Embed Size (px)
Citation preview
Technical Assistance Consultant’s Report
This consultant’s report does not necessarily reflect the views of ADB or the Government concerned, and ADB and the Government cannot be held liable for its contents. (For project preparatory technical assistance: All the views expressed herein may not be incorporated into the proposed project’s design.
Project Number: 47177 May 2015
Republic of the Union of Myanmar: Support for Post-Primary Education Development (Cofinanced by the Government of Australia)
Prepared by Chris Spohr, Principal Social Sector Specialist, ADB Myanmar Resident Mission (MYRM), in collaboration with the Comprehensive Education Sector Review (CESR) Team, and in dialogue with TA-financed consultants.
For the Ministry of Education

Myanmar Comprehensive Education Sector Review (CESR)
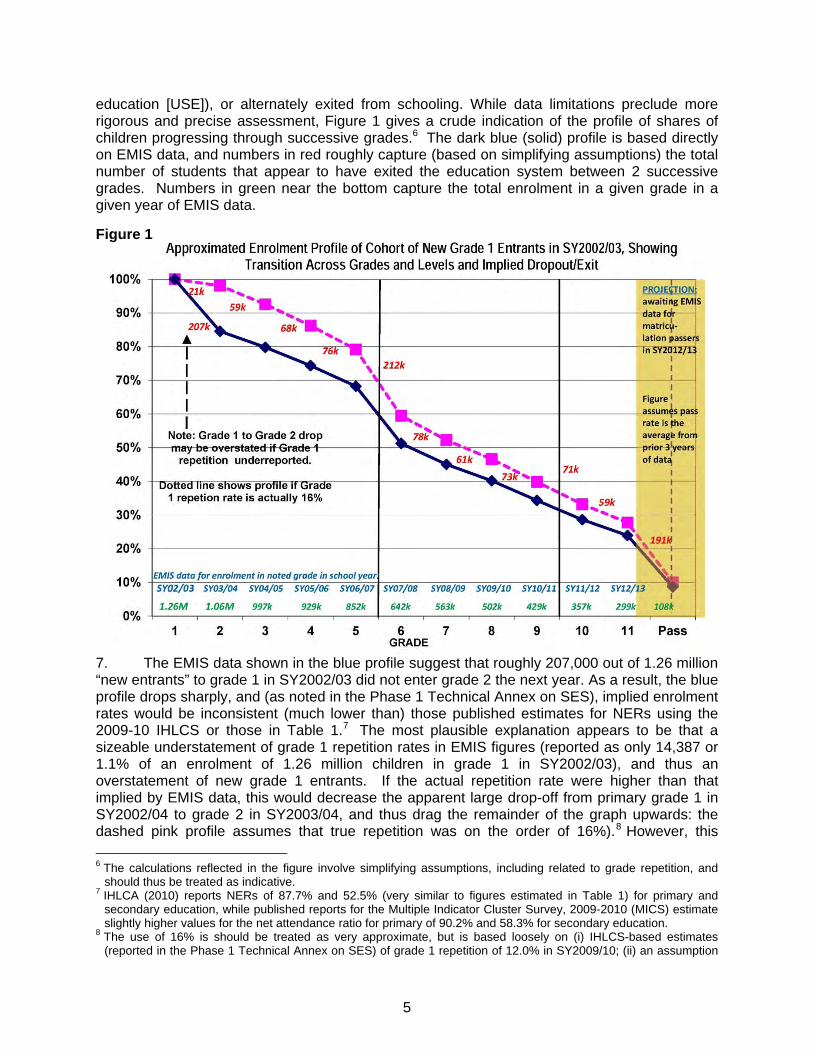
Phase 2: In-Depth Analysis
Supplementary Annex:
Updated Analysis of Education Access, Retention, and Attainment in Myanmar, with a Focus on Post-
Primary Education
(3 February 2014; minor updates/revisions 30 May 2015)
Foreword This report was prepared as part of the In-Depth Analysis (Phase 2) of Myanmar’s Comprehensive Education Sector Review (CESR), which is led by the Union of Myanmar Ministry of Education (MOE), coordinating inputs from other government agencies and support from an array of development partners. The report serves as a Supplementary Annex to the compilation “Volume 2” for CESR Phase 2. Under the umbrella of the CESR and as an input to Phase 2, this document provides a summary of initial analysis conducted by Asian Development Bank (ADB) staff in collaboration with the CESR Team, utilizing the dataset for the 2009/10 Integrated Household Living Conditions Survey (IHLCS), MOE’s Education Management Information System (EMIS), as well as a survey of secondary education schools nationwide conducted under the CESR with support from ADB technical assistance TA 8187-MYA: Support for Education Sector Planning, which is cofinanced by ADB and the Government of Australia. It also links to additional analysis reported under 4 other technical annexes to CESR Phase 2 that were supported under technical assistance TA 8385-MYA: Support for Post-Primary Education Development, which also involves cooperation between ADB and the Government of Australia). Building on findings reported in a Supplementary Appendix prepared for CESR Phase 1, this Annex presents findings regarding various education subsectors, ranging from preschool through technical and vocational education and training (TVET) and higher education, with some focus on the secondary education subsector, where most youth exit Myanmar’s education system. The analysis focuses largely on education access, it provides at least indirect insights into some dimensions of education quality and management, including in particular the links between quality and education attainment. While this Supplementary Annex was principally drafted by ADB staff Chris Spohr (Principal Social Sector Specialist, ADB Myanmar Resident Mission in Naypyitaw), it reflects a collaborative effort involving inputs from the CESR Team throughout the process, including in particular Daw Tin Tin Shu, U Tin Hlaing, Daw Thin Thin Khine, Daw Tin Min Latt, Daw Soe Pyae Mon, and members of other CESR Basic Education sub-components. It is structured around a set of research questions posed by the CESR Team and dialogue with the secondary education sub-team in particular. However, any errors herein are those of the author alone. Additionally, the analysis is subject to various caveats, and while figures generally show 1 decimal place, this is not intended to convey statistical precision, particularly for analysis using subsamples of the data (as IHLCS is understood to be nationally representative at the national level). More generally, the findings herein will be subject to continued analysis under Phase 3 of the CESR and as additional and more updated data becomes available: e.g., MOE and ADB intend to update some of the analysis using the 2014 Census dataset, once released. The Annex also reflects inputs from and ADB-mobilized consultants supporting CESR Phase 2 (in alphabetical order, May Yimon Aung, Shwe Zin Mon Aung, Nigel Billany, Paul Brady, Khin Than Nwe Soe, Carsten Huttemeier, Ei Phyu, and Marion Young). It also benefited from dialogue with government counterparts (including especially those from MOE and the Ministry of Science and Technology), counterparts from Australia and UNICEF (which are supporting overall CESR coordination), Dr. Myint Thein and other national advisers to the CESR, CESR international advisers Jonathan Caseley, Julian Watson, and Eric Woods, as well as other development partners supporting the CESR including GIZ, JICA, and UNESCO.
Disclaimer: The views expressed herein are those of the author and do not necessarily reflect the views and policies of the Government of Myanmar or any of its agencies, the Asian Development Bank (ADB) or its Board of Governors or the governments they represent, or the Government of Australia. ADB and its partners do not guarantee the accuracy of the data included in this publication and accepts no responsibility for any consequence of their use. By making any designation of or reference to a particular territory or geographic area, or by using the term “country”, this document does not intend to make any judgments as to the legal or other status of any territory or area.
3
I. Introduction 1. In 2012, Myanmar launched a landmark Comprehensive Education Sector Review (CESR), representing the first rigorous analysis of the entire education sector in 2 decades. The Ministry of Education (MOE) leads the CESR, coordinating inputs from other relevant agencies and development partner organizations (DPOs). During CESR’s Rapid Assessment (Phase 1), the CESR Team, with support from the Asian Development Bank (ADB) staff 1 conducted quantitative analysis of education access using available data sources, in particular MOE’s Education Management Information System (EMIS) and the Integrated Household Living Conditions Survey in Myanmar, 2009-10 (IHLCS). Findings of this analysis were reported in the CESR Phase 1 Technical Annex on the Secondary Education Subsector (SES)2 and to varying degrees in technical annexes covering technical and vocational education and training (TVET) and the higher education subsector (HES).3 Among other dimensions, that Phase 1 analysis included investigation of transitions across grades using both EMIS and IHLCS data, as well as a broader array of analysis using the IHLCS database. The latter included investigation of (i) net and gross enrolment rates; (ii) the distribution of Basic Education (using Myanmar’s definition as grade 1-11) across types of schools for Myanmar nationally and in different regions, using IHLCS data; (iii) shares of children having never entered schooling and having dropped out or otherwise exited from education, and the main reasons for being out-of-school; (iv) the correlation between key factors (including geographic area, households’ socioeconomic status, parent’s education, and children’s prior completion of preschool) and the likelihood of completing primary school; (iv) access to training as defined in the IHLCS (likely analogous to TVET short-courses and informal TVET). The final section of the CESR Phase 1 Technical Annex on SES also included initial findings from ongoing IHLCS analysis related to (i) educational attainment including highest grade completed; (ii) transitions from primary to middle school; (iii) repetition rates; and (iv) age-specific enrolment profiles for children nationwide, and in urban and rural areas. 2. This Supplementary Annex summarizes further quantitative analysis by the CESR Team and ADB staff during CESR Phase 2 (In-Depth Analysis), which aimed to complement and/or corroborate analysis completed during Phase 1 (noted above and reflected in the Phase 1 technical annexes (generally not repeated herein). The Phase 2 work principally used data from 3 sources. The majority of this work continued Phase 1 analysis drew on an updated EMIS dataset and the IHLCS 2009/10 dataset. At the same time, the Supplementary Annex also incorporates selected findings from a survey of nearly 800 post-primary and secondary schools of different types in selected townships spanning all states and regions, which the CESR Team secondary education sub-team organized with financial and technical support under ADB-Australia cofinanced technical assistance TA 8187-MYA: Support for Education Sector Planning.4
1 As an input to CESR Phase1 and 2—and as part of broader analytical collaboration various CESR Team sub-teams
for secondary education and other post-primary education subsectors—the statistical analysis summarized herein was conducted by Chris Spohr, Principal Social Sector Specialist of the ADB Myanmar Resident Mission in Naypyitaw. While the research reflects a collaborative effort, any errors herein are Dr. Spohr’s alone.
2 Available online at the CESR website (www.cesrmm.org)and at http://www.adb.org/projects/documents/cesr-p1-rapid-assessment-annex-secondary-education-tacr and the
3 These are also posted on the CESR website and at http://www.adb.org/projects/46369-001/documents . 4 Consultants under TA 8385-MYA: Support for Post-primary Education Development also supported encoding and
analysis of the SES school survey. Broader findings from the survey are reported in the Basic Education chapter of the CESR Volume 2 compilation report and/or the CESR Phase 2 Technical Annex for SES, to be posted at www.cesrmm.org and at http://www.adb.org/projects/47177-001/documents. This Supplementary Annex reports only selected findings from that survey which corroborate analysis herein using EMIS or IHLCS data.
4
3. The Supplementary Annex is structured around the research questions posed by the CESR Team using the 3 main data sources noted, with the findings organized as follows. Section II presents findings from further EMIS-based analysis (using more recent data that became available during Phase 2). As the Supplementary Annex’ main focus, Section III then provides further analysis of IHLCS data, building on findings reported in Phase 1 (see para. 1), and Section IV presents graphical detailed enrolment profiles in efforts to provide a deeper understanding of the dynamics of issues enrolments, grade progression, dropout, and repetition, as well as distinctions in such dynamics across urban and rural households, the poor, and by gender. Section IV also reports additional findings regarding access to various types of TVET. Finally, Section V provides a selective summary of a subset analysis conducted by the CESR SES team (with ADB support) that corroborates or complements findings in Sections II-IV. Key conclusions drawn from the quantitative analysis reported herein are elaborated in the CESR Phase 2 Technical Annex for SES, and are not repeated in this Supplementary Annex. II. EMIS-based Analysis of Transitions across Basic Education Grades (G1-11) 4. The Phase 1 analysis reported estimates for gross enrolment rate (GER) and net enrolment rate (NER) for primary, middle, and high school-age youth, as well as for higher education and preschool, as tabulated in Table 1 (at end). At the same time, while estimates for GER and NER provide a useful yardstick for education access at a given level of schooling, they provide a limited understanding of the dynamics and underlying issues. Caution is also needed in interpreting these figures: e.g., a higher GER is not necessarily better (since, for example, repetition tends to inflate GERs, which may be above 100%). The same applies for other singular indicators: e.g., estimates of the completion rate using the official normative age of completion often substantially understate the actual share of children completing a given level of schooling. CESR Phase 1 and 2 analysis thus aimed to complement investigation of singular indices like GER and NER with approaches that allow for more detailed investigation of dynamics, which can help better understand these indexes (e.g., including, for example, a large gap between the GER and NER) and also give policy-relevant information as to the underlying dynamics (e.g., pinpointing where in the education cycles is drop-out occurring). 5. While the EMIS in Myanmar (and nearly all countries) does not allow for tracking individual students across multiple calendar years (i.e., it does not provide true “panel data”), EMIS data can provide a very useful, if only approximated, picture of grade progression via at least 2 approaches: (i) tracking a cohort across numerous years of data; and (ii) looking at grade-specific transitions across 2 recent years of data. II.1 Cohort tracking using 11 years of EMIS data 6. While this approach involves some simplifying assumptions (particularly regarding repetition), it approximately allows tracking of children entering grade 1 in a given year across subsequent years of data, which in turn captures how students in that cohort progressed across grades or dropped out from the education system between certain grades. Using the latest available EMIS data5, the Phase 2 analysis used EMIS data for SY2002/03 through SY2012/13 to construct a cohort profile showing an approximated transition path of new entrants to primary school (grade 1) in SY2002/03 as they progressed across grades of primary education, middle school (i.e., lower secondary education [LSE]), and high school (i.e., upper secondary
5 Available EMIS data for SY2012/13 did not yet include high school completion (matriculation exam passage) or an
enrolment breakdown by gender. However, analysis using earlier EMIS years suggests that the profiles for girls and boys are similar (see also later sections using IHLCS data).
5
education [USE]), or alternately exited from schooling. While data limitations preclude more rigorous and precise assessment, Figure 1 gives a crude indication of the profile of shares of children progressing through successive grades.6 The dark blue (solid) profile is based directly on EMIS data, and numbers in red roughly capture (based on simplifying assumptions) the total number of students that appear to have exited the education system between 2 successive grades. Numbers in green near the bottom capture the total enrolment in a given grade in a given year of EMIS data.
Figure 1
7. The EMIS data shown in the blue profile suggest that roughly 207,000 out of 1.26 million “new entrants” to grade 1 in SY2002/03 did not enter grade 2 the next year. As a result, the blue profile drops sharply, and (as noted in the Phase 1 Technical Annex on SES), implied enrolment rates would be inconsistent (much lower than) those published estimates for NERs using the 2009-10 IHLCS or those in Table 1.7 The most plausible explanation appears to be that a sizeable understatement of grade 1 repetition rates in EMIS figures (reported as only 14,387 or 1.1% of an enrolment of 1.26 million children in grade 1 in SY2002/03), and thus an overstatement of new grade 1 entrants. If the actual repetition rate were higher than that implied by EMIS data, this would decrease the apparent large drop-off from primary grade 1 in SY2002/04 to grade 2 in SY2003/04, and thus drag the remainder of the graph upwards: the dashed pink profile assumes that true repetition was on the order of 16%).8 However, this
6 The calculations reflected in the figure involve simplifying assumptions, including related to grade repetition, and
should thus be treated as indicative. 7 IHLCA (2010) reports NERs of 87.7% and 52.5% (very similar to figures estimated in Table 1) for primary and
secondary education, while published reports for the Multiple Indicator Cluster Survey, 2009-2010 (MICS) estimate slightly higher values for the net attendance ratio for primary of 90.2% and 58.3% for secondary education.
8 The use of 16% is should be treated as very approximate, but is based loosely on (i) IHLCS-based estimates (reported in the Phase 1 Technical Annex on SES) of grade 1 repetition of 12.0% in SY2009/10; (ii) an assumption
6
should not overly affect relative drop-offs across subsequent grades, and the crude profile is at minimum useful to understand qualitative patterns. 8. As discussed in Section III.1, there are some reasons to suspect that EMIS data may provide an overly pessimistic view of dropout. As noted above, one reason relates to the possibility that repetition in grade 1 may be under-reported, which would lead to overstated estimates of dropout during or immediately after grade 1.9 This would be addressed by focusing on the pink profile in Figure 1, though there are other factors that may lead EMIS-based estimates to represent a “lower bound”, including the fact that EMIS-based estimates of grade progression would typically have to look at direct progression: e.g., the pink line would trace out the share of new grade 1 entrants who progress directly through the system and successfully reach grade 11 and pass the matriculation exam 11 years later: Figure 1 does not capture youth who are not enrolled in grade 11 but retake and pass the matriculation exam in subsequent years. With these caveats, Figure 1 suggests that up to 1 million youth exit Myanmar’s education system each year without completing high school. Namely, of the roughly 1.1 million estimated new entrants to grade 1, only around 110,000 progress through the system and pass the matriculation exam at the end of grade 11 eleven years later. Given the fact (as discussed in later sections) higher education and many forms of TVET require matriculation exam passage, this leaves roughly a “missing million” of youth each year with limited prospects for further education, training, or access to modern sector employment. 9. Finally, in terms of pinpointing the challenges for grade progression, Figure 1 suggests that exit from school is particularly marked at the transition from primary to secondary school. Among children in cohort that entered grade 1 in SY2002/03, it appears that four-fifths completed primary school, but fully 1 in 4 primary school completers failed to enter middle school. Such dimensions are revisited using IHLCS household survey data Section III.1 further below.
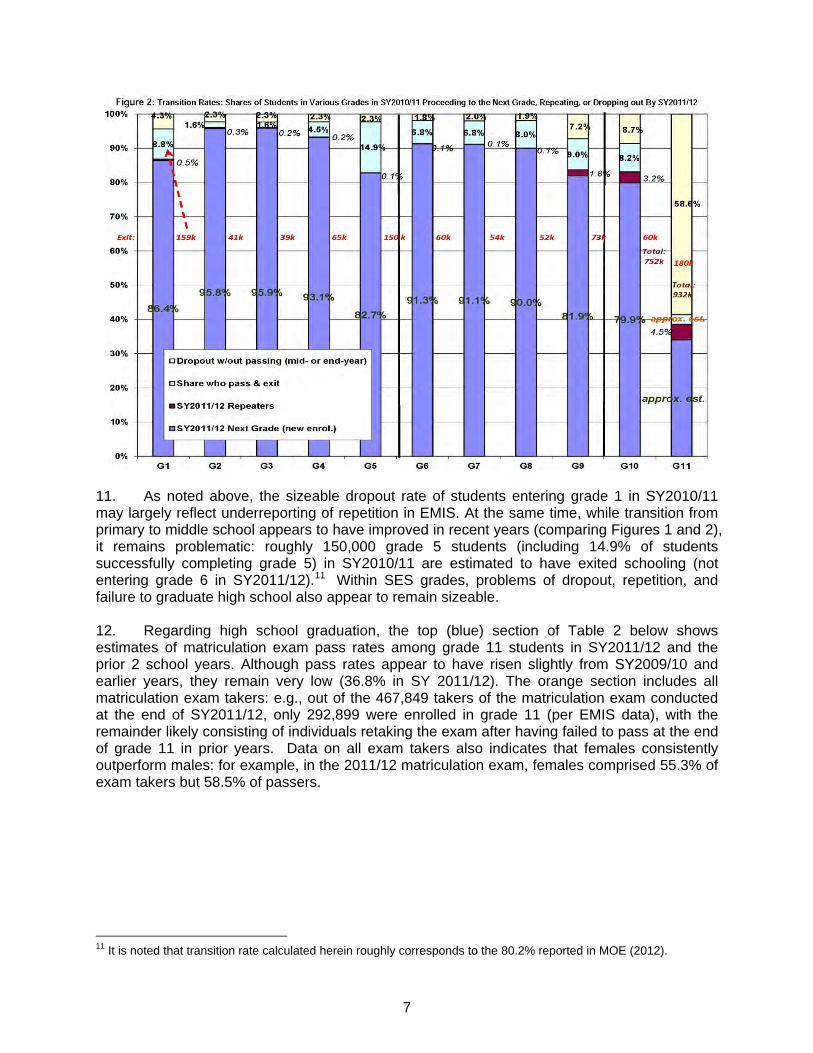
II.2 Grade-specific transitions using EMIS data for SY2009/10 and SY2010/11 10. As an update to Phase 1 findings, the analysis used data for the 2 most recent school years for which grade completion figures were available in EMIS (SY2010/11 and SY2011/12), to look at the progression from students in grade X to the next grade (X+1). For example, the G1 bar at the far left of Figure 2 estimates the shares of grade 1 students in SY2010/11 who moved on to grade 2, repeated grade 1, dropped out in the middle of grade 1, or completed grade 1 but did not continue further.10
that parent-reported repetition reflected in the IHLCS may be slightly lower than actual repetition; and (iii) an assumption that grade 1 repetition has likely improved (and thus would have been higher in SY2002/03).
9 Muta (2014) reaches a similar conclusion in his in-depth analysis of EMIS data. 10 While this analysis allows the use of more recent data than the cohort-based approach in Section II.1, it should be
noted that each grade-specific transition refers to a different cohort: i.e., in contrast to Figure 1, Figure 2 shows different cohorts of children at different grades. Data on numbers of new HES entrants in SY2010/11 was not available, though it is believed that most of the 36.8% of grade 11 finishers in SY2011/12 who passed the matriculation exam (shown at the far right) probably entered HES the following year.
7
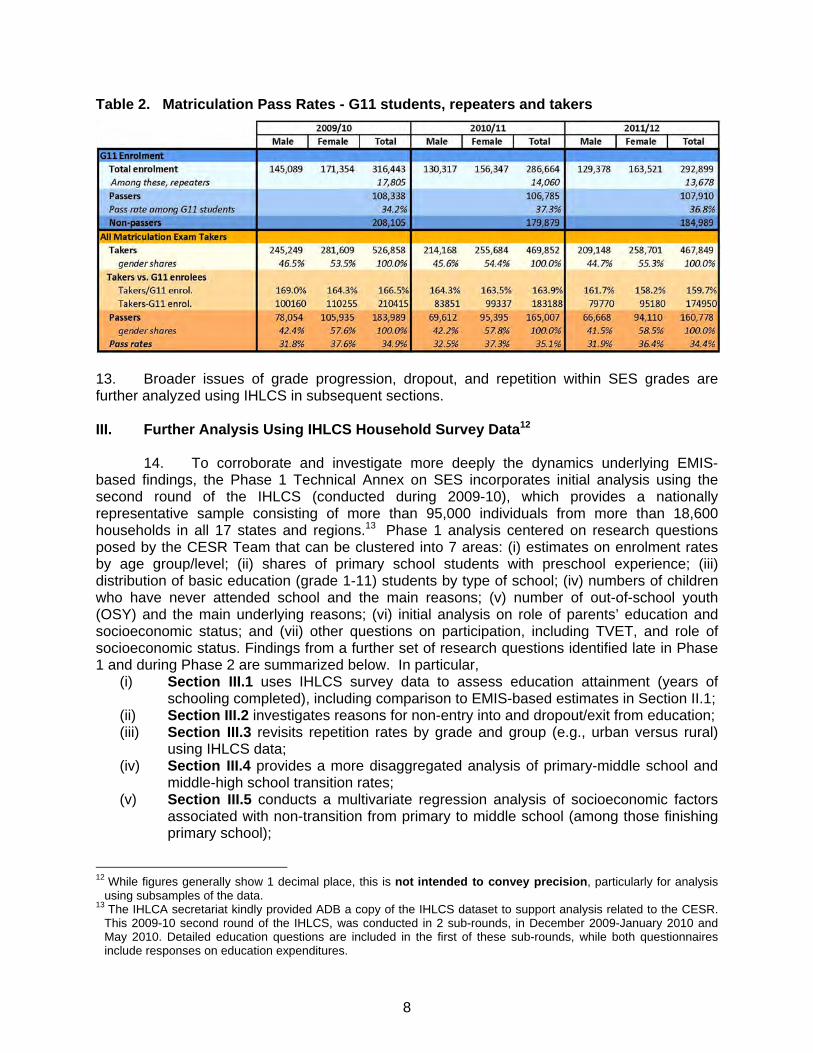
11. As noted above, the sizeable dropout rate of students entering grade 1 in SY2010/11 may largely reflect underreporting of repetition in EMIS. At the same time, while transition from primary to middle school appears to have improved in recent years (comparing Figures 1 and 2), it remains problematic: roughly 150,000 grade 5 students (including 14.9% of students successfully completing grade 5) in SY2010/11 are estimated to have exited schooling (not entering grade 6 in SY2011/12).11 Within SES grades, problems of dropout, repetition, and failure to graduate high school also appear to remain sizeable. 12. Regarding high school graduation, the top (blue) section of Table 2 below shows estimates of matriculation exam pass rates among grade 11 students in SY2011/12 and the prior 2 school years. Although pass rates appear to have risen slightly from SY2009/10 and earlier years, they remain very low (36.8% in SY 2011/12). The orange section includes all matriculation exam takers: e.g., out of the 467,849 takers of the matriculation exam conducted at the end of SY2011/12, only 292,899 were enrolled in grade 11 (per EMIS data), with the remainder likely consisting of individuals retaking the exam after having failed to pass at the end of grade 11 in prior years. Data on all exam takers also indicates that females consistently outperform males: for example, in the 2011/12 matriculation exam, females comprised 55.3% of exam takers but 58.5% of passers. 11 It is noted that transition rate calculated herein roughly corresponds to the 80.2% reported in MOE (2012).
8
Table 2. Matriculation Pass Rates - G11 students, repeaters and takers
13. Broader issues of grade progression, dropout, and repetition within SES grades are further analyzed using IHLCS in subsequent sections. III. Further Analysis Using IHLCS Household Survey Data12
14. To corroborate and investigate more deeply the dynamics underlying EMIS-based findings, the Phase 1 Technical Annex on SES incorporates initial analysis using the second round of the IHLCS (conducted during 2009-10), which provides a nationally representative sample consisting of more than 95,000 individuals from more than 18,600 households in all 17 states and regions.13 Phase 1 analysis centered on research questions posed by the CESR Team that can be clustered into 7 areas: (i) estimates on enrolment rates by age group/level; (ii) shares of primary school students with preschool experience; (iii) distribution of basic education (grade 1-11) students by type of school; (iv) numbers of children who have never attended school and the main reasons; (v) number of out-of-school youth (OSY) and the main underlying reasons; (vi) initial analysis on role of parents’ education and socioeconomic status; and (vii) other questions on participation, including TVET, and role of socioeconomic status. Findings from a further set of research questions identified late in Phase 1 and during Phase 2 are summarized below. In particular,
(i) Section III.1 uses IHLCS survey data to assess education attainment (years of schooling completed), including comparison to EMIS-based estimates in Section II.1;
(ii) Section III.2 investigates reasons for non-entry into and dropout/exit from education; (iii) Section III.3 revisits repetition rates by grade and group (e.g., urban versus rural)
using IHLCS data; (iv) Section III.4 provides a more disaggregated analysis of primary-middle school and
middle-high school transition rates; (v) Section III.5 conducts a multivariate regression analysis of socioeconomic factors
associated with non-transition from primary to middle school (among those finishing primary school);
12 While figures generally show 1 decimal place, this is not intended to convey precision, particularly for analysis
using subsamples of the data. 13 The IHLCA secretariat kindly provided ADB a copy of the IHLCS dataset to support analysis related to the CESR.
This 2009-10 second round of the IHLCS, was conducted in 2 sub-rounds, in December 2009-January 2010 and May 2010. Detailed education questions are included in the first of these sub-rounds, while both questionnaires include responses on education expenditures.
9
(vi) Section III.6 applies similar multivariate regression analysis to investigate factors associated with non-completion of middle school (among those entering middle school); and
(vii) Section III.7 investigates household expenditures on education. III.1 Estimated Educational Attainment Profile Using IHLCS Household Data 15. Building on findings emerging at the end of CESR Phase 1 (see especially pages 73-81 of the Phase 1 Technical Annex on SES), CESR Phase 2 analysis used IHLCS data to further investigate educational attainment, as outlined below.
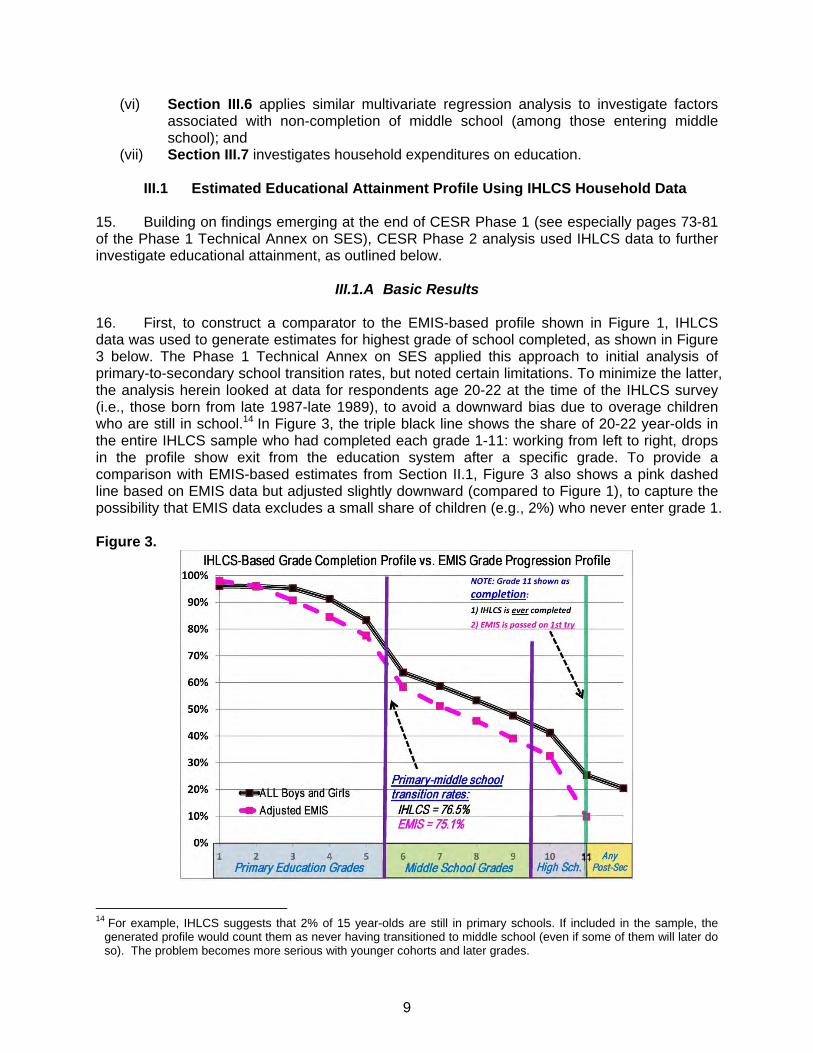
III.1.A Basic Results 16. First, to construct a comparator to the EMIS-based profile shown in Figure 1, IHLCS data was used to generate estimates for highest grade of school completed, as shown in Figure 3 below. The Phase 1 Technical Annex on SES applied this approach to initial analysis of primary-to-secondary school transition rates, but noted certain limitations. To minimize the latter, the analysis herein looked at data for respondents age 20-22 at the time of the IHLCS survey (i.e., those born from late 1987-late 1989), to avoid a downward bias due to overage children who are still in school.14 In Figure 3, the triple black line shows the share of 20-22 year-olds in the entire IHLCS sample who had completed each grade 1-11: working from left to right, drops in the profile show exit from the education system after a specific grade. To provide a comparison with EMIS-based estimates from Section II.1, Figure 3 also shows a pink dashed line based on EMIS data but adjusted slightly downward (compared to Figure 1), to capture the possibility that EMIS data excludes a small share of children (e.g., 2%) who never enter grade 1. Figure 3.
14 For example, IHLCS suggests that 2% of 15 year-olds are still in primary schools. If included in the sample, the
generated profile would count them as never having transitioned to middle school (even if some of them will later do so). The problem becomes more serious with younger cohorts and later grades.
10
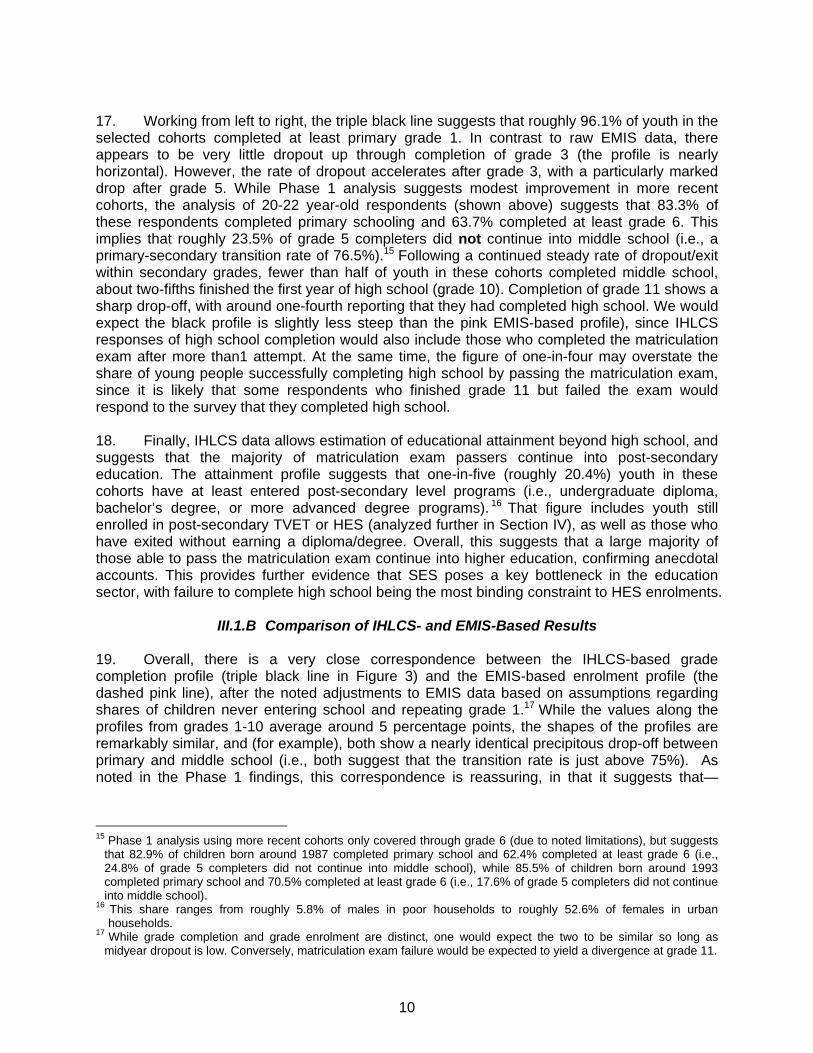
17. Working from left to right, the triple black line suggests that roughly 96.1% of youth in the selected cohorts completed at least primary grade 1. In contrast to raw EMIS data, there appears to be very little dropout up through completion of grade 3 (the profile is nearly horizontal). However, the rate of dropout accelerates after grade 3, with a particularly marked drop after grade 5. While Phase 1 analysis suggests modest improvement in more recent cohorts, the analysis of 20-22 year-old respondents (shown above) suggests that 83.3% of these respondents completed primary schooling and 63.7% completed at least grade 6. This implies that roughly 23.5% of grade 5 completers did not continue into middle school (i.e., a primary-secondary transition rate of 76.5%).15 Following a continued steady rate of dropout/exit within secondary grades, fewer than half of youth in these cohorts completed middle school, about two-fifths finished the first year of high school (grade 10). Completion of grade 11 shows a sharp drop-off, with around one-fourth reporting that they had completed high school. We would expect the black profile is slightly less steep than the pink EMIS-based profile), since IHLCS responses of high school completion would also include those who completed the matriculation exam after more than1 attempt. At the same time, the figure of one-in-four may overstate the share of young people successfully completing high school by passing the matriculation exam, since it is likely that some respondents who finished grade 11 but failed the exam would respond to the survey that they completed high school. 18. Finally, IHLCS data allows estimation of educational attainment beyond high school, and suggests that the majority of matriculation exam passers continue into post-secondary education. The attainment profile suggests that one-in-five (roughly 20.4%) youth in these cohorts have at least entered post-secondary level programs (i.e., undergraduate diploma, bachelor’s degree, or more advanced degree programs). 16 That figure includes youth still enrolled in post-secondary TVET or HES (analyzed further in Section IV), as well as those who have exited without earning a diploma/degree. Overall, this suggests that a large majority of those able to pass the matriculation exam continue into higher education, confirming anecdotal accounts. This provides further evidence that SES poses a key bottleneck in the education sector, with failure to complete high school being the most binding constraint to HES enrolments.
III.1.B Comparison of IHLCS- and EMIS-Based Results 19. Overall, there is a very close correspondence between the IHLCS-based grade completion profile (triple black line in Figure 3) and the EMIS-based enrolment profile (the dashed pink line), after the noted adjustments to EMIS data based on assumptions regarding shares of children never entering school and repeating grade 1.17 While the values along the profiles from grades 1-10 average around 5 percentage points, the shapes of the profiles are remarkably similar, and (for example), both show a nearly identical precipitous drop-off between primary and middle school (i.e., both suggest that the transition rate is just above 75%). As noted in the Phase 1 findings, this correspondence is reassuring, in that it suggests that—
15 Phase 1 analysis using more recent cohorts only covered through grade 6 (due to noted limitations), but suggests
that 82.9% of children born around 1987 completed primary school and 62.4% completed at least grade 6 (i.e., 24.8% of grade 5 completers did not continue into middle school), while 85.5% of children born around 1993 completed primary school and 70.5% completed at least grade 6 (i.e., 17.6% of grade 5 completers did not continue into middle school).
16 This share ranges from roughly 5.8% of males in poor households to roughly 52.6% of females in urban households.
17 While grade completion and grade enrolment are distinct, one would expect the two to be similar so long as midyear dropout is low. Conversely, matriculation exam failure would be expected to yield a divergence at grade 11.
11
excepting non-entry and grade 1 repetition18—EMIS is doing a fairly good job, and at minimum there is no evidence that EMIS is showing an overly optimistic picture of the education sector. In fact, the EMIS-based profile lies below the IHLCS-based profile, reversing the picture in many countries, where administrative data tells a more optimistic picture than household survey data. At the same time, the correspondence between findings from these 2 independent data sources (IHLCS and EMIS) provides greater confidence in the IHLCS data and a much broader array of analysis that can be conducted using IHLCS data, as laid out in the remainder of this Supplementary Annex. 20. So how do we interpret the remaining distinction between the 2 profiles shown in Figure 3? One source of distinction is that the 2 profiles are not measuring exactly the same thing: in addition to the fact that enrolment and grade completion are distinct (though generally close), the way the 2 profiles are constructed means that they do not capture exactly the same cohorts of children, which could create a gap if there has been a strong time trend in education access in Myanmar in recent years. However, taking all factors into consideration, it is argued herein that the “reality” lies somewhere in between the 2 profiles in Figure 3, namely:
(i) IHLCS-based estimates (the black completion profile) likely represent an upper-bound (overly optimistic) estimate; while
(ii) EMIS-based estimates (the pink enrolment profile) likely represent a lower-bound (overly pessimistic) estimate.
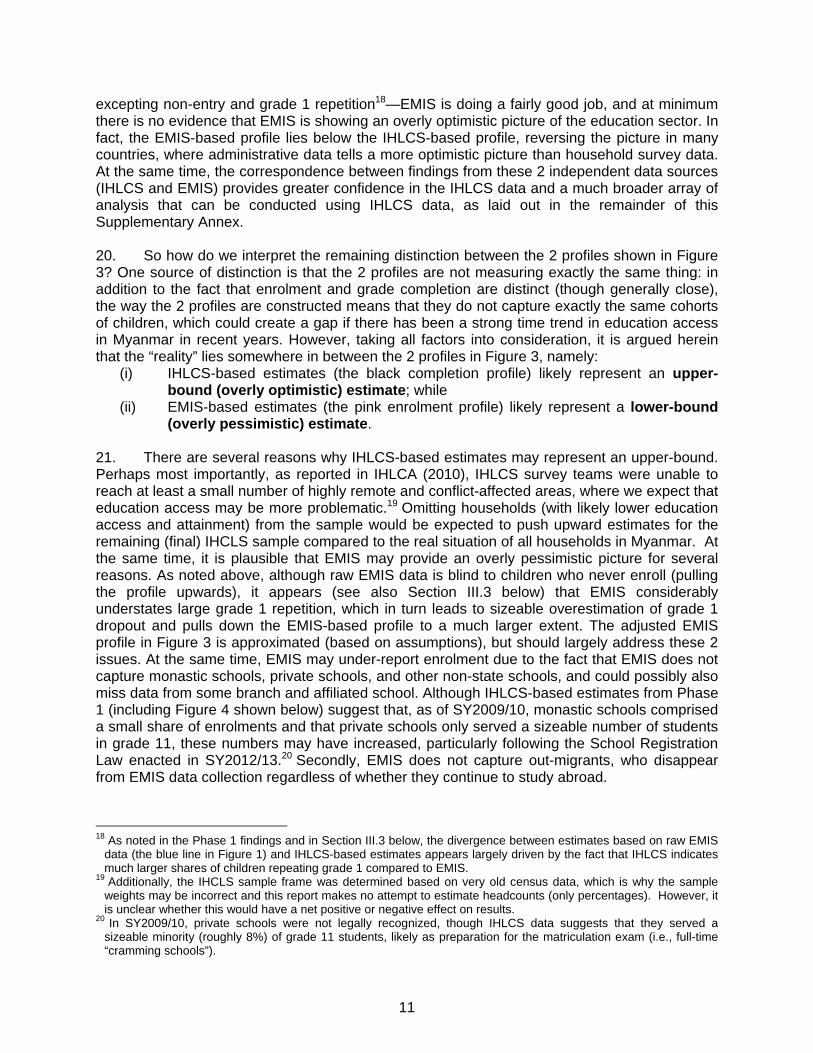
21. There are several reasons why IHLCS-based estimates may represent an upper-bound. Perhaps most importantly, as reported in IHLCA (2010), IHLCS survey teams were unable to reach at least a small number of highly remote and conflict-affected areas, where we expect that education access may be more problematic.19 Omitting households (with likely lower education access and attainment) from the sample would be expected to push upward estimates for the remaining (final) IHCLS sample compared to the real situation of all households in Myanmar. At the same time, it is plausible that EMIS may provide an overly pessimistic picture for several reasons. As noted above, although raw EMIS data is blind to children who never enroll (pulling the profile upwards), it appears (see also Section III.3 below) that EMIS considerably understates large grade 1 repetition, which in turn leads to sizeable overestimation of grade 1 dropout and pulls down the EMIS-based profile to a much larger extent. The adjusted EMIS profile in Figure 3 is approximated (based on assumptions), but should largely address these 2 issues. At the same time, EMIS may under-report enrolment due to the fact that EMIS does not capture monastic schools, private schools, and other non-state schools, and could possibly also miss data from some branch and affiliated school. Although IHLCS-based estimates from Phase 1 (including Figure 4 shown below) suggest that, as of SY2009/10, monastic schools comprised a small share of enrolments and that private schools only served a sizeable number of students in grade 11, these numbers may have increased, particularly following the School Registration Law enacted in SY2012/13.20 Secondly, EMIS does not capture out-migrants, who disappear from EMIS data collection regardless of whether they continue to study abroad.
18 As noted in the Phase 1 findings and in Section III.3 below, the divergence between estimates based on raw EMIS
data (the blue line in Figure 1) and IHLCS-based estimates appears largely driven by the fact that IHLCS indicates much larger shares of children repeating grade 1 compared to EMIS.
19 Additionally, the IHCLS sample frame was determined based on very old census data, which is why the sample weights may be incorrect and this report makes no attempt to estimate headcounts (only percentages). However, it is unclear whether this would have a net positive or negative effect on results.
20 In SY2009/10, private schools were not legally recognized, though IHLCS data suggests that they served a sizeable minority (roughly 8%) of grade 11 students, likely as preparation for the matriculation exam (i.e., full-time “cramming schools”).
12
Figure 4. Share of Enrolment by Grade and Type of School (IHCLS)
22. Expected MOE-ADB analysis of the forthcoming 2014 Census (which includes 3 questions related to literacy, current enrolment, and highest grade/level completed) will provide a more definitive and precise picture of enrolment and grade completion. Pending that, the remainder of this report conducts more in-depth analysis of the IHCLS data, with the caveat that estimates may be overly optimistic at least to a slight degree.
III.1.C Disaggregated Grade Completion Profile Using IHLCS Data
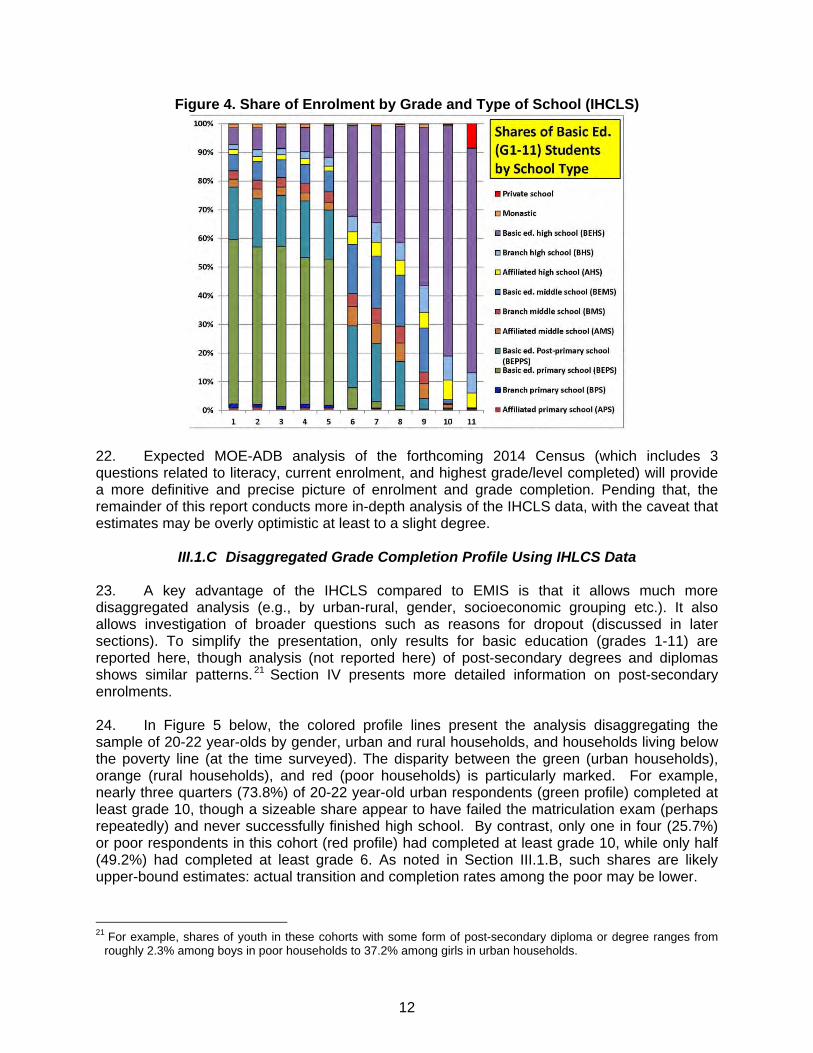
23. A key advantage of the IHCLS compared to EMIS is that it allows much more disaggregated analysis (e.g., by urban-rural, gender, socioeconomic grouping etc.). It also allows investigation of broader questions such as reasons for dropout (discussed in later sections). To simplify the presentation, only results for basic education (grades 1-11) are reported here, though analysis (not reported here) of post-secondary degrees and diplomas shows similar patterns.21 Section IV presents more detailed information on post-secondary enrolments. 24. In Figure 5 below, the colored profile lines present the analysis disaggregating the sample of 20-22 year-olds by gender, urban and rural households, and households living below the poverty line (at the time surveyed). The disparity between the green (urban households), orange (rural households), and red (poor households) is particularly marked. For example, nearly three quarters (73.8%) of 20-22 year-old urban respondents (green profile) completed at least grade 10, though a sizeable share appear to have failed the matriculation exam (perhaps repeatedly) and never successfully finished high school. By contrast, only one in four (25.7%) or poor respondents in this cohort (red profile) had completed at least grade 10, while only half (49.2%) had completed at least grade 6. As noted in Section III.1.B, such shares are likely upper-bound estimates: actual transition and completion rates among the poor may be lower.
21 For example, shares of youth in these cohorts with some form of post-secondary diploma or degree ranges from
roughly 2.3% among boys in poor households to 37.2% among girls in urban households.
13
Figure 5
III.2 Self-reported reasons for non-entry into and dropout/exit from education 25. For each of those 6 subsamples—in panels using the same color coding as Figure 5—Table 3 (at end) provides corresponding numerical figures of shares of children who dropped out/exited as well as the reported reasons for exiting.22 In each socioeconomic group panel, columns 1-6 distinguish lack of entry or dropout/exit at each of 6 key stages: (i) never entered school, (ii) primary entry but non-completion, (iii) primary completion but not transitioned to middle school (MS), (iv) dropout within middle school, (v) MS completion but not transitioned into high school (HS), and (vi) entered but didn't complete high school. For example, among the poor (red panel), looking at the top row, roughly: (i) 8.0% never entered school, (ii) 17.9% entered but didn't complete primary, (iii) 24.7% completed primary but did not transition to middle school, (iv) 16.9% dropped out within middle school, (v) 6.0% completed MS but did not transition to high school (HS), and (vi) 12.3% entered but didn't complete high school. The next row (light blue shows cumulative dropout to that point (e.g., 85.7% is the sum of the above), and the third row (darker blue) shows the shares of grade 5 and of grade 9 completers students not transitioning to grades 6 and 10, respectively: i.e., the shares of primary and middle school completers who did not successfully enter middle or high school. So for example, on-third (33.3%) of poor students who made it to grade 5 did not continue into middle school, 18.3% out of the smaller number of students completing grade 9 did not continue into high school. Differences by gender (blue and pink panels in the Table) are fairly modest, but two observations are noted. First, a slightly larger share of females never entered middle school: roughly 38.9% of females versus 33.2% of males in this cohort never completed grade 6.23 However, conditional on reaching middle school, female retention at subsequent grades appears marginally higher: e.g., 90.8% of female middle school graduates entered high school (versus 83.7% for males), and females appear to outperform males on the matriculation exam (and thus high school completion), as noted in Table 2 above.
22 In other words, this table explains why each profile in the graph falls off at various grades/stages. 23 In terms of grade 5 completers, 22.1% of males and 24.8% of females who completed primary school did not
complete grade 6.
14
26. Remaining rows in Table 3 show the reported reasons for non-entry into primary schooling (column [1] in each panel) and for dropout/exit during subsequent stages (columns [2]-[6] in each panel). Consistent with the Phase 1 findings, for the full sample of 20-22 year-olds (first panel), the lead reasons reported (in decreasing order of importance) are generally (i) costs not affordable, (ii) “lack of interest” (see Phase 1 Technical Annex on SES and below), (iii) agricultural work, (iv) care for family, and (v) non-agricultural work. In international terminology, the first of these would correspond to “direct costs” of schooling, while the third through fifth (agricultural and non-agricultural work and care for family) could be termed as “opportunity costs” of schooling.24 In terms of opportunity costs, comparisons across the urban (green) rural (orange) panels in the Table confirm that agricultural work and care for family are more important in rural areas, with non-agricultural work more important in urban areas. 27. While the role of direct and opportunity costs mirrors findings from household surveys in many other countries, the strong influence of what is termed “lack of interest” in the IHLCS is somewhat striking, although ADB analysis of household data for the Philippines25 shows a very similar phenomenon. As in the Philippines case, "lack of interest" appears to reflect both demand-side factors (e.g., low parental recognition of the value of education) as well as an array of issues related to quality. The latter, in turn, may range from students’ and parents’ perceptions that the education offered is not relevant to the real world, to a dynamic wherein rote-based instruction and classroom overcrowding promotes a cycle wherein children with weaker academic and socioeconomic backgrounds are allowed to slip increasingly far behind, become marginalized and/or stigmatized, and then eventually dropout. Looking further at reported “lack of interest”, it is also noteworthy that direct costs appear to be the single most important factor in non-entry into the subsequent levels, however lack of interest is the most important reason reported for dropout or failure to complete middle school or high school: e.g., 32.5% of primary completers and 26.1% of middle school completers who did not enter the next level cited costs as the main reason, however 33.1% of middle school dropouts and 49.0% of those entering but not completing high school cited lack of interest as the main reason. Unsurprisingly, costs appear to be a bigger factor among the poor (red panel), but lack of interest remains the lead reason for non-completion among middle and high school entrants. 28. Final analysis of the student module conducted as part of the SES school survey (see Annex 2 of the Phase 2 Technical Annex on SES) may shed further light on the role of “lack of interest” as the lead factor cited for dropout among entrants to middle and high school. Overall, the findings from the IHLCS, SES school survey, and other sources suggest that it will be critical for Myanmar to engineer a fundamental reform of the curriculum (to improve quality and relevance to the shifting socioeconomic context), including both subject contents and pedagogy, and to back this up with strengthened teacher training and support as well as improved student assessment. These may be particularly important to shift middle and high school education toward student-centered, active learning and to ensure flexible mastery of subject contents. 29. The fact that “lack of interest” plays such an important role has important implications for policy. For example, while the elimination of formal school fees (which was extended to middle school from SY2014/15 and to high school from SY2015/16) is an important move to lower cost barriers, this alone will not be enough to solve all access and completion issues. In terms of
24 The term “opportunity costs” conveys the notion that hours spent in a classroom or doing homework cannot be
spent on work for income or other tasks of value to the family. 25 See ADB. 2011. Country Partnership Strategy: Philippines, Sector Assessment (Summary): Education (Linked
Document 8).
15
other factors, consistent with the Phase 1 findings, IHLCS responses reflected in Table 3 suggest that other supply-side factors such as distance to schools (i.e., “physical access”) or lack of teachers, school supplies, weather, etc. may be less important than observed in some other countries. In the case of distance to the nearest school, it is possible that parents perceive this as a cost issue, such that distance factors may be partly hidden within responses of costs—this explanation would be partly supported by analysis of household expenditures in Section III.7 below, which finds that boarding costs are a key education-related expense. More generally, the above does not mean that these other factors are not important in terms of learning outcomes, merely that they are not seen by parents or other respondents as the main impediments to access per se. Additionally, while illness appears to be a significant factor explaining why some children never entered schooling, it is cited infrequently as a reason for exiting education: this is at least consistent with the explanation that disabilities are being enumerated as “illness”, and that disability is a more significant deterrent to entry to school than to progress once enrolled.
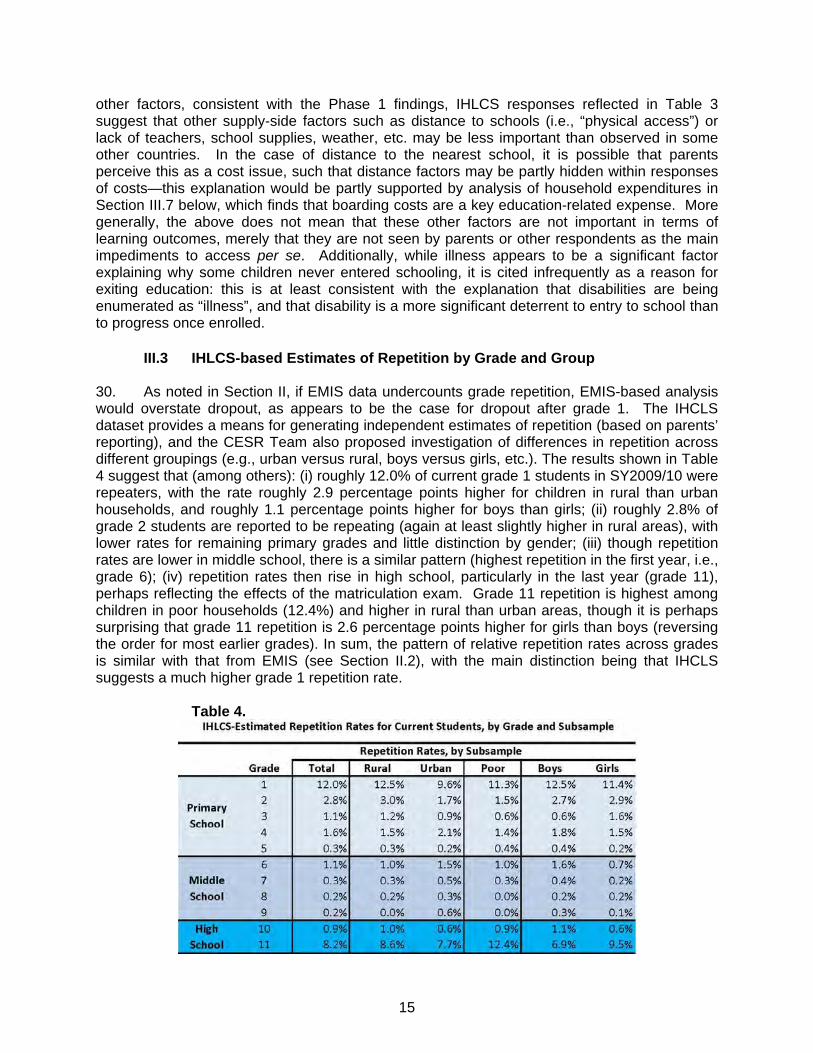
III.3 IHLCS-based Estimates of Repetition by Grade and Group 30. As noted in Section II, if EMIS data undercounts grade repetition, EMIS-based analysis would overstate dropout, as appears to be the case for dropout after grade 1. The IHCLS dataset provides a means for generating independent estimates of repetition (based on parents’ reporting), and the CESR Team also proposed investigation of differences in repetition across different groupings (e.g., urban versus rural, boys versus girls, etc.). The results shown in Table 4 suggest that (among others): (i) roughly 12.0% of current grade 1 students in SY2009/10 were repeaters, with the rate roughly 2.9 percentage points higher for children in rural than urban households, and roughly 1.1 percentage points higher for boys than girls; (ii) roughly 2.8% of grade 2 students are reported to be repeating (again at least slightly higher in rural areas), with lower rates for remaining primary grades and little distinction by gender; (iii) though repetition rates are lower in middle school, there is a similar pattern (highest repetition in the first year, i.e., grade 6); (iv) repetition rates then rise in high school, particularly in the last year (grade 11), perhaps reflecting the effects of the matriculation exam. Grade 11 repetition is highest among children in poor households (12.4%) and higher in rural than urban areas, though it is perhaps surprising that grade 11 repetition is 2.6 percentage points higher for girls than boys (reversing the order for most earlier grades). In sum, the pattern of relative repetition rates across grades is similar with that from EMIS (see Section II.2), with the main distinction being that IHCLS suggests a much higher grade 1 repetition rate.
Table 4.
16
III.4 Disaggregated analysis of primary-middle school and middle-high school
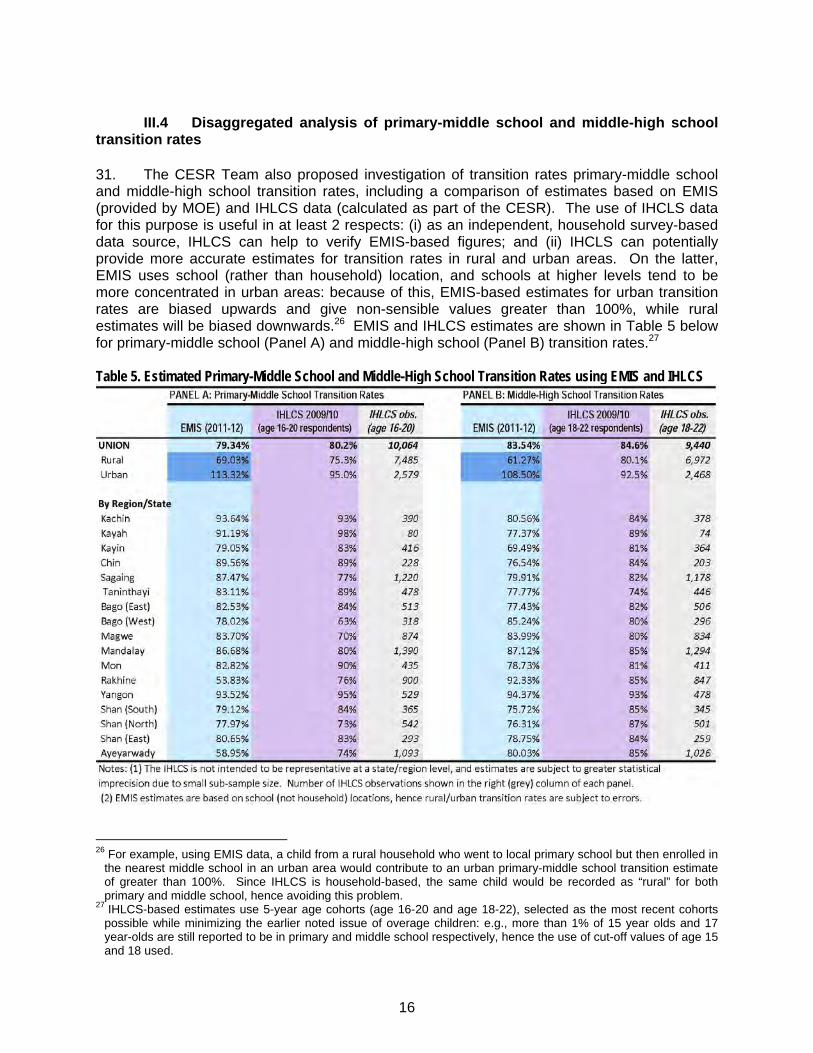
transition rates 31. The CESR Team also proposed investigation of transition rates primary-middle school and middle-high school transition rates, including a comparison of estimates based on EMIS (provided by MOE) and IHLCS data (calculated as part of the CESR). The use of IHCLS data for this purpose is useful in at least 2 respects: (i) as an independent, household survey-based data source, IHLCS can help to verify EMIS-based figures; and (ii) IHCLS can potentially provide more accurate estimates for transition rates in rural and urban areas. On the latter, EMIS uses school (rather than household) location, and schools at higher levels tend to be more concentrated in urban areas: because of this, EMIS-based estimates for urban transition rates are biased upwards and give non-sensible values greater than 100%, while rural estimates will be biased downwards.26 EMIS and IHLCS estimates are shown in Table 5 below for primary-middle school (Panel A) and middle-high school (Panel B) transition rates.27 Table 5. Estimated Primary-Middle School and Middle-High School Transition Rates using EMIS and IHLCS
26 For example, using EMIS data, a child from a rural household who went to local primary school but then enrolled in
the nearest middle school in an urban area would contribute to an urban primary-middle school transition estimate of greater than 100%. Since IHLCS is household-based, the same child would be recorded as “rural” for both primary and middle school, hence avoiding this problem.
27 IHLCS-based estimates use 5-year age cohorts (age 16-20 and age 18-22), selected as the most recent cohorts possible while minimizing the earlier noted issue of overage children: e.g., more than 1% of 15 year olds and 17 year-olds are still reported to be in primary and middle school respectively, hence the use of cut-off values of age 15 and 18 used.
17
32. Key observations that can be drawn from the Table include: (i) At the national level (“UNION” row), the 2 sets of estimates are very similar, with
IHLCS-based estimates being roughly 1 percentage point higher. This consistency gives confidence in the IHCLS-based approach (as well as the EMIS data). IHLCS suggests that in recent years, roughly 80.2% of primary graduates and 84.6% of middle school graduates have entered the next level;
(ii) Given noted issues with EMIS-based estimates, IHLCS figures give a clearer picture of transition rates in rural and urban areas. They suggest that primary-middle school transition rates are nearly 20 percentage points higher (95.0% versus 75.3%) for children from urban versus rural households. For middle-high school transition rates, estimates are 92.5% for urban and 80.1% for rural children (a disparity of just above 21 percentage points). Part of this disparity is likely capturing the effect of poverty, which is largely a rural phenomenon in Myanmar (further investigated in the next section);
(iii) EMIS and IHLCS-based estimates at the region/state level are generally but not fully consistent. 28 Both datasets show large variations in transition rates across regions/states. Unsurprisingly, both datasets show transition rates in Yangon as having the highest or second highest transition rates, with values of 93% - 95% at both levels. Both datasets suggest relatively and perhaps surprisingly low primary-middle school transition rates in Ayeyarwady. While EMIS-based estimates show Rakhine to have the lowest primary-middle school transition rate, the IHLCS-based estimate rate is low but higher (76% versus 53.8%). Based on more detailed analysis of the IHLCS data, the main source of the discrepancy is believed to be that IHLCS-estimates indicate that a very large share (roughly 17%) of children in Rakhine never complete grade 1 (i.e., a sizeable portion of children are OSY even before the primary-middle school divide).
III.5 Analysis of socioeconomic factors associated with non-transition from
primary to middle school 33. As Myanmar has made progress towards universalizing free compulsory primary education, promoting progress toward universalization of middle school and related policies and programs has been a key area for CESR Phase 2 analysis. The analysis above—based on self-reported reasons for non-transition into middle school—provides some evidence, suggesting (for example) the need to address direct and opportunity costs of middle school education and also to improve perceived quality and relevance. The CESR Phase 2 analysis also utilized the IHLCS dataset to investigate the role of household-level socioeconomic factors, which may help better understand the results above and also help to pinpoint policy and programmatic interventions. 34. The approach involves multivariate regression analysis, a statistical technique to look for correlation between an “outcome variable” and one or more “explanatory variables”: in this case, the regressions restricted the sample to respondents age 16-22 who had completed primary school (at least), and looked at the extent to which various factors appear to explain non-transition to middle school.29 The regressions also split the sample into boys and girls, to allow 28 This merits further exploration and could reflect the noted issues affecting EMIS data, methodology used by MOE
in generating local estimates, lack of state/region representativeness and small sub-sample size in the IHLCS, or other factors.
29 In other words, the outcome variable is an indicator or “dummy variable”: a variable with only 2 values (1 or 0), in this case set at 1 for primary completers who did not complete grade 6, and 0 for primary completers who completed at least 1 year of middle school.
18
for the possibility that some factors differentially affect boys and girls. The regressions are constructed to principally show relative distinctions, and the factors (explanatory variables) of particular interest are:30
(i) Under basic household characteristics, the first variable “rural” tries to capture the extent to which rural households differ from urban ones, after controlling for other factors;31
(ii) The remaining 5 variables under that heading capture the effect of being in a specific per-capita income32 grouping relative to the richest 20% of households (richest quintile);33
(iii) The next category includes a set of region/state dummy variables that attempt to capture the effect of the household (regardless of socioeconomic status) living in a specific state or region, measured relative to residence in Yangon;
(iv) The next category attempts to capture the influence of parents’ education (see further also below);
(v) The variable “everpreschool” attempts to isolate the effect of prior completion of preschool; and
(vi) The final variable of interest (“ageff”) attempts to capture any trend across older versus younger cohorts of respondents in the sample.34
35. The results are tabulated in Table 6A (at end). The left-most column displays the explanatory variables noted above, while values in each column to the right list the set of coefficients from a given regression specification used in columns 1-16 (see para. 36 below). As noted above, the coefficients in shown in the first row shows the relative influence of the household’s residence in a rural area (relative to a similar household living in an urban area), with the subsequent rows capturing the apparent effect of the household’s lying in a specific per-capita income grouping relative to households who are similar but live in the highest income quintile. The next 17 rows of coefficients capture the apparent influence of residence in a specific state/region relative to similar households living in Yangon (blacked out). Subsequent rows then add proxy variables to at least approximately gauge the influence of parents’ education.35 The next row of interest tests whether having earlier completed ECCD appears to have an effect on transitioning from grade 5 into middle schools (after controlling for the other factors above), while the “ageff” row allows for a time trend (i.e., whether non-transition appears
30 Without digressing into methodology, many of the explanatory variables used are also dummy variables. The
regressions involve simplifying assumptions, and are intended to provide evidence of whether certain factors appear important rather than to provide precise estimates.
31 In simplest terms, “controlling for other variables” means that the regression also includes those other variables, trying to isolate the effect of each factor, based on simplifying assumptions. For example, in this case, the regression attempts to isolate the effect of rural residence from the fact that, for example, rural households are also typically poorer, since the regression also includes separate variables to capture poverty.
32 It is recognized that household income is measured in the year prior to the survey. The approach assumes that this is a relatively good indicator of socioeconomic situation at the time when youth in the sample were finishing primary school.
33 These 5 dummy variables are defined as follows: (i) “foodpoor” means the per capita income of the household lies below the food poverty line; (ii) “otherpoor” captures households lying above the food poverty line but below the national poverty line; (iii) “nearpoor” captures households lying above the poverty line but within the second lowest income quintle; (iv) “quintd3” captures households in the third income quintile; and (v) “quintd4” captures households in the fourth income quintile (i.e., the second richest quintile).
34 As shown in the table, the regressions also include a constant, though this is harder to interpret and not of direct interest.
35 The majority of youth in the sample are recorded in households with much older adults, however, it is not possible to precisely identify parent-child pairs throughout the sample: the analytical routine (programmed in Stata software) identified the male and female adult aged 25 or above with the highest level of education in the household as a proxy for education of the father and the mother. The coefficients should thus be treated with some caution.
19
more or less prominent among older respondents in the sample, who would have started their schooling in earlier calendar years).36 Columns 1-8 use the subsample of boys, and columns 9-18 use the subsample of girls. Columns 1-4 and 9-12 use a specification based on the approximated years of schooling of these adults, while columns 5-8 and 13-16 use sets of 0-1 dummy variables for whether the adult male (variables starting with “dad”) and adult female (variables starting with “mom”) have completed specific tiers of education.37 36. Note on specifications used (columns). Since the outcome variable (non-transition from primary to middle school) is a discrete variable with value of either 0 or 1, logit regression is used in most of the columns as a basis to show whether variables appear have a statistically significant effect. Standard ordinary least squares (OLS) regressions are not, strictly speaking, appropriate (particularly in terms of standard errors generated), given the 0-1 outcome variable. However, OLS coefficients are easier to interpret, since a value of “0.1” or “-0.1” approximates an increase or decrease of 10 percentage points per unit of the explanatory variable: positive coefficients can be thought of as “bad” in that they suggest that the factor makes grade 5 completers more likely not to transition to grade 6. The discussion below thus focuses on OLS coefficients in Columns 4 and 8 (for boys) and 12 and 16 (for girls), with the noted caveat that results are indicative. 37. Basic regression results. Near the top of Panel 6A1 (for males born during late 1987 to late 1993) and Panel 6A2 (for females) of Table 6A, regression coefficients tabulated column 4 suggest that, controlling for the other variables, coming from a rural household increases the probability of a male primary completer not transitioning to middle school (i.e., decreases the probability of continuing into grade 6) by very roughly 7.4 percentage points compared to boys residing in urban areas, even after controlling for state/region and other factors included in the regressions. Being from a household lying below or near the poverty line appears to have a larger effect on non-transition (among boys who completed primary schooling). Both of these effects appear larger for females (column 12). Rural residence is associated with an increase in the likelihood of non-transition by roughly 10.6 percentage points, while the effect of income grouping is remarkably monotonic: measured compared to girls in the richest quintile, the effect of lower socioeconomic status on non-transition rate appears increasingly large in successively lower income households. For girls, living below the food poverty line is associated with a roughly 25.4 percentage point rise in girls’ non-transition, with a 17.9 percentage point effect on girls in poor households lying above the food poverty line, a 10.7 percentage point drop for girls in “near-poor” households (those living above the poverty line but in the second income quintile). In comparison, the effect of being in the third or fourth quintile is more modest (rises of 6.6 and 3.1 percentage points relative to girls from the richest quintile of households). While these regressions involve simplifying assumptions and figures should be treated as approximate, the above corroborates initial findings from Phase 1 suggesting that primary completers in rural and poorer households have a particularly high incidence of non-entry into middle school, even after controlling for state/region effects and other variables included in the regression. 38. Further down the Table in Panels 6A1 (boys) and 6A2 (girls), differences in values of the next set of coefficients confirm that state and region of residence remain an important determinant of transition into middle school, even after controlling for basic household
36 Independent age dummies suggested a roughly linear pattern, hence the use of a singular trend term in results
reported here. The trend could also capture other age-related effects, such as any shifts in sample composition (e.g., if older children split off into separate households).
37 For example, if the adult male has completed only middle school, this would be reflected as values of 1 for “dadprim” and “dadmid” (since he completed primary as well as middle school), with zeros for the other dummy variables. So each coefficient captures the marginal impact of an additional level of education.
20
characteristics and the other variables included in the regression. Using OLS results in columns 4 and 12 again (see notes and caveats above), comparison of the coefficients suggests that exit from schooling at the juncture between primary and middle school is particularly prominent in states/regions like Bago (West), Shan (North), and Magwe, and less prominent in states/regions including Chin, Shan (South), Tachin, and Mon. Differences in coefficient values also suggest somewhat more regional variation for girls: e.g., for girls, residence in Magwe, Rakhine, and Sagaing is associated with a larger rise in likelihood of non-transition to middle school compared to that for boys. 39. The next set of coefficients suggests that, controlling for other factors, primary school completers in households with more educated parents are more likely to continue into grade 6 (reflected by negative coefficients). For males, column 4 implies that the likelihood that primary graduate continues into middle school rises by around 0.7 - 0.8 percentage points per additional year of schooling for either the father or mother (proxied by the co-resident male or female adult with the most education). Both of the effects are strongly statistically significant (in the logit formulation), while the effect of the father’s education appears very marginally stronger than that for mother’s education. For girls (columns 9-12), the effect of father’s education remains statistically significant (in the logit formulation), however, the effect of mother’s education appears much stronger: OLS coefficients would suggest that each additional year of mother’s education raises the likelihood that a female primary completer enters middle school by roughly 1.0 percentage point (significantly higher than the 0.4 percentage point estimate for fathers’ years of schooling). Despite the noted caveats, that result would echo results from many developing countries, which find that mother’s education is particularly important for daughters’ educational prospects.38 The specifications in columns 5-8 and 13-16 are more subject to statistical noise, but suggest that parents’ (especially mothers’) completion of at least middle school may have a particularly strong effect on children’s likelihood for transitioning into middle school.39 40. Near the bottom, the Table suggests that prior completion of preschool (ECCD) is an important determinant of transition into middle school, though this result may combine ECCD’s effects on school readiness and performance as well as the fact that preschool access in the 1990s was largely limited to more affluent areas.40 The correlation appears particularly strong for female primary completers, with prior preschool experience associated with a roughly 4-5 percentage point increase in the probability of continuation into middle school. Finally, the positive and statistically significant coefficient on the variable “ageeff” is at least suggestive that transition rates are improving (with the caveats noted above), perhaps particularly for girls, which could be capturing the effects of MOE’s expansion of post-primary schools and other efforts to expand access to LSE. 41. In sum, despite important caveats, the results from regression analysis are fairly plausible. While more analysis is needed, the results suggest that—despite some signs of progress in recent years—increasing transition rates into middle school will require expanded interventions targeted (in particular) at rural and poor populations, as well as children from
38 See for example Chris Spohr, “Formal Schooling and Workforce Participation in a Rapidly Developing Economy:
Evidence from “Compulsory” Junior High School in Taiwan”, Journal of Development Economics, Vol. 70/2 (April 2003), pp. 291 – 327, and sources therein.
39 The Table indicates that these results are subject to larger estimated standard errors. The dummy variables are defined to provide marginal effects of each subsequent level, which may explain why some coefficients are positive (but not statistically significant).
40 The inclusion of the noted basic household characteristics in the regression reported herein decreases the estimated impact of ECCD.
21
households with less educated parents.
III.6 Further regression analysis of factors associated with non-completion of middle school 42. While Figure 5 suggests that the most dramatic grade-to-grade drop occurs between grades 5 and 6 (i.e., non-transition to middle school), it also points to substantial dropout within middle school grades. Table 6B applies a similar regression framework as used in Section III.5 (with the same caveats and limitations noted therein) to investigate factors associated with the likelihood that middle school entrants (namely those who complete at least grade 6) dropout before completing middle school.41 43. The interpretation of various coefficients is similar as to the discussion in Section III.5 (excepting that they are now capturing effects on middle school dropout rather than non-transition from primary to middle school), so detailed findings are not reported here in the text. However, among other observations, the results in Table 6B suggest that, controlling for the other variables:
(i) Coming from a rural household increases the probability of a male middle school entrant not completing middle school by just above 11 percentage points compared to boys residing in urban areas. The apparent effect is very similar for girls (roughly 10 percentage points);
(ii) For boys and especially for girls, household per capita income is a strong determinant of non-completion and the effect of income grouping is largely monotonic: compared to children in the richest quintile, the effect of lower socioeconomic status on non-transition rate appears increasingly large in successively lower income households. For females, living in a household living below the food poverty line is associated with a nearly 26 percentage point higher likelihood of non-completion (measured relative to girls from households who are in the richest quintile but otherwise fairly similar), with successively weaker estimated effects of roughly 11.5 percentage points for those in poor households lying above the food poverty line, roughly 9.3 percentage points for those in “near-poor” households (those living above the poverty line but in the second income quintile), roughly 6.2 percentage points for those in the third quintile, and roughly 4.8 percentage points for those in households in the fourth quintile (all measured relative to girls from the richest quintile of households).
(iii) Taken together with the findings in earlier sections, for boys and particularly for girls, poverty and rural status not only lower the likelihood of transitioning from primary to middle school, they also lower the likelihood of successful completion among those fortunate enough to enter middle school;
(iv) Parent’s education continued to be strongly correlated with ability to successfully complete middle school. The effect appears slightly larger (though not statistically significantly different) for mothers: each extra year of mothers’ education appears associated with a decline in the likelihood of intra-middle school dropout of roughly 1.2 and 0.9 percentage points for male and female middle school entrants respectively.
(v) Prior completion of ECCD continues to have a sizeable and statistically significant effect (decreasing the likelihood of intra-middle school dropout by roughly 7-8 percentage points; and
(vi) Perhaps disconcertingly, whereas para. 40 noted that “ageeff” terms showed signs of
41 The analysis uses IHLCS respondents age 18-22, to avoid the effects of overage children still in middle school.
22
improvement across cohorts in terms of declining non-transition into middle school, Table 6B shows no such trend. While the coefficients are not statistically significant, the negative sign suggests that, if anything, grade 6 entrants born in more recent years appear more likely to drop out during middle school.
44. As with Section III.5, the quantitative estimates above should be viewed as indicative, given simplifying modeling assumptions and the other caveats noted. Nonetheless, they again appear highly plausible overall and may shed useful light on reasons for dropout and necessary interventions. On the surface, the last finding (para. 43.[vi]) is puzzling. However, a worsening overtime could be the byproduct of policies to expand the pool of entrants into middle school. In particular, this could reflect the expansion of post-primary schools, which provided only 1 or more early LSE grades (thus directly boosting entry not completion of middle school). More generally, it may be that children from more disadvantaged backgrounds are entering middle school in greater numbers while remaining highly at-risk of dropout. Once again, the interventions required will likely need to address both:
Demand-side constraints—e.g., well targeted needs-based stipends and/or other interventions to lower the direct and opportunity costs of middle school education; and
Supply-side constraints—e.g., not only expanding physical school networks, but also improving the curriculum and pedagogy in ways that ensure that children from weaker backgrounds can succeed.
III.7 IHLCS-based analysis of household expenditures on education
45. The analysis above demonstrates that financial burdens pose a particular obstacle for entry into middle school and high school. The CESR Team proposed use of the IHLCS to further investigate household expenditures related to education, using a broad definition for the latter (e.g., including any fees as well as costs of transportation to school, private tuition, etc.). 46. As a first step, the analysis used data for IHLCS households with any member studying in a school or participating in training to calculate average expenditures related to education, including various components of education-related expenditures included in the IHLCS survey. Table 7 below provides the basic results, showing estimates for the overall sample, urban and rural households, and households living below the poverty line: an expanded Table 8 (at end) at the end additionally adds findings for households living below the more austere food poverty line, as well as comparisons of expenditures for the richest quintile (20% of households) and lower income quintiles. Key observations from both tables include the following:
(i) On average, households with current learners were estimated to have spent roughly 85,000 kyat in the year from April 2009 - April 2010, comprising roughly 4.7% of total household expenditures (numbers are similar if one include in-kind consumption);
(ii) Average education-related expenditures for urban households are nearly 2.5 times those for rural households (in nominal terms), and represent a larger share of total household expenditures (5.8% versus 4.0% in rural households);
(iii) Education-related spending by the poor and “food poor” is lower than for urban or rural samples, but remains a sizeable burden, accounting for roughly 2.4% and 1.9% of total household expenditures for these groups respectively;
(iv) The richest quintile (20%) of households spent just above 200,000 kyat on average, comprising 6.6% of total household expenditures;
(v) Importantly, for all groups except the extreme poor (living below the food poverty line), private tutoring represents the single largest education expenditure: for rural households, private tutoring comprises nearly a third (31.2%) of total education spending, rising to a share of 56.0% of education spending in urban households. It is
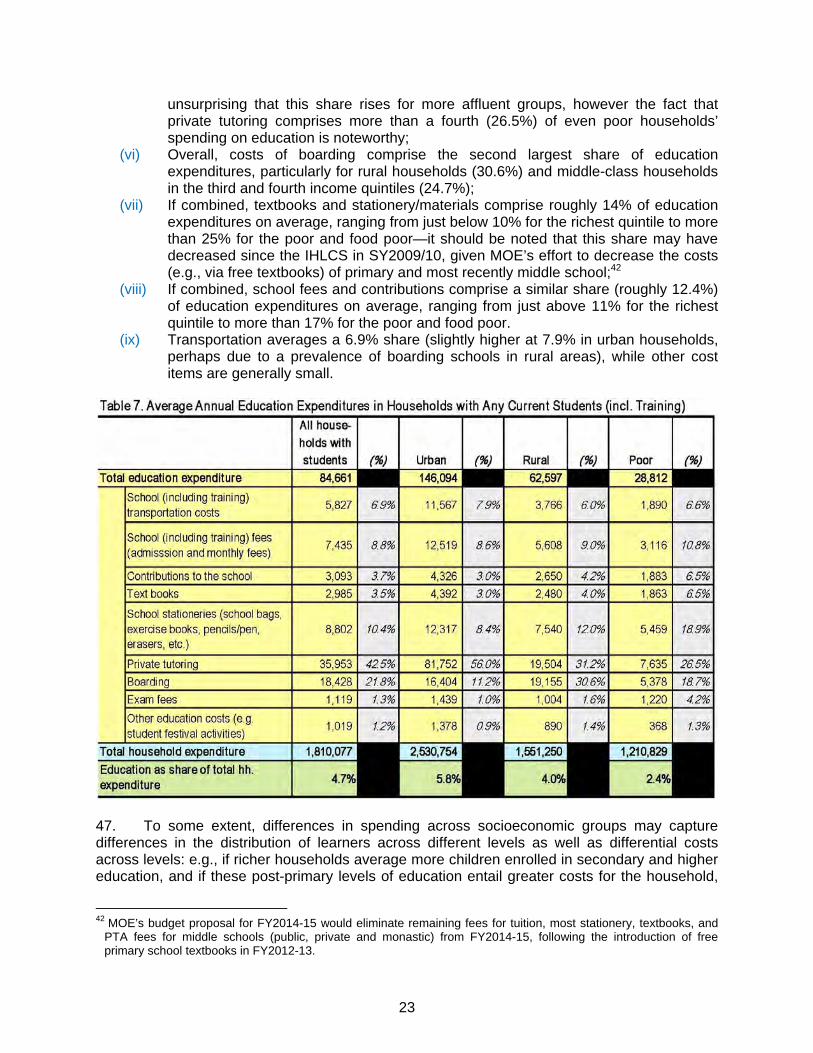
23
unsurprising that this share rises for more affluent groups, however the fact that private tutoring comprises more than a fourth (26.5%) of even poor households’ spending on education is noteworthy;
(vi) Overall, costs of boarding comprise the second largest share of education expenditures, particularly for rural households (30.6%) and middle-class households in the third and fourth income quintiles (24.7%);
(vii) If combined, textbooks and stationery/materials comprise roughly 14% of education expenditures on average, ranging from just below 10% for the richest quintile to more than 25% for the poor and food poor—it should be noted that this share may have decreased since the IHLCS in SY2009/10, given MOE’s effort to decrease the costs (e.g., via free textbooks) of primary and most recently middle school;42
(viii) If combined, school fees and contributions comprise a similar share (roughly 12.4%) of education expenditures on average, ranging from just above 11% for the richest quintile to more than 17% for the poor and food poor.
(ix) Transportation averages a 6.9% share (slightly higher at 7.9% in urban households, perhaps due to a prevalence of boarding schools in rural areas), while other cost items are generally small.
47. To some extent, differences in spending across socioeconomic groups may capture differences in the distribution of learners across different levels as well as differential costs across levels: e.g., if richer households average more children enrolled in secondary and higher education, and if these post-primary levels of education entail greater costs for the household,
42 MOE’s budget proposal for FY2014-15 would eliminate remaining fees for tuition, most stationery, textbooks, and
PTA fees for middle schools (public, private and monastic) from FY2014-15, following the introduction of free primary school textbooks in FY2012-13.
24
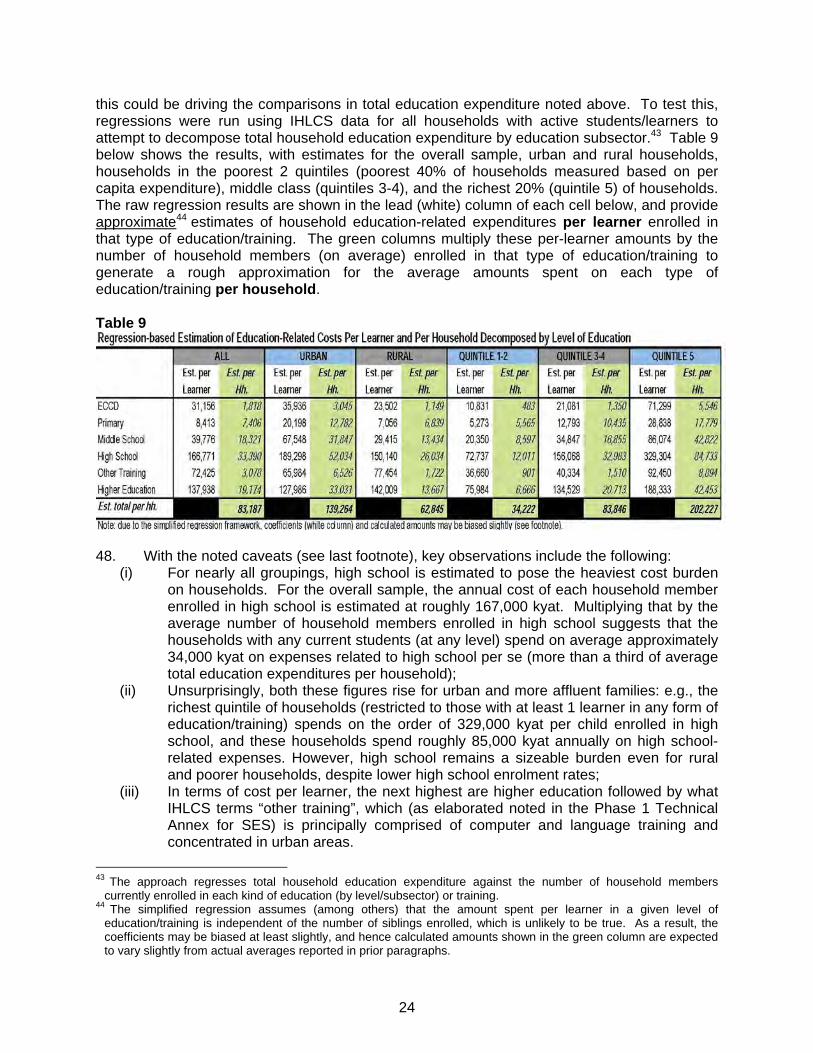
this could be driving the comparisons in total education expenditure noted above. To test this, regressions were run using IHLCS data for all households with active students/learners to attempt to decompose total household education expenditure by education subsector.43 Table 9 below shows the results, with estimates for the overall sample, urban and rural households, households in the poorest 2 quintiles (poorest 40% of households measured based on per capita expenditure), middle class (quintiles 3-4), and the richest 20% (quintile 5) of households. The raw regression results are shown in the lead (white) column of each cell below, and provide approximate44 estimates of household education-related expenditures per learner enrolled in that type of education/training. The green columns multiply these per-learner amounts by the number of household members (on average) enrolled in that type of education/training to generate a rough approximation for the average amounts spent on each type of education/training per household.
Table 9
48. With the noted caveats (see last footnote), key observations include the following: (i) For nearly all groupings, high school is estimated to pose the heaviest cost burden
on households. For the overall sample, the annual cost of each household member enrolled in high school is estimated at roughly 167,000 kyat. Multiplying that by the average number of household members enrolled in high school suggests that the households with any current students (at any level) spend on average approximately 34,000 kyat on expenses related to high school per se (more than a third of average total education expenditures per household);
(ii) Unsurprisingly, both these figures rise for urban and more affluent families: e.g., the richest quintile of households (restricted to those with at least 1 learner in any form of education/training) spends on the order of 329,000 kyat per child enrolled in high school, and these households spend roughly 85,000 kyat annually on high school-related expenses. However, high school remains a sizeable burden even for rural and poorer households, despite lower high school enrolment rates;
(iii) In terms of cost per learner, the next highest are higher education followed by what IHLCS terms “other training”, which (as elaborated noted in the Phase 1 Technical Annex for SES) is principally comprised of computer and language training and concentrated in urban areas.
43 The approach regresses total household education expenditure against the number of household members
currently enrolled in each kind of education (by level/subsector) or training. 44 The simplified regression assumes (among others) that the amount spent per learner in a given level of
education/training is independent of the number of siblings enrolled, which is unlikely to be true. As a result, the coefficients may be biased at least slightly, and hence calculated amounts shown in the green column are expected to vary slightly from actual averages reported in prior paragraphs.
25
(iv) At roughly 40,000 kyat per middle school pupil per year, middle school is the next costliest in per-learner terms (white column). However, given that middle school enrolments are much larger than for higher education (or other training), average per-household expenditures on middle school and higher education are very similar. For the poorest 40% of households (quintiles 1-2), middle school poses the second highest total burden on average (second to high school);
(v) In per-learner terms primary education is the least costly, in part reflecting the government’s efforts to provide free compulsory primary schooling as well as lower transportation costs, etc. By contrast, preschool (ECCD) is much more costly per learner, though this reflects the fact that (as of the survey dates), preschool was largely confined to a small minority of children concentrated in affluent urban households.
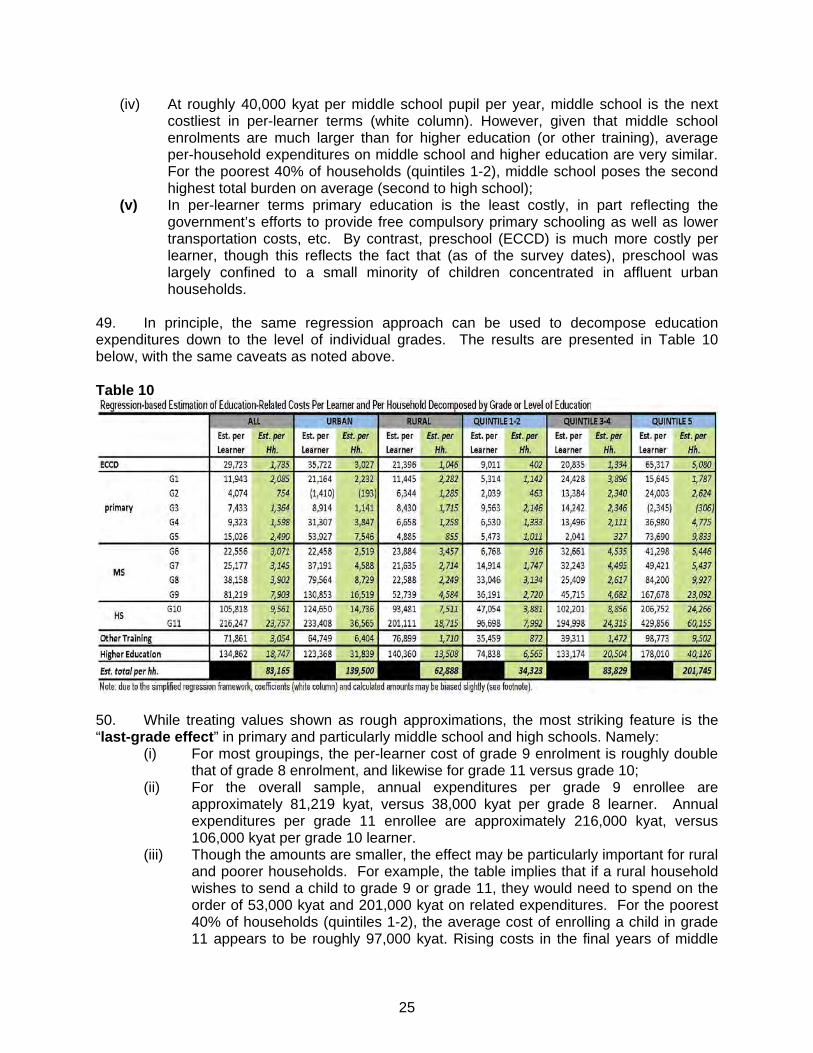
49. In principle, the same regression approach can be used to decompose education expenditures down to the level of individual grades. The results are presented in Table 10 below, with the same caveats as noted above. Table 10
50. While treating values shown as rough approximations, the most striking feature is the “last-grade effect” in primary and particularly middle school and high schools. Namely:
(i) For most groupings, the per-learner cost of grade 9 enrolment is roughly double that of grade 8 enrolment, and likewise for grade 11 versus grade 10;
(ii) For the overall sample, annual expenditures per grade 9 enrollee are approximately 81,219 kyat, versus 38,000 kyat per grade 8 learner. Annual expenditures per grade 11 enrollee are approximately 216,000 kyat, versus 106,000 kyat per grade 10 learner.
(iii) Though the amounts are smaller, the effect may be particularly important for rural and poorer households. For example, the table implies that if a rural household wishes to send a child to grade 9 or grade 11, they would need to spend on the order of 53,000 kyat and 201,000 kyat on related expenditures. For the poorest 40% of households (quintiles 1-2), the average cost of enrolling a child in grade 11 appears to be roughly 97,000 kyat. Rising costs in the final years of middle
26
and high school may help explain higher rates of dropout among children from rural and disadvantaged backgrounds;
(iv) Further analysis (not tabulated here) suggests that the last-grade effect is largely driven by increased expenditures on private tuition, such as to prepare for the matriculation exam. This provides further evidence on the need to address private tuition as a critical policy issue.
IV Analysis of Enrolment and Grade Progression Dynamics Using Detailed Enrolment Profiles 51. Building on initial findings reported in the Phase 1 Technical Annex on SES, Phase 2 work included additional analysis using an ADB-developed approach called “detailed enrolment profiles”, generated using IHLCS data. The latter technique looks beyond highly aggregated figures (e.g., GER and NER) to provide a deeper understanding of the detailed dynamics of enrolment, grade progression, age of entry, the ages or grade levels at which disparities among different groups (e.g., urban versus rural) emerge, and other dimensions. 52. As its first-level of disaggregation, the analysis uses household survey data to generate profiles showing estimated age-specific enrolment rates for children and youth: in this case, for the 22 groups of children/youth at each age in the range 2-23 years of age, this first step estimates what percentage of children at each specific age are enrolled in some form of education institution.45 However, the ADB-developed detailed enrolment profile approach goes beyond that first level to investigate the detailed distribution of children by grade level, for each age cohort. Running this analysis for IHLCS subsamples of children grouped by gender, urban or rural residence, etc., allows for comparisons of detailed profiles of how children of different socioeconomic status progress through (and exit) the school system. For example, it allows at least approximate comparisons of not only whether the shares of children enrolled in some form of education at a given age differ between urban and rural areas, but also a deeper (albeit somewhat imprecise46) understanding of whether there are differences in patterns of the shares of children whose grade progression is “on track” or lagging vis-à-vis national norms. 53. Initial analysis during CESR Phase 1 suggested that the gross majority of girls and boys at least enter schooling, even in rural areas and disadvantaged households. However, it also suggested that enrolment rates begin to drop off starting around age 11, particularly in rural areas. Particularly after age 11, rural areas appear to show lower performance in terms of both lower shares of children enrolled in school at any grade, as well as higher shares of those enrolled whose grade progression is lagged vis-à-vis national norms (e.g., larger shares of rural children age 10 and older are still in primary school, although the normative age for entry into middle school is age 10). That Phase 1 initial analysis concluded that the net effect is disparities in participation (both in terms of enrolment and shares of children on-track or lagging in grade progression) widen at higher grades, with substantially lower levels of participation in rural areas in high school, higher education, and other training recorded in the IHLCS (termed herein as “TVET”).47
45 At this first-level, World Bank’s ADePT Education database provides similar findings for numerous countries
including several in Asia. See http://web.worldbank.org/WBSITE/EXTERNAL/TOPICS/EXTEDUCATION/EXTDATASTATISTICS/EXTEDSTATS/0,,contentMDK:22302305~menuPK:6422592~pagePK:64168445~piPK:64168309~theSitePK:3232764,00.html
46 The “on track” baseline refers to those entering grade 1 at age 5 and progressing without repetition. As noted earlier, IHLCS surveys age at the date of survey (December or January), hence it may somewhat overstate the share of children lagging behind.
47 TVET is defined herein to include programs below the tertiary level that may be either prior to entry into
27
54. To better understand these dynamics, CESR Phase 2 analysis generated detailed enrolment profiles for 8 IHLCS subsamples, presented graphically in Panels A-H of Figure 6 (at the end). Namely, these panels show comparisons of detailed enrolment profiles (depicting grade progression and dropouts by age cohort) for:
(A) All children or youth aged 2-23 (denoted “children” for brevity) in the sample; (B) Urban children, or more precisely, children from households in urban areas; (C) Rural children (based on household location); (D) Children in poor households; (E) Boys; (F) Girls; (G) Boys in poor households; and (H) Girls in poor households.48
55. Overall, the focus of analysis herein is on qualitative comparisons of the profiles, though annotations in Panels A-H in Figure 6 provide at least approximate49 quantitative comparisons of disaggregated enrolments at selected ages (namely, ages 6, 12, 15, 16,and 18). 56. Panel A: All Children reflects the entire IHLCS sample of children (nationwide, and including boys and girls), with the total height of each bar capturing the age-specific enrolment rate: termed “first-level disaggregation” above, this captures the share of children in each age cohort in the range 3-23 years-old who is enrolled in some form of education service. Going beyond that first-level disaggregation, colored segments within each bar correspond to shares of children at each age enrolled in a specific grade (i.e., age- and grade-specific enrolment rates). In particular:
The 3 pink bars to the far left represent shares of children aged 2, 3, and 4 participating in preschool and/or other types of ECCD.50
Starting with age 5, the bars depict grade progression for basic education for each age cohort: for a given age (along the x-axis). Concentrated in ages 5-10 but extending as high as age 16, blue segments capture grades of primary school, with the darkest blue shade representing grade 1 and the lightest blue shade capturing grade 5—while the total height of each bar measures enrolment in some form of education, the successive blue colored segments show specific grades of primary schooling;
Further to the right, successively dark to light shades of green depict shares of children enrolled in each middle school grade (grade 6 in dark green, through grade 9 in light green);
Further to the right, dark and light purple segments show enrolment in high school grades 10 and 11, respectively.
57. Finally, to capture the dynamics of on-time or delayed progression across primary and middle school grades and entry into high school:
The height of the solid black line captures the share of children who are “on-track” vis-à-
employment or mid-career: partly due to the structure of the data, but consistent with definitions used in some countries, this excludes engineering/technical programs at level of undergraduate diploma and up (captured as higher education).
48 Other groupings (e.g., boys in urban households, children in urban poor households, etc.), but are not reported herein. See also next footnote.
49 Figures should be treated as approximate, particularly for smaller subsamples (e.g., poor households), which are subject to more statistical noise and sampling issues.
50 The IHCLS questionnaire only asks parents regarding ECCD participation for children age 2-4, hence IHLCS cannot provide information on the extent to which any children age 5 and up remain in ECCD (overage).
28
vis MOE’s norms, or perhaps even at a higher grade level; The position of the dashed black line captures children who appear to be lagged behind
the MOE norm by one year, though noting that this could partly capture the fact that the IHLCS survey commenced in December (mid-school-year). In other words, for each age bar,
o the height of the single colored segment between the solid and dashed lines captures the share of children at that age who may be lagged by 1-year, while
o the total height of any colored segments lying above the dashed line captures the share of children at that age who are in-school but whose grade progression appears to be lagged by 2 or more years.
While each bar represents a distinct age cohort, comparisons across successive bars can give at least a rough understanding of the dynamics such as dropout and grade repetition.
58. Looking in more detail at Panel A, approximated quantitative estimates by age and qualitative patterns include:
(i) In terms of entry into primary school, looking at the bar for 5 year-olds (MOE’s normative age for entry into primary grade 1), the total height of the bar suggests that roughly 65.2% of 5 year-olds are in primary school51, while the next 2 bars indicate that this overall enrolment rate rises to roughly 89.4% and 95.2% for children ages 6 and 7 respectively.
(ii) For age 5, subdividing the bar into colored segments, the height of the darkest blue “G1” segment suggests that roughly 57.4% of 5 year olds are in grade 1 (“on-track” vis-à-vis MOE’s norm), while the lighter “G2” segment indicates that roughly 7.1% are in grade 2 (further advanced than expected).
(iii) Looking to age 6, while the total height of the bar (overall enrolment rate) has risen to 89.4% as noted above, one notes a sharp drop in the solid black line: i.e., whereas 65.2% of 5 year-olds are at least in grade 1, only 45.9% of 6 year-olds are at least in grade 2. While these 2 bars represent different cohorts, this sizeable drop (nearly 20 percentage points) is consistent with other CESR Phase 1 and Phase 2 findings using IHLCS in suggesting substantial repetition of grade 1;
(iv) At age 7, a. The total height of the bar suggests that (as noted) 95.2% of 7 year-olds are
enrolled, a share that stays roughly constant through age 9; b. The medium blue “G2” segment (between the solid and dashed black line)
indicates that up to 43.5% of 7 year-olds may be lagged by 1 year (with the caveat noted above that this may be an over-estimate due to IHLCS’ survey timing); and
c. the darkest blue “G1” segment above the dashed line indicates that roughly 12.2% of children are in grade 1 (i.e., in school but more clearly lagging in their grade progression).
(v) At age 10 (the normative age for entry into middle school), there are modest signs of dropout, as the share of children enrolled in any form of schooling has begun to drop slightly (down to 92.1%; i.e., the share of OSY has risen to 7.9%). By specific level of enrolment, roughly 26.7% of 10 year-olds are in middle school, while another 65.4% are still enrolled in primary;
(vi) At age 12, roughly 79.4% of children are enrolled (20.6% are OSY), with roughly 59.7% of 12 year-olds in secondary school, with 19.2% still enrolled in primary
51 It is noted that the share of children participating in any form of education is likely understated for 5 year-olds and
perhaps slightly older children, since the IHLCS survey does not include participation of 5 year olds in preschool.
29
(considerably lagged); (vii) By age 15 (the normative age for entry into high school), nearly half (48.0%) of
children are OSY, while roughly 14.6% of 15 year-olds are on-schedule (grade 11) and about 18.8% are in grade 10, with smaller shares (totaling around 0.8%) enrolled in higher education and/or TVET;
(viii) By age 16 (the normative age for entry into higher education or post-secondary forms of TVET), two-thirds (60.4%) of children are OSY, while roughly 27.5% are still in secondary school (including roughly 8.1% still in middle school) and 5.8% of 16 year-olds have progressed into higher education and/or are enrolled in TVET;
(ix) Enrolment in higher education peaks at age 18, with roughly 13.6% of 18 year-olds reported to be enrolled in higher education, comprised of:
a. 11.7% in higher education only, and b. 1.9% in both higher education and TVET.
(x) TVET participation (as measured in IHLCS) also peaks at age 18, with roughly 2.8% of 18 year-olds reported to be enrolled in “other training”, comprised of:
a. 0.9% in TVET only, and b. 1.9% in both higher education and TVET, as noted above;
(xi) Meanwhile, three-quarters (75.5) of 18 year-olds are OSY, while the remaining 8.5% of 18 year-olds are still in secondary school (significantly overage);
(xii) At ages 19-23, shares of youth enrolled in education drops off further, with higher education accounting for the majority of declining shares of youth still enrolled in education, with smaller shares enrolled in TVET (see below) or still in high school.
59. The detailed enrolment profile in Panel A also yields further observations that may help to better understand the findings on school entry and transitions across grade-levels discussed in earlier sections:
(i) As noted in para. 58(iii) above, Panel A provides further evidence of persistent repetition in grade 1, which is much larger than repetition at subsequent grades (demonstrated by the sharp drop in the solid black line, which then relatively levels off);
(ii) In terms of transition from primary to middle school, the profile shows significant drop-off between primary and middle school grades. However, whereas similar ADB analysis in the Philippines52 shows a strong correlation between on-time completion of elementary (primary) school and transition to secondary school, this IHLCS data for Myanmar give more mixed evidence of that phenomenon;53
(iii) At the transition from middle to high school (captured in the light green “G9” and dark purple G10” segments), the profile gives somewhat stronger evidence that on-time completion of middle school raises the likelihood of entry into high-school subject to caveats noted in the last footnote. The profiles also suggest that repetition is particularly high in grade 11, demonstrated by the height and persistence of the light purple “G11” bars, which suggest that grade 11 enrolment peaks at age 16, but remains sizeable up through age 19.
(iv) In terms of transition into higher education, the profiles reconfirm that, in addition to whether and when a child reaches grade 11, the matriculation exam is a strong
52 See (i) ADB (2011), referenced in footnote 17; and (ii) Paqueo, V., A. Orbeta, T. Castaneda, and C. Spohr. 2013.
“After Five Years of Pantawid, What Next?”, online at (i) http://www.adb.org/projects/documents/support-social-protection-reform-pantawid-program-policy-brief-tacr .
53 While subject to statistical noise and other factors, the dashed black line in Panel A would imply that this is true for entry into middle school by age 11 (i.e., within 1 year of the norm), but not for entry by age 10. A possible explanation that would be consistent with this finding would be if parents of children who initially enter grade 5 at age 9 were more likely to let them repeat, to be better prepared or more mature for middle school.
30
determinant of the likelihood and timing of entry into higher education. The sharp drop-off in the solid black line between age 15 and age 16 yields a crude estimate54 that just above one-third (35.0%) of children who enter grade 11 by age 15 (on-time) enter higher education at age 16. Assuming that virtually all matriculation exam passers enter higher education in the subsequent year, this 35% figure also gives a crude upper-bound estimate of the share of on-time entrants to grade 11 who successfully pass the matriculation exam on their first try, since in general we would expect that on-time entrants to grade 11 would be stronger students than those reaching grade 11 one or more years overage. As also noted in the last bullet, failure on the matriculation exam appears to be driving grade 11 repetition.
(v) As noted above, the share of youth entering TVET (directly after high school or at any other stage) is very low. Paras. 63-64 below provide further discussion on transitions into TVET and higher education.
60. Panels B-D of Figure 6 show similar analysis for sub-samples of children from urban households (Panel B), rural households (Panel C), and poor households (Panel D). Quantitative findings are not reported (though some are annotated in each Panel), although comparisons point to clear differences, including in the following dimensions:
(i) Overall enrolment rates (measured by the total height of each bar) are modestly higher for urban children among those age 5-9, with the gaps largest compared against those from poor households (mostly in rural areas) at age 5-6. For example, roughly 94.2% of urban children are in primary school by age 6, versus 79.8% of 88.3% of rural children and 79.8% of children from poor households. However, gaps enrolment rates among poor and especially poor children drop off much more sharply after age 9, consistent with cohort-based analysis in Section III.1;
(ii) Looking below that first-level disaggregation, the profiles indicate that the above is driven by the fact that primary grade repetition rates and dropout appear much lower among urban children. This is most notable in comparing the drop in the solid black line after grade 1, however Panel B also shows that both the solid and dashed black line are much closer to horizontal, suggesting that the gross majority of urban children who enter grade 1 at age 6 enter grade 5 at age 9 (on-time) and likewise for those who may be 1-year lagged. By contrast, the solid and dashed black lines in Panel D show a particularly rapid plummet, indicating that children from poor households are repeating and/dropping out of school at much higher rates (consistent with the multi-cohort analysis reported above).
(iii) Relatedly, the profiles point to marked disparity in the shares of children who are overage. This is immediately apparent in comparing the height of all colored segments lying above the dashed black line versus the total height of those bars, which represents the share of enrolled children that is lagging considerably behind the MOE norm.55 For children from urban households (Panel C), fewer than 1 in five enrolled children age 10-15 are considerably lagging. By contrast, this share is closer to one-half for children from rural poor households (Panel C) and more than one-half for children from poor households (Panel D). For example, among poor, poor 12 year-olds (which in MOE norms would correspond with grade 8, the third year of middle school), 30.4% are OSY, while 41.5% (or three fifths of the 69.5% who are enrolled in schooling) are in grade 6 or earlier, including 27.9% who are still
54 Since successive bars in the profile represent different cohorts of children, such comparisons using 1 year of
IHLCS data can only give approximations of transitions within a single cohort of children. 55 Namely, the IHCLS data suggests children captured above the dashed line may be 2 or more years older than the
MOE norm for that grade, with the earlier noted caveat that this may overstate year’s overage since the survey was administered mid-school-year.
31
in primary school. (iv) The profiles also confirm that children in rural and particularly those in poor
households are much less likely to transition into middle school. (v) Drop-out within middle school appears highest56 among the subsample of all rural
children (even higher than among the mostly rural poor subsample), perhaps because many poor children are screened out of the system before entry into middle school;
(vi) Similarly, the profiles suggest that many poor students exit the system before grade 11. However, the profiles suggest some evidence that poor children who enter grade 10 are less likely to enter grade 11, perhaps due to rising costs of private tutoring and other inputs as indicated in Section III.7).
(vii) Above, it was noted that the slope of the solid black line between age 15 and age 16 yields a crude estimate for the share of on-time entrants to grade 11 who pass the matriculation exam on the first try and enter higher education the next year. Compared to the 35% share noted for the entire sample, the share is roughly 40% for children from urban households versus 31% from rural children and just above 21% for those from poor households. This suggests that, even among children reaching grade 11 on-schedule (who are likely to be the stronger students), matriculation exam passage and transition rates to higher education in the subsequent year are considerably lower. This likely reflects a combination of financial cost barriers to higher education as well as higher failure rates among rural and poor students on the matriculation exam, though available data on matriculation exam do not allow this to be directly verified.
61. Comparisons of Panels E-F suggest that differences by gender are more modest. Among observations:
(i) Overall enrolment rates in primary school appear very similar, though boys appear slightly more likely to enter school at age 5 but also to repeat grade 1;
(ii) Boys also appear to begin repetition and/or dropout slightly earlier (starting after age 9 versus after age 10 for girls).
(iii) A slightly higher share of girls appears to enter middle school on-time or within 1 year of the norm: at the time of the IHCLS survey, roughly 58% of girls and 54% of boys age 11 were reported to be in middle school (grade 6 or higher). However, distinctions in progression through middle and high school appear very modest;
(iv) Overall enrolment rates remain similar at older ages, though the profiles suggest slightly higher shares of females in each age cohort between age 16-19 enrolled in higher education, with a gap of roughly 0.8 percentage points for youth aged 16-17 and roughly 3.9 percentage points for those age 18-19 (estimated shares of females and males enrolled in higher education are roughly 14.8% versus 10.9%). The shares of 20-21 year-old females and males enrolled in higher education are nearly identical (7.9%), while the gender gap reverses at higher ages: males age 22-23 are roughly 1.0 percentage point more likely to be enrolled in higher education (6.0% versus 5.0%). Particularly among earlier ages, these comparisons may reflect females’ stronger performance on the matriculation exam (see para. 12), though length of years in higher education (due to pace of progress, degrees pursued, and/or other factors such as marriage) may contribute to the reversal at older ages.
62. Looking specifically at boys and girls in poor households, Panels G-H similarly suggest
56 This is reflected in the fact that the solid and dashed lines are much steeper in rural than urban children, despite
the fact that the share of urban children entering middle school is so much higher in absolute terms.
32
that differences by gender are modest. Due to smaller subsample sizes (creating more statistical noise) distinctions should be treated with greater caution, but observations include the following:
(i) Overall, primary enrolment rates appear similar: poor boys again appear slightly more likely to enter school at age 5 but also to repeat grade 1.
(ii) Poor boys also appear to begin repetition and/or dropout slightly earlier (starting after age 9 versus after age 10 for girls). However, whereas the share of poor boys enrolled in any form of school drops rather steadily from age 9-15 (and more sharply at ages 16 and 17), the drop-off in the profile appears more dramatic for girls at during ages 12-14;
(iii) Overall, secondary enrolment rates appear similar, however the shares of poor girls who enter middle school by age 10 and high school by age 14 appear modestly higher: on-time (by age 11). Conversely, larger shares of poor boys remain in school but lagging significantly in their progress (captured by the segments above the dashed black line). This appears to mimic similar findings in other countries, wherein academic performance appears to be a much stronger determinant of prospects for remaining in school among poor girls compared to poor boys.
(iv) Slightly larger shares of poor females appear to at least reach grade 11 (light purple segments), and are more likely to do so roughly on-time.
(v) Enrolment in higher education appears modestly higher among poor females age 16-19 compared to poor males, with a slight reversal at higher ages.
63. Additional findings on TVET. Lastly, the detailed enrolment profiles may provide further insights into transitions from basic education into TVET to corroborate and allow better understanding of quantitative findings from CESR Phase 1 (based on IHLCS data for earlier cohorts). As noted above, IHLCS-based references to “TVET” herein draw on the questions in the IHCLS questionnaire regarding participation in “other training”. TVET is defined herein to include programs below the tertiary level that may be either prior to entry into employment or mid-career: partly due to the structure of the data, but consistent with definitions used in some countries, this excludes engineering/technical programs at level of undergraduate diploma and up (which are captured as higher education). Phase 1 analysis showed that training is especially limited in skills relevant to Myanmar’s agricultural and industrial sectors, as reflected in Table 11 below, which shows the breakdown of adolescents and adults in different age groups by general/academic education attainment as well as past and ongoing participation in various sub-types of TVET.
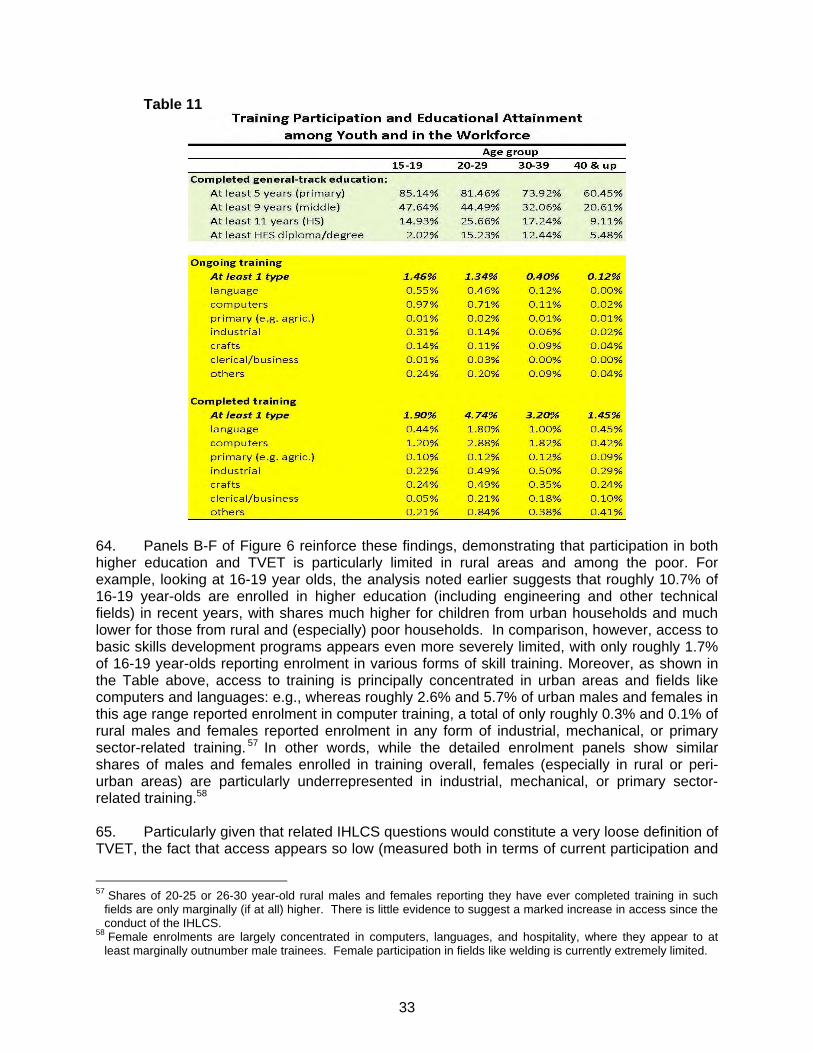
33
Table 11
64. Panels B-F of Figure 6 reinforce these findings, demonstrating that participation in both higher education and TVET is particularly limited in rural areas and among the poor. For example, looking at 16-19 year olds, the analysis noted earlier suggests that roughly 10.7% of 16-19 year-olds are enrolled in higher education (including engineering and other technical fields) in recent years, with shares much higher for children from urban households and much lower for those from rural and (especially) poor households. In comparison, however, access to basic skills development programs appears even more severely limited, with only roughly 1.7% of 16-19 year-olds reporting enrolment in various forms of skill training. Moreover, as shown in the Table above, access to training is principally concentrated in urban areas and fields like computers and languages: e.g., whereas roughly 2.6% and 5.7% of urban males and females in this age range reported enrolment in computer training, a total of only roughly 0.3% and 0.1% of rural males and females reported enrolment in any form of industrial, mechanical, or primary sector-related training. 57 In other words, while the detailed enrolment panels show similar shares of males and females enrolled in training overall, females (especially in rural or peri-urban areas) are particularly underrepresented in industrial, mechanical, or primary sector-related training.58
65. Particularly given that related IHLCS questions would constitute a very loose definition of TVET, the fact that access appears so low (measured both in terms of current participation and
57 Shares of 20-25 or 26-30 year-old rural males and females reporting they have ever completed training in such
fields are only marginally (if at all) higher. There is little evidence to suggest a marked increase in access since the conduct of the IHLCS.
58 Female enrolments are largely concentrated in computers, languages, and hospitality, where they appear to at least marginally outnumber male trainees. Female participation in fields like welding is currently extremely limited.
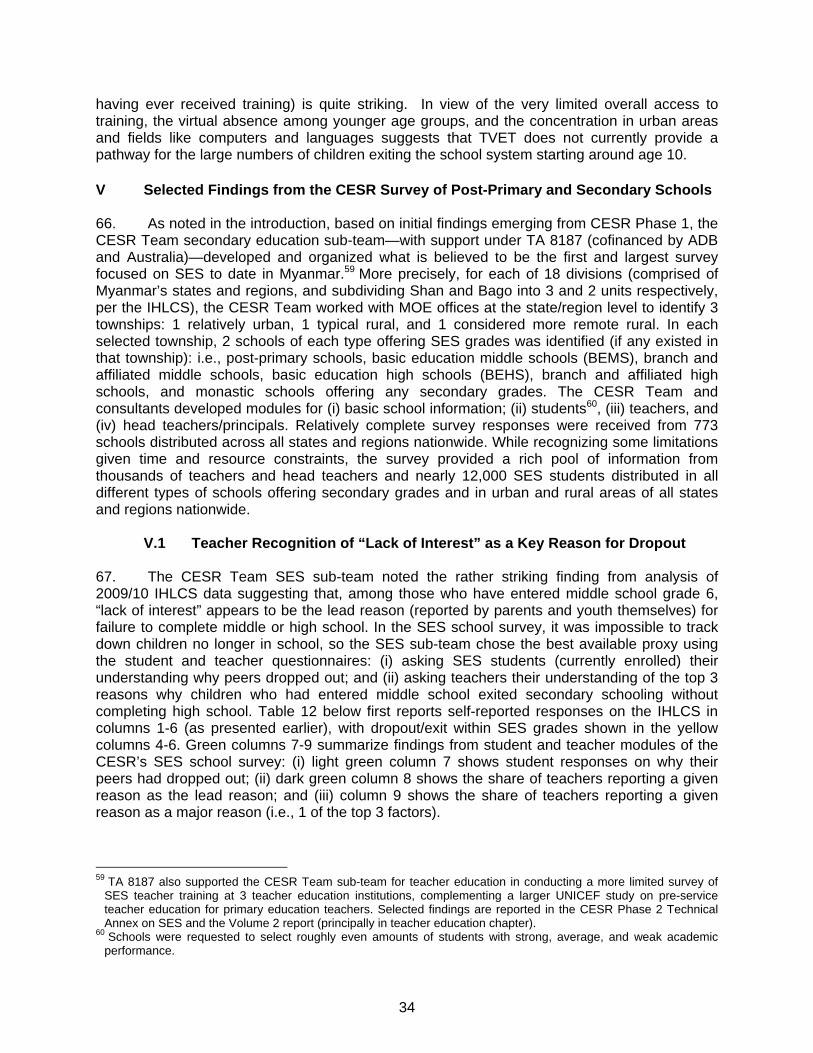
34
having ever received training) is quite striking. In view of the very limited overall access to training, the virtual absence among younger age groups, and the concentration in urban areas and fields like computers and languages suggests that TVET does not currently provide a pathway for the large numbers of children exiting the school system starting around age 10. V Selected Findings from the CESR Survey of Post-Primary and Secondary Schools 66. As noted in the introduction, based on initial findings emerging from CESR Phase 1, the CESR Team secondary education sub-team—with support under TA 8187 (cofinanced by ADB and Australia)—developed and organized what is believed to be the first and largest survey focused on SES to date in Myanmar.59 More precisely, for each of 18 divisions (comprised of Myanmar’s states and regions, and subdividing Shan and Bago into 3 and 2 units respectively, per the IHLCS), the CESR Team worked with MOE offices at the state/region level to identify 3 townships: 1 relatively urban, 1 typical rural, and 1 considered more remote rural. In each selected township, 2 schools of each type offering SES grades was identified (if any existed in that township): i.e., post-primary schools, basic education middle schools (BEMS), branch and affiliated middle schools, basic education high schools (BEHS), branch and affiliated high schools, and monastic schools offering any secondary grades. The CESR Team and consultants developed modules for (i) basic school information; (ii) students60, (iii) teachers, and (iv) head teachers/principals. Relatively complete survey responses were received from 773 schools distributed across all states and regions nationwide. While recognizing some limitations given time and resource constraints, the survey provided a rich pool of information from thousands of teachers and head teachers and nearly 12,000 SES students distributed in all different types of schools offering secondary grades and in urban and rural areas of all states and regions nationwide.
V.1 Teacher Recognition of “Lack of Interest” as a Key Reason for Dropout 67. The CESR Team SES sub-team noted the rather striking finding from analysis of 2009/10 IHLCS data suggesting that, among those who have entered middle school grade 6, “lack of interest” appears to be the lead reason (reported by parents and youth themselves) for failure to complete middle or high school. In the SES school survey, it was impossible to track down children no longer in school, so the SES sub-team chose the best available proxy using the student and teacher questionnaires: (i) asking SES students (currently enrolled) their understanding why peers dropped out; and (ii) asking teachers their understanding of the top 3 reasons why children who had entered middle school exited secondary schooling without completing high school. Table 12 below first reports self-reported responses on the IHLCS in columns 1-6 (as presented earlier), with dropout/exit within SES grades shown in the yellow columns 4-6. Green columns 7-9 summarize findings from student and teacher modules of the CESR’s SES school survey: (i) light green column 7 shows student responses on why their peers had dropped out; (ii) dark green column 8 shows the share of teachers reporting a given reason as the lead reason; and (iii) column 9 shows the share of teachers reporting a given reason as a major reason (i.e., 1 of the top 3 factors).
59 TA 8187 also supported the CESR Team sub-team for teacher education in conducting a more limited survey of
SES teacher training at 3 teacher education institutions, complementing a larger UNICEF study on pre-service teacher education for primary education teachers. Selected findings are reported in the CESR Phase 2 Technical Annex on SES and the Volume 2 report (principally in teacher education chapter).
60 Schools were requested to select roughly even amounts of students with strong, average, and weak academic performance.
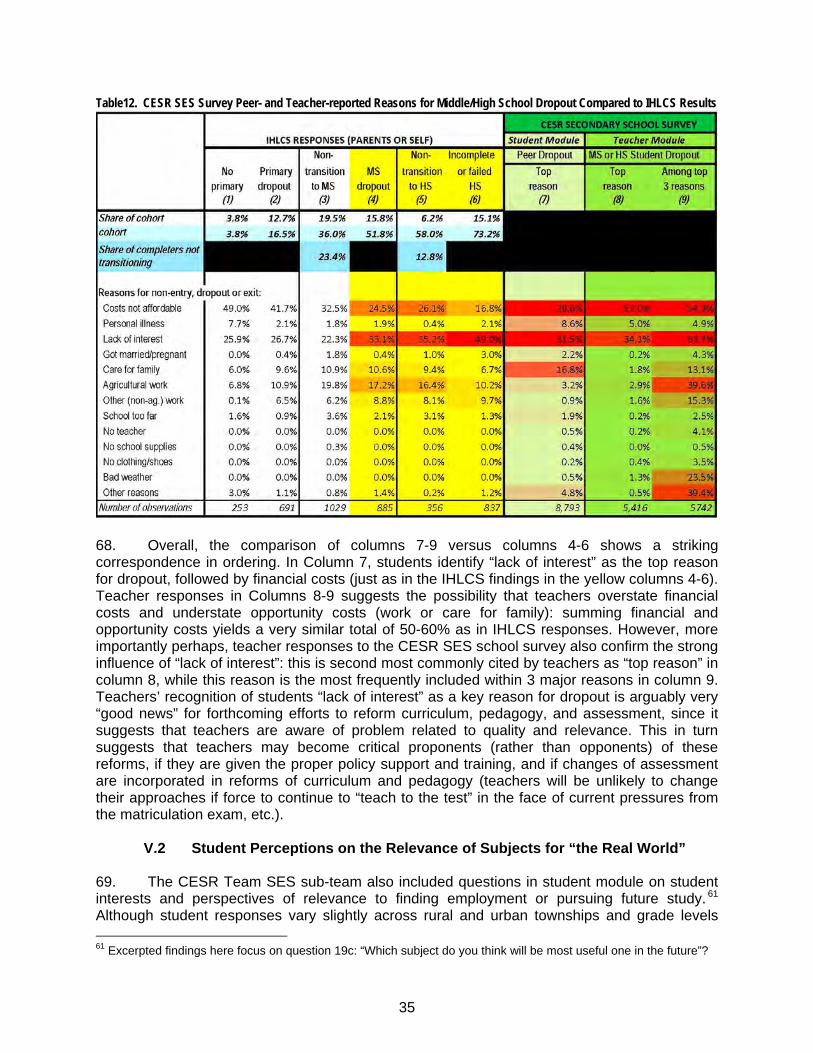
35
Table12. CESR SES Survey Peer- and Teacher-reported Reasons for Middle/High School Dropout Compared to IHLCS Results
68. Overall, the comparison of columns 7-9 versus columns 4-6 shows a striking correspondence in ordering. In Column 7, students identify “lack of interest” as the top reason for dropout, followed by financial costs (just as in the IHLCS findings in the yellow columns 4-6). Teacher responses in Columns 8-9 suggests the possibility that teachers overstate financial costs and understate opportunity costs (work or care for family): summing financial and opportunity costs yields a very similar total of 50-60% as in IHLCS responses. However, more importantly perhaps, teacher responses to the CESR SES school survey also confirm the strong influence of “lack of interest”: this is second most commonly cited by teachers as “top reason” in column 8, while this reason is the most frequently included within 3 major reasons in column 9. Teachers’ recognition of students “lack of interest” as a key reason for dropout is arguably very “good news” for forthcoming efforts to reform curriculum, pedagogy, and assessment, since it suggests that teachers are aware of problem related to quality and relevance. This in turn suggests that teachers may become critical proponents (rather than opponents) of these reforms, if they are given the proper policy support and training, and if changes of assessment are incorporated in reforms of curriculum and pedagogy (teachers will be unlikely to change their approaches if force to continue to “teach to the test” in the face of current pressures from the matriculation exam, etc.).
V.2 Student Perceptions on the Relevance of Subjects for “the Real World” 69. The CESR Team SES sub-team also included questions in student module on student interests and perspectives of relevance to finding employment or pursuing future study. 61 Although student responses vary slightly across rural and urban townships and grade levels 61 Excerpted findings here focus on question 19c: “Which subject do you think will be most useful one in the future”?
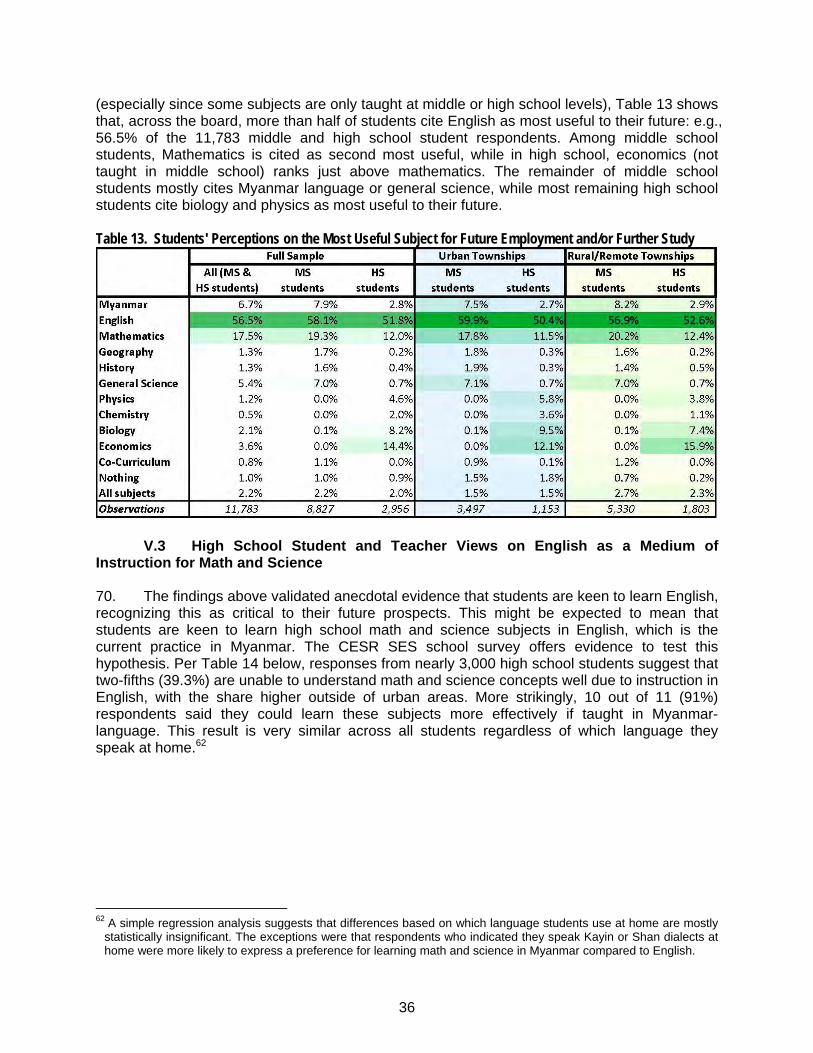
36
(especially since some subjects are only taught at middle or high school levels), Table 13 shows that, across the board, more than half of students cite English as most useful to their future: e.g., 56.5% of the 11,783 middle and high school student respondents. Among middle school students, Mathematics is cited as second most useful, while in high school, economics (not taught in middle school) ranks just above mathematics. The remainder of middle school students mostly cites Myanmar language or general science, while most remaining high school students cite biology and physics as most useful to their future. Table 13. Students' Perceptions on the Most Useful Subject for Future Employment and/or Further Study
V.3 High School Student and Teacher Views on English as a Medium of Instruction for Math and Science 70. The findings above validated anecdotal evidence that students are keen to learn English, recognizing this as critical to their future prospects. This might be expected to mean that students are keen to learn high school math and science subjects in English, which is the current practice in Myanmar. The CESR SES school survey offers evidence to test this hypothesis. Per Table 14 below, responses from nearly 3,000 high school students suggest that two-fifths (39.3%) are unable to understand math and science concepts well due to instruction in English, with the share higher outside of urban areas. More strikingly, 10 out of 11 (91%) respondents said they could learn these subjects more effectively if taught in Myanmar-language. This result is very similar across all students regardless of which language they speak at home.62
62 A simple regression analysis suggests that differences based on which language students use at home are mostly
statistically insignificant. The exceptions were that respondents who indicated they speak Kayin or Shan dialects at home were more likely to express a preference for learning math and science in Myanmar compared to English.
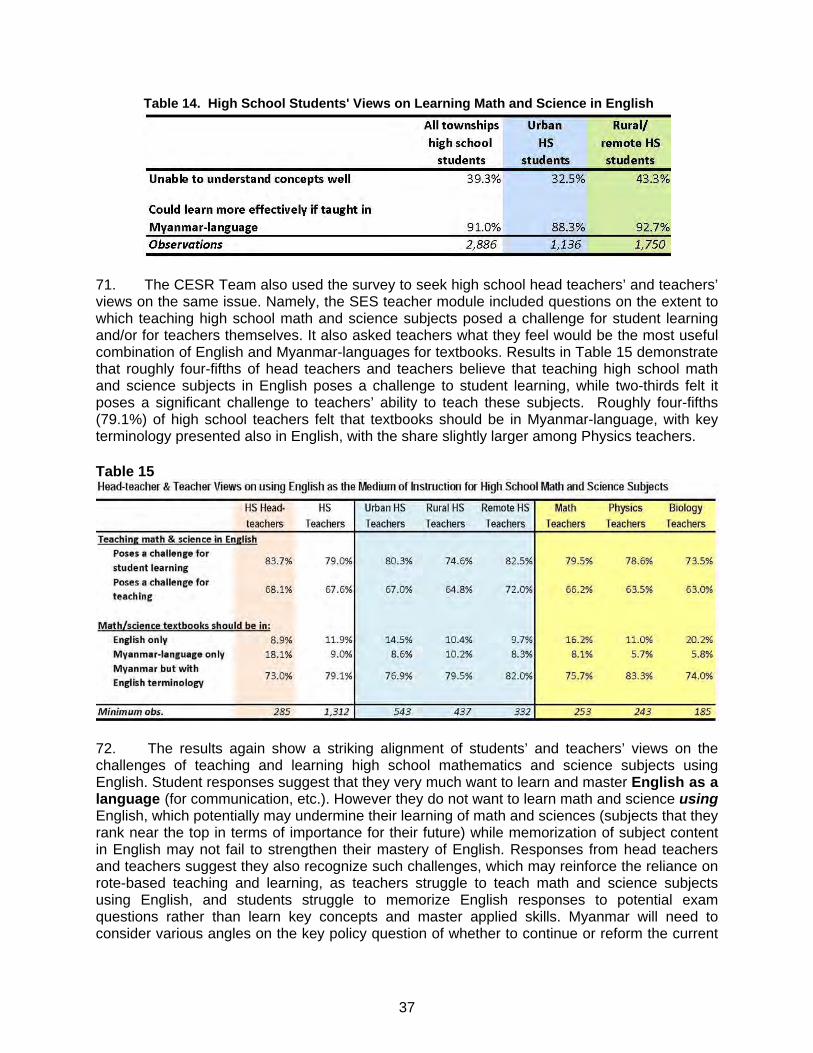
37
Table 14. High School Students' Views on Learning Math and Science in English
71. The CESR Team also used the survey to seek high school head teachers’ and teachers’ views on the same issue. Namely, the SES teacher module included questions on the extent to which teaching high school math and science subjects posed a challenge for student learning and/or for teachers themselves. It also asked teachers what they feel would be the most useful combination of English and Myanmar-languages for textbooks. Results in Table 15 demonstrate that roughly four-fifths of head teachers and teachers believe that teaching high school math and science subjects in English poses a challenge to student learning, while two-thirds felt it poses a significant challenge to teachers’ ability to teach these subjects. Roughly four-fifths (79.1%) of high school teachers felt that textbooks should be in Myanmar-language, with key terminology presented also in English, with the share slightly larger among Physics teachers. Table 15
72. The results again show a striking alignment of students’ and teachers’ views on the challenges of teaching and learning high school mathematics and science subjects using English. Student responses suggest that they very much want to learn and master English as a language (for communication, etc.). However they do not want to learn math and science using English, which potentially may undermine their learning of math and sciences (subjects that they rank near the top in terms of importance for their future) while memorization of subject content in English may not fail to strengthen their mastery of English. Responses from head teachers and teachers suggest they also recognize such challenges, which may reinforce the reliance on rote-based teaching and learning, as teachers struggle to teach math and science subjects using English, and students struggle to memorize English responses to potential exam questions rather than learn key concepts and master applied skills. Myanmar will need to consider various angles on the key policy question of whether to continue or reform the current
38
practice, but the CESR SES school survey findings suggests that Myanmar may consider Malaysia’s experience (Box 1). Box 1. Malaysia’s About-Face from Teaching High School Math and Science in English Until 2003, Malaysian high schools taught math and science subjects using the national language (Bahasa Malay) or in Mandarin in Chinese-language schools. Partly in view of parents’ demands (particularly in urban areas) and the sense that English was increasingly important due to globalization, in January 2003 Malaysia commenced application of a new policy of using English as medium of instruction for high school math and science. However, despite continued popularity among some segments of the public (especially in urban areas), Malaysia encountered major challenges in teaching and learning, particularly in rural areas where teachers’ and students’ had weaker English capacity. Among other symptoms, national exam scores dropped sharply. In terms of the share of students able to score in the acceptable (grade A-C) range:
(i) In sciences, the share of acceptable passers dropped 2.5 percentage points in urban areas and by 3 percentage points in rural areas;
(ii) In mathematics the share of acceptable passers plummeted by 4 percentage points in both urban and rural areas.
In view of such challenges, in the simplest terms, Malaysia concluded that an attempt to achieve a “win-win” (using math and science subjects to reinforce English mastery) had resulted in a “lose-lose”: students’ learning of math and science suffered from instruction in English, which did not significantly improve their English ability. In 2009, the Malaysian government announced a policy reversal to stop teaching high school math and science subjects in English starting in 2012. The new policy was two-fold:
(i) revert to instruction of math and science in Bahasa Malay or Chinese; and (ii) at the same time, increase instructional hours for the English subject by up to 30%, in order
to strengthen students’ mastery of English. In other words, Malaysia refocused its efforts on strengthening English by focusing fully on improving teaching and learning of the English subject. While this issue continues to attract debate within Malaysia, it may have important implications for Myanmar.
V.4 Evidence on Priorities for Improving Learning Environments: “ICT or Libraries?” 73. The CESR Team SES sub-team also used the survey to investigate the situation of learning environments and relative priorities. For example, many of Myanmar’s neighbors have invested heavily in costly information and communication technology (ICT), though international experience suggests there may be many more “costly failures” than successes of such investments, in part due to lack inadequate consideration of total costs of ownership (TCO), in particular high recurrent costs of electricity, maintenance, teacher training, etc. For example, rigorous impact evaluations of one-laptop per child (OLPC) programs globally point to high costs with minimal (if any) benefits in terms of core education sector objectives like enrolment or completion rates and learning outcomes in core subjects.63 If this is the case, investments in
63 See studies referenced in C. Spohr. “ICT + Education: Promise & Pitfalls”, presented at the ASEAN Deep Learning
Policy Series: Empower Students with 21st Century Deep Learning Skills, on 24 September 2014, Yangon. Among others, an impact evaluation of Uruguay’s national OLPC project by Machado (2014) found that “the program had no effects on math & reading scores…”, while an Inter-American Development Bank (2012) study of OLPC in Peru found that the Program “did not increase learning… [We] find no evidence that the program increased learning in
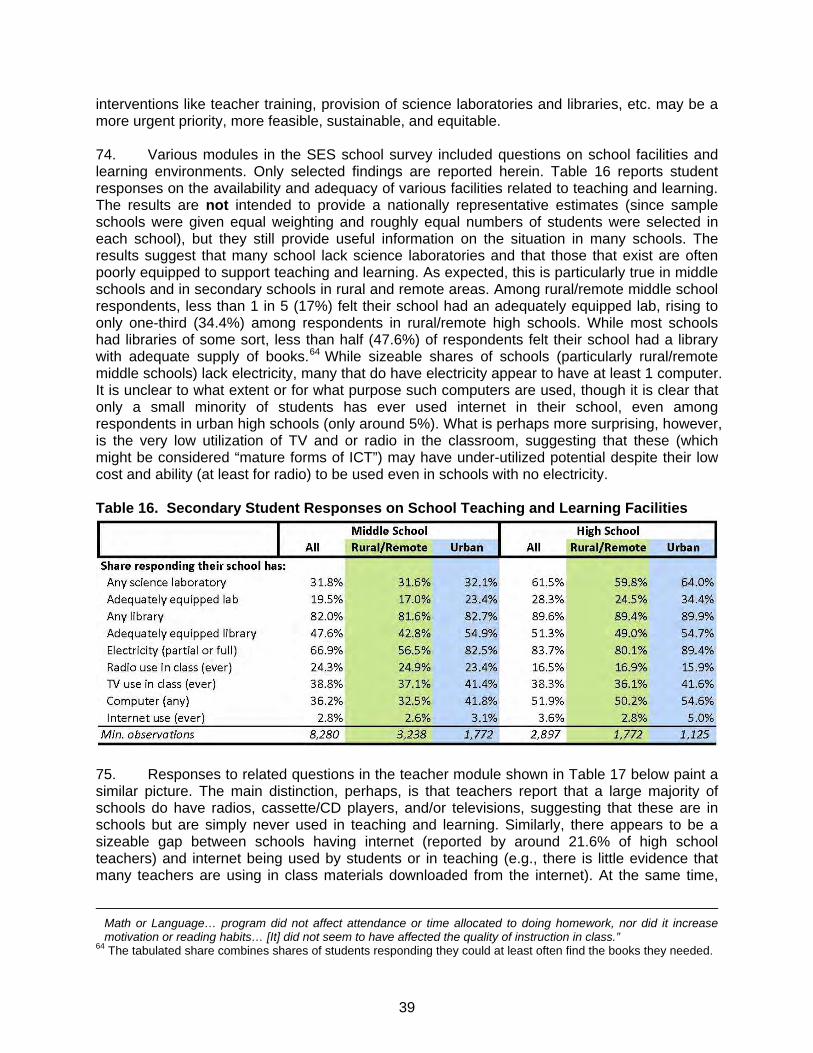
39
interventions like teacher training, provision of science laboratories and libraries, etc. may be a more urgent priority, more feasible, sustainable, and equitable. 74. Various modules in the SES school survey included questions on school facilities and learning environments. Only selected findings are reported herein. Table 16 reports student responses on the availability and adequacy of various facilities related to teaching and learning. The results are not intended to provide a nationally representative estimates (since sample schools were given equal weighting and roughly equal numbers of students were selected in each school), but they still provide useful information on the situation in many schools. The results suggest that many school lack science laboratories and that those that exist are often poorly equipped to support teaching and learning. As expected, this is particularly true in middle schools and in secondary schools in rural and remote areas. Among rural/remote middle school respondents, less than 1 in 5 (17%) felt their school had an adequately equipped lab, rising to only one-third (34.4%) among respondents in rural/remote high schools. While most schools had libraries of some sort, less than half (47.6%) of respondents felt their school had a library with adequate supply of books.64 While sizeable shares of schools (particularly rural/remote middle schools) lack electricity, many that do have electricity appear to have at least 1 computer. It is unclear to what extent or for what purpose such computers are used, though it is clear that only a small minority of students has ever used internet in their school, even among respondents in urban high schools (only around 5%). What is perhaps more surprising, however, is the very low utilization of TV and or radio in the classroom, suggesting that these (which might be considered “mature forms of ICT”) may have under-utilized potential despite their low cost and ability (at least for radio) to be used even in schools with no electricity. Table 16. Secondary Student Responses on School Teaching and Learning Facilities
75. Responses to related questions in the teacher module shown in Table 17 below paint a similar picture. The main distinction, perhaps, is that teachers report that a large majority of schools do have radios, cassette/CD players, and/or televisions, suggesting that these are in schools but are simply never used in teaching and learning. Similarly, there appears to be a sizeable gap between schools having internet (reported by around 21.6% of high school teachers) and internet being used by students or in teaching (e.g., there is little evidence that many teachers are using in class materials downloaded from the internet). At the same time,
Math or Language… program did not affect attendance or time allocated to doing homework, nor did it increase motivation or reading habits… [It] did not seem to have affected the quality of instruction in class.”
64 The tabulated share combines shares of students responding they could at least often find the books they needed.
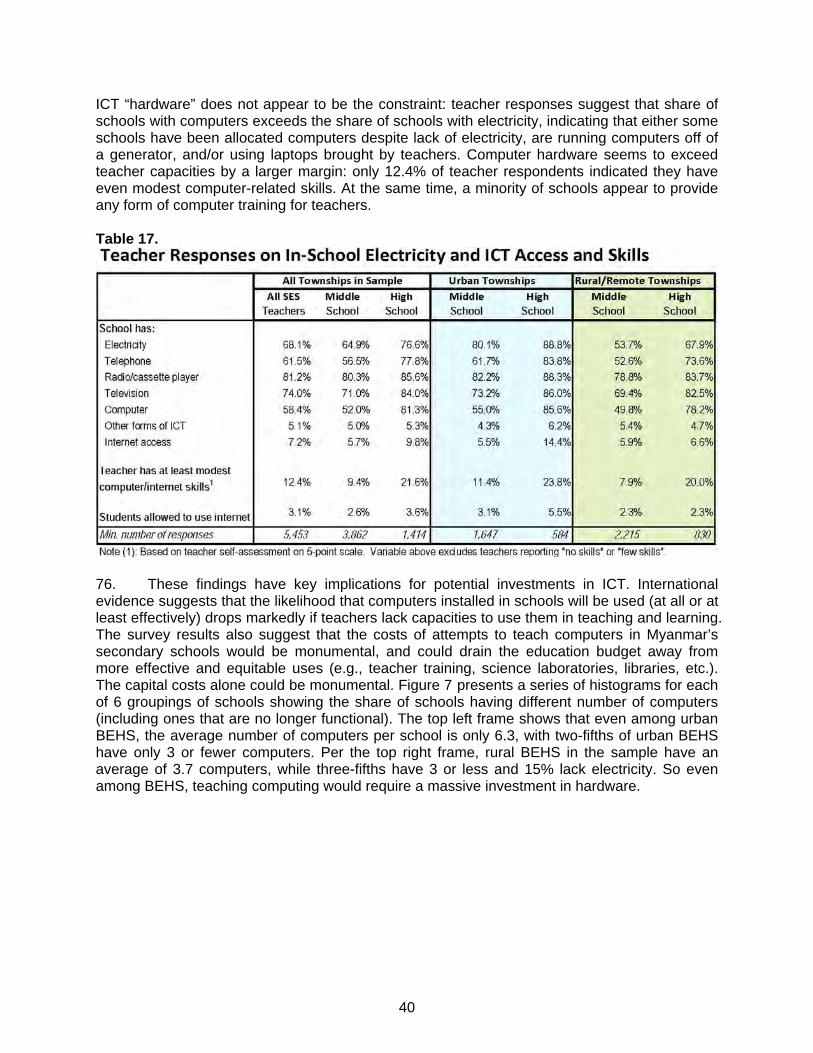
40
ICT “hardware” does not appear to be the constraint: teacher responses suggest that share of schools with computers exceeds the share of schools with electricity, indicating that either some schools have been allocated computers despite lack of electricity, are running computers off of a generator, and/or using laptops brought by teachers. Computer hardware seems to exceed teacher capacities by a larger margin: only 12.4% of teacher respondents indicated they have even modest computer-related skills. At the same time, a minority of schools appear to provide any form of computer training for teachers. Table 17.
76. These findings have key implications for potential investments in ICT. International evidence suggests that the likelihood that computers installed in schools will be used (at all or at least effectively) drops markedly if teachers lack capacities to use them in teaching and learning. The survey results also suggest that the costs of attempts to teach computers in Myanmar’s secondary schools would be monumental, and could drain the education budget away from more effective and equitable uses (e.g., teacher training, science laboratories, libraries, etc.). The capital costs alone could be monumental. Figure 7 presents a series of histograms for each of 6 groupings of schools showing the share of schools having different number of computers (including ones that are no longer functional). The top left frame shows that even among urban BEHS, the average number of computers per school is only 6.3, with two-fifths of urban BEHS have only 3 or fewer computers. Per the top right frame, rural BEHS in the sample have an average of 3.7 computers, while three-fifths have 3 or less and 15% lack electricity. So even among BEHS, teaching computing would require a massive investment in hardware.
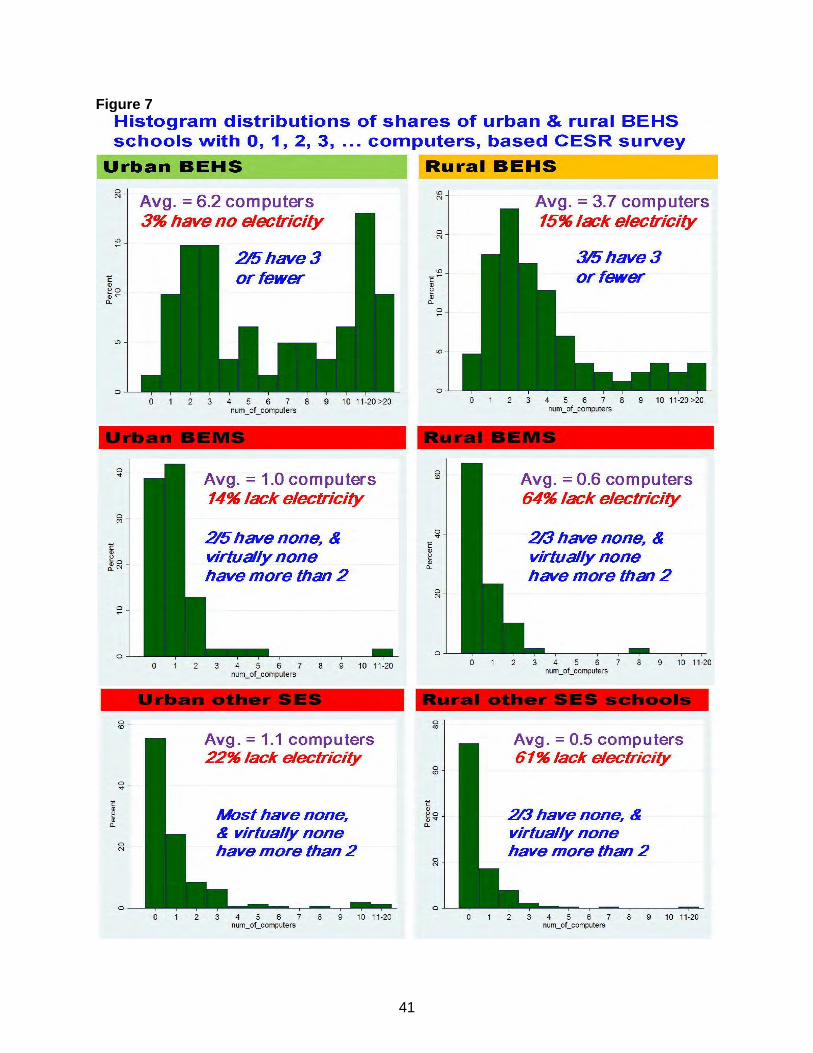
41
Figure 7
42
77. The frames in the middle row show similar histograms for numbers of computers currently urban and rural BEMS. In both cases, the challenges to teaching computing would appear very extreme: e.g., rural BEMS in the survey sample had an average of only 0.6 computers, with two-thirds having none and 64% having no reliable electricity. The remaining types of urban and rural schools (including post-primary, branch, and affiliated middle and high schools) in the bottom frames show a similar picture. In short, the capital cost alone of installing adequate numbers of computers to teach computing in middle or high school would be exceedingly high, particularly in rural areas. This also excludes recurrent costs, which are a key element of the total cost of ownership (TCO). A TCO analysis has not been conducted in Myanmar, but including the recurrent costs needed to keep computer labs in schools operational for around 3-5 years would probably yield a TCO at least double the initial capital investment. All of this has important implications for policy decisions related to whether and how to introduce computers into the curriculum and into schools. Just like hardware installation, maintenance, electricity, and other recurrent costs would likely be higher in rural areas. 78. In the near term, the survey results above would suggest that Myanmar would face huge challenges if it attempts to widely “computerize” secondary schools (e.g., installing computer labs) or to include computers as a subject in the national curriculum.65 In addition to immense capital and recurrent costs, such attempts may yield failures (in terms of little or no contribution to core education objectives), as observed in many countries in the region and globally.66 By contrast, the survey results present a strong case for provision and strengthening of science laboratories and libraries (reported above) as well as teacher training, which appear badly needed and (based on international experience) potentially much more cost-effective in improving education quality, completion rates, and broader learning outcomes. At the same time, Myanmar might explore smarter approaches to education-driven forms of low-cost ICT (e.g., radio, TV, and/or DVD-based content developed for teacher use as self-study to better understand and master student-centered pedagogical practice).67 Myanmar might also consider developing a policy on ICT-for-Myanmar education (ICT4ME), to promote the selective use of ICT in the basic education subsector only where evidence suggests it can serve as a tool to effectively advance core education objectives (e.g., education access, improved teaching, student mastery of core subjects, etc.), is cost-effective and sustainable, and promotes rather than undermines equity.68
65 Of course, even if computer science is not included in the national curriculum, well-resourced schools could include
computers as an extracurricular activity, or as part of the locally-determined curriculum. 66 See also (i) http://www.adb.org/Documents/Reports/Consultant/36518-PRC/36518-PRC-TACR.pdf ; and (ii)
surveys of international evidence by Michael Trucano and InfoDev colleagues at www.infodev.org . 67 During the CESR, initial brainstorming with Dr. Nwe Nwe Win of the Myanmar Computer Federation identified
exciting possibilities. See also C. Spohr. “Reinforcing the Pivotal Link—What Does the Evidence Tell Us About Secondary Education Subsector (SES) Curriculum Reform?”, presented at the Seminar on Basic Education Curriculum Framework, Yangon, 3-4 September 2014.
68 With support from ADB, Lao PDR formulated such a policy, which was approved in December 2013.
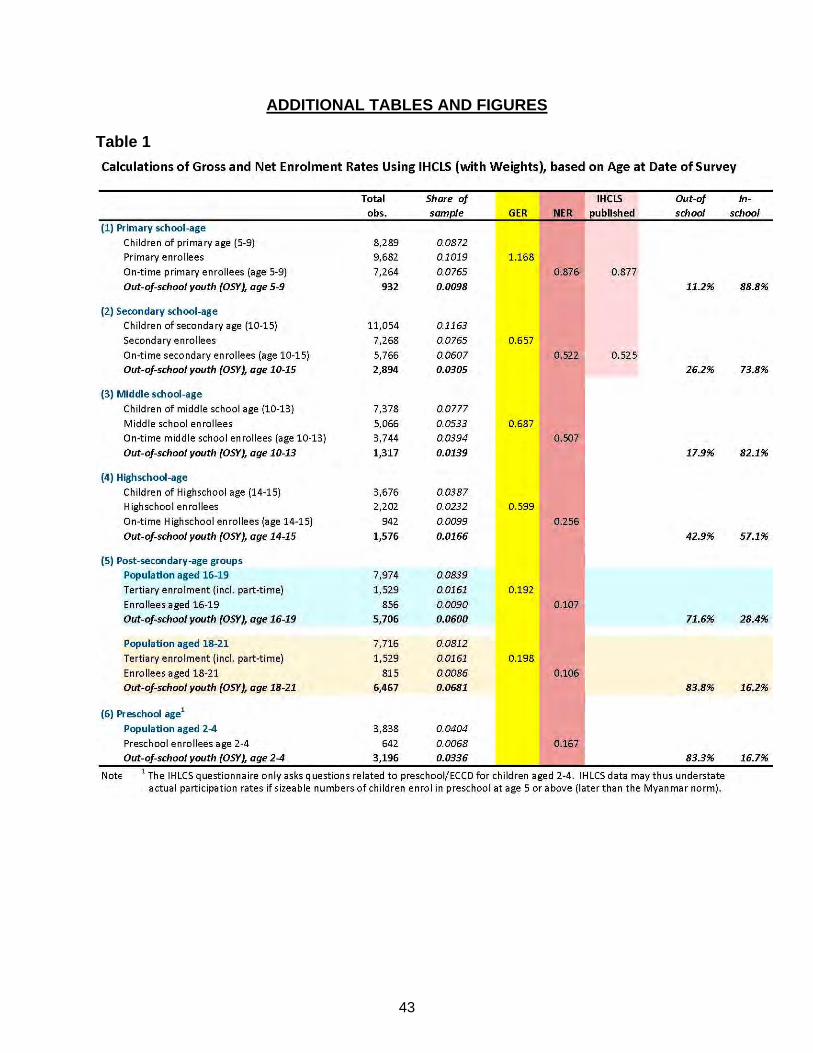
43
ADDITIONAL TABLES AND FIGURES
Table 1
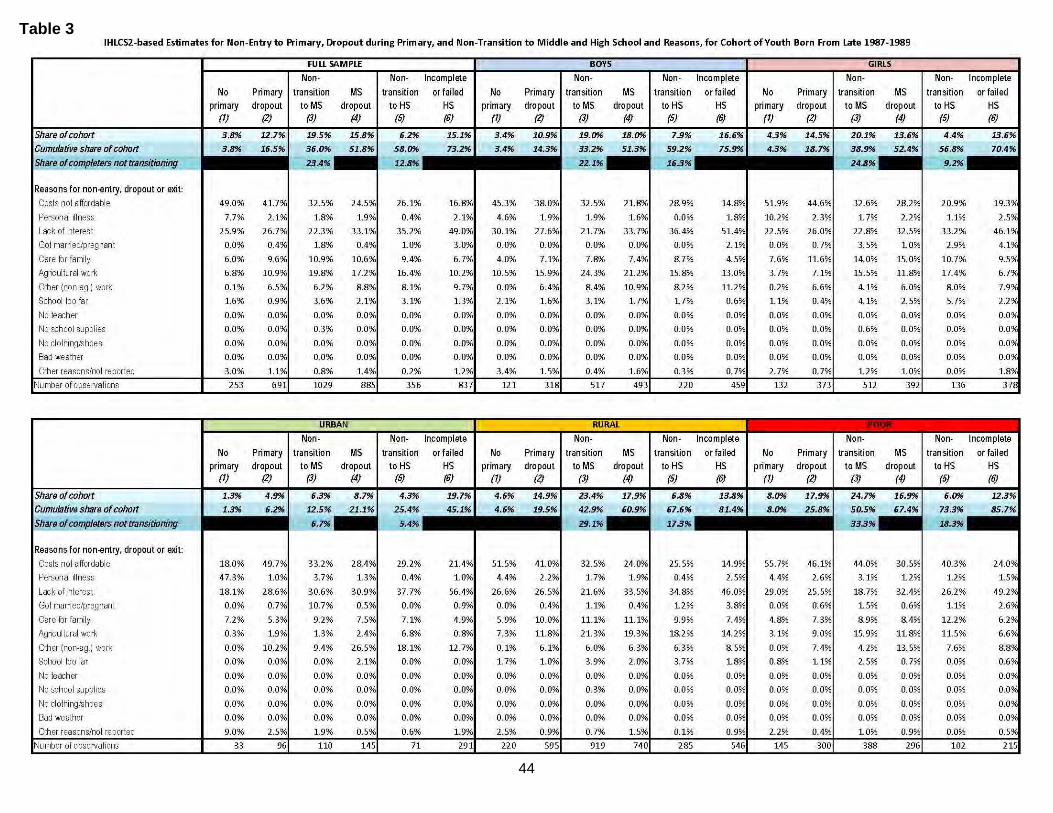
44
Table 3
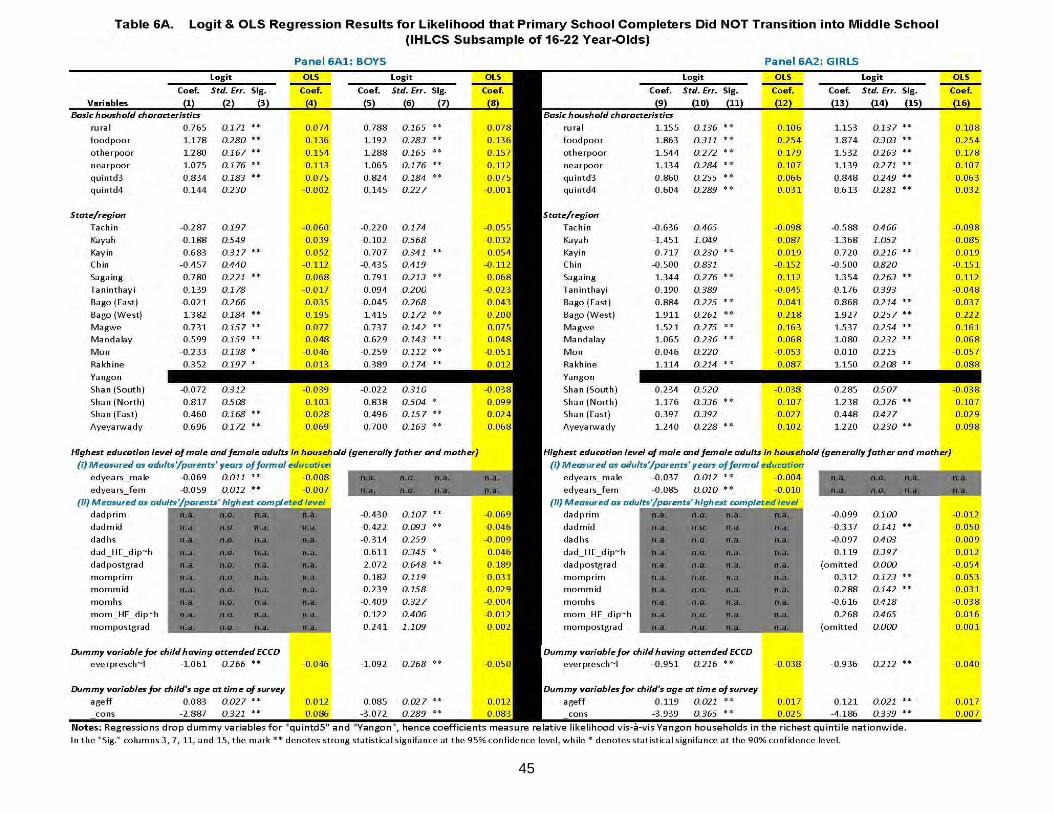
45
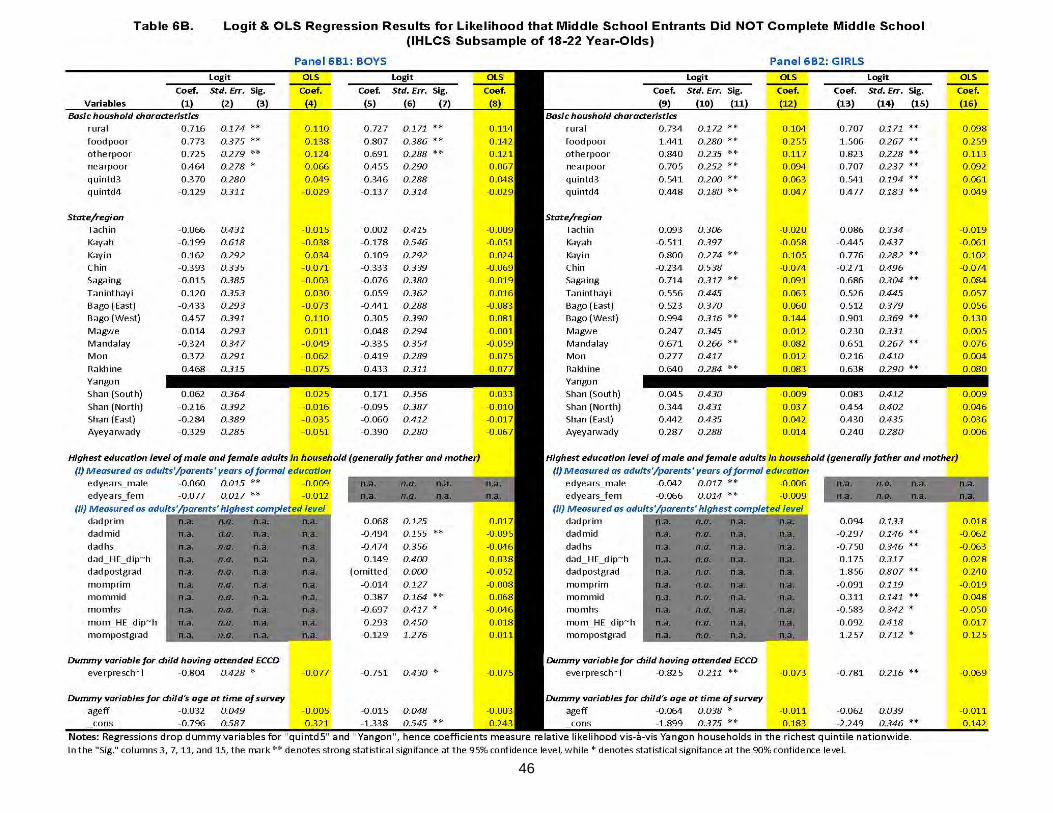
46
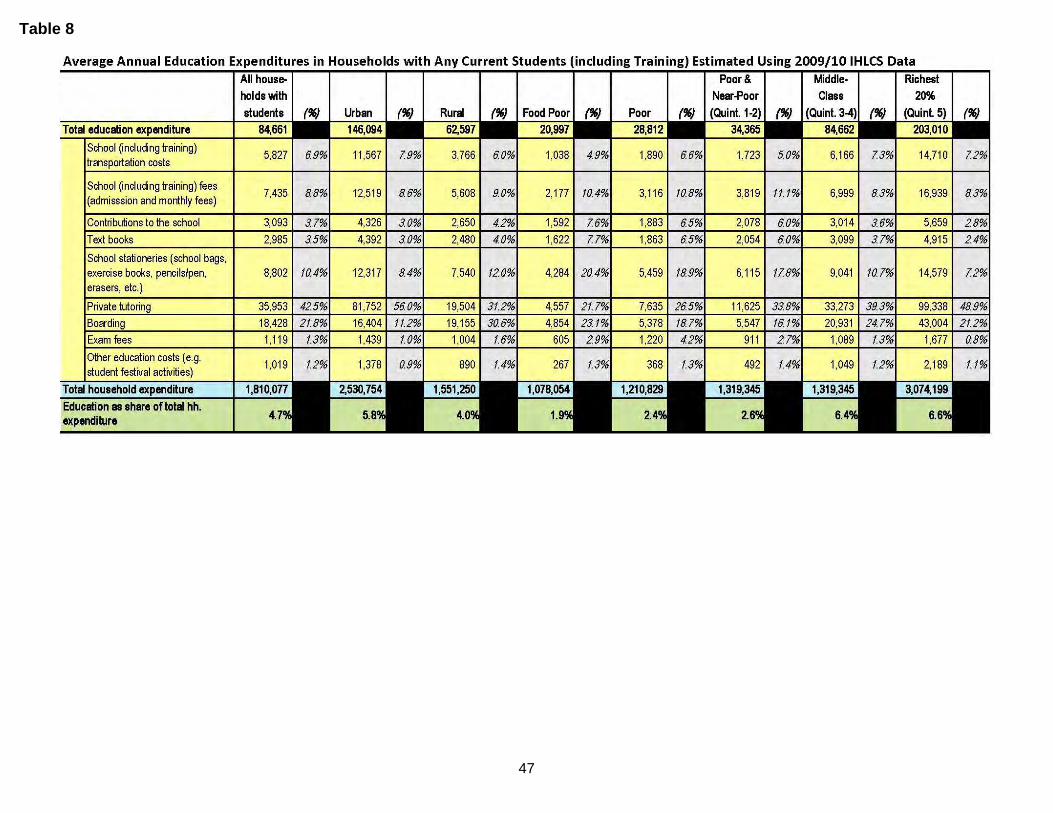
47
Table 8
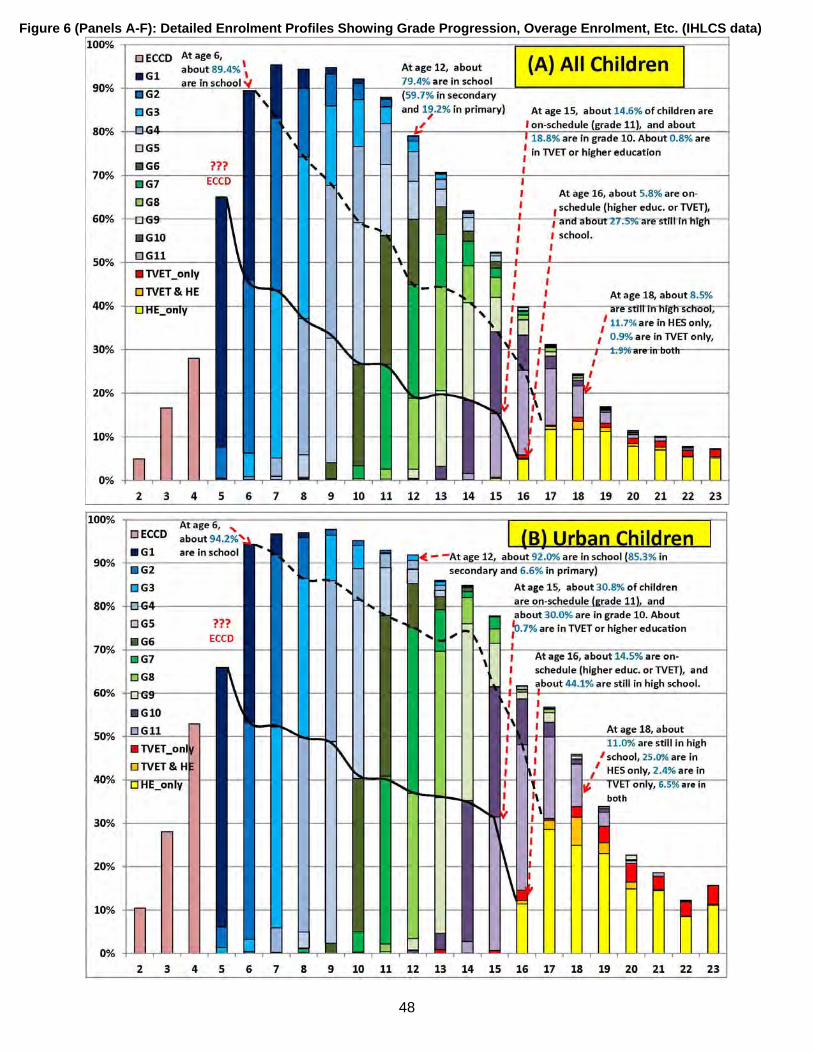
48
S
Figure 6 (Panels A-F): Detailed Enrolment Profiles Showing Grade Progression, Overage Enrolment, Etc. (IHLCS data)
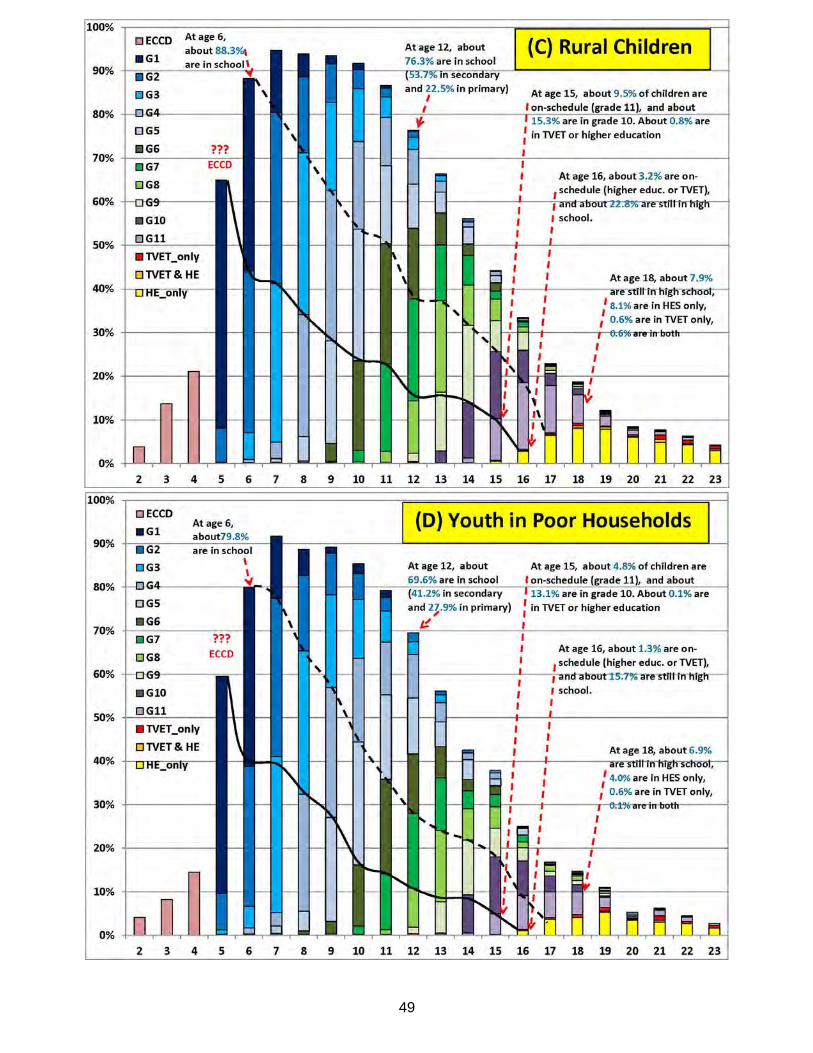
49
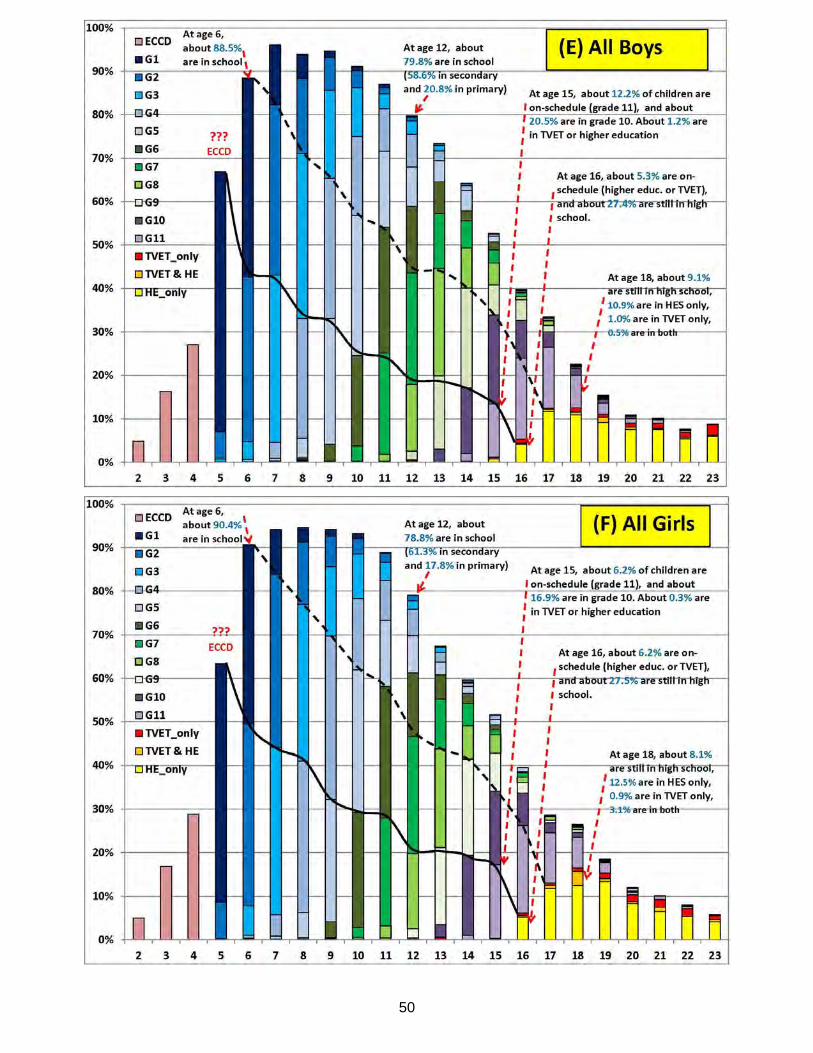
50
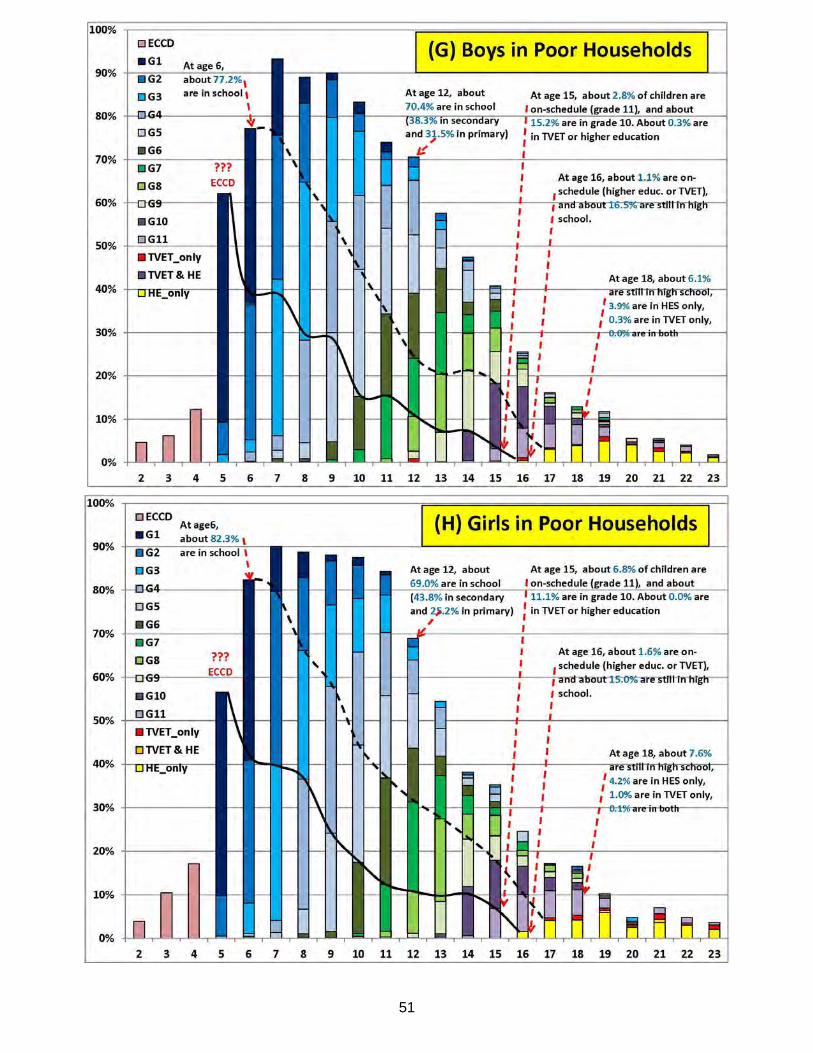
51