Embed Size (px)
Citation preview

Team Leads: Bill Putman (NASA), Brian Gross (NOAA) and Bill Collins (DOE) Addi%onal input from:
Daniel Duffy -‐ High Performance Compu%ng Lead NASA Center for Climate Simula%ons
Team 4:
Computa%onal and infrastructure environment in the next 5 years and the limits on high resolu%on ini%alized simula%ons

NASA High-‐End Compu?ng Program
High-End Computing Capability (HECC) Project NASA Advanced Supercomputing (NAS)
NASA Ames Dr. Piyush Mehrotra
NASA Center for Climate Simulation (NCCS) Goddard Space Flight Center (GSFC)
Dr. Daniel Duffy
HEC Program Office NASA Headquarters
Dr. Tsengdar Lee Scientific Computing Portfolio Manager
2

High Performance Computing Cluster Discover
Current Major NCCS Services
Mass Storage
Advanced Data Analytics Platform (ADAPT)
Disk ~4 PB
Tape ~45 PB
GPFS Shared File System ~33PB
• Large Scale Models • ~3.5 PF Peak >80,000 Cores
• Web services • Designed for large scale
data analytics • Science Cloud • HPC Technologies
NCCS Local Area Network
10 GbE and 40 GbE
• 1,000’s of cores • Petabytes of storage • Using decommissioned HPC
systems
Current NCCS Total Peak Compu?ng Capability This graph shows the growth of the total peak computing
capability of Intel Xeon processors, GPUs, and Intel
Phis at the NCCS
• Grew by almost 3x over the past few years
• Over a 100x increase in compute capability over the past 8 years
• Comparable growth in spinning disk over the same time period

Poten?al Growth of Peak Compu?ng Estimated expansion of capability at the
NCCS assuming a continued Moore’s Law growth over the next 5 years
• Blue line assumes only traditional Intel Xeon Processors O(100K) cores
• Red line shows a multi-core approach something similar to NVIDIA GPUs or Intel Phis O(10M) cores
• Over a 3x increase in the peak computing capability using the multi-core approach and potentially a 100x increase in the number of cores
• Don’t focus on the absolute numbers but on the relative increases.
0.00#
10,000.00#
20,000.00#
30,000.00#
40,000.00#
50,000.00#
60,000.00#
70,000.00#
10/10/06# 7/6/09# 4/1/12# 12/27/14# 9/22/17# 6/18/20# 3/15/23#
Total&Peak&Co
mpu
.ng&Ca
pability&(TF)&
Extrapola.on&of&Poten.al&Growth&of&Peak&Compu.ng&in&the&NCCS&
Intel#Only#Processors# Mul=>Core#Approach#

NCCS Discover Scratch (Disk) Calendar Descrip2on Decommission Total Usable Capacity (TB)
2012 Combina?on of DDN disks None 3,960
Fall 2012 NetApp1: 1,800 by 3 TB Disk Drives; 5,400 TB RAW
None 9,360
Fall 2013 NetApp2: 1,800 by 4 TB Disk Drives; 7,200 TB RAW
None 16,560
Early 2015 DDN10: 1,680 by 6 TB Disk Drives, 10,080 TB RAW
DDNs 3, 4, 5 26,000
Mid 2015 DDN11: 1,680 by 6 TB Disk Drives, 10,080 TB RAW
DDNs 7, 8, 9 33,000
Mid 2016 Target addi?onal 10,000 TB RAW
None ~41,000
• Usable capacity differs from RAW capacity for two reasons. First, the NCCS uses RAID6 (double parity) to protect against drive failures. This incurs a 20% overhead for the disk capacity. Second, the file system formatting is estimated to also need about 5% of the overall disk capacity. The total reduction from the RAW capacity to usable space is about 25%.
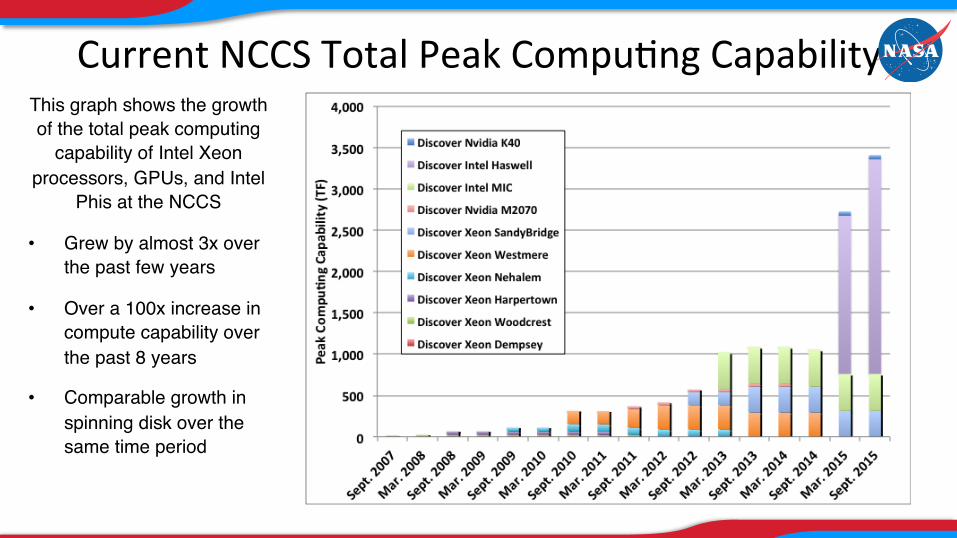
Growth of the NCCS Mass Storage (Tape)
!5.00%
5.00%
15.00%
25.00%
35.00%
45.00%
55.00%
Jan!12%
Mar!12%
May!12%
Jul!12%
Sep!12%
Nov!12%
Jan!13%
Mar!13%
May!13%
Jul!13%
Sep!13%
Nov!13%
Jan!14%
Mar!14%
May!14%
Jul!14%
Sep!14%
Nov!14%
Jan!15%
Mar!15%
May!15%
Jul!15%
Sep!15%
PBs$
1st$and$2nd$Copy$Totals$
1st%copy% 2nd%copy% Total% License%
• Stopped making second copies of tape in 2012.
• Close to linear growth regardless of compute resources.
• Quotas have been established as of 2015.
• No sign of this slowing down.

Global Modeling and Assimila%on Office
3.5-‐km GEOS-‐5 14,400 cores
0.25 GB per 2D Slice
17.8 GB per 3D Field (72-‐levels)
33.2 TB per Simulated Day
9.2 Hours Spent Wri?ng*
7-‐km GEOS-‐5 7,200 cores
0.06 GB per 2D Slice
4.45 GB per 3D Field (72-‐levels)
8.30 TB per Simulated Day
2.3 Hours Spent Wri?ng*
1.25-‐km GEOS-‐5 43,200 cores
1.0 GB per 2D Slice
71.2 GB per 3D Field (72-‐levels)
132.8 TB per Simulated Day
36.8 Hours Spent Wri?ng*
*Assumes IO Bandwidth of ~1 GB/s for 1-day simulation Typical GEOS-‐5 Output with Serial Writes

Global Modeling and Assimila%on Office
Parallel IO Strategies File-‐per-‐processor Each processor maintains its own filehandle to a unique file and can write independently without any coordina?on with other processors.
Parallel file systems o_en perform well with this type of access up to several thousand files, but synchronizing metadata for a large collec?on of files introduces a boaleneck.
One way to mi?gate this is to use a 'square-‐root' file layout, for example by dividing 10,000 files into 100 subdirectories of 100 files.
Shared-‐file (independent) Shared file access allows many processors to share a common filehandle but write independently to exlusive regions of the file.
This coordina?on can take place at the parallel file system level.
However, there can be significant overhead for write paaerns where the regions in the file may be contested by two or more processors.
Shared-‐file with collec2ve buffering Collec?ve buffering is a technique used to improve the performance of shared-‐file access by offloading some of the coordina?on work from the file system to the applica?on.
A subset of the processors is chosen to be the 'aggregators' who collect the data from all other processors and pack it into con?guous buffers in memory that are then wriaen to the file system.
Reducing the number of processors that interact with the I/O subservers is o_en beneficial, because it reduces conten?on.
Asynchronous reads/writes A collec?on of processors are reserved as IO servers, gathering data and distribu?ng to designated writers or reading data and scaaering back to the compute nodes.
In-‐Line data analysis Perform some or all of your data anaylsis during processing to avoid having to write full resolu?on data to disk
haps://www.nersc.gov


Ques?ons to address in this workshop

Compu?ng Capabili?es • What are the current compu?ng capabili?es available to NASA and NOAA and
planned growth?
• The Na?onal Strategic Compu?ng Ini?a?ve names DOE and NSF as Lead Agencies in gekng us to exascale, and NASA and NOAA as deployment agencies that focus on their respec?ve missions. Describe how these agencies can work together to advance ini?alized predic?ons.
• How do evolving mul?core accelerator architectures fit into you current so_ware models and to what extent have these technologies been explored to facilitate your hi-‐resolu?on coupled systems?

• What modeling improvements will most significantly impact compu?ng and storage requirements (e.g., resolu?on, processes/complexity, ensemble members, etc)?
• What horizontal and ver?cal resolu?ons are necessary to adequately resolve processes in the coupled system that drive both predic?on error in the short term forecast and climate simula?on bias?
• What is the ideal size of the ensemble needed for this effort both for predic?on and for understanding coupled processes and biases?
Resolu?on, Complexity, Ensembles

• How will increasingly high-‐resolu?on data be stored and shared for community research?
• As resolu?on increases, it becomes more difficult to save every bit to disk. How would you suggest we reduce the storage burden from coupled hi-‐res integra?ons?
• What must be analyzed at full resolu?on, and what can be evaluated at coarser spa?al resolu?on?
• What aspects of your analysis can be in-‐lined during computa?on to reduce the required storage?
• How does increased horizontal resolu?on impact the necessary temporal resolu?on of your analysis and data storage?
• What new technologies, such as non-‐vola?le random-‐access memory (NVRAM), provide the greatest poten?al to improve the scalability and efficiency of your coupled systems and par?cularly IO boalenecks that are inevitable at high resolu?on?
Data Volume/Storage/Sharing

Thank you!
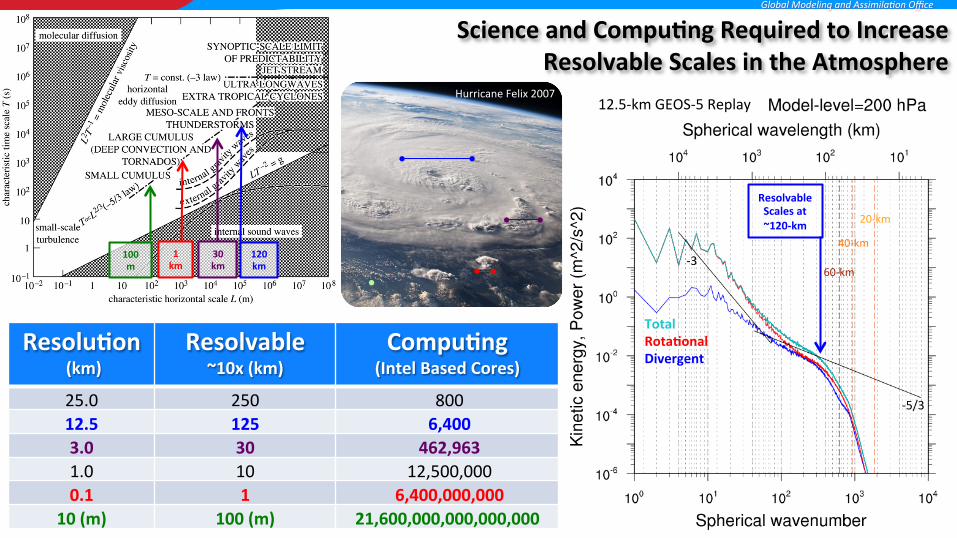
Science and Compu2ng Required to Increase Resolvable Scales in the Atmosphere
Global Modeling and Assimila%on Office
12.5-‐km GEOS-‐5 Replay
-‐5/3
-‐3
20-‐km
40-‐km
60-‐km
Resolvable Scales at ~120-‐km
Resolu2on (km)
Resolvable ~10x (km)
Compu2ng (Intel Based Cores)
25.0 250 800 12.5 125 6,400 3.0 30 462,963 1.0 10 12,500,000 0.1 1 6,400,000,000
10 (m) 100 (m) 21,600,000,000,000,000
120km
30 km
1 km
100 m
Hurricane Felix 2007
Total Rota2onal Divergent

Process-‐Based Predic?on
Teleconn
ec?o
ns
Single-‐Column
Large-‐Eddy Radia?ve-‐Convec?ve-‐Equilibrium
Embedded Regional
Pioneering Global OSSEs
Determinis?c Medium-‐Range
Seasonal
Climate Reanalysis
Process-‐Focused Field-‐Campaigns
Airborne Missions
Space-‐Based LEO/GEO CubeSat
ISS
Decadal Survey
Bill Putman – Global Modeling and Assimila?on Office
Observa?on Driven Modeling at NASA/GMAO

Modeling Component Current Capability 5-‐10 Years 10-‐20 Years
Single Column 100 Levels 200 Levels 400 Levels Large-‐Eddy
Radia2ve-‐Convec2ve-‐Equilibrium
100 m -‐ 1 km 10-‐100 m 1-‐10 m
Embedded-‐Regional Pioneering Global
OSSEs 1-‐3 km 500 m – 1 km 100-‐500 m
Determinis2c Medium-‐Range 10-‐15 km 1-‐3 km 500 m -‐ 1 km
Seasonal 25 km 3-‐10 km 1-‐3 km
Climate/Reanalysis 50 km 10-‐25 km 3-‐10 km
Observa?on Driven Modeling at NASA/GMAO

Modeling Component Current Processing (Intel-‐based cores)
5-‐10 Years (Intel-‐based cores)
10-‐20 Years (Intel-‐based cores)
Single Column 1 1 1 Large-‐Eddy
Radia2ve-‐Convec2ve-‐Equilibrium
1,000 500,000 1,000,000
Embedded-‐Regional Pioneering Global
OSSEs 30,000 12,500,000 6,400,000,000
Determinis2c Medium-‐Range 6,000 6,000,000 12,500,000
Seasonal 800 75,000 3,000,000
Climate/Reanalysis 100 8,000 100,000
Observa?on Driven Modeling at NASA/GMAO