Embed Size (px)
Citation preview

1Consumer Products Limited
Unit: Malanpur
“19th National Award for Excellence in Energy Management-
2018”
29- Aug 2018 to 31-August 2018 , Hyderabad.
Team Members :
Mr. Sandesh Borwankar
DGM-Engg Services
Mr. Mukesh Agrawal
Asst. Manager-Engg Serv.
Mr. S N Mathur
Asst. Manager-Operation

2Consumer Products Limited
Plant profile
Plant area – 70 acres
Commencement of plant operations – 1990
Unit is certified with ISO 9002 , ISO 14001 ,
TPM excellence award – 2007
Green co award – Gold category in year 2017 in its first attempt.
Godrej group established in 1897; current turnover Rs. 9000 crores,18,000 strong workforce.
Manufacturer of locks to launchers and store wells to soaps.
GCPL Malanpur unit is located in dist. Bhind MP , 30 km away fromGwalior MP.
Malanpur plant manufactures toilet soaps and soap noodles producing150000 MT of soap noodles and 70000 MT of toilet soaps .
Total Capex – 230 crore
Turnover – 1000 crore

3Consumer Products Limited
MILESTONES
Apr 1995
Mar1997
Jun 1999
May 2006
Apr
2008
Mar1991Establishment of
plants
GreenCo Gold Award
ISO 9002
Expansion
Expansion of
chemical plants
and toilet soap
plant
ISO 14001TPM Award from
JIPM
TPM award
Expansion of
chemical plants
and soap
noodles
Apr
2012Expansion of
toilet soap plant
Expansion
Expansion Jan 2017

4Consumer Products Limited
Process Flow Diagram for manufacturing Soap
Noodles/finished
Oil Tanker
Soap Bar

5Consumer Products Limited
PLANT CAPACITY DETAILS
PLANTINSTALLED
CAPACITY (MT / DAY)
CURRENT CAPACITY (MT /
DAY)
CURRENT CAPACITY (MT / ANNUM) @ 330
WORKDAYS
FAT SPLITTING(INPUT) 325 463 1,52,790
FATTY ACID
DISTILLATION(INPUT)325 445 1,46,850
SWEET WATER EVAPORATION(INPUT)
240 280 92,000
HYDROGENATION
(Stearic Acids)48 48 -
TOILET SOAP 200 200 66,000
SOAP NOODLES 325 425 1,50,000

6Consumer Products Limited
2
o Achieve zero waste to landfill
o Carbon neutrality
o A positive water balance
o Reduce specific energy
consumption by 30%
o Increase renewable energy
utilization by 30%
1
Train 1 million youth in
skills that will enhance their
earning potential
ENSURING
EMPLOYABILITYGREENER
INDIA3
Generate a third of our
portfolio revenues
from ‘good’ and/or ‘green’
products
GOOD & GREEN
PRODUCTS
OUR 2020 GOALS- “GOOD & GREEN”
DRIVING FORCE
TPM and IMS policies key points Waste elimination
Optimization of resources
Continual improvements

7Consumer Products Limited
• Target setting mechanism:
-Long term target : 30% reduction in SEC by 2020 as per Good & Green goals
-Annual targets are proposed based on the achievement during annual Greener
India council review meeting
-Greener India Council is overseen by our directors .
-All the business heads and manufacturing heads are members of the council
-The proposed targets are conveyed to all the businesses and manufacturing units
-The unit head of Malanpur discusses with the team and sets the annual target
and conveys back to the Good & Green team
-The targets are cascaded down to various sections in the plant and KPIs are set
for team members
Objectives and Targets

8Consumer Products Limited
TARGETS
4190
2850
1000
1500
2000
2500
3000
3500
4000
4500
KWH/MT
Specific Energy Consumption (Total) MJ /MT of product
Base line 10-11 2020

9Consumer Products Limited
Specific energy consumption MJ/MT
35
%
4190
34723192 3105
2894 2915 2957 29442689
2000
2500
3000
3500
4000
4500
10-11 11-12 12-13 13-14 14-15 15-16 16-17 17-18 18-19-YTD
Total Specific Energy Consumption- MJ/MT
Reasons for Deviations• Increased in energy in year 15-16 due to Biomass Boiler installation and
consumption of high power consumption in solid fuel boilers.• Bio-Mass Boiler is less efficient wrt Gas / liquid fuel fired boilers• FY 18-19 YTD performance results of initiatives in last year

10Consumer Products Limited
Specific energy consumption MJ/MT
23
%
37
%
3722
30372814 2731
2530 2559 2587 2581
2329
2000
2500
3000
3500
4000Specific Thermal Energy Consumption- MJ/MT
130121
105 104 101 99 103 101 100
708090
100110120130140
Specific Power Consumption- kWH/MT
Biomass Boiler
installed
High power consumption
in Biomass Boiler

11Consumer Products Limited
Information on Competitors, National & Global benchmark
• National/ International Benchmarking is not available
• Setting Internal Benchmarking
21.93
40.58
28.43
19.6
31.5
26.58
10
15
20
25
30
35
40
45
FSP FADP SWEP
Specific Energy Consumption wrt Vendor commitment- Fuel consumption in Kg/MT

12Consumer Products Limited
S.No. Projects Total Annual
Savings
Investment
in Lacs
Payback in
Months
Energy saving
(GJ)
1. Installation of Energy efficient water
jet vacuum system in FSP315.0 13
10 1625
2 Installed Micro steam turbine37 127
36 1903
3. Installation of energy efficient LED
lights in place of conventional lights4.5 4
12 231
4 Installed pneumatic based control
valve system in chemical plants in
order to reduce the steam
consumption
8.9 2
3 964
5. Installed heating coil system in Raw
oil tankers in order to reduce steam
consumption
6.9 20
36 748
6. Installed Energy efficient water
chilling unit compressor in soap
finishing line
4.7 5
12 242
Total80.1 171
5713
Energy Saving projects implemented in FY 2015-16

13Consumer Products Limited
S.No
.
Projects Total Annual
Savings
Investment
in Lacs
Payback
in
Months
Energy
Saving (GJ)
1. Installed pre-concentrator in FSP2
for conserving energy and
improving SW concentration
54 170
36 7020
2. Installed a water based vacuum
system in FADP2 to eliminate
usage of saturated steam
9 24
12 1170
3. Installation of Magnetic flux in
Burners of Boilers-10 3
3 1300
4. Installation of heat exchanger in
FSP215 10
9 1950
5. Installed a water based vacuum
system in Dryer 4 to eliminate
usage of saturated steam
8.4 14.7
18 1092
6. Installed energy efficient water
chilling compressor4.7 6.0
14 250
Total 101.1 227.7 12782
Energy Saving projects implemented in FY 2016-17

14Consumer Products Limited
S.No
.
Projects Total Annual
Savings
Investment
in Lacs
Payback in
Months
Energy
Saving (GJ)
1. Installed & commissioned CFA vs DFA heat
exchanger in FADP-3-15 25
20 2229
2. Installed a IOT system in RO unloading
section to reduce the steam consumption –
steam saving of 30 kg/MT of oil
30 80
30 4457
3. Modified the banding machine from 50
bundles to 100 bundles /min to reduce the
power consumption
8 27
42 423
4. Reduction in steam pressure of FADP2 10
kg/cm2 steam used for booster by 8 kg/cm28.4 2.5
3 1248
5. TIC installation in Soap Making 2 & FADP2
for maintaining of steam pressure at desired
value
3.4 2.2
9 327
6 Installed energy efficient brine chilling
compressor4.7 6.0
14 249
7 Interlocking of metal detector conveyor belt
with wrapping to reduce power consumption0.1 0
Immediate 5.3
8 Enhancement of SWEP 3 cooling tower 3.0 5.5
24 446
Total75.5 148.2
9384
Energy Saving projects implemented in FY 2017-18

15Consumer Products Limited
S. No. Year of Implementation Saving –Rs lacs
Investment –Rs in lacs
1 2010-11 28.5 35.93
2 2011-12 123.21 75.8
3 2012-13 31.29 20.72
4 2013-14 42 19.52
5 2014-15 100.71 136.22
6 2015-16 80.1 171
7 2016-17 101.1 227.7
8 2017-18 72.52 148.2
Summary of Energy saving Initiatives ( FY 2010 to 2017)

16Consumer Products Limited
Investment Vs. Savings
171
227
148
77101
75
171
398
546
77
178253
10
110
210
310
410
510
610
15-16 16-17 17-18
Cummulative Savings vs. Investment – Rs. In Lacs

17Consumer Products Limited
REDUCTION IN ENERGY CONSUMPTION ACHIEVED THROUGH…….
• De-Bottlenecking process
• Process Improvement
• Better planning
• Involvement of operations & maintenance teams
• Breakthrough technology- Up-gradation of technology has resulted in
improvement in reduction of energy cost. To achieve business excellence in
competitive environment, up gradation of technology is critical for existence
• Optimal running of Boilers & plants
• Reuse of waste process energy
• Cost reflecting the actual usage as per oil/FA, thereby selection of raw
material as per proper weightage of energy cost
In the last five years we have implemented more than 60 no's of energy conservation projects resulting into major cost reduction in our variable
cost

18Consumer Products Limited
REDUCTION IN ENERGY CONSUMPTION ACHIEVED THROUGH…….
335370
382
420444 446
463 472.7477.6
300
350
400
450
500
Feed
-M
T/d
ay
Years
Improvement in plant feed through de-bottlenecking
42.5%
Some measure taken for de-bottlenecking
▪ Enhancement of plunger pump capacity
▪ Modification in instrumentations
▪ Increase in line sizes
▪ Installation of pre concentrator
▪ Installation of 10 kg heat exchanger
FSP
335 362
399415
436 438445 452 452
300
350
400
450
500
Feed
-M
T/d
ay
Years
Improvement in plant feed through de-bottlenecking
Some measure taken for de-bottlenecking
▪ Enhancement of heat exchanger
▪ Modification in instrumentations
▪ Increase in line sizes
▪ Water jet vacuum system
▪ Installation of CFA/DFA heat exchanger
FADP
35%

19Consumer Products Limited
REDUCTION IN ENERGY CONSUMPTION ACHIEVED THROUGH…….
200 205 211
230244
257 255244 248
180
220
260
300
Feed
-M
T/d
ay
Years
Improvement in plant feed through de-bottlenecking
24%
Some measure taken for de-bottlenecking
▪ Utilization waste heat to preheat SW
▪ Timely cleaning of calendria
▪ Vacuum through water jet vacuum system
▪ By reducing water consumption in FSP
feed; over all sweet water generation is
reduced
294
379
414 409 421 424 425 427 431
275
315
355
395
435
Soap
No
od
le-
MT/
day
Years
Improvement in plant feed through de-bottlenecking
Some measure taken for de-bottlenecking
▪ Enhancement of soap heat exchangers
▪ Provision of water based vacuum system
▪ Timely cleaning of recupurator
▪ Periodic maint of equipment's
SWEP SOAP NOODLES
44%

20Consumer Products Limited
90
63.1262.44
52.1047.6445.27 43.60
43.06 39.16
30405060708090
100
% w
ater
ad
dit
ion
fo
r sp
litti
ng
Years
Reduction of water addition with oil for splitting
Some measure taken for reduction of water
▪ Optimization of critical process parameters
▪ Fine tuning of control system to achieve desired
temp.
▪ Study of oils chemistry w.r.t fatty acid present.
▪ Synchronization of oil-water ratio & temperature.
56%
Steps taken for better planning
▪ Maximum utilization of energy
efficient plants
▪ Loading of plants for AOP volume is
prioritized based on energy
REDUCTION IN ENERGY CONSUMPTION ACHIEVED THROUGH
▪ These are high return and low
investment project driven out of
system thinking.

21Consumer Products Limited
REDUCTION IN ENERGY CONSUMPTION ACHIEVED THROUGH
Steps taken for better planning in order to utilized the plants running wrt
low consumption of energy
▪ Reduction of load in FSP 1 from 26% to 0.5%▪ Increase in FSP3 utilization from 50 to 60%
▪ Reduction of load in FADP 1 from 24% to 5%▪ Increase in FADP3 utilization from 53 to 66%
25.6 25.3
15.8 15.6
8.9 9.4
0.5
23.8 23.6
32.8
22.4
38.336.3
39.3
50.6 51.0 51.5
62.1
52.8 54.3
60.1
0.0
10.0
20.0
30.0
40.0
50.0
60.0
70.0
2010-11 2011-12 2012-13 2013-14 2014-15 2015-16 2016-17
% U
tiliz
atio
n
Year
% Utilization as per Volume
24.622.6
18.5 18.8
10.112.8
4.6
22.018.1
22.4
15.5
27.2 26.529.2
53.4
59.3 59.1
65.762.7
60.8
66.3
0.0
10.0
20.0
30.0
40.0
50.0
60.0
70.0
2010-11 2011-12 2012-13 2013-14 2014-15 2015-16 2016-17
% U
tiliz
atio
n
Year
% Utilization as per Volume

22Consumer Products Limited
Innovative Projects implemented in 17-18

23Consumer Products Limited
Reduction of steam consumption in oil unloading activity in tank farm using IOT ( Internet of things )
• Raw oils ( non edible vegetable) are transported through oil tankers which are non insulated , the total transit time is 6-7 days hence oil used to get solidify at ambient temperatures . We need to heat tankers upto 55 deg to make it fluid so that it can be unloaded through a transfer pump
• The practice used was use of open steam through steam pipe to melt the oil , which was a manual activity.
Entire operation was based on lot of manual intervention and
human judgment leading to wasteful excessive heating .
No control since tank farm is at a remote location from main
plant
No alarm system for timely action
Steam Consumption -140 Kg/MT
ISSUES
Before

24Consumer Products Limited
STEAM FLOWMETER
SOLENOID ON/OFF VALVE
TEMP. SENSOR(RTD) 4
2 3 1
After
• Provided individual sensors for compartment temperature monitoring . A warning alarm also provided for timely actions from operators .
• Individual steam meters and solenoid shutoff valve provided for each unloading station .• Entire system of 7 such stations connected to a SCADA system for monitoring and controlling of steam
consumption on real time data basis . The online information made available to all operators , officers ,plant in charge .
All of the above benefits have resulted in timely efficient unloading of oils .Savings – 40 kg /MT of oil unloading amounting to 35 lac per annum
Reduction of steam consumption in oil unloading activity in tank farm using IOT ( Internet of things )

25Consumer Products Limited
To install a micro steam turbine to generate
electricity from steam pressure reduction
Background: For process heating, 3 kg of LP steam is
required & pressure reducing stations were used at
various locations to reduce steam pressure from 15 bar to 3 bar for process applications.
Idea: To utilize the reduction of steam pressure from 15 to
3 bar in generating power .we came across two alternate to generate electricity
Steam Expander – Forbes MarshalMajority of installation out of India – Not provenMicro turbine – M/s Turtle Pune previously known as Biogreen energy – There were more than 20 installations inIndia , one of the installation at near by Kota (Rajasthan)we could see the actual operation and decided go for this .
Implementation: Installed a micro steam turbine of 150 kwh
in the main steam line of 15 bar which in turns gives a LP
steam of 3 bar.
Before
Steam
pressure
15 kg/cm2
Steam pressure 3
kg/cm2 to
plant
After
Saving of Rs. 37 lac/annum Investment: 127 lac

26Consumer Products Limited
Water based vacuum system
Background:
• Our vacuum system consist of a dry ejector, a wet ejector , two boosters and a conventional barometric condenser to generate a vacuumof 2- 5 mm in our distillation plant
• For running vacuum system we required a medium pressure steam (10kg/cm2) in a tune 1000 kg per hour.
• Any fluctuation in steam pressure gives impact on vacuum & thereby on process efficiency.
• Steam boilers needs fuel & are costlier.
Idea generation : A new improved design barometric condensers we were using in our soap driers where the vacuum requirement was tothe tune of 60 mm absolute and there was no requirement of steam . Taking this into our notice , we consulted our condenser suppler to tryout our distillation process so that we can have a hybrid vacuum system without using two of the steam ejectors out of four .
Action taken:
Installed new barometric condenser with a suitable design in our distillation plant vacuum system . Now with new barometric condenser theoperations of its dry and wet ejectors is eliminated .
Benefits : 500 kg/hr steam saved amounting to Rs 72 lac per annum
After Before

27Consumer Products Limited
0.00 1.20 1.20 0.82 1.854.00
19.20
27.4
0.00
5.00
10.00
15.00
20.00
25.00
30.00
Increased in renewable energy by 27%
Utilisation of renewable energy sources
Actions
▪ Installed a Biomass Boiler
▪ Usage of Solar power in day time
Installed in 2015-16

28Consumer Products Limited
Utilisation of waste material as fuel
• Biomass Briquette:
Briquette is made from Bio waste reduces the use of fossil fuels and help in increasing Renewable energy foot prints
• Pitch:
Pitch is a waste material from the process –using as a fuel in boilers.
606 111 196321
5529
8546
0
2000
4000
6000
8000
10000
15-16 16-17 17-18
Utilization of waste material as Fuel- MT
Pitch Briquette

29Consumer Products Limited
Projects identified for energy conservation for year 18-19
(under implementation)
S.No. Projects Total Annual
Savings
Investmen
t in Lacs
Payback in
Months
Energy
Saving (GJ)
1. Installation of water based vacuum system in
FADP3
23 55 30 2990
2. Installation of static mixer in place of
conventional agitator to reduce power
consumption in soap kettles
28 41 18 3640
3. Installation of energy efficient LED lights in
place of conventional lights
3.5 10.2 36 185
4. Installation of energy efficient air conditioners 2.2 7 36 371
5. Installation of water based low head vacuum
system in soap finishing
2 3 15 260
6. Installation of Heat Pump in SM2 9 21 30 477
7. Installation of energy efficient water chilling
compressor
5.5 10 24 291
8. Installation of Mechanical Vapor Compressor
for reducing energy consumption in SWEP2
110 300 36 6895
Total 183.2 447.2 15109

30Consumer Products Limited
Roadmap for achieving Benchmark for further reduction of energy consumption
S.No. Energy Conservation Projects Expected reduction
1 Installation of mechanical vapor
compressor in SWEP2
2%
2 Removal of one roll mill from soap
lines
0.05%
3 Installation of VFD in Mixers of
soap finishing lines
0.05%
4 Installation of IOT based system
in RO unloading
1%
5 Replacement of air conditioners 0.02%
6 Use of natural lights in place -
7 Reduction in steam pressure from
12 to 10 kg/cm2
0.05%

31Consumer Products Limited
ENERGY MANAGEMENT SYSTEM DISTRIBUTION – YEAR 2017-18
12%
88%
Electrical Thermal
56.7
1.941.4
2.9
Electrical Energy Distribution
Grid
Captive
Solar (Open access)
Micro turbine
68.9
6.4 1.4
23.3
Thermal Energy Distribution
RLNG FO PITCH Briquette
RLNG gas - 427000 mm BTU/annum
Using fossil fuel like Furnace Oil etc
Using pitch (renewable) which is a byproduct generated from our process-
Biomass fuel- Briquette for steam generation
THERMAL POWER SOURCE
Maximum Demand Contract with MPEB –3320 KVA
Captive Power Plants- 5250 KVA having 5 DG sets
•Captive is used in case of MPEB fails
•Power factor maintaining unity for the last 10 years
ELECTRICAL POWER SOURCE
Total energy in MW -

32Consumer Products Limited
Reduction in GHG emission by 50% wrt base year
314
272
251243
233 238
179
158
100
150
200
250
300
350
10-11 11-12 12-13 13-14 14-15 15-16 16-17 17-18
GHG - CO2 emission Kg/MT of production • Biomass briquette boiler:
-Commissioned in December 2015
-Replaces approximately 25% of fossil fuel (natural gas)
-Reduces GHG emissions by 7500 tCO2e per annum
GHG Inventorisation

33Consumer Products Limited
47397
3245531350
20000
25000
30000
35000
40000
45000
50000
15-16 16-17 17-18
GHG emission in MT
GHG Inventorisation
22281
9075
GHG Emissions tCO2e – 17-18
Scope 1 Scope 2

34Consumer Products Limited
Green Supply Chain
• We have developed a Sustainable Procurement Policy to deep dive into the value chain and handhold our suppliers to begin/continue their sustainability journey.
• Green Practices are a key pillar in our Sustainable Procurement Policy.
• Baselining of our suppliers have been conducted.
• An emailer group has been established in which we roll out best practices communication in energy efficiency/water management and so on to our suppliers.

35Consumer Products Limited
Green Supply Chain
S.No. Vendor Suggestions and Training
1 Sweet Industries, Baddi Suggested usage of LED lights and VFDs in
their manufacturing equipment.
2 Siddhomal, Ghaziabad On-site visit, identified opportunities of
energy reduction through interlocking of
conveyors and reducing idle running time

36Consumer Products Limited
REDUCTION IN SUPPLIER RESOURCES• Some of the major initiatives taken during the last 3 years:
Green Supply Chain
S.No. Initiative Material Saving –MT/annum
1 Optimisation of laminate thickness
for soap wrappers from 10 mic to 8
mic
130 MT of PET
2 Optimisation of Hot Melt Adhesive
(HMA) consumption
Optimisation of Hot
Melt Adhesive (HMA)
consumption
3 Procurement of reduced GSM
cartons
353 MT of Paper

37Consumer Products Limited
51.345
3.59 0.00 0.25 0.040.0
10.020.030.040.050.060.0
Acidification Potential (AP) [% contribution]
1.2 0 0.06
98.27
0.03 0.000.0
20.040.060.080.0
100.0120.0
OilCultivation,Processingand Import
Productionat
Malanpur
OutboundTransport
Use phaseof Toilet
Soap
Paperwaste on
landfill
Plasticwaste on
landfill
Eutrophication Potential (EP) [% contribution]
1.20 0.07 0.00
98.77
0.00 0.000.00
20.0040.0060.0080.00
100.00120.00
Blue Water Consumption (% contribution)
-65.6
29.62.2 0.0 2.6 0.0
-80.0
-60.0
-40.0
-20.0
0.0
20.0
40.0
OilCultivation,Processingand Import
Productionat
Malanpur
OutboundTransport
Use phaseof Toilet
Soap
Paperwaste on
landfill
Plasticwaste on
landfill
Global Warming Potential (GWP 100 years) [%
contribution]
Life Cycle Assessment of Godrej No.1 Soap

38Consumer Products Limited
Team Work Employee Involvement & Monitoring

39Consumer Products Limited
Main utilities
Boilers – 11 nos – Ranging from 17.5 barto 75 bar steam pressure
Thermic fluid heaters – 45 lac Kcal /hr heat output , Temperature upto 315 deg
Air compressors – 7 nos
Cooling towers – 16 nos
Transformers – 5 nos Ranging from 1250 KVA to 2500 KVA
DG sets – Ranging from 1000 KVA to 1000 KVA
Chilling plants – 11 nos of water and brine chilling
Energy bill of approx. 70 crore accounts for 10%of the total product cost and 92 % of the Totalvariable cost

40Consumer Products Limited
ENERGY CELL
FACTORY HEADCORPORATE
GROUP
ENERGY TEAM (CROSS
FUNCTIONAL MEMBERS)
ENERGY CELL
HEAD
Mr. Durgesh Tripathi
• Strategic Planning
• Quarterly Review
• Project facilitation
• Strategic Planning
• Monthly Review
• Monthly Review
• Daily Monitoring
• Identification and execution of
projects
MEMBER
Mr. C B Sahu ( Sr.
Officer)- Chemical
plant
MEMBER
Mr. Dinesh Verma
( Executive) -
Utility
MEMBER
Mr. S N Mathur ( Sr.
Executive) Chemical plant
MEMBER
M. Saxena
( Ass. Manager)
Soap Plant
MEMBER
Mr. Alok Gupta (
Executive) Engg
Services
MEMBER
Mr. Mukesh Agrawal
(Astt Manager) –
Engg Services
CROSS FUNCTIONAL TEAM MEMBERS

41Consumer Products Limited
Energy Monitoring & Management System
➢Energy meters and steam flow meters have been installed at all sections
➢Daily performance reviews and corrective actions
➢Monthly energy data is compiled based on daily reports and updated into ‘Sustainability
Performance Monitoring Tool’ (SOFI) .
➢Monitoring of consumption on major equipment to identify the potential area of improvements or
technological up gradation
➢Constantly taking help from experts by means of various audits like Process energy , Harmonics ,
pumps and compressed air network
➢Sharing of knowledge at various platform within organization and other industries
➢Started implementing concept of IOT (Internet of things ) for on time information and analytics for
consumption pattern and subsequent corrective actions .
OpportunityIdentification
• Energy Mapping
• Benchmarking
• OEE
Suggestion
• Idea Generation
• Idea Screening
• Feasibility Study
Teamformation
&
Allocation ofproject
team
Projectexecution
&
Review ofProgress
ResultsAchieved
Rewards &
Recognition

42Consumer Products Limited
RO 1 3KG
BLENDING
CP-1 PLANT
SM-1 ,3KG STEAM
SM-1 10 KG STEAM
CP-2 PLANT MAIN
FSP 10 kg
EVP 10 kg
FADP 10 kg
FADP 3 KG STEAM
RO 3KG STEAM
TANK FARM
CP-1
CP-2
SM-1
SM-2, 3KG STEAM
SM-2, 10 KG STEAM
RO 3 KG
EVP 10 KG
FSP 10 KG HEAT EXCHANGERFADP 10 KG DISTILLER
FADP 10 KG PRECUTPLANT 3KG STEAM
SM-2
CP-3
FSP 10KG VACCUM SYSTEM STEAM
RO3
VORTEX FLOWMETER
DIFFERENTIAL PRESSURE TYPE FLOW METER
3 KG STEAM
10 KG STEAM3 KG STEAM FROM TURBINE
STEAM DISTRIBUTION NETWORK
LPB 1
LPB 2
LPB 3
TURBINE
GAS LINE
TP-25 CP-3TP-15CP-3
TP-25CP-2
TP-10CP-1
LP-1LP-2
MAIN GAS
GAIL PLANT METER
Gas Distribution Network

43Consumer Products Limited
CP
3
MCC204
MCC213
MCC102
MCC7
MCC301
MCC302
MCC401
MCC402
WC
BEEDS MCC
MCC 109
MCC 101
MCC 303
MCC PNEUMETIC
MCC 108
MCC 9
MCC305
MCC 206
MCC 6
MCC 304
MCC 5
MCC 10
MCC MLDB
MCC3
MCC MPDB
SOA
P F
INIS
HIN
G
SOA
P M
AK
ING
-1
MCC2
MCC 8
MCC 107 ETP
MCC 205
CP
-1
MCC 4 UTI
LITY
MCC ETP 2
MCC RECTFIER 1
MCC 1
MCC 206
MCC RECTFIER 12
25
00
KV
A M
AIN
M
ETER
MCC 207
MCC MLDB
MCC CP2
MCC LP3
MCC UGP
MCC UTILITY
MCC TANKFORM
MCC FSP
MCC LP2
MCC FADP
MCC MPDB
MCC UTILITY
MCC MIL GF
MCC MIL FF
MCC PDB +LDB
MCC GCPL 1
MAIN METER MPEB
MCC ETP 3
SOA
P M
AK
ING
-2
TXR-3 1250 KVA TXR-1 1250 KVATXR-2 1250 KVATXR-4 2500 KVATXR-5 1600 KVA
LAY OUT DIAGRAM OF POWER DISTRIBUTION
• NOTE -• MCC- MAIN CONTROL CUBICAL• ETP- EFULENT TREATMENT PLANT• WC- WATER CHILLING• MLDB- MAIN LIGHT DISTRIBUTION BOARD• MPDB- MAIN POWER DISTRIBUTION BOARD

44Consumer Products Limited
28.6
20.84
20.2917.45
7.52
3.25
0.87
0.52
0.51
0.16
Total Energy (Electrical + Thermal) in % loading
CP#3 RMD Soap Noodles
CP#2 CP#1 Soap Finishing
Boilers Others Compressors
30.36
23.27
19.4218.86
8.09
Total Thermal Energy in % loading
CP#3 RMD
Soap Noodles CP#2
27.75
26.87
15.227.43
6.84
4.43
4.4
2.49
1.35
Total Electrical Energy in % loading
Soap Finishing Soap Noodles CP#3
Boilers CP2 Others
Air Compressor
Distribution of energy at various cost centers

45Consumer Products Limited
Monitoring of Energy consumption
POWER STATEMENT STEAM STATEMENT

46Consumer Products Limited
Monitoring of Energy parameters in SCADA and alerts

47Consumer Products Limited
• Awareness through Display of the Posters across the plant.
• Suggestion Schemes – INSAAN platform
• Celebration of World Environment Day on 5th June of every year.
• Celebrated Energy Conservation Week from 11th Dec to 16th Dec.
• Spot award recognition for workers at shop floow
AWARENESS CREATION
48Consumer Products Limited
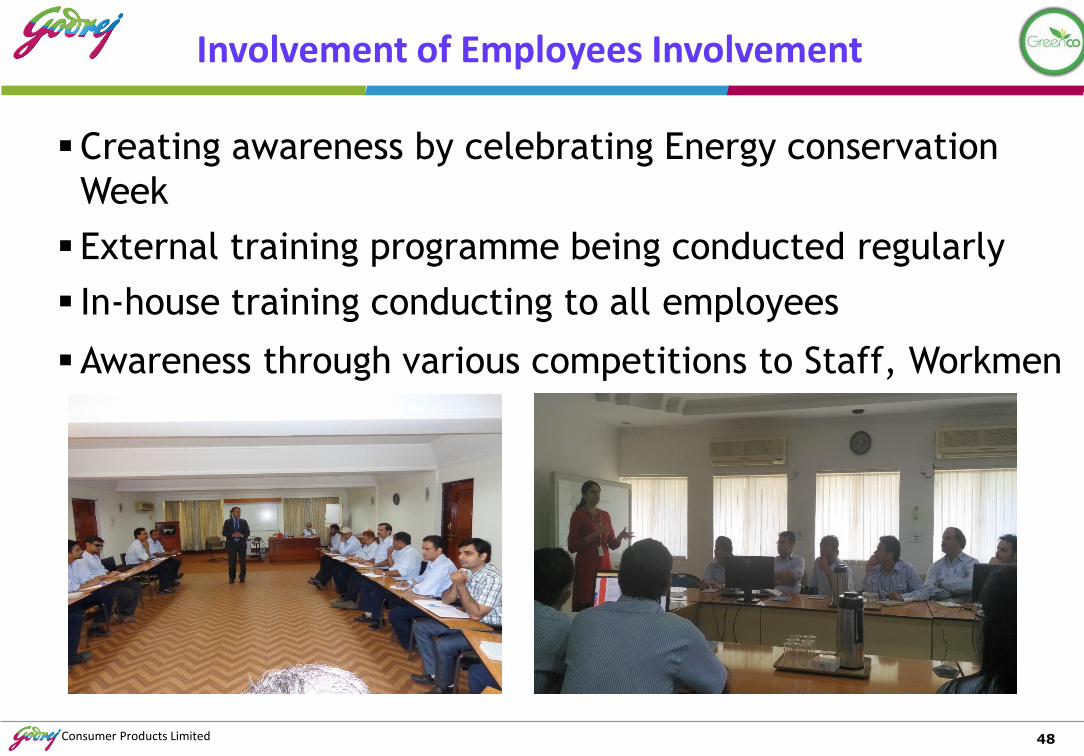
Involvement of Employees Involvement
▪Creating awareness by celebrating Energy conservation
Week
▪ External training programme being conducted regularly
▪ In-house training conducting to all employees
▪Awareness through various competitions to Staff, Workmen

49Consumer Products Limited
TRAINING PLAN FOR 17-18
Sr. No. Topic of training programme Plan/Actual Apr-17 May-17 Jun-17 Jul-17 Aug-17 Sep-17 Oct-17 Nov-17 Dec-17 Jan-18 Feb-18 Trainer
1 Energy conservation Plan 20 20 20 Mukesh Agrawal /
Actual 19 19 17 Durgesh Tripathi
2 Enviroment Plan 20 20 20 20 Pramod Sengar /
Actual 21 13 25 13 Amit Bahal
3 GMP Plan 20 10 40 10 40 10 Ajay Batham /
Actual 16 5 38 5 38 5 S.N.Mathur
4 ISO Plan 20 25 10 50 25 10 50 Ajay Batham /
Actual 16 10 45 10 45 Manoj Saxena
5 Material Management Plan 20 80 70 80 70 80 SS Gupta /
Actual 13 77 72 77 72 77 Surendra Singh
6 Quality circle Plan 40 20 40 20 40 40 Thomas Mathew /
Actual 38 22 38 22 38 38 Santosh Mishra
7 safety Plan 25 25 25 25 Pramod Sengar /
Actual 22 20 28 26 Sandeep Khedkar
8 health Plan 20 20 20 Pramod Sengar /
Actual 18 22 21 Santosh Mishra
9 TPM Plan 75 75 75 75 75 Pradeep Tripathi /
Actual 60 77 72 70 78 Mukesh Agrawal
10 Waste Reduction Plan 10 10 10 Manoj Saxena /
Actual 8 9 6 Sunil Sharma
11 Water conservation Plan 20 20 20 Dinesh Verma /
Actual 19 23 20 AlokGupta
12 Behaviour Training Plan 50 50 60 Amit Bahal
Actual 50 49 55 Thomas Mathew /
13 Printing machine Plan 60 60 60 Rajeev Chauhan /
Actual 62 56 56 P.Tripathi
14 Briquette fire boiler Plan 10 10 10 Sanjay Agrawal /
Actual 8 12 11 Dinesh Verma

50Consumer Products Limited
ThemeSaving Mode
Team members Amount
Earlier 22 KW motor was running to provide cooling water for steam turbine. Our team check the requirement and arrange a pump from some other section with 7.5 KW motor for the same. Now it is working with 7.5 KW. Our team saved 14.5 KW energy every hour.
Power
Sanjay Agrawal,Sandeep Khedkar,D. K. Tripathi,D. K. Verma
6 Lacs
Installed a control valve in place of 10 kg PRV to reduce the steam losses in chemical plant.
steam Sanjay Agrawal, Rajeev Chauhan,Amol Singh
5 Lacs
We started to increase the feed water temperature of LP3 with the help of waste steam of CP2 steam drumvapors.
Fuel D. K. Verma, SanjayAgrawal, JP Yadav
4 Lacs
There are 04 no. cooling fans fitted in a cooling tower which were running continuously for 24 hrs. If any problem comes in any fan, water temperature raised, blade angle of cooling fins and set it to maximum side according to the capacity of fan motor.
Power
Abhay Gautam, Sunny Batra, Ram Milan, Sanjay Singh
2.10Lac
Projects implemented through Kaizens (Workers and Supervisor level)

51Consumer Products Limited
Reduce, Reuse & Recycle approach
Recycle
• Water used for cooling in process pumps recycled thru cooling tower and avoided to drain in ETP. Annual saving is 3500 KL
Reuse
• Started using condensate water from oil storage tanks after settling & collected in separate tanks. This condensate water is reused for further process in plants. Annual saving of water # 5500 KL
Reduce
•
Water Consumption – KL/MT of production
43% Reduction from 2011
2.85
2.142.04
1.75 1.72 1.71 1.731.62
1.5
2
2.5
3
2010-11 2011-12 2012-13 2013-14 2014-15 2015-16 2016-17 2017-18
Annual Fresh Water Consumption KL/MT of Production
Provided automatic level control system in sum of the cooling towers to prevent overflowAnnual saving is 340kL
Water Conservation Approach
More Actions
Installation of aquatron water recycling system at ETP discharge –saving of 150 KLD
Recharge
Increased the under ground water level by installing Kedia based farm technology in 25 locations

52Consumer Products Limited
AWARDS & ACCOLADES
GCPL Malanpur has been awarded the “ Green Co” -
Gold Certification by Confederation of Indian
Industry in accordance with the Green Company
rating system. This award recognize the significant
contribution of GCPL in the area of energy reduction,
environment and sustainability performance.
Energy efficiency
Water conservation
GHG emissions
Material conservatio
n
Recycling and recyclability
Green supply chain
Renewable energy
Product stewardship
Life cycle assessment

53Consumer Products Limited
MP state environment award 2016- First prize
CDP disclosure – Ranked 3rd in India 2016
Awards and recognitions

54Consumer Products Limited
Awards and recognitions
Energy efficiency award in CHEMIX 2015 from FICCI
Bhamashah award 2013
CII Business Excellence award 2010
TPM excellence award JIPM Japan 2007

55Consumer Products Limited
Thankyou


![325 ROC10[1]](https://img.pdfslide.us/doc/110x75/547f5669b4af9fea158b590a/325-roc101.jpg)