Embed Size (px)
Citation preview
Team development 1
Running head: TEAM DEVELOPMENT
Team Development: Definition, Measurement and Relationships with Team Effectiveness
Carlos Ferreira Peralta
Norwich Business School
University of East Anglia, United Kingdom
Paulo Renato Lourenço
Faculty of Psychology and Education Sciences
University of Coimbra, Portugal
Paulo Nuno Lopes
Católica-Lisbon School of Business and Economics
Catholic University of Portugal, Portugal
Cátia Baptista
Faculty of Psychology and Education Sciences
University of Coimbra, Portugal
Leonor Pais
Faculty of Psychology and Education Sciences
University of Coimbra, Portugal
Keywords: team development, measurement, team effectiveness, team processes, team
emergent states
This research was supported by funding from Portugal’s Fundação para a Ciência e a
Tecnologia (SFRH/BD/76704/2011) and Programa Operacional Potencial Humano/Fundo
Social Europeu (POPH/FSE) awarded to Carlos Ferreira Peralta.
The authors wish to thank the anonymous reviewers and Dr Woehr, the Editor, for their
invaluable and helpful comments on earlier drafts of the article.
Address for correspondence:
Carlos Ferreira Peralta
Thomas Paine Study Center – Norwich Business School, University of East Anglia
Norwich, Norfolk, NR4 7TJ, UK
Email: [email protected]
This manuscript is currently (March 2018) in press at Human Performance and should be
cited as follows:
Peralta, C. F., Lourenço, P. R., Lopes, P. N., Baptista, C., & Pais, L. (in press). Team
development: Definition, measurement and relationships with team effectiveness.
Human Performance.
Please note that the final, published version may incorporate some additional, minor edits.
Team development 2
Team Development: Definition, Measurement and Relationships with Team Effectiveness
Abstract
This article describes the development and validation of a theory-based measure of
team development. Drawing on three independent samples, including multisource and two-
wave data, we found support for the scale’s theoretical multidimensionality. Convergent and
discriminant validity was established, and criterion-related validity was determined through
the scale’s relation with three facets of team effectiveness: viability, extra-role performance
and reputation. We conclude that the 29-item measure is valid and reliable for the assessment
of team development. Theoretically, we shed light on the dimensionality of team
development and extend the available knowledge on its nomological network. Practical
implications for enhancing team effectiveness via team development are discussed.
Keywords: team development, measurement, team effectiveness, team processes, team
emergent states
Team development 3
The idea that teams are dynamic entities developing over time is well documented and
empirically supported (Chang, Bordia, & Duck, 2003; Garfield & Dennis, 2013; Mathieu &
Rapp, 2009; Miller, 2003; Morgan, Salas, & Glickman, 1993; Oliveira, Miguez, & Lourenço,
2005; Smith, 2001; Tuckman & Jensen, 1977; Wheelan, Davidson, & Tilin, 2003). During
team development, team processes, emergent states and even characteristics such as
knowledge sharing and cohesion change (Chang, Duck, & Bordia, 2006; Kuipers & Stoker,
2009). These changes can be described by fairly distinct stages of team development (Chang
et al., 2006; Miller, 2003; Wheelan, 2005). Teams at a given development stage tend to reveal
a common pattern of actions and behaviors related to tasks and relationships, and a similar
level of effectiveness (Agazarian & Gantt, 2003; Garfield & Dennis, 2013; Smith, 2001;
Wheelan, 2005). Teams functioning at the higher stages of development tend to be more
productive and to have healthier and more satisfied members (Jacobsson, Rydbo, & Börresen,
2014; Kuipers & Stoker, 2009; Wheelan & Hochberger, 1996).
Although researchers generally agree that teams develop over time and that team
development is important for effectiveness, several conceptual and methodological
challenges remain. First, there are hundreds of team development models and still no
consensus regarding the definition and measurement of team development (Kozlowski,
2015). Definitions vary in terms of context specificity, population generalizability and
normativity of development patterns (Chang et al., 2006), limiting the consistency of the team
development construct across studies. Second, because research on team development has
been mainly focused on the development process in itself, only scant research has looked at
issues of effectiveness and relationships between team development and related constructs
(Ericksen & Dyer, 2004; Mannix & Jehn, 2004). As such, there is still limited knowledge on
the nomological network of team development. Third, existing measures of team
development, such as the Group Development Questionnaire (Wheelan & Hochberger, 1996)
Team development 4
and the Group Development Assessment (Jones & Bearley, 2001), have several
shortcomings, such as low reliabilities (below .60), inconsistent empirical support for the
expected number of development stages, difficulties in disentangling task and interpersonal
dimensions of each team development stage, and little evidence of construct validity (Ito &
Brotheridge, 2008; Wheelan & Hochberger, 1996). Testing a comprehensive nomological
network for team development requires valid and reliable measures of team development.
The purpose of this article is to provide an integrative definition of this construct so as
to guide future research and thereby also to develop a valid and reliable measure of team
development. Drawing on current integrative approaches to team development, we define
team development as the changes in team processes and emergent states that occur over time
and can be described by discrete developmental stages (Chang et al., 2006; Garfield &
Dennis, 2013; Smith, 2001; Wheelan, 2005). Second, we develop a theory-based
multidimensional measure of team development consisting of 29 items, which can be
administered to teams, team leaders and single team members. Following the
recommendations of the literature on scale development (e.g., DeVellis, 2017; Ferris, Brown,
Berry, & Lian, 2008; Furr, 2011; Hinkin, 1995, 1998), we perform an extensive array of tests
to validate this measure. Finally, we conclude with implications for the use of this measure in
research on team development.
This article contributes to the literature on teams in several ways. First, in keeping with
an integrated approach to team development, it establishes a definition of team development
that considers not only the developmental stages but also the task and interpersonal
dimensions of each stage. It is theoretically accepted that separating task and interpersonal
dimensions of team development, processes and emergent states is important, and that each
dimension explains unique variance in different facets of team effectiveness (Carless & De
Paola, 2000; Marks, Mathieu, & Zaccaro, 2001; Smith, 2001). Nonetheless, there is no team

Team development 5
development measure that captures this distinction validly and reliably. Second, using data
from three major samples and two countries, we answer calls for empirical research
addressing the description of team development stages. As argued by Kozlowski (2015, p.
279), “there are many theories of team development. However, good, large sample, diverse
team descriptive research is lacking.” Moreover, a reliable and valid tool for use in empirical
research is lacking. In this article we aim to provide such a tool. Third, considering the need
to broaden the nomological network of team development (Ericksen & Dyer, 2004; Mannix
& Jehn, 2004), we extend available knowledge on its relationships with other constructs. In
the section on convergent and discriminant validity, we theorize and examine relationships
with team processes and emergent states that are expected to define each developmental
stage. In criterion-related validity analyses, we look at issues of team effectiveness.
Team Development
Teams are dynamic entities of two or more interdependent individuals who work
together toward common goals (Kozlowski & Bell, 2003). Although several development
models are available to explain the changes that occur over time in teams, most of them can
be subsumed under two main approaches (Chang et al., 2003; Garfield & Dennis, 2013; Seers
& Woodruff, 1997): the integrated stage approach and the punctuated equilibrium approach.
The integrated stage approach by and large focuses on micro issues such as the temporal
changes in team processes and emergent states that occur along both task and interpersonal-
related dimensions, whereas the punctuated equilibrium approach tends to look at more
macro issues such as time awareness, and pacing and task activities (Bonebright, 2010;
Chang et al., 2003). Because some teams may follow both models, researchers should focus
on either model to explain team development, depending on the unit of analysis under
scrutiny (Chang et al., 2003). In addition, the integrated stage approach describes the
development of all types of teams, whereas the punctuated equilibrium approach is
Team development 6
particularly focused on project teams with a limited time span (Chang et al., 2003, 2006).
Because we are interested in developing a measure that captures changes in configurations of
team processes and emergent states, and that can be used with any type of team, we draw
upon the integrated stage approach.
Based on this approach, we define team development as the changes in team processes
and emergent states that occur over time in a team. These can be usefully described as shifts
between well-defined developmental stages (Chang et al., 2006; Garfield & Dennis, 2013;
Smith, 2001). Over time, teams go through a series of stages as members seek to change their
interaction and action patterns (team processes) and their cognitive, motivational and
affective states (emergent states; Marks et al., 2001; Mathieu & Rapp, 2009). Stages of
development can therefore be viewed as configurations of team processes and emergent states
that occur frequently and represent “attractors” in complex dynamics of change over time.
From this perspective, the term “development” does not necessarily imply improvement over
time, although many teams do evolve towards more efficient processes as they mature.
Each stage of team development encompasses both task and interpersonal dimensions
(Jones & Bearley, 2001; Morgan et al., 1993; Wheelan, 2005). Whereas the task dimension
reflects the processes and emergent states that occur as team members work together toward
common goals, the interpersonal dimension reflects the processes and emergent states
focused on the management of interpersonal relationships (Marks et al., 2001; Morgan et al.,
1993). Although teams tend to reveal a dominant stage at any time point, they may also
reveal characteristics of other stages to some extent (Agazarian & Gantt, 2003; Ito &
Brotheridge, 2008; Smith, 2001). Although teams tend to reveal task and interpersonal
dimensions characteristic of a single stage, they may also reveal dimensions characteristic of
different stages at any one point in time (Ito & Brotheridge, 2008; Jones & Bearley, 2001).
Accordingly, the developmental approach of team processes and emergent states suggests
Team development 7
that teams can move through the dimensions and stages at differential rates (e.g., a team can
be at Stage 3 in the task dimension, but at Stage 4 in the interpersonal dimension).
Our definition of team development departs from the existing ones in two main ways.
First, existing definitions tend to focus each developmental stage on specific processes and/or
emergent states. For example, while Tuckman (1965) proposes that teams on stage 3 focus on
issues of cohesion, Wheelan (2005) indicates that teams at stage 3 deal with issues of trust.
On the one hand, these narrow definitions contributed to a detailed knowledge of the
nomological network of unique processes and emergent states. On the other hand, they also
contributed to the fragmentation of the available knowledge on team development and to the
literature’s inability to offer practical recommendations to team leaders. The importance of
defining and measuring team development at a broader level of conceptual abstraction,
including complex configurations of team processes and emergent states at each stage, speaks
to meta-analytic evidence indicating that unique processes and emergent states are highly
correlated, forming two global factors that capture the overall quality of task and
interpersonal-related aspects (e.g., LePine, Piccolo, Jackson, Mathieu, & Saul, 2008; Smith,
2001). Second, disentangling task and interpersonal dimensions of each stage is of key
importance for theoretical and applied purposes. Previous research found that task and
interpersonal dimensions of the same construct frequently have different relationships with
criteria, are subject to different contextual influences and require different forms of
intervention (Beal, Cohen, Burke, & McLendon, 2003; Buzaglo & Wheelan, 1999; Ito &
Brotheridge, 2008; Jehn, Greer, Levine, & Szulanski, 2008). As such, it is important to
conceptualize and evaluate not only the team’s development stage, but also the task and
interpersonal dimensions of each stage.
Although there are different conceptualizations on which configuration or unique
processes and emergent states define each stage, researchers who compared different stage
Team development 8
models found striking underlying conceptual similarities regarding the number of stages
(four), the dimensions that each stage encompasses (task and interpersonal), and the
likelihood of developed teams to be more effective than teams in early stages of development
(e.g., Bonebright, 2010; Garfield & Dennis, 2013; Ito & Brotheridge, 2008; Kozlowski &
Ilgen, 2006; Kuipers & Stoker, 2009; Miller, 2003; Oliveira et al., 2005; Smith, 2001;
Tuckman & Jensen, 1977; Wheelan, 2005). Building on the current definition of team
development and on these similarities, the stages of team development (1 to 4) can be labeled
as: dependency, counterdependency, work restructuring and performing with regard to the
task dimension; and inclusion, fight, interpersonal restructuring and functional interaction
with regard to the interpersonal dimension. In the following paragraphs we describe the
prototypical characteristics of each stage and dimension of team development that should
represent complex configurations of team processes and emergent states. A more detailed list
of the theoretical sources from which these descriptions derive is in the Appendix.
Starting with the task dimension of stage 1, team members try to understand the
boundaries of the task and their role in the team and expected contribution to task
accomplishment (Furst, Reeves, Rosen, & Blackburn, 2004; Morgan et al., 1993). Because
members feel insecure about their role in the team, they tend to rely on leaders’ instructions
and to passively accept their decisions regarding work (Wheelan, 2005). With regard to the
interpersonal dimension of the first stage, team members try to get to know each other,
experiencing a mix of anxiety and excitement (Tuckman & Jensen, 1977; Smith, 2001).
However, their interactions tend to be cautious and superficial because they do not know
exactly what to expect from others and are still learning what they can and cannot express
(Agazarian & Gantt, 2003).
Turning to the task dimension of stage 2, team members question and challenge the
leader’s competence and the distribution of work (Jones & Bearly, 2001; Tuckman & Jensen,
Team development 9
1977). Attempts to define rules and goals cause tension and task conflict between team
members and between members and the leader (Wheelan, 2005). At the interpersonal level,
team members affirm and fight for their individuality by accentuating individual differences
and establishing alliances with members perceived as similar (Agazarian & Gantt, 2003). A
hostile climate emerges, with team members often clashing with one another and
experiencing negative emotions (Furst et al., 2004; Morgan et al., 1993; Smith, 2001).
In stage 3, teams begin to communicate more openly, to renegotiate roles and resolve
differences constructively, to establish collectively norms for the team, and to discuss and
find more efficient ways to achieve objectives (Jacobsson et al., 2014; Wheelan, 2005).
Regarding the task dimension, teams direct more energy and effort toward the assigned work,
by establishing a structure to support team goals, discussing different perspectives about the
task and integrating the contributions of each member (Bonebright, 2010; Garfield & Dennis,
2013; Hare, 1973). At the interpersonal level, team members begin to accept others’
idiosyncrasies, collectively establish norms clarifying which behaviors are acceptable and
unacceptable, and build interactions based on trust (Kuipers & Stoker, 2009; Hare, 1973).
At the task dimension of stage 4, members’ efforts and energy are truly channeled into
the task (Jacobsson et al., 2014; Kozlowski & Ilgen, 2006). Team members search for new
ways of solving work problems and use the competencies of each member to enhance the
effectiveness of the team (Smith, 2001). They reflect on their decisions and on previously
established rules and roles and adjust these if needed in order to improve (Wheelan, 2005). At
the interpersonal level, there is a friendly environment of trust, openness and interdependence
that benefits the team and all its members (Tuckman & Jensen, 1977; Wheelan, 2005).
Lastly, for temporary teams, there is a termination stage, when the team disbands.
Following others’ recommendations (e.g., Wheelan & Hochberger, 1996), we did not
measure this stage to keep the instrument focused only on ongoing teams.
Team development 10
The Present Study
To create a reliable and valid measure of team development (the Team Development
Questionnaire, TDQ), we followed the recommended steps for scale development and
validation (DeVellis, 2017; Furr, 2011; Hinkin, 1998) and subjected the scale to an extensive
array of tests. In Phase 1, we generated an initial pool of potential items, and then reduced
and refined these to end up with a 29-item scale capturing the eight theoretical dimensions of
team development. In Phase 2, we evaluated psychometric properties of the measure: (a)
dimensionality, by means of confirmatory factor analyses; (b) reliabilities; (c) measurement
invariance; (d) temporal stability; and (e) aggregation to the team level. In Phase 3, we
examined convergent and discriminant validity with regard to a total of 18 variables. In Phase
4, we assessed criterion validity with regard to three facets of team effectiveness: viability,
extra-role performance, and reputation. To ensure generalizability, we replicated and cross-
validated the results reported in Phases 2 through 4 using three complementary samples
(single team members, team leaders and aggregated data from multiple team members) from
the US and Portugal, including a variety of occupations and organizations.
Because team development is a time-dependent phenomenon, we validated our measure
using two complementary approaches: the differential approach and the temporal approach
(Roe, Gockel, & Meyer, 2012). According to the differential approach, teams differ with
regard to their developmental stages, processes and emergent states. Using this variance-
driven approach, we undertook three types of analyses. First, we evaluated how items group
together to form dimensions and how different developmental dimensions are interrelated
(see the psychometric properties section). Second, we evaluated how each dimension of team
development relates to similar and dissimilar constructs (see the convergent and discriminant
validity section). Third, we evaluated the extent to which each developmental dimension
explains variance in team effectiveness (see the criterion validity section).

Team development 11
In contrast, the temporal approach is focused on how team development unfolds over
time and on how these changes relate to other variables. Using this approach, we investigated
whether changes in team development over one month influence related constructs
(convergent and discriminant validity) and team effectiveness (criterion validity). In keeping
with the suggestions of Li and Roe (2012), analyses based on the differential approach were
performed using data from all the samples, whereas analyses based on the temporal approach
relied on data from a two-wave sample.
We collected data from three independent samples. In samples 1 and 2, using the key
informant methodology (Kumar, Stern, & Anderson, 1993), either a single team member
(Sample 1) or the team leader (Sample 2) completed the questionnaire. In Sample 3, at least
two members of each team completed the questionnaire and data were aggregated to the team
level. These three samples complement each other in several ways. First, the use of two
diverse samples (Samples 1 and 3) supports the generalization of findings to different
organizations and occupations in Portugal and the USA. Second, the use of a homogeneous
sample (call center team leaders; Sample 2) helps to validate the TDQ in a specific work
context. Third, sampling diverse teams encompassing different stages of development ensures
adequate variance between groups, required to conduct validation analyses based on the
differential approach. Also, the use of a two-wave design (Sample 1) allowed validation
analyses using the temporal approach. Fourth, collecting data from single team members
(Sample 1), team leaders (Sample 2) and at least two team members (aggregated, Sample 3)
helps to evaluate the TDQ in different research designs (in contrast to previous research,
which generally relied only on key informants or data aggregated across multiple team
members). Team leaders are able to evaluate their teams’ development, processes and
emergent states because they have ample opportunities to observe members interacting and
working together, and have privileged access to information about the team as a whole (e.g.,

Team development 12
Gilson & Shalley, 2004; Jehn et al., 2008). Team members are expected to share
homogeneous perceptions of team development, processes and emergent states because they
interact with each other and work together on a regular basis (e.g., Aubé & Rousseau, 2005;
Zhang, Waldman, & Wang, 2012). There is also ample evidence for the accurateness of
single member assessments (e.g., Kumar et al., 1993; Wheelan & Hochberger, 1996) of team
development, processes and emergent states.
Building on these arguments (e.g., experience and perceptions in the team are shared,
members and supervisors have access to the experiences of others), we operationalized team
development using a referent-shift consensus model (Chan, 1998); that is, individual ratings
had the team as the referent. According to Klein and Kozlowski (2000), using a referent shift
model creates a construct that is conceptually distinct from the original individual-level
construct. Specifically, individual ratings of team development, when aggregated to the team
level and/or with the team as the referent, form a team-level construct that reflects the
experience of the team as a whole (Chan, 1998; Klein & Kozlowski, 2000).
Phase 1: Item Generation and Reduction
Existing theoretical models provide a solid foundation for identifying and mapping
dimensions of team development. In fact, despite having several distinctions in terms of, for
example, how each stage is defined and how teams are expected to develop (e.g., Tuckman &
Jensen, 1977; Karriker, 2005), most theoretical models of the stage approach posit a similar
number of dimensions of team development and provide unique information to the broad
conceptualization we follow (Arrow, Poole, Henry, Wheelan, & Moreland, 2004; Kozlowski
& Ilgen, 2006; Kuipers & Stoker, 2009; Miller, 2003; Oliveira et al., 2005; Smith, 2001;
Wheelan, 2005). Thus, we followed a deductive approach to item generation (Hinkin, 1995,
1998). Scales developed using this approach tend to be more generalizable across cultures,
have more stable factorial structures and reveal greater content validity (Riordan &
Team development 13
Vandenberg, 1994). As such, the use of the deductive approach is fully aligned with our goal
of developing a theory-driven, valid and reliable measure of team development.
Based on a review of the literatures on team development, team processes and team
emergent states, we identified the defining aspects of the task and interpersonal dimensions of
each stage of team development. Then we generated 40 items to map those aspects (4 stages
x 2 dimensions x 5 items). These items were then screened by a panel of experts, composed
of three of the authors and two external team development experts (Costa & Anderson, 2011;
DeVellis, 2017; Furr, 2011; Hinkin, 1998). Screening criteria included: 1) applicability and
relevance to the team context; 2) content validity, or the extent to which the items reflected
and fully represented each team development stage and dimension; 3) singularity and
identification, or the extent to which each item measured only the corresponding aspect of
team development; 4) non-redundancy of item content; and 5) comprehensibility, clarity and
wording of the items. Experts independently read all the items and identified those they
deemed problematic, justifying their choices. Items were retained only when experts
approved them unanimously, in keeping with the extant literature (e.g., Costa & Anderson,
2011; Miller, 2003) and the goal of preventing problems in subsequent phases of scale
development and validation (DeVellis, 2017). During this process, 11 items were eliminated
because they were flagged by at least one expert as not meeting one or more criteria. The first
version of the measure was therefore composed of 29 items.
To further ensure content validity, we confirmed that the retained items still fully
captured the defining aspects of each team development dimension. To ensure face validity
and clarity, these items were presented to a group of four team members and to a group of
two team leaders in a pilot study. These checks did not suggest additional revisions. The scale
items and the main theoretical sources from which they derive are presented in the Appendix.
We used the expression “group/team” in some items for three reasons. First, a team is a
Team development 14
goal-oriented group that shares processes, emergent states and characteristics with groups
(Ancona & Caldwell, 1992; Karriker, 2005). As such, both terms can be used
interchangeably. Second, the exclusive use of the term “group” or “team” could bias
responses on items focused on development stages, because people may perceive and
attribute different characteristics to teams and groups (Fisher, Hunter, & Macrosson, 1997).
Third, the exclusive use of one term could bias responses in some settings, because the
attributions may vary across occupations. For example, these terms may have somewhat
different connotations in sports and work settings.
In sum, the careful procedure used for generating and selecting items ensured the
content and face validity of the TDQ.
Phase 2: Psychometric Properties of the Scale
In phase 2 we evaluated: 1) the dimensionality of the scale; 2) the reliability of each
dimension; 3) measurement invariance across language; 4) the stability of the scale over time;
and 5) within-team consensus and between-team discriminant power for each dimension.
In line with previous work (e.g., Ito & Brotheridge, 2008; Miller, 2003; Wheelan &
Hochberger, 1996), we measured all stages and dimensions at the same time: all stages may
be evident at any point in time, although they manifest themselves to different extents. In
other words, although teams reveal a dominant stage at any one time, they may also reveal
some characteristics of other stages (Agazarian & Gantt, 2003; Ito & Brotheridge, 2008;
Smith, 2001). Also, the differential approach used in this phase assumes that teams differ
with regard to their developmental stages, processes and emergent states (Roe et al., 2012).
Within samples, teams varied with regard to occupation (Samples 1 and 3) and length of
existence (Sample 2) and were therefore expected to be in different developmental stages.
Accordingly, we had a priori evidence of between-groups variance – a requisite for
evaluating the psychometric properties of the scale.

Team development 15
Method
Participants and Procedure
Sample 1. US-based employees working full time, under direct supervision and in a
team were recruited online, via Amazon’s Mechanical Turk, to participate in a two-wave
study. At time 1, 473 employees completed the TDQ. It is important to note that each
individual was almost certainly from a different team (i.e., the data from each team was
independent). The average age of team members was 34.68 years (SD = 11.35) and the
average tenure in their current team was 3.86 years (SD = 3.72). Most participants completed
high school (47.3%) or college (51.6%). A variety of occupations was represented, including
sales (12.7%), healthcare (9.9%), education, training and library (9.7%), office and
administration support (9.5%), computer and mathematical (7.4%), food preparation and
related services (7.4%), business and financial operations (6.6%), and management (5.7%).
At Time 2, one month later, 209 participants completed the questionnaire again. There are
two main reasons to use a one month time span. First, it is sufficient to reduce common
source variance (Podsakoff, MacKenzie, & Podsakoff, 2012). Second, it allows balancing
two requirements for accurately measuring dynamic constructs: stability in measurement and
change in the phenomenon (DeVellis, 2017). Because teams are not expected to change
abruptly over a relatively short period of time (Wheelan et al., 2003), one month allows us to
test how stable the instrument is – if the instrument truly reflects the construct of team
development, it should assess team development comparably on close by occasions.
However, because there are small but meaningful changes in team development over
relatively short periods of time (Wheelan et al., 2003; Wheelan, 2005), one month should also
allows us to assess whether the instrument is capturing small changes over time in the
phenomenon of team development.
Sample 2. Participants were 152 team leaders from a Portuguese call center
Team development 16
organization. Team leaders were on average 30 years old (SD = 5.57) and had been leading
the same team for an average of 1.67 years (SD = 1.23); 60.5% were women; 55% had a high
school degree and 39% a bachelor’s degree. Their teams had all the characteristics of real
work teams (Cohen & Bailey, 1997): team members were interdependent and interacted
frequently; they had common goals and incentives; team membership was stable; and the
boundaries of each team were clearly defined. Previous research supports the notion that call
center teams are real teams (e.g., Robinson & Morley, 2007; Zhang et al., 2012).
Sample 3. Participants were 576 members of 109 teams from a wide range of sports and
organizational contexts in Portugal: sports (29.4%), management (18.3%), architecture and
engineering (12.8%), computer and mathematical (5.5%), transportation (5.5%), and sales
(5.5%). All were Portuguese and belonged to professional teams. On average, each team was
composed of 5.28 members (ranging from 2 to 12; SD = 2.75), with an average tenure in the
team of 4.50 years (SD = 3.66). To reduce socially desirable responding and defensiveness,
we assured team members that their responses were anonymous and we did not request
demographic information (Podsakoff et al., 2012). The link between the members of each
team was the name of the direct supervisor. We guaranteed confidentiality to team
supervisors, and removed identification information from the data once the collection was
concluded. Data from team members were aggregated to the team level, as explained below.
Measures
Team development questionnaire. We used the 29-item scale developed in Phase 1.
Participants were asked to evaluate the extent to which each item applied to their teams at the
current moment, using a 5-point Likert scale (1 = Practically does not apply to 5 = Applies
almost totally). The items were originally developed in Portuguese. The questionnaire was
administered in this language to samples 2 and 3 (in Portugal). Sample 1 completed the
questionnaire in English. Items were translated from Portuguese to English and back-
Team development 17
translated to guarantee equivalence of meaning and accuracy (Brislin, 1980).
Results
Confirmatory Factor Analyses and Reliability
Participants’ responses to the team development questionnaire covered the entire range
of options. This suggests that the scale generates meaningful variance among participants for
reliability and confirmatory factor analyses.
We tested the eight-factor theoretical structure using confirmatory factor analyses.
Following the recommendations from Brown (2015), we adopted a three-index reporting
strategy for model fit, incorporating an incremental fit index (comparative fit index; CFI), an
absolute fit index (standardized root-mean-square residual; SRMR), and a parsimony
correction index (root mean square error of approximation; RMSEA). Because χ2 is
oversensitive to sample size, leading to the inadequate rejection of models tested in large
samples, we report but do not rely on χ2 to assess the fit of our models (Brown, 2015).
According to Marsh, Hau, and Wen’s (2004) cutoff criteria the following values indicate
acceptable fit: CFI ≥ .90, SRMR ≤ .10, and RMSEA ≤ .08 (see also Brown, 2015). To obtain
an overall perspective of the structure of the scale we combined the three samples (n = 1201).
Correlations among latent factors were allowed. The theoretical eight-factor structure was
supported: χ2 (349 df) = 1208.69, p < .01; CFI = .96; SRMR = .06; RMSEA = .05, LO90 =
.04 and HI90 = .05). In addition, because all items loaded significantly and above .50 on the
corresponding latent variable (all p’s < .01), and modification indices were low, we
concluded that there were no important localized areas of strain in the model (Brown, 2015).
Although the integrated stage approach of team development (e.g., Garfield & Dennis,
2013; Smith, 2001; Wheelan, 2005) suggests an eight-factor structure for team development,
alternative models might fit equally well. For example, a single dimension might capture the
overall maturity of team processes and emergent states (Janz, Colquitt, & Noe, 1997).
Team development 18
Additionally, it is possible that a model with two dimensions (task and interpersonal) but no
stages is a viable alternative solution (de Wit, Greer, & Jehn, 2012; LePine et al., 2008).
Finally, disentangling task and interpersonal dimensions of each team development stage
might not be required and a 4-stage model with no dimensions might also be a viable solution
(Wheelan & Hochberger, 1996).
To assess the viability of these alternative theoretical models we compared the fit of the
eight-factor model against nested measurement models in which potentially related latent
factors were combined. Given the sensitivity of χ2 difference tests in large samples, leading to
the detection of statistical differences between alternative structural models that may not have
any practical meaning, CFI differences between nested models are recommended as a
substitute (Brown, 2015; Cheung & Rensvold, 2002). Large Monte Carlo simulation studies
indicated that a CFI oscillation higher than .01 is indicative of a significant drop in fit
(Cheung & Rensvold, 2002). The hypothesized model fit better (CFI = .96) than the one-
factor solution (CFI = .46; ∆CFI = .50); the two-factor model (capturing task and
interpersonal dimensions and not the stages; CFI = .48; ∆CFI = .48); and the four-factor
model (capturing the four stages and not the task and interpersonal dimensions; CFI = .79;
∆CFI = .17).
Considered together, confirmatory factor analyses and ∆CFI tests indicate that the eight
theoretical factors are empirically distinguishable and fit the data adequately. Further, these
results are consistent with the integrated stage approach of team development, which suggests
that team development has four stages, each one having distinguishable task and
interpersonal dimensions.
The reliability of each dimension was assessed using Cronbach’s alpha and corrected
item-total correlations. Reliabilities ranged from .70 to .92 (see Table 1). Out of eight alpha
coefficients, only two were slightly below the stringent standard of .80 (Lance, Butts, &
Team development 19
Michels, 2006). A few modest reliabilities were to be expected given the relatively broad
configuration of team processes and emergent states that defines each dimension of team
development (Smith, 2001; Van de Ven & Ferry, 1980; Wheelan, 2005). Importantly, given
that existing measures of team development have shown low reliabilities (below .60; Ito &
Brotheridge, 2008; Wheelan & Hochberger, 1996), this measure is a significant improvement
on existing measures in the field. Corrected item-total correlations were high, ranging from
.43 to .84 (average = .70). Overall, there is evidence supporting internal reliability of each
subscale. Nevertheless, there is scope for further refinement on the two dimensions with
modest reliabilities.
Measurement Invariance across Language
Measurement invariance analyses were conducted to compare the structure of the scale
across English and Portuguese languages. Measurement invariance was tested by multi-group
confirmatory factor analysis, following a three-step procedure of nested constraints placed on
parameters across samples (Brown, 2015). First, we undertook the two key tests of configural
and metric invariance (Vandenberg & Lance, 2000). Second, because previous measures of
team development have been unable to consistently capture the four stages of team
development and to disentangle the task and interpersonal dimensions of each stage, we also
tested whether the covariances were invariant (Garcia & Kandemir, 2006). Configural
invariance indicates that the number of factors and the items that define each factor are stable
across samples – i.e., respondents from different samples perceive team development
similarly. Metric invariance indicates that each item has a comparable relationship with the
correspondent subscale. Covariance invariance suggests that the relationships between the
eight latent variables are similar across samples. When comparing the unconstrained models
with the constrained models, a CFI oscillation lower than .01 suggests invariance (Cheung &
Rensvold, 2002). Prior to conducting these analyses we merged the Portuguese samples (2
Team development 20
and 3; n = 728) and used only Time 1 of Sample 1 (English sample; n = 473).
Results suggested that the factor structure (configural invariance: χ2 (698 df) = 1756.59,
CFI = .95; SRMR = .08; RMSEA = .04, LO90 = .03 and HI90 = .04), the strength of the
relationships between each item and the correspondent latent variable (metric invariance: CFI
= .95, ΔCFI = -.003), and the covariances among latent variables (covariance invariance: CFI
= .94, ΔCFI = -.008) were similar across language (Cheung & Rensvold, 2002).
Temporal Stability
The stability of TDQ scores was assessed with the 209 participants of Sample 1 who
completed the questionnaire at two time points, one month apart. A three step approach was
followed (Brown, 2015). First, we cross-validated the overall factor structure on Sample 1,
Time 2. Second, we evaluated whether the structure of the scale remained invariant across
time, performing a measurement invariance test with Sample 1 (Time 1 and Time 2 data).
Third, we evaluated correlations between Time 1 and Time 2 scores.
The eight-factor model was supported at Time 2 (n = 209): χ2 (349 df) = 631.27, p <
.01; CFI = .93; SRMR = .08; RMSEA = .06, LO90 = .05 and HI90 = .07. Measurement
invariance tests indicated configural (χ2 (698 df) = 1482.76; CFI = .94; SRMR = .08; RMSEA
= .04, LO90 = .04 and HI90 = .04), metric (CFI = .94; ΔCFI = -.001) and covariance (CFI =
.93; ΔCFI = -.002) invariance. This suggests that the structure of the measure did not change
through time. Correlations between Time 1 and Time 2 scores were positive, significant (p <
.01) and strong (Cohen, 1988) for all subscales, ranging from .51 to .65. This indicates that
the scores are relatively stable through time. Importantly, the correlations between Time 1
and Time 2 scores were always below the corresponding Cronbach’s alphas. This may be an
indication of actual change/development over time (DeVellis, 2017). Together, these results
suggest appropriate test-retest reliability, measurement invariance over time, and that the
TDQ is capturing changes in team development through time.
Team development 21
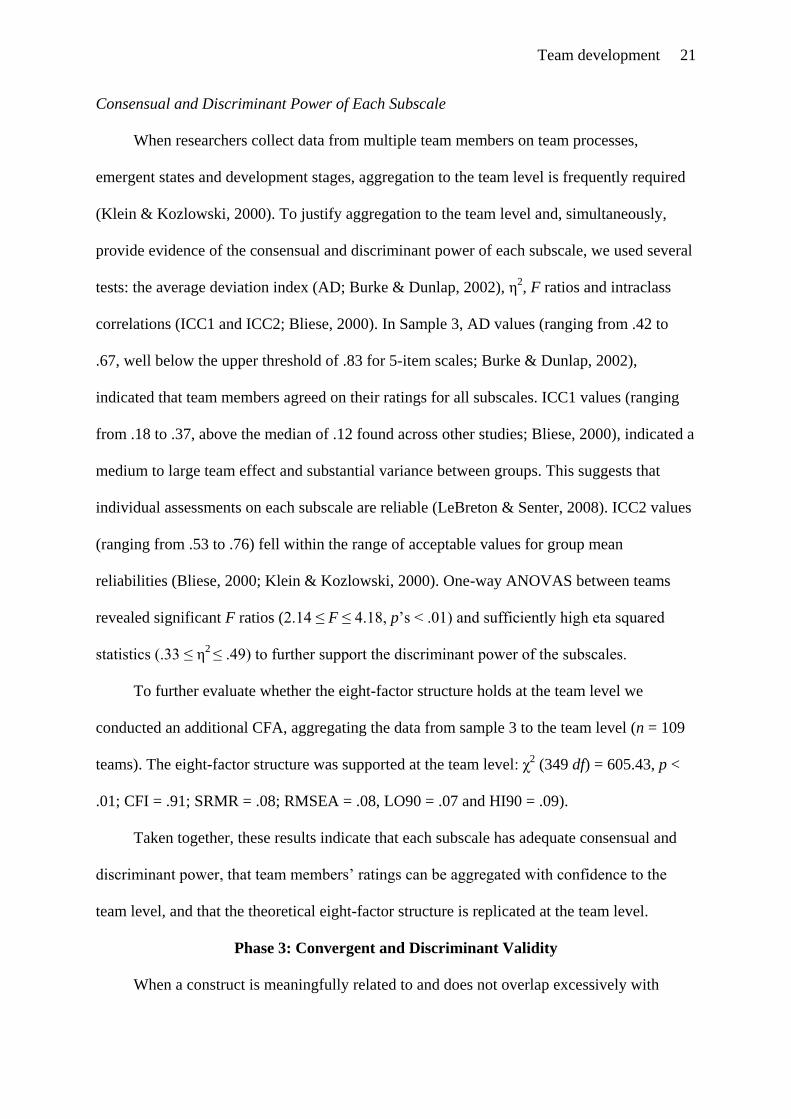
Consensual and Discriminant Power of Each Subscale
When researchers collect data from multiple team members on team processes,
emergent states and development stages, aggregation to the team level is frequently required
(Klein & Kozlowski, 2000). To justify aggregation to the team level and, simultaneously,
provide evidence of the consensual and discriminant power of each subscale, we used several
tests: the average deviation index (AD; Burke & Dunlap, 2002), η2, F ratios and intraclass
correlations (ICC1 and ICC2; Bliese, 2000). In Sample 3, AD values (ranging from .42 to
.67, well below the upper threshold of .83 for 5-item scales; Burke & Dunlap, 2002),
indicated that team members agreed on their ratings for all subscales. ICC1 values (ranging
from .18 to .37, above the median of .12 found across other studies; Bliese, 2000), indicated a
medium to large team effect and substantial variance between groups. This suggests that
individual assessments on each subscale are reliable (LeBreton & Senter, 2008). ICC2 values
(ranging from .53 to .76) fell within the range of acceptable values for group mean
reliabilities (Bliese, 2000; Klein & Kozlowski, 2000). One-way ANOVAS between teams
revealed significant F ratios (2.14 ≤ F ≤ 4.18, p’s < .01) and sufficiently high eta squared
statistics (.33 ≤ η2 ≤ .49) to further support the discriminant power of the subscales.
To further evaluate whether the eight-factor structure holds at the team level we
conducted an additional CFA, aggregating the data from sample 3 to the team level (n = 109
teams). The eight-factor structure was supported at the team level: χ2 (349 df) = 605.43, p <
.01; CFI = .91; SRMR = .08; RMSEA = .08, LO90 = .07 and HI90 = .09).
Taken together, these results indicate that each subscale has adequate consensual and
discriminant power, that team members’ ratings can be aggregated with confidence to the
team level, and that the theoretical eight-factor structure is replicated at the team level.
Phase 3: Convergent and Discriminant Validity
When a construct is meaningfully related to and does not overlap excessively with
Team development 22
established measures of similar constructs, and is unrelated to dissimilar measures, there is
evidence of convergent and discriminant validity (Campbell & Fiske, 1959; Hinkin, 1998;
Nunnally, 1978). To evaluate convergent validity we examined correlations with constructs
that prior theory and research indicate are related to team development, including: proximal
team processes (relationship conflict, creative processes, tacit knowledge sharing, knowledge
utilization and helping behaviors); team emergent states (trust, potency, goal clarity and
commitment, task and social cohesion, learning and vitality); and team characteristics
(participation in decision making and task interdependence). Divergent validity analyses
examined four theoretically and conceptually unrelated variables (i.e., team members’ and
leaders’ tenure in team and sex).
Considering the literature on team development (e.g., Bonebright, 2010; Garfield &
Dennis, 2013; Ito & Brotheridge, 2008; Kozlowski & Ilgen, 2006; Kuipers & Stoker, 2009;
Miller, 2003; Oliveira et al., 2005; Smith, 2001; Tuckman & Jensen, 1977; Wheelan, 2005),
we expect the following global pattern of relationships between stages of team development
and measures of positive proximal team processes, emergent states and characteristics. In the
first stage, members are dependent on the leader, trying to better understand the task at hand
and are concerned with their inclusion. As such, we expect only weak correlations between
the two dimensions of stage 1 and other variables. In the second stage, team members
experience tension and conflict as they struggle with clashing perspectives and vie for
influence in the team. Therefore we expect the second stage to be positively associated with
relationship conflict and negatively associated with other variables. During the third stage,
team members develop more effective processes. They restructure their work, revise
strategies and redefine interpersonal norms to set a common course of action and achieve
their goals, contributing to more positive emergent states and characteristics. Accordingly, we
expect weak to moderate associations in stage 3. Finally, in the fourth stage, efficient

Team development 23
processes are in place, enhancing performance. Accordingly, we expect medium to strong
positive correlations (and a negative correlation with relationship conflict). The main sources
supporting each specific relationship are displayed in Table 2.
With regard to discriminant validity, we considered that TDQ scores should be only
weakly related to the length of time that teams have been in existence, as indexed by team
members’ and leaders’ tenure in teams. Although common conceptions of biological or
psychological development typically reflect increasing maturation over time, evidence
suggests that teams do not mature or evolve towards more efficient processes linearly over
time. In fact, teams can jump stages, change through time in non-linear ways, become
blocked in a stage or even regress to less mature stages depending on both internal and
external factors (Arrow et al., 2004). Given that TDQ captures configurations of team
processes, emergent states and characteristics, scores should also be unrelated to team
members’ or leaders’ sex. Absence of excessive overlap with conceptually related team
processes, emergent states and characteristics, and a pattern of weak or null relationships with
tenure and sex variables can therefore be viewed as evidence of discriminant validity.
Both the differential approach and the temporal approach (Roe et al., 2012) were used
in Phase 3 analyses. We used the differential approach in all three samples to evaluate the
pattern of relationships with proximal and unrelated constructs. For sample 1 (two-wave
data), we also used the temporal approach to evaluate whether changes in TDQ scores over
one month predicted team processes, emergent states and characteristics at Time 2.
Method
Participants and Procedure
We used data from the three samples described above. In sample 1 we controlled for
common method bias, as suggested by Podsakoff et al. (2012): TDQ scores at Time 1 were
correlated with other measures collected at Time 2; and TDQ scores at Time 2 were
Team development 24
correlated with other measures collected at Time 1. In sample 3, convergent and discriminant
validity tests were performed for a subset of 77 teams only, because we could not collect
additional variables for sports teams.
Measures
Team development was measured with the 29-item scale developed in Phase 1. The
remaining measures used in these analyses are displayed in Table 2.
Results
In line with previous work (e.g., Dobrow & Tosti-Kharas, 2011; Ferris et al., 2008), we
evaluated convergent and discriminant validity based on the differential approach in three
ways. First, we examined the significance and magnitude of correlations between TDQ scores
and other constructs, and evaluated whether these relationships were consistent with theory.
Second, we used confirmatory factor analyses to evaluate whether the eight TDQ factors
were empirically distinguishable from the other constructs. Specifically, we evaluated
whether nine-factor models (8 TDQ factors plus each additional construct) fit the data better
than eight-factor models (where items from the additional construct were forced to load on
each of the eight TDQ subscales; Anderson & Gerbing, 1988). We followed this procedure
because including all variables at the same time would very likely mask excessive overlap
between a specific pair of variables (Brown, 2015).
Following Cohen’s (1988) classification, each correlation was categorized as small (r ≤
.29), medium (.30 ≤ r ≤ .49) or large (r ≥ .50). Table 3 shows that all but one correlation
between the dimensions of stage 1 and convergent validity variables were small (absolute
average r = .14). Dimensions of stage 2 were negatively related to team processes, emergent
states and characteristics, and positively associated with relationship conflict. On average,
dimensions of stage 2 had a medium correlation with convergent validity variables (|r| = .31).
Overall, dimensions of stage 3 were positively related to proximal constructs, with effect
Team development 25
sizes ranging from small to medium (|r| = .24). Dimensions of stage 4 were generally
positively related to proximal constructs, and negatively related to relationship conflict, and
most associations were of medium to large magnitude (average |r| = .44). With regard to
discriminant validity, we found only weak and non-significant relationships (average |r| =
.07) between TDQ scores and both team leaders’ and members’ sex and tenure in the team.
These results are consistent with the theory-based expectations outlined above, both in terms
of magnitude and direction.
Confirmatory factor analyses allayed concerns about excessive overlap between TDQ
scores and team processes, emergent states and characteristics. Nine-factor models (8 TDQ
factors plus each additional construct) always fit the data better than eight-factor models
(where items from the additional construct were forced to load on one of the eight TDQ
subscales; ∆CFI ranged between -.02 and -.13; Cheung & Rensvold, 2002).
Based on the temporal approach, convergent and discriminant validity were evaluated
using the inter-team methodology because in the process of scale validation we are interested
in conclusions regarding aggregated change at the sample level (cf. Li & Roe, 2012; van der
Haar, Li, Segers, Jehn, & Van den Bossche, 2015). In line with previous research (e.g., van
der Haar et al., 2015), we first computed percentage change ratios from Time 1 to Time 2 for
each team development dimension, and then used hierarchical multiple regression to examine
the effects of these relative change ratios on other variables at Time 2, controlling for all
eight dimensions of team development at Time 1. The results are shown in Table 4. Overall,
changes in stage 1 dimensions had weak effects (average |β| = .10). Changes in dimensions of
stage 2 tended to be negatively related to other variables (average |β| = .17). Changes in
dimensions of stage 3 had weak to moderate positive effects (average |β| = .14). Finally,
changes in dimensions of stage 4 had medium to large positive effects (average |β| = .34).
These results indicate that the TDQ can detect the relatively small changes in team
Team development 26
development that occur during one month (Wheelan, 2005), and that these changes reveal the
expected pattern of relationships with team processes, emergent states and characteristics.
In sum, these results indicate that TDQ scores are meaningfully related to, yet separable
from, team processes, emergent states and characteristics, and unrelated to indicators of team
tenure and sex, thus providing evidence of convergent and discriminant validity.
Phase 4: Criterion Validity
In this phase we examined whether the TDQ scores and changes in team development
over one month predict three facets of team effectiveness: team viability, extra-role
performance and reputation. This way, we sought to expand the available knowledge on the
nomological network of team development and provide further evidence of the construct
validity of the TDQ (Cronbach & Meehl, 1955; Hinkin, 1998). Using the differential
approach, three steps were followed. First, we examined theoretically meaningful correlations
between TDQ scores and team effectiveness. Second, we evaluated the extent to which each
dimension of team development explains criteria above and beyond related constructs. Third,
we evaluated whether task and interpersonal dimensions of each stage explain unique
variance in criteria. Using the temporal approach, we evaluated whether changes in TDQ
scales over one month explain team viability at Time 2.
Drawing on the multidimensional conceptualization of team effectiveness (Mathieu &
Gilson, 2012; Sundstrom, McIntyre, Halfhill, & Richards, 2000), we examined three facets of
team effectiveness (viability, extra-role performance and reputation) for the following
reasons. First, they are theoretically distinguishable and complement each other (Mathieu &
Gilson, 2012). Team viability is “the team’s capacity to adapt to internal and external changes
as well as the probability that team members will continue to work together in the future”
(Aubé & Rousseau, 2005, p. 192). Team extra-role performance focuses on spontaneous
actions that go beyond formal requirements and contribute to performance (Bakker,
Team development 27
Demerouti, & Verbeke, 2004; Eisenberger et al., 2010; Tjosvold, Hui, & Yu, 2003). Team
reputation reflects third parties’ subjective opinions about a team (Tyran & Gibson, 2008).
Competitive and effective teams sustain success over time (viability), go the extra mile to
increase their performance (extra-role performance), and are credible to external observers
(reputation). Second, previous research found that these facets of team effectiveness are
related but distinguishable, and have their distinct correlates and predictors (e.g., Bakker et
al., 2004; Cropanzano, Li, & Benson, 2011; Tyran & Gibson, 2008). Finally, these facets are
particularly relevant for our purpose because previous research has found that they are
influenced by team processes, emergent states, characteristics and developmental stages (e.g.,
Behfar, Peterson, Mannix, & Trochim, 2008; Cropanzano et al., 2011; Jacobsson et al., 2014;
LePine et al., 2008; Tjosvold et al., 2003; Tyran & Gibson, 2008).
Team effectiveness is expected to vary across stages of team development. At each
stage, however, task and interpersonal dimensions of team development are expected to
reveal similar relationships with different facets of team effectiveness because these
dimensions reflect broad configurations of team processes and emergent states (Smith, 2001;
Wheelan, 2005). This notion is consistent with theory (Marks et al., 2001; Wheelan, 2005) as
well as with research using other broad measures of team development and team processes
(e.g., Jacobsson et al., 2014; Lepine et al., 2008; Wheelan & Hochberger, 1996).
Viable teams are able to adapt to changes in their internal and external environment,
and have satisfied team members eager to continue working in the team (Aubé & Rousseau,
2005; Behfar et al., 2008; Hackman, 1987). In stage 1, teams have not yet developed a series
of processes and emergent states to sustain success over time (Smith, 2001). In stage 2,
tension, conflict and negative emotions tend to undermine perceived team viability
(Jacobsson et al., 2014; Jehn et al., 2008). In stage 3, members restructure norms and
relationships, and develop more positive processes and emergent states that enhance team
Team development 28
viability. By stage 4, teams are mature, having adopted effective processes and nurtured
positive emergent states (Janz et al., 1997), further enhancing team viability (Aubé &
Rousseau, 2005; Jehn et al., 2008). Therefore, we hypothesize:
Hypothesis 1: Team viability has a) a negative relationship with both dimensions of
stage 1; b) a negative relationship with both dimensions of stage 2; c) a positive relationship
with both dimensions of stage 3; and d) a positive relationship with both dimensions of stage
4.
Team extra-role performance depends on the team members’ inclination to make
constructive suggestions, to use their knowledge for the benefit of the team, and to protect the
team from potential threats (Eisenberger et al., 2010; Tjosvold et al., 2003; Tjosvold & Yu,
2004). In stage 1, team members are highly dependent on the leader. They are trying to learn
and comply with the existing norms. They may be unclear about their goals and feel insecure
about their roles. Accordingly, they may refrain from making suggestions or going out on a
limb to benefit the team. In stage 2, conflict and tension may exacerbate concerns about
power and influence and undermine team members’ inclination to go over and above the call
of duty to support their peers and the team. In stage 3, teams restructure processes, norms and
patterns of interaction to be more effective. For this purpose, members are likely to help the
team to learn and improve. By stage 4, team members have established clear goals, have
effective interpersonal processes, feel secure about their roles, and are focused on task
accomplishment (Janz et al., 1997; Porter & Lilly, 1996; Smith, 2001; Tuckman & Jensen,
1977; Wheelan & Hochberger, 1996). They are therefore even more willing to go the extra
mile, to make helpful suggestions and to share useful knowledge. Therefore, we hypothesize:
Hypothesis 2: Team extra-role performance has a) a negative relationship with both
dimensions of stage 1; b) a negative relationship with both dimensions of stage 2; c) a
positive relationship with both dimensions of stage 3; and d) a positive relationship with both
Team development 29
dimensions of stage 4.
Team reputation refers to third parties’ “future expectations for the team’s performance,
social interaction, and other behaviors” (Tyran & Gibson, 2008, p. 49). Clients, suppliers, and
members of other teams may form such subjective opinions based on their interactions or
other information about a team (Laird, Zboja, & Ferris, 2012). The team processes, emergent
states and characteristics that configure development stages can be observed by third parties
(Wheelan et al., 2003; Wheelan & Williams, 2003). Therefore, we expect team development
to influence the reputation of a team. In stage 1, dependency and lack of sound processes and
norms may elicit perceptions of low competence and effectiveness. In stage 2, conflict,
tension and negative emotions, compounding the lack of sound processes, may amplify
perceptions that the team is dysfunctional (Baumeister, Bratslavsky, Finkenauer, & Vohs,
2001). In stage 3, teams start to establish a set of effective processes and a positive emotional
atmosphere likely to enhance their reputation. However, reputation attributions require
consistency in observed behaviors (Zinko, Ferris, Humphrey, Meyer, & Aime, 2012), which
may be lacking during team restructuring. In stage 4, teams reveal effective processes and a
positive atmosphere. Also, they are motivated to develop fruitful relationships with clients,
suppliers and other teams (Kuipers & Stoker, 2009). Accordingly, we hypothesize:
Hypothesis 3: Team reputation has a) a negative relationship with both dimensions of
stage 1; b) a negative relationship with both dimensions of stage 2; c) a positive relationship
with both dimensions of stage 3; and d) a positive relationship with both dimensions of stage
4.
Method
Participants and Procedure
We used all three samples for these analyses. We controlled for common method bias
(Podsakoff et al., 2012) using two-wave data (Sample 1) and multisource data (Sample 3). In
Team development 30
sample 1, the TDQ subscales were collected at Time 1 and Time 2, and the criterion variable
(team viability) at Time 2, one month later. In sample 2, team leaders completed the TDQ
and criterion measure (team extra-role performance) at the same time. In sample 3, members
of 77 teams completed the TDQ and their supervisors rated the reputation of the team. Most
supervisors were men (74%) and had university degrees (83.2%). They averaged 43 years of
age (SD = 8.50) and 8 years of tenure as supervisors of their current team (SD = 6.01).
Measures
Team development was measured with the 29-item scale developed in Phase 1.
Team viability was measured with the four-item scale developed by Aubé and Rousseau
(2005). A 5-point scale ranging from 1 (Not true at all) to 5 (Totally true) was used. A sample
item is “The members of this team could work together for a long time.”
Team extra-role performance was evaluated with five items adapted from Eisenberger
et al. (2010). Items were adapted such that the referent was the team instead of a single
employee (e.g., “My employees looked for ways to make our team more successful”). The
response scale ranged from 1 (Strongly disagree) to 7 (Strongly agree).
Team reputation was assessed with three items developed by Hochwarter, Ferris,
Zinko, Arnell, and James (2007), adapted to the team level. An example item is “In this
organization my team has the reputation for producing the highest quality performance.” The
response scale ranged from 1 (Strongly disagree) to 7 (Strongly agree).
Results
Table 3 presents the correlations between TDQ subscales and the three facets of team
effectiveness. In line with our expectations, for stage 1 the task dimension was negatively
related to team reputation (r = -.26, p < .05) and the interpersonal dimension was negatively
related to both team viability (r = -.25, p < .01) and extra-role performance (r = -.23, p < .01).
Contrary to our expectations, the task dimension of stage 1 was unrelated to team viability
Team development 31
and extra-role performance, and the interpersonal dimension was unrelated to team
reputation. Consistent with our predictions, teams in stage 2 were found to be less viable, to
display less extra-role performance efforts and to be less reputable (r values ranged from = -
.40 to -.27, p < .01). Stage 3 dimensions were positively related to team viability (e.g., r =
.18, p < .01), as expected, but negatively related to extra-role performance (e.g., r = -.18, p <
.05) and unrelated to reputation (e.g., r = .13, p > .05), contrary to our expectations. Stage 4
dimensions revealed substantial positive relationships will all three facets of effectiveness
(lowest r = .29, p < .05; highest r = .54, p < .01), in line with our hypotheses.
We tested whether the relationships reported above held controlling for the effects of
related team processes and emergent states. In Sample 1, we controlled for trust, team
potency and relationship conflict. These variables and the TDQ were measured at Time 1,
and team viability at Time 2, minimizing common method variance (Podsakoff et al., 2012).
In sample 2, we controlled for helping behaviors. In sample 3, we controlled for learning,
vitality and tacit knowledge sharing. Hierarchical multiple regression analyses were used,
entering control variables in step 1 and TDQ scores in step 2. Most (78%) of the relationships
reported above remained significant or marginally significant. These results suggest that TDQ
subscales explain significant variance in team effectiveness and capture a configuration of
team processes and emergent states, rather than a single aspect of team development.
Next, we evaluated whether task and interpersonal dimensions at each stage explained
unique variance in criteria. As can be seen in Table 5, task and interpersonal dimensions
often revealed unique effects. In some cases, they even related to criteria in opposite
directions. For example, in stage 1 the task dimension relates positively (β = .14, p < .05),
whereas the interpersonal dimension relates negatively (β = -.27, p < .01), to team viability.
This implies that merging dimensions of the same stage would mask the individual
relationships of each dimension with criteria, resulting in an overall non-significant
Team development 32
relationship. Finally, the effects of the two dimensions of each stage varied across facets of
team effectiveness. For example, the task dimension of stage 1 was positively related to
viability (β = .14, p < .05) and negatively related to reputation (β = -.25, p < .05), whereas the
interpersonal dimension of stage one was negatively related to viability (β = -.27, p < .01) and
unrelated to reputation (β = -.06, p > .05). If we merged the two dimensions of each stage, we
would erroneously conclude that stage 1 was unrelated to both team viability and team
reputation. These results further support the separation of task and interpersonal dimensions.
Criterion-related validity using the temporal approach was assessed with the same
methodology reported in the convergent and discriminant validity phase (Li & Roe, 2012).
Table 4 shows that relative changes in each dimension of team development over one month
predicted team viability at Time 2. Overall, the pattern of relationships was aligned with
Hypothesis 1 (except that the task dimension of stage 1 was positively, albeit weakly, related
to team viability and the interpersonal dimension was unrelated to team viability). These
results provide further evidence of criterion validity.
Discussion
Most stage models of team development shift across four stages that can be described
along two dimensions: task and interpersonal. However, previous empirical research has been
unable to consistently capture the four stages of team development and to disentangle the task
and interpersonal dimensions of each stage. Therefore we sought to create a new measure of
team development that captures its eight theoretical factors (two dimensions per stage), based
on a definition of team development informed by an integrated stage approach. Overall, the
present findings provide evidence that the TDQ is a valid measure of team development. This
conclusion is robust insofar as our results were generally consistent across research designs
and samples: using one key informant per team and aggregated data from multiple team
members; using cross-sectional, multisource and two-wave data from three samples and two
Team development 33
countries; using both a differential approach and a temporal approach to data analyses; and
using evaluations of 1278 team members and leaders from several occupations.
The psychometric properties of the TDQ were sound. An array of tests support this
assertion: 1) confirmatory factor analyses showed that the eight factor model fit the data
appropriately; 2) internal consistencies for each factor ranged from .70 to .92; 3)
measurement invariance analyses, showed consistency in the structure and meaning of the
instrument across language (Portuguese and English); 4) construct distinctiveness analyses
(∆CFI of nested models) suggested that, for ongoing teams, development occurs along four
stages, each having distinguishable task and interpersonal dimensions; and 5) consensual and
discriminant power analyses indicated that team members largely share their perceptions on
the developmental stage of the team and, thus, each factor can be aggregated with confidence
to the team level and can be measured accurately with both a key respondent per team (leader
or member) or multiple respondents. Also, temporal stability tests indicated that while the
meaning of the measure remained stable through time (measurement invariance tests), the
relationships between scores of team development at T1 and T2 were lower than the
reliability (Cronbach’s alpha) of each team development dimension. Together, these findings
indicate that the adjustments in team development scores are more likely to be due to the
small changes in team development occurred over a one-month period (Wheelan, 2005) than
to the measure being unreliable (DeVellis, 2017).
In addition, we demonstrated convergent and discriminant validity between each team
development factor and team processes (relationship conflict, creative processes, tacit
knowledge sharing, knowledge utilization and helping behaviors), team emergent states
(potency, goal clarity and commitment, task and social cohesion, and thriving), team
characteristics (participation in decision making and task interdependence) and leader and
member demographics (sex and tenure in team). Lastly, we established the criterion validity
Team development 34
of TDQ factors by showing that they explain variance in team viability, extra-role
performance and reputation. Furthermore, we found that most of these relationships remained
significant after controlling for (one to three) relevant team processes and emergent states,
and the task and interpersonal dimensions of each stage had unique effects on criteria. Thus,
the instrument demonstrated predictable relationships with variables in the nomological
network of team development.
To complement the above results, based on the differential approach, we also
conducted analyses based on the temporal approach (Li & Roe, 2012). Using an inter-team
methodology, we further established convergent validity and criterion-related validity. In
particular, we showed that, for each stage of team development, relative changes in task and
interpersonal dimensions over one month related, in the expected direction and magnitude, to
relevant constructs as well as to team viability. Considering stability tests and the effects of
changes in team development dimensions together suggests that the TDQ balances two
requirements for measuring dynamic constructs. On the one hand, the measure reveals
temporal reliability – as expected, considering that most teams do not change abruptly over a
short time period. On the other hand, the measure is able to detect the small changes that do
occur even in a relatively short time period.
The development and validation of this theory-driven measure makes three theoretical
contributions. First, because previous measures have been unable to consistently disentangle
task and interpersonal dimensions, and capture the four theoretical stages of development in
ongoing teams, some have questioned the four-stage perspective of team development (Ito &
Brotheridge, 2008; Wheelan & Hochberger, 1996). Our results support the widely held and
integrative view that ongoing teams vary in terms of four stages and two dimensions: task
and interpersonal.
Second, consistent with the notion that team development reflects changes in
Team development 35
configurations of team processes, emergent states and characteristics (Chang et al., 2006;
Garfield & Dennis, 2013; Smith, 2001; Wheelan, 2005), we found that each developmental
dimension and stage was related to, yet distinguishable from, a range of related constructs
including team processes, emergent states and characteristics. Meaningful but not excessive
correlations between each dimension of team development and these related constructs
suggest that the theoretical nomological network of the TDQ is valid and consistent with the
definition of team development on which it was based. Although different stages of
development share similar processes and emergent states, they also reveal different patterns
of relationships with these constructs. For example, the fourth stage (reflecting higher team
maturity) revealed moderate to strong relationships with adaptive team processes and positive
emergent states, whereas the preceding stage (when teams begin to establish sound processes
to enhance effectiveness) revealed only weak to moderate relationships.
Third, this study extended the available knowledge on the nomological network of team
development by examining three facets of team effectiveness. Researchers often assume that
developed teams are more effective than teams in early stages of development because their
established processes and emergent states promote effectiveness (e.g., Kuipers & Stoker,
2009; Wheelan, 2005). However, scant research has examined relationships between stages
of team development and team effectiveness. Our results suggest that mature teams are more
viable and reputable, and foster higher extra-role performance. We are among the first to
show that task and interpersonal dimensions of each stage have unique, and sometimes
opposite, effects on effectiveness. These findings highlight the importance of considering not
only a team’s developmental stage but also task and interpersonal dimensions to fully
understand team effectiveness.
Limitations and Future Directions
This study has some limitations. First, our goal was to develop a measure of team
Team development 36
development that could be administered to key team informants (single team member and
team leader) as well as to several team members. At present, we cannot guarantee that this
measure will also be valid and reliable if administered to external observers. Relatedly,
because we used a referent-shift consensus approach (Chan, 1998), it is still an open question
whether variations in individual perceptions of team development are relevant to team and/or
individual effectiveness, and whether this measure is valid and reliable when a full team
answer it together (true team level measure). Exploring these multilevel issues and validating
the measure with a full team discussion are potential avenues for further research. Second,
this measure assumes the existence of a team leader. Further research is required to adapt and
evaluate the validity of TDQ with self-managed teams.
Third, we cannot claim that the relationships observed between stages of team
development and team effectiveness reflect causal effects. We used two-wave and
multisource data, performed analyses based on both the differential and temporal approaches,
and found solid evidence of criterion validity (Dobrow & Tosti-Kharas, 2011; Ferris et al.,
2008). Nonetheless, some conceptual overlap between stages of team development and
effectiveness criteria is unavoidable. The taxonomy upon which the present work is based
reflects team processes, emergent states, and team characteristics, overlapping to some extent
with team effectiveness. By design, the fourth stage of team development reflects mature and
efficient team functioning. This conceptualization may be viewed as an advantage for
researchers and practitioners interested in a broad level of analysis, and as a disadvantage by
those seeking to distinguish team processes, emergent states, and effectiveness.
Relatedly, we controlled for common method bias in criterion validity tests (Podsakoff
et al., 2012) using two-wave data (Sample 1; one month apart) and multisource data (Sample
3). Further, the inclusion of control variables from the same source (used in Samples 1, 2 and
3) tends to attenuate the effects of common method bias (Siemsen, Roth, & Oliveira, 2010).
Team development 37
The fact that the pattern of results between the TDQ and criteria was very similar with and
without control variables indicates that it is very unlikely that these findings can be explained
by common method bias.
Fourth, only three facets of effectiveness were evaluated: viability, extra-role
performance and reputation. Future research should examine relationships between team
development and other facets of effectiveness, such as task performance, absenteeism, and
turnover intentions (Mathieu & Gilson, 2012). Fifth, we only evaluated the validity of this
measure in Portugal and in the USA. Translation and back-translation procedures (Brislin,
1980) in conjunction with measurement invariance tests (Cheung & Rensvold, 2002)
provided strong evidence for lexical and meaning equivalence of the items for Portuguese
and English languages. Future research should extend these procedures to other languages.
Lay views and common definitions of development emphasize growth or increasing
maturity over time. Our claim that teams do not necessarily shift to more mature stages of
development linearly over time goes against this assumption. We have argued that the stages
of development measured by the TDQ reflect common configurations of team processes,
emergent states and characteristics that act as "attractors" in complex change dynamics.
Teams can shift to more mature processes and positive states over time, becoming more
efficient. However, they can also shift to less efficient processes or to more dysfunctional
behavior, depending on factors internal and external to the team. Future research should
investigate these transitions between dimensions and stages of team development, and what
triggers them. In particular, different leadership styles or behaviors (Morgeson, DeRue, &
Karam, 2010) and external forces (Garfield & Dennis, 2013) may promote or hinder team
development, depending on the current stage of the team. For example, a leader who
systematically establishes expectations and goals for the team may unintentionally keep the
team at the task dimension of the first stage of development. Understanding which factors
Team development 38
promote the development of the interpersonal dimension and which promote the development
of the task dimension may also be a great avenue for future research. Finally, identifying
profiles of transitions among stages and dimensions of team development might also be a
fruitful avenue for future research.
The goal of this paper was to develop and validate a measure assessing the extent to
which teams fit different stages, as identified by an important body of theory on team
development. In light of the empirical evidence presented here, we believe this goal was met.
Nonetheless, it is important to recognize that the work of validation does not end here.
Although prior theory and research suggest that these modes of team functioning are relevant
across cultures, further evidence of cross-cultural validity for our scale is also needed before
we can confidently recommend that it be used in different cultural contexts.
Moreover, the ultimate value of the TDQ depends on the soundness of the theoretical
models from which it was derived. Further research is needed to evaluate whether the stages
of team development identified by this theoretical literature provide the most useful and
comprehensive taxonomy, or whether this taxonomy needs further elaboration or revision.
We believe that our measure and the taxonomy upon which it is based are useful for
evaluating modes of team functioning at a fairly broad level of analysis. For example,
practitioners may use it to identify salient stages of team development, foster awareness of
strengths and weaknesses in a team, and start a reflective discussion of steps to be taken to
further develop the team. Practitioners seeking a more fine grained analysis of team
functioning may wish to examine specific team processes and emergent states relevant to
previously identified stages of team development.
Practical implications
This study has at least three practical implications. First, the team development
questionnaire can be used as a diagnostic tool for instructors, team leaders and organizations.

Team development 39
An instructor who understands the developmental stage that best characterizes a team’s
functioning can develop more tailored and effective team-building programs. A team leader
can use this instrument to facilitate a discussion with team members about what can be done
to promote or to sustain sound processes and a healthy team atmosphere. From an
organizational perspective, the instrument could be useful for signaling training needs that are
transversal to several teams in the organization.
Second, disentangling task and interpersonal dimensions of team development stages
facilitates effective interventions. When asked, team members tend to frame team problems
as interpersonal problems (Buzaglo & Wheelan, 1999). The use of the TDQ makes targeted
interventions on task and/or interpersonal dimensions possible. Finally, our results suggest
that team leaders and organizations interested in fostering team effectiveness should invest in
the development of their teams. Teams at the fourth stage of development, our results
indicate, tend to be more viable, to go the extra mile, and to be more reputable.
Conclusion
Team development has been conceptualized from a variety of theoretical perspectives
and different models have been proposed to explain the changes that occur in teams over
time. Integrative approaches have sought to combine valuable contributions from various
models and perspectives into an overall description of each stage and dimension of team
development. However, until now, these efforts at integration were not used to improve the
measurement of team development. With the TDQ, researchers can now capture the
overarching stages and dimensions of team development, as proposed by the integrative
approach, and accumulate and communicate empirical findings on team development using a
standard classification. Although analyzing specificities of team development remains crucial
for theory development, now we also have a measure that allows researchers to study stages
and dimensions of team development comprehensively, at a broad level of analysis.
Team development 40
References
Agazarian, Y., & Gantt, S. (2003). Phases of group development: Systems-centered
hypotheses and their implications for research and practice. Group Dynamics: Theory,
Research, and Practice, 7, 238-252.
Ancona, D. G., & Caldwell, D. F. (1992). Bridging the boundary: External activity and
performance in organizational teams. Administrative Science Quarterly, 37, 634-665.
Anderson, J. C., & Gerbing, D. W. (1988). Structural equation modeling in practice: A
review and recommended two-step approach. Psychological Bulletin, 103, 411-423.
Anderson, N., Potočnik, K., & Zhou, J. (2014). Innovation and creativity in organizations: A
state-of-the-science review, prospective commentary, and guiding framework. Journal of
Management, 40, 1297-1333.
Arrow, H., Poole, M. S., Henry, K. B., Wheelan, S. A., & Moreland, R. (2004). Time,
change, and development: The temporal perspective on groups. Small Group Research, 35,
73-105.
Atwater, L., & Carmeli, A. (2009). Leader–member exchange, feelings of energy, and
involvement in creative work. The Leadership Quarterly, 20, 264-275.
Aubé, C., & Rousseau, V. (2005). Team goal commitment and team effectiveness: The role
of task interdependence and supportive behaviors. Group Dynamics: Theory, Research,
and Practice, 9, 189-204.
Bakker, A. B., Demerouti, E., & Verbeke, W. (2004). Using the job demands-resources
model to predict burnout and performance. Human Resource Management, 43, 83-104.
Baumeister, R. F., Bratslavsky, E., Finkenauer, C., & Vohs, K. D. (2001). Bad is stronger
than good. Review of General Psychology, 5, 323-370.
Beal, D. J., Cohen, R. R., Burke, M. J., & McLendon, C. L. (2003). Cohesion and
performance in groups: A meta-analytic clarification of construct relations. Journal of
Team development 41
Applied Psychology, 88, 989-1004.
Behfar, K. J., Peterson, R. S., Mannix, E. A., & Trochim, W. M. K. (2008). The critical role
of conflict resolution in teams: A close look at the links between conflict type, conflict
management strategies, and team outcomes. Journal of Applied Psychology, 93, 170-188.
Bliese, P. D. (2000). Within-group agreement, non-independence, and reliability:
Implications for data aggregation and analyses. In K. J. Klein & S. W. J. Kozlowski (Eds.),
Multilevel theory, research, and methods in organizations: Foundations, extensions, and
new directions (pp. 349–381). San Francisco: Jossey-Bass.
Bock, G. W., Zmud, R. W., Kim, Y., & Lee, J. (2005). Behavioral intention formation in
knowledge sharing: Examining the roles of extrinsic motivators, social-psychological
forces, and organizational climate. MIS Quarterly, 29, 87-111.
Bonebright, D. A. (2010). 40 years of storming: A historical review of Tuckman’s model of
small group development. Human Resource Development International, 13, 111-120.
Brislin, R. W. (1980). Translation and content analysis of oral and written materials. In H. C.
Triandis & W. W. Lambert (Eds.), Handbook of cross-cultural psychology (Vol. 2, pp.
349-444). Boston, MA: Allyn & Bacon.
Brown, T. (2015). Confirmatory factor analysis for applied research. NY: Guilford Press.
Burke, M. J., & Dunlap, W. P. (2002). Estimating interrater agreement with the average
deviation index: A user’s guide. Organizational Research Methods, 5, 159-172.
Buzaglo, G., & Wheelan, S. A. (1999). Facilitating work team effectiveness: Case studies
from central America. Small Group Research, 30, 108-129.
Campbell, D., & Fiske, D. (1959). Convergent and discriminant validation by the multitrait–
multimethod matrix. Psychological Bulletin, 56, 81-105.
Campion, M. A., Medsker, G. J., & Higgs, A. C. (1993). Relations between work group
characteristics and effectiveness: Implications for designing effective work groups.
Team development 42
Personnel Psychology, 46, 823-850.
Carless, S. A., & De Paola, C. (2000). The measurement of cohesion in work teams. Small
Group Research, 31, 71-88.
Chan, D. (1998). Functional relations among constructs in the same content domain at
different levels of analysis: A typology of composition models. Journal of Applied
Psychology, 83, 234-246.
Chang, A., Bordia, P., & Duck, J. (2003). Punctuated equilibrium and linear progression:
Toward a new understanding of group development. Academy of Management Journal, 48,
106-117.
Chang, A., Duck, J., & Bordia, P. (2006). Understanding the multidimensionality of group
development. Small Group Research, 37, 327-350.
Cheung, G. W., & Rensvold, R. B. (2002). Evaluating goodness-of-fit indexes for testing
measurement invariance. Structural Equation Modeling, 9, 233-255.
Cohen, J. (1988). Statistical power analysis for the behavioral sciences (2nd ed.). Hillsdale,
NJ: Erlbaum.
Cohen, S. G., & Bailey, D. E. (1997). What makes teams work: Group effectiveness research
from the shop floor to the executive suite. Journal of Management, 23, 239-290.
Costa, A. C., & Anderson, N. (2011). Measuring trust in teams: Development and validation
of a multifaceted measure of formative and reflective indicators of team trust. European
Journal of Work and Organizational Psychology, 20, 119-154.
Cronbach, L. J., & Meehl, P. E. (1955). Construct validity in psychological tests.
Psychological Bulletin, 52, 281-302.
Cropanzano, R., Li, A., & Benson, L. (2011). Peer justice and teamwork process. Group &
Organization Management, 36, 567-596.
de Wit, F. R. C., Greer, L. L., & Jehn, K. A. (2012). The paradox of intragroup conflict: A
Team development 43
meta-analysis. Journal of Applied Psychology, 97, 360-390.
DeVellis, R. F. (2017). Scale development: Theory and applications (4th
Edition). London:
SAGE.
Dobrow, S. R., & Tosti-Kharas, J. (2011). Calling: The development of a scale measure.
Personnel Psychology, 64, 1001-1049.
Drach-Zahavy, A., & Somech, A. (2001). Understanding team innovation: The role of team
processes and structures. Group Dynamics: Theory, Research, and Practice, 5, 111-123.
Ehrhart, M. G., Bliese, P. D., & Thomas, J. L. (2006). Unit-level OCB and unit effectiveness:
Examining the incremental effect of helping behavior. Human Performance, 19, 159-173.
Eisenberger, R., Karagonlar, G., Stinglhamber, F., Neves, P., Becker, T. E., Gonzalez-
Morales, M. G., & Steiger-Mueller, M. (2010). Leader–member exchange and affective
organizational commitment: The contribution of supervisor’s organizational embodiment.
Journal of Applied Psychology, 95, 1085-1103.
Ericksen, J., & Dyer, L. (2004). Right from the start: Exploring the effects of early team
events on subsequent project team development and performance. Administrative Science
Quarterly, 49, 438-471.
Faraj, S., & Sproull, L. (2000). Coordinating expertise in software development teams.
Management Science, 46, 1554-1568.
Ferris, D. L., Brown, D. J., Berry, J. W., & Lian, H. (2008). The development and validation
of the workplace ostracism scale. Journal of Applied Psychology, 93, 1348-1366.
Fisher, S. G., Hunter, T. A., & Macrosson, W. D. K. (1997). Team or group? Managers’
perceptions of the differences. Journal of Managerial Psychology, 12, 232-242.
Furr, R. M. (2011). Scale construction and psychometrics for social and personality
psychology. London: SAGE.
Furst, S. A., Reeves, M., Rosen, B., & Blackburn, R. S. (2004). Managing the life cycle of

Team development 44
virtual teams. Academy of Management Executive, 18, 6-20.
Garcia, R., & Kandemir, D. (2006). An illustration of modeling moderating variables in
cross-national studies. International Marketing Review, 23, 371-389.
Garfield, M. J., & Dennis, A. R. (2013). Toward an integrated model of group development:
Disruption of routines by technology-induced change. Journal of Management Information
Systems, 29, 43-86.
Gersick, C. J. G. (1988). Time and transition in work teams: Toward a new model of group
development. Academy of Management Journal, 31, 9-41.
Gibson, C. B., & Vermeulen, F. (2003). A healthy divide: Subgroups as a stimulus for team
learning behavior. Administrative Science Quarterly, 48, 202-239.
Gilson, L. L., Mathieu, J. E., Shalley, C. E., & Ruddy, T. M. (2005). Creativity and
standardization: Complementary or conflicting drivers of team effectiveness? Academy of
Management Journal, 48, 521-531.
Gilson, L. L., & Shalley, C. E. (2004). A little creativity goes a long way: An examination of
teams’ engagement in creative processes. Journal of Management, 30, 453-470.
Goncalo, J. A., Polman, E., & Maslach, C. (2010). Can confidence come too soon? Collective
efficacy, conflict and group performance over time. Organizational Behavior and Human
Decision Processes, 113, 13-24.
Hackman, J. R. (1987). The design of work teams. In J. W. Lorsch (Ed.), Handbook of
organizational behavior (pp. 315-342). Englewood Cliffs, NJ: Prentice-Hall.
Hare, A. P. (1973). Theories of group development and categories for interaction analysis.
Small Group Research, 4, 259-304.
Hinkin, T. R. (1995). A review of scale development practices in the study of organizations.
Journal of Management, 21, 967-988.
Hinkin, T. R. (1998). A brief tutorial on the development of measures for use in survey
Team development 45
questionnaires. Organizational Research Methods, 1, 104-121.
Hochwarter, W. A., Ferris, G. R., Zinko, R., Arnell, B., & James, M. (2007). Reputation as a
moderator of political behavior-work outcomes relationships: A two-study investigation
with convergent results. Journal of Applied Psychology, 92, 567-576.
Ito, J. K., & Brotheridge, C. M. (2008). Do teams grow up one stage at a time? Exploring the
complexity of group development models. Team Performance Management, 14, 214-232.
Jacobsson, C., Rydbo, N., & Börresen, J. E. (2014). The links between group development
and health in manufacturing industry. Small Group Research, 45, 400-415.
Janz, B. D., Colquitt, J. A., & Noe, R. A. (1997). Knowledge worker team effectiveness: The
role of autonomy, interdependence, team development, and contextual support variables.
Personnel Psychology, 50, 877-904.
Jehn, K. A., Greer, L., Levine, S., & Szulanski, G. (2008). The effects of conflict types,
dimensions, and emergent states on group outcomes. Group Decision and Negotiation, 17,
465-495.
Jehn, K. A., & Mannix, E. A. (2001). The dynamic nature of conflict: A longitudinal study of
intragroup conflict and group performance. Academy of Management Journal, 44, 238-251.
Jones, J. E., & Bearley, W. L. (2001). Facilitating team development: A view from the field.
Group Facilitation, 3, 56-65.
Kark, R., & Carmeli, A. (2009). Alive and creating: The mediating role of vitality and
aliveness in the relationship between psychological safety and creative work involvement.
Journal of Organizational Behavior, 30, 785-804.
Karriker, J. H. (2005). Cyclical group development and interaction-based leadership
emergence in autonomous teams: An integrated model. Journal of Leadership &
Organizational Studies, 11, 54-64.
Kivimaki, M., & Elovainio, M. (1999). A short version of the Team Climate Inventory:
Team development 46
Development and psychometric properties. Journal of Occupational and Organizational
Psychology, 72, 241-246.
Klein, K. J., & Kozlowski, S. W. J. (2000). From micro to meso: Critical steps in
conceptualizing and conducting multilevel research. Organizational Research Methods, 3,
211-236.
Kozlowski, S. W. J. (2015). Advancing research on team process dynamics: Theoretical,
methodological, and measurement considerations. Organizational Psychology Review, 5,
270-299.
Kozlowski, S. W. J., & Bell, B. S. (2003). Work groups and teams in organizations. In W. C.
Borman, D. R. Ilgen, & R. J. Klimoski (Eds.), Handbook of psychology: Vol. 12. Industrial
and organizational psychology (pp. 333-376). Hoboken, NJ: Wiley.
Kozlowski, S. W. J., & Ilgen, D. R. (2006). Enhancing the effectiveness of work groups and
teams. Psychological Science in the Public Interest, 7, 77-124.
Kuipers, B. S., & Stoker, J. I. (2009). Development and performance of self-managing work
teams: A theoretical and empirical examination. The International Journal of Human
Resource Management, 20, 399-419.
Kumar, N., Stern, L. W., & Anderson, J. C. (1993). Conducting interorganizational research
using key informants. Academy of Management Journal, 36, 133-1651.
Laird, M. D., Zboja, J. J., & Ferris, G. R. (2012). Partial mediation of the political skill-
reputation relationship. Career Development International, 17, 557-582.
Lance, C. E., Butts, M. M., & Michels, L. C. (2006). The sources of four commonly reported
cutoff criteria: What did they really say? Organizational Research Methods, 9, 202-220.
LeBreton, J. M., & Senter, J. L. (2008). Answers to 20 questions about interrater reliability
and interrater agreement. Organizational Research Methods, 11, 815-852.
LePine, J. A., Piccolo, R. F., Jackson, C. L., Mathieu, J. E., & Saul, J. R. (2008). A meta-

Team development 47
analysis of teamwork processes: Tests of a multidimensional model and relationships with
team effectiveness criteria. Personnel Psychology, 61, 273-307.
Li, J., & Roe, R. A. (2012). Introducing an intrateam longitudinal approach to the study of
team process dynamics. European Journal of Work and Organizational Psychology, 21,
718-748.
Mannix, E., & Jehn, K. A. (2004). Let’s norm and storm, but not right now: Integrating
models of group development and performance. In E. Mannix, M. Neale & S. Blount
(Eds.), Research on managing groups and teams: Temporal issues (Vol. 6, pp. 11-37).
New York: Elsevier.
Marks, M. A., Mathieu, J. E., & Zaccaro, S. J. (2001). A temporally based framework and
taxonomy of team processes. Academy of Management Review, 26, 356-376.
Marsh, H. W., Hau, K. T., & Wen, Z. (2004). In search of golden rules: Comment on
hypothesis-testing approaches to setting cutoff values for fit indexes and dangers in
overgeneralizing Hu and Bentler’s (1999) findings. Structural Equation Modeling, 11, 320-
341.
Mathieu, J. E., & Gilson, L. (2012). Criteria issues and team effectiveness. In S. W. J.
Kozlowski (Ed.), Oxford handbook of industrial and organizational psychology (pp. 910-
930). London: Oxford Press.
Mathieu, J. E., & Rapp, T. L. (2009). Laying the foundation for successful team performance
trajectories: The roles of team charters and performance strategies. Journal of Applied
Psychology, 94, 90-103.
Miller, D. L. (2003). The stages of group development: A retrospective study of dynamic
team processes. Canadian Journal of Administrative Sciences, 20, 121-134.
Morgan, B. B., Salas, E., & Glickman, A. S. (1993). An analysis of team evolution and
maturation. The Journal of General Psychology, 120, 277-291.
Team development 48
Morgeson, F. P., DeRue, D. S., & Karam, E. P. (2010). Leadership in teams: A functional
approach to understanding leadership structures and processes. Journal of Management,
36, 5-39.
Nunnally, J. C. (1978). Psychometric theory (2nd ed.). New York: McGraw-Hill.
Oliveira, J. C., Miguez, J., & Lourenço, P. R. (2005). Group development: The issue of
sequentiality. Boletim SPEF, 30/31, 121-131.
Podsakoff, P. M., Ahearne, M., & MacKenzie, S. B. (1997). Organizational citizenship
behavior and the quantity and quality of work group performance. Journal of Applied
Psychology, 82, 262-270.
Podsakoff, P. M., MacKenzie, S. B., & Podsakoff, N. P. (2012). Sources of method bias in
social science research and recommendations on how to control it. Annual Review of
Psychology, 63, 539-569.
Porath, C., Spreitzer, G., Gibson, C., & Garnett, F. G. (2012). Thriving at work: Toward its
measurement, construct validation, and theoretical refinement. Journal of Organizational
Behavior, 33, 250-275.
Porter, T. W., & Lilly, B. S. (1996). The effects of conflict, trust, and task commitment on
project team performance. International Journal of Conflict Management, 7, 361-376.
Riordan, C. M., & Vandenberg, R. J. (1994). A central question in cross-cultural research: Do
employees of different cultures interpret work-related measures in an equivalent manner?
Journal of Management, 20, 643-671.
Robinson, G., & Morley, C. (2007). Running the electronic sweatshop: Call centre managers’
views on call centres. Journal of Management & Organization, 13, 249-263.
Roe, R. A., Gockel, C., & Meyer, B. (2012). Time and change in teams: Where we are and
where we are moving. European Journal of Work and Organizational Psychology, 21,
629-656.
Team development 49
Seers, A., & Woodruff, S. (1997). Temporal pacing in task forces: Group development or
deadline pressure? Journal of Management, 23, 169-187.
Siemsen, E., Roth, A., & Oliveira, P. (2010). Common method bias in regression models with
linear, quadratic, and interaction effects. Organizational Research Methods, 13, 456-476.
Smith, G. (2001). Group development: A review of the literature and a commentary on future
research directions. Group Facilitation, 3, 14-45.
Sundstrom, E., McIntyre, M., Halfhill, T., & Richards, H. (2000). Work groups: From the
Hawthorne studies to work teams of the 1990s and beyond. Group Dynamics: Theory,
Research, and Practice, 4, 44-67.
Sung, S. Y., & Choi, J. N. (2012). Effects of team knowledge management on the creativity
and financial performance of organizational teams. Organizational Behavior and Human
Decision Processes, 118, 4-13.
Tjosvold, D., Hui, C., & Yu, Z. (2003). Conflict management and task reflexivity for team in-
role and extra-role performance in China. The International Journal of Conflict
Management, 14, 141-163.
Tjosvold, D., & Yu, Z. (2004). Goal interdependence and applying abilities for team in-role
and extra-role performance in China. Group Dynamics: Theory, Research, and Practice, 8,
98-111.
Tuckman, B. W. (1965). Developmental sequence in small groups. Psychological Bulletin,
63, 384-399.
Tuckman, B. W., & Jensen, M. A. C. (1977). Stages of small-group development revisited.
Group & Organization Management, 2, 419-427.
Tyran, K. L., & Gibson, C. B. (2008). Is what you see, what you get?: The relationship
among surface- and deep-level heterogeneity characteristics, group efficacy, and team
reputation. Group & Organization Management, 33, 46-76.
Team development 50
Van de Ven, A., & Ferry, D. (1980). Measuring and assessing organizations. NY: Wiley.
van der Haar, S., Li, J., Segers, M., Jehn, K. A., & Van den Bossche, P. (2015). Evolving
team cognition: The impact of team situation models on team effectiveness. European
Journal of Work and Organizational Psychology, 24, 596-610.
Vandenberg, R. J., & Lance, C. E. (2000). A review and synthesis of the measurement
invariance literature: Suggestions, practices, and recommendations for organizational
research. Organizational Research Methods, 3, 4-70.
Wageman, R. (1995). Interdependence and group effectiveness. Administrative Science
Quarterly, 40, 145-180.
Wheelan, S. A. (2005). Group processes: A developmental perspective (2nd ed.). Boston:
Allyn & Bacon.
Wheelan, S. A., Davidson, B., & Tilin, F. (2003). Group development across time: Reality or
illusion? Small Group Research, 34, 223-245.
Wheelan, S. A., & Hochberger, J. M. (1996). Validation studies of the Group Development
Questionnaire. Small Group Research, 27, 143-170.
Wheelan, S. A., & Williams, T. (2003). Mapping dynamic interaction patterns in work
groups. Small Group Research, 34, 443-467.
Zhang, Z., Waldman, D. A., & Wang, Z. (2012). A multilevel investigation of leader–
member exchange, informal leader emergence, and individual and team performance.
Personnel Psychology, 65, 49-78.
Zinko, R., Ferris, G. R., Humphrey, S. E., Meyer, C. J., & Aime, F. (2012). Personal
reputation in organizations: Two-study constructive replication and extension of
antecedents and consequences. Journal of Occupational and Organizational Psychology,
85, 156-180.
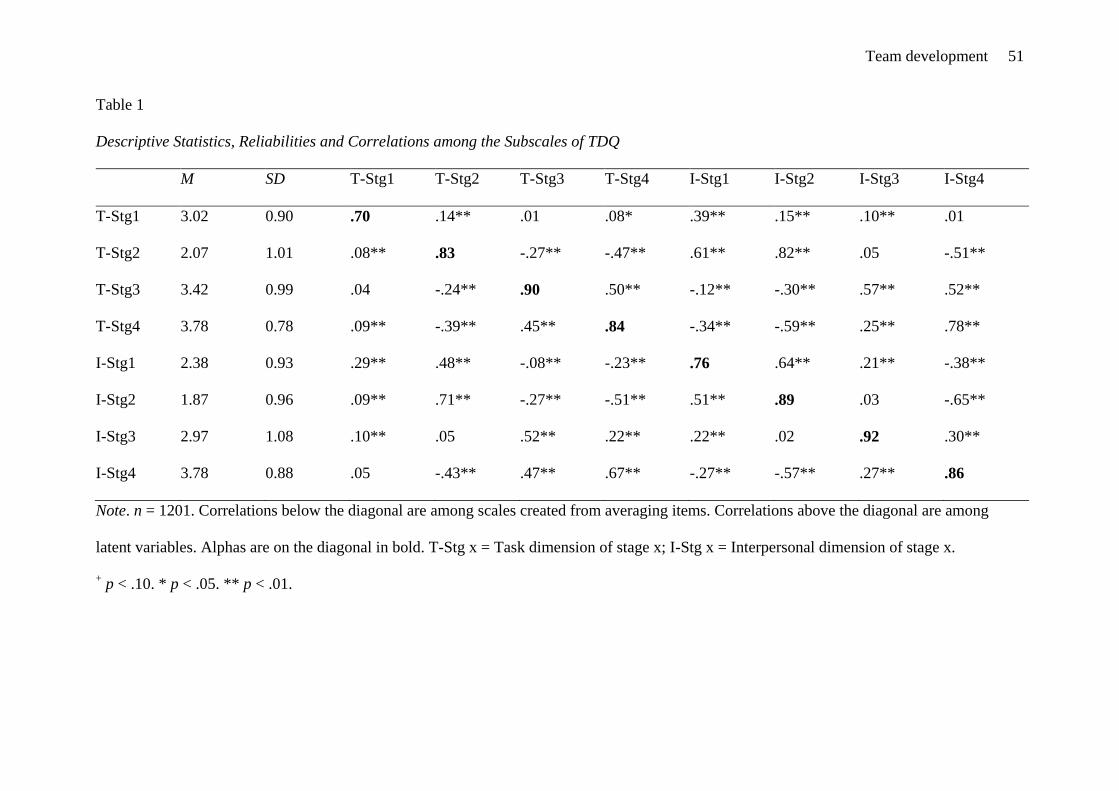
Team development 51
Table 1
Descriptive Statistics, Reliabilities and Correlations among the Subscales of TDQ
M SD T-Stg1 T-Stg2 T-Stg3 T-Stg4 I-Stg1 I-Stg2 I-Stg3 I-Stg4
T-Stg1 3.02 0.90 .70 .14** .01 .08* .39** .15** .10** .01
T-Stg2 2.07 1.01 .08** .83 -.27** -.47** .61** .82** .05 -.51**
T-Stg3 3.42 0.99 .04 -.24** .90 .50** -.12** -.30** .57** .52**
T-Stg4 3.78 0.78 .09** -.39** .45** .84 -.34** -.59** .25** .78**
I-Stg1 2.38 0.93 .29** .48** -.08** -.23** .76 .64** .21** -.38**
I-Stg2 1.87 0.96 .09** .71** -.27** -.51** .51** .89 .03 -.65**
I-Stg3 2.97 1.08 .10** .05 .52** .22** .22** .02 .92 .30**
I-Stg4 3.78 0.88 .05 -.43** .47** .67** -.27** -.57** .27** .86
Note. n = 1201. Correlations below the diagonal are among scales created from averaging items. Correlations above the diagonal are among
latent variables. Alphas are on the diagonal in bold. T-Stg x = Task dimension of stage x; I-Stg x = Interpersonal dimension of stage x.
+ p < .10. * p < .05. ** p < .01.
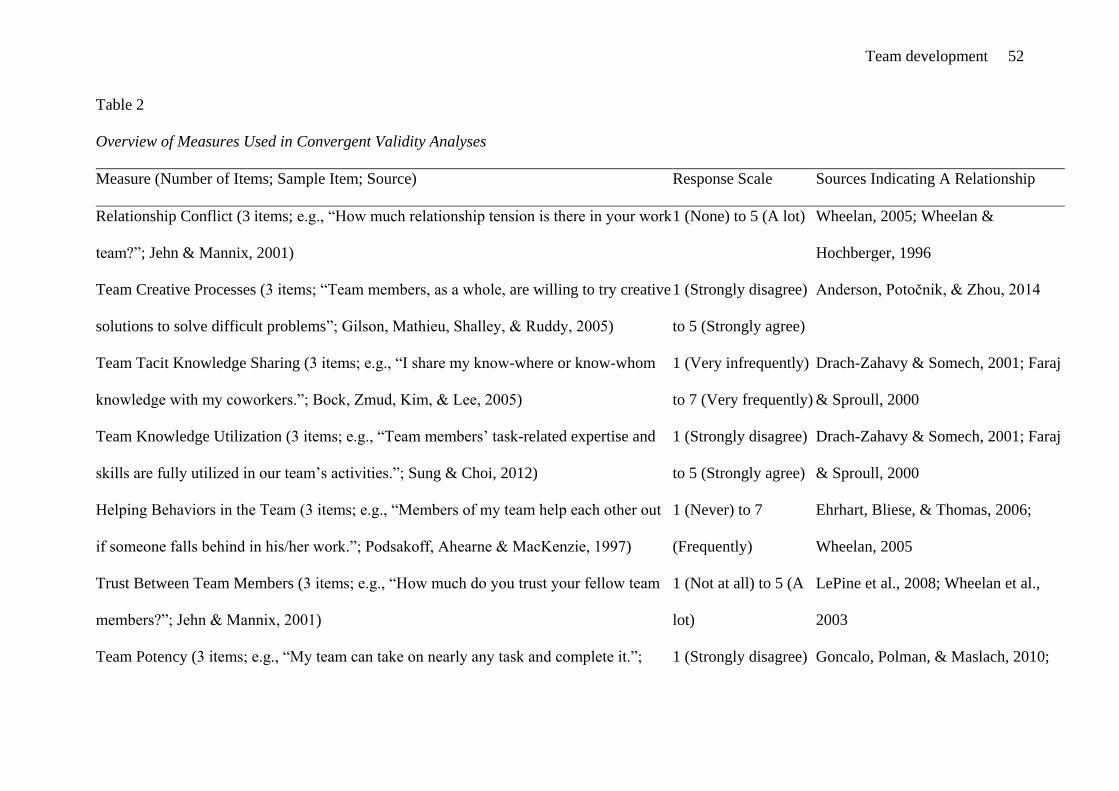
Team development 52
Table 2
Overview of Measures Used in Convergent Validity Analyses
Measure (Number of Items; Sample Item; Source) Response Scale Sources Indicating A Relationship
Relationship Conflict (3 items; e.g., “How much relationship tension is there in your work
team?”; Jehn & Mannix, 2001)
1 (None) to 5 (A lot) Wheelan, 2005; Wheelan &
Hochberger, 1996
Team Creative Processes (3 items; “Team members, as a whole, are willing to try creative
solutions to solve difficult problems”; Gilson, Mathieu, Shalley, & Ruddy, 2005)
1 (Strongly disagree)
to 5 (Strongly agree)
Anderson, Potočnik, & Zhou, 2014
Team Tacit Knowledge Sharing (3 items; e.g., “I share my know-where or know-whom
knowledge with my coworkers.”; Bock, Zmud, Kim, & Lee, 2005)
1 (Very infrequently)
to 7 (Very frequently)
Drach-Zahavy & Somech, 2001; Faraj
& Sproull, 2000
Team Knowledge Utilization (3 items; e.g., “Team members’ task-related expertise and
skills are fully utilized in our team’s activities.”; Sung & Choi, 2012)
1 (Strongly disagree)
to 5 (Strongly agree)
Drach-Zahavy & Somech, 2001; Faraj
& Sproull, 2000
Helping Behaviors in the Team (3 items; e.g., “Members of my team help each other out
if someone falls behind in his/her work.”; Podsakoff, Ahearne & MacKenzie, 1997)
1 (Never) to 7
(Frequently)
Ehrhart, Bliese, & Thomas, 2006;
Wheelan, 2005
Trust Between Team Members (3 items; e.g., “How much do you trust your fellow team
members?”; Jehn & Mannix, 2001)
1 (Not at all) to 5 (A
lot)
LePine et al., 2008; Wheelan et al.,
2003
Team Potency (3 items; e.g., “My team can take on nearly any task and complete it.”; 1 (Strongly disagree) Goncalo, Polman, & Maslach, 2010;
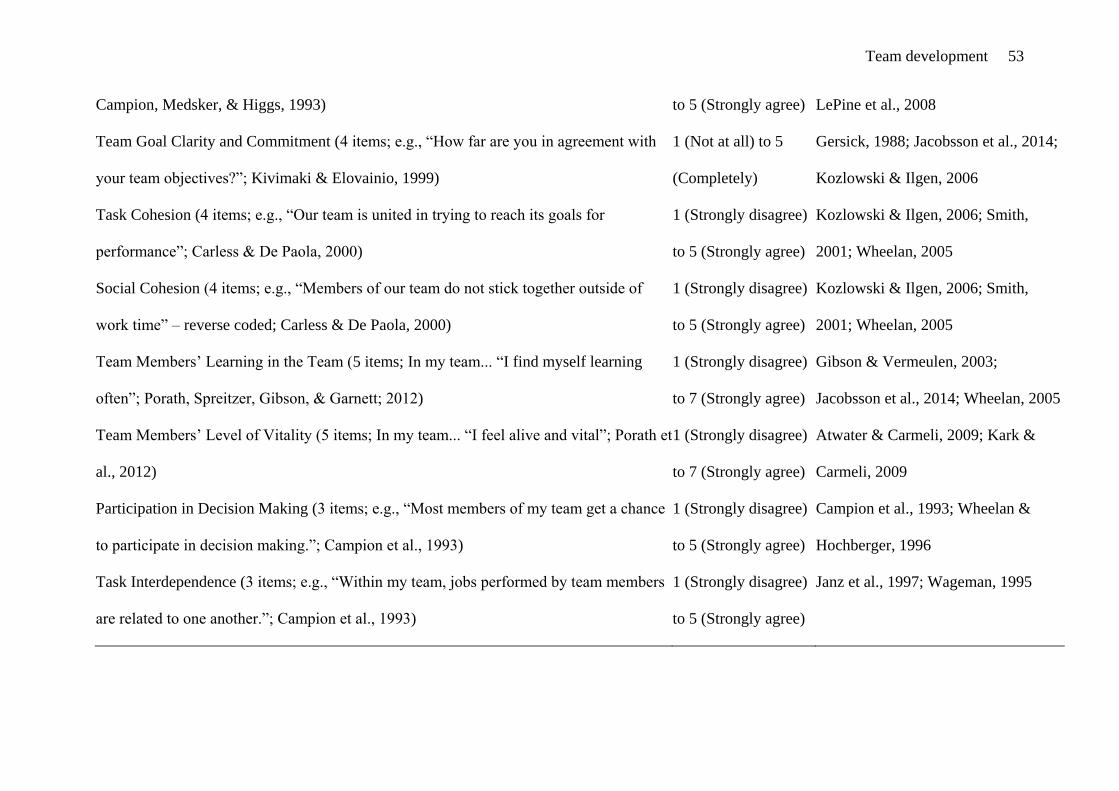
Team development 53
Campion, Medsker, & Higgs, 1993) to 5 (Strongly agree) LePine et al., 2008
Team Goal Clarity and Commitment (4 items; e.g., “How far are you in agreement with
your team objectives?”; Kivimaki & Elovainio, 1999)
1 (Not at all) to 5
(Completely)
Gersick, 1988; Jacobsson et al., 2014;
Kozlowski & Ilgen, 2006
Task Cohesion (4 items; e.g., “Our team is united in trying to reach its goals for
performance”; Carless & De Paola, 2000)
1 (Strongly disagree)
to 5 (Strongly agree)
Kozlowski & Ilgen, 2006; Smith,
2001; Wheelan, 2005
Social Cohesion (4 items; e.g., “Members of our team do not stick together outside of
work time” – reverse coded; Carless & De Paola, 2000)
1 (Strongly disagree)
to 5 (Strongly agree)
Kozlowski & Ilgen, 2006; Smith,
2001; Wheelan, 2005
Team Members’ Learning in the Team (5 items; In my team... “I find myself learning
often”; Porath, Spreitzer, Gibson, & Garnett; 2012)
1 (Strongly disagree)
to 7 (Strongly agree)
Gibson & Vermeulen, 2003;
Jacobsson et al., 2014; Wheelan, 2005
Team Members’ Level of Vitality (5 items; In my team... “I feel alive and vital”; Porath et
al., 2012)
1 (Strongly disagree)
to 7 (Strongly agree)
Atwater & Carmeli, 2009; Kark &
Carmeli, 2009
Participation in Decision Making (3 items; e.g., “Most members of my team get a chance
to participate in decision making.”; Campion et al., 1993)
1 (Strongly disagree)
to 5 (Strongly agree)
Campion et al., 1993; Wheelan &
Hochberger, 1996
Task Interdependence (3 items; e.g., “Within my team, jobs performed by team members
are related to one another.”; Campion et al., 1993)
1 (Strongly disagree)
to 5 (Strongly agree)
Janz et al., 1997; Wageman, 1995
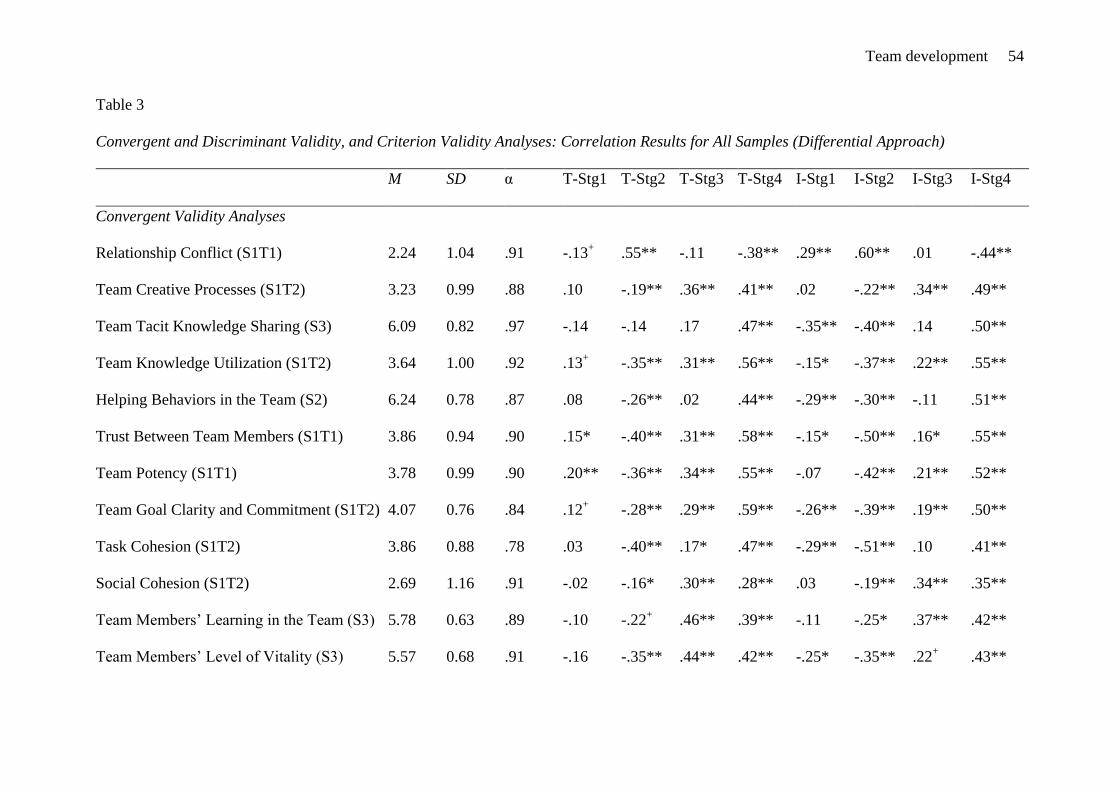
Team development 54
Table 3
Convergent and Discriminant Validity, and Criterion Validity Analyses: Correlation Results for All Samples (Differential Approach)
M SD α T-Stg1 T-Stg2 T-Stg3 T-Stg4 I-Stg1 I-Stg2 I-Stg3 I-Stg4
Convergent Validity Analyses
Relationship Conflict (S1T1) 2.24 1.04 .91 -.13+ .55** -.11 -.38** .29** .60** .01 -.44**
Team Creative Processes (S1T2) 3.23 0.99 .88 .10 -.19** .36** .41** .02 -.22** .34** .49**
Team Tacit Knowledge Sharing (S3) 6.09 0.82 .97 -.14 -.14 .17 .47** -.35** -.40** .14 .50**
Team Knowledge Utilization (S1T2) 3.64 1.00 .92 .13+ -.35** .31** .56** -.15* -.37** .22** .55**
Helping Behaviors in the Team (S2) 6.24 0.78 .87 .08 -.26** .02 .44** -.29** -.30** -.11 .51**
Trust Between Team Members (S1T1) 3.86 0.94 .90 .15* -.40** .31** .58** -.15* -.50** .16* .55**
Team Potency (S1T1) 3.78 0.99 .90 .20** -.36** .34** .55** -.07 -.42** .21** .52**
Team Goal Clarity and Commitment (S1T2) 4.07 0.76 .84 .12+ -.28** .29** .59** -.26** -.39** .19** .50**
Task Cohesion (S1T2) 3.86 0.88 .78 .03 -.40** .17* .47** -.29** -.51** .10 .41**
Social Cohesion (S1T2) 2.69 1.16 .91 -.02 -.16* .30** .28** .03 -.19** .34** .35**
Team Members’ Learning in the Team (S3) 5.78 0.63 .89 -.10 -.22+ .46** .39** -.11 -.25* .37** .42**
Team Members’ Level of Vitality (S3) 5.57 0.68 .91 -.16 -.35** .44** .42** -.25* -.35** .22+ .43**
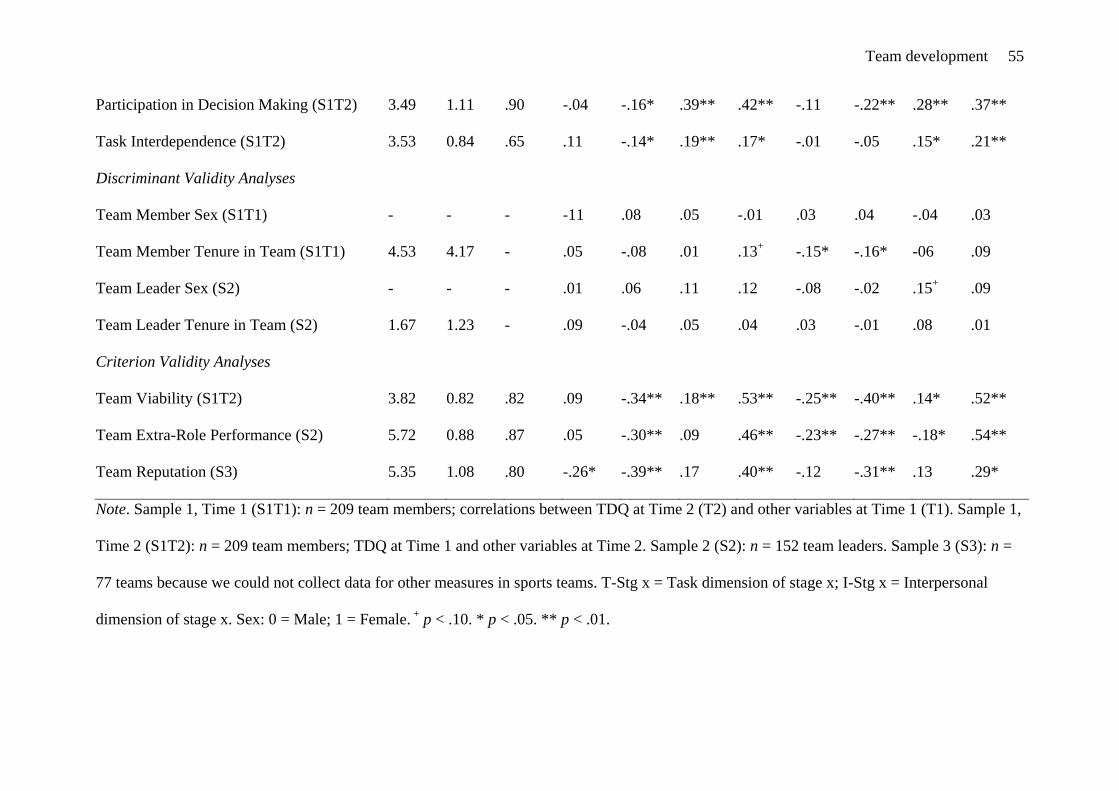
Team development 55
Participation in Decision Making (S1T2) 3.49 1.11 .90 -.04 -.16* .39** .42** -.11 -.22** .28** .37**
Task Interdependence (S1T2) 3.53 0.84 .65 .11 -.14* .19** .17* -.01 -.05 .15* .21**
Discriminant Validity Analyses
Team Member Sex (S1T1) - - - -11 .08 .05 -.01 .03 .04 -.04 .03
Team Member Tenure in Team (S1T1) 4.53 4.17 - .05 -.08 .01 .13+ -.15* -.16* -06 .09
Team Leader Sex (S2) - - - .01 .06 .11 .12 -.08 -.02 .15+ .09
Team Leader Tenure in Team (S2) 1.67 1.23 - .09 -.04 .05 .04 .03 -.01 .08 .01
Criterion Validity Analyses
Team Viability (S1T2) 3.82 0.82 .82 .09 -.34** .18** .53** -.25** -.40** .14* .52**
Team Extra-Role Performance (S2) 5.72 0.88 .87 .05 -.30** .09 .46** -.23** -.27** -.18* .54**
Team Reputation (S3) 5.35 1.08 .80 -.26* -.39** .17 .40** -.12 -.31** .13 .29*
Note. Sample 1, Time 1 (S1T1): n = 209 team members; correlations between TDQ at Time 2 (T2) and other variables at Time 1 (T1). Sample 1,
Time 2 (S1T2): n = 209 team members; TDQ at Time 1 and other variables at Time 2. Sample 2 (S2): n = 152 team leaders. Sample 3 (S3): n =
77 teams because we could not collect data for other measures in sports teams. T-Stg x = Task dimension of stage x; I-Stg x = Interpersonal
dimension of stage x. Sex: 0 = Male; 1 = Female. +
p < .10. * p < .05. ** p < .01.
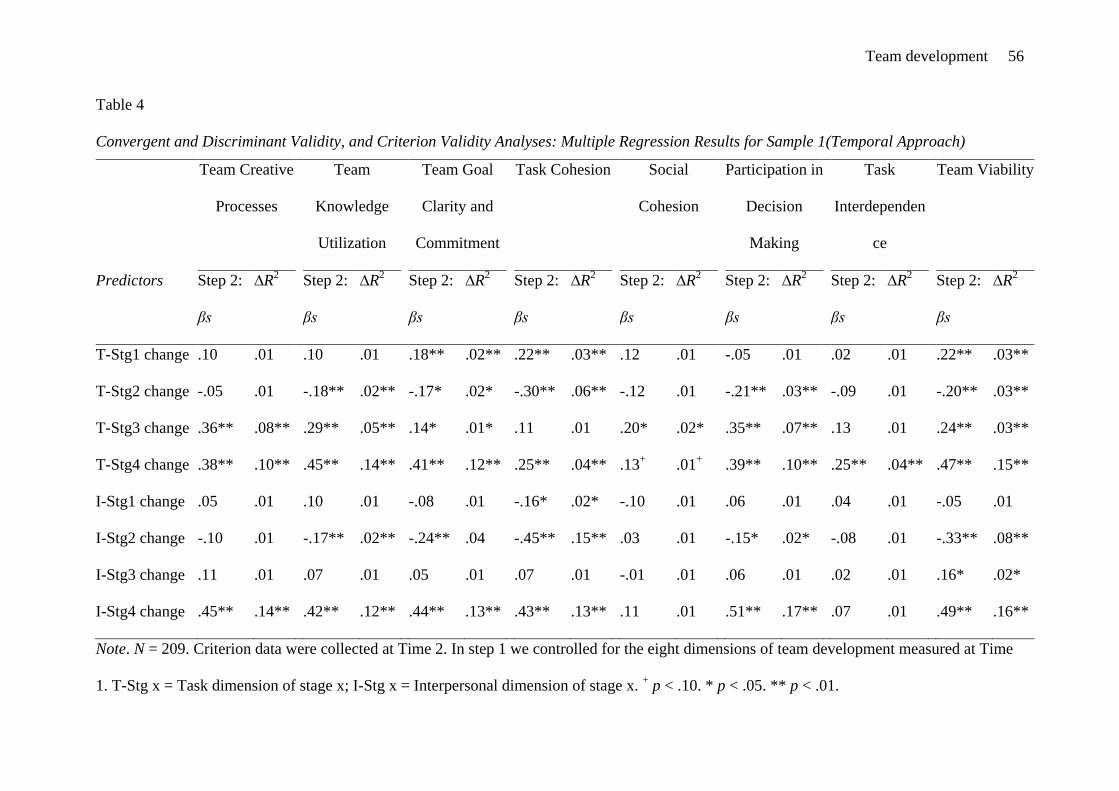
Team development 56
Table 4
Convergent and Discriminant Validity, and Criterion Validity Analyses: Multiple Regression Results for Sample 1(Temporal Approach)
Team Creative
Processes
Team
Knowledge
Utilization
Team Goal
Clarity and
Commitment
Task Cohesion Social
Cohesion
Participation in
Decision
Making
Task
Interdependen
ce
Team Viability
Predictors Step 2:
βs
∆R2 Step 2:
βs
∆R2 Step 2:
βs
∆R2 Step 2:
βs
∆R2 Step 2:
βs
∆R2 Step 2:
βs
∆R2 Step 2:
βs
∆R2 Step 2:
βs
∆R2
T-Stg1 change .10 .01 .10 .01 .18** .02** .22** .03** .12 .01 -.05 .01 .02 .01 .22** .03**
T-Stg2 change -.05 .01 -.18** .02** -.17* .02* -.30** .06** -.12 .01 -.21** .03** -.09 .01 -.20** .03**
T-Stg3 change .36** .08** .29** .05** .14* .01* .11 .01 .20* .02* .35** .07** .13 .01 .24** .03**
T-Stg4 change .38** .10** .45** .14** .41** .12** .25** .04** .13+ .01
+ .39** .10** .25** .04** .47** .15**
I-Stg1 change .05 .01 .10 .01 -.08 .01 -.16* .02* -.10 .01 .06 .01 .04 .01 -.05 .01
I-Stg2 change -.10 .01 -.17** .02** -.24** .04 -.45** .15** .03 .01 -.15* .02* -.08 .01 -.33** .08**
I-Stg3 change .11 .01 .07 .01 .05 .01 .07 .01 -.01 .01 .06 .01 .02 .01 .16* .02*
I-Stg4 change .45** .14** .42** .12** .44** .13** .43** .13** .11 .01 .51** .17** .07 .01 .49** .16**
Note. N = 209. Criterion data were collected at Time 2. In step 1 we controlled for the eight dimensions of team development measured at Time
1. T-Stg x = Task dimension of stage x; I-Stg x = Interpersonal dimension of stage x. + p < .10. * p < .05. ** p < .01.
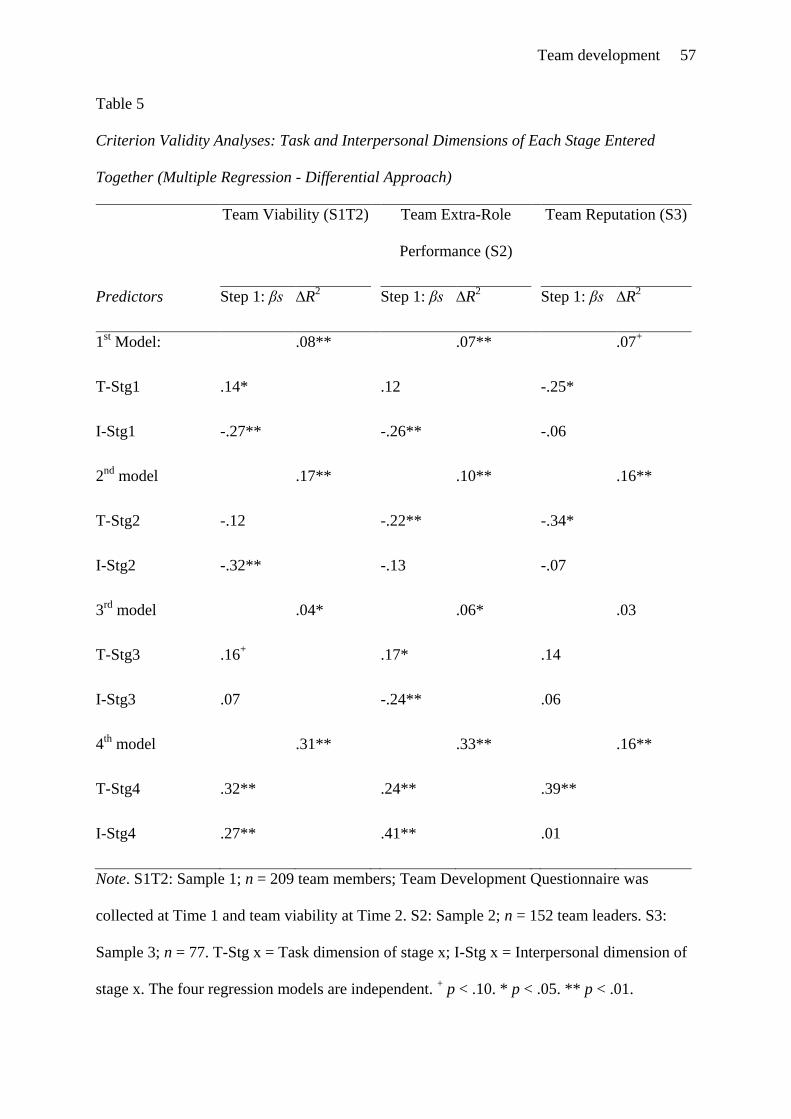
Team development 57
Table 5
Criterion Validity Analyses: Task and Interpersonal Dimensions of Each Stage Entered
Together (Multiple Regression - Differential Approach)
Team Viability (S1T2) Team Extra-Role
Performance (S2)
Team Reputation (S3)
Predictors Step 1: βs ∆R2 Step 1: βs ∆R
2 Step 1: βs ∆R
2
1st Model: .08** .07** .07
+
T-Stg1 .14* .12 -.25*
I-Stg1 -.27** -.26** -.06
2nd
model .17** .10** .16**
T-Stg2 -.12 -.22** -.34*
I-Stg2 -.32** -.13 -.07
3rd
model .04* .06* .03
T-Stg3 .16+ .17* .14
I-Stg3 .07 -.24** .06
4th
model .31** .33** .16**
T-Stg4 .32** .24** .39**
I-Stg4 .27** .41** .01
Note. S1T2: Sample 1; n = 209 team members; Team Development Questionnaire was
collected at Time 1 and team viability at Time 2. S2: Sample 2; n = 152 team leaders. S3:
Sample 3; n = 77. T-Stg x = Task dimension of stage x; I-Stg x = Interpersonal dimension of
stage x. The four regression models are independent. + p < .10. * p < .05. ** p < .01.