Embed Size (px)
Citation preview

IZA DP No. 3871
Teachers’ Training, Class Size and Students’ Outcomes:Learning from Administrative Forecasting Mistakes
Pascal BressouxFrancis KramarzCorinne Prost
DI
SC
US
SI
ON
PA
PE
R S
ER
IE
S
Forschungsinstitutzur Zukunft der ArbeitInstitute for the Studyof Labor
December 2008

Teachers’ Training, Class Size and
Students’ Outcomes: Learning from Administrative Forecasting Mistakes
Pascal Bressoux Université de Grenoble
Francis Kramarz
CREST, CEPR, IFAU and IZA
Corinne Prost CREST, EHESS Paris-Jourdan
Discussion Paper No. 3871 December 2008
IZA
P.O. Box 7240 53072 Bonn
Germany
Phone: +49-228-3894-0 Fax: +49-228-3894-180
E-mail: [email protected]
Any opinions expressed here are those of the author(s) and not those of IZA. Research published in this series may include views on policy, but the institute itself takes no institutional policy positions. The Institute for the Study of Labor (IZA) in Bonn is a local and virtual international research center and a place of communication between science, politics and business. IZA is an independent nonprofit organization supported by Deutsche Post World Net. The center is associated with the University of Bonn and offers a stimulating research environment through its international network, workshops and conferences, data service, project support, research visits and doctoral program. IZA engages in (i) original and internationally competitive research in all fields of labor economics, (ii) development of policy concepts, and (iii) dissemination of research results and concepts to the interested public. IZA Discussion Papers often represent preliminary work and are circulated to encourage discussion. Citation of such a paper should account for its provisional character. A revised version may be available directly from the author.

IZA Discussion Paper No. 3871 December 2008
ABSTRACT
Teachers’ Training, Class Size and Students’ Outcomes: Learning from Administrative Forecasting Mistakes*
This paper studies the impact of different teacher and class characteristics on third graders’ outcomes. It uses a feature of the French system in which some novice teachers start their jobs before receiving any training. Three categories of teachers are included in the sample: experienced teachers, trained novice teachers and untrained novice teachers. To identify the effects, we use administrative mistakes in forecasting the number of teachers. We find that trained and untrained novice teachers are assigned to similar classes, whereas experienced teachers have better students located in better environments. Hence, in order to match similar students and classes, we focus on pupils with novice teachers and discard those with experienced teachers. In addition, we show that the same sample can be used to estimate the causal effect of class size on students’ outcomes. Our findings are: (1) teachers’ training substantially improves students’ test scores in mathematics; (2) this training effect does not rely on different teaching practices, but mainly on subject matter competence; untrained teachers who majored in sciences at university improve their students’ achievement as much as trained teachers do; (3) the class size effect is substantial and significant; class size does not seem to be correlated with instructional practices; (4) teachers’ training does not improve the scores of initially low-achieving students and classes; on the contrary, a smaller class is more beneficial to low-achieving students within classes and to all students in low-achieving classes. JEL Classification: I21 Keywords: teachers’ training, class size Corresponding author: Francis Kramarz CREST 15, bd Gabriel Péri 92245 Malakoff Cedex France E-mail: [email protected]
* We have benefited from helpful comments by participants in the labor economics workshop at Cornell University, the seminar of the Department of Evaluation of the Ministry of Education (Direction de l’Evaluation et de la Prospective), the CEPR-EEEPE network meeting in Amsterdam, the 2006 ASSA meetings (Boston), the TARGET conference in Vancouver, the INED seminar (Institut National d’Etudes Demographiques), and the RES 2008 conference in Warwick. We are particularly grateful to Ronald Ehrenberg, Caroline Hoxby, Robert Hutchens, George Jakubson, Eric Maurin and Christopher Taber for their comments and suggestions.

1 Introduction
Several papers find a large variability in the extent to which teachers promote
student learning.2 Yet little evidence has been found that any observable teacher
characteristic explain a large part of this variation. Teacher experience, at least the very
first years of experience, seems to have a small positive impact on student achievement
(Rivkin, Hanushek and Kain, 2005, Clotfelter, Ladd and Vigdor, 2006). As for the impact
of teachers’ academic training, the results are mixed. Some studies show that measures of
academic skills are positively related to teacher effectiveness: verbal ability, subject
matter preparation, quality of a teacher’s undergraduate college, test scores. Yet it seems
that teachers holding master’s degrees are not more effective (Ehrenberg and Brewer,
1994; Ehrenberg and Brewer, 1995, Clotfelter, Ladd and Vigdor, 2006).
Few studies have specified the impact of professional training in developed
countries. In the US, some recent papers try to assess the effects of certified programs
and those of new programs with reduced requirements prior to teaching (Kane, Rockoff
and Staiger, 2006; Boyd et al., 2005). Few effects are found and they are at most small.
On the contrary, two papers find a large impact of training in other countries. In
France, Bressoux (1996) studies the effect of teachers’ training on third-grade pupils’
achievement, comparing certified and uncertified teachers. Bressoux finds that training
substantially improves students’ scores in mathematics. Angrist and Lavy (2001),
evaluating the effect of in-service teacher training in Jerusalem schools, find a
significantly positive causal effect of this program on pupils’ test scores. Their cost-
effectiveness analysis suggests that teacher training may provide a less costly means of
improving pupil achievement scores than reducing class size or adding school hours.
Importantly though, the experiment used in Bressoux (1996) is not randomized.
The ideal situation would involve the random assignment of pupils to the different types
of teachers. In fact, Bressoux (1996) uses a specific survey on third-grade students and
teachers in 1991, including three types of teachers: untrained novice teachers, trained
novice teachers, experienced teachers. Yet the data show that classes differ according to
the teachers’ status. Hence, in the absence of random assignment, Bressoux estimates the
2 See, for instance, Rivkin, Hanushek and Kain (2005) and Rockoff (2004).
2

impact of training using regressions controlling for numerous variables. The estimated
effect is the causal one if no unobserved student or class characteristic is correlated with
the teacher’s type and with the student’s test scores. Otherwise, estimates are potentially
biased.
This paper explores more thoroughly the quasi-experimental design of the same
data. The strategy relies on the specificity of experienced teachers. The fact that the
allocation of classes is not random is virtually only due to experienced teachers, who can
choose their schools, and who often choose advantaged zones. It is well known that the
effect of teacher experience on student achievement is difficult to assess because teachers
are sorted across schools, more experienced teachers often working in schools with
affluent students (for a recent paper on this topic, see Clotfelter, Ladd, Vigdor, 2006).
But, in principle and in the data, trained and untrained novice teachers are assigned to
almost similar classes. So our paper uses the fact that, when excluding experienced
teachers, we are faced with a quasi-randomized design. Furthermore, because the quality
of these trained and untrained novice teachers might differ, our identification strategy
relies on administrative mistakes in forecasting the number of teachers, mistakes that
appear to have only taken place in the year we study. In addition, and as usual in this
literature, we check the robustness of our assumptions on our observable variables.
The data used here are very rich. The unit of observation is the student, a very
important element for this kind of analysis (see Summers and Wolfe, 1977). Multiple
students’ characteristics are collected and students’ achievement is extremely precisely
measured by detailed test scores at the beginning and at the end of the year. Furthermore,
all students within a third-grade classroom are included in the sample. This gives us an
opportunity to control for class effects. In addition, teachers provide a lot of information
on their personal characteristics, their teaching practices, as well as characteristics of their
classes and their schools.
A first aim of this paper is to check that Bressoux’s findings on training – better
trained teachers induce higher students’ outcomes – are robust. To perform this task, we
control for the endogenous allocation of classes by excluding experienced teachers, in
order to estimate the causal effect of training of novice teachers on pupils. Particular
attention is given to heterogeneous effects. A second goal is to see if some particular
3

characteristics of the teachers, such as their university background (which was not used in
Bressoux, 1996), have any impact on their students’ outcomes. This paper also examines
other class characteristics, more particularly class size. Indeed, when excluding
experienced teachers, it appears that class size is not correlated with pupils’ initial test
scores. There is no sign of a relation between class sizes and class mean initial
achievement or class socio-economic background. Thus, it seems that no selection bias in
class size allocation is present when our sample is restricted to novice teachers.
Consequently, we use similar methods to assess the effect of class size as were used to
estimate the effect of training effect.
The findings on the training effect are very close to those found by Bressoux
(1996): the training of novice teachers largely promotes students’ learning in
mathematics. Yet it seems that within classes, less able students do not benefit from their
teachers’ training. By the same token, classes with a low initial average achievement are
no better off with a trained teacher. It seems that training does not help to improve scores
for the initially less advantaged students and classes.
We also find that teachers’ education background has a significant impact since
untrained teachers who majored in sciences at university have the same effect on pupils’
outcomes as trained teachers. Furthermore, training does not change teachers’ teaching
practices. It seems that the positive effect of training is due to a better subject matter
competence.
Concerning the class size effect, we find substantial effects on third-grade test
scores. These results are close to the findings of Piketty (2004) on the effect of the size of
French second-grade classes, and close to the results analyzing the Tennessee STAR
experiment.3 It appears that the effect is similar on students’ reading scores within the
classes; it is larger for less able pupils in mathematics. Moreover, a smaller class size has
a more favorable impact on students’ scores when students are in a low-achieving class, a
potential consequence of higher frequencies of disruptions in such classes, as described in
3 See for instance Krueger (1999). The estimation of the class size effect continues to yield a huge literature. For some recent papers on the topic, see among many others Angrist and Lavy (1999), Ehrenberg, Brewer, Gamoran and Willms (2001), Hanushek (2003), Hoxby (2000), Krueger (2003), Woessman and West (2006).
4

Lazear (2001). Furthermore, no apparent relation can be found between class size and
teaching practices.
The paper is organized as follows. Following a description of the design and the
data in Section 2, Section 3 describes the statistical model and the empirical tests for
evidence of non-random differences in the observable characteristics. Section 4 and 5
reports the estimation results for the training effect and the class size effect. Section 6
concludes.
2 Institutional background and data
2.1 A quasi-experimental design
In France, teachers in public schools are civil-servants recruited and paid by the
State. Recruitment is based on competitive examinations which usually have low
acceptance rates (at the end of the 1990’s, there were often more than five applicants for
each primary school teacher new position). To take the examination, students are required
to have a diploma in any academic field, corresponding to at least two years in a
university.4 When the students pass the examination, they become civil servants in
traineeship and are trained in specific colleges. After their traineeship, young teachers get
tenure. During the period this paper studies, the beginning of the 1990’s, the teacher
training colleges were called ‘écoles normales’ and students were trained during two
years.5
Thus teachers are usually seen as a homogeneous professional group of persons,
with equivalent credentials and the same training. Yet, each year, in France at least, some
novice teachers start their job without any training.
The number of slots in the training colleges is limited and determined each year
by the regional administration, using forecasts for teachers’ positions. All applicants are
ranked according to their grades in this examination. The students ranked first enter the
4 Since 1992, the requirement to take the exam is a three-year-university diploma. 5 France is geographically divided into administrative ‘départements’ and there was an ‘école normale’ in each ‘département’. In 1991, the ‘écoles normales’ were closed and since then, the new teacher training colleges were called university teacher training institutes ‘Instituts Universitaires de Formation des Maitres (IUFM)’ and started to depend administratively on a region (a region includes several departments). The new training period (after the exam) became one year.
5
‘école normale’ and begin their training. Students who are ranked just after the last
admitted candidate on this primary list are assigned and ranked within a waiting list.
In September, the number of vacant job slots is often greater than the one
expected two years earlier. Students who have finished their training at the ‘école
normale’ are assigned to some of these job slots, and, in October, some students in the
waiting list are assigned to the vacant slots. Hence, these persons have to teach a class for
an entire school-year without receiving any training. They enter the ‘école normale’ the
year after.
This special feature of the French system gives the opportunity to compare
teachers who were trained with teachers who were not. Yet it is not obvious that
comparing the effectiveness between untrained and trained novice teachers could give an
estimate of the impact of training on student achievement. In fact, there are two potential
sources of selection bias between trained and untrained novice teachers. The first
potential source of bias stems from the fact that trained novice teachers are not exactly
similar to untrained teachers: in principle, they have better rankings at the entrance
examination than untrained beginners, who come from the waiting list. This should mean
that initial academic knowledge for trained teachers is wider. Yet the rankings of the
untrained teachers depend on the year of the exam, and the number of persons directly
selected through the primary list. And for any given year (prior to 1992), untrained
beginners have taken the exam the same year whereas trained beginners have taken the
exam two years earlier. So they were ranked by two different exams taking place in two
different years.
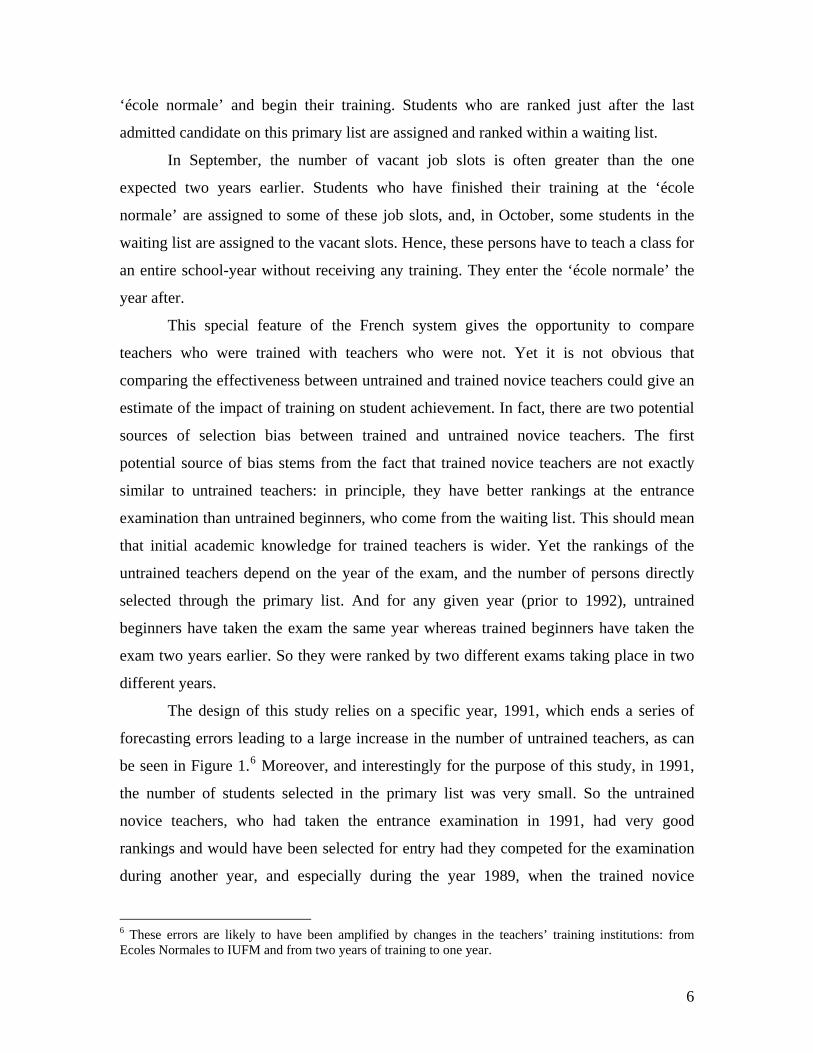
The design of this study relies on a specific year, 1991, which ends a series of
forecasting errors leading to a large increase in the number of untrained teachers, as can
be seen in Figure 1.6 Moreover, and interestingly for the purpose of this study, in 1991,
the number of students selected in the primary list was very small. So the untrained
novice teachers, who had taken the entrance examination in 1991, had very good
rankings and would have been selected for entry had they competed for the examination
during another year, and especially during the year 1989, when the trained novice
6 These errors are likely to have been amplified by changes in the teachers’ training institutions: from Ecoles Normales to IUFM and from two years of training to one year.
6

teachers we examine passed their entrance competitive exam. Thus this type of selection
bias is likely to be very small.
The second source of bias may come from the usual problem with non-
experimental design in education: the assignment of the various types of teachers to
classes is non-random and may be related to student achievement. In France, schools do
not hire their teachers. Instead, the system of job assignment is centralized and depends
on the teachers’ choices. When the choices of different teachers are the same, the final
assignments depend on the years of experience and on a mark given by the
administration, this mark being well correlated with the years of teaching experience.
Hence, as they accumulate experience, teachers are able to choose the schools they want,
and mostly go from disadvantaged schools to advantaged ones.
On the contrary, novice teachers have much less opportunities to choose their
schools and mostly go to schools that have not been chosen by experienced teachers.
Nevertheless, there are potentially two reasons of sorting for trained and untrained novice
teachers and those reasons would have opposite results. On the one hand, trained novice
teachers choose first, so they may choose the best schools. On the other hand, some new
slots open between September and October, when jobs are allocated to untrained
teachers. These new slots are due to unexpected quits of experienced teachers and can be
in good schools (after accidents, diseases, deaths, changes in careers,…). Nevertheless, it
should be noted that experienced teachers are not only able to work in the best schools,
but are also often allocated to the best classes inside their schools. Finally, it is likely that
novice teachers have on average similar classes, being trained or untrained. In the
following of the paper, we will test this hypothesis using observables.
2.2 The data
The data come from a survey conducted by the French Ministry of Education in
the school year 1991-1992, in 12 ‘départements’. The sample covers third-grade students
(8 years old) and their teachers: in French primary schools (1st grade to 5th grade),
students only have one teacher, who teaches all disciplines. The data explicitly includes
the three categories of teachers: untrained novice teachers, trained novice teachers and
experienced teachers. The sampled teachers were teaching in third-grade classes or in
7

multi-grade classes including third graders. In the 12 ‘départements’ selected, all novice
teachers were surveyed while experienced teachers were chosen randomly. All third-
graders in the same class were included. Finally, the survey covers 4,001 students and
197 teachers. The numbers of teachers within each category are not perfectly balanced:
there are 96 experienced teachers, 65 trained novice teachers and 36 untrained novice
teachers.7
The information about the students is comprehensive: parents’ occupations, sex,
date of birth, nationality (French or not), number of siblings, number of years spent in a
pre-elementary school, repeated classes. In addition, two sets of scores are available in
the data. In France, there is national testing of all pupils just at the beginning of the third
grade, both in reading and mathematics. The reading tests comprise grammar,
vocabulary, spelling and reading comprehension per se. The mathematics tests comprise
arithmetic, geometry and problem-solving. For this specific survey, covered pupils were
also tested at the end of the school year in both subjects, using a design similar to that
prevailing in the entry tests. These both sets of scores are normalized in this paper, with a
standard error of 1.
In addition, teachers had to answer a questionnaire on their personal
characteristics, on their teaching practices, and on the characteristics of their classes and
their schools. The main variables used in the following are the field of specialization of
the teacher during his/her studies at the university (sciences, humanities, unknown,
other), the class size, the fact that the class is a combination class mixing students from
different grades, the category of the area of the school (rural, semi-rural, urban), and the
priority status. The class size is not known for 35 classes. Yet when the class size is
known and the class comprises only third-graders, the class size variable is equal or close
to the number of students at the end of the year, measured by the number of third-graders
enrolled in the final test. Thus the unknown class sizes are imputed at this number, except
for 8 classes which mix students of different grades. Finally, the mean of the class sizes is
23.9 students per class, with a standard deviation of 4.1. By comparison with data on all
7 These statistics are slightly different from the ones in Bressoux (1996) because of some small differences in the methods for matching the student data and the teacher data.
8

elementary schools, Piketty (2004) finds that the average class size in the primary schools
(first grade to fifth grade) is close to 23.3 in the school year 1991-1992.
Descriptive statistics are given in Table 1. In general, the fraction of missing
values is small, except for some variables like test scores where it can amount to 15%.
This attrition for test scores is due to many reasons. A few students were present at the
beginning of the year, and then moved to another class or school and are not observed at
the end of the year. The opposite is true: a few students were not enrolled in the class at
the beginning of the year but are present at the end. Moreover, some students are
observed in the data but some of their test scores are missing, probably because they were
not present in class when the tests were conducted. In addition, in some classes, all the
scores are missing. Finally, the scores of initial or final reading tests are not known for
981 students, including 9 entire classes, and the scores of math tests are not known for
778 students, including 4 entire classes. Besides, seven classes display atypical mean
scores in mathematics: Figure 2 shows that initial mean scores in mathematics and in
reading in each class are well correlated except for these seven classes which have
unusually weak mean score in mathematics. Thus the scores in mathematics for these
classes were suppressed.
Each test comprises four exercises. The test score is obtained by adding up the
scores of each exercise. Within each test (initial reading, final reading, initial math, final
math), the scores of these exercises are very well correlated. We use this result to impute
the total score of those students for whom only one exercise score is missing, through a
regression of the total score on the scores of the three other exercises. It is possible to do
this imputation for 680 test scores. After this imputation, test scores are missing in 13
entire classes.8
Eventually, this attrition and these imputations should not induce any bias: Table
1 shows that the characteristics of the balanced sample, encompassing students whose
scores and class sizes are known or imputed, do not significantly differ from those of all
the students. It seems that the absence of information on the scores or the class sizes have
random origins.
8 For all our results, we checked that they were similar without these imputations, which it is the case.
9

The data show that the aggregate characteristics of pupils vary with teachers’
types (see Table 2). Indeed, experienced teachers have on average better classes. In these
classes, compared to those with novice teachers, initial scores are higher, the share of
non-French pupils is lower, children have fewer siblings, fathers and mothers have more
often a high occupation and students less often repeated the first grade. In addition,
schools are less often in a priority educational area.9 Besides, experienced teachers work
more often in large classes.
By contrast, the classes with trained novice teachers and the classes with
untrained novice teachers are essentially similar. The Chi-squared tests do not reject the
hypothesis that students are the identical whether their teachers are trained or untrained,
except for the size of the family. As for school-level variables, trained novice teachers are
more often located in urban areas and in priority zones than untrained novice teachers.
Figure 3 shows the class means of scores according to teachers’ type. It confirms
what we described based teachers’ mobility rules: experienced teachers often have better
classes than novice teachers. On the contrary, trained and untrained novice teachers seem
to have been assigned to more similar classes as measured by their mean scores. More
precisely, untrained beginners seem to work in slightly better classes, which could bias
downwards the estimation of the training effect. Furthermore, we looked at various
characteristics of novice teachers, comparing trained and untrained. They look very
similar as should be expected.
3 Statistical methods
To assess the trained teachers’ effectiveness in raising student achievement, we
estimate the following regression at the student level:
(1) εγδββα +++++= ZTXXSS ici
ci
ii
fi
where and are the final and initial test score of student i , represents student
characteristics, is the characteristics of student i ’s classroom, is the category of
student ’s teacher and
fiS
i
iiS
ciX
iX
iT
γZ is the estimation of random class effects. This latter
component allows us to take into account the correlation between students within classes,
9 Priority educational areas are enrolled in a specific program which will be briefly described below.
10

since class variables may be not sufficient to control for these correlations. It is important
to incorporate class effects; otherwise, the standard deviations could be underestimated,
as it would be the case with OLS estimation (see Moulton, 1986). However, Moulton
stresses the problem of the precision of coefficient estimates, but he also shows that the
coefficients may be different when the estimation incorporates random class effects
without imposing the absence of correlation between these effects and the other
covariates. Indeed, this kind of estimation results in substantial gains in efficiency.
Throughout this paper, class effects are estimated through the resulting mixed models
(see Robinson, 1991). These models allow a general specification of class effects, fixed
effects being only a specific case within such a specification. In this mixed models
setting, identification of class effects uses more information than “classic” fixed effects
models -- the variance of the class effects instead of only the mean, thanks to a more
general prior distribution (see appendix A).
Bressoux (1996) estimates the training effect through an equation similar to (1).
Since experienced teachers have on average better classes, Bressoux (1996) assumes that
this selection bias can be controlled for by using observed variables, including initial test
scores. The causal interpretation of the coefficients related to the type of teacher relies on
the assumption that no selection bias comes from unobserved variables.
This paper explores the issue of this non-randomized design, and assesses the
robustness of the teachers’ training effects found in Bressoux (1996). Our strategy is to
check the extent of the potential bias using the observable variables. This is done through
the regression of initial test scores on student and teacher characteristics:
(2) εγδββ ~~~~~++++= ZTXXS i
ci
ci
ii
The estimated coefficient shows whether the assignment of classes across the
categories of teachers can be considered as random or not. If the coefficient
δ~
δ~ is
significantly different from zero, it means that the assignment is non-random since the
students have not been exposed to these teachers’ teaching yet. If the coefficient δ~ is not
significant, this is a good sign that the assignment can be considered as random. Yet δ~
can be insignificantly different from zero because of a large standard deviation rather
11
than a small coefficient. Thus the strategy will be to systematically compare δ~ with δ ,
estimated on final scores.10
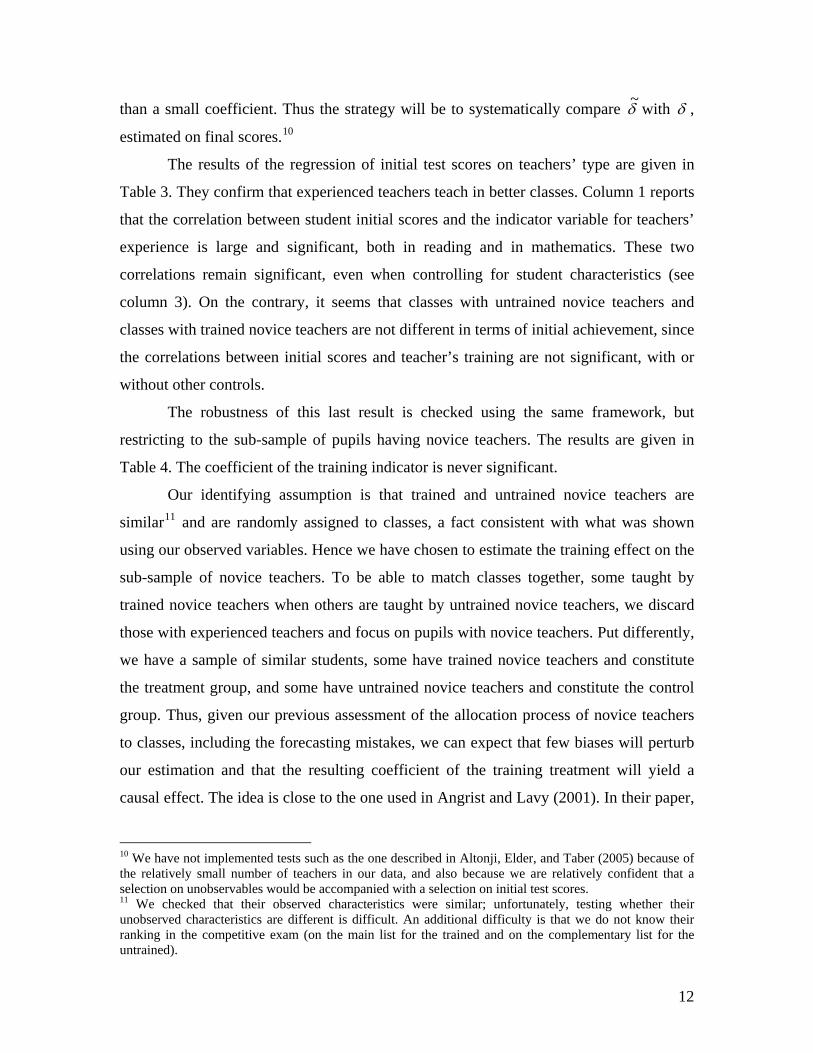
The results of the regression of initial test scores on teachers’ type are given in
Table 3. They confirm that experienced teachers teach in better classes. Column 1 reports
that the correlation between student initial scores and the indicator variable for teachers’
experience is large and significant, both in reading and in mathematics. These two
correlations remain significant, even when controlling for student characteristics (see
column 3). On the contrary, it seems that classes with untrained novice teachers and
classes with trained novice teachers are not different in terms of initial achievement, since
the correlations between initial scores and teacher’s training are not significant, with or
without other controls.
The robustness of this last result is checked using the same framework, but
restricting to the sub-sample of pupils having novice teachers. The results are given in
Table 4. The coefficient of the training indicator is never significant.
Our identifying assumption is that trained and untrained novice teachers are
similar11 and are randomly assigned to classes, a fact consistent with what was shown
using our observed variables. Hence we have chosen to estimate the training effect on the
sub-sample of novice teachers. To be able to match classes together, some taught by
trained novice teachers when others are taught by untrained novice teachers, we discard
those with experienced teachers and focus on pupils with novice teachers. Put differently,
we have a sample of similar students, some have trained novice teachers and constitute
the treatment group, and some have untrained novice teachers and constitute the control
group. Thus, given our previous assessment of the allocation process of novice teachers
to classes, including the forecasting mistakes, we can expect that few biases will perturb
our estimation and that the resulting coefficient of the training treatment will yield a
causal effect. The idea is close to the one used in Angrist and Lavy (2001). In their paper,
10 We have not implemented tests such as the one described in Altonji, Elder, and Taber (2005) because of the relatively small number of teachers in our data, and also because we are relatively confident that a selection on unobservables would be accompanied with a selection on initial test scores. 11 We checked that their observed characteristics were similar; unfortunately, testing whether their unobserved characteristics are different is difficult. An additional difficulty is that we do not know their ranking in the competitive exam (on the main list for the trained and on the complementary list for the untrained).
12

they observe that pupils in the treatment group have initially lower scores than pupils in
the control group. As they would like pupils in the control group to be comparable to
pupils in the treatment group, they match individual pupils on the basis of their initial test
scores, by dividing test scores into quartiles and comparing treatment and control scores
in each quartile. Here, we restrict the sample in order to have similar pupils in the
treatment and control group. But, by contrast with Angrist and Lavy, we keep a
regression strategy, in order to control for the other covariates, and more specifically to
control for class effects.
We will also check the robustness of our results inspiring ourselves from the
treatment literature (the treatment is to have a trained teacher) and matching techniques,
by focusing on the classes sharing a “common support”. For this, we will estimate a
propensity score for a class of having a novice trained teacher, in contrast with having an
untrained one. This propensity score will allow us to focus on the common support of our
classes.
In the last part of the paper, we will apply a similar strategy to estimate the class
size effect. Indeed, Table 3 reports that the correlation between initial scores in reading
and class size is positive and significant when all pupils are included in the regression.
When adding other covariates, this correlation remains significant and positive, even
though the effect is weaker. By contrast, Table 4 reports that even without any other
control, class size is no more correlated with initial scores when we focus on the reduced
sample of students with novice teachers.
Class size is often positively correlated with students’ achievement in countries
with a centralized school system (see Woessman, 2005; Woessman and West, 2006). In
these countries, advantaged schools or districts cannot hire more teachers and the
education system is often organized in order to support less advantaged pupils by
gathering them in small classes whereas more advantaged students are assigned to larger
classes. This can be done within schools as well as between schools, for instance with the
implementation of programs which allocate a greater number of teachers to
disadvantaged schools. This selection bias is one reason why causal effects of class size
can be difficult to measure.
13

In France, the system of assignment of teachers to schools is centralized, and is
not supposed to differentiate between schools in the allocation of resources. The only
official exception is the policy of education priority areas (ZEP, ‘zones d’éducation
prioritaires’). The ZEP policy is a program implemented in 1982, which is supposed to
give more resources to disadvantaged schools (for a description and an assessment of this
program on sixth and seventh graders, see Benabou, Kramarz, Prost, 2005). According to
our data, the classes in the ZEP have on average 23.8 students per class, whereas the
mean class size in the non priority zones is 25.2.12
Rural areas also have schools with smaller classes: because of small enrollments,
classes are often small, even if schools are sometimes organized with combination classes
by mixing students of different grades in the same classroom. Yet the impact in terms of
selection is not clear since pupils in rural schools have better achievement at the
beginning of third grade, but tend to improve less during the year.13
In addition to these sources of bias, due to sorting between schools in response to
the organization of the educational system, biases due to parents’ behavior may also
arise. Some parents may move or enroll their children in a private school when their
children happen to be enrolled in a large class. If these parents are also those who are the
most motivated for their children’s education, it would induce a negative bias. Yet we
believe that if this bias is large, it should appear through the correlation between class
size and initial achievement.
There may also be selection within schools, usually a positive selection, low
achieving students being allocated to the smaller classes.14 This selection is possible in
large schools, when there are several third grade classes. Worthy of note, French schools
are often small with one class per grade (when the enrollment of third-graders exceeds 30
12 The priority zones are more often in urban areas, where classes are larger than in rural areas. So the effective reduction in class size in ZEP schools could be larger than the one given by the raw difference of the two means. A regression of the class size on the dummy variable for ZEP schools, controlling for the rural areas and the combination classes, shows that class size is smaller by 1.75 students in priority zones. 13 We obtain these results with our data. They are consistent with Brizard (1995) and Thaurel-Richard (1995). 14 In the ZEP junior high schools, there is some evidence that enrollment decreases because these areas are avoided by some parents (see Benabou, Kramarz, Prost, 2005). To thwart this shunning, some principals give better conditions to the most affluent students. Yet we do not observe that in the primary schools of our data. On the contrary, as we will see later, the positive correlation between class size and initial achievement is even larger in ZEP schools.
14

students, it does not always entail a new third grade class, but some third graders are
often assigned to a class with students of other grades).15
Still, there are some large schools in urban areas, where student sorting is
possible. Since experienced teachers are more often in urban areas, this may explain why
selection on initial scores can be observed for classes with experienced teachers and not
for novice teachers.
Finally, we will estimate the class size effect, again using the sample that
excludes experienced teachers. As the correlation between class size and observed initial
scores is significant on the whole sample, we suspect that there may also be a selection
on unobserved variables, which could perturb the estimation of the causal effect of class
size on pupils’ achievement. On the contrary, the correlation between class size and
initial scores is not significant for the sub-sample of pupils with novice teachers. Hence
we assume that the “traditional” selection bias is taken care of. Finally, to assess the
robustness of our findings, we will also estimate the class size effect on all the students,
using instrumental variables.
4 Estimation results of the training effect
4.1 Main results
Estimation results of the effects of teacher and class characteristics on pupils
achievement are presented in Table 5a (detailed in Table 5b). It is a regression of final
test scores on initial (and national) test scores, student, teacher, and class characteristics.
The estimation controls for class effects and is estimated on the sub-sample of students
with novice teachers.
The regressions of final test scores include class characteristics. Some class
characteristics can be computed using the average individual characteristics. In particular,
we computed the fraction in the class of students with advantaged parents as measured by
occupations, the fraction of girls, the fraction of non-French students, and the fraction of
students who repeated at least one grade. These variables are calculated for each student,
excluding his/her own characteristics in the calculation of the means. None of these
15 In our data, 77% of the schools have less than 11 classrooms, for 5 grades (1st grade to 5th grade). But urban areas are overrepresented in our sample. In 2006, in France, 62% of the schools have less than 6 classrooms, and 92% less than 11 classrooms.
15

variables yields significant coefficients. They are not included in the specification
presented in this paper.
On the contrary, means and standard deviations of initial test scores within class
have significant correlations with final scores. For the regression of final scores in
reading, the included variables are the class means and standard deviation of initial scores
in reading. Likewise, the means and standard deviation included in the regression of
scores in mathematics are calculated using the initial test scores in mathematics. These
means are also calculated for each student, excluding his/her own characteristics. Table
5b reports the effects of class characteristics on final test scores, and both means and
standard deviations of initial test scores have a negative impact on pupils’ improvement,
meaning that students have better results in homogeneous classes and when the average
achievement is not too high.16
The estimated impact of teachers’ training is not significant for reading
achievement but it is significant and large for mathematics achievement: students gain
one quarter of a standard deviation on their final scores when their teachers have been
trained. This effect should be compared to the coefficient estimated on initial test score
(0.062). The effect on final scores is substantial enough to be confident that it is not
driven by a bias in the assignment of teachers to classes.
These results are close to the findings reported in Bressoux (1996). They are also
close to the raw differences of the means: as can be seen from Table 2, students with
untrained novice teachers have similar initial scores than students with trained novice
teachers; yet, their performance is much lower during the year. The raw difference-in-
difference estimator gives an effect of 0.14 in reading, and 0.25 in mathematics.
Incorporating other covariates decreases the effect in reading, close now to 0.05 and not
significant. The estimation of the regression without class effects would have led to a
significant effect equal to 0.11. Hence incorporating (correlated) random class effects
makes the training coefficient weaker and non significant.
16 This is a raw result which should not lead to any conclusion. Exploring the question of the impact of class homogeneity is not the purpose of this paper.
16

4.2 Training: does it give pure academic skills or better teaching methods?
Our results confirm those in Bressoux (1996): in France, training improves
teachers’ effectiveness in raising their students’ achievement in mathematics. But, there
is no significant effect in reading. It would be very interesting to fully understand what is
efficient in the training: is it the improvement of pure academic skills in mathematics or
the improvement in educational and teaching methodologies?
Our data are not precise enough to thoroughly explore this question. Nevertheless
they include a lot of information about the teachers’ instructional practices. They include
in particular the number of hours per week used for teaching reading or mathematics, the
number of hours asked for homework per week, the practice of organizing the class in
groups, and how these groups are chosen. Yet none of these variables is significantly
correlated to the dummy for trained/untrained teachers.17 So it seems that trained teachers
do not adopt different practices than untrained teachers. Furthermore, these variables
have been tested in the regression of the final test scores on the initial test scores, student
and class characteristics. None of the coefficients are significant, meaning that none of
the practices seem to have better results than others. The small number of classes in the
sample may prevent us from identifying effects that might exist.
The data also give some information about the teachers’ academic backgrounds,
in particular the diploma and the discipline studied at university. So we can add this
information in our regressions. More precisely, we include indicator variables for
teachers having majored in sciences at university (14% of novice teachers) and for
teachers having majored in a discipline not reported in the survey (roughly 14% of novice
teachers). This latter group of teachers comprises some individuals who did not report
this information, potentially because of multiple fields of specialization, as well as a
small number of teachers who did not go to university. Novice teachers are endowed with
similar diplomas since it is compulsory to have a degree equivalent to two years in a
university to enter an ‘école normale’. Yet parents of three or more children and
professional sports-persons are exempt from the diploma requirement. The omitted
category finally comprises those teachers who majored in humanities (often French or
another language, sociology, psychology, history).
17 Results are available from the authors.
17

Table 6 shows the results when differentiating the educational background of
trained and untrained teachers. The first columns give the results on initial scores,
assessing the potential biases in assignment of those different kinds of teachers. The last
columns reveal the effects on final test scores.
Concerning scores in reading, no differential effect can be seen whether the
teacher’s field of specialization is sciences or humanities. Teachers with unknown field
of specialization have large impacts on final test scores. However they also seem to be
assigned to better classes, at least for the untrained teachers. Thus the reason why the
academic specialization is not known is probably non-random.
The results for scores in mathematics are quite revealing. Teachers who majored
in sciences improve their pupils’ mathematics achievements more than other teachers do
even if they are untrained. Actually, trained teacher whose field of specialization is
humanities have a positive impact amounting to 27% of a standard error. Those whose
field of specialization is sciences have an impact equal to 43% (yet not significantly
different from the previous 27%), which is very close to the impact estimated for
untrained teachers whose field of specialization is also sciences (44%). This pattern does
not seem to be driven by initial biases.
Even though the training effect is substantial in mathematics achievements,
teachers who have not been trained, but who have studied mathematics or sciences at
university, compensate for this lack of training. Training seems to be very useful in
improving scientific knowledge for teachers who studied other disciplines in their
university. Hence, even though caution is granted because the sample is small, training
seems to improve teachers’ effectiveness through academic preparation in mathematics
and not through professional training or better teaching methodologies.
4.3 Differential effects
We now estimate heterogeneous training effects, both heterogeneous student
effects and heterogeneous class effects. These effects are measured by interacting the
indicator variable for trained teachers with two types of quartiles, one constructed using
the distribution of students scores within a class, the other constructed using the
distribution of mean class scores across classes.
18

First, to estimate heterogeneous student effects, the quartiles are constructed using
students’ initial test scores in reading and are measured within the class. We include
interactions between the training variable and the student quartile indicators in a unique
regression. Indeed, it is important to keep controlling for class effects. This methodology
allows us to estimate the within-class effect for these student-specific variables.
No significant training effects appear for scores in reading (Table 7). For scores in
mathematics, the training effect is substantial and significant for all students except low-
achieving students. Training helps teachers improve students’ results in mathematics,
except for the least able ones.
Second, to estimate heterogeneous class effects, the quartiles are constructed
using the class means of initial scores in reading. The decomposition reveals a weakly
significant effect of teachers’ training on test scores in reading for the high-achieving
classes. In mathematics, once again, the effect appears to be non-significant in low-
achieving classes. So training seems to help teachers to improve their teaching, except
when they face a class where the mean achievement is low: training is no help for less-
advantaged classes. Yet the Fisher tests cannot reject the null hypothesis that the
coefficients for the third and the fourth quartiles are equal to the coefficient for the first
quartile.
4.4 Robustness check
To test for the robustness of the training effect, we start by estimating a
propensity score for a class to have a trained teacher using a logistic model at the class
level (Table 8). Class means of initial test scores do not differentiate trained and
untrained teachers, except the standard deviation of initial math scores. On the contrary,
trained teachers have a much lower probability to be in a rural or semi-rural school than
untrained teachers. The resulting distributions of having a trained or an untrained teacher
are displayed on Figure 4. To discard extreme classes which could bias our estimates, we
keep only classes which are within the common support of both distributions. The results
of the estimation of the training effect are given in Table 9. The correlation between the
trained teacher indicator and initial scores is even smaller than before. And the training
19

effects estimated on final scores are very similar to those estimated on the whole sample
of novice teachers.
5 Estimation results on the class size effect
5.1 Main results
Results for the class size effect are also contained in Table 5a (detailed in Table
5b). Class size has a significant impact on students’ outcomes. The impact is quite similar
in reading and in mathematics, close to 3% of a standard deviation of final test scores.
This result should be compared to class size correlations with initial test scores (Table 4):
these correlations are not negligible, around 1% but they are positive, meaning that the
effects measured on final test scores could even be biased downwards.
This impact seems to be robust to the problem of combination classes. The
regression is estimated with a sample including multiple-grade classes. In the case of a
combination class, the class size is then the size of the entire class, and not the number of
third-graders. Yet the indicator for multiple-grade classes is not significant.18 Results are
similar when excluding these combination classes.
This impact is substantial: reducing the class size by 10 students increases the
final test scores by 25 to 30 percentage points. Using similar arguments as presented for
teachers’ training, we believe our results come from a quasi-experimental design and are,
therefore, causal. This estimated impact is close to that obtained for teachers’ training in
mathematics. Comparing to other studies on class size, it is close to the highest
estimators, in particular it is roughly equal to the effect reported in the Tennessee STAR
experiment (see Krueger (1999)).
5.2 Instructional practices?
One strand of research about class size focuses on the channels which could
explain how a small class may help students improving their scores. In our data, the
information given by the teacher about his or her practices in the class can be used to
partially open the black box and to evaluate whether training effect or class size effect are
driven by different teaching practices.
18 This result is consistent with Oeuvrard (1995).
20

The regressions are done at the class level. We estimate whether class size can be
explained by the variables describing the teaching practices.19 None of the practices
seems correlated with class size. The same is true with a dummy variable for large
classes, instead of the class size variable. This result is consistent with other studies,
which usually find that teaching practices do not vary with class size (for a survey, see
Ehrenberg, Brewer, Gamoran and Willms, 2001).
5.3 Differential effects
Some papers find that a reduction in class size affects more directly low-achieving
students. However, this result may come from some composition effect, hiding the fact
that class size benefits similarly to all students within a class.
The results for differential effects of class size are given in Table 10. Within
classes, the pattern for scores in reading is relatively flat, the class size affecting similarly
all students, except a slightly smaller effect for low-achieving students. On the contrary,
the effect on mathematics scores decreases when the “quality” of the students increases.
Hence, within classes, low-achieving students seem to benefit more from being in a small
class than high-achieving students.
Between classes, the class size effect appears much more substantial for less
advantaged classes and decreases when the “quality” of the class increases. The most
clear-cut results are for the first and the last quartiles; the pattern is less clear for medium-
low-achieving classes and medium-high-achieving classes.
This heterogeneity is confirmed by results in Table 11, which reports estimates of
the class size effect for all schools and for ZEP schools alone, estimated in the same
regression. The class size effects are larger in the ZEP school, and are very substantial:
5% in reading (yet non-significantly different from the main effect of 2%) and 8% in
mathematics. This finding confirms recent results obtained by Piketty (2004) who also
finds a substantial impact of class size in ZEP schools, albeit marginally significant
because of the small number of students in ZEP schools in his sample.
These results show that the students in ZEP schools and in disadvantaged classes
in general are more sensitive to class size as a group than other groups of students. One
19 Results are available from the authors.
21
potential explanation is behavioral; in larger classes the probability of having a
troublemaker among students is larger in these schools (see Lazear, 2001).
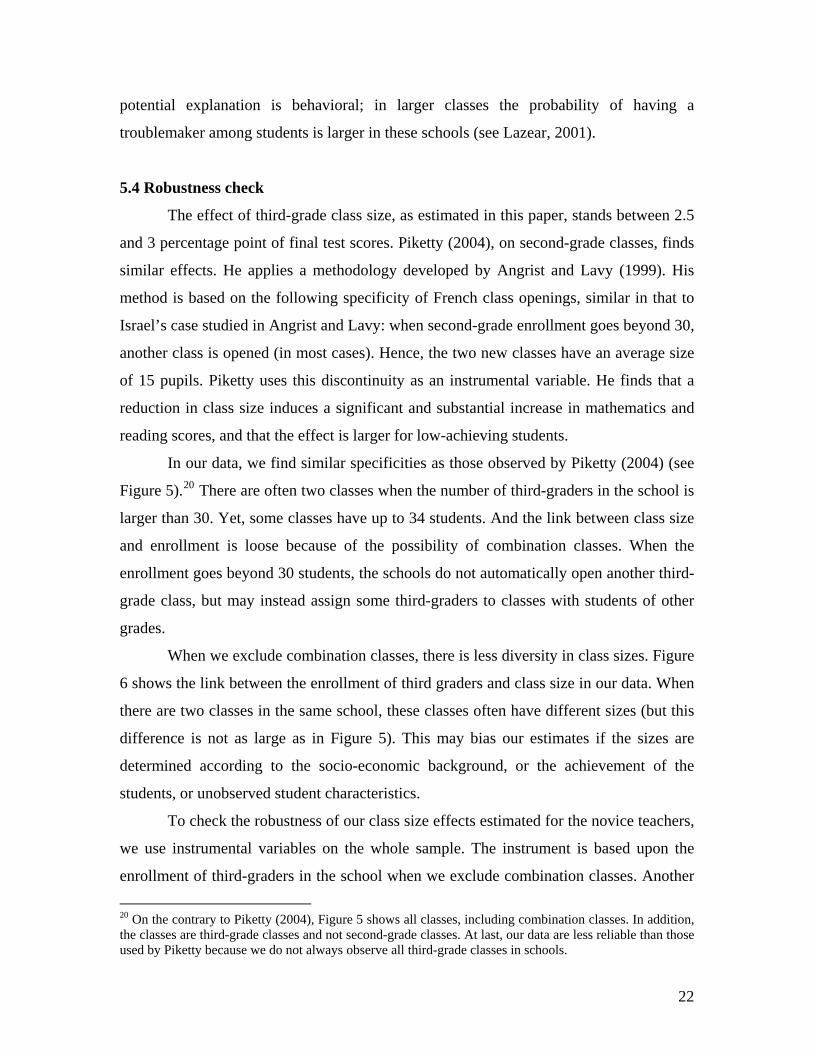
5.4 Robustness check
The effect of third-grade class size, as estimated in this paper, stands between 2.5
and 3 percentage point of final test scores. Piketty (2004), on second-grade classes, finds
similar effects. He applies a methodology developed by Angrist and Lavy (1999). His
method is based on the following specificity of French class openings, similar in that to
Israel’s case studied in Angrist and Lavy: when second-grade enrollment goes beyond 30,
another class is opened (in most cases). Hence, the two new classes have an average size
of 15 pupils. Piketty uses this discontinuity as an instrumental variable. He finds that a
reduction in class size induces a significant and substantial increase in mathematics and
reading scores, and that the effect is larger for low-achieving students.
In our data, we find similar specificities as those observed by Piketty (2004) (see
Figure 5).20 There are often two classes when the number of third-graders in the school is
larger than 30. Yet, some classes have up to 34 students. And the link between class size
and enrollment is loose because of the possibility of combination classes. When the
enrollment goes beyond 30 students, the schools do not automatically open another third-
grade class, but may instead assign some third-graders to classes with students of other
grades.
When we exclude combination classes, there is less diversity in class sizes. Figure
6 shows the link between the enrollment of third graders and class size in our data. When
there are two classes in the same school, these classes often have different sizes (but this
difference is not as large as in Figure 5). This may bias our estimates if the sizes are
determined according to the socio-economic background, or the achievement of the
students, or unobserved student characteristics.
To check the robustness of our class size effects estimated for the novice teachers,
we use instrumental variables on the whole sample. The instrument is based upon the
enrollment of third-graders in the school when we exclude combination classes. Another
20 On the contrary to Piketty (2004), Figure 5 shows all classes, including combination classes. In addition, the classes are third-grade classes and not second-grade classes. At last, our data are less reliable than those used by Piketty because we do not always observe all third-grade classes in schools.
22

strategy is to work with “pure” third-grade classes and combination classes, including in
the enrollment the students who are in the same class as some third-graders, whatever
grade they are in (see Figure 7). In all cases, the instrumental variable is the mean of the
class sizes in the school: the sizes of the “pure” third-grade classes in the first case and
those of all classes with third-graders in the second case. This instrument takes care of the
selection bias which arises when schools organize classes so that small classes gather
low-achieving students and high-achieving students are assigned to larger classes.
As can be seen on Figures 6 and 7, the instrumental variable is very close to the
actual class size. Indeed, in our data, we identify few schools with more than one third-
grade class. And when there are two classes, the sizes of these two classes are not very
different. Hence the findings are easy to foresee: the results estimated with the
instrumental variable are very close to the OLS results (see Table 12).
The idea in Angrist and Lavy (1999) is to use the discontinuity of the class size
resulting from the creation of several classes when the enrollment goes beyond some
level, assuming that this discontinuity is exogenous. One way of using this discontinuity
is to estimate the class effect only when the enrollment is close to the “breaking point”.
We also use this method and estimate our instrumented regression for school where the
enrollment is close to 34 students, the “breaking point” according to our data. We have
chosen to restrict the sample to enrollments between 29 and 40. The coefficients are still
substantial, even if they are no more significant.
All these results confirm the estimated magnitude: the class size effect is close to
2.5 percentage point of the final test scores.
6 Conclusion
This paper looks at the impact of teachers’ training using more a quasi-
experimental design together with the administrative mistakes made in forecasting the
required number of teachers, and checking using observable variables that the assignment
of teachers is as good as random. The effect of teachers’ training is substantial: final test
scores in mathematics of students with a trained teacher are larger by 25% of the standard
deviation than the scores they would have had if their teachers had not been trained.
23

The importance of teachers’ training is confirmed by the effect of teachers’
educational background. Teachers who majored in sciences at university but are
untrained improve their students’ outcomes in mathematics as much as trained teachers.
Thus past scientific studies compensate for the lack of training in mathematics. This
result implies that training is efficient in improving discipline competence in
mathematics, in particular for those teachers who did not study sciences at their
university. This finding confirms other studies which find an effect of the academic
background of the teachers. Yet, in our paper, this effect is of paramount importance and
may be due to the specificities of the French educational system, before the entry in
teachers training colleges.
The effect of class size is shown to be significant and negative: a smaller class
size improves student achievement. The impact is evaluated between 2.5% and 3% of a
standard deviation of the scores. Hence, training teachers is equivalent to reducing class
size by 10 students, in terms of final test scores in mathematics. It is worth noting that
this equivalence is true on average. But the effects vary according to the characteristics of
the classes. The effect of class size is more beneficial in classes with a low initial average
achievement than in classes with a better achievement; the students in the former classes
would benefit most from a decrease in class size. The effect is particularly large for
classes in priority education areas. On the contrary, it seems that such classes do not
benefit from the training of their teachers. This finding shows the complexity of the
education production function and proves that it is essential to study how resources
impact different students differently.
24

References
Altonji, Joseph G., Todd E. Elder, and Chistopher R. Taber (2005), “Selection on Observed and Unobserved Variables: Assessing the Effectiveness of Catholic Schools,” Journal of Political Economy, 113(1), 151-184 Angrist, Joshua D., and Victor Lavy (1999), “Using Maimonides’ Rule to Estimate the Effect of Class Size on Scholastic Achievement,” Quarterly Journal of Economics, 114(2), 533-574 Angrist, Joshua D., and Victor Lavy (2001), “Does Teacher Training Affect Pupil Learning? Evidence from Matched Comparisons in Jerusalem Public Schools,” Journal of Labor Economics, 19(2), 343-369 Benabou, Roland, Francis Kramarz, and Corinne Prost (2005), “The French Zones d’Education Prioritaire: Much Ado About Nothing,” CEPR Discussion Paper, 5085 Boyd, Donald, Pamela Grossman, Hamilton Lankford, Susanna Loed, and James Wyckoff (2005), “How Changes in Entry Requirements Alter the Teacher Workforce and Affect Student Achievement,” NBER Working Paper, 11844 Bressoux, Pascal (1996), “The Effects of Teachers’ Training on Pupils’ Achievement: the Case of Elementary Schools in France,” School Effectiveness and School Improvement, 7(3), 252-279 Brizard, Agnes (1995), “Écoles rurales, écoles urbaines : performance des élèves en français et en mathématiques,” Éducation et Formations, 43, 105-111 Clotfelter, Charles T., Helen F. Ladd, and Jacob L. Vigdor (2006), “Teacher-Student Matching and the Assessment of Teacher Effectiveness,” NBER Working Paper, 11936 Ehrenberg, Ronald G., and Dominic J. Brewer (1994), “Do School and Teacher Characteristics Matter? Evidence from High School and Beyond,” Economics of Education Review, 13(1), 1-17 Ehrenberg, Ronald G., and Dominic J. Brewer (1995), “Did Teachers’ Verbal Ability and Race Matter in the 1960s? Coleman revisited,” Economics of Education Review, 14(1), 1-21 Ehrenberg, Ronald G., Dominic J. Brewer, Adam Gamoran, and Douglas J. Willms, (2001), “Class Size and Student Achievement”, Psychological Science in the Public Interest, 2(1), 1-30 Hanushek, Eric A. (2003), “The Failure of Input-Based Schooling Policies,” Economic Journal, 113(485), 64-98
25

Hoxby, Caroline M. (2000), “The Effects of Class Size on Student Achievement: New Evidence from Population Variation,” Quarterly Journal of Economics, 115(4), 1239-1285 Kane, Thomas J., Jonah E. Rockoff, and Douglas O. Staiger (2006), “What Does Certification Tell Us about Teacher Effectiveness? Evidence from New York City,” NBER Working Paper, 12155 Krueger, Alan B. (1999), “Experimental Estimates of Educational Production Functions,” Quarterly Journal of Economics, 114(2), 497-532 Krueger, Alan B. (2003), “Economic Considerations and Class Size,” Economic Journal, 113(485), 34-63 Lazear, Edward P. (2001), “Educational Production,” Quarterly Journal of Economics, 116(3), 777-803 Moulton, Brent R. (1986), “Random Group Effects and the Precision of Regression Estimates,” Journal of Econometrics, 32(3), 385-397 Oeuvrard, Françoise (1995), “Les performances en français et en mathematiques des écoles à classe unique,” Éducation et Formations, 43, 113-116 Piketty, Thomas (2004), “L’impact de la taille des classes et de la ségrégation sociale sur la réussite scolaire dans les écoles françaises : une estimation à partir du panel primaire 1997,” mimeo Rivkin, Steven G., Eric A. Hanushek, and John F. Kain, (2005), “Teachers, Schools, and Academic Achievement,” Econometrica, 73(2), 417-458 Robinson, Geoff K. (1991), “That BLUP is a Good Thing: the Estimation of Random Effects,” Statistical Science, 6(1), 15-32 Rockoff, Jonah (2004), “The Impact of Individual Teachers on Student Achievement: Evidence from Panel Data,” American Economic Review, 94(2): 247-252 Summers, Anita, and Barbara Wolfe (1977), “Do Schools Make a Difference?” American Economic Review, 67(4), 639-652 Thaurel-Richard, Michèle (1995), “Les progrès des élèves au CE2 en milieu rural,” Éducation et Formations, 43, 117-123 Woessman, Ludger, and Martin R. West (2006), “Class-Size Effects in School Systems around the World: Evidence from Between-Grade Variation in TIMSS,” European Economic Review, 50(3), 695-736
26

Woessman, Ludger (2005), “Educational Production in Europe,” Economic Policy, 20(43), 445-504
27

Appendix A: Class effects estimated with mixed models The mixed model is written:
εγβ ++= ZXY where γ and ε are Gaussian:
⎥⎦
⎤⎢⎣
⎡=⎥
⎦
⎤⎢⎣
⎡00
εγ
E and ⎥⎦
⎤⎢⎣
⎡=⎥
⎦
⎤⎢⎣
⎡R
GVar
00
εγ
The endogenous variable Y is explained with covariates X multiplied by fixed-effects parameters β and with covariates Z multiplied by random-effects parametersγ . For estimating class effects, the matrix Z is composed of class dummies. The vector γ is then a vector of random class effects. We assume that variance matrices and are diagonal: and . diagonal means that the random effects are uncorrelated.
G RIG 2
1σ= IR 2σ= G
G and can be estimated by the method of restricted/residual maximum likelihood (REML). Coefficients are then determined with Henderson’s mixed model equations:
R
⎥⎦
⎤⎢⎣
⎡=⎥
⎦
⎤⎢⎣
⎡⎥⎦
⎤⎢⎣
⎡
+ −
−
−−−
−−
YRZYRX
GZRZXRZZRXXRX
1
1
111
11
ˆ'
ˆ'ˆ
ˆˆˆ'ˆ'
ˆ'ˆ'γβ
The coefficients are thus:
( ) ( )
( ) ( ) ( ) YZGZRXXZGZRXXRZRZGZRZ
YZGZRXXZGZRX
⎭⎬⎫
⎩⎨⎧
+⎥⎦⎤
⎢⎣⎡ +−+=
+⎥⎦⎤
⎢⎣⎡ +=
−−−−−−−−
−−−
11111111
111
'ˆˆ''ˆˆ'ˆ'ˆ'ˆˆ'ˆ
'ˆˆ''ˆˆ'ˆ
γ
β
Thus, if the eigenvalues of , then , and the system is identical to the one of the estimation of fixed effects.
∞→G 0ˆ 1 →−G
28

Appendix B: Tables and figures Table 1: Descriptive statistics
Full sample Balanced sampleVariable N Mean N Mean
Month of birth 3885 6.51 3209 6.54One year younger than usual age 3885 0.02 3209 0.02Female 3908 0.48 3209 0.48Foreign nationality 3889 0.17 3209 0.171 sibling 3887 0.35 3209 0.352 siblings 3887 0.27 3209 0.273 or more siblings 3887 0.28 3209 0.28Father's occupation: high 3738 0.34 3209 0.33Mother's occupation: high 3860 0.17 3209 0.17Pre-elementary school: less than 3 years 3652 0.15 3209 0.14Pre-elementary school: more than 3 years 3652 0.19 3209 0.18One repeated grade in pre-elementary school 3803 0.02 3209 0.01First grade repeated 3854 0.13 3209 0.12Second grade repeated 3863 0.07 3209 0.07Third grade repeated 3864 0.07 3209 0.06Initial test score in reading 3612 5.00 3209 4.99
(1.00) (0.99)Initial test score in math 3551 5.00 3209 5.00
(1.00) (1.00)Final test score in reading 3320 5.00 3209 4.99
(1.00) (1.00)Final test score in math 3467 5.00 3209 5.00
(1.00) (1.00)
Experienced teacher 197 0.49 177 0.46Trained novice teacher 197 0.33 177 0.36Untrained novice teacher 197 0.18 177 0.18Field of specialization: sciences 197 0.12 177 0.12Field of specialization: unknown 197 0.40 177 0.40Class size 189 23.92 177 23.90
(4.06) (4.13)Combination class 196 0.32 177 0.29Rural 194 0.15 177 0.15Semi-rural 194 0.19 177 0.19Priority educational area (ZEP) 197 0.25 177 0.27
A.Student variables
B.Teacher and class variables
Note: Standard deviations are reported in parentheses for non-dummy variables. High occupation corresponds to self-employed worker, executive, teacher, professor, technician, and foreman. The field of specialization is unknown when the teacher did not answer the question or when the teacher did not go to the university.
29

Table 2: Statistics by type of teacher
Experienced Trained novice Untrained novice Chi-squared tests Chi-squared testsacross the 3 categories
trained versus untrained
Variable Mean Mean Mean P-value P-value
Month of birth 6.51 6.55 6.61 0.69 0.46One year younger than usual age 0.02 0.01 0.02 0.79 0.57Female 0.48 0.48 0.47 0.98 0.83Foreign nationality 0.14 0.21 0.17 0.00 0.121 sibling 0.40 0.29 0.35 0.00 0.012 siblings 0.26 0.28 0.29 0.19 0.593 or more siblings 0.25 0.35 0.25 0.00 0.00Father's occupation: high 0.35 0.29 0.33 0.01 0.19Mother's occupation: high 0.18 0.15 0.14 0.01 0.90Pre-elementary school: less than 3 years 0.13 0.15 0.16 0.08 0.41Pre-elementary school: more than 3 years 0.20 0.17 0.16 0.06 0.88One repeated grade in pre-elementary school 0.01 0.02 0.01 0.27 0.38First grade repeated 0.09 0.15 0.14 0.00 0.49Second grade repeated 0.07 0.07 0.05 0.29 0.12Third grade repeated 0.07 0.06 0.05 0.17 0.27Initial test score in reading 5.15 4.79 4.85
(0.95) (1.01) (1.00)Initial test score in math 5.15 4.82 4.84
(0.98) (0.99) (0.98)Final test score in reading 5.16 4.81 4.73
(0.96) (1.01) (1.00)Final test score in math 5.14 4.91 4.68
(0.96) (0.99) (1.04)Number of students 1695 1027 487
Field of specialization: sciences 0.10 0.14 0.13 0.70 0.81Field of specialization: unknown 0.70 0.13 0.19 0.00 0.43Class size 24.95 22.73 23.53
(3.65) (4.05) (4.85)Large class (>25 students) 0.41 0.21 0.34 0.03 0.15Combination class 0.17 0.37 0.44 0.00 0.49Rural 0.12 0.11 0.28 0.06 0.04Semi-rural 0.15 0.19 0.28 0.25 0.31Priority educational area (ZEP) 0.20 0.35 0.28 0.11 0.50Number of classes 82 63 32
B. Teacher and class variables
teachers teachers teachers
A. Student variables
Note: Balanced sample. Standard deviations are reported in parentheses for non-dummy variables. High occupation corresponds to self-employed worker, executive, teacher, professor, technician, and foreman. The field of specialization is unknown when the teacher did not answer the question or when the teacher did not go to the university. The two last columns give the P-values for the tests of the hypothesis that students are similar across teacher categories. The second to last column compares the three categories whereas the last column compares only students with novice teachers.
30

Table 3: Regression estimates on initial test scores, with all pupils
Experienced teacher 0.318 ** 0.269 **(0.116) (0.094)
Trained novice teacher -0.065 0.052(0.123) (0.098)
Class size 0.025 ** 0.016 *(0.011) (0.009)
Other variables No No YesClass effects Yes Yes Yes
Number of students 3718 3650 3650Number of classes 196 188 188Class level residual variance 0.289 0.308 0.161Individual level residual variance 0.701 0.698 0.561
Dependent variable: initial scores in reading
Experienced teacher 0.294 ** 0.264 **(0.112) (0.096)
Trained novice teacher -0.082 0.038(0.118) (0.099)
Class size 0.019 * 0.010(0.01) (0.009)
Other variables No No YesClass effects Yes Yes Yes
Number of students 3584 3521 3521Number of classes 188 181 181Class level residual variance 0.256 0.278 0.157Individual level residual variance 0.727 0.726 0.633
Dependent variable: initial scores in math
Note: Regression of the initial test scores of all the students; when the covariates are included, they comprise student and teacher characteristics. Coefficients are estimated through mixed models, with class effects. Standard errors are reported in parentheses. **p<0.05 *p<0.10
31

Table 4: Regression estimates on initial test scores, on the pupils with novice teachers
Trained novice teacher -0.065 0.068(0.130) (0.111)
Class size 0.015 0.014 (0.015) (0.013)
Other variables No No YesClass effects Yes Yes Yes
Number of students 1711 1711 1711Number of classes 100 100 100Class level residual variance 0.327 0.325 0.201Individual level residual variance 0.721 0.721 0.618
Dependent variable: initial scores in reading
Trained novice teacher -0.082 0.062(0.118) (0.101)
Class size 0.009 0.008 (0.014) (0.012)
Other variables No No YesClass effects Yes Yes Yes
Number of students 1685 1685 1685Number of classes 98 98 98Class level residual variance 0.255 0.255 0.152Individual level residual variance 0.727 0.727 0.666
Dependent variable: initial scores in math
Note: Regression of the initial test scores of the students with novice teachers; when the covariates are included, they comprise student and teacher characteristics. Coefficients are estimated through mixed models, with class effects. Standard errors are reported in parentheses. **p<0.05 *p<0.10
32
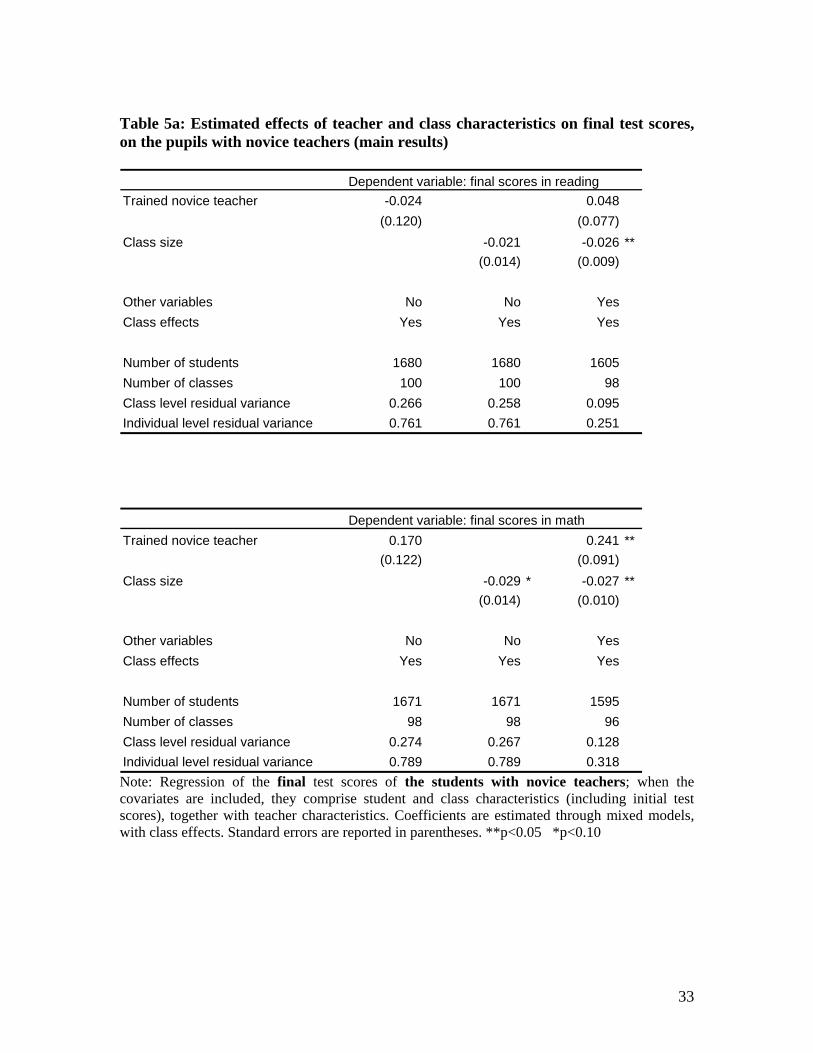
Table 5a: Estimated effects of teacher and class characteristics on final test scores, on the pupils with novice teachers (main results)
Trained novice teacher -0.024 0.048(0.120) (0.077)
Class size -0.021 -0.026 **(0.014) (0.009)
Other variables No No YesClass effects Yes Yes Yes
Number of students 1680 1680 1605Number of classes 100 100 98Class level residual variance 0.266 0.258 0.095Individual level residual variance 0.761 0.761 0.251
Dependent variable: final scores in reading
Trained novice teacher 0.170 0.241 **(0.122) (0.091)
Class size -0.029 * -0.027 **(0.014) (0.010)
Other variables No No YesClass effects Yes Yes Yes
Number of students 1671 1671 1595Number of classes 98 98 96Class level residual variance 0.274 0.267 0.128Individual level residual variance 0.789 0.789 0.318
Dependent variable: final scores in math
Note: Regression of the final test scores of the students with novice teachers; when the covariates are included, they comprise student and class characteristics (including initial test scores), together with teacher characteristics. Coefficients are estimated through mixed models, with class effects. Standard errors are reported in parentheses. **p<0.05 *p<0.10
33
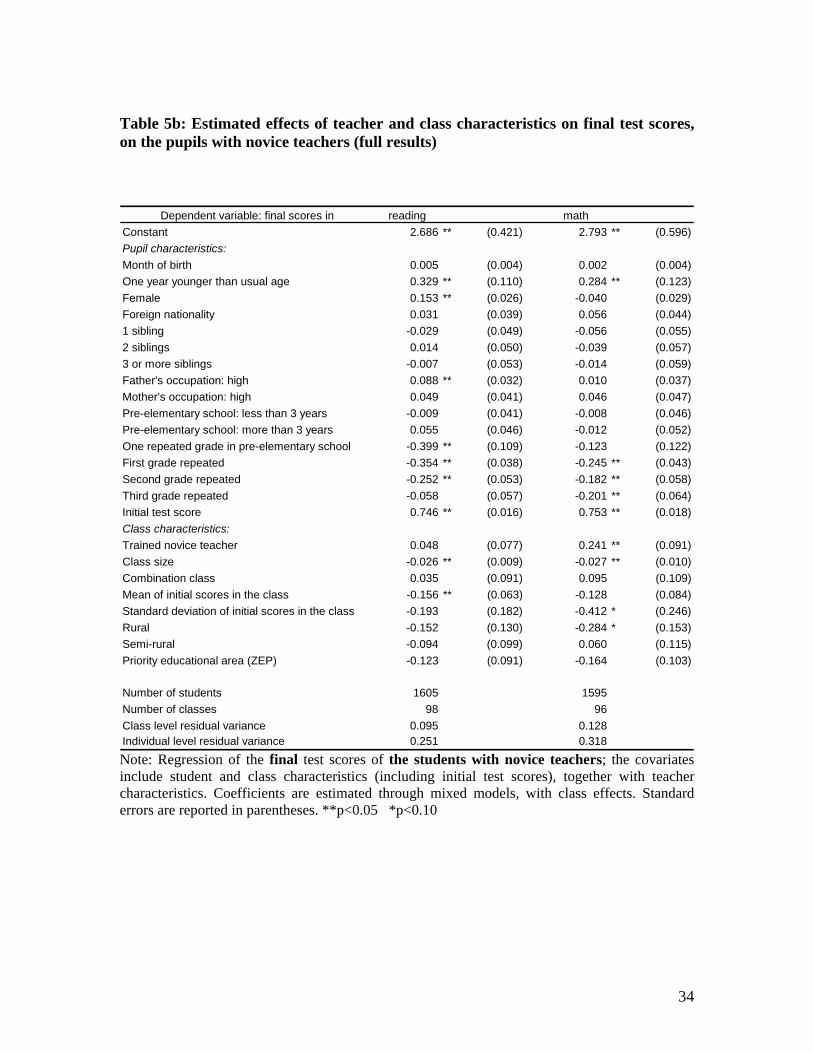
Table 5b: Estimated effects of teacher and class characteristics on final test scores, on the pupils with novice teachers (full results)
Dependent variable: final scores in reading mathConstant 2.686 ** (0.421) 2.793 ** (0.596)Pupil characteristics:Month of birth 0.005 (0.004) 0.002 (0.004)One year younger than usual age 0.329 ** (0.110) 0.284 ** (0.123)Female 0.153 ** (0.026) -0.040 (0.029)Foreign nationality 0.031 (0.039) 0.056 (0.044)1 sibling -0.029 (0.049) -0.056 (0.055)2 siblings 0.014 (0.050) -0.039 (0.057)3 or more siblings -0.007 (0.053) -0.014 (0.059)Father's occupation: high 0.088 ** (0.032) 0.010 (0.037)Mother's occupation: high 0.049 (0.041) 0.046 (0.047)Pre-elementary school: less than 3 years -0.009 (0.041) -0.008 (0.046)Pre-elementary school: more than 3 years 0.055 (0.046) -0.012 (0.052)One repeated grade in pre-elementary school -0.399 ** (0.109) -0.123 (0.122)First grade repeated -0.354 ** (0.038) -0.245 ** (0.043)Second grade repeated -0.252 ** (0.053) -0.182 ** (0.058)Third grade repeated -0.058 (0.057) -0.201 ** (0.064)Initial test score 0.746 ** (0.016) 0.753 ** (0.018)Class characteristics:Trained novice teacher 0.048 (0.077) 0.241 ** (0.091)Class size -0.026 ** (0.009) -0.027 ** (0.010)Combination class 0.035 (0.091) 0.095 (0.109)Mean of initial scores in the class -0.156 ** (0.063) -0.128 (0.084)Standard deviation of initial scores in the class -0.193 (0.182) -0.412 * (0.246)Rural -0.152 (0.130) -0.284 * (0.153)Semi-rural -0.094 (0.099) 0.060 (0.115)Priority educational area (ZEP) -0.123 (0.091) -0.164 (0.103)
Number of students 1605 1595Number of classes 98 96Class level residual variance 0.095 0.128Individual level residual variance 0.251 0.318 Note: Regression of the final test scores of the students with novice teachers; the covariates include student and class characteristics (including initial test scores), together with teacher characteristics. Coefficients are estimated through mixed models, with class effects. Standard errors are reported in parentheses. **p<0.05 *p<0.10
34

Table 6: Estimated effects of teachers’ academic background on initial and final test scores, on the pupils with novice teachers
Dependent variable:Trained novice teacher 0.180 (0.128) 0.110 (0.087)Trained novice teacher and field of specialization= sciences 0.121 (0.176) 0.013 (0.118) field of specialization= unknown -0.117 (0.192) 0.253 ** (0.127)
Untrained novice teacher and field of specialization= sciences 0.354 (0.268) 0.138 (0.179) field of specialization= unknown 0.514 ** (0.233) 0.450 ** (0.162)
Other variables Yes YesClass effects Yes Yes
Number of students 1711 1605Number of classes 100 98Class level residual variance 0.197 0.085Individual level residual variance 0.617 0.251
Dependent variable:Trained novice teacher 0.116 (0.116) 0.274 ** (0.104)Trained novice teacher and field of specialization= sciences 0.251 (0.168) 0.159 (0.149) field of specialization= unknown 0.028 (0.172) 0.239 (0.150)
Untrained novice teacher and field of specialization= sciences 0.122 (0.240) 0.441 ** (0.211) field of specialization= unknown 0.526 ** (0.210) 0.188 (0.191)
Other variables Yes YesClass effects Yes Yes
Number of students 1685 1595Number of classes 98 96Class level residual variance 0.147 0.122Individual level residual variance 0.665 0.318
Initial scores in reading Final scores in reading
Initial scores in math Final scores in math
Note: Regression of the initial or final test scores of the students with novice teachers; the covariates include student and class characteristics (including initial test scores), together with teacher characteristics. Coefficients are estimated through mixed models, with class effects. Standard errors are reported in parentheses. **p<0.05 *p<0.10
35

Table 7: Differential effects of training
Dependent variable: final scores in reading mathteachers' training 0.053 0.119and low achieving students (Q1) (0.085) (0.097) teachers' training 0.023 0.269 **and medium low achieving students (Q2) (0.082) (0.097) teachers' training 0.022 0.271 **and medium high achieving students (Q3) (0.082) (0.097)
teachers' training 0.098 0.334 **and high achieving students (Q4) (0.086) (0.099)
Other variables Yes YesClass effects Yes Yes
F-test Q2 = Q1 (p value) 0.52 0.00F-test Q3 = Q1 (p value) 0.56 0.00F-test Q4 = Q1 (p value) 0.50 0.00
Number of students 1605 1569Number of classes 98 96Class level residual variance 0.095 0.129Individual level residual variance 0.251 0.316
Quartiles within the classes of students' initial reading scores
36

Dependent variable: final scores in reading mathteachers' training -0.181 0.016and low achieving classes (Q1) (2.05) (0.142) teachers' training 0.129 0.437 **and medium low achieving classes (Q2) (1.82) (0.122) teachers' training 0.009 0.262 **and medium high achieving classes (Q3) (1.86) (0.127)
teachers' training 0.187 * 0.228 *and high achieving classes (Q4) (1.92) (0.127)
Other variables Yes YesClass effects Yes Yes
F-test Q2 = Q1 (p value) 0.02 0.00F-test Q3 = Q1 (p value) 0.20 0.13F-test Q4 = Q1 (p value) 0.03 0.24
Number of students 1605 1569Number of classes 98 96Class level residual variance 0.090 0.118Individual level residual variance 0.251 0.319
Quartiles of class means of initial reading scores
Note: Regression of the final test scores of the students with novice teachers; the covariates include student, class characteristics and dummy variable of trained teachers, broken down according to the quartiles. Coefficients are estimated through mixed models, with class effects. Standard errors are reported in parentheses. **p<0.05 *p<0.10
37

Table 8: Trained novice and untrained novice teachers
Dependent variable: trained teacher indicator variableConstant -6.59 (4.30)Field of specialization: sciences 0.36 (0.84)Field of specialization: unknown -0.46 (0.78)Class size -0.13 * (0.07)Combination class 0.92 (0.69)Rural -2.66 ** (1.10)Semi-rural -2.01 ** (0.82)Priority educational area (ZEP) -1.53 (1.07)Share in the class of students: One year younger than usual age -11.16 (7.67) Female 0.56 (2.48) Foreign nationality 0.56 (1.64) 3 or more siblings 3.62 * (2.26) Father's occupation: high -2.21 (1.87) Mother's occupation: high 1.94 (2.90) First grade repeated -1.24 (2.47) Second grade repeated 1.14 (3.65) Third grade repeated -0.57 (2.22)Mean of initial reading scores in the class 0.38 (0.98)Standard deviation of initial reading scores in the class 0.03 (1.61)Mean of initial math scores in the class 1.18 (1.15)Standard deviation of initial math scores in the class 4.02 ** (1.89)
Number of observations 97 Note: Logistic regression of the trained teacher indicator variable on the characteristics of the class. Standard errors are reported in parentheses. **p<0.05 *p<0.10 Table 9: Training effect using teachers on common support
Dependent variable: Initial scores
in readingInitial scores
in mathFinal scores in reading
Final scores in math
Trained novice teacher 0.000 0.005 0.053 0.237 **(0.123) (0.109) (0.085) (0.101)
Other variables Yes Yes Yes YesClass effects Yes Yes Yes Yes
Number of students 1359 1359 1275 1299Number of classes 79 79 78 79 Note: Regression of the final test scores of the students with novice teachers, belonging to the common support; the covariates include student and class characteristics (including initial test scores), together with teacher characteristics. Coefficients are estimated through mixed models, with class effects. Standard errors are reported in parentheses. **p<0.05 *p<0.10
38

Table 10: Differential effects of class size
Dependent variable: final scores in reading mathclass size -0.022 ** -0.035 **and low achieving students (Q1) (0.009) (0.010) class size -0.026 ** -0.028 **and medium low achieving students (Q2) (0.009) (0.010) class size -0.027 ** -0.027 **and medium high achieving students (Q3) (0.009) (0.010)
class size -0.027 ** -0.024 **and high achieving students (Q4) (0.009) (0.010)
Other variables Yes YesClass effects Yes Yes
F-test Q2 = Q1 (p value) 0.04 0.00F-test Q3 = Q1 (p value) 0.03 0.00F-test Q4 = Q1 (p value) 0.14 0.00
Number of students 1605 1569Number of classes 98 96Class level residual variance 0.095 0.130Individual level residual variance 0.250 0.313
Quartiles within the classes of students' initial reading scores
39
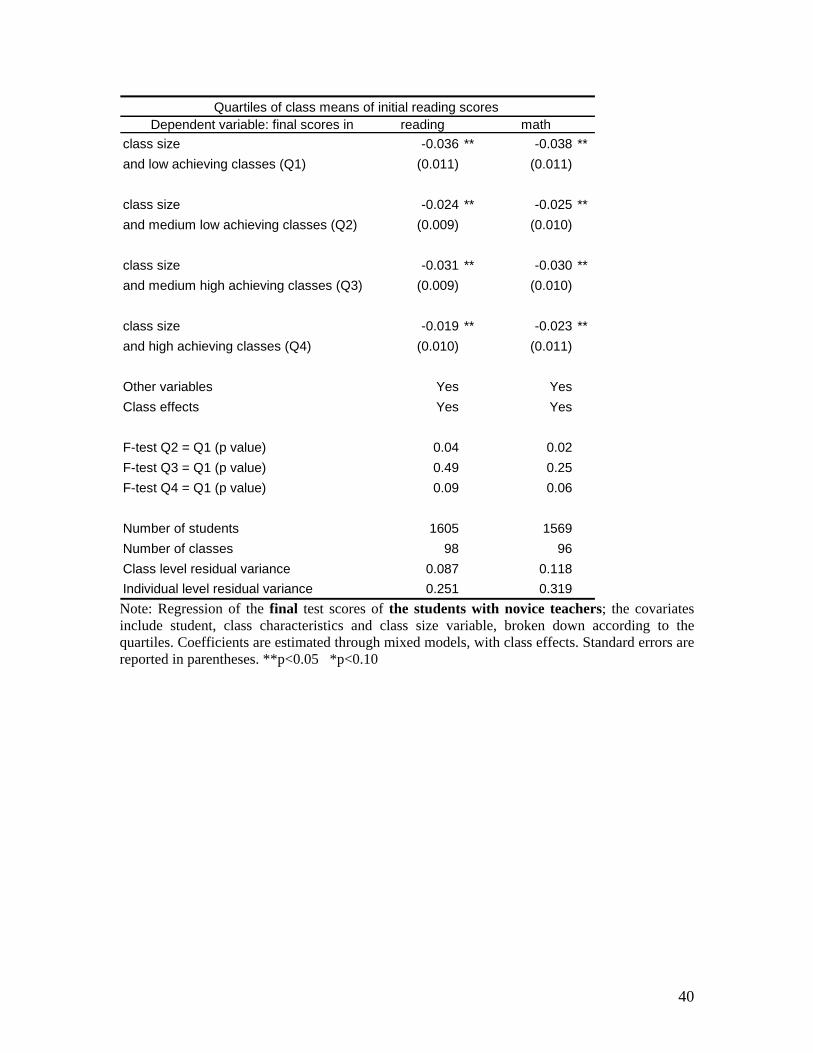
Dependent variable: final scores in reading mathclass size -0.036 ** -0.038 **and low achieving classes (Q1) (0.011) (0.011) class size -0.024 ** -0.025 **and medium low achieving classes (Q2) (0.009) (0.010) class size -0.031 ** -0.030 **and medium high achieving classes (Q3) (0.009) (0.010)
class size -0.019 ** -0.023 **and high achieving classes (Q4) (0.010) (0.011)
Other variables Yes YesClass effects Yes Yes
F-test Q2 = Q1 (p value) 0.04 0.02F-test Q3 = Q1 (p value) 0.49 0.25F-test Q4 = Q1 (p value) 0.09 0.06
Number of students 1605 1569Number of classes 98 96Class level residual variance 0.087 0.118Individual level residual variance 0.251 0.319
Quartiles of class means of initial reading scores
Note: Regression of the final test scores of the students with novice teachers; the covariates include student, class characteristics and class size variable, broken down according to the quartiles. Coefficients are estimated through mixed models, with class effects. Standard errors are reported in parentheses. **p<0.05 *p<0.10
40

Table 11: Effect of class size in the ZEP schools
Dependent variable:class size 0.011 (0.014) -0.019 ** (0.010)
class size * ZEP school 0.015 (0.032) -0.034 (0.022)
Other variables Yes YesClass effects Yes Yes
Number of students 1711 1605Number of classes 100 98Class level residual variance 0.203 0.094Individual level residual variance 0.618 0.251
Dependent variable:class size 0.008 (0.013) -0.013 (0.011)
class size * ZEP school -0.001 (0.029) -0.072 ** (0.024)
Other variables Yes YesClass effects Yes Yes
Number of students 1685 1595Number of classes 98 96Class level residual variance 0.154 0.116Individual level residual variance 0.666 0.318
Initial scores in reading Final scores in reading
Initial scores in math Final scores in math
Note: Regression of the final test scores of the students with novice teachers; the covariates include student, class characteristics and a specific class size effect for ZEP schools. Coefficients are estimated through mixed models, with class effects. Standard errors are reported in parentheses. **p<0.05 *p<0.10
41

Table 12: Effect of class size estimated with or without instrumental variable All classes Dependant variable:
OLS IV IV (24-45) OLS IV IV (24-45)Class size -0.024 ** -0.025 ** -0.019 -0.025 ** -0.025 ** -0.017
(0.006) (0.007) (0.014) (0.007) (0.007) (0.014)
Other variables Yes Yes Yes Yes Yes YesClass effects Yes Yes Yes Yes Yes Yes
Number of students 3447 3447 2248 3347 3347 2129Number of classes 185 185 106 179 179 100
Without combination classesDependant variable:
OLS IV IV (24-45) OLS IV IV (24-45)Class size -0.023 ** -0.023 ** -0.012 -0.026 ** -0.026 ** -0.016
(0.007) (0.007) (0.014) (0.008) (0.008) (0.012)
Other variables Yes Yes Yes Yes Yes YesClass effects Yes Yes Yes Yes Yes Yes
Number of students 2924 2924 1971 2826 2826 1844Number of classes 132 132 82 127 127 76
Final scores in reading Final scores in math
Final scores in reading Final scores in math
Note: Regression of the final test scores of all the students; the covariates include student, class characteristics and instrumented variable of class size. The last column correspond to the estimation on the sub-samples restricted to enrollments between 24 and 45 students. Coefficients are estimated through mixed models, with class effects. Standard errors are reported in parentheses. **p<0.05 *p<0.10
42
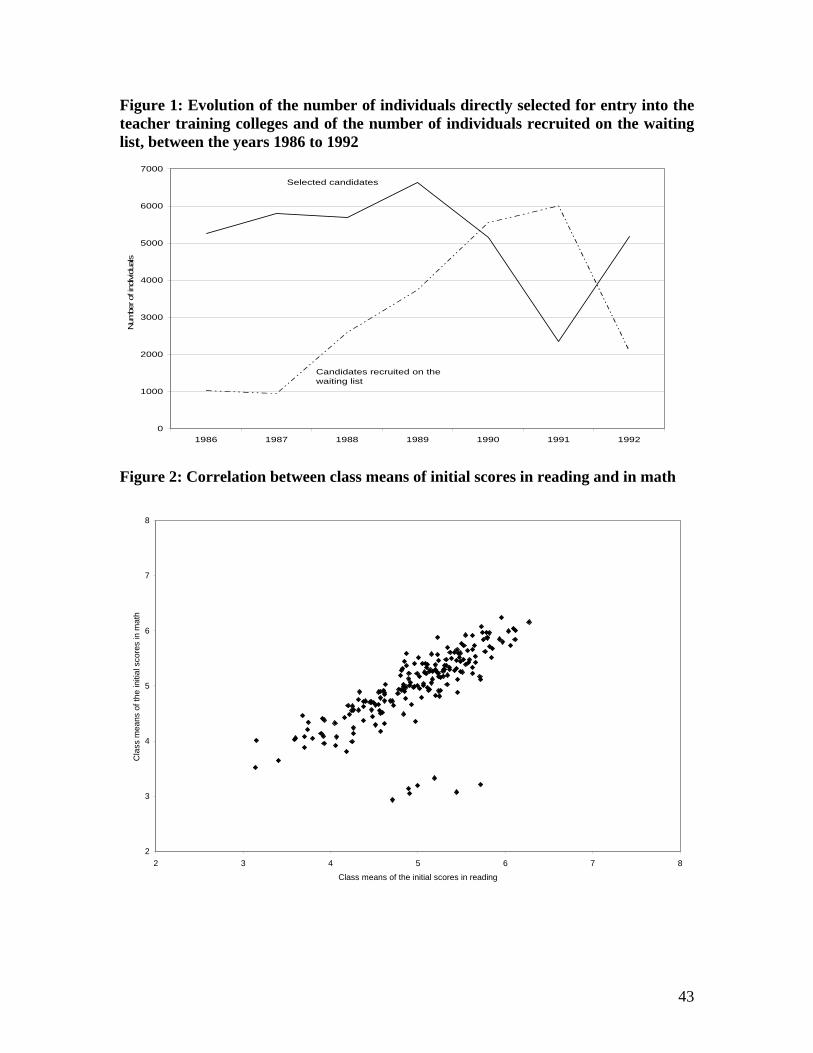
Figure 1: Evolution of the number of individuals directly selected for entry into the teacher training colleges and of the number of individuals recruited on the waiting list, between the years 1986 to 1992
0
1000
2000
3000
4000
5000
6000
7000
1986 1987 1988 1989 1990 1991 1992
Num
ber o
f ind
ivid
uals
Selected candidates
Candidates recruited on the waiting list
Figure 2: Correlation between class means of initial scores in reading and in math
2
3
4
5
6
7
8
2 3 4 5 6 7
Class means of the initial scores in reading
Cla
ss m
eans
of t
he in
itial
sco
res
in m
ath
8
43

Figure 3: Initial scores in reading and in math by type of teacher
2 3 4 5 6 7 8
Class means of initial score in reading
Experienced teachers
Untrained novice teachers
Trained novice teachers
2 3 4 5 6 7 8
Class means of initial score in math
Experienced teachers
Untrained novice teachers
Trained novice teachers
44

Figure 4: Probability of being trained and support
0%
2%
4%
6%
8%
10%
12%
14%
16%
18%
20%
0.1 0.2 0.3 0.4 0.5 0.6 0.7 0.8 0.9 1
Untrained novice teachers
Trained novice teachers
Figure 5: Enrollment and number of third-graders per class
0
5
10
15
20
25
30
35
40
0 10 20 30 40 50
Number of third-graders in the school
Num
ber o
f thi
rd-g
rade
rs p
er c
lass
60
number of third-graders per classschool mean of the number of third-graders per classcombination class
45

Figure 6: Enrollment and size of third grade classes, excluding combination classes
0
5
10
15
20
25
30
35
40
0 10 20 30 40 50
Number of third-graders in the school
Siz
e of
third
-gra
de c
lass
es
60
class size
mean of class sizes in the school
Figure 7: Enrollment and size of third-grade classes, including combination classes
0
5
10
15
20
25
30
35
40
0 10 20 30 40 50 6Number of students in third-grade classes in the school (including students from other grades in
combination classes)
Size
of t
hird
-gra
de c
lass
es
0
class size
mean of class sizes in the school
46