Embed Size (px)
Citation preview

presented by:John Burns | CEO
949-870-1210
F E B R U A R Y 2 4 t h 2 0 1 7
Teachers Retirement
System of TexasHousing Overview
& Strategies
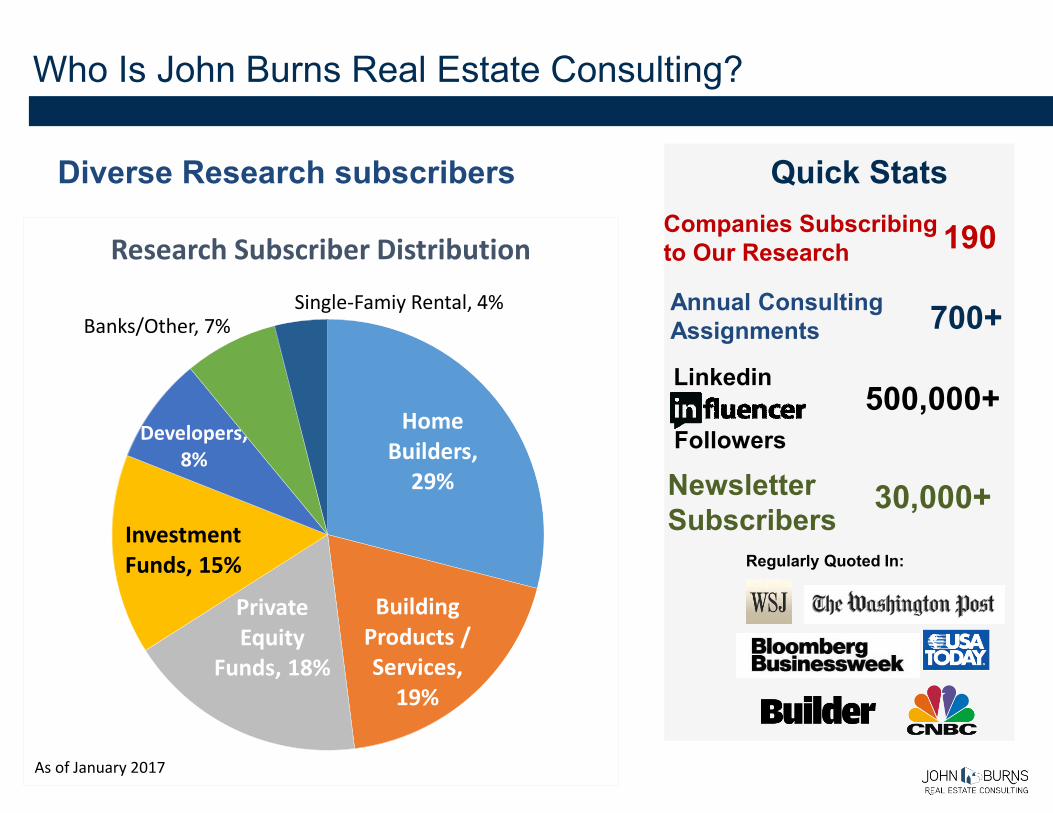
Who Is John Burns Real Estate Consulting?
Quick Stats
30,000+
500,000+Linkedin
NewsletterSubscribers
Regularly Quoted In:
Companies Subscribing to Our Research
Diverse Research subscribers
Home Builders,
29%
Building Products / Services,
19%
Private Equity
Funds, 18%
Investment Funds, 15%
Developers, 8%
Banks/Other, 7%Single-Famiy Rental, 4%
Research Subscriber Distribution
As of January 2017
700+
190
Annual Consulting Assignments
Followers
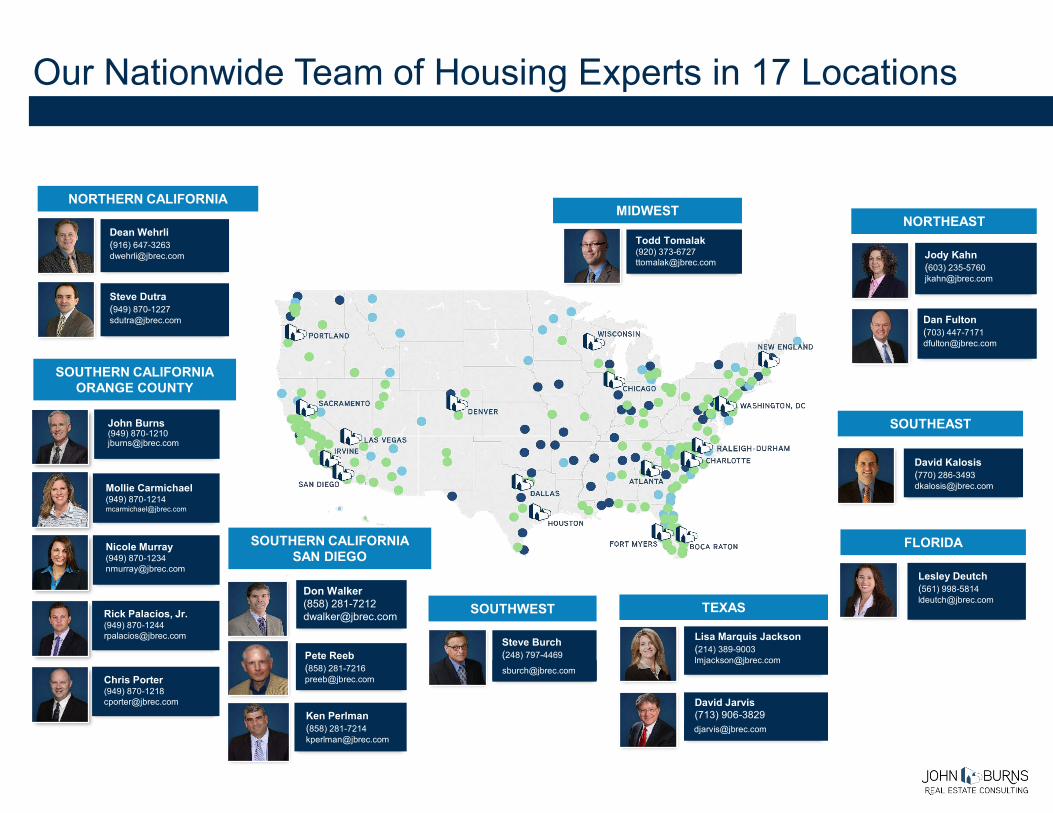
Our Nationwide Team of Housing Experts in 17 Locations
Jody Kahn(603) [email protected]
Dean Wehrli(916) [email protected]
NORTHERN CALIFORNIA
TEXAS
FLORIDA
SOUTHEAST
NORTHEAST
Lesley Deutch(561) [email protected]
David Kalosis(770) [email protected]
Jody Kahn(603) [email protected]
SOUTHERN CALIFORNIAORANGE COUNTY
Don Walker(858) [email protected]
Pete Reeb(858) [email protected]
Ken Perlman(858) [email protected]
Chris Porter
Mollie Carmichael(949) [email protected]
Chris Porter(949) [email protected]
Todd Tomalak(920) [email protected]
MIDWEST
Steve Dutra(949) [email protected]
Nicole Murray(949) [email protected]
Rick Palacios, Jr.(949) [email protected]
John Burns(949) [email protected]
SOUTHERN CALIFORNIASAN DIEGO
Lisa Marquis Jackson(214) [email protected]
SOUTHWEST
Steve Burch(248) 797-4469
David Jarvis(713) [email protected]
Dan Fulton(703) [email protected]
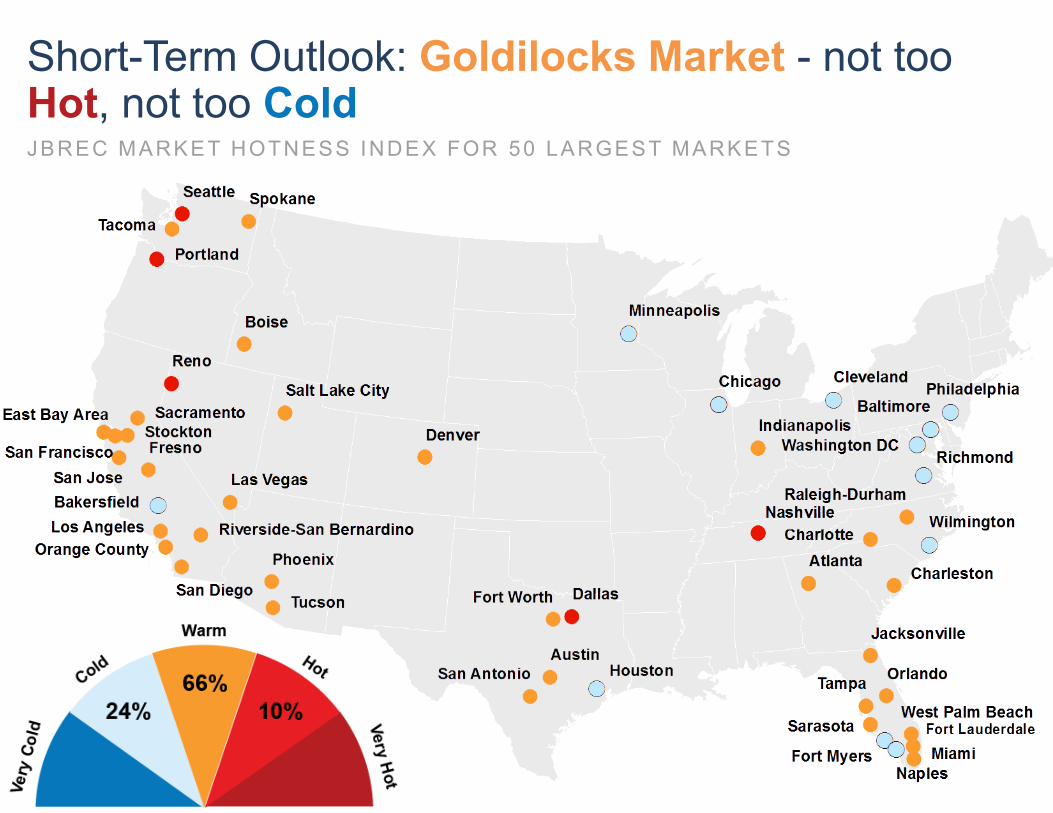
Short-Term Outlook: Goldilocks Market - not too Hot, not too ColdJBREC MARKET HOTNESS INDEX FOR 50 LARGEST MARKETS
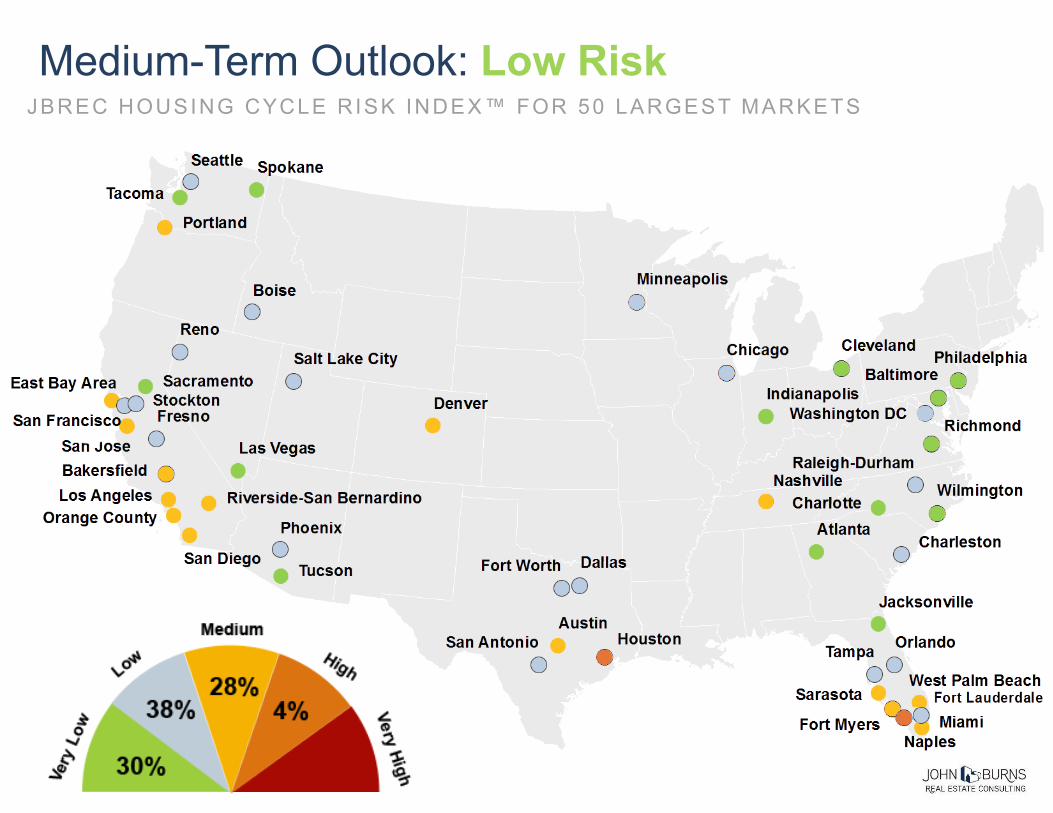
Medium-Term Outlook: Low RiskJBREC HOUSING CYCLE RISK INDEX™ FOR 50 LARGEST MARKETS
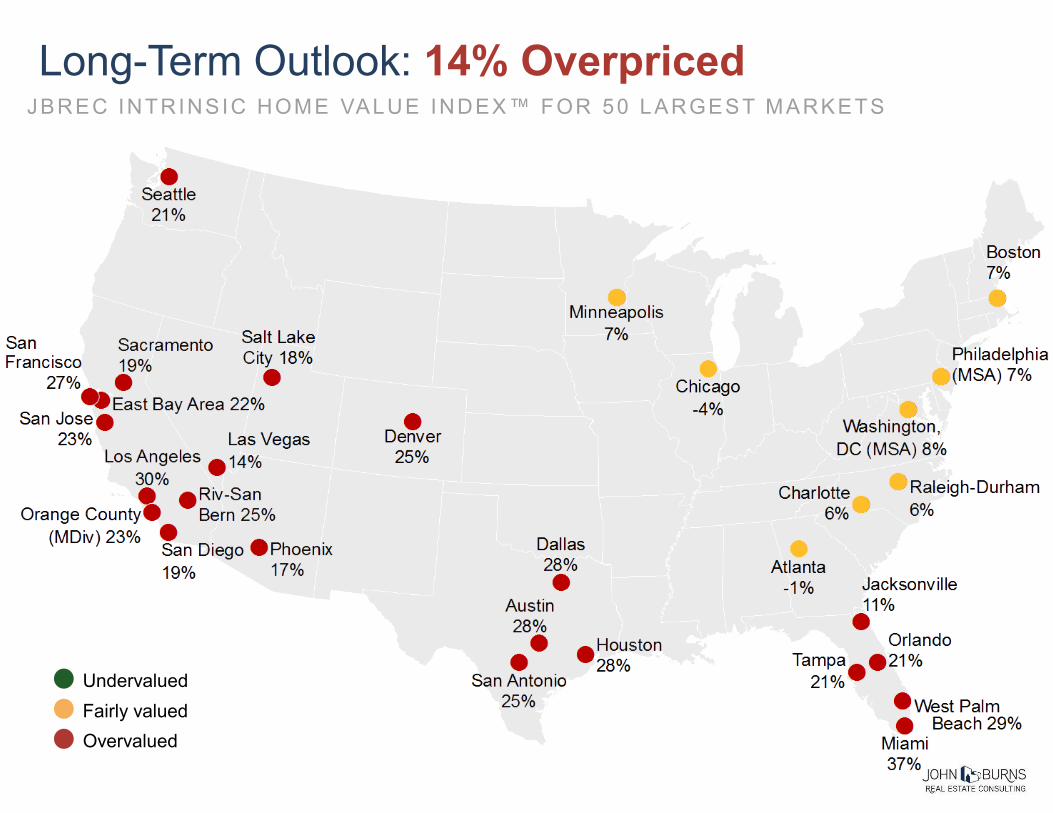
Long-Term Outlook: 14% OverpricedJBREC INTRINSIC HOME VALUE INDEX™ FOR 50 LARGEST MARKETS
Overvalued
UndervaluedFairly valued
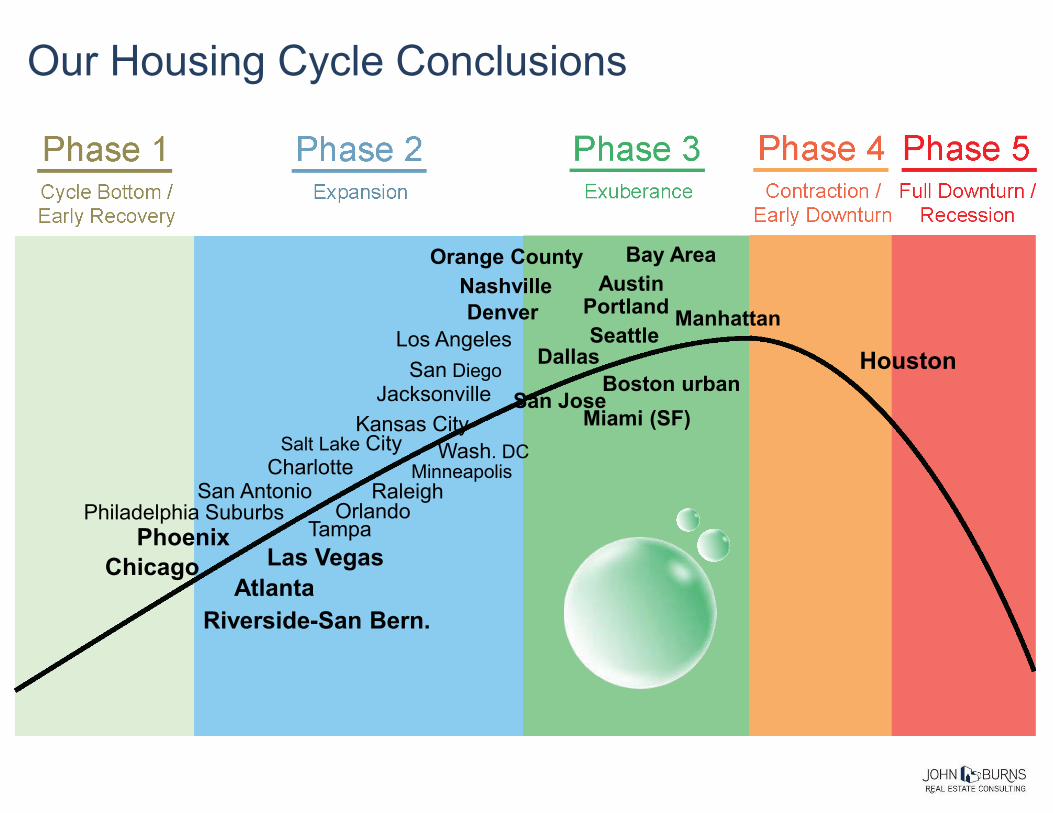
Houston
Orange County
Los Angeles
Riverside-San Bern.
Chicago
Dallas
Austin
Orlando
Las Vegas
Wash. DC
Tampa
Nashville
Phoenix
Atlanta
CharlotteRaleighSan Antonio
Bay Area
DenverSeattle
Philadelphia Suburbs
Minneapolis
ManhattanPortland
Miami (SF)Boston urbanSan Diego
Jacksonville
Salt Lake City
Our Housing Cycle Conclusions
San JoseKansas City
Demographic
Clarity
for Business

Demographics drive the economy with household formation and home buying

1. Group the Generations into Decade Born
2. Filter through the 4-5-6 Rule
2025347 million (+8%)
INFLUENCERS
LIFE
STAGES
New Framework for Demographic Clarity
0
1,000,000
2,000,000
3,000,000
4,000,000
5,000,000
NU
MB
ER
OF
BIR
TH
S
YEAR
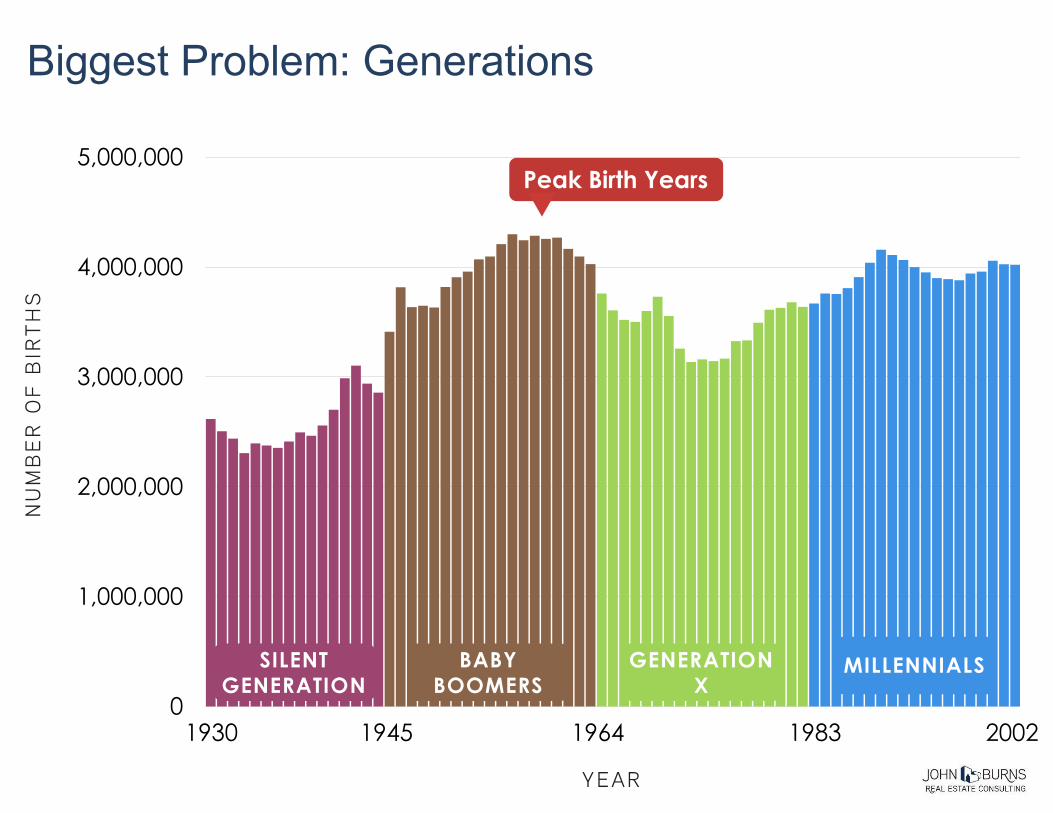
Peak Birth Years
1930 1945 1964 1983 2002
SILENT
GENERATION
BABY
BOOMERS
GENERATION
XMILLENNIALS
Biggest Problem: Generations

32 year old
Working Father
16 year old
High School Junior
1984 2002M I L L E N N I A L S
What do these two have in common?
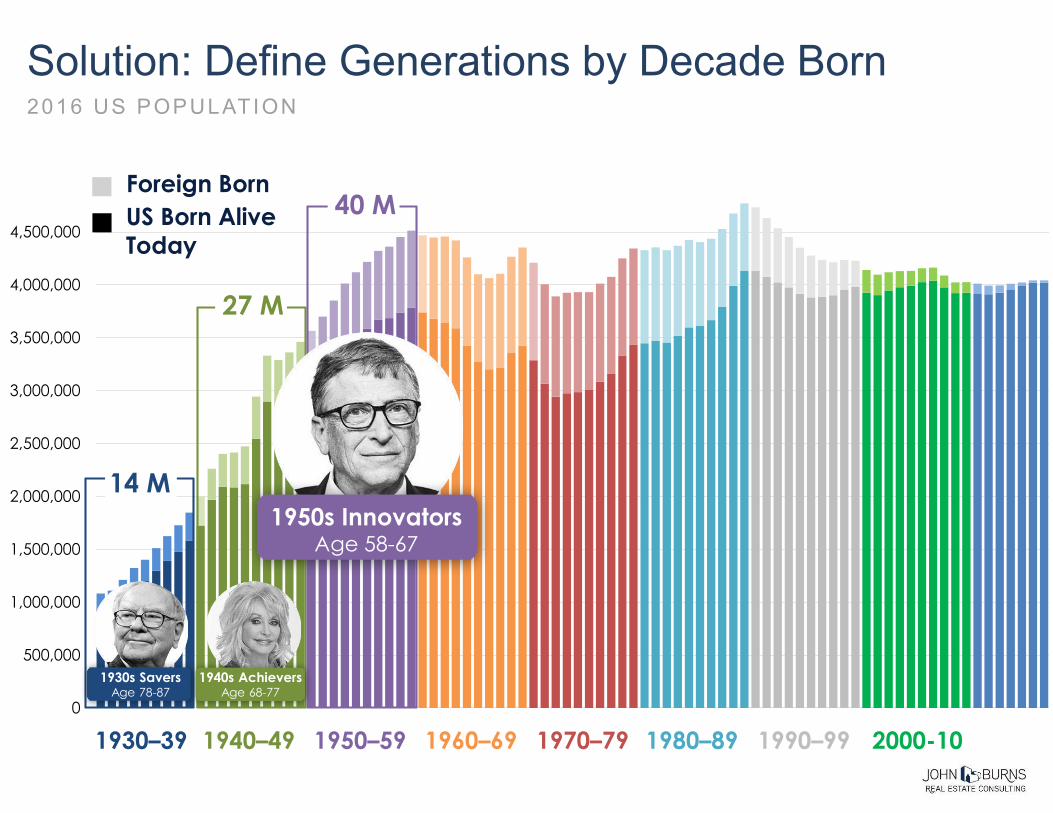
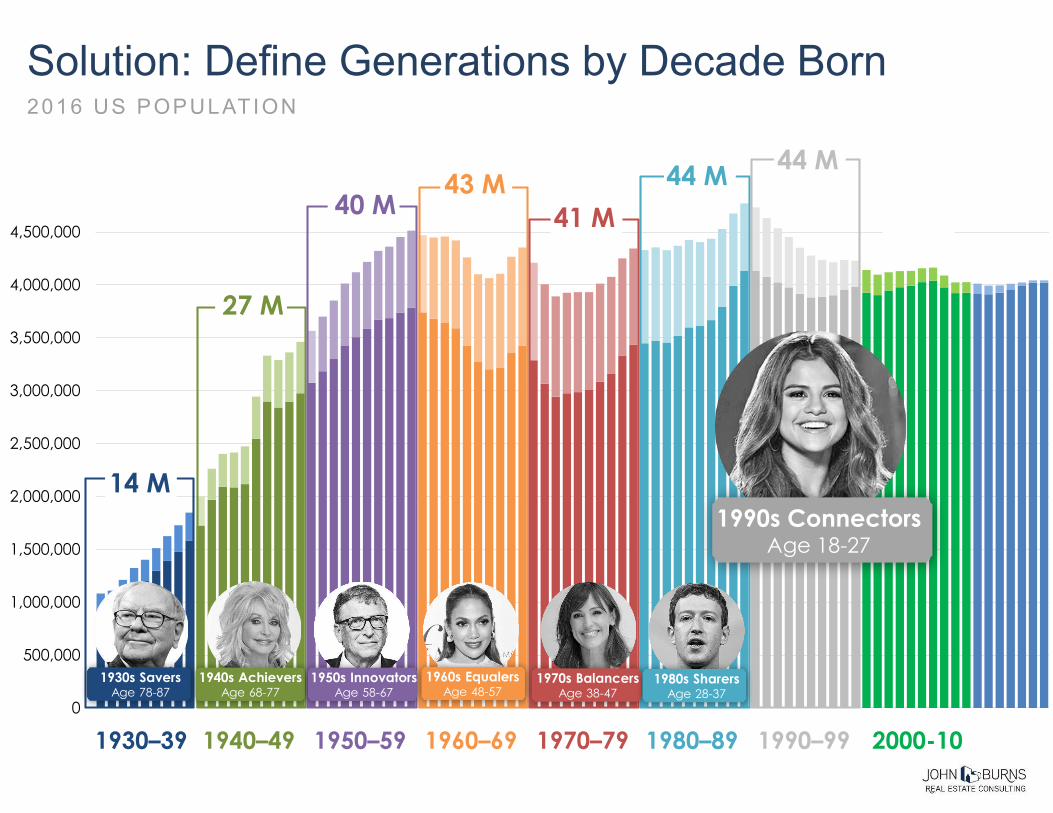
Solution: Define Generations by Decade Born2016 US POPULATION
0
500,000
1,000,000
1,500,000
2,000,000
2,500,000
3,000,000
3,500,000
4,000,000
4,500,000US Born Alive
Today
Foreign Born
27 M
40 M
1930s SaversAge 78-87
1940s AchieversAge 68-77
14 M
1930–39 1940–49 1950–59 1960–69 1970–79 1980–89 1990–99 2000-10
1950s InnovatorsAge 58-67
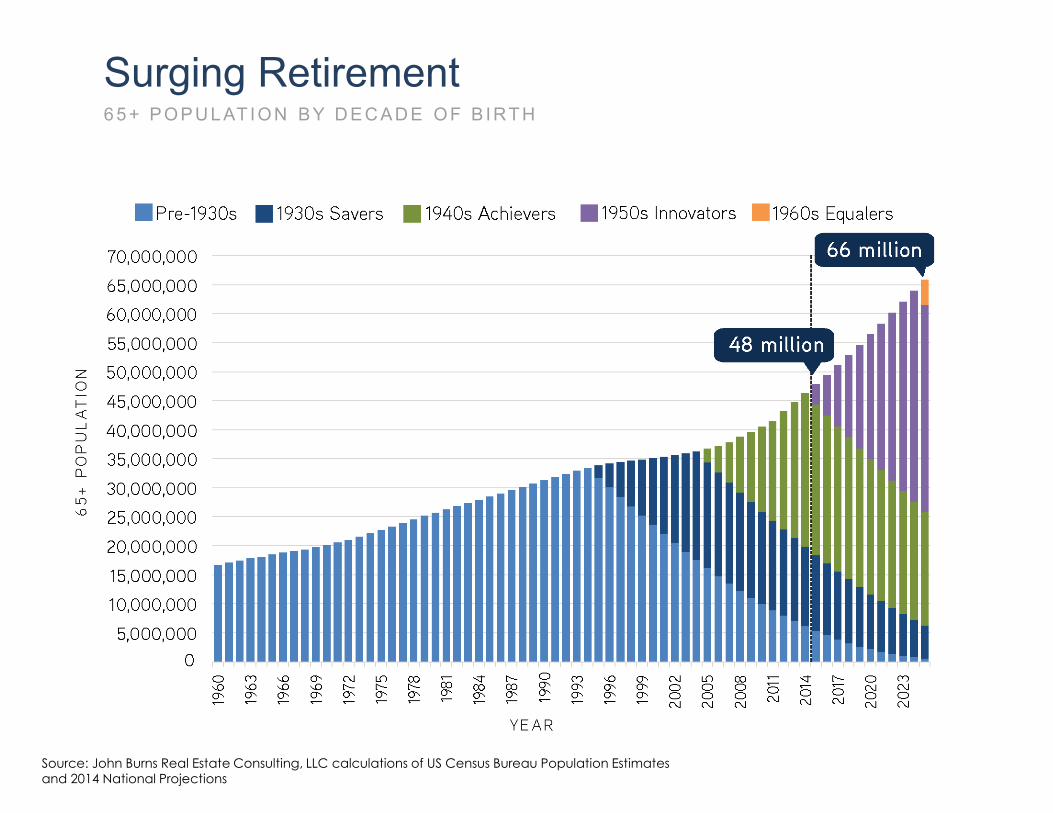
Surging Retirement6 5 + PO PU L AT IO N BY D EC AD E O F B IRT H
Source: John Burns Real Estate Consulting, LLC calculations of US Census Bureau Population Estimates
and 2014 National Projections

1930s
I N N O V A T O R S
1950s
40 Million Aged 57-66

1930s
I N N O V A T O R S
1950s
40 Million Aged 57-66

0
500,000
1,000,000
1,500,000
2,000,000
2,500,000
3,000,000
3,500,000
4,000,000
4,500,000
27 M
40 M43 M
1930s SaversAge 78-87
1940s AchieversAge 68-77
1950s InnovatorsAge 58-67
14 M
1960s EqualersAge 48-57
1930–39 1940–49 1950–59 1960–69 1970–79 1980–89 1990–99 2000-10
Step 1: Define Generations by Decade Born2016 US POPULATION
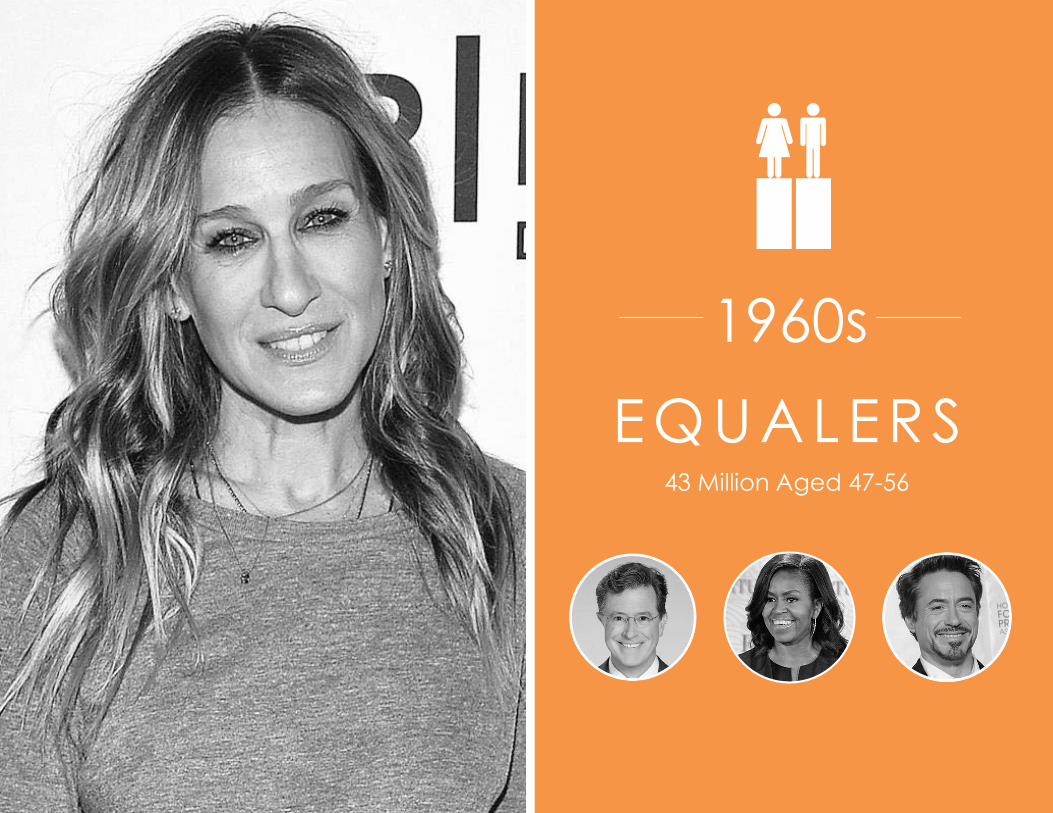
EQUALERS
1960s
43 Million Aged 47-56

EQUALERS
1960s
43 Million Aged 47-56
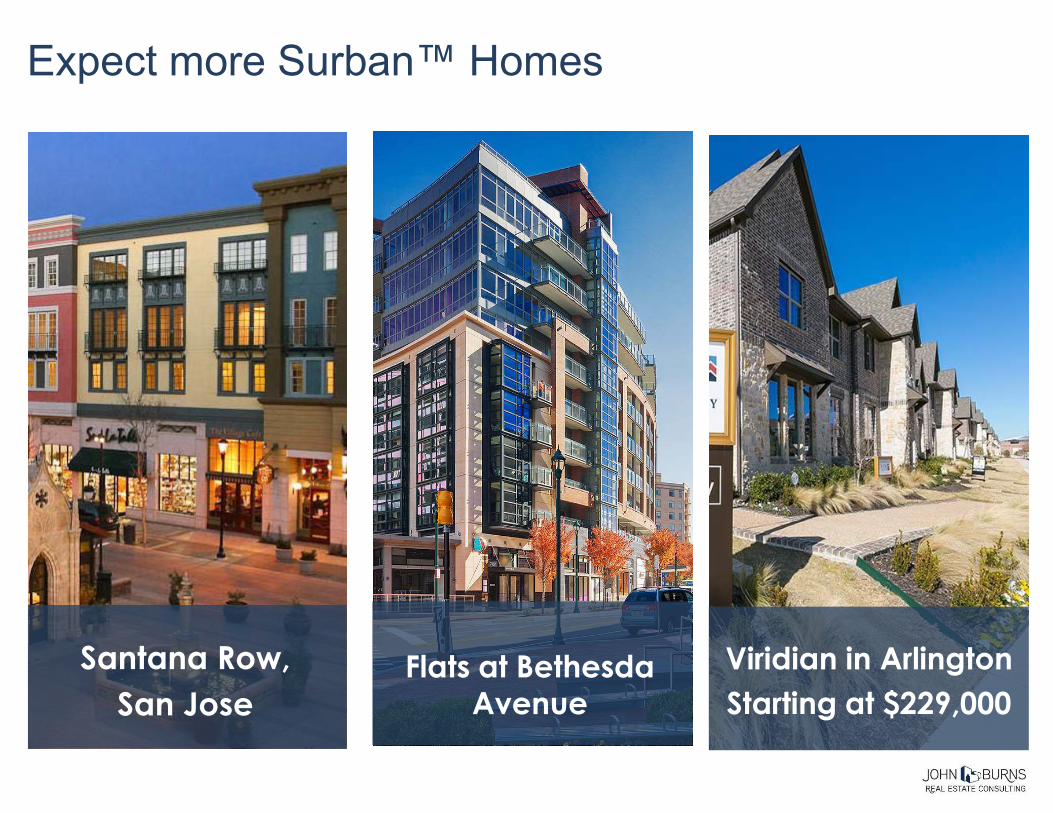
Expect more Surban™ Homes
Santana Row,
San Jose
Viridian in Arlington
Starting at $229,000Flats at Bethesda
Avenue
0
500,000
1,000,000
1,500,000
2,000,000
2,500,000
3,000,000
3,500,000
4,000,000
4,500,000
27 M
40 M43 M
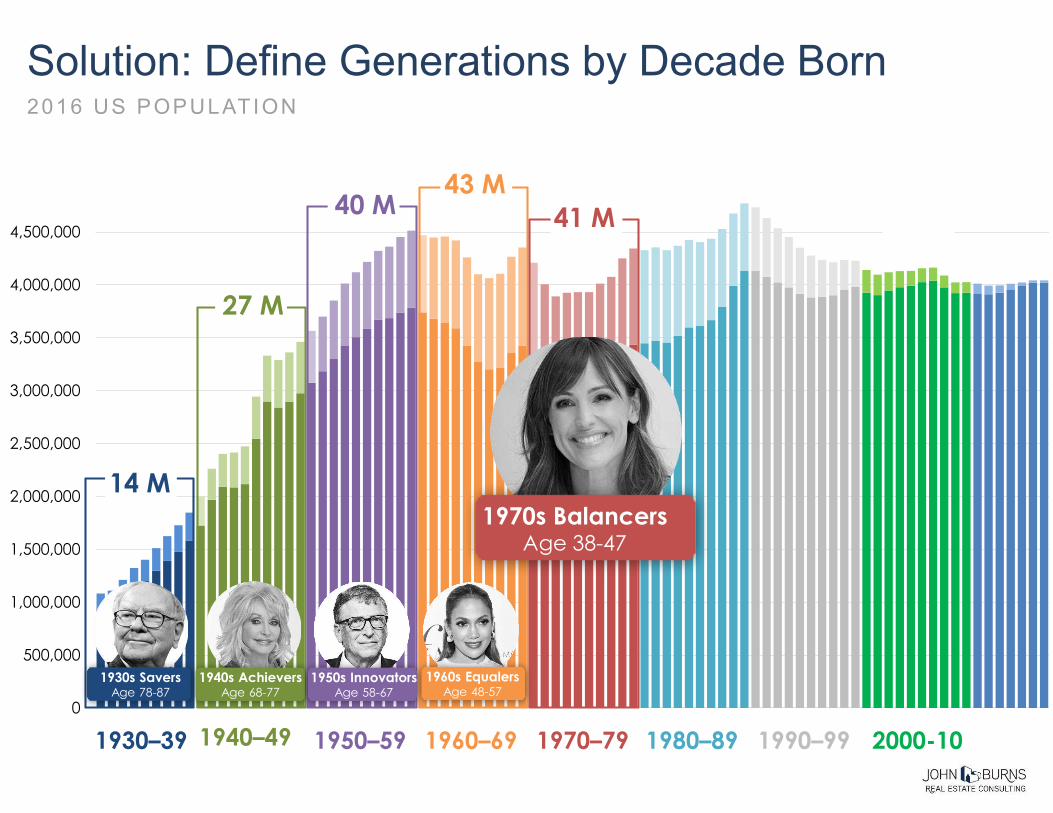
41 M
1930s SaversAge 78-87
1940s AchieversAge 68-77
1950s InnovatorsAge 58-67
14 M
1970s BalancersAge 38-47
1960s EqualersAge 48-57
1930–39 1940–49 1950–59 1960–69 1970–79 1980–89 1990–99 2000-10
Solution: Define Generations by Decade Born2016 US POPULATION

Source: John Burns Real Estate Consulting, LLC calculations of Bureau of Labor Statistics data; color-coded
based on the year a generation turns 20
37%
Fewer WorkingFEMALE LABOR FORCE PARTICIPATION RATE, AGES 20 –64

44%
23%
29%
More Stay-at-Home MomsSHARE OF MOMS WHO STAY AT HOME FULL T IME
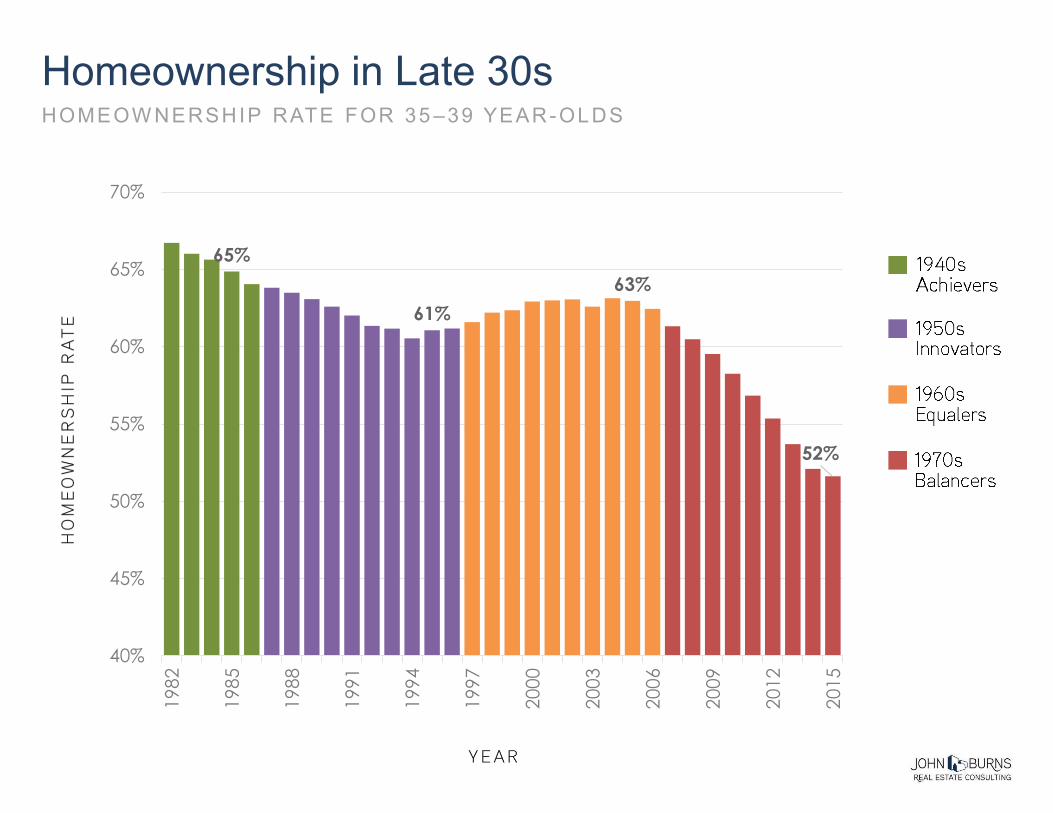
65%
61%
63%
52%
40%
45%
50%
55%
60%
65%
70%1
98
2
198
5
198
8
199
1
199
4
199
7
200
0
200
3
200
6
200
9
201
2
201
5
Homeownership in Late 30sHOMEOW NERSHIP RATE FOR 35 –39 YEAR-OLDS
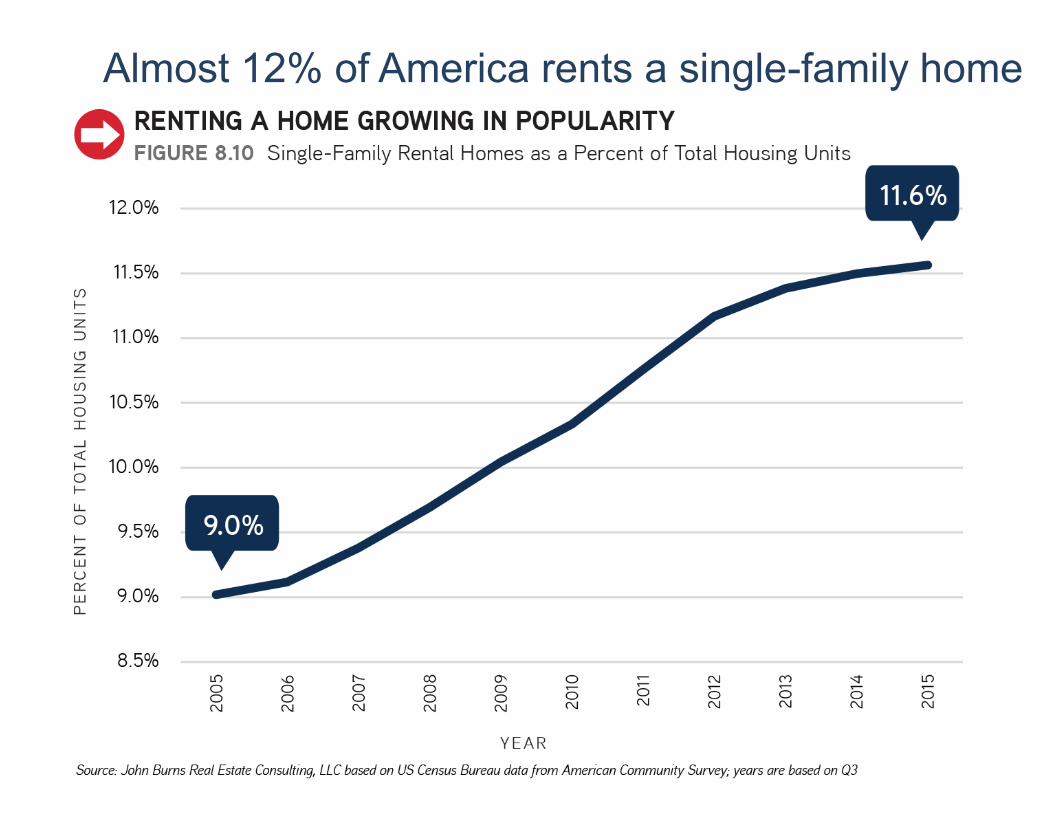
Almost 12% of America rents a single-family home

0
500,000
1,000,000
1,500,000
2,000,000
2,500,000
3,000,000
3,500,000
4,000,000
4,500,000
27 M
40 M43 M
41 M
44 M
1930s SaversAge 78-87
1970s BalancersAge 38-47
1940s AchieversAge 68-77
1950s InnovatorsAge 58-67
14 M
1980s SharersAge 28-37
1960s EqualersAge 48-57
1930–39 1940–49 1950–59 1960–69 1970–79 1980–89 1990–99 2000-10
Solution: Define Generations by Decade Born2016 US POPULATION
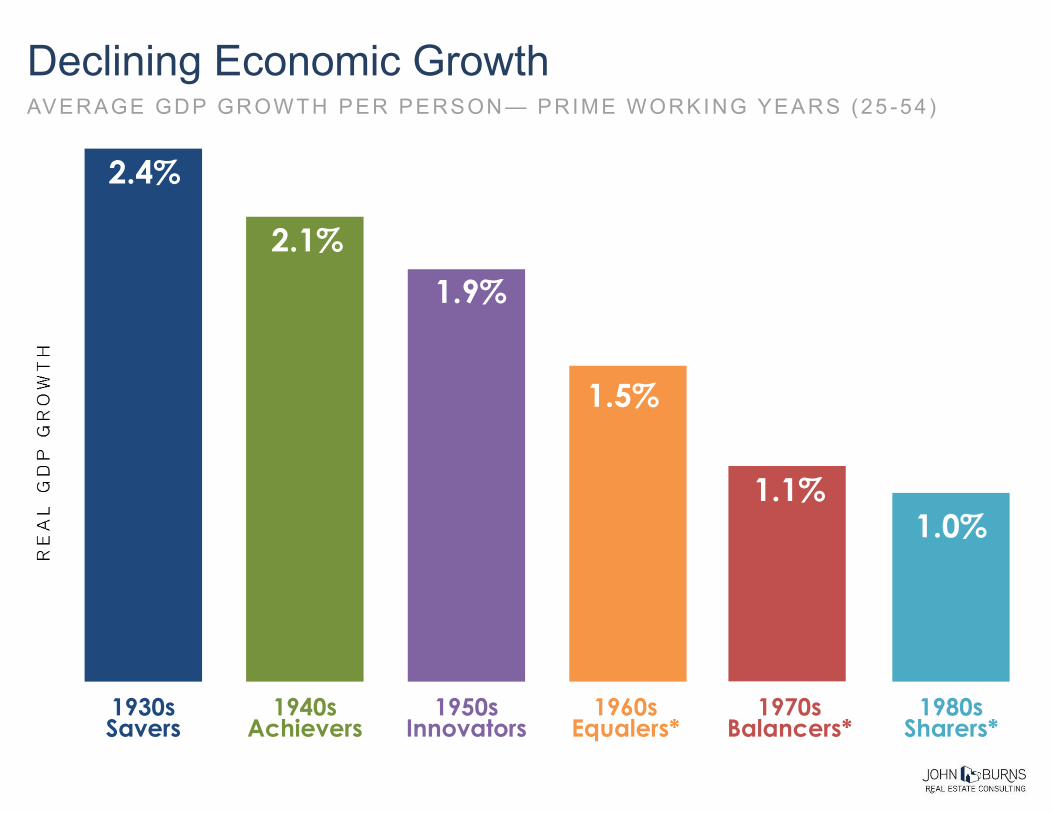
2.4%
2.1%
1.9%
1.5%
1.1%1.0%
1930sSavers
1940sAchievers
1950sInnovators
1960sEqualers*
1970sBalancers*
1980sSharers*
Declining Economic GrowthAVERAGE GDP GROWTH PER PERSON — PRIME WORKING YEARS (25 -54)

SHARERS
1980s
44 Million Aged 27-36
0
500,000
1,000,000
1,500,000
2,000,000
2,500,000
3,000,000
3,500,000
4,000,000
4,500,000
27 M
40 M43 M
41 M
44 M44 M
1930s SaversAge 78-87
1970s BalancersAge 38-47
1980s SharersAge 28-37
1940s AchieversAge 68-77
1990s ConnectorsAge 18-27
1950s InnovatorsAge 58-67
14 M
1960s EqualersAge 48-57
1930–39 1940–49 1950–59 1960–69 1970–79 1980–89 1990–99 2000-10
Solution: Define Generations by Decade Born2016 US POPULATION

Urban and suburban will capture a high share of growthSHARE OF HOUSEHOLD GROW TH BY DECADE
Source: John Burns Real Estate Consulting, LLC based on US Census Bureau data


0
500,000
1,000,000
1,500,000
2,000,000
2,500,000
3,000,000
3,500,000
4,000,000
4,500,000
27 M
40 M43 M
41 M
44 M44 M
41 M
1930s SaversAge 78-87
1970s BalancersAge 38-47
1980s SharersAge 28-37
1990s ConnectorsAge 18-27
1940s AchieversAge 68-77
1950s InnovatorsAge 58-67
14 M
1960s EqualersAge 48-57
2000s GlobalsAge 8-17
1930–39 1940–49 1950–59 1960–69 1970–79 1980–89 1990–99 2000-10
Solution: Define Generations by Decade Born2016 US POPULATION
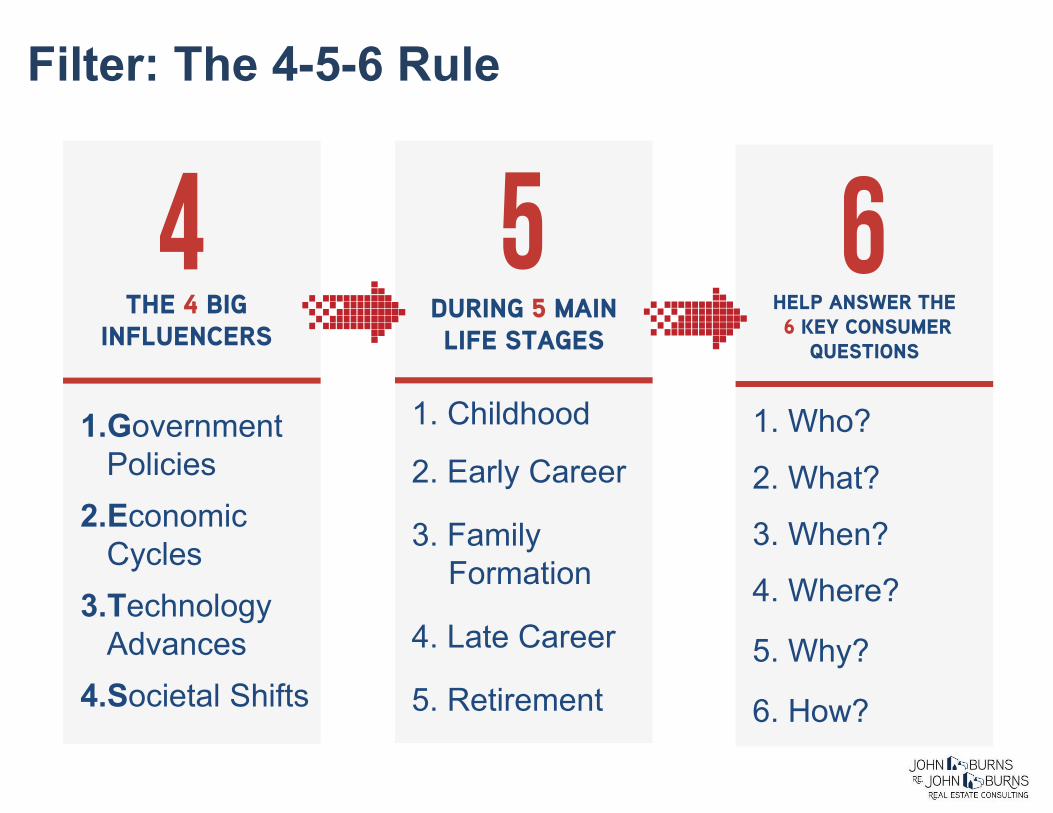
THE 4 BIG
INFLUENCERS
1.Government Policies
2.Economic Cycles
3.Technology Advances
4.Societal Shifts
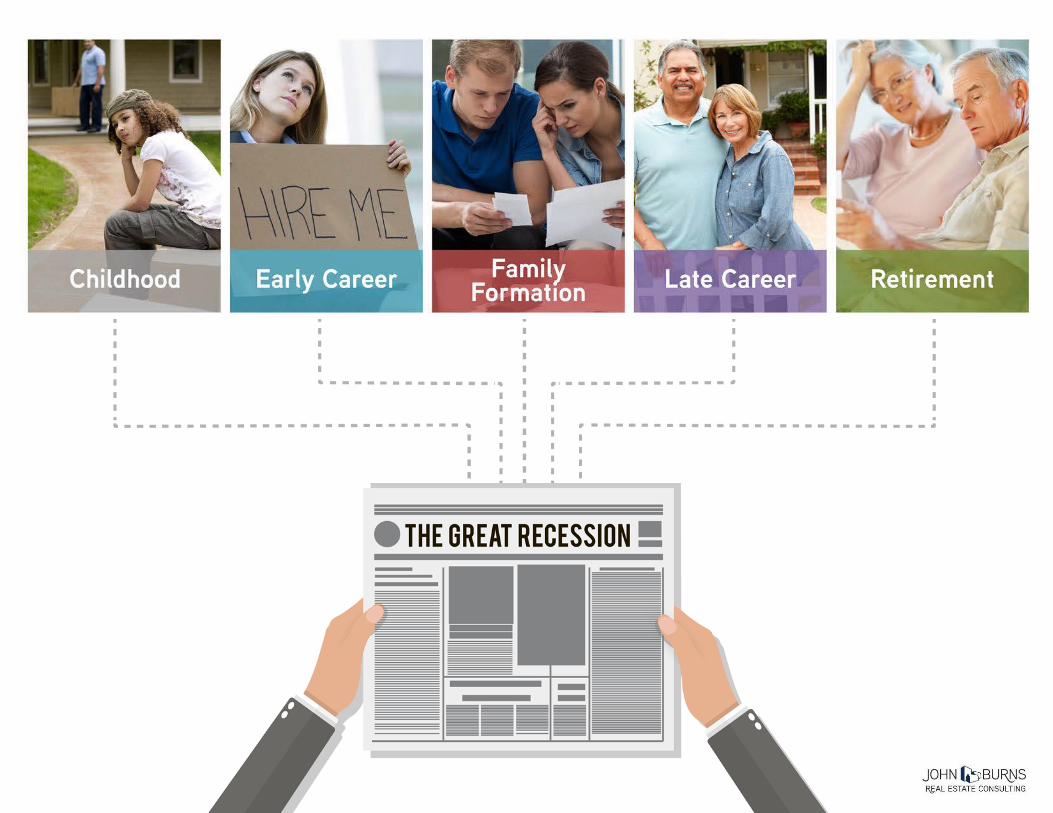
DURING 5 MAIN
LIFE STAGES
1. Childhood
2. Early Career
3. Family Formation
4. Late Career
5. Retirement
Filter: The 4-5-6 Rule
HELP ANSWER THE
6 KEY CONSUMER
QUESTIONS
1. Who?
2. What?
3. When?
4. Where?
5. Why?
6. How?
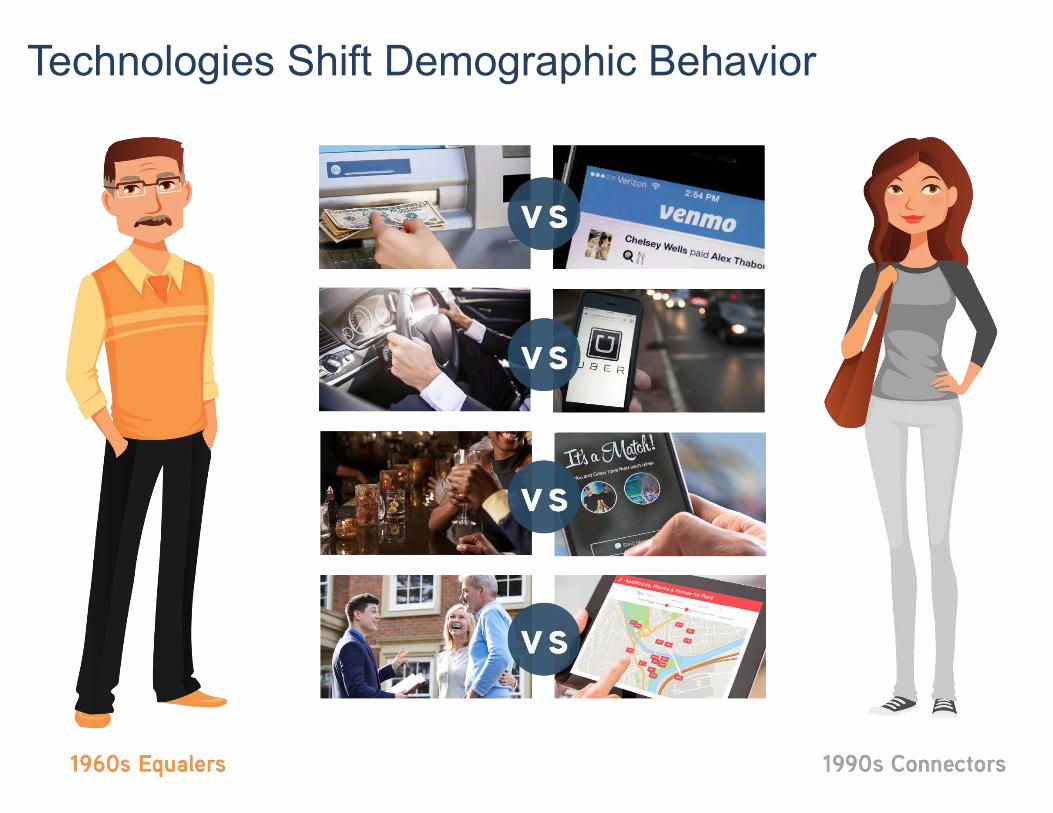
Technologies Shift Demographic Behavior

Each generation from 1950 on should form 23-24 million households.ESTIMATED 2016 HOUSEHOLDS BY DECADE BORN
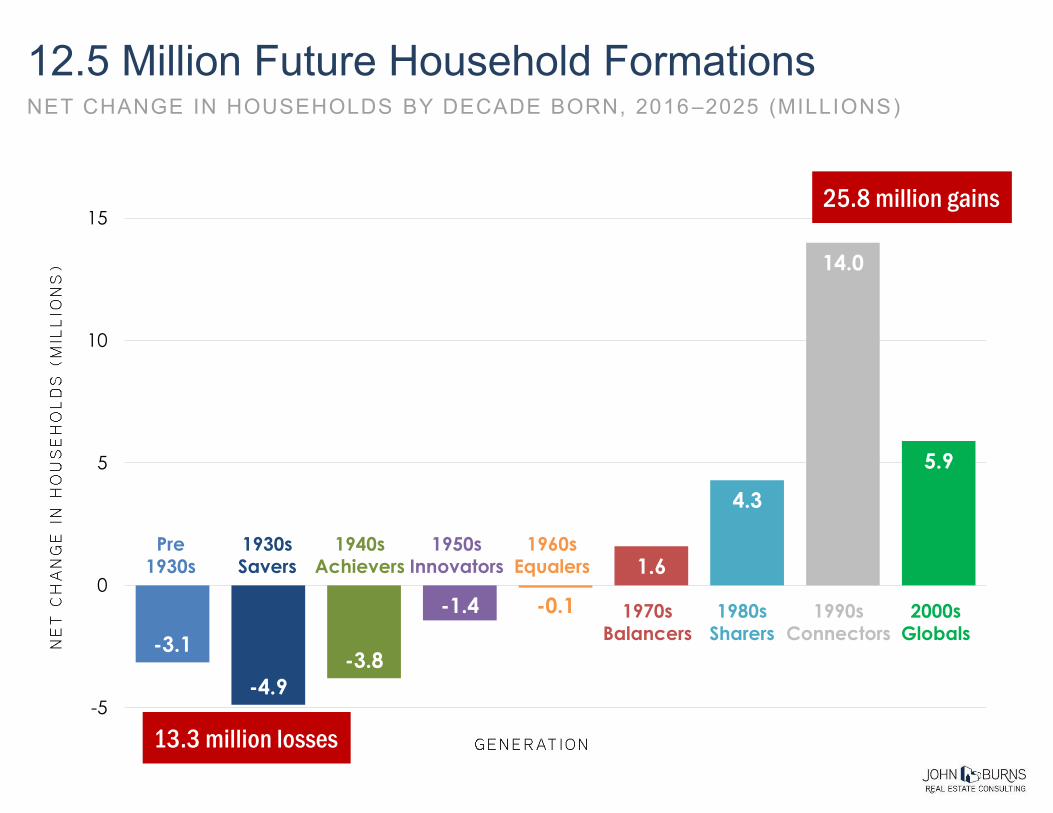
-3.1
-4.9
-3.8
-1.4 -0.1
1.6
4.3
14.0
5.9
-5
0
5
10
15
Pre 1930s
1930sSavers
1940sAchievers
1950sInnovators
1960sEqualers
1970sBalancers
1980sSharers
1990sConnectors
2000sGlobals
13.3 million losses
25.8 million gains
12.5 Million Future Household FormationsNET CHANGE IN HOUSEHOLDS BY DECADE BORN, 2016 –2025 (MILLIONS)

-2,000,000
0
2,000,000
4,000,000
6,000,000
8,000,000
10,000,000
12,000,000
Under Age 45
Age 45–64
Age 65+
0.01 M
0.8 M
2.5 M
-0.8 M
-0.2 M
5.4 M
4.3 M
0.5 M
Big Shift in Household CompositionHOUSEHOLD FORMATION BY AGE GROUP, 2016–2025
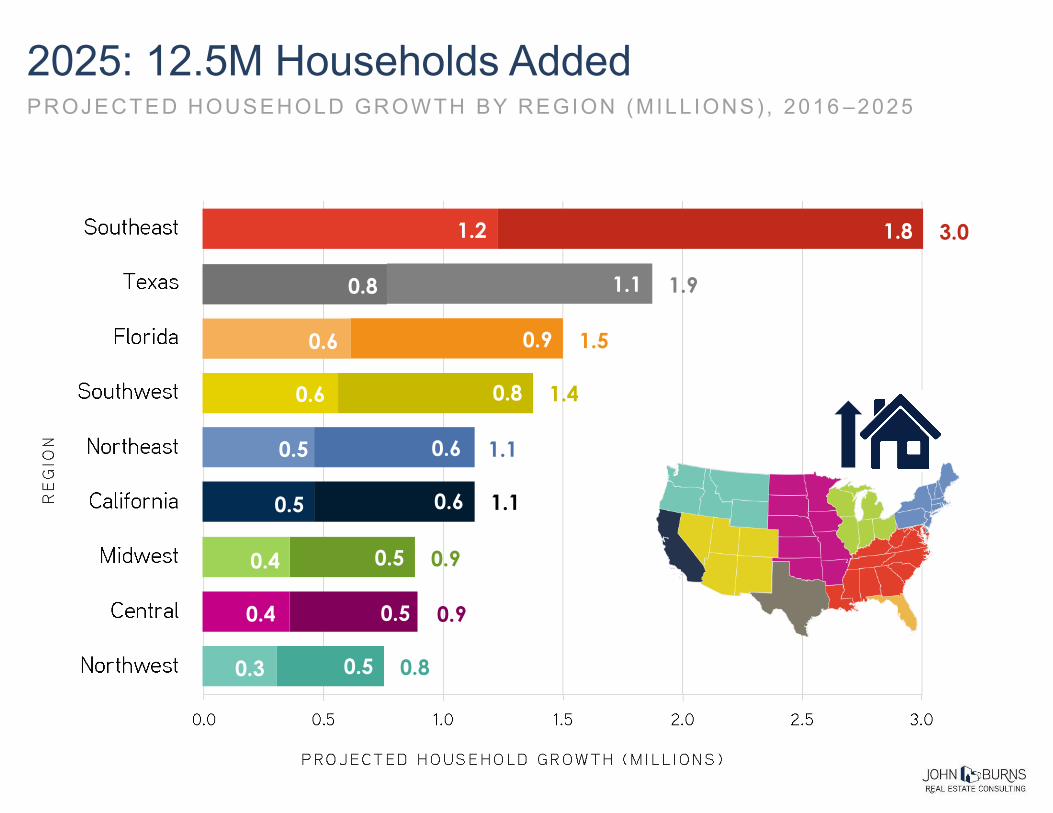
1.1
0.9
0.8
1.8
0.5
0.6
0.5
0.5
0.6
2025: 12.5M Households AddedPROJECTED HOUSEHOLD GROWTH BY REGION (MILL IONS) , 2016 –2025
Owners Renters
1.2
0.8
0.6
0.6
0.3
0.5
0.4
0.4
0.5
1.9
1.5
1.4
3.0
0.8
1.1
0.9
0.9
1.1
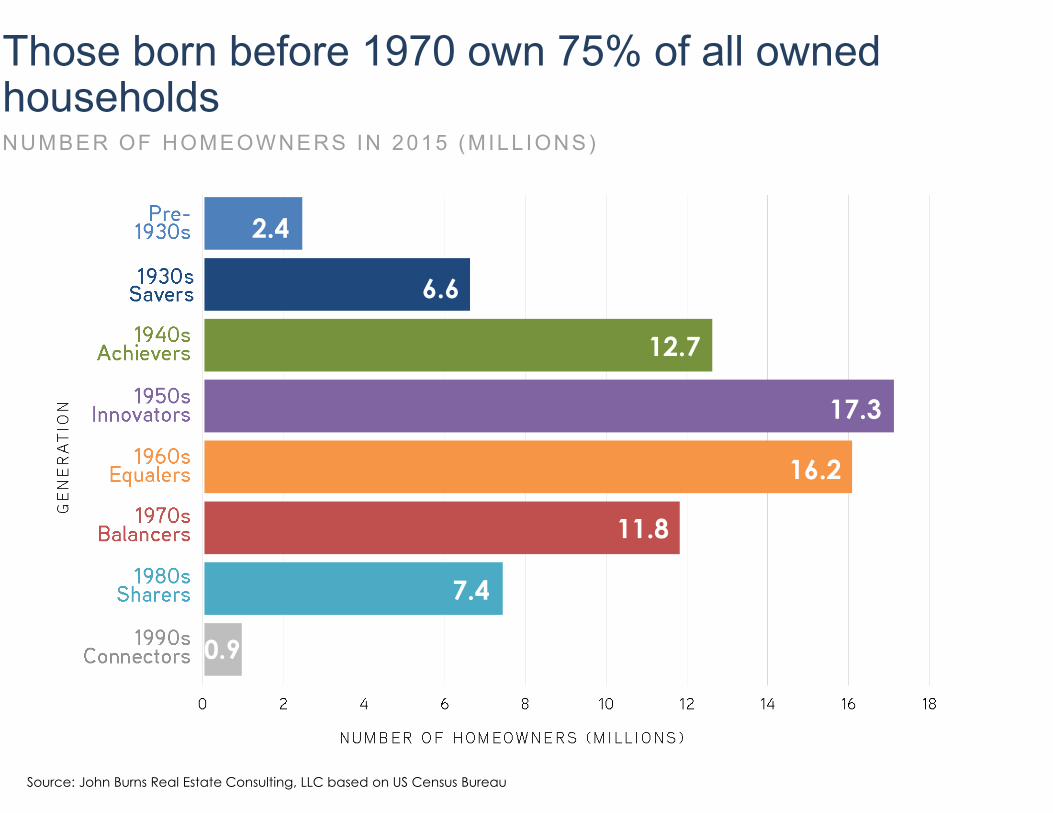
Those born before 1970 own 75% of all owned householdsNUMBER OF HOMEOWNERS IN 2015 (MILL IONS)
2.4
6.6
12.7
17.3
16.2
11.8
7.4
0.9
Source: John Burns Real Estate Consulting, LLC based on US Census Bureau
Sources: John Burns Real Estate Consulting
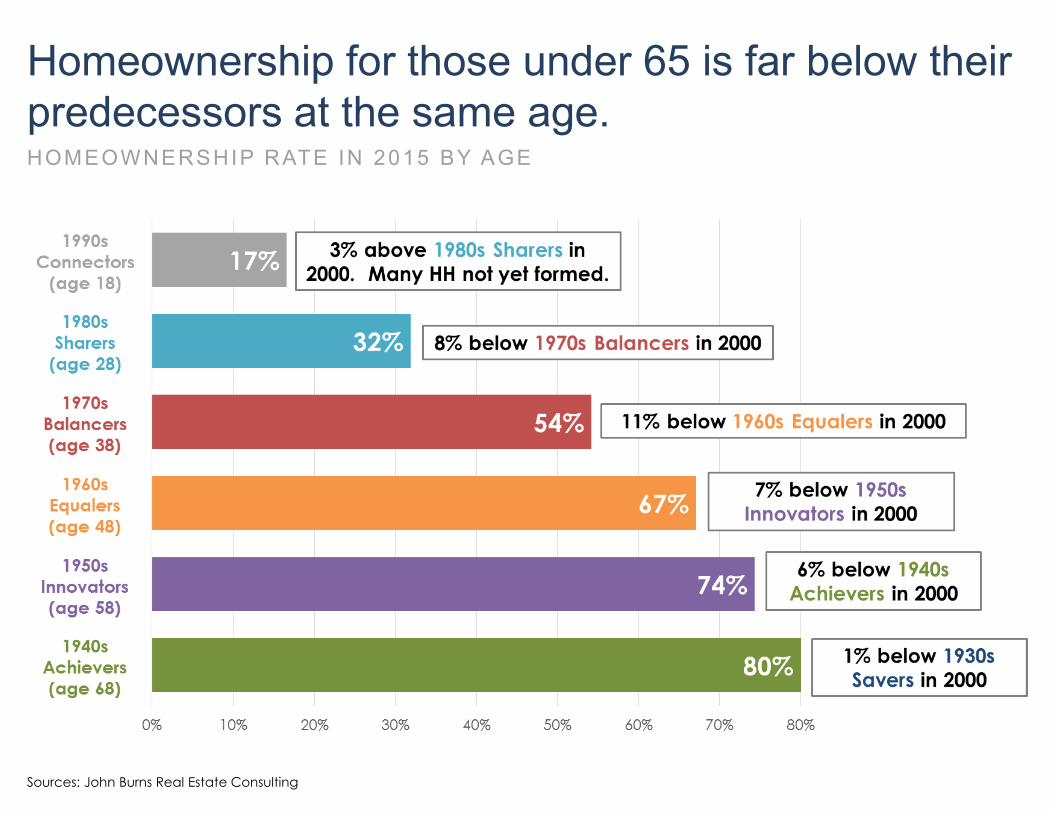
Homeownership for those under 65 is far below their predecessors at the same age.HOMEOWNERSHIP RATE IN 2015 BY AGE
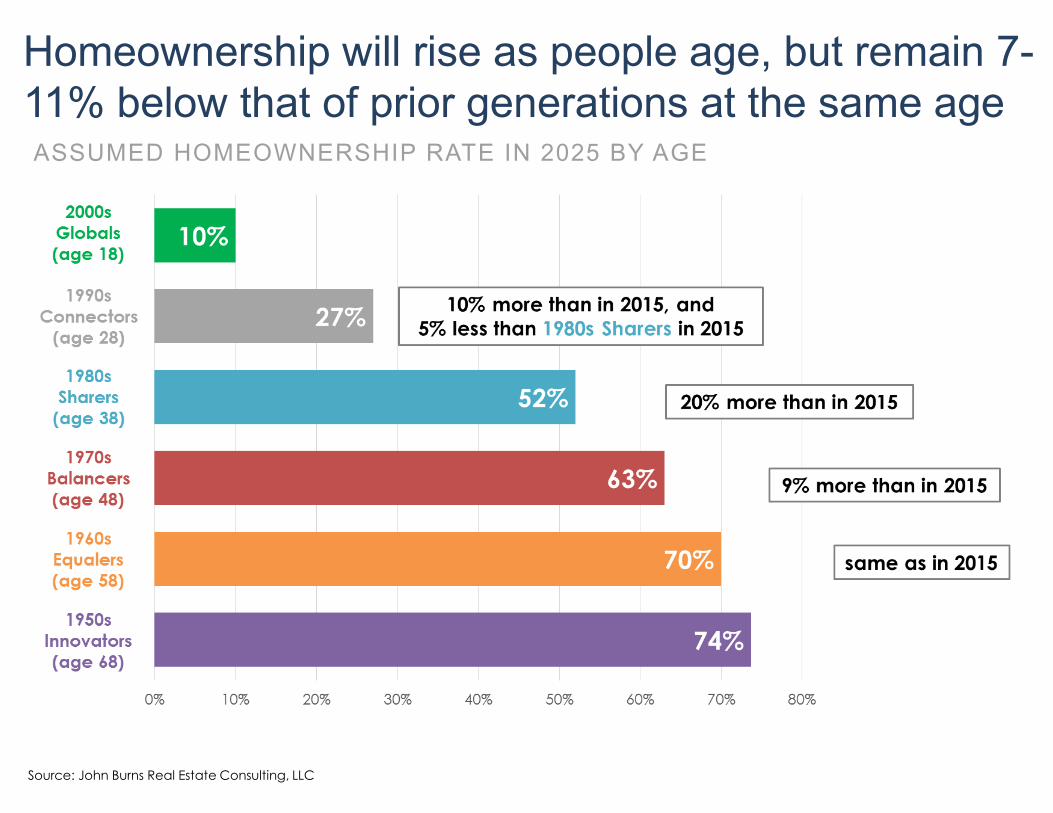
Homeownership will rise as people age, but remain 7-11% below that of prior generations at the same ageASSUMED HOMEOWNERSHIP RATE IN 2025 BY AGE
Source: John Burns Real Estate Consulting, LLC
Pre 1930s
1930s Savers
1940s Achievers
1950s Innovators
1960s Equalers
1970s Balancers
1980s Sharers
1990s Connectors
2000 Globals
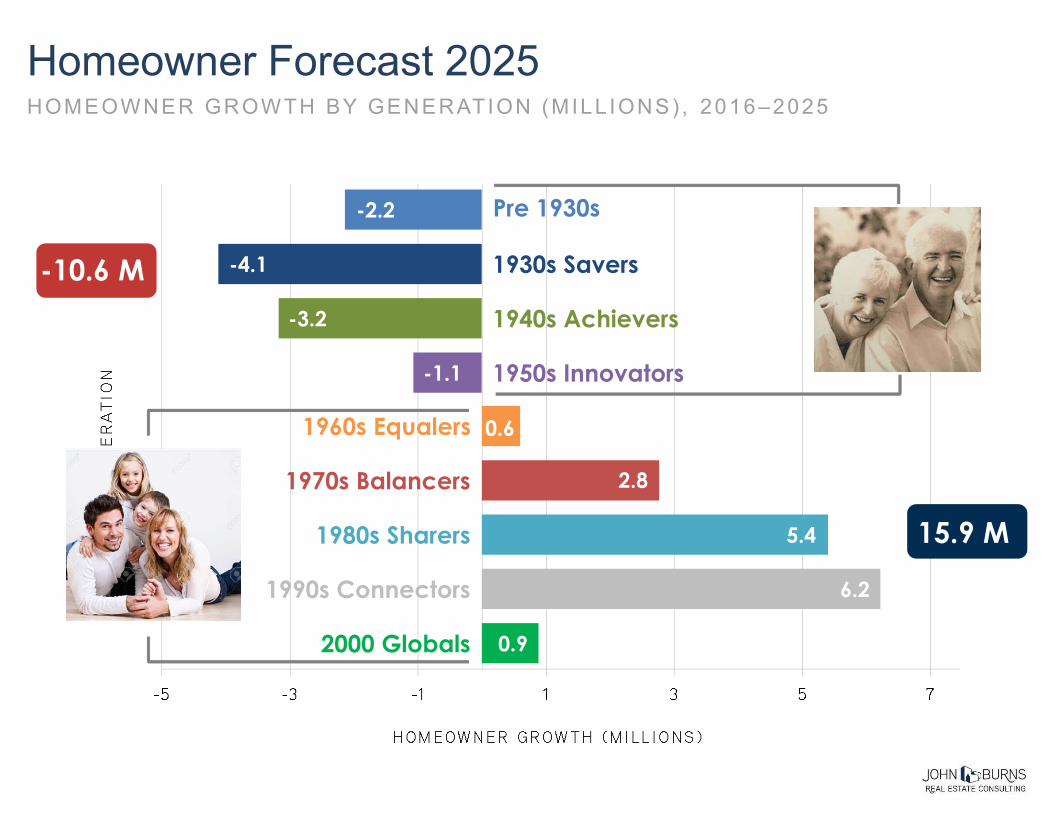
-2.2
-4.1
-3.2
-1.1
0.6
2.8
5.4
6.2
0.9
15.9 M
Homeowner Forecast 2025HOMEOWNER GROWTH BY GENERATION (MILL IONS) , 2016–2025
-10.6 M
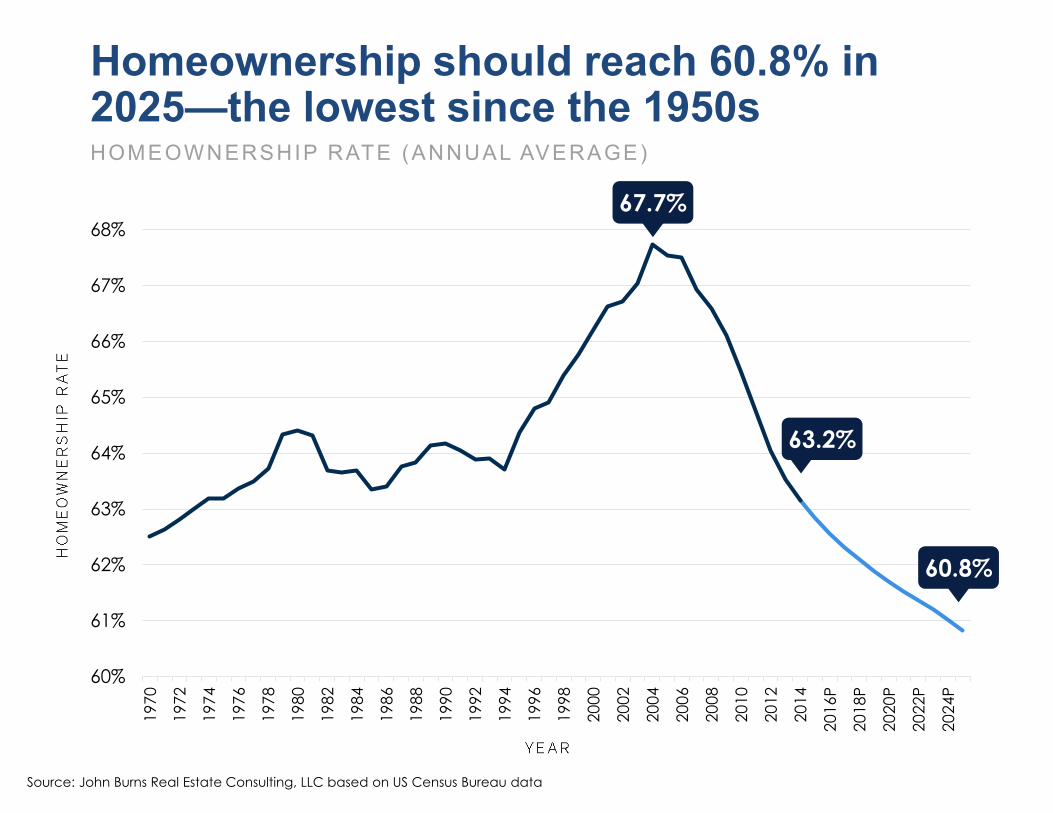
Homeownership should reach 60.8% in 2025—the lowest since the 1950sHOMEOWNERSHIP RATE (ANNUAL AVERAGE)
60%
61%
62%
63%
64%
65%
66%
67%
68%
19
70
19
72
19
74
19
76
19
78
19
80
19
82
19
84
19
86
19
88
19
90
19
92
19
94
19
96
19
98
20
00
20
02
20
04
20
06
20
08
20
10
20
12
20
14
20
16
P
20
18
P
20
20
P
20
22
P
20
24
P
67.7%
63.2%
60.8%
Source: John Burns Real Estate Consulting, LLC based on US Census Bureau data
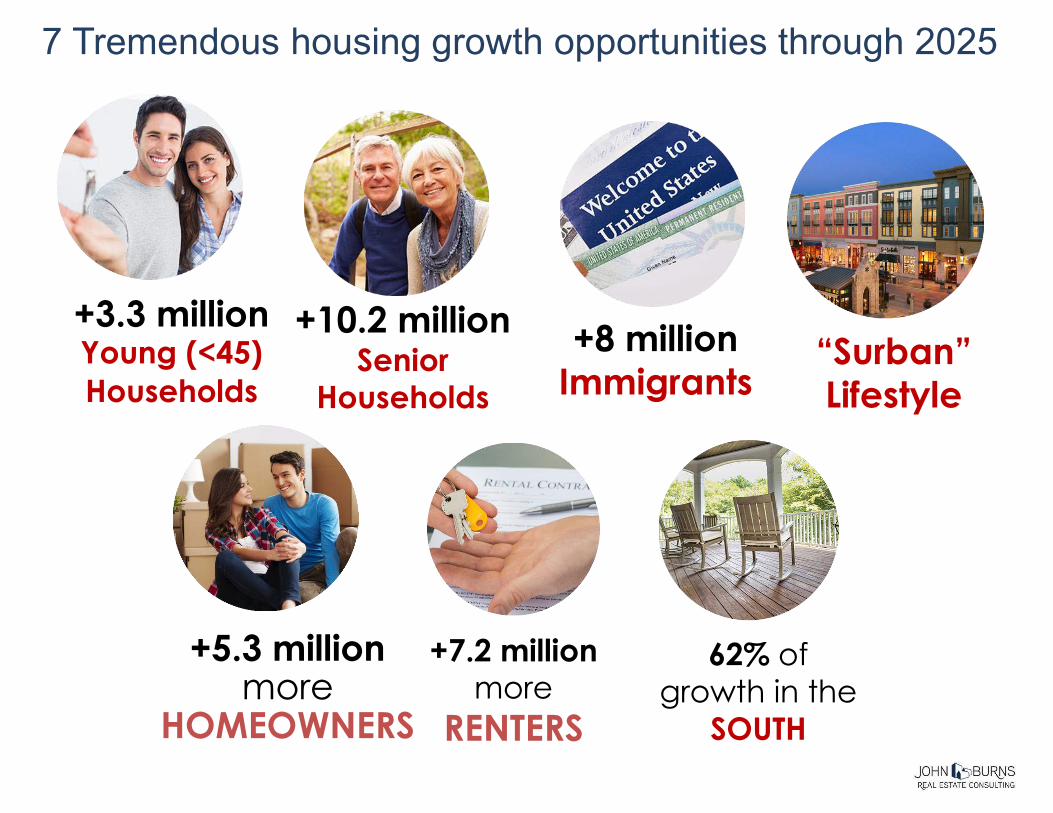
+3.3 millionYoung (<45)
Households
+8 million
Immigrants
+10.2 million Senior
Households
+5.3 millionmore
HOMEOWNERS
7 Tremendous housing growth opportunities through 2025
+7.2 millionmore
RENTERS
62% of
growth in the
SOUTH
“Surban”
Lifestyle


![Por Una Cabeza - Arr.williams-Perlman[1]](https://img.pdfslide.us/doc/110x75/545db836b0af9ff1168b4710/por-una-cabeza-arrwilliams-perlman1.jpg)