Embed Size (px)
Citation preview
Lehigh UniversityLehigh Preserve
Theses and Dissertations
2019
Teachers Matter: Traditional and Non-traditionalTeacher Quality Measures in IndiaPreeti KumarLehigh University, [email protected]
Follow this and additional works at: https://preserve.lehigh.edu/etd
Part of the International and Comparative Education Commons
This Dissertation is brought to you for free and open access by Lehigh Preserve. It has been accepted for inclusion in Theses and Dissertations by anauthorized administrator of Lehigh Preserve. For more information, please contact [email protected].
Recommended CitationKumar, Preeti, "Teachers Matter: Traditional and Non-traditional Teacher Quality Measures in India" (2019). Theses and Dissertations.4355.https://preserve.lehigh.edu/etd/4355
TEACHERS MATTER:
TRADITIONAL AND NON-TRADITIONAL MEASURES OF TEACHER QUALITY IN
INDIA
by
Preeti Kumar
Presented to the Graduate and Research Committee
of Lehigh University
in Candidacy for the Degree of
Doctor of Philosophy
in
Comparative and International Education
Lehigh University
16 August 2018
ii
Copyright
Preeti Kumar
2018
iii
Approval
Approved and recommended for acceptance as a dissertation in partial fulfillment of the
requirements for the degree of Doctor of Philosophy.
_____________________ Date
____________________________________ Dissertation Director
_____________________ Accepted Date
Committee Members:
______________________________ Dr. Alexander W. Wiseman Comparative and International Education Program Director Professor
______________________________ Dr. Peggy Kong Comparative and International Education
Assistant Professor
______________________________ Dr. Qiong Fu Counseling Psychology Professor of Practice
____________________________________ Dr. Lisa Damaschke-Deitrick Comparative and International Education
Professor of Practice
iv
Acknowledgements
This dissertation would not have been possible without the support of the members of my
Dissertation Committee. Professor Alexander Wiseman, as teacher, advisor, supporter, and the
Chair, guided me through every step of the long and endless journey, of the Ph.D. program. I am
truly indebted to his support and trust.
My sincere gratitude goes to Professor Qiong Fu who provided me with very effective feedback
and valuable information for improvement at the appropriate time.
Professor Peggy Kong and Professor Lisa Damaschke-Deitrick willingly accepted my invitation
to serve on the committee. I truly appreciate their valuable time spent on reading my draft and
giving me suggestions. I also thank my dear friend Elizabeth Bruce for patiently editing the draft
and encouraging me at my lowest.
Last but not the least, I give my deepest thanks and love to my husband Sanjeev and our son,
Aadit. They have been the most ardent supporters of my educational pursuit. I am greatly
indebted to their financial and emotional support.
v
Table of Contents
Title Page
Copyright ........................................................................................................................................ ii
Approval ........................................................................................................................................ iii
Acknowledgements ........................................................................................................................ iv
List of Tables ................................................................................................................................ vii
List of Figures .............................................................................................................................. viii
Abstract ........................................................................................................................................... 1
Chapter One: Introduction .............................................................................................................. 2
Problem Statement ..................................................................................................................... 5
Significance of the Study ........................................................................................................... 7
Research Questions .................................................................................................................... 8
Comparative and International Education ................................................................................ 10
Key Factors .............................................................................................................................. 12
Chapter Two: Literature Review .................................................................................................. 15
Organization of Literature Review........................................................................................... 16
Section I ................................................................................................................................... 16
Section II .................................................................................................................................. 30
Findings from Literature Review ............................................................................................. 43
Section III ................................................................................................................................. 44
Chapter Three: Methodology ........................................................................................................ 57
Qualitative Research Methodology and Rationale ................................................................... 57
Quantitative Research Methodology and Rationale ................................................................. 70
Independent Variables (IV)—Traditional teacher quality variables. ............................. 78
Independent Variables (IV)—Non-traditional teacher quality variables. ...................... 79
Dependent Variable (DV). .............................................................................................. 80
Chapter Four: Results ................................................................................................................... 86
Qualitative Phase ...................................................................................................................... 86
Traditional teacher quality variables. ............................................................................. 90
Traditional teacher quality variables. ............................................................................. 94
Quantitative Phase .................................................................................................................. 109
Descriptive statistics. .................................................................................................... 110
Summary of Quantitative Results .......................................................................................... 124
Chapter Five: Discussion ............................................................................................................ 126
Summary ................................................................................................................................ 126
Conclusion ............................................................................................................................. 140
Recommendations .................................................................................................................. 145
Concluding Remarks .............................................................................................................. 146
References ................................................................................................................................... 147
Appendix A ................................................................................................................................. 167
vi
Appendix B ................................................................................................................................. 168
Appendix C ................................................................................................................................. 171
Biography .................................................................................................................................... 172
vii
List of Tables
Table 1. Categories and Sub-categories for Teacher Quality Measures………………..……….13
Table 2. Traditional Teacher Quality Variable Keywords……………………………….……...63 Table 3. Non-Traditional Teacher Quality Variable Keywords…………….……….…………..63 Table 4. Pages Coded in Pilot Coding and Final Coding.….…………………………………....65 Table 5. Additional Teacher Quality Variable from NCF 2005, NCFTE 2009, and NPE 2016...69
Table 6. Data Frequency Matrix for Traditional Teacher Quality Variables………..….……….86
Table 7. Data Frequency Matrix for Non-Traditional Teacher Quality Variables Including Teacher Accountability……………………………………………………………….…….……87
Table 8. Pearson’s Correlation between Predictor Variables and Mean Mathematics Scores………………….………………….…………………………….………….……..….…115 Table 9. Multiple Regression Results Investigating the Association Between Traditional Teacher Quality Variables and Students’ Mathematics Performance.…..………………………………117 Table 10. Multiple Regression Results Investigating the Association Between the Non-Traditional Teacher Quality Variables and Students’ Mathematics Performance..……………119 Table 11. Multiple Regression Results Investigating the Combined Association Between the Non-Traditional Teacher Quality Variables and Students’ Mathematics Performance..…………………………………………………….…………………….….……122
Table B1. Piloted Coding Scheme for Traditional Teacher Quality Variables...………………168 Table B2. Piloted Coding Scheme for Non-Traditional Teacher Quality Variables...…………170 Table B3. Additional Teacher Quality Variable from NCF 2005, NCFTE 2009, and NPE 2016… .…………………………………………………………………………………………………170

viii
List of Figures
Figure 1. Indian education system ................................................................................................ 19
Figure 2. Visual diagram applied to the Indian context showing the relationship between teacher quality variables, students, and performance in mathematics....................................................... 46
Figure 3. Elements of human capital theory and world culture theory applied to India’s focus on teacher quality variables to improve the education quality. ......................................................... 54
Figure 4. Phases in content analysis ............................................................................................. 64
Figure 5. Curricular areas of initial teacher preparation in NCFTE 2009 .................................... 98
Figure 6. Percentage of sentences relating to traditional teacher quality variables in the policy documents ................................................................................................................................... 127
Figure 7. Percentage of sentences relating to non-traditional teacher quality variables in the policy documents ........................................................................................................................ 131
Figure 8. Timeline depicting shift in teacher quality variables and national competitiveness from 2005 to 2016 ............................................................................................................................... 134
1
Abstract
In this age of educational globalization, much focus is on teacher quality as a factor to
improve education quality worldwide. In India, teacher quality is blamed for the poor
performance on the Programme for International Student Assessment (PISA) 2009.
Policymakers are, therefore, looking at teacher quality as a measure to improve student
performance. Through content analysis, this study investigates teacher quality in India using
evidence from the National Curriculum Framework (NCF 2005), National Curriculum for
Teacher Education (NCFTE 2009), and the National Policy on Education (NPE 2016).
Furthermore, this study uses data collected from PISA 2009 testing to analyze teacher quality
variables with student mathematics scores for India. The purpose of this mixed methods analysis
is to identify and analyze both traditional and non-traditional measures of teacher quality and
how teacher quality explains the variance in student performance in mathematics in India. The
study provides a systematic framework for policymakers for further improving teacher quality in
India. Also, the study indicates paths for further research in order to augment educational
practices in India in order to secure better student achievement and improve the country’s global
standing.
2
Chapter One: Introduction
Teachers matter. There is a global consensus that quality teachers are pivotal to quality
education (Azam & Kingdon, 2014; Darling-Hammond, 2000; Hanushek & Rivkin, 2003).
Researchers have found that teacher quality impacts student performance (Abe, 2014; Fong-Yee
& Normore, 2006; Goldhaber & Anthony, 2003; UNESCO, 2006). Drawing from the Coleman
Report released in 1966, Goldhaber (2016) stated that teachers are the single most important
school-related factor in student achievement and, thus, the idea that teachers impact children’s
learning moved to the forefront, where it remains today. In the literature, one may clearly see
how intensely this focus has been placed upon teachers, to the relative exclusion of other factors
influencing the quality of education.
Commenting on teachers occupying a central role in schools and the education policy of a
country, Hanushek and Rivkin (2006) state “there is a prima facie case for the concentration on
teachers, because they are the largest single budgetary element in schools” (p. 1053). In addition,
the Organization for Economic Co-operation and Development (OECD) sets forth the frequent
assertion that among the school variables that are “open to policy influence, teacher quality is the
single most influential factor in determining student achievement” (2005, p. 2). Therefore, it is
apparent that the role of teachers in student learning is given dominant status, which, as a result,
places much pressure upon teachers who seek to serve their students’ learning needs as best they
can.
Given the global consensus on importance of teacher quality in influencing quality of
education that students attain, it is surprising that there is no “standard” definition or
measurement of teacher quality. Ways to measure and estimate teacher quality are questions not
specifically answered. Thus, Goe and Stickler (2008) comment:
3
While many studies attest that some teachers contribute more to their students’ academic
growth than other teachers, research has not been very successful at identifying the
specific teacher qualifications, characteristics, and practices that are more likely to
improve student learning. Unfortunately, this is just the information that education
policymakers need the most. (p. 1)
Countries across the world conceptualize and measure teacher quality in various ways. In
many countries, teacher certification and professional development are used as a component to
define teacher quality. Wiseman and Al-bakr (2013) present teacher licensing, or certification, as
a “ubiquitous component of national education systems and pre-service teacher education around
the world” (p. 289). In the United States, teacher qualifications are used to measure teacher
quality (Azam & Kingdon, 2014). Therefore, the importance of highly qualified teachers is
reflected in the No Child Left Behind (NCLB) Act of 2001. And yet, another global
understanding of what teacher quality entails is evident in China where it is expected that
instructors be continuously engaged in professional development activities, leading them to
become higher quality teachers who can better contribute to their students’ achievement
(Robinson, 2008).
A report by the OECD reveals that Brazil, a developing country like India, has taken
many steps since the mid-1990s to improve teacher quality (2015). Specifically, the 1996 Law on
National Educational Guidelines and Framework mandated that all teachers attain a university
qualification with in-service training and an increased number of practice teaching days (OECD,
2015).
Wiseman and Al-bakr (2013) cite the ubiquity of quickly developing education systems
in nations around the world measuring teacher quality on the basis of standardized student

4
achievement test scores (pp. 289, 291). Similarly, in Russia, teacher quality is determined by
scores students get after completion of the eleventh grade, the final year of high school. Every
student in the country takes the common entrance exam, the Unified State Exam (USE), that
functions as a college entrance examination. The exam is considered high-stakes because of the
massive number of students in Russia who participate. Thus, teacher quality is determined by the
scores students get on the exam (Zakharov, Carnoy, & Loyalka, 2015).
Another way to estimate teacher quality based on students’ test scores is called the “value
added measure” (VAM) approach. This outcome-based approach takes the perspective that a
good quality teacher is one who raises her or his students’ academic growth from one year to the
next year and is now being widely used in the United States (Azam & Kingdon, 2014).
In India, the context of the study, much focus is on teacher quality as a measure to
improve educational quality. Although there is research on assessing teacher quality in India
(Azam & Kingdon, 2014; Muralidharan & Sundararaman, 2011; Nanda, 2017), there is limited
study on the clarity of the definition of teacher quality in the policies in India. Unfortunately,
there is no concept of a highly qualified teacher, though the current Minister of State for Human
Resource Development is extending the duration for teacher education in a bid to improve
teacher quality (Nanda, 2017). Conducting a study in private schools in the Indian state of Uttar
Pradesh, Azam and Kingdon (2014) propose using the VAM approach to assess teacher quality
in India, too.
The global overemphasis on certain variables of teacher qualification, teacher
certification, and professional development deemed “traditional” measures of teacher quality
(Goe & Stickler, 2008) fails to consider that there are other “non-traditional” teacher quality
5
variables impacting student outcomes. These traditional and non-traditional teacher quality
variables are the key factors in this study.
Wiseman and Al-bakr (2013) offer their critique of this global model of defining and
measuring teacher quality by stating, “… the fact is that some teachers facilitate student learning
better than others regardless of their educational preparation and expertise in the subject matter,
as measured by their certification” (p. 291). They acknowledge that measuring teacher quality is,
indeed, “elusive” (Wiseman & Al-bakr, 2013, p. 289), and they affirm that there are other factors
that are related to students’ learning in the classroom.
Problem Statement
The problem statement of this study is that despite India’s poor performance on the
Programme for International Student Assessment (PISA) 2009 being blamed on poor teacher
quality, to date, there has been limited study undertaken to analyze India’s performance on PISA
2009 in mathematics on the basis of teacher quality variables. This study can be used as a base or
initial work for those interested in studying teacher quality in the other states in India and quality
of educational resources in India.
It has been stated that the country’s economic strength and the social well-being of its
people are closely linked to the education sector of the country. Since India’s independence in
1947, education as an important factor for the nation’s development has been a major concern of
the Government, which is reflected in its curriculum frameworks and education policies.
In India, the importance of teachers is recognized as influencing student learning and is
embedded in the national education policies. The National Council of Educational Research and
Training (NCERT) in India made a decision in 2004 to revise the existing National Curriculum
Framework (NCF) to improve teacher quality through revamping the existing teacher education
6
with a vision to prepare every child in the country to grow in India’s fast-changing world and
global economy (NCERT, 2005).
The National Curriculum Framework for Teacher Education (NCFTE) 2009’s vision,
drafted by the National Council For Teacher Education (NCTE), is to make the teacher
educational institutions into centers of research and practical training to improve teacher
education and quality in the country (NCTE, 2010). A recent addition to the education policies in
India is the National Policy on Education 2016 by the Government of India, that seeks to
“address the unfinished agenda relating to the goals and targets set in the previous national
policies on education and the current and emerging national development and education sector-
related challenges” (Government of India Ministry of Human Resource Development [MHRD],
2016a, p. 6).
Studies conducted, though limited, have established the relationship between teacher
quality and student outcomes in India (Azam & Kingdon, 2014; Muralidharan & Sundararaman,
2011; Singh & Sarkar, 2012). Azam and Kingdon’s study (2014) in India on teacher quality in
private schools reveals that teacher quality matters a “great deal” (p. 4) in students’ achievement,
and within schools, teacher quality varies, impacting student scores. Muralidharan and
Sundararaman (2011) show how teacher incentives like performance pay help increase student
performance, while Singh and Sarkar (2012) show how teacher practices in the classroom affect
student performance.
For the first time, two Indian states, Tamil Nadu and Himachal Pradesh, participated in
the PISA in 2009. The “embarrassing” results (Chhapia, 2013, p. 1), where India ranked second
to last amongst 73 countries, resulted in the country opting out of the 2012 and 2015 rounds of
the assessment (OECD, 2010). The results revealed that not more than 15% of the children (15
7
years of age) who participated in the testing could perform basic mathematics skills, shedding
light on the education quality in the country (OECD, 2010). Furthermore, publicizing the poor
performance in PISA 2009, an article in a leading Indian newspaper, The Times of India, stated
that an eighth-grade Indian student is at a similar level to a third-grade South Korean student in
mathematics; an eighth-grade Indian student in reading also, on average, is at Shanghai’s second-
grade level. Questions arose related to teachers, and teachers were blamed for the poor
performance of students (Rao, 2013).
Significance of the Study
The significance or the purpose of the study is to show through evidence that teacher
quality cannot be only measured by traditional variables of teacher qualification, teacher
certification, and teachers’ professional development and that there are other non-traditional
variables that enhance teacher quality to improve student performance that policymakers are
overlooking. Despite India’s poor performance on the international benchmark, there has been
limited study to analyze India’s performance on PISA. Rather, there have been criticisms of the
poor quality of Indian teachers and low education quality in the country. Due to its poor
performance in 2009, India has consciously opted out of the 2012 and the 2015 PISA testing
(Venkatachalam, 2017). However, per a recent leading newspaper report, the country is set to
participate in PISA 2021 (Venkatachalam, 2017).
Given the evidence through studies (Azam & Kingdon, 2014; Muralidharan &
Sundararaman, 2011; Singh & Sarkar, 2012) that teachers play an important role in student
outcomes in India, it is important to analyze the various teacher quality variables and their
correlation to student outcomes within the framework of the PISA 2009 testing to improve
teacher quality in the country. This study looks into the latest national policies for education in

8
India to see how the policymakers address the teacher variables. Then the study identifies or
uncovers teacher quality variables that are highly correlated to student outcomes in mathematics
in India. The information on the highly effective teacher characteristics is generated by
comparing the traditional and non-traditional teacher quality variables.
Accepting the fact that every country participating in the PISA assessment varies from
one another on social, cultural, and economic factors, the study analyzes the teacher quality
measures or variables related to the Indian context only, rather than making cross-national
comparisons between teacher quality measures in India and the high performing countries on the
PISA assessment. Such an unrealistic comparison would not assist India in making policy
changes to enhance its teacher quality. The research is limited to the PISA 2009 data as India has
only participated in PISA 2009 so far.
To ensure that students in India get access to quality teachers, the study provides
evidence to policymakers to enable them to judicially focus on those teacher variables that highly
relate to student outcomes in mathematics. For the policymakers, the educational system has
limited resources, which should be deployed to maximize student outcomes. Therefore, the
educational leaders and policymakers at the national, local, and school levels can use the
information gained from this study in allocating and spending resources to focus on specific
characteristics in teacher quality to improve student performance in mathematics.
Research Questions
The national education policies, including the NCF 2005, the NCFTE 2009, and the NPE
2016, in India are an integral part of the Indian education system that focus on improving teacher
quality in the country. To understand how the policies address both the traditional and non-
traditional measures of teacher quality, the study analyzes the documents. The study provides
9
information to policymakers to focus their resources and time on those teacher measures that
explain the variance in the student outcomes in mathematics to improve the teacher quality in the
country.
Thus, the first research question may be stated as two complementary questions:
RQ1a: How do Indian national education policy documents (NCF 2005, NCFTE 2009,
and NEP 2016) frame traditional and non-traditional teacher quality
characteristics in reference to student achievement gains?
RQ1b: How did Indian national education policy shift from 2005 to 2016 in reference to
traditional and non-traditional teacher quality characteristics and national
competitiveness?
By analyzing the traditional and non-traditional measures of teacher quality that impact
student outcomes in mathematics, the study identifies those teacher quality measures that are
highly associated with student performance in mathematics on PISA 2009 in India based on the
OECD average score in mathematics. Both the variables are laid out in the key factors section of
this chapter.
Using quantitative data analysis on PISA 2009 data, the study compares traditional and
selected non-traditional measures of teacher quality. Thus, the second research questions
governing the study may also be stated as multiple complementary questions as follows:
RQ2a: Which traditional teacher quality variables are most strongly related to
student mathematics performance in India?
RQ2b: Which non-traditional teacher quality variables are most strongly related to
student mathematics performance in India?

10
RQ2c: How are traditional and non-traditional measures of teacher quality
differently related to student mathematics performance in India?
The research questions, therefore, validate or invalidate several assumptions regarding
the focus by policymakers on traditional and non-traditional teacher characteristics and student
achievement through the data collected from PISA 2009. The validation is essential if one wants
to take a stance in the debate occurring in India regarding the nature of reforms needed in
preparing high quality teachers who can enhance student performance.
Comparative and International Education
The field of comparative and international education (CIE) has been a topic of discussion
since its inception, and there is much debate on what constitutes the field. It is, therefore,
important to place the research topic within CIE’s broad horizon. Also, placing this research
within CIE helps explain the importance of the research study in improving educational
processes locally and globally.
According to Epstein (1992), the terms “comparative” and “international,” though used
synonymously, are distinct. The comparative component of the field is more academic and
analytical, explaining why “educational systems and processes vary and how education relates to
wider social factors and forces,” while the international component is more descriptive, focusing
on “descriptive information about nations and societies and their education systems and
structures” (Epstein, 1992, p. 409). The research here to a large extent fulfills the criteria of CIE
outlined in the definition. It is comparative as it compares India’s educational performance in
mathematics with that of other countries that participated in PISA 2009. It is international as the
teacher quality variables in this research are teacher characteristics that are deemed global or
universal by literature review.
11
Cook, Hite, and Epstein state that comparative education “is held together by a
fundamental belief that education can be improved and can serve to bring about change for the
better in all nations” (2004, p. 27). The research here is based on the belief that within India,
focus on specific teacher quality variables will assist in improving the teacher quality in the
country and impact the education quality.
Furthermore, authors state that for any study to fall under CIE, comparison is an
important characteristic (Brickman, 1966; Epstein, 1992). The inception of this research stems
from “comparison” between India and the participating countries on the PISA 2009 assessment,
where India’s performance ranked second to last amongst 74 participating countries and regions.
Epstein (1992) also defines comparative education as “a field of study that applies social
scientific theories and methods to international issues of education” (p. 409). In this research,
human capital theory and world culture theory provide a framework to explain why India is
focusing on teacher quality to improve the educational quality in the country.
Emphasizing the benefits of the appropriate use of comparative and international
education, Noah (1984) observes that comparative and international education can assist various
actors like policymakers and administrators and form an integral part of teacher education.
Connecting this definition to the research, the main purpose of the study is to provide
information to the policymakers in India to focus on those teacher quality variables that are
related to student mathematics performance.
Bray and Thomas (1995) argue that most research in the field of CIE “requires multilevel
comparative analysis in order to achieve a full and balanced understanding” (p. 488). The
research questions fulfill this requirement of CIE as it looks at the macro-level by analyzing
national policies and also the micro-level practices by analyzing PISA data on teacher quality

12
variables and student performance in mathematics. The purpose in conducting cross-national
studies is so that researchers can use the comparative data to provide policy recommendations to
nation-states. Unfortunately, in India, the PISA 2009 comparative data is merely used to criticize
the quality of education and to blame teachers for the poor performance of students (Chhapia,
2013; Venkatachalam, 2017). Acknowledging the unique global and local connection provided
by the field of comparative and international education, the study, therefore, uses the global
comparative data on teacher quality towards reforming education at the local level and
improving the education system in India.
Key Factors
The key factors considered in the study are context, teacher quality measures, and student
outcomes. As mentioned before, there has been limited study in India on teacher quality with
reference to PISA scores. Therefore, the context in this study is India with specific reference to
the two states of Tamil Nadu and Himachal Pradesh.
Detailed information on the Indian context with respect to its socio-cultural factors,
history, current state of teacher education, and the Indian education policies is provided in the
next chapter. The information is relevant to the study as it reinforces the role a teacher has
historically played in Indian society through student achievement. Recognizing the qualities
required by such a teacher for today’s students is of great significance given India’s poor
performance in PISA 2009. Although the focus of the study is India, literature from other
countries is also included and analyzed due to the limited study conducted in India. Literature
that highlights the traditional and non-traditional teacher quality measures that are included in
the PISA 2009 school survey is considered for the study.

13
The categories and sub-categories of teacher quality measures are presented in Table 1.
Both the traditional and the non-traditional teacher quality measures and the bullet points are
derived from the PISA 2009 school questionnaire created by the OECD main survey (Core B
Consortium, 2008) and the literature review.
Table 1
Categories and Sub-categories for Teacher Quality Measures
Traditional Teacher Quality Measuresa Non-Traditional Teacher Quality Measuresb
Teacher qualification
● Initial education and degree ISCED5A in India is a graduate with a (B.Ed.) degreec.
Teacher certification
● Valid general teacher certification by appropriate authority
Professional development and supervision ● Teacher in-service training and
participation in different activities enhancing teacher knowledge and skills
Teacher salary/performance pay
● Monthly pay and increments ● Performance pay based on
assessment data ● Any monetary incentives to teachers
Teacher absenteeism ● Number of days a teacher is absent
from her/his class
Teacher qualified in the subject mathematics ● Importance of subject-matter
knowledge
Teacher attitude ● Teacher relationship with student ● Teacher disciplinary measures
Note. Both the traditional and the non-traditional teacher quality measures and the bullet points
are derived from the PISA 2009 school questionnaire created by the OECD main survey (Core B
Consortium, 2008) and the literature review.
a The variables of teacher qualification, teacher certification, and professional development are
deemed “traditional” measures of teacher quality by Azam and Kingdon (2014) and Goe and
Stickler (2008).
b These variables are thus deemed as “non-traditional” by the researcher for the study and
derived from literature review.
14
c ISCED5A in India is equivalent to a graduate with a (B.Ed.) degree (OECD, 2010).
The above key independent variables depicted for the study are operationalized in
Chapter Three on methodology.
Finally, although NCF 2005 and NCFTE 2009 are official curriculum frameworks and
NEP 2016 is an education policy, these three documents were chosen for analysis as they are an
integral part of the Indian education system and contain discourse that is relevant to the study.
Therefore, a brief overview of the chosen policies is given in the literature review, though their
in-depth content analysis is included in the fourth chapter of the study, which is data analysis.
15
Chapter Two: Literature Review
The Indian states of Tamil Nadu and Himachal Pradesh participated in PISA 2009 and
ranked the lowest (second from the bottom) in mathematics. It created a “shock wave in the
country, blaming the quality of teachers alongside other factors like the linguistic-cultural
discrepancy and socio-cultural disconnect” (Mitra, 2015). On teacher quality in India,
Venkatachalam (2017) states:
Education in most schools is one dimensional, with an obsessive focus on marks. Added
to this is the lack of availability of trained teachers at all levels. Quality teachers are the
missing link in the Indian education system. Although pockets of excellence exist, the
quality of teaching, especially in government schools, does not meet the standards. (p. 1)
Despite the ongoing global debate on the best measure of teacher quality, there exists no
empirical evidence in the literature to show which teacher characteristics or variables most
impact student outcomes. Studies show that much focus by policymakers internationally and
within India is on traditional measures of teacher quality like teacher qualification, teacher
certification, and professional development (Akiba, LeTendre, & Scribner, 2007; Desimone,
Smith, Baker, & Ueno, 2005; Hill, Rowan, & Ball, 2005, Kingdon, 2006; Lamb & Fullarton,
2001). However, studies have also revealed that traditional teacher variables have not made any
significant difference in student outcomes in mathematics, and there are non-traditional teacher
variables that affect student performance (Akello, 2015; Kingdon, 2007; Muralidharan &
Sundararaman, 2011; Singh & Sarkar, 2012). This dissertation thus adds to the literature by
comparing both the traditional and non-traditional teacher variables to study which have the most
influence on student performance in mathematics.
16
Organization of Literature Review
The literature review in this study reviews articles on the Indian education system, which
focus on teacher quality to show its transformation from a traditional culture to a modern culture
by competing in international testing like PISA. It also includes published empirical studies on
teacher quality globally, focusing on studies in India on teacher variables termed traditional and
non-traditional. The literature review examines new and older published articles, policy briefs,
working papers, and newspaper articles that influence and shape the study on teacher quality.
The literature review is divided into three main sections. The first section examines the
context. It includes background on 1) India as a diverse nation, 2) the Indian education system,
including the states of Tamil Nadu and Himachal Pradesh, 3) teacher education in India (history
and current scenario), and 4) an overview of the Indian education policies selected for the study.
The second section reviews literature on both the traditional and non-traditional variables of
teacher quality. The third section includes conceptual and theoretical frameworks and a summary
of the frameworks.
Section I
India—A diverse nation. India is a prime example of “unity in diversity” with its
multiple states, languages, religions, and cultures. While a rich cultural heritage is an outstanding
characteristic of the country, social hierarchies due to the caste system, the widening gap
between the rich and poor, and the gap between the educated “elite” and the uneducated are also
an integral part of the society. The classification of schools between private and government is
the result of the class inequalities, where only the privileged can afford to attend a “good
education” system provided by private schools. Apart from such a classification affecting the
education access, it affects the teacher quality as teachers in private schools may not be qualified
17
or certified from teacher education institutes under the government body NCERT (Singh &
Sarkar, 2012).
Additionally, India has over 291 states with their own regional languages apart from the
language Hindi, declared the official language in India after independence. The diversity of
languages or multilingualism is a unique characteristic of the country and also a cause of concern
in the education sector (Huisman, Rani, & Smits, 2010). Although Hindi is an official language,
it is not a native language for many, and hence there is no one medium of instruction for the
teacher. The teacher, apart from catering to diverse academic needs of her or his students, has an
additional task of accounting for dialectic nuances that influence student learning (Gelda,
Narayan, Mudiyam, Raturi, & Seshan, 2013). The three-language formula2 adopted by the
education sector in the country in 1957 is now being replaced by bilingualism with English and
Hindi or English and a regional language as a medium of instruction. Therefore, the western
influence is overtaking the language diversity in India, with English slowly becoming the
dominant language of instruction in most parts of the country (Huisman et al., 2010).
Unfortunately, hegemony by the English language is affecting the quality of education in the
country, especially in the rural areas as natives are not familiar with the English language.
Furthermore, the NCF 2005 states that since the language used in mathematics textbooks
is different from the language students use in their day-to-day living, it creates anxiety and fear
in students. Therefore, it was recommended that the mathematics curriculum contain language
that students use in their daily lives (NCERT, 2006). The policymakers also realized the
1 22 languages have gained constitutional recognition in India. 2 The three-language formula was adopted in 1957. In the first five years of schooling, a regional language is used as
the first teaching language. During school years 6 to 8, a second language is taught as a school subject: Hindi in non-Hindi areas and another Indian language in the Hindi areas. From the third year onwards, English is taught as a school subject (Huisman et al., 2010).
18
importance of English as a necessary means for international communication. Therefore,
teaching in English could not be completely shut down either. Thus, the country’s diversity poses
many challenges, especially to teachers.
The Indian education system. India, a country in Asia, is the home to over a billion
people. Indeed, education has always been given a valuable place in Indian society and is
considered a means to eliminate the vicious circle of poverty, thereby raising the country’s
productivity. In fact, the father of the Indian nation, Mahatma Gandhi, stressed the importance of
education for both males and females as a source of developing a balanced human personality
(Rani, 2010).
Classification of schools. According to a report in 2014 by The British Council, India on
the Indian school education system:
The Indian school education system is one of the largest and most complex in the world.
The complexity of the system stems from India’s need to maintain standards and
uniformity, while giving scope for its diverse culture and heritage to grow and flourish
across the length and breadth of the country. (p. 3)
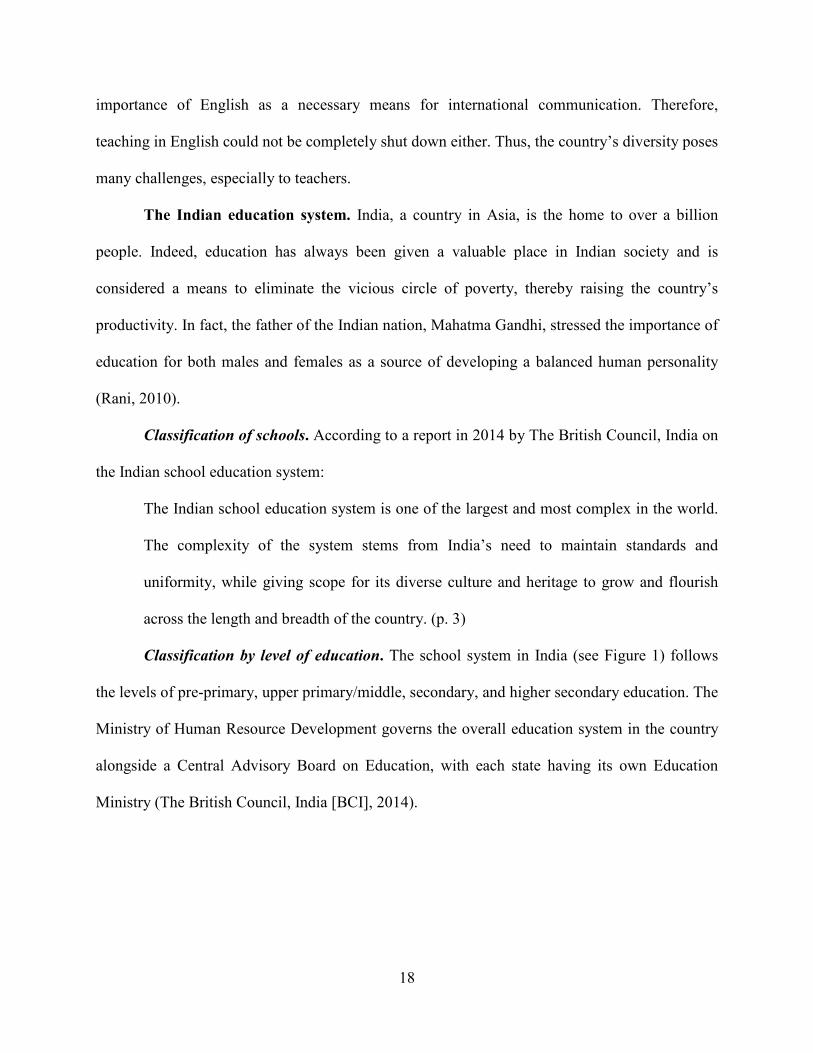
Classification by level of education. The school system in India (see Figure 1) follows
the levels of pre-primary, upper primary/middle, secondary, and higher secondary education. The
Ministry of Human Resource Development governs the overall education system in the country
alongside a Central Advisory Board on Education, with each state having its own Education
Ministry (The British Council, India [BCI], 2014).
19
Figure 1. Indian education system. Reprinted from BCI (2014, p. 22).
Classification by ownership. Schools in India are owned either by the government
(central, state, or local government bodies) or private entities (trusts, individuals, or societies).
They are classified into three categories: 1) government schools run by state education
departments where no fees are charged; 2) private aided schools where schools are managed by
private bodies but funds (partially or fully) are received from the government; and 3) private
schools unaided and not funded by the government, who survive by charging fees. The private
unaided schools have their own fee structure based on the location and services provided (Singh
& Sarkar, 2012).
Since the private unaided schools are not homogenous in the country, one can find some
schools charging low fees while others catering to rich families have a high fee structure. The
interesting point to note here, according to Singh and Sarkar (2012), is that the three school
categories also fall under the recognized and unrecognized categories. The schools recognized or
approved by the state government have to fulfill certain requirements under the state government
regulations regarding teacher-pupil ratios, qualifications, etc. The unrecognized schools are not
Pre-Primary
(18 mths-5 yrs)
Pre-school
Primary School
(6 yrs-10 yrs)
Class 1-5
Upper Primary/Middle School
(11 yrs-14 yrs)
Class 6-8
Secondary School
(14 yrs-16 yrs)
Class 8-10
Higher Secondary
(16 yrs-18 yrs)
Class 10-12

20
affiliated to any board but still continue to run in the country, though the District Information
System for Education (DISE) does not have data pertaining to such an unrecognized education
sector.
Classification by educational board affiliations. Education in India is under the control
of NCERT. It is an apex organization selected by the government of India to maintain quality in
education. NCERT provides support to schools and ensures enforcement of the education
policies. It also supports and advises the Ministry of Education in maintaining the quality of
school education and teacher education in India (Nirav, 2012).
Acknowledging the importance of improving the teacher quality, the government has set
up a permanent body for the selection of teachers known as the NCTE. It conducts training and
selection of teachers and provides certificates/degrees for teachers, known as a Bachelor of
Education (B.Ed.) or Shastri education, which are essential for teachers seeking employment in
schools (Nirav, 2012). However, the NCTE has failed to prevent entry of private and
unrecognized institutions that provide training and certifications to teachers, and private schools
readily employ such teachers (Nirav, 2012).
Although the curriculum in all schools in India is monitored or comes under the two main
boards which are the Central Board of Secondary Education (CBSE) and the Indian Certificate of
Secondary Education (ICSE), recruitment of teachers in private schools is solely at the schools’
discretion. Therefore, the quality of teachers in both private and public schools in India differs
substantially. According to a report in The Times of India, many teachers in private schools in the
country do not have the requisite teaching B.Ed. degree, and a few of them have not even
completed their high school education (Raghavan, 2013).
21
Thus, the Indian education system, which is vast and continuously changing, faces many
challenges (BCI, 2014). Evidence shows that the number of private schools in India has been
increasing since the 1990s due to demand for good education and lack of adequate facilities in
the government schools (Huisman et al., 2010). However, since the private schools are not
regulated by NCERT, the quality of teachers is questionable.
Within India, there were only two states that participated in the PISA 2009 tests. Since
every state of India is unique, the following paragraphs briefly introduce the states of Tamil
Nadu and Himachal Pradesh with respect to teacher quality.
Tamil Nadu. Situated in the southern part of India, the state of Tamil Nadu (TN) is
geographically the 11th largest state in the country, occupying 4% of the national area (Gupta,
2012). Although a poor state, TN is one of the “better off” (Gupta, 2012, p. 1) states in the
country in terms of literacy and student enrollment rates. Per Census 2001, TN had an overall
literacy rate of 73% and female literacy rate of 65%. In terms of enrollment, the state has the
highest enrollment in primary and upper primary education (Gupta, 2012).
The high enrollments are the results of various initiatives that the government of the state
is providing and not due to the quality of education imparted (Duraisamya, Jamesb, Lanec, &
Tanb, 1998). According to a study by Duraisamya et al. (1998), the government of the state
provides free midday meals to every student in primary and middle school 365 days a year and
also free uniforms and books to every child in the midday meal program. However, the high
enrollments are leading to a skewed teacher-pupil ratio. Duraisamya et al. (1998) noted that
between 1977 and 1992 the number of enrollments in schools across TN rose by about 139%,
though the number of teachers increased by only 44%, affecting the learning of students. Lack of
teachers is blamed on a poor salary scale and incentives.
22
TN primarily focuses on teacher qualification and in-service training to improve its
teacher quality. Interestingly, according to Vaigaichelvan (2013), of the 625 teacher training
institutions, 87% are private and unaided. On a national level, 90% of the teacher education
institutions are private, and per NCFTE 2009, the rapid increase and privatization of teacher
education is resulting in poor and sub-standard regulation of teacher education. Mathematics is
taught by unqualified teachers or qualified teachers with no proper training (Ramachandran,
Bhattacharjea, & Sheshagir, 2008).
The Sarva Shiksha Abhiyan (SSA) or literally the “Campaign for Universal Education,” a
flagship program by the Government of India initiated in 2000 for achieving universal
elementary education, plays a major part in in-service training for teachers in TN (Kingdon,
2007). The objective of SSA is to keep teachers motivated and confident. However, a study by
Ramachandran et al. (2008) finds that teachers are demotivated and stressed due to their non-
involvement in the strategic planning of a program borrowed from the western culture, the
Active-Based Learning (ABL) program.
Thus, the state of TN that participated in PISA 2009 has a high rate of literacy that is not
the result of teacher quality. Also, unqualified and dissatisfied teachers, increased privatization
of teacher education, and educational borrowing are issues resulting in poor teacher quality in the
state. However, TN is mainly focusing on traditional measures of teacher qualification and in-
service training to improve teacher quality.
Himachal Pradesh. The state of Himachal Pradesh (HP) is situated in the northern part
of India in the Himalayas and is the 11th highest state in the country with respect to literacy. HP
is a top state in the country for a low student-teacher ratio, far below the minimum required ratio
of 30:1 as mandated by the Right to Education (RTE) Act. However, the quality of education is
23
low, and hence there is a flight of children from government to private schools as it is believed
that education in private schools is better. The recent trend in the state is the increase in the
number of schools, and the government of HP is consciously moving from a focus on access to
quality of education (Wad, 2017). The state of HP is a unique example in India of high literacy
rate, less gender bias, and less social discrimination in enrollment, and the gross enrollment ratio
for boys and girls is 1:1. In an article, Wad (2017) states that although the school has adequate
educational resources due to the state policy and assistance from the SSA, there is a lack of
trained and qualified teachers. In addition, many teachers in schools are contract or part time
teachers. This is negatively impacting the learning of students and education quality.
The situation in HP reinforces that teacher quality impacts students’ learning and
education quality. The government of HP is consciously consolidating existing schools rather
than increasing the number of schools and recognizes the fact that consolidation of schools will
be beneficial only if it is accompanied by an adequate supply of good teachers (Wad, 2017).
However, like in the other states of India, “good” teacher is not defined, although it is connected
to better outcomes (Wad, 2017).
The states of TN and HP, which are showcases of India’s education and development in
areas of literacy and enrollment, are looking at traditional qualities of teacher qualification and
training in improving teacher quality (Duraisamya et al., 1998; Ramachandran et al., 2008) and
yet teachers in many schools do not possess any kind of a college degree. In TN, there is an
increase in private unaided teacher training institutions, leading to low teacher quality. In the
state of HP, teachers are getting a B.Ed. degree within 8-10 months of joining the course
(Lohumi, 2015).
24
Apart from there being an acute shortage of teacher training facilities, the programs are
varied throughout the country. So how does India train its teachers? The next section gives an
overview of the history of teacher education in India.
Teacher education in India.
History. In ancient India, education was largely religious, and the onus of teaching rested
on the Brahmins.3 There exist no records of any formal teacher training institutions although the
relationship between a teacher and student was considered vital and sacred (Saxena, 2007).
Teachers in that era were expected to possess characteristics of “piety, religiousness, illuminated
vision, high character, self-confidence, sound judgment, awareness of his social duties,
efficiency and self-restraint” (Saxena, 2007, p. 2). The “Gurukul” education, as it was called,
was a system of education where whoever wanted to study went to the teacher or the “guru’s”
home to learn subjects like mathematics.
Around the eighteenth century when Europe gained world recognition due to its
advancement in science, technology, and other subjects, the British felt the need to introduce
English education in the country to bring in the modern education system and curriculum in
India (Kumar, Dewan, & Subramaniam, 2008). This period also witnessed teacher education
getting due attention.
The first teacher training institute in India was started in 1802 by Danish missionaries in
West Bengal.4 By the nineteenth century, the need for systematic teacher training institutions
evolved in the metropolitan cities of Calcutta, Madras, and Bombay. The focus of these
institutions was enhancing student knowledge for academic excellence with teaching
3 In ancient India 600 BCE, Brahmins were considered the highest class in India (Saxena, 2007). 4 West Bengal state is situated in the eastern part of India.
25
methodology ignored. In the year 1886, the first secondary teachers’ training institute, called the
Government Normal School, was established in Madras,5 and between 1904 and 1912 further
teacher training centers evolved with the passage of the Government of India’s resolution calling
for secondary school teachers to have a certificate of teaching. Thus, the concept of the
traditional teacher measure of teacher quality evolved: qualification and teacher certification.
By the mid-1900s, the Hartog Committee recommended refresher courses and
conferences for existing teachers to increase the quality of teachers in schools, giving rise to the
concept of teacher training which in today’s modern era is called the professional or in-service
teacher training (Saxena, 2007.). By the year 1947, when India gained independence from British
rule, there were many teacher training institutes that focused mainly on teacher variables that are
defined as traditional measures in this study. Saxena (2007) in her study asserts that the
importance of a teacher in a student’s progress has been stressed in the Indian society since the
Rig Vedic age,6 and the country has always aspired and “inspired the presence of high quality
teachers” (p. 27). Thus, India has a history of recognizing traits or variables that a good teacher
should possess and the importance of teachers in a student’s life.
Current scenario. Since the early 1900s, the teacher education system has also expanded,
but rather unevenly. Most parts of the country have poor infrastructure to train teachers, and out
of the 5 million teachers, only 80% receive some kind of formal teacher training (Kumar et al.,
2008). Furthermore, student teachers get little practical experience due to a lack of infrastructure
and professional expertise. Also, the curriculum and training given to student teachers does not
provide them with insight on the practical applications of subjects like mathematics and science
5 Madras is now called Chennai and is the capital city of the state of Tamil Nadu. 6 1500-500 BCE was when the Vedas or the oldest scriptures of the Hindu religion were composed.
26
(Kumar et al., 2008). The launching of the 2010 RTE Act shows there is a need to recruit trained
teachers because more than 30 million children in India are still out of school. Additionally, the
distinction between pre-service and in-service teacher training is blurred. In many schools
(private and public), teachers without any training or qualifications are already employed in
schools and are now expected to get the required diploma or training within a time specified by
the 2010 RTE Act.
The Public Report on Basic Education (PROBE) (1999) in India found the following:
Many teachers in our country have not had the benefit of a good pre-service training for
their job. For most candidates who wish to be teachers, there is an acute dearth of good
teacher-training facilities and the quality of training programs offered in the country is
varied. Another problem is the content of the training course. For one thing, the content
of the pre-service courses has not kept pace with changes in the field. Secondly, it is
assumed that the higher a teacher’s formal qualifications, the more suitable he or she is
for the job. Thus, a B.A. (Bachelor of Arts) would be preferred over a class-12 candidate
with a BTC (Basic Training Certificate). Again, if there was a tussle between a B.A.,
B.Ed. and an M.A. (Master of Arts), then the latter would automatically be taken.
Ironically, neither the B.A. nor the M.A. has any special relevance to young children, and
the B.Ed. is really a pre-service training for secondary school teaching. (p. 56)
The position paper of NCF 2005 on teacher curriculum highlights that a new teacher
education program should be formulated for pre-primary, primary, secondary, higher secondary,
and graduate levels, and it should be under a recognized university. Also, the teacher education
program should be a five-year program after the 10 + 2 level of school education followed by the
country. The program should contain core competencies that teachers at all levels from pre-
27
primary to graduate levels will follow before their choice of specialization. NCF 2005 also states
that the teacher program should not be created in isolation but should be connected to the school
curriculum, considering the regional context of the school’s location. Finally, the position paper
highlights that the teacher program should have a provision for linking the pre- and post-training
of teachers through the District Institute of Education and Training (DIET) within university-
based institutions (NCERT, 2005).
Sadly, in practice today, there is little focus on the quality of teachers. The Teachers
Curriculum framed by NCTE in 2006 (as cited in Naik, 2008) shows the lack of professional
development for teachers in India with little concern for preparing teachers for constantly
demanding and fluid classroom situations. The other issue that the Indian education system is
facing is a high pupil-teacher ratio due to an acute shortage of teachers. Therefore, to enhance
teacher quality, India also needs to look at teacher absenteeism and take adequate measures.
Kohli (2015) reports that in a few government schools in New Delhi, students are taught in
corridors due to lack of space, and there are teachers who are absent for 40% of the working
days.
Summary of teacher education in India and its relevance to the study. Teacher
education in the country is an old concept, and yet the quality of teachers in the country leaves
much to be desired. There has been much focus on traditional teacher variables like teacher
qualification and professional development and training since the early 1900s. However, the
current scenario of teacher education in the country shows lack of quality teachers and needs to
focus on other teacher variables to improve the teacher quality. The history of teacher education
and current scenario reconfirm the necessity of this study to move the focus of policymakers

28
from traditional teacher quality measures tied to teacher education institutions in the country to
non-traditional teacher quality variables to improve teacher quality in India.
To discover how education policies support or do not support certain teacher quality
variables or measures, the next heading focuses on an overview of the policies chosen for the
study.
Overview of Indian education policies. The Executive Committee of NCERT in India
made a decision in 2004 to revise the existing (2000) National Curriculum Framework to create a
balanced national education system. The decision came in light of the repeated concerns over the
quality of learning and the unnecessary academic pressure on school going children (Pal, 1993).
The low quality of education imparted was reflected in the low scores in literacy and numeracy
assessment on Trends in International Mathematics and Science Study (TIMSS) 2007.
Prior to the report, there were several recommendations made over the past two decades
by several committees, including the Ishwarbhai Patel Review Committee (1977) and the
NCERT Working Group (1984), to improve the quality of learning for young children in India.
The curriculum development agencies implemented the recommendations more specifically,
however, when the new curriculum was introduced by the National Policy on Education (NPE)
in 1986 (Pal, 1993). Therefore, the NPE (1986) proposed a new curriculum framework to evolve
a better quality and child-centered national system of education, which was called the NCF, in
2005.
NCERT is responsible for reviewing and formulating the curriculum at regular intervals,
considering the fact that a national curriculum cannot be a static document but should be revised
regularly to reflect the dynamism and diversity of society, reflected in schools (NCERT, 2010).
Therefore, the NCF 2005 is a result of revisions made to NCF 1975, 1988, and 2000 by the

29
NCERT in consultation with the National Steering Committee, 21 focus groups, and the position
papers prepared by these groups (Yadav, 2013).
The NCF 2005 aims to prepare every child in the country to grow in India’s fast-
changing position in the world and global economy (NCERT, 2005), and for this, it focuses on
remodeling the teacher education to make learning more relevant for the child in today’s global
economy. The NCF 2005 model works on the principle that if the method of teaching is relevant
to the child, it will positively impact both teacher quality and student learning.
NCFTE 2009 developed by the NCTE gives a systematic and comprehensive framework
for teacher education. The NCFTE 2009 views teaching as a profession that requires a well-
planned and relevant education program and training like any other profession. NCFTE’s vision
is to make the teacher educational institutions centers of research and practical training to
improve teacher education and quality in the country (NCTE, 2010).
A recent addition to the education policies in India is a draft of the NPE 2016 by the
Government of India, which mainly targets improving quality of education at all levels by
focusing on an incomplete agenda of previous policies and current education sector-related
challenges (Government of India MHRD, 2016a).
The national policies chosen in the study consider different ways to improve teacher
quality. Therefore, an in-depth analysis of them shows which teacher quality variables or
measures are a focus of the policies in India.
Summary of Section I. In traditional Indian society, class structure permitted only the
higher class, or the Brahmins, to be “qualified” teachers. The Scheduled castes, Scheduled tribes,
and women were not permitted to possess formal education, thus segregating the population
between the educated and the uneducated. In modern times, the repercussions of the class
30
structure are visible in the current situation of teacher quality. Classification of schools between
the government and private unaided schools has led to variation in teacher quality in the country.
Although India has teacher education institutes managed by NCERT and Section 23 of the RTE
Act mandates all teachers employed in government schools possess the minimum qualifications
laid down by the NCTE, the requirements are not mandatory for private unaided schools
(Government of India MHRD, 2016a). However, since the private sector is expanding in the
country (Kingdon, 2006), there is now a flood of poor quality teachers.
Additionally, in India, the formulation of policies since 1968 focuses on teacher quality
to improve quality of Indian education. The number of teacher education institutions and training
centers is increasing (Kumar et al., 2008), and the NCF 2005 has revised various components
including teacher education in the country. However, the student performance is low compared
to international standards. This leads to the first research question which analyzes the main
Indian education policies to see how they support the various teacher characteristics.
Section II
This section reviews literature on the traditional and the non-traditional measures or
characteristics of teacher quality with respect to student performance as selected in the study.
Teacher quality measures. The study now explores the relationship between the
selected traditional teacher quality variables of teacher qualification, teacher certification, and
professional development.
Traditional teacher quality measures. Teacher quality is an abstract term as there is no
specific way to define it. However, teacher quality has been associated with many variables or
traditional characteristics (Goe & Stickler, 2008). Policymakers continue to use traditional
teacher qualities of teacher qualification, teacher certification, and professional development as
31
proxies for teacher quality. This study presents these traditional teacher quality measures
associated with student achievement.
Teacher qualification. Teacher qualification, characterized as a traditional teacher
quality, is measurable. There is no universal teacher qualification requirement, however, and it
varies from country to country based on its education policy. In India, teacher qualification is
identified with a graduate (B.Ed.) or a postgraduate (M.Ed.) degree in order to teach mathematics
(NCTE, 2010). In the United States, one needs to have a bachelor’s degree to enter the
profession, and teachers who teach mathematics to middle or high school students need to be
highly qualified in mathematics per the NCLB Act of 2001 (Akiba et al., 2007; Ingersoll, 2007).
There are several studies that have found an association between student achievement in
mathematics and teacher qualification if the qualification is content related. Akiba et al. (2007),
in a cross-national study on teacher quality, found that students whose teachers are certified in
mathematics, have three or more years of experience teaching mathematics, and are also
mathematics-major holders positively impact student outcomes as compared to teachers qualified
in subjects other than mathematics. Similarly, a study by Lee and Zuze (2011) in Sub-Saharan
Africa demonstrated that mathematics achievement is typically higher for students whose
teachers have stronger academic and professional qualifications in the subject matter. The study
revealed that some schools in Sub-Saharan African countries like Botswana, where the quality of
teachers in terms of qualification and experience is high, score better in mathematics than
students in schools in Malawi where teacher qualification is low. In South Africa, a country still
facing the consequences of the apartheid regime, evidence shows that learning outcomes for
students are on the rise after schools were able to retain qualified mathematics teachers (Van der
Berg & Louw, 2007). It is argued that a qualified teacher shifts her or his role from being simply

32
an evaluator to a facilitator and guide who allows students to think about and analyze their own
work (Hill, Rowan, & Ball, 2005).
Evidence in support of teacher qualification in India varies. A study by Kingdon (2006)
revealed that, although minimal, a teacher with a master’s degree or above can raise student
outcomes. In India, many schools realize the significance of qualified teachers with respect to
student learning and are trying to attract and retain qualified teachers through incentives
(Muralidharan & Sundararaman, 2011).
Within India there are also studies that show diverse results between government and
private schools in respect to teacher qualification and student achievement in mathematics. A
study by Singh and Sarkar (2012) in the state of Andhra Pradesh showed that mathematics
teachers in government schools have on average three years or more experience than
mathematics teachers in private schools. Additionally, the study further revealed that, for
mathematics teachers, there is a far larger percentage of teachers in government schools that hold
a diploma, bachelor’s, or master’s degree as compared to private schools. However, the number
of bachelor’s and master’s degrees held by teachers in areas other than teaching is higher in
private schools. Evidence in the study showed that students’ mathematics scores are higher in
private schools than in government schools. The question then arises as to why learning
outcomes are higher in private schools when there are better qualified and experienced teachers
in government schools. The authors reiterated that just having a general B.Ed. or M.Ed. is not
sufficient to impact student mathematics performance.
Teacher certification. Teacher certification for this study is defined as a teaching
certification by an authorized institution in the country. The topic of teacher certification impacts
on student achievement is quite limited both in India and outside the country. The few studies
33
available (Darling-Hammond, 2000; Goldhaber & Anthony, 2003) argue that teacher
certification is associated with student gains. Darling-Hammond (2000) conducted a state level
analysis using data from the United States to examine the relationship between certification
status and student achievement on the National Assessment of Educational Progress (NAEP).
This study revealed that certification status is an important determinant of student outcomes.
In contrast, Ballou and Podgursky (2000) stated that there is no association between
teacher certification and student achievement in mathematics. The researchers commented that
certification in fact prevents bright and capable people from entering the teaching profession.
Later, Pugath (2017) asserted that developing countries are giving priority to teacher certification
and spending substantial resources in certifying teachers. However, Pugath (2017) said that
evidence in Gambia, Chile, and Indonesia shows little or no association between teacher
certification and student outcomes. Pugath (2017) argued that while in the United States a
master’s degree distinguishes between a certified and uncertified teacher, in most developing
countries a teaching certificate is a part of an undergraduate degree and, therefore, certification in
developed and developing countries differs in impacting student learning.
Acknowledging teacher certification being associated with student gains, Goldhaber and
Brewer (2000) conducted a study to examine which type of certification (standard, private
school, emergency certification, not certified in subject area) impacts student performance in
mathematics. The study revealed “evidence in math that teachers with subject-specific training (a
mathematics degree or certification) outperform those without subject-matter preparation” (p.
141).
In India, the NCTE determines the qualifications required by teachers, while the
certification, which is a relatively new concept in India, is handled by the Centre for Teacher
34
Accreditation (CENTA). From the limited information available, existing teachers are certified
by CENTA based on their years of experience. However, certified teachers without teacher
qualifications can only teach in private, unaided, pre-primary schools in India (Centre for
Teacher Accreditation [CENTA], n.d.). There were no evidence-based studies available showing
that teacher certification impacts student outcomes in India.
Professional development. Professional training considered for the study includes teacher
in-service training and participation in different activities enhancing teacher knowledge and
skills. In India, the NCTE, a statutory body of the Central Government, is responsible for pre-
service teacher training through a planned and coordinated development of teacher education in
the country. The in-service training is provided by various teacher training institutions (TTIs),
unaided schools, and other establishments (Government of India MHRD, 2017).
On professional development, Garet, Porter, Desimone, Birman and Yoon (2001)
concluded that teacher professional development is a major focus of a “[systematic] teacher
reform initiative” (p. 916). The study stated that professional development for teachers is most
effective in improving student performance when it is “ongoing, sustained and intense” (p. 916)
rather than short term. Therefore, the duration of the professional development has important
impacts on student outcomes. The study also revealed that professional development influences
student outcomes when it is hands-on, embedded within the curriculum, and active with school
goals.
A report by Wenglinsky (2002) stated that students whose teachers receive professional
development perform better than students whose teachers do not receive any professional
development, especially in mathematics, where there was a difference of one full grade. A study
in the United States conducted on the effect of a three-year long professional development

35
program on mathematics showed professional development impacts teachers’ content knowledge
and teaching practices, thus significantly impacting student achievement (Polly et al., 2015).
However, a study in eight Latin American countries showed that on average there is no
impact of teacher professional development on student learning, and formal education or pre-
service training is more effective than in-service training (Velez, Schiefelbein, & Valenzuela,
1993). A study by Hanushek and Luque (2003) in the United States showed no impact on student
performance due to any kind of specialized training in mathematics by the teachers.
In contrast, Stewart (2010), in her article commenting on the education systems of the
United Kingdom, Singapore, China, the United States, Canada, Japan, and Finland asserted that
“regular professional development is essential for effective teaching and learning” (p. 19). She
believes that countries such as the United States provide incoherent and inconsistent professional
development opportunities for their teachers.
In India in a study conducted using administrative data from private schools, Azam and
Kingdon (2014) showed that there is no association between teacher in-service training and
student achievement and that there is unnecessary emphasis on teacher in-service training by
policymakers in the country. However, a study in rural India showed that students benefit from
professional teacher training in their classroom knowledge and skills, though it reported that the
training was not conducted per the norms of the NCTE with respect to content and
implementation of practices (Kidwai et al., 2013).
Summary of literature on traditional teacher quality measures. With respect to teacher
qualification in India, evidence from the literature shows that it has a positive impact on student
outcomes in mathematics, if the degree is in mathematics. Having a bachelor’s or a master’s
degree in a subject other than mathematics does not impact student outcomes. This view holds
36
true even in the United States. With respect to teacher certification, there were no studies
available in India. Internationally, the evidence is mixed. While some studies show that teacher
certification has an impact on student outcomes, others show no association between the two. In
the United States, it is evident that certification matters provided it is subject specific and not a
general certification. With respect to professional development, conflicting results show that
research does not support the view that teacher training will increase teacher quality or student
outcomes, but it also does not state that training is unimportant. The study concluded that
training by itself may not prove beneficial to student outcomes.
Non-traditional teacher quality measures. The study now explores the relationship
between the selected non-traditional teacher quality variables of teacher salary and performance
pay, teacher absenteeism, teacher qualified in mathematics, teacher attitude, and student
achievement in mathematics.
Teacher salary and monetary incentives. In India, the salary of teachers employed by
private schools is “negotiable” at the entry level (Jain & Kabra, 2015), and private schools may
opt for the salary bands suggested by the Pay Commission. The salary or incentives for teachers
employed in government schools is determined on the recommendations of the Pay Commission
with an annual increase of 2.5%. The basic salary in government schools is based on
qualification and years of experience.
There are limited studies on the association of teacher salary/performance pay/any
monetary incentives and student achievement. In the United States, the results on teacher salary
and monetary incentives are mixed. Figlio and Kenny in 2007 conducted a study showing that
students’ test scores are higher in schools where teachers are given individual financial
incentives; however, statistical evidence to prove a positive correlation between teacher merit-
37
pay and student outcomes in mathematics was limited. Others state there is no association
between monetary incentives and student outcomes (Fryer, 2008)
For India, Kingdon and Teal (2007) asserted that pay structure is an important tool in the
hands of the policymakers and supported this in their study involving private and government
schools there. They found that although the merit-pay incentive works well in private schools, it
fails to impact the results in government schools. Kingdon and Teal (2007) concluded that higher
salaries motivate teachers to work harder in government schools.
Muralidharan and Sundararaman (2011) recommended monetary incentives in the form
of performance pay to teachers to improve student learning. They conducted a study in a few
government schools in the state of Andhra Pradesh where teachers were given bonus payments
based on student achievement. The study found that “students scored significantly higher on
conceptual and mechanical components of the assessments revealing that student learning
improved in math versus students in schools with other school-based inputs of a similar value to
the teacher performance pay” (p. 1). The study argued that monetary incentives are a great
motivator not only to retain teachers but to improve their quality and student performance.
Additionally, such incentives encourage teachers to be more committed, especially in a country
like India where the pay scales are low in comparison to the international standards.
To study the long-term impact of performance pay on student outcomes, the study by
Muralidharan and Sundararaman in 2011 was extended for three years. The study found that
although individual teacher incentive programs continued to enhance student outcomes not only
in mathematics but also in other subjects, group teacher incentives that worked in the initial two
years of the experiment gradually ceased to impact student outcomes. The researchers, some of
the few who have conducted a study on performance pay in India, concluded that teacher

38
incentives are three times more effective in raising student test scores than other school related
inputs.
Although the studies conducted are few in India, evidence shows a positive association
between performance pay and student outcomes in mathematics, other factors remaining
constant. In other developing countries like Israel (Lavy, 2002), performance pay and high
salaries are associated with student performance. Similarly, a study conducted in Kenya reveals
that increases in salary and monetary benefits show positive impact on student outcomes as
teachers are motivated, and therefore, they perform more effectively (Akello, 2015).
Teacher absenteeism. Studies have shown absenteeism lowers student performance in
mathematics and is also an economic concern for schools. In respect to student performance,
evidence shows that the more days a teacher is absent or out of the classroom, the more
negatively it affects student performance (Finlayson, 2009; Miller, 2012; Porres, 2016).
Finlayson (2009) studied the effect of third-grade teacher absenteeism on third-grade students’
performance on the Criterion Reference Competency Test (CRCT) to show how teachers’
absenteeism affects students’ outcomes including in mathematics, which requires daily teacher
supervision, input, and practice. She found that in Cobb County, Georgia, United States, teachers
were absent an average of ten days a year, significantly reducing student scores.
In a study conducted in New Jersey, United States, Miller, Murmane, and Willett (2008)
reported that on average 40% of teachers are absent each day. Evidence from her study showed
teacher absenteeism to be an important indicator of student outcomes in mathematics. In the
study, Miller et al. stated, “Every 10 absences lowers average mathematics achievement
equivalent to the difference between having a novice teacher and one with a bit more
experience” (p. 5). Miller et al.’s study (2008) further found that teachers remained absent less if
39
they had to notify the management or principal of the school by telephone. To reduce teacher
absenteeism and the negative impact on student scores, Boyer (1994) recommended paying
teachers for unused sick leave.
Often teachers are within the school premises but absent from the classroom as they are
attending professional development workshops during school hours. This also negatively impacts
student learning (Miller, 2012).
Teachers from low socio-economic areas tend to be absent more often than those at other
schools (Kremer, Chaudhury, Rogers, Muralidhran, & Hammer, 2005; Miller, 2012; Nedungadi,
Mulki, & Raman, 2017). In a study conducted in six countries across three continents, Kremer et
al. (2005) found that India had the highest absence rate compared to Bangladesh, Uganda, Peru,
Indonesia, and Ecuador. Conducting their study in government schools in rural areas of the states
of Maharashtra (Western India) and Jharkhand (Northern India), researchers found that 25% of
teachers were absent during the team’s unannounced visit to the schools.
Evidence from the literature review on teacher absenteeism takes a clear and logical stand
that when teachers are absent or out of the classroom, a student’s outcome is negatively
impacted. In India, teacher absenteeism is high, thus affecting students’ performance.
Teachers’ subject-matter knowledge. In the United States, studies show that a teacher’s
subject knowledge, especially in mathematics, positively impacts student achievement
(Goldhaber & Brewer, 1997, 2000; Hill, Rowan, & Ball, 2005; Monk, 1994; Rowan, Chiang, &
Miller, 1997; Wenglinsky, 2002). Studies reveal that students whose teachers have a master’s or
bachelor’s degree in mathematics have the highest test scores as compared to students whose
teachers have a master’s or bachelor’s degree in other subjects but teach mathematics (Goldhaber
& Brewer, 2000). Kennedy (1997) argued that mathematics is a subject in which teachers

40
themselves need to have a deep understanding of the concepts and procedures so as to encourage
students to explore the subject without any fear.
Although studies consistently support the fact that subject-matter knowledge in
mathematics is important to increase student outcomes, subject-matter knowledge is measured
differently. In the United States, Goldhaber and Brewer (2000) measured subject-matter
knowledge of mathematics with a master’s or a bachelor’s degree in mathematics. Similarly,
Rowan, Chiang, and Miller (1997) measured subject knowledge in terms of whether the teacher
had a mathematics degree at the bachelor’s or undergraduate level and whether the teacher could
answer a mathematics quiz in a teacher survey. Studies convey that the association is logical, as
to teach a subject like mathematics, expertise in it is essential.
Studies in developing countries also show a positive relationship between a teacher’s
subject knowledge and student outcomes. A study conducted in five countries (South Africa,
Botswana, Mozambique, Tanzania, and Namibia) using the Southern and Eastern Africa
Consortium for Monitoring Educational Quality (SACMEQ) II data revealed that teacher content
knowledge plays a big role in impacting student outcomes. However, it was not clear from the
study how content knowledge was measured (Spreen & Fancsali, 2005). Similar results were
found in a study conducted in Thailand on eighth-grade mathematics students in a few Thai
schools using multi-level modeling (Lockheed & Longford, 1989). The study affirmed that
subject knowledge of the teacher is critical to student learning and that a mathematics teacher has
to be qualified in mathematics. However, the study did not define the term “qualified in
mathematics.”
Teacher attitude. Teacher attitude for this study includes student and teacher rapport and
classroom environment. Teacher attitude is increasingly important, especially in light of the

41
recurring problem of how to improve enthusiasm and student mathematics scores for the subject.
Realizing the importance of teacher attitude on student outcomes, it is not surprising that there
are many studies focusing on this teacher quality measure.
Studies from the United States reveal that in the absence of a teacher’s positive demeanor
and encouragement, students face mathematics difficulties, thus leading to poor performance
(Lattimore, 2005). Therefore, most studies in the United States conclude that a positive attitude
displayed by a teacher can help reduce mathematics phobia or anxiety in students, resulting in
improved test scores (Ashcraft, 2002; Lattimore, 2005; Opdenakker & Damme, 2007).
With respect to mathematics, studies show that teachers who project a feeling of trust in
their students’ ability to do mathematics communicate confidence in the pupils’ future
performance, leading to a positive growth in mathematics learning (Lee & Loeb, 2000). During
mathematics instruction, a positive reaction by a teacher rather than a neutral response facilitates
student learning because it encourages students to participate in class discussions (Centra &
Potter, 1980). Also, a teacher’s attitude about teaching mathematics to her or his children comes
across clearly in the teaching methods. A teacher who has a positive attitude towards her or his
students and mathematics will facilitate knowledge building in mathematics through an
exploratory process, thus enabling students to grasp the conceptual knowledge of the subject and
achieve high test scores (Lattimore, 2005).
In respect to student-teacher relationships, studies from the United States reveal that a
positive teacher’s attitude also helps develop a strong rapport between a teacher and student,
impacting student outcomes in mathematics (Downey, 2008; Gallagher, Kainz, Feagans, &
White, 2013). Gallagher et al. (2013) further added that apart from academic gains from a
positive teacher-student relationship, there are social gains too: students feel motivated to work
42
and also communicate better with their teachers, thus reducing the number of high school
dropouts.
In India, most studies on teacher attitude focus on college level students. However,
evidence, though limited, shows that teachers in schools in Rajasthan (Northern India) and
Orissa (Eastern India) who have a positive attitude towards the learning of their students and
show a positive attitude towards additional training have improved student performance (Wu,
Goldschmidt, Boscardin, & Sankar, 2009).
Summary of literature on non-traditional teacher quality measures. In India, evidence
from an extensive five-year study showed that teacher performance pay is a motivator for
teachers. The salary structure for teachers in India is comparatively low, and, therefore,
performance pay acts as an incentive for teachers to increase the quality and time spent on
teaching students to improve their performance. However, in the United States, the results are
mixed. While few studies show the positive relationship between teacher merit or performance
pay and student outcomes, there are other studies that show that there is no association between
the two.
Globally, teacher absenteeism has been shown to negatively impact student performance
as there is discontinuation of instruction, practice, and classroom routine (Miller et al., 2008). In
respect to subject-matter knowledge, evidence from studies globally shows that there is a
positive relationship between teachers’ subject-matter knowledge in mathematics and students’
performance in the subject. The logic is that if a teacher has a thorough knowledge of
mathematics, she/he will be in a better position to explain the content well. However, the main
drawback in studies relating to subject-matter competency is that teachers’ competency in
mathematics knowledge is not measured consistently across countries.
43
Teacher attitude is an important factor impacting student’s performance. A teacher with a
positive attitude has a “student-centered” approach to her or his teaching, instilling confidence in
students to approach a complex subject like mathematics for which many possess mathematics
phobia or anxiety. In comparison, research has shown that a teacher with a negative attitude and
“teacher-centered” instruction adversely impacts student performance (Manswell Butty, 2001).
Findings from Literature Review
First, the literature review sheds light on how the socio-economic characteristics of India,
like the class inequality and language diversity, are challenges that teachers face. In the pre-
British regime, education was religious with only a selected class called the Brahmins able to
informally teach students, and there were no formal teacher training institutions. The concept of
teacher training and education was the influence of the British regime. The poor student
performance in PISA 2009 resulted in the country blaming the teacher quality. The policymakers
are looking at reforms and new ways to improve teacher quality in the country. Since the concept
of teacher quality is abstract, policymakers are focusing on a few teacher qualities or
characteristics, termed the traditional characteristics (Goe & Stickler, 2008).
Second, in respect to the traditional teacher quality characteristics of teacher
qualification, teacher certification, and teacher professional development, evidence in India and
other countries shows mixed results for individual characteristics. However, the strongest
evidence exists for the teacher quality measure of teacher qualification, provided the degree is in
mathematics. Evidence in India with respect to teacher certification is missing, and, therefore, it
is not clear the impact of teacher certification on student performance in mathematics. The
literature review does highlight the importance of professional development on teacher
44
pedagogy, though much research is still needed to study the statistical impact on student
performance.
Third, with respect to the measure of teacher salary and monetary incentives, results
differ between developed and developing countries. In India, performance pay is a strong
motivator for teachers and is reflected in the high mathematics scores. Evidence of the
relationship between teacher subject-matter knowledge in mathematics and student performance
is the strongest as studies show a positive correlation between the two. Overall studies reveal a
strong association between teacher attitude and student performance, as students are motivated to
perform well with a teacher who has a positive attitude.
Fourth, teacher absenteeism is a big issue in India and negatively impacts students’
performance as revealed in the studies. Teacher absenteeism reduces the opportunities for
children to learn and is a greater problem in a developing country like India, which has a high
teacher absenteeism rate (Kremer et al., 2005).
Thus, the literature review shows how the various measures of teacher quality impact
student achievement. The literature review does not support any one category of teacher quality
measure over the others. For example, although evidence shows the importance of teacher
qualification to improve teacher quality, subject-matter knowledge or a degree in mathematics is
an added requirement. Similarly, teacher certification by itself has no impact on student
outcomes in mathematics unless the certification is in mathematics. Therefore, the literature
review supports the argument of the study that there are variables other than the traditional
teacher quality variables, which are the non-traditional variables, that also impact teacher quality
and are largely ignored by policymakers.
Section III
45
Conceptual framework. The study uses an adapted version of Hanushek’s Education
Production Function model to explain the linear and direct relationship between resources as
inputs and their outcomes. The Education Production Function shows common inputs like school
resources, teacher quality, and family attributes, with the outcome being student achievement
(Hanushek, 2007). The inputs are easily measured and manipulated to get the desired output. The
fundamental assumption governing the input-output model used in this study is that to achieve
maximum output, here student performance in mathematics, policymakers should focus on the
input teacher quality.
The model in Figure 2 offers a visual depiction of the relationships between the variables
included in the study. The diagram shows the direct relationship between teacher quality
variables (a school factor) and student outcomes in mathematics, a subject that nations across the
globe consider a requirement for enhancing their education systems (Wiseman & Al-bakr, 2013).
The intrinsic variable denotes the students from the two states that participated in the testing. The
variables differ in their performance in the testing. The model is applied to the context of India.
First, since teacher quality is an abstract term and the study has chosen traditional and
non-traditional measures to define it, the arrow from the school factor that is teacher quality
shows a direct relationship to the intrinsic variable, which is the students, and their achievement
in mathematics—the outcome. The conceptual framework, which follows, presents the two
theories, given in Figure 2’s circles, explaining why and how India is focusing on teacher quality
as a resource to improve student outcomes internally and internationally.
Since human capital is the model India is adopting while focusing on teacher quality to
improve student outcomes and the education quality in India, RQ1a and RQ1b analyze key

46
education policies in India to reveal whether the traditional or non-traditional teacher variables
have been supported or not supported by them.
Figure 2. Visual diagram applied to the Indian context showing the relationship between teacher
quality variables, students, and performance in mathematics. School Factor for this study
includes only teacher quality. Adapted from Hanushek’s Education Production Function Model
(2007).
Next, the world culture theory shows how India is adopting a shared model to improve
teacher quality. Therefore, finding out which set of teacher quality variables maximize the
outcomes of students in mathematics is the essence of the study, as shown in RQ2a, RQ2b, and
RQ2c, where the traditional and non-traditional variables are analyzed.
Theoretical framework. A strong theoretical foundation is essential for any research
study and the scope of the research indicates which theory is the best fit. The research here
47
shows two main lenses through which to understand why India is focusing on teacher quality to
enhance student performance. However, the research is not merely stating the existing theories
but rather arguing how both complement each other and give a “bigger picture” of the research
topic.
The first lens is human capital theory with human capital defined as a set of skills and
characteristics that enhance human productivity (Mincer, 1981). The second lens is world culture
theory which uses culture, or the “social[ly] shared symbolic and meaning systems that become
embedded in objects, organizations, and people” (Lechner & Boli, 2005, p. 12), as its perspective
for analysis. Both theories though separate are important in understanding India’s focus on
teacher quality to improve student outcomes and in answering the research questions.
Human capital theory. Human capital, works as a key stimulus to promote a country’s
economic growth. The human capital model being discussed was created by Jacob Mincer (1981)
who formulated it based on the principle that investment in education leads to a future return on
capital. The theory proposes that human capital in the form of human capabilities enhanced
through education and training not only enhances personal economic growth but also the
economic growth of a nation. Mincer’s model of human capital divides individual skills into two
categories: skills that are inherited and skills that are acquired. He focuses on acquired skills,
noting that they differ over time between countries and are the result of education, training,
experience, and mobility.
Human capital theory asserts that the acquisition of such skills incurs costs and benefits:
the former are either direct or indirect and the latter are either private or public (Mincer, 1981, p.
3). The theory argues that the benefits of costs incurred on acquisition of skills are durable and
not immediate, representing an investment in human capacity. Just like any other investment,
48
Mincer argues that health issues or a skill becoming obsolete can result in the depreciation of a
primary asset: human capital. The human capital theory advises developing countries to invest in
health and education among other sectors to enhance that country’s human capital and thereby its
economic development. As Quiggin (1999) states, “in the ‘human capital’ model, education is an
investment that produces benefits in the future. Recent cuts in education spending will therefore
reduce future national income” (p. 3). The human capital model embraced by this study,
however, does not take into account the fact that learning need not always lead to higher
monetary returns but can simply lead to a higher base of knowledge.
India is one of the fast-developing economies, but the low quality of education in the
country is hampering growth of its global excellence (Dhawan, 2014). The low quality of
knowledge and skills imparted in schools is giving rise to unemployment in the society. The
resulting talent shortage is thus limiting corporate growth and the economic growth of the
country. India recognizes that success of any enterprise is largely dependent on its human capital
and not just on its infrastructure. Therefore, the government recognizes that building human
capital through education is a key stimulus of its economic growth (Sarkar, Rao, & Naik, 2008)
and, given the importance of a quality teacher in enhancing student performance, is focusing on
teacher human capital.
The teachers’ human capital is articulated as a focus on developing a stronger teacher
workforce that has the capabilities, skills, and knowledge to positively impact student outcomes,
and this is referred to as investment in “human capital” (Dhawan, 2014). The human capital
model used in this study works on the principle that investment in education brings returns for
the future that include individual economic growth at a micro level and the country’s economic
growth at a macro level (Mincer, 1981; Quiggin, 1999). As the teacher quality improves by
49
investing in teachers’ human capital, it will positively impact student skills and knowledge.
Thus, the graduation rate in schools and colleges will improve, resulting in a stronger talent
force. As Mincer (1981) states, “Schooling improves the efficiency with which people can
absorb learning on the job, leading to greater job investments” (p. 10). The accumulation of
individual human capital through quality education will lead to higher employment
opportunities. As local and international corporations provide such opportunities, economic
growth for the individuals and the country will result (Mincer, 1981).
Research by Sarkar et al. (2008) revealed that such economic growth for India depends
on its ability to revamp its educational sector, which is facing issues of equity and quality. The
researchers further added that to improve India’s education system, investment in a capable and
quality teacher workforce is a way to increase student outcomes and develop a future globally
competitive and skilled workforce. Because of the costs associated to improve teacher quality,
policymakers need to be aware of the appropriate areas to make the investments.
Applying and adapting the theory to this study, teachers’ human capital in India is the
knowledge, skills, attitude, motivation, and other measures or variables, both traditional and non-
traditional, which have the potential to increase teacher quality and, in return, student skills and
knowledge. Therefore, teachers’ human capital can be increased by focusing on the appropriate
teacher quality measures determined by the study to positively relate to student outcomes in
mathematics. Over the years, the national policies in India have been reformed to account for
changes in the education sector in India including teacher characteristics. The in-depth analysis
of the three national education policies answers the first set of research questions on how Indian
policymakers are addressing teacher human capital in terms of their focus on traditional and non-
traditional teacher quality variables.
50
World culture theory. Neo-institutionalism, particularly world culture theory, provides a
theoretical framework that explains India’s participation in PISA testing and the significance of
the research here in analyzing the influence of teacher quality variables on student performance.
The world culture theory holds that shared norms, values, and ideals (also termed scripts)
are now embedded in nations around the world as part of a world culture (Lechner & Boli,
2005). Lechner and Boli (2005) describe this rise of world culture around the globe as no longer
being defined in European terms. Instead, they assert that “scholars agree that the rise of world
culture is an outcome of globalization; as the world becomes more intimately connected in
complex ways, growing links are given meaningful forms” (p. 438).
Globally shared values or norms, bounded rationality, and loose coupling are three
characteristics of world culture. Lechner and Boli (2005) further explain that there is a
worldwide culture embedded in organizations, technical structures, formalized rules, and
constitutional documents in nations worldwide and that these norms and knowledge are shared
across national boundaries by individuals, organizations, and corporations. Globally shared
values or common scripts consist of a “systematic body of rules and principles, implemented by
an ever-expanding set of institutions” that get adopted by individuals and organizations (Lechner
& Boli, 2005, p. 12). These values or scripts may be widely-diffused but become so ingrained in
society that they become taken for granted and unquestioned, eventually developing into societal
expectations. Wiseman, Astiz, and Baker (2014) state that this adoption of common scripts or
norms is legitimacy-seeking by nation-states to gain or maintain status at the international level.
However, “local variations and departures from standard models occur, in response to
local circumstance and conditions” (Lechner & Boli, 2005, p. 15) which contribute to the
creation of a bounded rationality. Discrepancies between policies made at the local and national
51
levels are what is referred to as loose coupling. Thus, world culture provides a foundation of
similarity in values and guiding ideas across nations—these might be thought of as blueprints or
scripts that the world culture values and people, therefore, view as rational (Lechner & Boli,
2005).
Institutionalized systems of education can be seen to display many characteristics
espoused by world culture theory. According to the Universal Declaration of Human Rights,
education was officially labeled as a human right in 1948, thus contributing to its evolution to a
globally shared value, where all nation-states must provide, at a minimum, primary education for
citizens as a way of being recognized as legitimate by other nation-states. Additionally,
education systems exist within a bounded rationality of a generally accepted model to follow,
consisting, for example, of a teacher, students, curriculum, and an organizational structure where
students progress from one grade or level to the next. Finally, educational systems experience
loose coupling in that policies made at the national level generally lose some of their intention by
the time they are implemented at the local level.
Applying the main characteristics of world culture theory to the research here, we can
first note that PISA testing commenced in 2003, and the next testing was in 2006. India did not
participate in PISA 2003 or PISA 2006, instead participating for the first time in 2009. Overall,
the number of countries participating in the testing increased from 49 in 2003 to 57 in 2006 and
65 in 2009, as they gradually embraced a world culture of education. India is culturally, socially,
and economically different from most of the countries participating in PISA. However, India too
is embracing a world culture of education by competing in international tests like the PISA 2009
to seek a legitimate standing at the global level.
52
Next, given the shared norms, values, and ideals that make up this world culture, the
expectation is that many similarities exist between the educational systems globally and locally.
In this research we can see this in the global acceptance that to improve education quality,
teacher quality is used as a measure. Across the globe, there are also similarities in the
conceptions of high teacher quality, leading to a degree of homogenization although there is no
standard way to define teacher quality. The classification of teacher variables such as teacher
qualification, teacher certification, and professional development is recognized by research
globally. For example, in India, there is focus on teacher qualification to improve teacher quality
(NCERT 2006), as is also the case in the United States where government regulations7 prevail at
many levels for highly qualified teachers (Ingersoll, 2007).
PISA assessments have thus resulted in countries competing with each other to gain a
global standing in core subjects of mathematics, science, and reading. Meyer, Boli, Thomas, and
Ramirez (1997) explain how the cross-national studies as a result of PISA assessments result in
countries adopting similar national development goals, projects, and commitments and viewing
education as a solution to gain global recognition. The differences in economic forces, power,
and culture take on “standardized forms and soon appear to be similar to a hundred other nation
states around the world” (Meyer, 1977, p. 152). The research shows how India too, a developing
country, is focusing on teacher quality as an important school resource to improve the quality of
education.
Influenced by international organizations, India has developed an official teacher
evaluation tool named the Indian Performance Indicators (PINDICS), designed by NCERT at the
policy level (Government of India MHRD, 2016a). The policymakers’ expectations are that
7 For example, to teach mathematics, a teacher has to be highly qualified in mathematics per the NCLB Act of 2001.
53
implementation of PINDICS will improve the teacher quality and increase the education quality
per international standards, although there are no official results on this so far. In terms of
teacher education, Indian policymakers are adopting education policies, similar to those in
Western countries. For example, in the United States, there are more than 1,200 institutions that
provide pre-service teacher education programs (Morey, Bezek, & Chiero, 1997). In India, the
national policies are now focusing on teacher education programs, and their curricula have been
revised four different times between 1978 and 2009 to reflect changes adopted in the global
environment (Pandey, 2011).
Despite these similarities and shared conceptions surrounding teacher quality, loose
coupling occurs in that policies made at the national level generally lose some of their intention
by the time they are implemented at the local level. Loose coupling can occur due to poor
implementation of policies or lack of resources or even lack of intent to implement international
scripts at the local levels. This research determines the focus of Indian national policies on the
teacher quality variables in the study but examination of loose coupling is beyond the scope of
this research.
Summary of the theoretical framework. Human capital theory and world culture theory
are heuristic tools that can be used to study globalization and complement, rather than contradict,
each other through the different ways they work. While human capital theory highlights
economic investment as the model that India is adopting to address teacher quality, as depicted in
the national education policies, world culture theory allows for a different view on this. World
culture theory uses the principle of globally shared norms, bounded rationality, and loose
coupling to show how India is following a generally accepted model of educational improvement
by focusing on teacher quality variables. World culture theory uses the focus on teacher quality

54
as an example of global convergence as more and more countries are focusing on teacher quality
as a way to improve student outcomes. This study argues that the two theories have an important
place in the study of teacher quality in India, one theory cannot be substituted for the other, and a
single theory would not give a “bigger picture” of the topic. This is shown in Figure 3 below.
Figure 3. Elements of human capital theory and world culture theory applied to India’s focus on
teacher quality variables to improve the education quality.
In Figure 3, the circles represent the elements of human capital theory and world culture
theory. The black circles represent the elements specific to human capital theory, the white
circles show the elements specific to world culture theory, and the grey circles represent
common elements of the two theories.

55
Investment in teachers’ human capital results in improved student scores, a globally
competitive and skilled workforce, and future economic returns for both the individual and the
nation (Mincer, 1981). Therefore, policymakers should focus on the teacher quality variables that
influence the student performance in mathematics the most. As explained previously in the
discussion of human capital theory, human capital investment in appropriate teacher quality
variables can result in increased skills, ability, and attitude and ultimately increased student
achievement. Apart from gaining individual returns through competitive jobs based both locally
and internationally, the skilled workforce can bring both economic enhancement for the country
as well as global recognition.
Similarly, the white circles in the diagram represent the elements specific to world culture
theory. According to the theory, globally shared norms, bounded rationality, and loose coupling
give rise to a world culture which sees education and specifically teacher quality as a solution for
development and global recognition (Lechner & Boli, 2005). India is embracing a world culture
of education by participating in PISA 2009 and its focus on teacher quality as a measure to
improve its student outcomes and education quality.
As Figure 3 shows, though the two theories are different, the proposed study argues that
they complement each other as they have certain common elements denoted by the grey circles
in the diagram. Though the process can differ as human capital deals with teacher human capital
while world culture focuses on globally shared norms, bounded rationality, and loose coupling,
both the theories focus on teacher quality to improve student outcomes and the education quality.
This focus on teacher quality variables leads to a common goal of improved student outcomes.
While human capital diverts towards economic returns on investment in teacher human capital,
the world culture theory moves towards global recognition. Both the theories thus give a holistic
56
picture on teacher quality and its relation to student outcomes in India.
57
Chapter Three: Methodology
This mixed methods study uses qualitative and quantitative methods to examine the
relationship of teacher quality variables, both traditional and non-traditional, on student
achievement in mathematics. Through qualitative methodology, the study provides an
understanding of how the national education policies are addressing teacher quality and answers
RQ 1a and 1b. The content analysis of the documents shows which teacher quality variables are
given priority by the government. Next, the quantitative research uses PISA 2009 mathematics
data from schools in the Indian states of Himachal Pradesh and Tamil Nadu to analyze the
relation of policy implications to teacher quality variables affecting student achievement in
mathematics. The quantitative method answers RQ 2a, 2b, and 2c. Thus, the integration of
qualitative and quantitative research in a single study provides a more holistic picture of the
situation of teacher quality in India. The study aims to provide valuable information to
policymakers for improving teacher quality in India.
The chapter on methodology is divided into two main sections: Qualitative Research
Methodology and Rationale and Quantitative Research Methodology and Rationale.
Qualitative Research Methodology and Rationale
Research design. Content analysis as a qualitative research method is used to examine
the selected official Indian national education policies to answer the first research questions:
RQ1a: How do Indian national education policy documents (NCF 2005, NCFTE 2009,
and NEP 2016) frame traditional and non-traditional teacher quality
characteristics in reference to student achievement gains?
RQ1b: How did Indian national education policy shift from 2005 to 2016 in reference to
58
traditional and non-traditional teacher quality characteristics and national
competitiveness?
Content analysis as a method of analysis is non-participant or non-reactive for this study as there
is no direct contact between the participants and me (Kuckartz, 2014); therefore, this study did
not require any Institutional Review Board (IRB) approval.
The term content analysis is not new and dates back to the year 1910 when Max Weber
suggested an enquiry into the content of a newspaper, thus introducing content analysis as a
social science research method (Kuckartz, 2014). In respect to quantification of texts, Kuckartz
(2014) states that while it can be insightful, the resulting matrix of numerical data is limited in
what it can reveal about the text or phenomena under examination. The author argues that
classical content analysis or quantitative approaches are not the best choice of method of analysis
where subjective understanding and interpretation of text is required (Kuckartz, 2014). He
introduced qualitative content analysis that focuses on “discovering the meaning within texts and
analyzing their communicative content” (Kuckartz, 2014, p. 34).
Hsieh and Shannon (2005) define qualitative content analysis as “a research method for
the subjective interpretation of the content of text data through the systematic classification
process of coding and identifying themes or patterns” (p. 1278). Coding involves labeling
segments of the text with brief words or phrases to distill the information to broad categories or
themes (Neuman, 2014), which answer the research questions. The brief words or keywords
selected are highlighted or color-coded in the text manually or through a software (Kuckartz,
2014).
Though content analysis reveals the content of the text, it cannot interpret it nor can it
determine the “truthfulness of an assertion or evaluate the aesthetic qualities of literature”

59
(Neuman, 2014, p. 372), leading to an amount of bias. However, to answer the research
questions stated in the study, content analysis is an appropriate choice because it helps reduce the
volume of data in the three electronic versions of the official documents to a fairly manageable
amount for ease in interpretation by me. Content analysis enables a thorough examination of the
chosen Indian documents to understand how they address or do not address traditional and non-
traditional teacher quality variables chosen for the study. The remainder of this section talks
about document selection, constructs, reliability, validity, procedures, data analysis, and
limitations of the study.
Document selection and policy briefs. The documents for analysis are the NCF 2005,
NCFTE 2009, and NEP 2016. Critical examination of these documents addresses the situation of
teacher quality related to student outcomes in mathematics. Although NCF 2005 and NCFTE
2009 are official curriculum frameworks, while NEP 2016 is an education policy, these three
documents were chosen for analysis as they are an integral part of the Indian education system
and contain discourse that is relevant to the study. Also, the three documents constitute the
overarching policy documents that outline the education for schools in India including teacher
education. These are official policy documents that are applicable to all the states in India
including the states of Tamil Nadu and Himachal Pradesh. Since the research pertains to Indian
participation in PISA 2009, I was unable to successfully search for any official state policy for
Tamil Nadu and Himachal Pradesh with respect to education and teacher education. The chosen
policies represent India, which includes the two states.
As India is a diverse nation with more than 22 different states and various levels of
central and state governments, initially, the Indian Constitution gave permission to the state
governments to make all decisions regarding education for their respective states. However,

60
control in the hands of the Central Government for education began with the advent of the NCF
2005 when a national curriculum for India was proposed in contrast to individual state curricula
(NCERT, 2005). The argument was to propose a national system of education, with respect to
curriculum, teacher education, and education requirements, that was capable of responding to
India’s geographical and cultural diversity, while integrating the country through common
education goals and core values by taking input from various states. State governments were
encouraged to convert the various policies into the language of the state by NCERT for the states
(NCERT, 2005).
The documents chosen are national policy documents and accessible to the general public
through an internet search.
NCF 2005. NCERT is responsible for reviewing and formulating the curriculum at
regular intervals, considering the fact that a national curriculum cannot be a static document, but
rather should be revised often to reflect dynamism and the diversity of society reflected in
schools (NCERT, 2005). Therefore, the NCF 2005 is a result of revisions made to NCF 1975,
1988, and 2000 by NCERT in consultation with the National Steering Committee, 21 focus
groups, and the position papers prepared by these groups (Yadav, 2013). NCF 2005 focuses on
shifting the method of teaching from a textbook-centered, rote learning approach to one that
emphasizes a link between learning in school and the outside world as a way to increase quality
of education in India. Also, teachers are expected not just to follow a given syllabus or textbook
but to also participate in creating the syllabus, textbooks, and learning aids. Therefore, teacher
competency in respect to training and qualification is a major focus in NCF 2005.
NCFTE 2009. Recognizing the issues in the present teacher education scenario like the
backlog of untrained teachers, increase in demand for trained teachers, lack of pre-service

61
teacher certification, increase in substandard teacher education institutions, and lack of teacher
accountability, NCFTE 2009, developed by the NCTE, gives a systematic and comprehensive
framework for teacher education. The NCFTE 2009, apart from curricular areas of initial teacher
preparation, mainly addresses concerns about professionalization of teacher education, preparing
teacher educators, open and distance learning, and research and innovation in teacher education.
The NCFTE 2009 has given a systematic framework for main curricular areas of teacher
education along with strategies to implement it. It is comprehensive and includes Mathematics,
Social Sciences, Language, Knowledge, Theory, Practice, and Psychological as well as
Philosophical sections. The framework is divided into three areas: Area A, Area B, and Area C.
While Area A and Area B include curricula like Foundations of Education and Curriculum and
Pedagogy already included in the earlier teacher education program by NCF 2005, Area C
includes school internship, which is a crucial part of a teacher’s education. Area C includes visits
to innovative centers of pedagogy and learning, classroom-based research projects, and weekly
practical training in the classroom, making NCFTE curriculum for teacher education unique
(Mondal, Saha, & Baidya, 2015).
NEP 2016. The main goal of NEP 2016 as stated in the draft is on improving the quality
of education and restoring its credibility. It seeks to create conditions to improve the quality of
teaching, learning, and assessment and to promote transparency in the management of education
(Government of India MHRD, 2016a, p. 14).
Reinforcing the importance of quality education in India, NEP 2016 provides a
framework for developing the education sector in the country. It recognizes that the education
process, content, and policies need to evolve, keeping pace with the dynamics of local and
global changes, including changes in learner needs (Government of India MHRD, 2016a). The
62
report emphasizes students’ learning outcomes and connects them to quality of education
imparted. To ensure implementation and follow-up on recommendations of the policies, the
NEP 2016 proposes formulating a Framework for Action for each state and union territory in
India.
Reliability and validity. To ensure intercoder reliability, another coder independently
coded the text. A colleague from Lehigh University who is familiar with my research questions,
keywords, and use of MAXQDA also scanned the full documents and conducted independent
searches for the keywords. This step of pilot coding took about 10 days, when 10% of the
relevant sections were chosen. An intercoder reliability of 80% was selected for this research
(Kuckartz, 2014), and the coding scheme was revisited and refined until there was an agreement
between me and my colleague on 80% of the coding in the pilot phase.
Validity in content analysis is proven when the results from the study are able to answer
the research question (Creswell, 2012). Additionally, in content analysis, researchers must
adhere to the core principle of validity, be truthful, and have a neutral and objective view during
reporting (Neuman, 2014). Thus, making connections truthfully and objectively interpreting the
results from the analysis increases the validity of the study.
Coding system. In content analysis, there are no standard measures to code and each
study includes its own keywords. Coding requires systematic scanning of the documents, and
Neuman (2014) identifies two types of coding: manifest coding and latent coding. Manifest
coding includes counting the number of times the keyword appears in the text and is a reliable
way of coding because it can be determined if the keyword is present or not in the text. However,
the limitation of manifest coding is that it does not take into consideration the connotation of the
keywords or phrases (Neuman, 2014). On the other hand, latent coding looks for “underlying

63
implicit meaning in the content of a text” (Neuman, 2014, p. 373). In this study, the latent
method of coding was used.
The keywords, categories, and sub-categories were chosen from the literature review,
PISA 2009 school questionnaire, and theoretical framework pertaining to teacher quality
variables and then searched for in the text. Thus, the deductive method of coding, in which
concepts or variables emerge from the theory or previous studies, was used in this study. In
deductive methods of coding, codes exist first and are applied to the text with the intention of
theory testing and not theory building (Kuckartz, 2014). The pre-determined codes or keywords
are shown in Table 2 and Table 3.
Table 2
Traditional Teacher Quality Variable Keywords
Teacher Qualification
Keywords
Teacher Certification
Keywords
Professional Development
Keywords
● Teacher qualification ● Teacher ● Qualification ● Diploma ● Entry qualification ● Master of Education
(M.Ed.) ● Bachelor of Education
(B.Ed.) ● Teacher human capital
● Teacher certification ● Teacher ● Certificate ● Valid ● Authority ● Acquired skills
● In-service training ● Online training ● Professional activities ● Western influence
Table 3
Non-Traditional Teacher Quality Variable Keywords
Teacher
Salary/Performance
Pay
Keywords
Teacher
Absenteeism
Keywords
Teacher Qualified
in Mathematics
Keywords
Teacher Attitude
Keywords
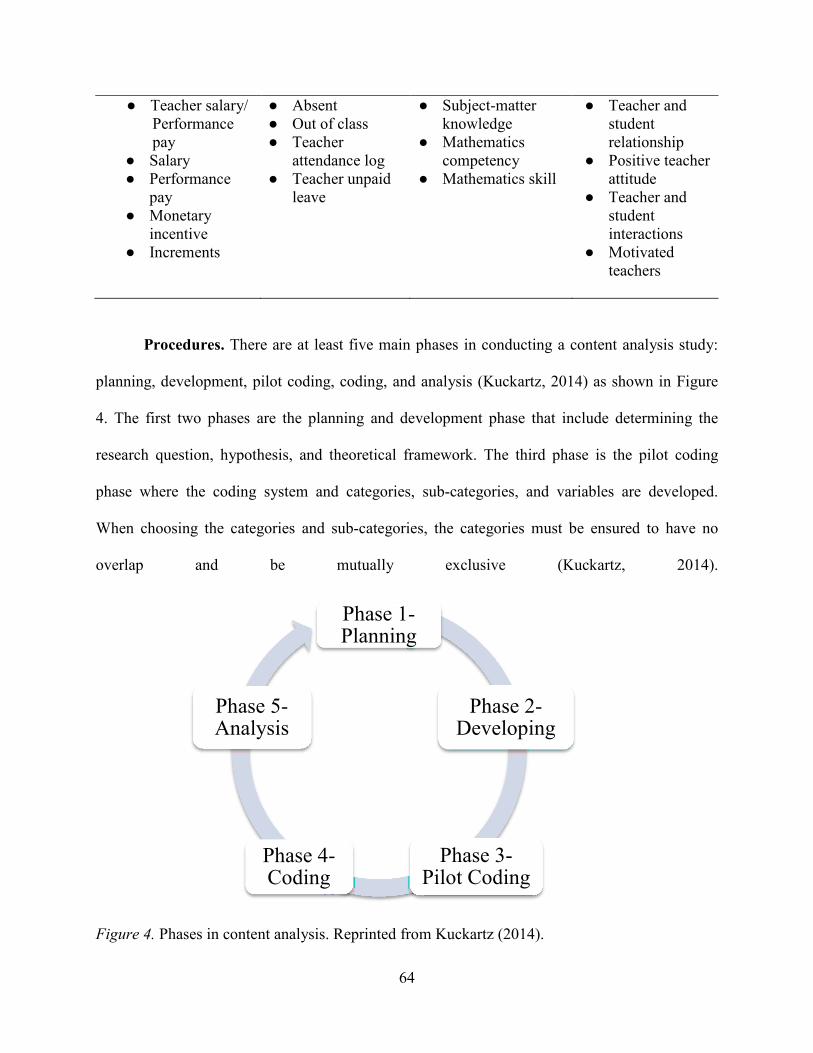
64
● Teacher salary/ Performance pay
● Salary ● Performance
pay ● Monetary
incentive ● Increments
● Absent ● Out of class ● Teacher
attendance log ● Teacher unpaid
leave
● Subject-matter knowledge
● Mathematics competency
● Mathematics skill
● Teacher and student relationship
● Positive teacher attitude
● Teacher and student interactions
● Motivated teachers
Procedures. There are at least five main phases in conducting a content analysis study:
planning, development, pilot coding, coding, and analysis (Kuckartz, 2014) as shown in Figure
4. The first two phases are the planning and development phase that include determining the
research question, hypothesis, and theoretical framework. The third phase is the pilot coding
phase where the coding system and categories, sub-categories, and variables are developed.
When choosing the categories and sub-categories, the categories must be ensured to have no
overlap and be mutually exclusive (Kuckartz, 2014).
Figure 4. Phases in content analysis. Reprinted from Kuckartz (2014).
Phase 1-Planning
Phase 2-Developing
Phase 3-Pilot Coding
Phase 4-Coding
Phase 5-Analysis
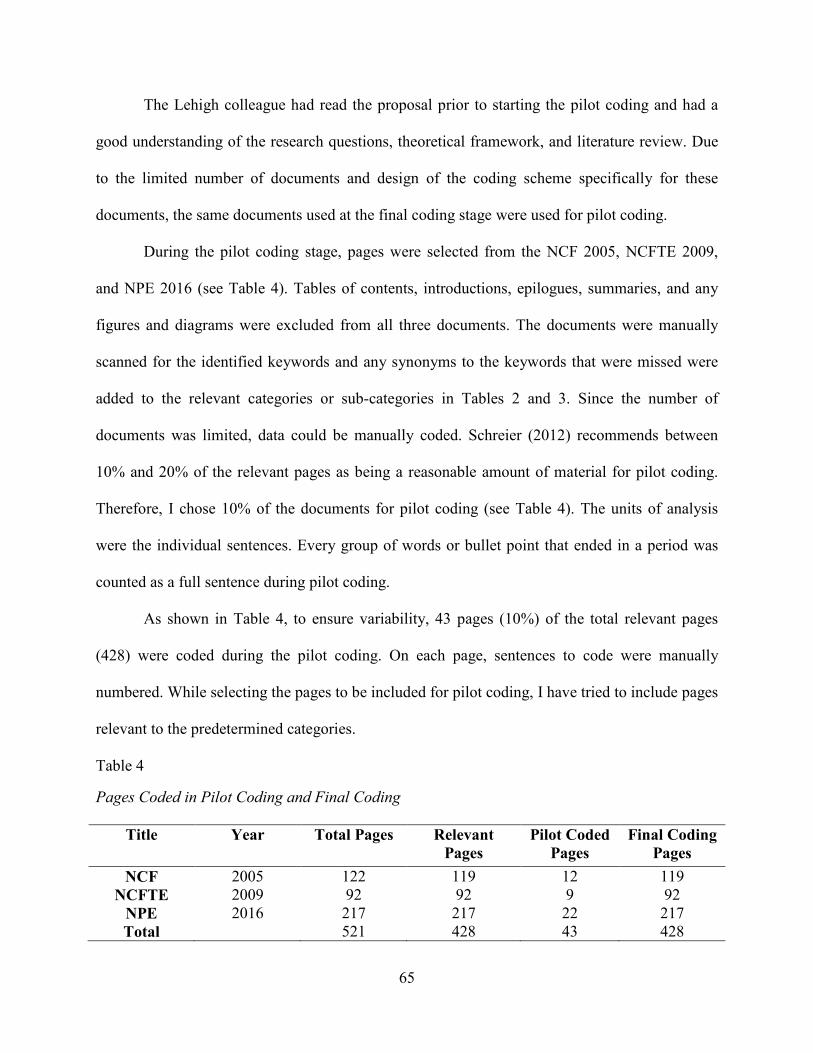
65
The Lehigh colleague had read the proposal prior to starting the pilot coding and had a
good understanding of the research questions, theoretical framework, and literature review. Due
to the limited number of documents and design of the coding scheme specifically for these
documents, the same documents used at the final coding stage were used for pilot coding.
During the pilot coding stage, pages were selected from the NCF 2005, NCFTE 2009,
and NPE 2016 (see Table 4). Tables of contents, introductions, epilogues, summaries, and any
figures and diagrams were excluded from all three documents. The documents were manually
scanned for the identified keywords and any synonyms to the keywords that were missed were
added to the relevant categories or sub-categories in Tables 2 and 3. Since the number of
documents was limited, data could be manually coded. Schreier (2012) recommends between
10% and 20% of the relevant pages as being a reasonable amount of material for pilot coding.
Therefore, I chose 10% of the documents for pilot coding (see Table 4). The units of analysis
were the individual sentences. Every group of words or bullet point that ended in a period was
counted as a full sentence during pilot coding.
As shown in Table 4, to ensure variability, 43 pages (10%) of the total relevant pages
(428) were coded during the pilot coding. On each page, sentences to code were manually
numbered. While selecting the pages to be included for pilot coding, I have tried to include pages
relevant to the predetermined categories.
Table 4
Pages Coded in Pilot Coding and Final Coding
Title Year Total Pages Relevant
Pages
Pilot Coded
Pages
Final Coding
Pages
NCF 2005 122 119 12 119
NCFTE 2009 92 92 9 92
NPE 2016 217 217 22 217
Total 521 428 43 428

66
Pilot coding consists of three stages (Schreier, 2012). In the first stage of trial coding,
once the coders are familiar with the research questions, coding procedure, and codes, the trial
coding begins. In this stage, both the coders worked independently during this period to code
each sentence on the designated pages and thus tried out the viability of the coding frame.
Comments or difficulties encountered were independently noted. The trial period for each of the
documents lasted between two to four days each.
During the second phase of consistent check, the two coders met online several times for
a period of nearly one week to clear differences and refine the definitions from the coding table.
An Excel spreadsheet was individually maintained by each coder, and the coding was discussed
after every few pages to get a better understanding of the scheme and codes. While coding each
sentence in pilot coding, a separate category was created for sentences that did not fit any
category, marked as “Irrelevant” in the Excel spreadsheets. This was to ensure that all of the data
were assigned to categories.
The third stage of pilot coding led to adjustments in the coding frame and, therefore, the
deductive coding procedure moved to inductive coding where new keywords and categories were
added or deleted from the coding frame. For example, transformative society as a common
keyword was added during pilot coding. Kuckartz (2014) notes that the first requirement in
creating categories in the deductive approach is that “they are distinctive and exhaustive” (p. 27).
Therefore, I have ensured that the categories did not overlap each other by clearly describing
them as well as specifying the coding guidelines along with keywords in each category. The pilot
coding, therefore, acted as a check for reliability to see how well the coding table was formulated
in respect to the information needed for the research.
67
A final intercoder reliability coefficient of 89% was achieved, which is a good number to
move to the final coding (Schreier, 2012). Details about this number can be found in Appendix
A. Though deductive and inductive methods of coding were used and the existing codes were
reviewed before final coding, even during final coding, I was open to any additions in the coding
scheme that affected the research questions. The final coding scheme is given in Appendix B.
Once the simple percent agreement was reached, the study moved to the fourth and fifth
phases. For the fourth phase of coding and the fifth phase of analysis, the study used MAXQDA,
a software tool that supports qualitative research. This software allows for thematic and
systematic analysis of written data (www.maxqda.com). This tool assisted in the coding process
and was user friendly with clear instructions on how to use it. Although I had used it in a group
and not independently, I felt confident using it. The three chosen documents were uploaded and
the software assisted in searching for the presence of the keywords, which could have been
overlooked if the search was done manually. Also, passages or excerpts containing the keywords
were highlighted to derive the content regarding the keyword. For this study, the lexical search
function of the software was used where keywords chosen were highlighted in every document.
Keywords in each category were color coded differently. The keywords that are listed in Tables
2 and 3 relevant to each category and sub-category of chosen teacher quality variables were
searched for and analyzed for their content and not for the number of times they occurred in each
document.
I conducted the final coding of the documents in the order of publication dates as shown
in Figure 4: NCF 2005 followed by NCFTE 2009 and finally NPE 2016. Using the MAXQDA
software, each document was uploaded one at a time and coded sentence by sentence. Each
category, including an “Irrelevant” category for sentences not applicable to the current study,
68
was color coded differently. MAXQDA automatically numbers the sentences during coding
which assisted in creating the coding matrix for frequency count. Once each document was
coded with MAXQDA, I conducted a lexical search for the keywords (manually checking for
every single word under the heading “subcategory/keywords”) to ensure that relevant sentences
were not missed while coding. Each sentence was manually coded using the lexical search and
crosschecked with the results from the MAXQDA coding and the pages coded during the pilot
coding. This was to ensure further reliability in the coding.
MAXQDA also features the ability to summarize, store, and retrieve notes made during
the search to assist in data analysis. It has a unique feature of providing space on every page for
summary and write-ups (www.maxqda.com). Additionally, MAXQDA has numerous visual
tools that assist in data analysis and summary writing. I used the space provided to make notes
during coding and also used the “summary grid.” The grid was a great visual tool to note and
compare keywords in all the three chosen documents, which assisted in answering the research
questions (www.maxqda.com).
Data analysis means a search for patterns in data, and once the patterns are determined
the researcher interprets them to answer the research question (Neuman, 2014). However, this
study did not merely count keywords or derive objective meaning from common themes or
patterns. I tried to understand the situation of teacher quality variables in a subjective manner. I
analyzed the documents chronologically (NCF 2005, NCFTE 2009, and NPE 2016). The first
step in the analysis was going to each of the coded sentences in their respective documents and
comparing the results in MAXQDA. I read through each of the sentences, storing relevant notes
in MAXQDA, and also making any coding adjustments. Once the data were ready and their
frequencies recorded, I looked for information required for my research questions and common
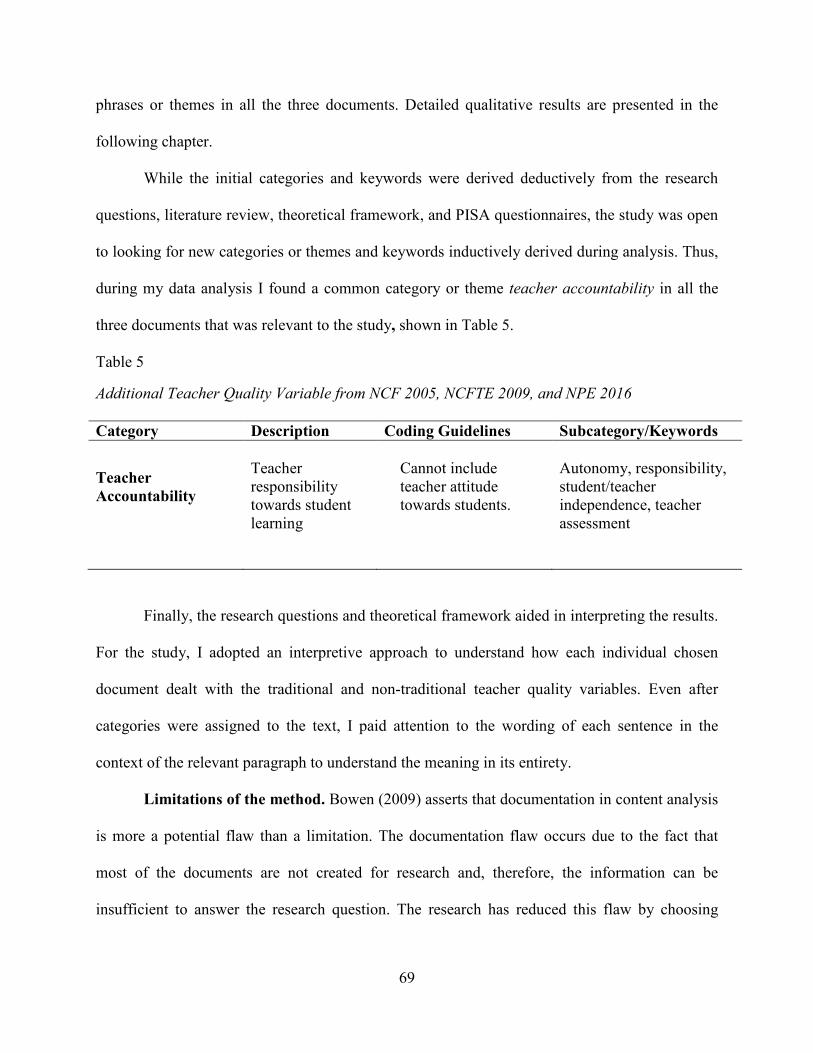
69
phrases or themes in all the three documents. Detailed qualitative results are presented in the
following chapter.
While the initial categories and keywords were derived deductively from the research
questions, literature review, theoretical framework, and PISA questionnaires, the study was open
to looking for new categories or themes and keywords inductively derived during analysis. Thus,
during my data analysis I found a common category or theme teacher accountability in all the
three documents that was relevant to the study, shown in Table 5.
Table 5
Additional Teacher Quality Variable from NCF 2005, NCFTE 2009, and NPE 2016
Category Description Coding Guidelines Subcategory/Keywords
Teacher
Accountability
Teacher responsibility towards student learning
Cannot include teacher attitude towards students.
Autonomy, responsibility, student/teacher independence, teacher assessment
Finally, the research questions and theoretical framework aided in interpreting the results.
For the study, I adopted an interpretive approach to understand how each individual chosen
document dealt with the traditional and non-traditional teacher quality variables. Even after
categories were assigned to the text, I paid attention to the wording of each sentence in the
context of the relevant paragraph to understand the meaning in its entirety.
Limitations of the method. Bowen (2009) asserts that documentation in content analysis
is more a potential flaw than a limitation. The documentation flaw occurs due to the fact that
most of the documents are not created for research and, therefore, the information can be
insufficient to answer the research question. The research has reduced this flaw by choosing

70
three overarching policy documents that outline the education for schools in India including
teacher education.
Similarly, Kuckartz (2014) outlines three potential threats to content analysis:
anecdotalism, trustworthiness, and transparency. Kuckartz (2014) explains that anecdotalism
happens when selected parts of a text or document are used for the analysis, which can give an
inaccurate picture of the data. In this study, I avoided anecdotalism by selecting and uploading
and coding the full three documents. Next, to reduce the possible threat of trustworthiness, I
followed the procedure outlined in the study and analyzed the data objectively. Finally, by
outlining detailed explanations on the units of analysis, constructs, coding and analysis methods,
I have tried to maintain transparency in the study.
Quantitative Research Methodology and Rationale
By identifying the teacher quality variables that have the strongest relationship with
student performance in mathematics in PISA 2009, the study collected relevant information. The
information may assist policymakers in adjusting the education resources to relevant teacher
quality variables that increase student performance in mathematics. This section looks at the
quantitative methodology of the study.
The quantitative method of the study used correlation analysis and multiple regression
to determine how traditional or non-traditional teacher quality variables influence student
performance in mathematics on PISA 2009 testing. It also determined individually which of the
traditional and non-traditional teacher quality variables most strongly influence student
performance in mathematics. A correlation analysis shows the direction and strength of the
relationship between two or more variables (O’Brien & Scott, 2012) and, for this research,
multiple regression showed the magnitude of the relationship between the teacher variables, both
71
traditional and non-traditional, to student performance in mathematics.
Since correlation analysis is limited to only establishing a relationship between two
variables (O’Brien & Scott, 2012), the study also used multiple regression. Multiple regression
helps determine the predictive power of the independent variables on the dependent variable
(O’Brien & Scott, 2012). Therefore, in the study, multiple regression assisted in examining the
relationships between the various independent teacher variables and the dependent variable—
student performance in mathematics—and identified the “best predictor of an outcome amongst a
set of variables” (O’Brien & Scott, 2012, p. 5).
For the correlation analysis and multiple regression, Statistical Software for Social
Sciences (SPSS), now called the IBM SPSS version 24, was used for calculations and graphing.
The International Database (IDB) analyzer by the International Association for the Evaluation of
Educational Achievement is an add-on to SPSS and uses appropriate weighted estimates for
analyses of large assessments like the PISA for unbiased results (IEA, 2013). The mathematics
literacy scores of students are represented in plausible values and not actual student scores. The
analyzer has an analysis module that has the capability of including plausible values as
dependent or independent variables.
Research design. Correlation analysis and multiple regression were used to answer the
quantitative research questions:
RQ2a: Which traditional teacher quality variables are most strongly related to
student mathematics performance in India?
RQ2b: Which non-traditional teacher quality variables are most strongly related to
student mathematics performance in India?
72
RQ2c: How are traditional and non-traditional measures of teacher quality
differently related to student mathematics performance in India?
The OECD has collected data on teacher quality variables which were considered for the
study and student performance in mathematics. The data collected from the OECD PISA 2009
database is continuous for some variables and nominal for some variables for Tamil Nadu and
Himachal Pradesh. The data from the school questionnaire and student questionnaire in PISA
2009 for the two states was filtered and merged to produce data considered representative of
India in this research, since the study is not a comparative study between the two states.
Each traditional and non-traditional teacher quality variable was compared to the
students’ mathematics performance or the mathematics scores for PISA 2009. SPSS and the IDB
analyzer were used to generate Pearson’s coefficient r (+1 to -1) to establish the relationship
between the teacher quality variables, both traditional and non-traditional, and the mathematics
performance.
Next, the IDB analyzer and SPSS were used for correlation analysis and multiple
regression. O’Brien and Scott (2012) state that multiple regression is a method used to answer
research questions that relate to “how well a set of variables can predict a particular outcome”
and “identification of the best predictor of an outcome amongst a set of variables” (p. 5). Thus,
the research method allowed determination of whether it is the traditional teacher quality
measures or the non-traditional teacher quality measures that are most strongly related to the
outcome and the individual contribution of each variable to the outcome variable (O’Brien &
Scott, 2012). Two simple multiple linear regressions were used in which traditional and non-
traditional teacher quality variables were entered into their respective equations in the IDB
analyzer and SPSS separately. There was no hierarchy of any variable maintained in the study.
73
Hypotheses. The quantitative analysis in this study tested three initial hypotheses
regarding teacher quality variables and student performance in mathematics. Teacher quality is
divided into two broad categories in this study: traditional teacher quality variables and non-
traditional teacher quality variables. The traditional teacher quality variables include teacher
qualification, teacher certification, and professional development. In comparison, the non-
traditional teacher quality variables include teacher subject-matter qualification, teacher
absenteeism, teacher attitude, and teacher salary. The three initial hypotheses presented are based
on both the theoretical framework and the literature review.
The first hypothesis suggests that, of the traditional teacher quality variables, student
performance in mathematics is significantly dependent on professional development of teachers.
The ongoing and subject-related professional development will improve teachers’ content
knowledge as well as their teaching practices. Professional development will provide teachers
with updated key strategies to teach the subject, which will significantly influence student
achievement in mathematics (Wenglinsky, 2002). Therefore, the first hypothesis states:
H2a: Of the traditional teacher quality variables, student performance in mathematics is
significantly related to professional development of teachers.
Interestingly, in India, the importance of professional development for the teachers stems
from the Vedic period8 where activities like yatras9 and kathas10 were organized for teachers,
though not systematically as compared to programs in the current times (Tiwari, 2016). Although
currently India has some professional development models like the Split model, the Site-based
model, and the Self-directed models, they have failed to bring about any effective changes in
8 Vedic Period: (c. 1500 - c. 600 BCE) 9 Yatras are where teachers travel around the country to learn from other teachers in different schools. 10 Kathas are stories that add to the existing knowledge of the teachers.
74
education (Tiwari, 2016). As India is embracing the world culture of education, it is learning
from international models of continuous professional development, like the Michigan Teacher
Excellence Program (MiTEP), Inquiry Learning, and Collaborative Learning (Tiwari, 2016), the
importance of providing relevant professional development activities for teachers to improve
teacher quality. Also, Tiwari (2016) states that evidence suggests students benefit “from teachers
who are not only qualified and experienced but at the same time always have an updated
knowledge base” (p. 1).
Moving to the second hypothesis, evidence suggests that the regular presence or
attendance of a teacher is vital in the education of a student; thus, teacher absenteeism is a
measure of teacher quality (Uehara, 1999). Also, teacher absenteeism gives an incorrect message
to the students that school attendance is not important, and it has a negative impact on student
outcomes (Uehara, 1999). In India, teacher absenteeism is a major issue leading to a loss of over
$2 million in education spending (Patrinos, 2013). Interestingly, a study by Muralidharan, Das,
Holla, and Mohpal (2013) showed that teacher absenteeism, though high in India, varies across
its states. High performing states like Tamil Nadu, Maharashtra, and Punjab have teacher
absenteeism rates below 15% compared to other states. Therefore, the second hypothesis states:
H2b: Of all the non-traditional teacher quality variables, student performance in
mathematics is significantly related to teacher absenteeism.
Hypothesis 2b suggests that out of the non-traditional teacher quality variables, teacher
absenteeism is most strongly related to student performance in mathematics. The rationale
behind this is that the classroom is the primary venue in which students and teachers interact;
therefore, when a teacher remains absent, students miss out on crucial learning in mathematics
and daily practice, which is essential for a practical subject like mathematics (Porres, 2016).

75
Finally, the third hypothesis suggests that in India, performance of students in
mathematics is significantly related to non-traditional teacher quality variables. For example,
India is a developing country and the human capital theory states that investment in teacher
quality acts as a future investment for the country and also for individuals (Mincer, 1981).
Teacher salary in India is low compared to the international level (Varmal, 2014), and, therefore,
monetary incentives like teacher performance pay and salary increases act as a strong motivator.
Furthermore, the literature review also shows performance pay and increased pay structures for
teachers have been indicated to impact student performance in mathematics (Kingdon & Teal,
2007). Therefore, the third hypotheses states:
H2c: In India, performance of students in mathematics is significantly related to non-
traditional teacher quality variables more than traditional teacher quality variables.
Based on the world culture theory, India is embracing certain educational norms or
standards to be a part of the global world culture in education. For example, similarly to the
education systems in the West, and in particular the United States, where teacher subject-matter
competency is required to teach a particular subject, in India too, subject-matter competency in
mathematics is a key priority in the NCF 2005 (NCERT, 2005). Also, evidence suggests a
positive relationship between teacher subject-matter competency in mathematics and student
achievement in mathematics (Rowan, Chiang, & Miller, 1997; Wenglinsky, 2002).
Participants. The OECD collected data for the fourth cycle of PISA assessments in
2009. There were originally 65 participating countries or economies. Thirty-four were member
countries, and 10 additional economies or countries could not participate within the PISA 2009
timeframe, participating instead in the PISA 2009 plus project (Walker, 2011). India participated
in the 2009 plus testing. The data and results of PISA 2009 plus were merged with the 2009 data

76
and results.
PISA testing is administered to 15-year-olds from seventh grade and above, and PISA
seeks to be as inclusive as possible in respect to both students and schools who are participating.
There were 1,616 students from seventh grade onwards that participated in PISA 2009 in
Himachal Pradesh and 3,210 students from Tamil Nadu. The total number of students, 4,826, is
considered a good sampling base for this study. Students from diverse socio-economic
backgrounds and abilities participate in PISA, and schools can exclude students from
participating in the tests if they are intellectually disabled, have functional disabilities, or if they
have low English language experience (OECD, 2010). Furthermore, private and public schools
participate in the tests, although special needs or small schools in remote regions are excluded.
Indian states of Himachal Pradesh (QHP) and Tamil Nadu (QTN) were the only two
states of India that participated in the 2009 plus testing and were the participants used for this
study. The country code for India is a three-character code (356) representing Himachal Pradesh
(HP) and Tamil Nadu (TN). A total of 213 schools from both the states participated in the PISA
2009 assessment, of which 66 schools were from Himachal Pradesh and 147 schools were from
Tamil Nadu. In total, there were 138 public schools and 65 private schools that participated,
while information about 10 schools was missing. Since there was no human subject research,
IRB approval was not required for the study.
Data integrity. The PISA is a reliable and valid test for mathematics, science, and
reading (OECD, 2012) as a result of numerous features. For comparability of results, students’
responses are coded in a uniform way country to country. For this, the OECD provides
international training for two representatives from each country. The reliability score for
mathematics is 0.882 and 0.75 for the survey questionnaire. Additionally, for construct validity,
77
PISA uses the Cronbach’s alpha approach to ensure consistency between countries. Strict control
and standards are set by the Technical Advisory group of the OECD to reduce bias in data
collection and documentation (OECD, 2012). It is stated that “internationally developed
instruments are widely examined for cross-national, cross-cultural and cross-linguistic validity
and that the interests and involvement of national stakeholders are considered throughout the
study” (OECD, 2012, p. 368).
Storage. No storage or filing of any data was required as the data was secondary data
collected by the OECD. The data used for this study was easily accessible to all through the
OECD website.
Sampling. The sampling design used in the PISA 2009 assessment was the two-stage
stratified sample design. The international target population for PISA 2009 included all 15-year-
old students from seventh grade and upwards studying in educational institutions (OECD, 2012).
In respect to the 15-year-old age criteria, OECD specified that for countries participating in April
2009, students born in 1993 attending educational institutions were eligible for the testing.
For school selection, the OECD maintained that the school sampling frame was
comprehensive and included “any school that could have 15-year-old students, even those
schools which might later be excluded, or deemed ineligible because they had no PISA-eligible
students at the time of data collection” (2012, p. 66). Within each selected school, a student
listing form, including a number of criteria, was prepared to determine student eligibility for
PISA testing. Age-eligible students were students born in 1993 (or the appropriate 12-month age
span agreed to by the participating country). It was suggested that schools retain a copy of the
student list in case the National Project Manager had to contact the school with questions.
Student lists were to be up-to-date at the time of sampling rather than a list prepared at the
78
beginning of the school year. Students were identified by their unique student identification
numbers (OECD, 2012, p. 40).
Once the National Project Managers received the student listing form from the schools,
student sampling was done using Key Quest, a PISA Consortium Software (OECD, 2012). All
participating countries, excluding Germany, used the Key Quest. To select students from the list,
PISA 2009 used two-stage stratified sampling wherein the first stage schools were selected from
a comprehensive list of PISA eligible schools, and in the second stage, students were selected
from the schools chosen in the first round. In general, 35 students from each school were
randomly chosen from the list. If the number of students was low, then all students from the
school were selected (OECD, 2012). OECD ensured “students were a representation of the full
target population of 15-year-old students in the participating country” (2012, p. 58).
Variables. The OECD used the survey method to collect data on each teacher variable
selected for the study (OECD, 2010). The student mathematics responses were taken from the
student data file available on the PISA 2009 website. The descriptions of the variables chosen for
traditional and non-traditional teacher quality are listed below.
Independent Variables (IV)—Traditional teacher quality variables.
Teacher qualification —full time. This variable is assessed by asking the following
question: “How many of the following teachers are on the staff of your school?—Full time
ISCED5A qualification” (SC09Q3111).
Teacher qualification—part time. For part time, fully qualified teachers, the question
“How many of the following teachers are on the staff of your school?—Part time teachers
ISCED5A qualification” (SC09Q32) applies.
11 The questions are from the school questionnaire from the compendium file in the PISA 2009 database. The questions are denoted by their respective question numbers for reference.
79
Teacher certification—full time. This variable is assessed by asking the following
question: “How many of the following teachers are on the staff of your school?—Full time
teachers fully certified” (SC09Q21).
Teacher certification—part time. For part time, fully certified teachers, the question
“How many of the following teachers are on the staff of your school?—Part time teachers fully
certified” (SC09Q31).
Professional development. This variable is assessed by the following statement, “The
school management makes sure that the professional development activities of teachers are in
accordance with the teaching goals of the school” (SC26Q01). The responses are categorical:
Never with a score of 1, Seldom with a score of 2, Quite often with a score of 3, and Very often
with a score of 4.
Independent Variables (IV)—Non-traditional teacher quality variables.
Teacher absenteeism. This variable is assessed by the question text, “To what extent is
the learning of students hindered by the following phenomenon—teacher absenteeism?”
(SC17Q06). The variable is categorical and scored by ticks. According to the codebook, Not at
all scores 1, Very little scores 2, To some extent scores 3, and A lot scores 4.
Teacher qualified in mathematics subject. This variable is assessed by the question, “Is
your school’s capacity to provide instruction hindered by any of the following issues—lack of
qualified mathematics teachers?” (SC11Q02). The variables are categorical and scored by ticks.
According to the codebook, Not at all scores 1, Very little scores 2, To some extent scores 3, and
A lot scores 4.
Teacher attitude—Poor student-teacher relationship. This variable is assessed by the
question, “Is your school’s capacity to provide instruction hindered by any of the following

80
issues—poor teacher and student relationship?” (SC17Q03). The variable is categorical and
scored by ticks. According to the codebook, Not at all scores 1, Very little scores 2, To some
extent scores 3, and A lot scores 4.
Teacher attitude—Teachers being too strict with students. This variable is assessed by the
question, “Is your school’s capacity to provide instruction hindered by the following issues—
teachers being too strict with students?” (SC17Q06). The variable is categorical and scored by
ticks. According to the codebook, Not at all scores 1, Very little scores 2, To some extent scores
3, and A lot scores 4.
Dependent Variable (DV).
Student mathematics scores. The data for the student mathematics scores is obtained from
the student data file. The mathematics literacy scores are available for all the 4,826 students that
participated in PISA 2009 testing from India. The mathematics scores are reported as plausible
values pvmath1, pvmath2, pvmath3, pvmath4, and pvmath5. Plausible values are a kind of
student ability estimate (OECD, 2010).
Instrument.
Mathematical literacy and assessment. PISA assesses outcomes in three areas: reading
literacy, mathematical literacy, and science literacy. Mathematical literacy in PISA is defined as:
An individual’s capacity to identify and understand the role that mathematics plays in the
world, to make well-founded judgments and to use and engage with mathematics in ways
that meet the needs of that individual’s life as a constructive, concerned and reflective
citizen. (Walker, 2011, p. 4)
The PISA mathematical assessment is concerned with real life problems that go beyond
what is encountered in school classrooms. The assessment is concerned with testing students’
81
ability to analyze, reason, and communicate effectively through solving the 35 questions.
According to OECD (2010), the questions are broadly grouped in three clusters:
1) The situation or context, which is the setting of the problem or all the elements used to
formulate the problem. OECD (2010) explains that most of the problems in this cluster
are real-world problems where students need to apply mathematics. For example, in this
cluster, problems can be based on finance or banking.
2) The mathematical content, in which all the problems cover the four overarching
mathematical ideas of space and shape, change of relationships, quantity, and
relationships.
3) The mathematical competencies, which are the fundamental processes that students use
to solve the real-world problems. They are further divided into three clusters: the
reproduction cluster (requiring reproduction of practiced knowledge), the connection
cluster (making connections involving familiar or non-familiar settings), and the
reflection cluster (requiring formulation and implementation of solutions).
The PISA 2009 mathematical literacy assessment was completed individually by all the
students in a paper and pencil-testing format for two hours. An additional 40 minutes was given
to complete the mathematics and science sections when a computer was used. The mathematics
assessment consists of 35 multiple-choice questions and questions for which students have to
calculate their own answers (OECD, 2010). The student performance in mathematics was stored
in a data file called the student data file (OECD, 2010). The student data file has information on
student identification number, school identification number, student age and gender, family
background, and mathematics, science, and reading literacy scores.
The school questionnaire tool used for this study was filled out by school principals
82
mostly through the paper and pencil format. The school questionnaire has questions about school
resources, a school’s instructions, curriculum and assessment, school climate, school policies,
structure and organization of the school, and the characteristics of the principal (OECD, 2010).
The school questionnaire and mathematics assessment are administered every three years
(OECD, 2010).
Data collection. The PISA 2009 data for the study is a secondary data type, which is
collected by the OECD. Data is accessed using the database from OECD 2009 that is accessible
to the public (www.oecd.org/2009pisa). The data collection procedures are strictly monitored for
documentation of data collection and implementation of procedures (OECD, 2012). The
procedures for data collection are consistent in every participating country to ensure high data
quality (OECD, 2012). Data for the Indian states of Himachal Pradesh and Tamil Nadu were
accessed from the school data file and student data file. The school questionnaire created by the
OECD has 27 questions to gather information on school resources among other areas. The school
questionnaire is answered by the principal or designate. The pvmath scores were obtained from
the student data file.
Procedure. Since the research is a non-experimental study, the data was secondary and
was collected from the PISA 2009 student data file and school data file. The data for the student
mathematics performance (dependent variable) was collected from the student data pertaining to
India. To reduce the length of the test, PISA applied matrix sampling, which splits one long test
booklet into several short test booklets. Therefore, each student works on one booklet only.
Because students complete different tests, mathematics achievement cannot be obtained using
traditional test scores, but instead by using plausible values. Responses in the student data for
mathematics is grouped under five plausible values (pvmath1 to pvmath 5). Instead of obtaining
83
a point-estimate for student ability, which is a traditional test score for each student, plausible
values are derived for each student (Neuschmidt, 2017).
The independent variables (traditional and non-traditional) were derived from the school
data file, which has data for the selected teacher variables. The type and measurement of each
variable is given under the heading “Independent Variables (IV)—Traditional teacher quality
variables” and “Independent Variables (IV)—Non-traditional teacher quality variables.” The
school data-file relating to traditional and non-traditional teacher quality variables was merged
with the student data file, and the key field was the school ID.
Each traditional and non-traditional teacher variable was compared to the mean student
score for every participating student in every participating school in the Indian states of
Himachal Pradesh and Tamil Nadu.
Data analysis. There were two main data analysis methods or techniques used in this
study: correlation analysis (Chen & Popovich, 2002; O’Brien & Scott, 2012) and multiple
regression (O’Brien & Scott, 2012). The IDB analyzer and SPSS were used to analyze the data.
Correlation analysis. The first step is to check for basic assumptions for correlation
analysis. This is to ensure that the data to be analyzed can be analyzed using the selected
correlation tests. The IDB analyzer uses Pearson’s correlation test. The first assumption is that
the variables are continuous, and the data is a random sample from the population (O’Brien &
Scott, 2012). Since a few variables were continuous and some were categorical, Pearson’s
correlation test was conducted on the continuous independent teacher quality variables and the
numeric dependent mathematics score variable. The second assumption, which is important for
Pearson’s r, is to check that the variables are normally distributed (Chen & Popovich, 2002). As
the sample size was large (in the thousands), this assumption was not required to be tested.
84
Furthermore, descriptive statistics and correlation analysis were run on all the chosen
independent or predictor variables to determine their relevance in the study. The test of
multicollinearity is essential and is checked through multiple regression analysis.
Multiple regression. There are a few assumptions in multiple regression which were
examined before running multiple regression for valid results. First, it is assumed that the
dependent variable is continuous. The pvmath variable (dependent variable) was numeric and,
therefore, fulfilled the first assumption. Second, there should be two or more independent
variables that are either continuous or categorical (ordinal or nominal). The traditional variables
were all continuous except professional development, which was categorical. In respect to non-
traditional teacher quality variables, they were mainly categorical. The third assumption is the
independence of observation or independence of residuals. Generally, a Durbin-Watson test
available on SPSS is used to test this assumption. However, in this study, this test was not used
as this data was not time series data or chronological data.
The fourth assumption checks for a linear relationship between the independent and
dependent variables. Linearity is checked only for numeric data. This study used scatterplot
visuals to check for linearity using SPSS. The fifth assumption, that there is no multicollinearity
between independent variables, is tested through multiple regression. The sixth assumption is
that there are no outliers that can distort the results. Cleaning the data files with the IDB analyzer
and SPSS was one way to remove outliers by deleting unwanted data. Some of the predictor
variables were categorical and hence were dummy coded for their inclusion in the regression
model by the IDB analyzer and SPSS.
Hypothesis 2a suggests that out of the traditional teacher quality variables, professional
development is most strongly related to student performance in mathematics. Correlation
85
analysis and multiple regression were used. When correlation analysis and multiple regression
were run on all traditional teacher quality variables together with student performance in
mathematics, the association of professional development on student performance was revealed
to test the hypothesis.
Hypothesis 2b suggests that of the non-traditional teacher quality variables, teacher
absenteeism is most strongly related to student performance in mathematics. To test this
hypothesis, correlation analysis and multiple regression were conducted. There were multiple
non-traditional teacher quality variables that are related to student performance in mathematics;
therefore, correlation analysis and multiple regression were the appropriate tools used to test the
hypothesis.
Hypothesis 2c suggests that non-traditional teacher quality variables are strongly related
to student performance in mathematics. To test this hypothesis, correlation analysis and multiple
regression were conducted. There were multiple non-traditional teacher quality variables that are
related to student performance in mathematics; therefore, correlation analysis and multiple
regression were the appropriate tools used to test the hypothesis.
86
Chapter Four: Results
This chapter presents findings and results from the qualitative and quantitative data
gathering and analysis to answer the research questions. It is divided into two sections, the
qualitative phase and the quantitative phase. The qualitative phase begins with a brief review of
the methodology. It is followed by qualitative coding data in matrix tables and representation of
the data in the chosen documents, NCF 2005, NCFTE 2009, and NPE 2016. The quantitative
phase also begins with a brief review of the methodology. It is followed by three sections:
preliminary data analysis, primary data analysis, and results. Chapter Four concludes with a
summary of the findings of both the qualitative and quantitative phases.
Qualitative Phase
The methodological approach chosen for the qualitative part of the study was content
analysis. Content analysis is an appropriate tool to reduce the volume of the three selected policy
documents to a fairly manageable amount for ease in interpretation by the researcher. Content
analysis enables a thorough examination of the chosen Indian documents to understand how they
address or do not address traditional and non-traditional teacher quality variables and thus aid in
answering the research questions.
The following section presents the results of coding the three chosen documents for both
the traditional and non-traditional teacher quality variables.
Qualitative results. Data frequency matrices (see Tables 6 and 7) that show the
percentage of sentences coded in each category in relation to the total number of sentences,
including those marked as “Irrelevant” to the study were used to compile the results to answer
the research questions.
Table 6
Data Frequency Matrix for Traditional Teacher Quality Variables
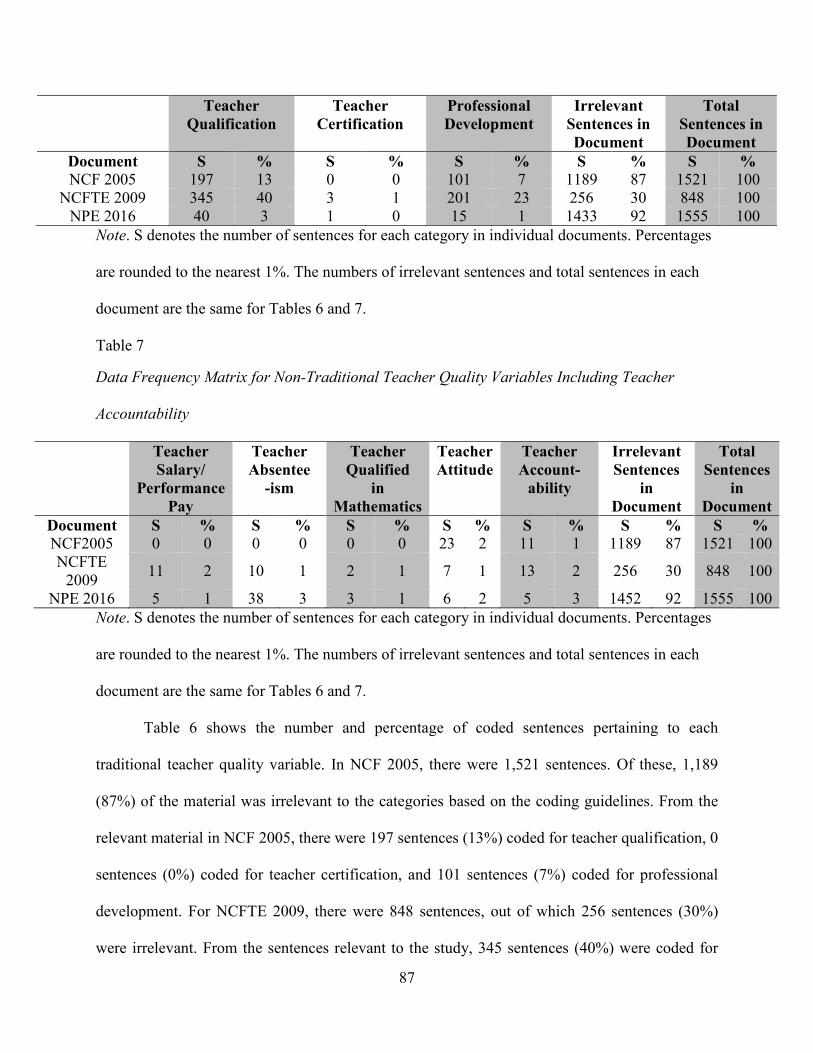
87
Teacher
Qualification
Teacher
Certification
Professional
Development
Irrelevant
Sentences in
Document
Total
Sentences in
Document
Document S % S % S % S % S %
NCF 2005 197 13 0 0 101 7 1189 87 1521 100 NCFTE 2009 345 40 3 1 201 23 256 30 848 100
NPE 2016 40 3 1 0 15 1 1433 92 1555 100
Note. S denotes the number of sentences for each category in individual documents. Percentages
are rounded to the nearest 1%. The numbers of irrelevant sentences and total sentences in each
document are the same for Tables 6 and 7.
Table 7
Data Frequency Matrix for Non-Traditional Teacher Quality Variables Including Teacher
Accountability
Teacher
Salary/
Performance
Pay
Teacher
Absentee
-ism
Teacher
Qualified
in
Mathematics
Teacher
Attitude
Teacher
Account-
ability
Irrelevant
Sentences
in
Document
Total
Sentences
in
Document
Document S % S % S % S % S % S % S %
NCF2005 0 0 0 0 0 0 23 2 11 1 1189 87 1521 100 NCFTE
2009 11 2 10 1 2 1 7 1 13 2 256 30 848 100
NPE 2016 5 1 38 3 3 1 6 2 5 3 1452 92 1555 100
Note. S denotes the number of sentences for each category in individual documents. Percentages
are rounded to the nearest 1%. The numbers of irrelevant sentences and total sentences in each
document are the same for Tables 6 and 7.
Table 6 shows the number and percentage of coded sentences pertaining to each
traditional teacher quality variable. In NCF 2005, there were 1,521 sentences. Of these, 1,189
(87%) of the material was irrelevant to the categories based on the coding guidelines. From the
relevant material in NCF 2005, there were 197 sentences (13%) coded for teacher qualification, 0
sentences (0%) coded for teacher certification, and 101 sentences (7%) coded for professional
development. For NCFTE 2009, there were 848 sentences, out of which 256 sentences (30%)
were irrelevant. From the sentences relevant to the study, 345 sentences (40%) were coded for

88
teacher qualification, three sentences (1%) were coded for teacher certification, and 201
sentences (23%) were coded for professional development. For NPE 2016, there were 1,555
sentences, out of which 1,433 sentences (92%) were irrelevant to the study. From the relevant
sentences, 40 sentences (3%) were coded for teacher qualification, one sentence (0%) was coded
for teacher certification, and 15 (1%) were coded for professional development.
Table 7 shows the number and percentage of coded sentences pertaining to each non-
traditional teacher quality variable. For NCF 2005, there were 1,521 total sentences in the
document, out of which 1,189 (87%) were irrelevant to the categories based on the coding
guidelines. From the relevant material in NCF 2005, there were 0 sentences (0%) coded for
teacher salary/performance pay, 0 sentences (0%) coded for teacher absenteeism, 0 sentences
(0%) coded for teacher qualified in mathematics, 23 sentences (2%) coded for teacher attitude,
and 11 sentences (1%) coded for teacher accountability. For NCFTE 2009, there were 848 total
sentences in the document, out of which 256 (30%) were relevant to the study. From the relevant
sentences in NCFTE 2009, 11 sentences (2%) coded for teacher salary/performance pay, 10
sentences (1%) coded for teacher absenteeism, two sentences (1%) coded for teacher qualified in
mathematics, seven sentences (1%) coded for teacher attitude, and 13 sentences (2%) coded for
teacher accountability. Finally, for NPE 2016, there were 1,555 total sentences in the document,
out of which 1,433 (92%) were irrelevant to the studies. From the relevant material in NPE 2016,
five sentences (1%) coded for teacher salary/performance pay, 38 sentences (3%) coded for
teacher absenteeism, three sentences (1%) coded for teacher qualified in mathematics, six
sentences (2%) coded for teacher attitude, and five sentences (3%) coded for teacher
accountability.

89
The following sections discuss what each of the policy documents state with respect to
each traditional and non-traditional teacher quality variable. The results are useful in answering
the first research question, which asks how the policy documents frame both the traditional and
non-traditional teacher quality variables.
Teacher quality discourse in 2005—NCF 2005. Throughout the NCF 2005, there is
ample evidence of teacher quality discourse that links quality education and teacher quality.
Further, NCF 2005 also highlights teachers as key stakeholders to student learning and
outcomes. For example, in respect to teacher quality, NCF 2005 states:
The availability of qualified and motivated teachers who perceive teaching as a career
option applies to all sectors of schools as a necessary precondition for quality. … No
system of education can rise above the quality of its teachers, and the quality of teachers
greatly depends on the means deployed for selection, procedures used for training, and
the strategies adopted for ensuring accountability. (p. 8)
NCF 2005 argues that improvement in teacher quality, apart from improving student
learning outcomes, will eventually restructure the globe into a place devoid of conflicts.
Addressing the globe as “our transformative world,” NCF 2005 addresses ways to “modernize”
the system of education to be on par with the world economy (p. 3), where teachers play the role
of facilitators and not just individuals who burden children with rote memorization and excessive
knowledge. Additionally, NCF 2005 states that “in the context of a fast-changing world and a
competitive global context, it is imperative that we respect children’s native wisdom and
imagination” (p. 6) and adequately prepare teachers. In this respect, it looks at some key
important teacher qualities to enhance student education quality in the country.

90
Traditional teacher quality variables.
Teacher qualification. NCF 2005 uses the terms “teacher preparation” and “teacher
education” in lieu of teacher qualification. It advocates that in order to strengthen teacher
education, a new teacher education program should be formulated at pre-primary, primary,
secondary, higher secondary, and graduate levels, and it should be under a recognized university.
Also, the teacher education program should be a five-year program after the 10 + 2 level of
school education followed by the country (NCERT, 2005). NCF 2005 urges including
components of special education, training for effective diagnostic testing for remedial efforts,
and awareness of a well-planned student assessment as part of the teacher education program.
NCF 2005 further stresses adequate teacher preparation and support for teachers to improve
student outcomes, showing that one way to define quality of education in India is through a
child’s performance. Furthermore, the role of institutions of higher education in teacher
education is highlighted in NCF 2005 where it states, “Institutions of higher education have an
important role to play in teacher education and in enhancing the professional status of teachers”
(p. 122).
In regards to strengthening teacher education, NCF 2005 vocalizes the need for
involvement of experts and teachers in preparing teacher education curriculum. Addressing the
existing teacher education curriculum in the education programs, the document remarks,
“Existing teacher curriculum neither accommodates the emerging ideas in context and pedagogy
nor addresses the issue of linkages between the school and innovative educational experiments”
(p. 107). The teacher education curriculum should contain core competencies that teachers at all
levels from pre-primary to graduate levels will follow before their choice of specialization. NCF
2005 adds that “[e]mphasis on these programs should be on enabling teacher trainees to acquire
91
the ability for self-learning and independent thinking” (p. 107). NCF 2005 argues for inclusion of
strategies in teacher education programs that will equip teachers to be well-informed so as to
play a more active role in children’s knowledge construction and not just be a “transmitter of
knowledge” (p. 18).
Being a multilingual country, NCF 2005 urges that it is imperative for teacher education
in every Indian state to include language education by which the teacher should be equipped to
teach in the local language of the state, the official Indian language (Hindi), and the global
language (English). NCF 2005 stresses language education for teachers to enhance student
performance in all subjects including mathematics. The document further states that teacher
education should be “ongoing and onsite” with support in the form of adequate resources made
available in every village, town, and city in the country (p. 39).
With respect to mathematics, NCF 2005 recognizes problems in school mathematics
education and asserts that teachers lack the confidence, preparation, and support to teach the
subject. Additionally, NCF 2005 critiques the current teacher education programs granting
Bachelor of Education or Master of Education degrees as lacking inclusive environments and
strongly recommends cultural, gender, and special needs sensitivity as part of teacher education
curriculum (p. 107). As one of the major goals of NCF 2005 is revamping the existing
curriculum, the document champions training teachers for curricular reform. Furthermore, NCF
2005 contends that teacher education should include a significant component of arts education
applicable to all subjects, even mathematics. As a champion for quality and equality in
education, NCF 2005 proposes equipping teachers with positive strategies to work with children
with different abilities and inclusion of special education components in teacher education
programs.
92
Teacher certification. NCF 2005 does not address teacher certification.
Professional development. Regarding the importance of adequate teacher preparation, for
a subject like mathematics or science, for example, NCF 2005 advocates professional
development for teachers that focuses on specific subjects and not “generic teacher training that
does not provide understanding of content, of instructional techniques, and critical issues in
mathematics education that is needed by classroom teachers” (p. 13). Emphasizing the
requirement of teacher training for teacher quality, the document states that “quality of teachers
greatly depends on procedures used for training” (p. 8) and that teacher training will help
teachers equip themselves to increase student outcomes.
Further quotes in NCF 2005, like “In-service training can play a significant role in the
professional growth of teachers and functions as an agent for change in school-related practices”
(p. 111) and in-service training can be a “process and not an event whereby teachers receive two
to three months of training once every five years” (p. 111), show the importance in the document
of in-service training for teachers. NCF 2005 pays attention to pre-service teacher education and
in-service teacher training and proposes the education and training be carried out systematically
to get quality results from both teachers and students.
Additionally, NCF 2005 recognizes the faults in the current teacher education system and
strongly recommends professional development for pre-primary, primary, and secondary grade
teachers and states that “professionalization of teachers should be reflected in policies governing
recruitment, pre-service, and in-service training and working conditions” (p. 102). Finally, the
document proposes that teacher programs should have a provision for linking the pre- and post-
training of teachers through the DIET within university-based institutions.

93
Non-traditional teacher quality variables. NCF 2005 makes no mention of the non-
traditional teacher quality variables of teacher salary/performance pay, teacher qualification in
mathematics, and teacher absenteeism.
Teacher attitude. NCF 2005 advocates a strong and positive student-teacher relationship
with zero tolerance for corporal punishment by teachers. NCF 2005 talks at length about
discipline and participatory management where it discusses the need for educating teachers to
have a positive attitude. A teacher’s good attitude and relationship with her or his students is
required for a stress-free learning environment for students’ overall growth (NCERT, 2005).
Also, a motivated teacher will motivate students who do not seem to be intrinsically motivated
(NCERT, 2005). Therefore, teachers should be trained and educated to discipline students with
few rules and freedom of expression and thought, inculcating habits of self-discipline (NCERT,
2005). The document also highlights the need for academic and emotional support by teachers to
enhance student learning.
Specific to mathematics, NCF 2005 proposes that mathematics teachers should have an
attitude in class that portrays their belief that every child can learn mathematics, a subject that
gives rise to anxiety in students. Teachers should possess an attitude to encourage every child to
have an equal opportunity to learn and especially be sensitive to children who learn differently
than others (NCERT, 2005). NCF 2005 advises schools to recruit teachers who have a
background in guidance and counseling so that no child is unable to learn. NCF 2005 states, “A
sensitive and well-informed teacher is able to engage children through well-chosen tasks and
questions, so that they are able to realize their developmental potential” (p. 17).
Teacher accountability. NCF 2005 stresses teacher accountability and states that teachers
should be accountable and responsive to the needs of children and “should view appraisal as a

94
continuous educative process” (p. 108). It also calls for a system for monitoring teaching
carefully be put into place in every school. Stressing the importance of teacher autonomy and
professional independence in enhancing teacher quality, NCF 2005 says that “teacher autonomy
is essential for ensuring a learning environment that addresses children’s diverse needs” (p. 98)
and that a teacher, in order to enhance children’s performance, needs autonomy and
independence in her or his role. Thus, for systematic reforms in the education system, NCF 2005
recommends “preparing teachers and supporting their professional practice” (p. 111) and
suggests giving teachers autonomy and independence in their teaching without much interference
by the school heads as another way to improve teacher quality (NCERT, 2005).
Teacher quality discourse in 2009—NCFTE 2009. NCFTE 2009 developed the
curriculum for teacher education with a vision to make much needed changes in the quality of
teachers through teacher education. The framework highlights the context, issues, and contents
of the curriculum for teacher education and stresses the need to treat teaching as a profession for
which revamping of teacher preparation is an urgent need.
Traditional teacher quality variables.
Teacher qualification. NCFTE 2009 recognizes the symbiotic relationship between
teacher quality and student outcomes and the need for academic and professional standards of
teachers, which is apparent from the following text:
The importance of competent teachers to the nation’s school system can in no way be
overemphasized. It is well known that the quality and extent of learner achievement are
determined primarily by teacher competence and it is a common knowledge that the
academic and professional standards of teachers constitute a critical component of the
essential learning conditions for achieving the educational goals. (p. 1)

95
NCFTE 2009 clearly demarcates between teacher initial education and professional
development. It argues that the initial teacher education plays an important role in the making of
a teacher as it marks “the initiation of a novice entrant to the calling” of the profession (p. 2).
NCFTE 2009 stresses the importance of direct human contact and social interaction among
student teachers as the “core requirement for initial teacher preparation” (p. 17). The document
repeatedly asserts the need for a sound and systematic teacher education program that should
encompass the changing needs of society and be upgraded with innovative skills and practices.
Highlighting the issues with the current teacher education for both elementary and
secondary school, NCFTE 2009 stipulates the ideal duration of teacher education as four years
after senior secondary or two years after a bachelor’s degree program, indicating that this “would
provide enough time and opportunity for self-study, reflection and involvement, engagement
with teachers, school, classroom and pedagogic activity and rigorous theoretical study” (p. 46).
Prior to explaining the curricular area of teacher education, NCFTE 2009 documents
shortcomings of the current teacher education and its vision for a teacher and teacher education
in India. First, it notes that the initial teacher preparation in India for elementary school teachers
suffers from isolation, a low profile, and poor visibility in view of its being a non-degree
program. NCFTE 2009 makes a valid observation here that the early years’ education of children
is crucial for the future of the individual and national development and, therefore, teachers at
elementary levels should be especially well prepared and trained.
At the time of publication of NCFTE 2009, holders of a short-term diploma in education
(D.Ed.) could teach at elementary schools in the country. Arguing that the short duration of the
course failed to equip teachers with required pedagogical skills and training needed to
understand children’s psychological needs and facilitate their learning, NCFTE 2009, therefore,
96
suggests the need to upgrade the elementary teacher education system. In this regard, it cites
“enhancing the entry qualification and duration of training making it equivalent to a degree
program including variety of scholarship from the sciences, social sciences, mathematics and the
languages” (p. 8).
Second, NCFTE 2009 stresses the need to strengthen secondary teacher education in
terms of intensity, rigor, and duration. At the time of its publication, there was an excess of
private colleges that provided sub-standard education and training to teachers, and the increase in
numbers of such institutions needed to be curbed by strict regulations. Such institutions and
programs do not prepare teachers to impart quality education and train teachers as only
“transmitters” of knowledge (p. 11).
Third, NCFTE 2009 realizes that the one-year B.Ed. degree program lacked practical
experience and proposes increasing the duration to two years to make it more relevant to the
children’s learning in the current transforming global situation. Fourth, teacher education in India
is noted to lack professional preparation of teachers in the sense that along with knowledge,
institutions need to produce reflective teachers with a passion for teaching and teachers who
possess positive attitudes and skills (NCTE, 2009). This shows that an attempt is being made to
search for the best teacher education program to improve teacher quality in today’s
transformative society.
While shaping the teacher education for the country, NCFTE 2009 also looks at teacher
characteristics globally. NCFTE 2009’s vision for teacher education keeps intact the Indian
culture and values and yet takes into consideration good teacher education principles and ideas
that are present globally. To this effect, the document purports that teacher education should be
flexible with the changing times, empower teachers, and be “liberal, humanistic” (p. 19), and
97
responsive to individual children’s needs. Also, teacher education should prepare teachers to
understand how students learn and how to actively engage students in learning. Furthermore,
teacher education should train teachers to critically examine textbooks rather than accepting
them as given. Finally, NCFTE 2009 says that teacher education should enable teachers to
understand that the responsibility of a teacher is not limited inside the classroom but extends
beyond with the need to educate students as responsible citizens.
A strong component of the NCFTE 2009 is the curricular area of teacher education to
improve the academic and professional standards of a teacher to achieve educational outcomes.
Evidence of teacher education curriculum is, therefore, extensive in the document (see Figure 5).
The NCFTE 2009 has a comprehensive framework for teacher education curriculum that
includes every aspect of education, including the theoretical, practical, psychological,
philosophical, and socio-economic, to bring about a positive change in teacher education. The
document argues that teacher education has to cover a spectrum of areas for a quality teacher (p.
111). NCFTE 2009 explains that the teacher education curriculum framework is divided into
three areas: Area A (Foundations of Education), Area B (Curriculum and Pedagogy), and Area C
(School Internship).
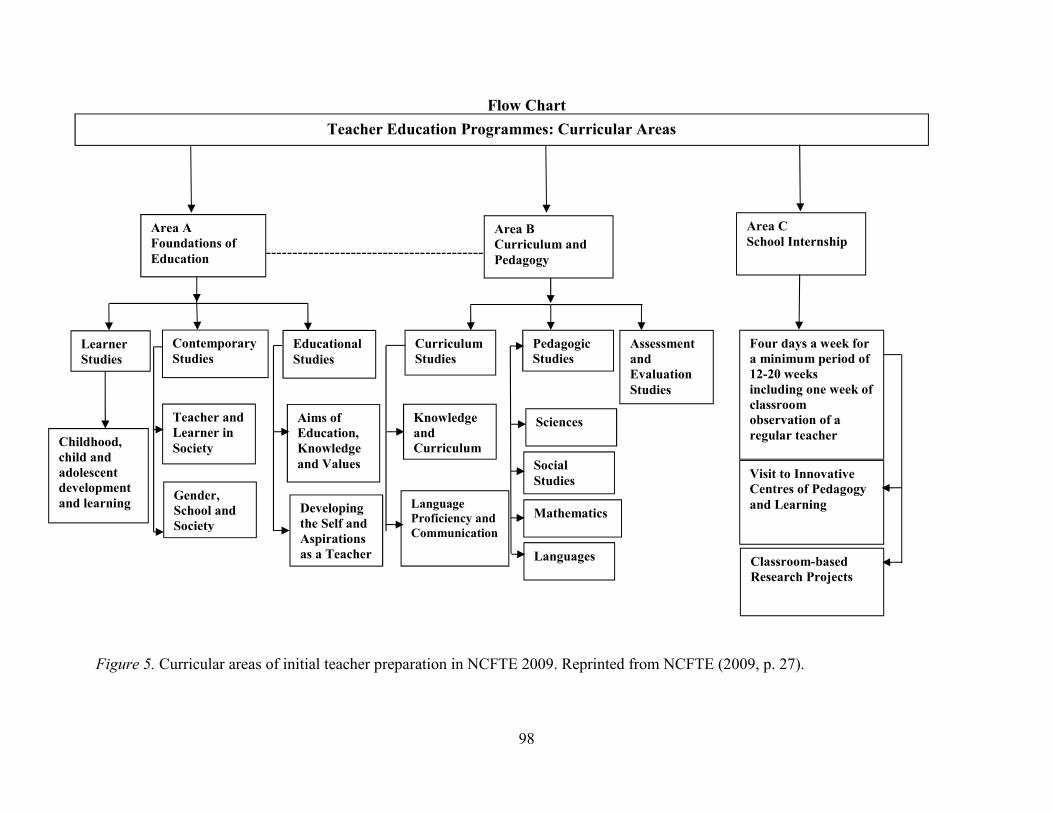
98
Flow Chart
-----------------------------------------
Figure 5. Curricular areas of initial teacher preparation in NCFTE 2009. Reprinted from NCFTE (2009, p. 27).
Teacher Education Programmes: Curricular Areas
Area C
School Internship Area A
Foundations of
Education
Area B
Curriculum and
Pedagogy
Contemporary
Studies
Educational
Studies
Teacher and
Learner in
Society
Gender,
School and
Society
Aims of
Education,
Knowledge
and Values
Childhood,
child and
adolescent
development
and learning
Curriculum
Studies
Knowledge
and
Curriculum
Developing
the Self and
Aspirations
as a Teacher
Pedagogic
Studies
Sciences
Learner
Studies
Language
Proficiency and
Communication
Social
Studies
Mathematics
Languages
Assessment
and
Evaluation
Studies
Four days a week for
a minimum period of
12-20 weeks
including one week of
classroom
observation of a
regular teacher
Visit to Innovative
Centres of Pedagogy
and Learning
Classroom-based
Research Projects
In Area A, Foundations of Education includes Learner Studies, Contemporary Studies,
and Educational Studies, explained as follows:
• Learner Studies: NCFTE 2009 acknowledges that pre-service teacher education at
all levels should be designed to study children and understand how they learn. For
this, teacher education should include subjects like psychology, philosophy, and
sociology that equip teachers with knowledge of children’s learning and thinking
at all age levels. The curricular includes two to three theory courses and a
practicum.
• Contemporary Studies: Teacher education should generate awareness of human
and child rights within the Indian society. Also, teachers should be educated to
understand the classroom environment as a social context and the relationship of
education to society and humanity. This curricular includes one to two theory
courses, projects, seminars, and assignments.
• Educational Studies: Teacher education curriculum should include the meaning of
education, its aims, values, and knowledge, and its relevance to children’s
learning. Through Educational Studies, teachers should be provided with a firm
foundation of educational theory and the practice of education. This curricular
includes one to two theory courses with assignments, built-in field-based units of
study, term papers, and presentations.
Area B of the curriculum includes Curriculum Studies, Pedagogic Studies, and
Assessment and Evaluation Studies, explained as follows:
• Curriculum Studies: NCFTE 2009 rationalizes the need to include general
education principles in teacher education to develop the conceptual foundation of

100
prospective teachers. Curriculum Studies engages student teachers with
“epistemological and ideological assumptions about knowledge, learner, and
learning; their implications for curriculum, pedagogy, and assessment in school
education” (p. 28). The language component is also included in Curriculum
Studies as a teacher’s language proficiency and communication skills are critical
factors in student learning. It includes four to six theory courses with recording
and analysis of observations.
• Pedagogic Studies: The focus is to understand school subjects and their pedagogic
approaches in the context of the learner and school. For example, instead of
teaching basic computations in mathematics, the subject is made more relevant to
the child through its usage in daily life. It includes four to six optional courses
with a practicum.
• Assessment and Evaluation Studies: The idea is to expose student teachers to the
history of evaluation and assessment and apply it not just to track students’
outcomes but also their overall development. It includes one theory course with
group and individual assignments and a practicum.
Lastly, Area C focuses on practical application of the theoretical aspect of teacher
education. NCFTE 2009 recommends that every student teacher should have four days a week of
practical teaching for between 12 to 20 weeks for both two-year and four-year degree programs.
The document further adds that internships should be a partnership between the school and the
student teacher, and schools should make resources available to the student teacher. The student
teacher develops unit plans and maintains reflective journals under a mentor.
101
However, although the NCFTE 2009 carefully maps units that should be included in the
teacher education curriculum, it states that “a teacher education curriculum framework needs to
be in consonance with the curriculum framework for school education” (p. 111). This quote
reaffirms the belief that teacher education curriculum should not be a static document, and
teachers should be trained to rise to the demands of the learner. Also, with the NCFTE 2009
being a template for teacher education across the country, it should be adapted per individual
state needs, keeping in mind the aims, goals, and values of the document. Believing teacher
education curriculum to be relevant and a planned effort, NCFTE 2009 calls for “participatory
curriculum planning involving all stakeholders, modular organizations of curriculum in terms of
critically engaging with theory and bringing practice within its perspective and a professional
approach” (p. 9).
Practicum courses are an integral part of the NCFTE 2009 teacher education curriculum,
showing that for teacher quality to improve, hands-on experience helps with “learning to
integrate ideas, experiences, and professional skills” (p. 38). To ensure that teacher education
curriculum is systematically put together and research based, NCFTE 2009 advocates the need
for research to document practices that can be included in the study for student teachers and also
innovative strategies and models to be included in teacher education curriculum.
Thus, through a single model of teacher education curriculum, NCFTE 2009 includes all
features to bring a desirable change in teacher education and an impact on the educational system
in India. NCFTE 2009 documents the need to replace the teacher education model in place at that
time, which was short in duration and low in planning and quality of teaching, with a model that
“integrates general education with professional development along with intensive internships
with schools” (p. 46). Appendix C has a comparison of a few key features of teacher practice in

102
place prior to NCFTE 2009 and teacher practice proposed at the time of publication of the
curriculum framework.
Although the NCFTE 2009 creates an invaluable framework for teacher education,
it realizes that the framework will remain just a document unless implemented by qualified,
competent, and professional teacher educators. However, there is a shortage of qualified
educators for teachers due to a lack of professional development for pre-school and elementary
school teachers and inadequate design for post-graduate programs in education (NCTE, 2009, p.
75). To address the issue, NCFTE 2009 highlights the need for teacher educators and outlines
their requirements. The document stresses the requirement of a minimum of a B.Ed. degree for
elementary teacher educators and an M.Ed. for secondary school teacher educators. The aim is to
have proficient teacher educators to educate and train teachers that have an impact on student
development and learning.
Teacher certification. Teacher certification in India is obtained by a teaching certificate
or short-term certificate course from authorized and recognized institutions like CENTA. In
contrast, teacher qualification includes pre-service teacher education (e.g., degree or diploma
courses) from private and public institutions recognized in India. NCFTE 2009 does not discuss
teacher certification and the focus of the document is on teaching degrees and diplomas.
Professional development. Regarding a need for professionalization of teacher education
in the country, NCFTE 2009 upholds “initial and continuing professional development to ensure
adequate supply of professionally competent teachers” (p. 2) and development of “reflective
teachers” (p. 15). In respect to training of teachers, NCFTE 2009 recognizes the need for
activities and interactions that would contribute towards sustaining professional development.

103
The document notes that, as professional development is an important ingredient in
enhancing teacher quality, currently there are many opportunities and avenues for such, with
varying degrees of motivating teachers and improving student outcomes. Professional
development still lacks adequate management and compromises on treating teaching as a
profession. NCFTE 2009 strongly recommends careful planning and designing of in-service or
professional development training and recommends certain routes towards teachers’ continuing
professional development.
First, there can be short-term and long-term courses, ranging between four to five days
and up to three months, on specific teacher topics to enable teachers to strengthen their
knowledge in any area. Second, teachers can be trained on using distance media like the internet
that acts as a resource for ideas and for wider dissemination of knowledge with professionals
worldwide. Third, teachers can be encouraged to take a sabbatical year for study and research
that will assist them in enhancing their teaching in class for the betterment of student learning.
Fourth, teachers can be encouraged to attend conferences and meetings connected to the
profession, with schools covering the expense. Fifth, schools can provide planned and
professional workshops regularly for teachers based on teachers’ needs and concerns and make
available required resources for them. Sixth, teacher fellowships can be granted to teachers to
enable them to work as faculty in colleges that are preparing future teachers. Finally, schools can
provide the opportunity for exchange programs for teachers within the country and outside and
utilize services of visiting teachers to enhance the quality of learning in schools (NCTE, 2009).
Furthermore, NCFTE 2009 advocates certain mechanisms be put into place for
professional development and for enacting the curriculum framework. One of the mechanisms it
strongly recommends is resource centers or teacher learning centers (TLCs). These centers are

104
proposed to assist both pre-service training and professional or continuing education for teachers.
Furthermore, a cluster of schools selected by the DIETs to place pre-service student teachers for
internship can also be used for in-service or professional development for existing school
teachers. NCFTE 2009 points out that the need and awareness for professional development gave
rise to more than 500 DIETs previously, although no more than 75% of the institutions were
functional at the time of publication with the reason being lack of qualified faculty to provide
professional training or in-service training to teachers. NCFTE 2009, recognizing the need for
expansion and reforms in professional development to enhance teacher quality and make it
meaningful for the progress of children, recommends strengthening of Institutes of Advanced
Studies in Education (IASEs) that are responsible for in-service training of secondary teachers
and making them responsible for professional development of elementary teachers as well.
Non-traditional teacher quality variables.
Teacher salary/performance pay. Apart from stating that the quality of a teacher includes
teachers’ status, remuneration, conditions of work, and their academic and professional
education and that violation of any of the above factors could impact teacher quality (p. 2),
NCFTE 2009 makes no other comment on teacher salary or performance pay.
Teacher qualification in mathematics. NCFTE 2009 does not discuss in detail teacher
subject-matter competency, though it does mention that specific subject training for teachers is a
part of the curriculum framework.
Teacher absenteeism. NCFTE 2009 does not address teacher absenteeism.
Teacher attitude. NCFTE 2009 stresses the positive attitude that teachers have to possess,
apart from initial and on-going teacher education and professional development. It purports that a
teacher in today’s global world “must be equipped not only to teach but to understand children”
105
(p. 2). Like the NCF 2005, NCFTE 2009 also mandates that a teacher should refrain from any
form of corporal punishment and be a facilitator of children’s learning, helping students
“construct knowledge and meaning” and not just be “givers” of information (p. 3) while
displaying an encouraging attitude towards their students.
Teacher accountability. With respect to teacher autonomy, NCFTE 2009 asserts that
teachers should play an active role in designing textbook content and curriculum to improve the
learning outcomes of the students. NCFTE 2009 talks about teacher autonomy in the form of
preparing teacher education programs to inculcate responsibility towards student learning.
Teacher quality discourse in 2016—NPE 2016. NPE 2016, a guiding document of the
policies of the Central Government, critically recognizes the importance of quality education for
the social, economic, and political growth of the country. To this effect, it states, “[A]n education
system built on the premises of quality and equity is central to the sustainable success in the
emerging knowledge economy” (p. 1). Apart from quality education, the discourse on teacher
quality is present in NPE 2016. The document recognizes that teachers are the pivot point around
which the education system of the country revolves, and quality of the teachers needs to be
increased to improve quality of education.
Traditional teacher quality variables.
Teacher qualification. Focusing on the importance of quality teachers in school
education, the draft of NPE 2016 states its mission is to “foster quality education with a strong
focus on … teacher quality and performance” (p. 14). Similar to the NCFTE 2009, NPE 2016
blames the poor quality of education in the country on poor teacher quality resulting from
inadequate teacher education and training. It is evident that the policy is seriously looking at
strengthening teacher education as it states that “it will be mandatory for all teacher institutions
106
such as DIETS, B.Ed., etc. to be accredited and benchmarking standards will be set up for block
resource centers” (p. 29).
The policy recognizes that the education system in India has paid a heavy price for
neglecting teacher education and training. Therefore, placing strong emphasis on teacher
education, NPE 2016 recommends following the NCFTE 2009 benchmark of a four-year
integrated Bachelor of Arts/Bachelor of Science/Bachelor of Education and further proposes the
possibility of a five-year integrated program after tenth grade for elementary teachers and after
twelfth grade for secondary teachers. The policy strongly advocates making the four-year
integrated course mandatory in all states. The expectation is that such a policy will give the
students the chance to be sure of their choice of the teaching profession and thereby increase
content knowledge and teacher quality. Furthermore, the policy recommends that the entry to the
B.Ed. degree should have a benchmark minimum requirement of marks of 50% or greater at
graduation. The policy aims for this to give the students the chance to be sure of their choice of
the teaching profession and thereby increase content knowledge and the teacher quality.
NPE 2016 addresses teacher quality within the context of the significant changes that are
in the current education system. NPE 2016 recognizes that teaching is no more confined to the
classroom, and students have access to new knowledge. The authors of NPE 2016 want to “guide
the new renewal process in India” (p. 5). Thus, to equip teachers to efficiently carry out their
duties, NPE 2016 proposes mandatory teacher training, a 4-year integrated teacher education
program that includes research, innovation, and experimentation, and links between teachers
accountable for student learning outcomes to improve teacher quality. To ensure that qualified
and competent teachers are employed in schools, the policy advises states in the country to have
separate teacher recruitment boards, approved by the Central Government.
107
With respect to teacher education curriculum to prepare teachers, NPE 2016 advises
integration of information and communication technologies (ICTs) as part of teacher education
curriculum to enhance teaching quality. Discussing the need to prepare teachers to handle the
dynamics of the current demands of education, the draft of NPE 2016 states that the “role of
teachers will be redefined to promote adoption of a blended model of pedagogy with a
combination of self-learning, practical and collaborative learning components” (p. 39).
Additionally, the NPE 2016 recommends linking teaching to research to enhance teacher quality
in the country.
Teacher certification. NPE 2016 recommends teacher certification or licensing once
every ten years to keep abreast of new additions in teacher education.
Professional development. Recognizing the importance of in-service training for teachers,
the NPE proposes use of information technology to train teachers and keep them abreast of
teaching strategies and techniques from around the world. Further, NPE 2016 calls for
“mandatory in-service training for all teachers once in every three years” (p. 30), revealing that it
is affirming earlier policies on requisite teacher training to improve teacher quality. The policy
suggests that current teachers in government schools who are working towards getting their
B.Ed. degree should be provided regular in-service training to improve the quality of teaching.
Additionally, the authors of the policy are of the opinion that, although the number of
SCERTs and DIETs that provide professional training to teachers is increasing, there is a lack of
adequately qualified and trained teacher trainers. The policy, therefore, advocates that teacher
trainers should have the same qualifications as college lecturers (doctorate degree) and be paid
on a similar pay scale.
Non-traditional teacher quality variables.
108
Teacher salary/performance pay. NPE 2016 remarks that in many states in the country, a
system of correlation between teacher monetary incentives and performance is lacking, which
demotivates the teacher, thus affecting school education. Therefore, the NPE 2016 calls for
“effective monitoring of teacher performance, with built in incentive systems like extra
incentives based on teacher performance” (p. 41).
Teacher qualification in mathematics. NPE 2016 recognizes the importance of subject-
matter competency and, though not elaborating much, states that “[t]he four year integrated
B.Ed. course will be strong in subject content” (p. 179).
Teacher absenteeism. NPE 2016 advocates appropriate mechanisms to prevent teachers
from being out of the class. It is noted that during elections, many political parties use teachers to
help with their administrative work, resulting in teachers not being in the class to teach. This
impacts the quality of education and the learning outcomes. The NPE 2016, therefore, wants to
prevent political interference in the teaching duties of the teacher through appropriate
management measures. Some states are noted as trying to control teacher absenteeism through
bio-metric attendance recording, but the situation in the country is noted to need a lot of attention
(p. 133).
Teacher attitude. NPE 2016 specifies that teachers should possess positive attitudes
towards children and their learning, especially with children with special needs. The policy
specifically states that teachers should actively involve children in their learning and play the
role of facilitators and mentors.
Teacher accountability. NPE 2016 clearly articulates the need for teacher accountability
for learning outcomes, which is clear from their quote, “Programmes for enhancing the capacity,
motivation and accountability of teachers to deliver quality education and improvements in
109
learning outcomes of students will be accorded priority” (p. 30). Additionally, to ensure teacher
accountability, the draft states that “periodic assessment of teachers in government and private
schools will be made mandatory and linked to their future promotions and increments” (p. 30).
Quantitative Phase
To analyze the influence of both the traditional and non-traditional teacher quality
variables on student performance in mathematics, correlation and multiple regression methods of
analysis are used. A correlation analysis shows the direction and strength of the relationship
between teacher variables, both traditional and non-traditional, to student performance in
mathematics, and multiple regression assists in examining the relationships between the various
independent teacher variables and the dependent variable, student performance in mathematics.
The results aid in testing the hypotheses governing the study. The quantitative phase is divided
into three sections: preliminary data analysis, primary data analysis, and results.
Preliminary data analysis. The data collected from the PISA 2009 for the two states of
QHP (Himachal Pradesh) and QTN (Tamil Nadu) in India were first filtered in SPSS, choosing
all the student variables from the student data files and the teacher quality variables (traditional
and non-traditional) from the school data file. Thus, the two generated SPSS files (student data
file and school data file) were merged using SPSS into one consolidated file with relevant
teacher quality variables. This customized merged file was used for all the analyses. SPSS script
was generated by the IEA’s IDB Analyzer (IEA 2013) in order to account for appropriate
weighting and jackknifing procedures (Neuschmidt, 2017). PISA 2009 testing uses plausible
values to report student performance to assess knowledge or skills of a population. The IDB
Analyzer first produces an SPSS syntax, which takes into account sampling weights and
plausible values reported in PISA 2009. Then, by using this syntax, SPSS conducts a multiple
110
regression analysis and estimates regression coefficients for independent variables, which predict
dependent variables, especially when the dependent variables consist of several plausible values,
like in PISA 2009 (IEA, 2013).
The following section highlights the descriptive statistics for the dependent mathematics
scores and independent teacher quality variables.
Descriptive statistics.
Dependent Variable (DV)—Mathematics scores. The research questions in the study are
analyzing influence of teacher quality variables from the PISA 2009 questionnaire on student
mathematics scores.
The mathematics literacy scores are the dependent continuous variables that are available
for all 4,826 students from India that participated in PISA 2009 testing. The average plausible
mean is 341.32, showing India’s performance in 2009 was way below the OECD average score
of 496. Any score below the OECD average of 496 is considered low (OECD, 2009).
Independent teacher quality variables. The 2009 PISA questionnaire has data on
predictor teacher quality variables, both continuous and categorical, that assist in answering the
research questions, and their parameters are highlighted below.
For RQ2a, which asks “Which traditional teacher quality variable is significantly
associated with student performance in mathematics?,” there are three continuous independent
variables, one categorical independent variable, and the dependent mathematics score that assist
in answering the research question.
The independent traditional teacher quality variables are Full Time, Fully Qualified
Teachers (SC09Q31), Full Time, Fully Certified Teachers (SC09Q21) and Part Time Teachers
(SC09Q22 and SC09Q32 merged together).

111
Full Time, Fully Qualified Teachers (SC09Q31) reflects the number of teachers who are
employed full time by the school and are fully ISCED5A qualified. Data for this variable is
available from 196 schools and data is missing/not available for 17 schools from the 213 schools
that participated in PISA testing (Mean = 17.75, SD = 17.14). The minimum and maximum
values range from zero to 120.
Full Time, Fully Certified Teachers (SC09Q21) reflects the number of teachers who are
full time employed by the school and are certified by the appropriate authority. Data for this
variable is available from 185 schools, and data is missing/not available from the remaining 28
schools (Mean = 29.85, SD = 24.87). On average, there are 30 teachers that are full time and
fully certified. The minimum and maximum values range from zero to 185.
Part Time Teachers (SC09Q22 and SC09Q32) reflects the teachers who are part time
employed by the school and are fully ISCED5A qualified and part time teachers employed by the
school and are fully certified by the appropriate authority. Data is available from 160 schools and
data is missing/not available from 53 schools (Mean = 1.03, SD = 3.71). On average, there is just
one teacher per school that is part time and fully certified and part time fully qualified. There are
138 public schools and 75 private schools that participated in PISA 2009 from the Indian
provinces of Himachal Pradesh and Tamil Nadu. Public schools in India are not allowed to keep
part time teachers to teach core subjects and that could be one reason for the missing data
(OECD, 2009).
Professional Development (SC26Q01) is a categorical variable that is recoded as Yes
equals 1 and No equals 0 (Quite often and Very often = Yes (1), Never and Seldom = No (0)).
This variable is used to indicate how often the school provides professional development
activities to teachers according to the school goals. The frequency distribution shows 4,495

112
responses (100 valid percent), and there are 331 missing/not available responses. The number of
No responses is 408 (9.1 valid percent) and the number of Yes responses is 4,087 (90.9 valid
percent).
The next section highlights vital parameters for the non-traditional categorical
independent variables useful in answering RQ2b.
For RQ2b, which asks “Which non-traditional teacher quality variable is significantly
associated with student performance in mathematics?,” there are four categorical independent
variables and the continuous dependent mathematics score that will assist in answering the
research question.
The independent variables are Teacher Absenteeism (SC17Q06), Teacher Qualified in
Mathematics (SC11Q02), Poor Student-Teacher Relationship (SC17Q03), and Teachers being
too Strict with Students (SC17Q11). Teacher Salary/Performance Pay has not been included in
regression analysis because it is more administrative in nature and is not a true representation of
teacher quality.
Teacher Absenteeism (SC17Q06) is a categorical variable that is recoded as Yes equals 1
and No equals 0 (To some extent and A lot = Yes (1), Not at all and Very little = No (0)). This
variable is used to indicate to what extent the learning of the school is hindered by the variable.
The frequency distribution for this variable shows 4,307 responses (100 valid percent) and
missing/not available responses are 519. The number of No responses is 4,174 (96.9 valid
percent), and the number of Yes responses is 133 (3.1 valid percent).
Teacher Qualified in Mathematics (SC11Q02) is a categorical variable that is recoded as
Yes equals 1 and No equals 0 (To some extent and A lot = Yes (1), Not at all and Very little = No
(0)). This variable is used to indicate to what extent learning of the school is hindered by the
113
shortage of teachers qualified in mathematics. The frequency distribution for this variable shows
4,371 responses (100 valid percent), and there are 455 missing/not available responses. The
number of No responses is 3,911 (89.5 valid percent), and the number of Yes responses is 460
(10.5 valid percent).
Poor Student-Teacher Relationship (SC17Q03) is a categorical variable that is recoded as
Yes equals 1 and No equals 0 (To some extent and A lot = Yes (1), Not at all and Very little = No
(0)). This variable is used to indicate to what extent the learning of the school is hindered by
poor student-teacher relationships. The frequency distribution for this variable shows 4,353
responses (100 valid percent), and there are 473 missing/not applicable responses. The number
of No responses is 3,288 (75.5 valid percent) and the number of Yes responses is 1065 (24.5 valid
percent).
Teachers being too Strict with Students (SC17Q11) is a categorical variable that is
recoded as Yes equals 1 and No equals 0 (To some extent and A lot = Yes (1), Not at all and Very
little = No (0)). This variable is used to indicate to what extent the learning of the school is
hindered by teachers being too strict with students. The frequency distribution for this variable
shows 4,353 responses (100 valid percent), and there are 473 missing/not available responses.
The number of No responses is 3,615 (83 valid percent) and the number of Yes responses is 738
(17 valid percent).
The next sections discuss the outliers, missing data, and the multicollinearity assumption
test before moving to primary data analysis.
Outliers. Outliers are data points that are well below or well above the other data points
for the variable (Pallant, 2010). Outliers can impact the analysis and have to be eliminated. SPSS
has many ways to check for the existence of outliers and I used the measure of Standard residual
114
and the Cook’s Distance rule, as the study uses regression analysis to test hypotheses (Field,
2014). The Cook’s Distance shows the influence of a single data point on the regression analysis
model of the study. The case-wise diagnostics in SPSS calculate the values of the measure of
Standard residual individual (S) and Cook’s Distance for plausible dependent mathematics
scores (pvmath1, pvmath2, pvmath3, pvmath4, and pvmath5) with the teacher quality variables.
If the standard residual is >|±3| and the Cook’s Distance is >|1|, the outlier needs to be eliminated
(Field, 2014). There were a few outliers based on the Standard residual; however, they were no
influential cases according to Cook’s Distance. Therefore, I did not eliminate any outliers in the
study.
Missing data. Missing data is the absence of values for one or more variables in a dataset.
The missing data in the study can be the result of questions not answered in the school and
student questionnaire, questions wrongly answered, or answers that are not applicable (Pigot,
2001). The PISA dataset 2009 for the school and student variables denotes missing data. While
running correlation and regression analysis on the IDB analyzer, I selected the listwise option so
that only a complete set of data is included.
Multicollinearity. Prior to testing the hypotheses in a study, the absence of
multicollinearity between predictor or independent variables needs to be determined.
Multicollinearity was checked in this study through the Variance Inflation Factor Analysis test
(VIF) in the SPSS software. The VIF value indicates whether the independent variables have a
strong linear relationship with other independent variables (Field, 2014). For the study, a value
of VIF less than 10 is considered an absence of multicollinearity (Field, 2014). The VIF and
Tolerance values are reported later in this chapter for each multiple regression equation in Table
9 and Table 10 for all predictor variables.
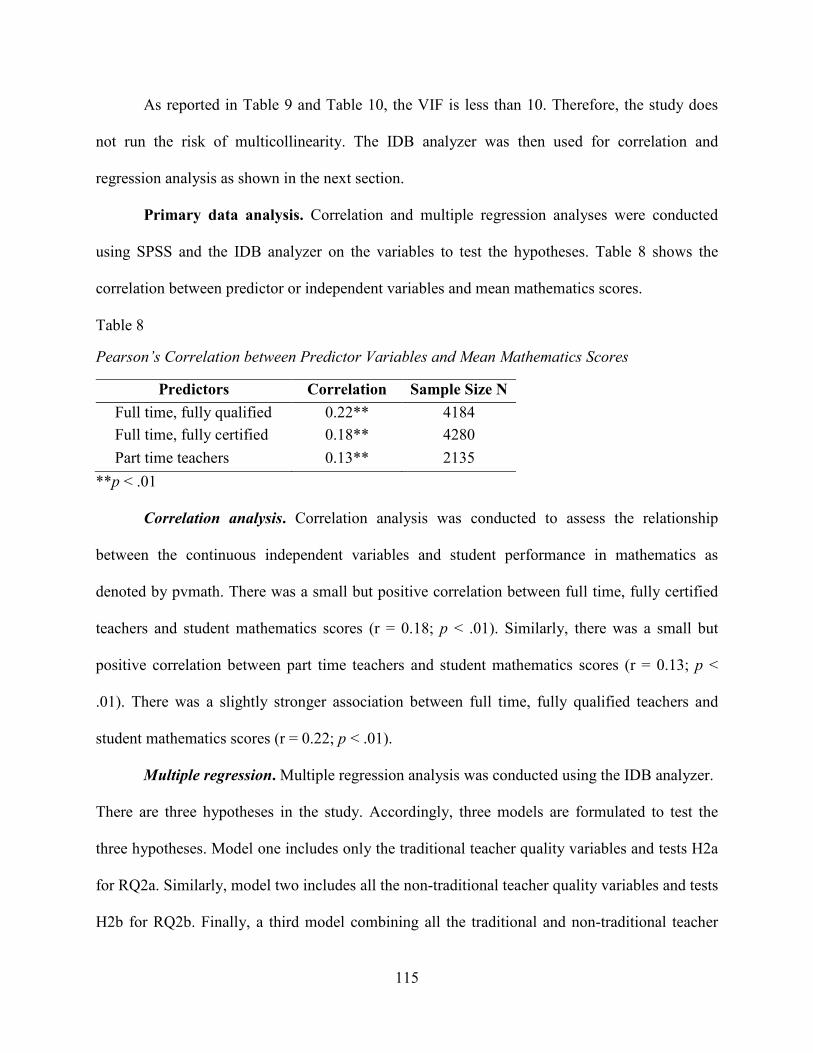
115
As reported in Table 9 and Table 10, the VIF is less than 10. Therefore, the study does
not run the risk of multicollinearity. The IDB analyzer was then used for correlation and
regression analysis as shown in the next section.
Primary data analysis. Correlation and multiple regression analyses were conducted
using SPSS and the IDB analyzer on the variables to test the hypotheses. Table 8 shows the
correlation between predictor or independent variables and mean mathematics scores.
Table 8
Pearson’s Correlation between Predictor Variables and Mean Mathematics Scores
Predictors Correlation Sample Size N
Full time, fully qualified 0.22** 4184
Full time, fully certified 0.18** 4280
Part time teachers 0.13** 2135
**p < .01
Correlation analysis. Correlation analysis was conducted to assess the relationship
between the continuous independent variables and student performance in mathematics as
denoted by pvmath. There was a small but positive correlation between full time, fully certified
teachers and student mathematics scores (r = 0.18; p < .01). Similarly, there was a small but
positive correlation between part time teachers and student mathematics scores (r = 0.13; p <
.01). There was a slightly stronger association between full time, fully qualified teachers and
student mathematics scores (r = 0.22; p < .01).
Multiple regression. Multiple regression analysis was conducted using the IDB analyzer.
There are three hypotheses in the study. Accordingly, three models are formulated to test the
three hypotheses. Model one includes only the traditional teacher quality variables and tests H2a
for RQ2a. Similarly, model two includes all the non-traditional teacher quality variables and tests
H2b for RQ2b. Finally, a third model combining all the traditional and non-traditional teacher

116
quality variables is used to test H2c for RQ2c. The following section restates H2a with its
multiple regression results, H2b with its multiple regression results, and H2c with its multiple
regression results.
Hypothesis 2a. This hypothesis states the following:
H2a: Of the traditional teacher quality variables, student performance in mathematics is
most strongly related to professional development of teachers.
This hypothesis suggests that among the traditional teacher quality variables, professional
development has a significant association with student performance in mathematics. Model one
has all the traditional teacher quality variables, which were simultaneously run in one equation.
Literature review shows that professional development affects teachers’ content knowledge and
teaching practices, thus significantly improving student achievement (Polly et al., 2015;
Wenglinsky, 2012). Therefore, to test the hypothesis and show that professional development is
an important teacher quality variable in the traditional teacher quality variable category, model
one includes only the traditional teacher quality variables including professional development.
The equation used in model one is as follows:
Y = B0 + B1 (Full time, fully qualified teachers) + B2 (Full time, fully certified teachers) +
B3 (Part time teachers) + B4 (Professional development)
where Y is the dependent variable, which is the student performance in mathematics derived
from the PISA 2009 database; B0 denotes the constant; and B1to4 are the regression coefficients
for the traditional teacher quality variables as shown in Table 9 below. Table 9 shows the results
for model one for H2a from multiple linear regression analysis on the IDB analyzer.

117
Table 9
Multiple Regression Results Investigating the Association Between Traditional Teacher Quality
Variables and Students’ Mathematics Performance
Variable Names B S.E. ß p value VIF
Constant 299.84
Full time, fully certified teachers -0.39 0.40 -0.12 .34 2.33 Full time, fully qualified teachers 1.45 0.51 0.35 .03 2.32 Part time teachers 1.38 1.18 0.10 .24 1.02 Professional development 34.16 13.84 0.08 .01 1.01
Note. R2 = .11. N = 855. S.E. = standard error of the slopes. Bold numbers show significant p
values.
In model one, presented in Table 9, multiple regression was conducted to analyze the
relationship between traditional teacher quality variables (IV) and student performance in
mathematics (DV). The combination of the four traditional teacher quality predictors explains
11% of the variance in student performance in mathematics (R2 = .11). Among the four
traditional teacher quality variables, full time, fully qualified teachers and professional
development significantly contribute in predicting student performance in mathematics (p <
0.05). Specifically, controlling for the other traditional predictors in this model, as full time, fully
qualified teachers increases by one unit, predicted outcome increases by 1.45 points. As teachers
attend professional development activities per school goals, the predicted outcome increases by
34.16 points. To compare the importance across the four predictors, the beta weights (ß) suggest
that full time, fully qualified teachers are most strongly related to the outcome.
Full time, fully certified teachers, an independent variable (IV), has a non-significant
relation with the dependent variable (DV), mathematics performance (B = -.39; p = .34). The
interpretation of these findings is that teacher certification in India is still an unexplored field.
Although in India, the State and Central Governments have made it mandatory for teachers to
have teaching certification from CENTA, private schools do not necessarily follow the
118
guidelines. Teachers can get certification from private unrecognized sources and such certified
teachers still get recruited by private schools, leading to low student outcomes.
Full time, fully qualified teachers (ISCED5A), an independent variable (IV), has a
significant relation to mathematics performance (DV). The B value of 1.45 and the
corresponding p value of .03 explains that as the number of full time, fully qualified teachers
increase by one unit, the predicted mathematics scores increase by 1.45 units. The results are not
surprising, as amongst all the traditional teacher quality variables, literature review supports the
fact that qualified teachers have shown increased student outcomes because of the increased
teacher knowledge (Muralidharan & Sundararaman, 2011). The equivalent to ISCED5A
qualification in India is the Bachelor of Education (B.Ed.), and more and more schools in India
are recruiting teachers with a B.Ed. degree from recognized institutions.
Part time teachers include part time teachers that are fully certified and part time teachers
who are fully qualified (IV) that are shown to have a non-significant influence on student
mathematics scores (DV) at p < .05 (B = 1.38; p = .24). The contribution of part time teachers
both certified and qualified in predicting mathematics performance in this model is low.
Results show that professional development (IV), a traditional categorical teacher quality
variable, has a significant positive relationship with mathematics performance (DV) (B = 34.16;
p = .01). The B value of 34.16 and the corresponding p value of .01 explain that as professional
development increases by one unit, the predicted mathematics scores increase by 34.6 units. This
suggests that when professional activities for teachers are conducted according to the schools’
goals, there is a favorable increase in student outcomes.
Thus, the results from model one contradict the hypothesis as amongst the four traditional
teacher quality variables, full time, fully qualified teachers and not professional development is

119
most strongly related to student outcomes.
Hypothesis 2b. This hypothesis states the following: H2b: Of all the non-traditional teacher quality variables, teacher absenteeism is most
strongly related to student performance in mathematics.
This hypothesis argues that among the non-traditional teacher quality variables, teacher
absenteeism has a significant relation with student performance in mathematics. Literature
review shows evidence in support of this claim. Teachers who remain out of the class or school
have been shown to significantly affect student performance, especially in a subject like
mathematics that requires daily practice and teacher guidance (Finlayson, 2009; Miller, 2012;
Porres, 2016). To test this hypothesis, model two includes only the non-traditional teacher
quality variables including teacher absenteeism. The equation used in model two is as follows:
Y = B0 + B1 (Teacher absenteeism) + B2 (Teacher qualified in mathematics) + B3 (Poor
student-teacher relationship) + B4 (Teachers too strict with students)
where Y is the dependent variable, which is the student performance in mathematics derived
from the PISA 2009 database; B0 denotes the constant; and B1to4 are the regression coefficients
for all the non-traditional teacher quality variables as shown in the Table 10 below.
Table 10
Multiple Regression Results Investigating the Association Between the Non-Traditional Teacher
Quality Variables and Students’ Mathematics Performance
Variable Names B S.E. ß p value VIF
Constant 348.77
Teacher absenteeism -6.20 9.73 -.02 .50 1.13 Teacher qualified in mathematics
-19.68 13.03 -.08 .11 1.01
Poor student-teacher relationship -13.05 10.86 -.09 .15 1.01 Teachers being too strict with students
8.56 8.30 .05 .27 1.01
120
Note. R2 = .03. N = 2141. S.E. = standard error of the slopes.
In model two, presented in Table 10, multiple regression was conducted to analyze the
relationship between non-traditional teacher quality variables (IV) and student performance in
mathematics (DV). The combination of the four non-traditional teacher quality predictors
explains 3% of the variance in student performance in mathematics (R2 = .03). The R2 value is
very small, showing that the influence of the non-traditional teacher quality variables on student
performance in mathematics is very low. Among the four non-traditional teacher quality
variables, none of the non-traditional teacher quality variables significantly contribute in
predicting student performance in mathematics, p < 0.05 thus contradicting the hypothesis that
suggests teacher absenteeism is most strongly related to student outcome.
Teacher absenteeism (IV), a categorical variable, has a negative and non-significant
relationship with student performance in mathematics (DV) (B = -6.20; p = .50). The results
suggest there is no relationship between teacher absenteeism and student performance in
mathematics, which is contradictory to what earlier studies have revealed about teacher
absenteeism having an influence on student outcomes (Manswell Butty, 2001; Miller et al.,
2008). However, most of the studies on teacher absenteeism and student performance in
mathematics are cross-national studies not involving India.
Teacher qualified in mathematics, a categorical variable, has a negative and non-
significant relationship with student performance in mathematics (B = -19.68; p = .11). The
results suggest a weak association between a shortage of teachers qualified in mathematics and
predicted mathematics scores. In India and in most developing countries the term “teachers’
qualified in mathematics” is not clearly defined (Goldhaber & Brewer, 1997, 2000; Hill, Rowan,
& Ball, 2005), and this could be one of the reasons for a weak association.

121
Poor student-teacher relationship, a categorical variable, has a negative and non-
significant relationship with student performance in mathematics (B = -13.05; p = .15). Results
are contradictory to previous research that shows a significant relationship between poor student-
teacher relationship and predicted mathematics scores’ decrease (Lee & Loeb, 2000).
Results of teachers being too strict with students, a categorical variable, show a positive
and non-significant relationship with student performance in mathematics (B = 8.56; p = .27).
Interpretation reveals that if teachers are strict with students, there is a possibility of a decrease in
the predicted mathematics scores. This could suggest that disciplinary measures are not helpful
in enhancing student outcomes.
Hypothesis 2c. This hypothesis states the following:
H2c: In India, performance of students in mathematics is significantly related more to
non-traditional teacher quality variables than traditional teacher quality variables.
Hypothesis 2c suggests that the four non-traditional teacher quality variables have a significant
relationship with student performance in mathematics in comparison to the traditional teacher
quality variables. A regression equation combining all the traditional and non-traditional teacher
quality variables was used to test H2c. The equation used in this model is as follows:
Y = B0 + B1 (Full time, fully qualified teachers) + B2 (Full time, fully certified teachers) +
B3 (Part time teachers) + B4 (Professional development) + B5 (Teacher absenteeism) + B6
(Teacher qualified in mathematics) + B7 (Poor student-teacher relationship) + B8
(Teachers too strict with students)
Table 11 outlines the multiple regression results for the combined variables of traditional
teacher quality and non-traditional teacher quality to predict student mathematics performance.
The R2 for this model is .15 indicating that 15% of the variance in student performance in PISA

122
2009 is explained by traditional and non-traditional teacher quality variables. Full time, fully
qualified teachers (p = .01) and professional development (p = .02) are significant predictors of
student performance amongst the traditional teacher quality measures. In the non-traditional
teacher quality measures, poor student-teacher relationship (p = .01) and teachers being too strict
with students (p = .04) are significant predictors of student performance in mathematics. The
combined model predicts full time, fully qualified teachers increase student performance by 1.48
points on average. For every additional occurrence of professional development according to
school goals, the model also predicts student performance will increase by 54.13 points, holding
all other variables constant. For student-teacher relationship, the model predicts that for every
occurrence of a poor student-teacher relationship, student performance will decrease by 34.17
points. Finally, the model predicts student performance will increase by 18.28 units for every
occurrence of teachers being strict with students.
Table 11
Multiple Regression Results Investigating the Combined Association Between the Non-
Traditional Teacher Quality Variables and Students’ Mathematics Performance
Variable names B S.E. ß p value
Constant 287.30
Full time, fully certified .. -0.41 0.37 -0.14 .26
Full time, fully qualified 1.48 0.47 0.35 .01
Part time teachers 1.28 1.14 0.08 .25
Professional development 54.13 15.21 0.14 .02
Teacher absenteeism 8.82 8.94 0.02 .32
Teacher qualified in mathematics -2.87 17.43 -0.01 .87
Poor student-teacher relationship -34.73 9.31 -0.20 .01
Teachers being too strict with students 18.28 9.21 0.11 .04
Note. R2 = .15. N = 849. S.E. = standard error of the slopes. Bold numbers show significant p
values.

123
Full time, fully certified teachers (p = .26) and part time teachers (p = .25) were not
significant predictors of student mathematics performance amongst the traditional teacher quality
measures. In comparison, non-traditional teacher quality measures of teacher absenteeism (p =
.32) and teacher qualified in mathematics (p = .87) were not significant predictors of student
mathematics performance. To compare the importance across the two sets of predictors, the beta
weights (ß) suggest that more traditional teacher quality variables are significantly related to
student outcomes than non-traditional teacher quality variables. Therefore, the results do not
support H2c.
Summary of Qualitative Results
The in-depth analysis of NCF 2005, NCFTE 2009, and NPE 2016 shows that, although
the three documents vary in the way they address the traditional and non-traditional teacher
quality variables, they all propose improving teacher quality in India.
NCF 2005 is considered an important document in India’s education system as it takes
the first stance formally recognizing that the country needs to revamp its education system from
one that focuses on rote learning and memorization to education that is relevant to the overall
development of the child. The document is the first to start the conversation on “modernizing”
the Indian education system, though its focus is on national integration and making education
comparable throughout the country (p. 3). Giving utmost importance to teacher quality, NCF
2005 places “different demands and expectations on the teacher, which needs to be addressed
both by initial and continuing education” (p. 11). It stresses good teacher quality in order to
implement the changes to enhance student learning and the education quality in India.
The NCFTE 2009, formalized in 2010, takes into consideration the changes proposed by
the NCF 2005. In an attempt to get competent teachers, it proposes looking at teacher education
124
curriculum through a holistic lens and recommends a teacher education curriculum that includes
“integration of general education with professional development along with intensive internships
in school” (p. 46).
NPE 2016 focuses on development of education in India, which needs to “evolve with the
changing times and needs” (p. 5). The document proposes improving teacher quality by giving
teachers autonomy and professional independence to make students competent in today’s
transformative society by making teachers accountable for learning outcomes.
The three documents clearly acknowledge that education is an important part of the
society, which is changing or transforming, and to improve quality of education in India,
teachers should be better equipped to handle the changes to improve student learning.
Summary of Quantitative Results
Correlation analysis and multiple regression were conducted on the traditional and non-
traditional teacher quality variables separately. The R2 value of the traditional variables in
predicting the student mathematics performance is 11%, which is a moderate value as compared
to the very low R2 value of 3% revealed from the non-traditional teacher quality variables and
student mathematics performance regression equation. Among the traditional teacher quality
variables, full time, fully qualified teachers were significantly associated to student performance
in mathematics while among the non-traditional teacher quality variables, none of the chosen
teacher variables showed any significant association with student performance in mathematics.
However, in the combined regression analysis, the R2 for the combined multiple regression was
15%. The traditional teacher quality variables of full time, fully qualified teachers and
professional development showed significant relation to student outcomes in mathematics and

125
non-traditional teacher quality variables of poor student teacher relationship and teachers being
too strict with students were significantly related to student outcomes.
126
Chapter Five: Discussion
The previous chapter presented results from both the qualitative and quantitative
methods for traditional and non-traditional teacher quality variables in relationship to student
performance in mathematics. In this chapter, results are discussed, and conclusions, limitations
of the study, and future recommendations or paths for this mixed methods study are presented.
This chapter is divided into four broad sections: 1) a summary, where the results are discussed
in conjunction with the research questions, 2) a conclusion, in which the results are integrated
and connected to the existing literature review and theoretical framework, 3) the limitations of
the study, and 4) recommendations for future research.
Summary
Literature review has shown that teachers play an important role in education quality and
student outcomes (Azam & Kingdon, 2014; Darling-Hammond, 2000; Muralidharan &
Sundararaman, 2011; Singh & Sarkar, 2012). The poor performance of Indian students on PISA
2009 testing has raised serious doubts on the quality of teachers in the country. Looking at a few
chosen teacher quality variables based on literature review, theoretical framework, and available
data from PISA 2009, the study seeks to examine how teacher quality is addressed by NCF 2005,
NCFTE 2009, and NPE 2016 in India and also the influence of the various teacher quality
variables on student performance on the PISA 2009 mathematics assessment.
In this mixed methods study, there are five research questions discussed. The first
research question focuses on the three chosen policy documents from India:
RQ1a: How do Indian national education policy documents frame traditional and non-
traditional teacher quality variables in reference to student achievement gains?

127
The following sections discuss the coding results derived from Chapter Four in respect to both
traditional and non-traditional teacher quality variables to understand how the policy documents
frame the teacher quality variables.
Traditional teacher quality variables. Figure 6 shows that among the chosen traditional
teacher quality variables, overall in each document, teacher qualification is the strongest category
at 40% in NCFTE 2009. In NCF 2005 and NPE 2006, it is addressed at 13% and 3% of coded
sentences, respectively. Overall in each document, the second strongest category is professional
development at 23% in NCFTE 2009, 7% in NCF 2005, and only 1% in NPE 2016. Finally,
teacher certification is the least dominant category in all the documents and mentioned only once
in NCFTE 2009.
Figure 6. Percentage of sentences relating to traditional teacher quality variables in the policy
documents.
The traditional teacher quality variables as coded in the three documents are discussed
individually below.
Teacher qualification. This is the strongest category in all the three documents, at 13%
in NCF 2005, 40% in NCFTE 2009, and 3% in NPE 2016. As shown in the Results chapter, all
13%
40%
3%1%7%
23%
1%0%
10%
20%
30%
40%
50%
NCF 2005 NCFTE2009
NPE 2016
Teacher qualification
Teacher certification
Professionaldevelopment
128
three documents demonstrate evidence of discourse on teacher qualification as an important
variable to improve teacher quality, though the percentage of focus differs.
The coded sentences pertaining to teacher qualification in NCF 2005 explain that the
policymakers acknowledge that the teacher quality in the country is poor and that it also vastly
impacted student performance. Twenty-three percent of the total sentences in NCF 2005 discuss
teacher quality variables that are selected for the study, out of which 13% discuss teacher
preparation pertaining to teacher qualification. NCF 2005 has a vision of how teacher education
programs should be strengthened to improve student education. The major focus in the 2005
policy document is a child-centered approach to education, requiring major changes in the
existing curriculum. To implement the curriculum, the 2005 policy document stresses teacher
education as a key teacher characteristic for good teacher quality. A majority of the coded 13%
of sentences on teacher qualification discuss the importance of the teacher’s role in a student’s
cognition or achievement that can be active only if the teacher is well prepared through teacher
education. The NCF 2005 document states that teacher qualification or a well-prepared teacher is
seen as a key teacher quality variable to focus on to improve student gains.
Teacher qualification is again the most focused on category in NCFTE 2009 at 40%. The
NCFTE 2009 and NCF 2005 documents are connected. NCFTE 2009 takes into account the
changes proposed by NCF 2005 to improve teacher quality through revamping the teacher
education curriculum and program. For the development of the entire teacher, the document
states that teacher education should be “aimed at development of the total teacher knowledge and
understanding, repertoire of skills, positive attitudes, habits, values and capacity to reflect”
(NCFTE, 2009, p. 23).
129
With the increase in school enrollments and school development programs to achieve
Universal Early Education, there has been an increase in the demand for teachers. The number of
teacher education institutions increased, leading to commercialization of teacher education and
low teacher quality. While NCF 2005 has a vision of how teacher education or teacher
qualification in India should be, NCFTE 2009 takes a step forward by framing a comprehensive
teacher education framework. NCFTE 2009 takes teacher quality as a serious national concern
and proposes a framework that will produce qualified and competent teachers to enter the school
workforce.
After NCF 2005 and NCFTE 2009, there was a nearly decade-long gap before
formulation of NPE 2016. NPE 2016 is a comprehensive policy to guide education in the
country. In NPE 2016, 3% of the coded sentences discuss the importance of teacher qualification
in improving teacher quality. NPE 2016 argues that with the constant changes in the world,
which the document terms as “transformative society” (p. 13), every teacher should be educated
in the use of technology to encourage self-learning when required. This will improve the
teacher’s role as a facilitator for students rather than a giver of information. This approach to
strengthen teacher education will improve the teacher quality in the country and keep teachers
abreast with new strategies that teachers use globally.
Professional development. This category is the second strongest traditional category and
the most dominant in NCFTE 2009 at 23% and the least dominant category in NPE 2016 at 1%.
In NCF 2009, it stands at 6%. In NCF 2005, professional development for teachers includes pre-
service teacher education and in-service teacher training, and although the document highlights
the importance of professional development in teacher quality, there is limited discussion on the
activities included in professional development. NCFTE 2009 focuses more on in-service

130
professional development for teachers. The document proposes various activities and teacher
interactions both at local and international levels that are viewed as continuing professional
development to enhance student achievement gains. Both NCF 2005 and NCFTE 2009 propose
that professional development be carried out systematically and monitored by the IASEs and the
DIETs in the country. Although professional development is the least dominant category in NPE
2016, the document notably proposes making in-service professional development compulsory to
all teachers even in government schools once every three years and reaffirms the importance of
professional development recommended by the earlier policies.
Teacher certification. This category was the least dominant of all the traditional
categories, addressed by only 1% of sentences in NCFTE 2009 and NPE 2016. This category is
ignored by NCF 2005. NPE 2016 recommends teacher certification for teachers in government
and private schools be renewed every 10 years. The low percentage of existence of teacher
certification in all the three policy documents shows that teacher certification is not considered a
distinct teacher quality variable in the country.
The next section discusses the coded sentences relating to non-traditional teacher quality
variables in the three policy documents.
Non-traditional teacher quality variables. The graph (see Figure 7) shows that
discussion of all the non-traditional teacher quality categories varies between 0% to 3% in the
documents. Teacher absenteeism and teacher accountability are the strongest categories in NPE
2016 at 3%. The second strongest categories are teacher accountability and teacher salary each at
2% in NCFTE 2009 and teacher attitude at 2% in NCF 2005 and NPE 2016. Overall, teacher
qualified in mathematics is a weak category, which is ignored in NCF 2005 and mentioned in 1%
of relevant sentences in NCFTE 2009 and 1% of relevant sentences in NPE 2016.

131
Figure 7. Percentage of sentences relating to non-traditional teacher quality variables in the
policy documents.
Teacher salary/performance pay. This non-traditional teacher quality variable is not
mentioned in NCF 2005 while it is mentioned at 2% and 1%, respectively, of the total material in
NCFTE 2009 and NPE 2016. NCFTE 2009 briefly mentions this variable when proposing more
incentives to qualified and committed teachers based on their performance. NPE 2016 highlights
that there is no reliable system correlating teacher performance with teacher salary and
“recommends effective monitoring of teacher performance with built-in incentive systems”
(Government of India MHRD 2016a, p. 41). However, there are no further guidelines or
measures presented in the document.
Teacher absenteeism. While NCF 2005 ignores teacher absenteeism, it is addressed at
3% in NPE 2016 and 1% in NCFTE 2009. NPE 2016 discusses it as an essential variable to
improve teacher quality. Interestingly, NPE 2016 highlights the fact that teacher absenteeism
largely is connected to political interference in the country. Due to lack of supervision on teacher
absenteeism and bureaucracy present in the government schools, many teachers remain absent
0%
1%
2%
3%
4%
5%
NCF 2005 NCFTE2009
NEP 2016
Reviewed Policy Documents
Teacher salary
Teacher absenteeism
Teacher qual.in math
Teacher attitude
Teacher accountability
132
from their classrooms to perform external pre- and post-election duties. Therefore, NPE 2016
urges political consensus to curb teacher absenteeism and strict governance by school
management to curb the issue.
Teacher qualified in mathematics. This category is weak, 0% to 1% in all the three
documents. While NCFTE 2009 proposes professional training to increase teachers’ subject-
matter competency in mathematics, NPE 2016 takes a more structured outlook on the variable.
NPE 2016 recommends subject-matter competency as a component of the teacher education
program, which will enable teachers to have the skill and competency to teach subjects like
mathematics and science. The weakness of this category could be due to the fact that the focus is
much more on teacher qualification, and it is assumed and practiced in India that a teacher with a
teacher qualification can teach any subject with subject-matter competency, which is not yet
mandatory in the country.
Teacher attitude. This variable is addressed weakly in all documents as it is at 2% of the
coded sentences in NCF 2005 and 1% each in NCFTE 2009 and NPE 2016. All three documents,
however, do highlight the fact that a positive teacher attitude helps teachers assume the role of
facilitators and mentors rather than being mere disciplinarians, and this improves student
achievement.
Teacher accountability. The coded statements for teacher accountability increases
gradually from NCF 2005 (1%) to NCFTE 2009 (2%) to NPE 2016 (3%). In NCF 2005, it is
recommended that teachers be accountable for children’s diverse needs and overall development.
The focus then is not on academic learning outcomes. In contrast, one can see the change in
NCFTE 2009 and NPE 2016 after the PISA 2009 testing. Then the documents recommend that
teachers be accountable for student achievement or learning outcomes. In NPE 2016, the

133
category is strong as policymakers realize that teacher quality in the country is far from
satisfactory and one way to measure or improve teacher quality is by holding teachers
accountable for failure to achieve students’ learning outcomes. For this to occur, the policy
recommends learning outcomes for students be evaluated regularly through internal and external
assessments (Government of India MHRD, 2016a).
The next research question highlights the shift in focus in respect to teacher quality
variables, both traditional and non-traditional, in the policy documents from 2005 and 2016.
RQ1b: How did Indian national education policy shift from 2005 to 2016 in reference to
traditional and non-traditional teacher quality variables and national competitiveness?
The following sections discuss that while the three documents recognize the importance
of teacher quality in improving the quality of education in India and student achievement gains
in the country, the significance of the individual traditional and non-traditional teacher quality
variables in the documents varies from 2005 to 2016, as shown in Figure 8.
In the timeline, we can see that in NCF 2005, with respect to teacher quality variables,
focus is more on traditional teacher quality variables of teacher qualification and professional
development. It is important to understand that NCF 2005 came into existence in India at the
time when the school education system in the country was controlled by internal high-stakes
examinations that were textbook oriented, and the role of teachers was imparting information
rather than facilitating learning (NCERT, 2005). The aim of the Indian education as quoted in
NCF 2005 is to enhance the child’s overall development and make learning more relevant to the
student. To implement the child-centered curriculum which is the focus in NCF 2005, the
document views teacher qualification as a prime teacher quality variable and professional
development as an essential variable to improve teacher quality. In 2005, non-traditional teacher

134
quality variables were mostly ignored.
Figure 8. Timeline depicting shift in teacher quality variables and national competitiveness from
2005 to 2016.
Note. NC = National competitiveness, TTQV = Traditional teacher quality variables, NTTQV =
Non-traditional teacher quality variables, TQ = Teacher qualification, PD = Professional
development. Blue shapes are about the teacher variables and pink shapes about national
competitiveness.
In respect to national competitiveness, the timeline highlights two important features in
2005. The first one is that the document does not mention the term “national competitiveness.”
Rather than emphasizing national competitiveness, NCF 2005 discusses strengthening the Indian
school systems to make education in different states within the country comparable. The
document envisions future changes in the education system in Indian society due to globalization
and terms it as a “transformative vision of society.” NCF 2005, therefore, justifies its focus on
teacher qualification and continuing education or professional development in teacher education

135
programs that should be prepared for a shift from imparting mere theoretical information to
disseminating practical knowledge.
As shown in the timeline, similarly to NCF 2005, NCFTE 2009 focuses the most on
traditional teacher quality variables of teacher qualification and professional development. To
give a concrete form to NCF 2005’s vision of a teacher education program, NCFTE 2009
addresses teacher quality through a relevant comprehensive teacher curriculum. In respect to
teacher education programs, justifying the need for a well-structured and planned comprehensive
teacher education framework, NCFTE 2009 argues that “teaching is a profession and teacher
education a process of professional preparation of teachers” (p. 15). Therefore, the document
proposes increasing the duration and rigor of the teacher education programs along with practical
experience to give it the status and quality of a “profession” (p. 8).
However, unlike NCF 2005, this document does not ignore the non-traditional teacher
quality variables and briefly discusses the importance of teacher salary, teacher absenteeism,
teacher attitude, and even teacher accountability. Although, the non-traditional teacher quality
variables in the document are scarcely mentioned, the document in 2009 acknowledges the
importance of these variables in improving teacher quality as compared to NCF 2005.
In respect to national competitiveness, NCFTE 2009 acknowledges that changes in
teacher education will take place. It therefore justifies that preparing teachers through the
planned curriculum framework will equip teachers to better prepare students to compete
globally. To this effect NCFTE 2009 states that the teacher education and preparation programs
need to take into account “the broader social, economic, and political changes taking place” (p.
2) in the changing society.
136
Thus, overall, the importance of traditional teacher quality variables in NCF 2005 and
NCFTE 2009 remains most significant. However, in respect to non-traditional teacher quality
variables, one can see a positive shift in the attention they get in NCFTE 2009 as compared to
NCF 2005.
In between NCF 2005 and NCFTE 2009, India participated and fared poorly in the PISA
2009 testing. This created a shock wave in the country. Among other factors, teacher quality was
blamed for the poor performance of Indian students. In NCF 2005, the document acknowledges
low teacher quality, leading NCFTE 2009 to present a comprehensive teacher curriculum
framework to improve teacher quality and, thereby, student performance.
Since PISA testing took place in the same year as NCFTE 2009 publication, it is difficult
to gauge the effect of the implementation of NCFTE 2009 policy. However, the effects of both
the NCF 2005 and NCFTE 2009 policy implications on teacher quality are visible in the NPE
2016.
PISA results of 2009 highlight India’s poor education and teacher quality. Since 2009,
the country has not participated in the subsequent PISA testing in 2012, 2015, and 2018. India is
preparing to participate in the 2021 PISA testing, and, therefore, it is critical to see shifts in
policy implications on chosen teacher quality variables in NPE 2016.
NPE 2016 takes a broader stand than NCF 2005 and NCFTE 2009 in respect to quality of
education in the country. It stresses the need for implementation of the recommendations to
improve teacher quality. The document clearly realizes that what was proposed by the earlier
policies failed to make an impact on the education sector in India. It recognizes that, in spite of
continued efforts by earlier frameworks and policies made for improving teacher quality, India’s
preparation and development of teachers is marked by deficiencies resulting in poor student
137
outcomes (Government of India MHRD, 2016a). It, therefore, proposes a Framework for Action
for implementing and monitoring the initiatives.
With respect to teacher quality variables, one sees a shift in the focus of NPE 2016 from
traditional teacher quality variables to non-traditional teacher quality variables. To a large extent,
there is equal focus on both traditional and non-traditional teacher quality variables, specifically
teacher qualification and teacher accountability. NPE 2016 also acknowledges the importance of
other non-traditional teacher quality variables, including teacher salary, teacher absenteeism,
teacher qualified in mathematics, and teacher attitude.
With respect to national competitiveness, NPE 2016 strongly advocates preparing
teachers to use ICT, a global networking system in classrooms to keep abreast of the latest
developments in education. NPE 2016 says that India is “at the cusp of major transformation” (p.
3), and every school in cities and villages will be well connected within the country and outside
through technology. NPE 2016 argues that use of ICT will make the teacher education programs
in India comparable to the rest of the world as ideas are exchanged globally. Thus, ICT will
impact teacher qualification and continuing education or professional development. In regard to
non-traditional teacher quality variables, ICT can be used to monitor teacher performance and
make teachers accountable to student learning and also enhance teachers’ subject-matter skills,
which is still a neglected variable in NPE 2016. Teacher absenteeism will be monitored strongly
through technology and thus controlled. Thus, NPE 2016 asserts that providing ICT in every
school will transform the Indian education system, making it modern and competitive with the
rest of the world “without compromising on India’s traditions and heritage” (p. 118).
Finally, NPE 2016 continues recognizing teacher attitude as a critical variable in student
achievement gains though it still remains a weak variable in 2016. As in 2005, NPE in 2016
138
recommends teachers to be mentors and refrain from any form of corporal punishment for
students.
The next three questions relate to the quantitative data analyzed from the PISA 2009
database for India to reveal which of the teacher quality variables from the selected ones in the
study are associated with student performance in mathematics.
To analyze significant variables from the traditional teacher quality variables, research
question 2a states:
RQ2a: Which traditional teacher quality variables are significantly related to student
performance in mathematics in India?
Results from multiple regression analysis show that, among the traditional teacher
quality predictors, full time, fully qualified teachers (p = .01) is most strongly related to student
performance in mathematics. Professional development (p = .02) is also significantly related to
student performance in mathematics. In respect to full time, fully qualified teachers, results
imply that teachers who are graduates with a B.Ed. degree and who are on the school payroll
will help improve student achievement gains. This result adds to results from literature review
for India and other countries that teachers who are qualified have the knowledge and expertise
to influence student outcomes (Akiba et al., 2007; Ingersoll, 2007; Kingdon, 2006).
The significant association between professional development and student achievement
gains implies that if professional development activities of teachers are conducted often, per
the goals of the school, student performance in mathematics increases. The result is consistent
with other studies that state the importance of professional development in reforming teacher
quality to affect student performance. Professional development that is ongoing, intense, and
curriculum based has shown to enhance teacher skills and knowledge to improve student
139
performance (Caena, 2011; Garet et al., 2001). However, literature review focuses a lot more
on studies that stress the importance of the duration rather than content of professional
development (Stewart, 2010). Studies on the influence of professional development on student
outcomes are limited in India, and available studies state that there is no relationship between
professional training and student outcomes (Azam & Kingdon, 2014). Therefore, the results of
this study add important content to existing literature by showing how professional
development activities for teachers conducted in tune with school goals will help improve
student outcomes.
To analyze which non-traditional teacher quality variables are good predictors of
student achievement gains, research question 2b states:
RQ2b: Which non-traditional teacher quality variables are significantly related to
student performance in mathematics in India?
In respect to non-traditional teacher quality variables, results from multiple regression
analysis show none of the non-traditional teacher quality variables are significantly related to
student performance in mathematics. However, when a combined regression analysis is
conducted with both traditional and non-traditional teacher quality variables, a significant value
(p = .04) for teacher attitude and specifically for teachers being too strict with students is
revealed. This shows that if the teachers take certain disciplinary measures, student outcomes can
improve. The results are surprising and contradictory to past studies indicating teacher attitude
concerning disciplinary measures shows that students lose interest and motivation to perform
well, resulting in low outcomes, as revealed by a study in Iran (Rahimi & Karkami, 2015). A
significant and negative relation is also revealed between poor student-teacher relationship (p
=.01) and student outcome. This result supports past studies that show positive demeanor and
140
relationship of a teacher with students can reduce mathematics phobia and anxiety, thereby
improving student mathematics scores (Opdenakker & Damme, 2007).
The next research question compares both traditional and non-traditional teacher quality
variables to see which variables influence student performance in mathematics.
RQ2c: How are traditional and non-traditional measures of teacher quality differently
related to student mathematics performance in India?
The combined regression models for both traditional and non-traditional teacher quality
variables highlight the relationship of the individual categories on student performance in
mathematics. The R2 value for the combined regression model is 15%, showing the percentage of
variance in scores as explained by combined traditional and non-traditional teacher quality
variables. While traditional teacher quality variables of full time, fully qualified teachers and
professional development show a significant relationship with student mathematics scores, for
non-traditional teacher quality variables, poor student-teacher relationship and teachers being too
strict with students has a significant relationship with student mathematics scores.
Conclusion
India, a developing economy, participated in PISA 2009 international assessments and
fared miserably. The news created a “shock wave” in the country and teachers were blamed for
the low quality of education and poor student performance in the country. The study, therefore,
analyzed the influence of teacher quality variables on students’ mathematics performance in
PISA 2009. The study’s purpose is to provide information to policymakers in India, which may
assist them in improving teacher quality in the country.
Literature review has termed certain teacher quality variables as “traditional,” which are
teacher qualification, teacher certification, and professional development. The study argues that
141
there is more focus in India on traditional teacher quality variables and other important variables
that are “non-traditional” are ignored. To study the influence of traditional and non-traditional
teacher quality variables on student mathematics performance, the mixed methodology using the
PISA 2009 database is governed by the five research questions that are stated earlier in the
chapter.
RQ1a. Results from the study show that the three policy documents, NCF 2005, NCFTE
2009, and NPE 2016, recognize the role of teacher quality in improving student achievement
gains. However, the way they are framed and the focus on the various teacher quality variables
varies in each document. NCF 2005 advocates the importance of strengthening teacher
preparation programs in the country, and the document considers teacher qualification as a key
teacher quality variable, followed by professional development, to influence student achievement
gains. Most of the non-traditional teacher quality variables are not addressed by NCF 2005,
although the document briefly addresses the importance of positive teacher attitude in
influencing student achievement. NCF 2005 and NCFTE 2009 are connected together, and to
give shape to NCF 2005’s vision of a strong and progressive teacher education program, NCFTE
2009 frames a comprehensive teacher education framework. The document again looks at
traditional teacher quality variables of teacher qualification and professional development as
critical for improving teacher quality and student scores. Teacher certification is not addressed.
Within the non-traditional teacher quality variables, a new category that evolved during
the coding process, teacher accountability, and its importance on student achievement are briefly
highlighted in the document. The latest document included in the study is NPE 2016, where,
although the focus continues to be on the traditional teacher quality variables of teacher
qualification and professional development, the documents highlights the importance of the non-

142
traditional teacher quality variables. NPE 2016 urges the need to reform teacher quality to be on
par with the rest of the world.
RQ1b. From 2005 to 2016, traditional teacher quality variables of teacher qualification
and professional development continued to be the focus, though we can see a gradual shift
towards the non-traditional teacher quality variables in 2016. PISA 2009 is not specifically
mentioned in any of the documents. However, in respect to national competitiveness, in 2005,
focus was on the country’s education system across all states, although globalization and its
accompanying changes were acknowledged. From 2009 to 2016, there was more talk about the
changing economy or the “transformative world,” the Indian education system, and the
importance of teacher quality as well as how teachers and students need to be prepared to be a
part of this ever-changing world.
RQs 2a, 2b, and 2c. Results from the correlation and multiple regression analysis reveal
that combined regression analysis shows better results. Among the traditional teacher quality
variables, full time, fully qualified teachers and professional development show significant
relationship with student performance in mathematics. In respect to non-traditional teacher
quality variables, both the influence of poor student-teacher relationship and teachers being too
strict with students have a significant influence on student performance in mathematics.
Therefore, evidence from the mixed methods study shows that policymakers from 2005
to 2016 in India have focused more on traditional teacher quality variables than on non-
traditional teacher quality variables. Teacher qualification and professional development have
also shown significant influence on students’ mathematics performance as shown in PISA 2009.
In comparison, the non-traditional teacher quality variables are largely ignored in the documents.
From the PISA 2009 data, the variable of teachers being too strict with students and poor
143
student-teacher relationship show significant relationship with student mathematics performance
in the combined regression analysis.
The world culture theory explains the isomorphism between Western countries and a
developing country, like India, in respect to linking teacher quality and student outcomes. As
shown in the Results section of the paper, there is ample evidence in all the chosen documents to
show that India recognizes that teacher quality is important for improving student scores and to
enhance the quality of education in the country. The latest document, NPE 2016, specifically
makes teachers accountable for student outcomes to improve teacher quality.
Furthermore, global discourse on quality teachers as an essential component of quality
education, in which India is a participant, as well as reforms to strengthen teacher education as
seen in the documents chosen for the study, show how India is seeking legitimacy on the world
stage. In alignment with the Western countries, India is including in-service training as a
necessary component of teacher preparation and professional training in specific core subjects
like mathematics and science. Although India has not specifically defined the term teacher
quality like some of the Western countries, evidence of focus on the select few categories of
teacher qualification and professional development shows that the country is defining quality
teachers as those who are professionally qualified and who undergo mandatory in-service
training. This definition is narrow and needs to be extended to include the non-traditional teacher
quality variable of teacher attitude, too.
Since 2016, one can see a gradual shift where policymakers are realizing the importance
of non-traditional teacher quality variables since they are addressing them more than the earlier
documents. The influence of the policy directives will hopefully be visible in future mathematics
144
assessments. Further research using more recent student mathematics scores is recommended to
study the influence of this shift on student achievement gains.
Additionally, human capital theory explains the investment the Indian government is
making in teacher education and training as a means for the country’s growth. High quality
teachers with credentials and training will raise the educational outcomes of students, thus
increasing the country’s human capital. As a country, India recognizes its huge untapped
reservoir of productive and creative human capital. Quality teacher training and education will
bring about huge gains in student learning and generate returns to the country. India is investing
in teacher training institutions like DIETs, Colleges of Teacher Education (CTEs), and teacher
curriculum as shown in NCTE 2009. However, it is important to note that while both the theories
are looking at improving teacher quality, human capital theory looks at capital gain as a form of
return in enhancing teacher quality, while there is no tangible return in world culture theory.
Limitations
The study findings are restricted by its limited scope and the nature of the variables. First,
the teacher quality variables obtained from the PISA 2009 database are perception based as they
are measured based on the views or opinions of the person filling out the survey. The data
collected can be biased and without the support of empirical evidence and may not be a true
representation of other states in India. Thus, the results from PISA 2009 cannot be generalized to
the whole country other than the states of Tamil Nadu and Himachal Pradesh.
Next, the qualitative analysis relies on select variables from the PISA 2009 database.
Although, I chose the dimensions of teacher quality that were suitable to the study and
documents chosen, there are other non-traditional teacher quality variables that need to be
included. In addition, there is a limited selection of documents, though the latest policy, NPE

145
2016, was included. Finally, I have restricted the study to analysis of policy without looking at
the extent of inclusion/implementation of policy directives in the school/education system.
Recommendations
Despite the results of this study, I inherently continue to believe that the non-traditional
teacher quality variables are also important in improving teacher quality and student achievement
gains. Therefore, I have some recommendations to policymakers and researchers.
First, using similar methodology, I recommend future research to include quantifiable,
and not perception based, non-traditional teacher quality variables to study the implications of
teacher quality variables on student mathematics performance. Second, as the model with
combined traditional and non-traditional teacher quality variables showed better results, I believe
it would be advantageous for policymakers to specifically take a closer look at both these
variables through additional evidence-based research rather than focus on just traditional teacher
quality variables. Third, as an extension of this study, along with policy documents, the study
should include and analyze teacher interviews, rather than surveys filled out by school
authorities, to understand how the policies have facilitated improvement in teacher quality.
Fourth, the five research questions of this study may be applied to data from 2018 Indian CBSE
and ICSE results, which have been published recently, to see if these results persist for the new
data set also. This may then lead to some clarity on the reasons for performance on PISA 2009
and provide some cues for teachers, educational administrators, and policymakers for
introducing some changes into the current educational practice for better performance by the
students on PISA 2021 in which India is participating.
146
Concluding Remarks
In spite of its limitations, this research has provided sufficient evidence to conclude that
India recognizes the importance of teacher quality. The latest document, NPE 2016, is a positive
step in improving teacher quality as it includes initiatives like research in teacher education,
focuses on eliminating the loopholes present in the system, and highlights the importance of both
traditional and non-traditional teacher quality variables in improving student outcomes. PISA
2021 will reveal the influence of the directives of NPE 2016 policy initiatives. India is hopeful of
a desired change.
147
References
Abe, T. (2014). The effects of teachers’ qualifications on students’ performance in mathematics.
Sky Journal of Educational Research, 2(1), 10-14. Retrieved from
http://www.skyjournals.org/sjer/abstract/2014/Feb/Abe.htm
Akello, A. J. (2015). Impact of teacher characteristics on student academic achievement in
Kisumu Central sub-county, Kenya. Journal of Educational Policy and Entrepreneurial
Research, 2(8), 47-56. Retrieved from http://jeper.org/index.php/JEPER/article/view/145
Akiba, M., LeTendre, G. K., & Scribner, J. P. (2007). Teacher quality, opportunity gap, and
national achievement in 46 countries. Educational Researcher, 36(7), 369-387. Retrieved
from http://www.jstor.org
Ashcraft, M. H. (2002). Math anxiety: Personal, educational and cognitive consequences.
Current Directions in Psychological Science, 11(5), 181-195. Retrieved from
http://www.jstor.org/stable/20182804
Azam, M., & Kingdon, G. (2014). Assessing teacher quality in India (Working Paper No. 8622).
London, UK: International Growth Center. Retrieved from http://www.theigc.org/wp-
content/uploads/2015/01/Azam-Kingdon-2014-Working-Paper.pdf
Ballou, D., & Podgursky, M. (2000). Reforming teacher preparation and licensing: What is the
evidence? Teachers College Record Volume, 102(1), 28-56. Retrieved from
http://faculty.missouri.edu/~podgurskym/wp-content/uploads/2000/TCRecord1.htm
Bloemraad, I. (2013). The promise and pitfalls of comparative research design in the study of
migration. Migration Studies, 1(1), 27-46. https://doi.org/10.1093/migration/mns035
Bowen, G. A. (2009). Document analysis as a qualitative research method. Qualitative Research
Journal, 9(2), 27-40. https://doi.org/10.3316/QRJ0902027

148
Boyer, C. E. (1994). The relationship between buy-back provision and teacher attendance rates
(Report No. EA 026 862). Retrieved from
https://files.eric.ed.gov/fulltext/ED384972.pdf
Bray, M., & Thomas, R. M. (1995). Levels of comparison in educational studies: Different
insights from different literatures and the value of multilevel analyses. Harvard
Educational Review, 65(3), 472-490. Retrieved from ERIC database. (EJ509517)
Brickman, W. (1966). Prehistory of comparative education to the end of the eighteenth century.
Comparative Education Review, 10(1), 30-47. https://doi.org/10.1086/445188.
The British Council, India. (2014). Indian school education system: An overview. New Delhi,
India: British Council & British High Commission. Retrieved from
https://www.britishcouncil.in/sites/default/files/indian_school_education_system_-
_an_overview_1.pdf
Caena, F. (2011). Literature review: Quality in teachers’ continuing professional development.
Brussels, Belgium: European Commission. Retrieved from
http://ec.europa.eu/dgs/education_culture/repository/education/policy/strategic-
framework/doc/teacher-development_en.pdf
Centra, J. A., & Potter, A. D. (1980). School and teacher effects: An international model.
Review of Educational Research, 50(2), 273-291.
https://doi.org/10.3102/00346543050002273
Centre for Teacher Accreditation. (n.d.). Teacher certification. Retrieved from
https://www.centa.org/
Chen, P. Y., & Popovich, P. M. (2002). Correlation: Parametric and non-parametric measures.
Thousand Oaks, CA: Sage.
149
Chhapia, H. (2013, June 1). India chickens out of international students assessment programme
again. The Times of India. Retrieved from
http://timesofindia.indiatimes.com/home/education/news/India-chickens-out-of-
international-students-assessment-programme-again/articleshow/20375670.cms
Cook, B. J., Hite, J. S., & Epstein, H. E. (2004). Discerning trends, contours, and boundaries in
comparative education: A survey of comparativists and their literature. Comparative
Education Review, 48(2), 123-149. Retrieved from http://www.jstor.org
Core B Consortium. (2008). School questionnaire for PISA 2009. Paris, France: OECD.
Retrieved from
http://www.oecd.org/pisa/pisaproducts/PISA09_School_questionnaire.pdf
Creswell, J. W. (2012). Educational research: Planning, conducting, and evaluating quantitative
and qualitative research. Upper Saddle River, NJ: Pearson.
Darling-Hammond, L. (2000). Teacher quality and student achievement: A review of state policy
evidence. Educational Policy Analysis Archives, 8(1), 1-44. Retrieved from
http://www.jstor.org
Desimone, M. I., Smith, T., Baker, D. P., & Uneo, K. (2005). Assessing barriers to the reform of
U.S. mathematics instruction from an international perspective. American Educational
Research Journal, 42(3), 501-535. Retrieved from
http://www.jstor.org/stable/10.7249/mg480nsf.15
Dewan, H., Batra, N., & Chabra, I. (2012). Mathematics up to the secondary level in India. In R.
Ramanujam & K. Subramaniam (Eds.), Mathematics education in India: Status and
outlook (pp. 89-107). Mumbai, India: Homi Bhabha Centre for Science Education, Tata
Institute of Fundamental Research.

150
Dhawan, A. (2014, December 1). Building the nation’s human capital. Livemint. Retrieved from
http://www.livemint.com/Opinion/rq1ptTptmGdcUkZ0XimGIK/Building-the-nations-
human-capital.html
Douglas, O., Burton, K. S., & Durham, N. R. (2009). The effects of multiple intelligence
teaching strategy on the academic achievement of eighth grade math students. Journal of
Instructional Psychology, 35(2), 182-187. Retrieved from
https://eric.ed.gov/?id=EJ813322
Downey, J. A. (2008). Recommendations for fostering educational resilience in the classroom.
Prevent School Failure, 53(1), 56-64. Retrieved from https://eric.ed.gov/?id=EJ814415
Duraisamya, P., Jamesb, E., Lanec. J., & Tanb, J-P. (1998). Is there quantity-quality trade-off as
pupil-teacher ratios increase? Evidence from Tamil Nadu, India. International Journal of
Educational Development, 18(5), 367-383. https://doi.org/10.1016/S0738-
0593(98)00022-4
Epstein. E. H. (1992). Editorial. Comparative Education Review, 36(4), 409-416.
https://doi.org/10.1086/447143
Field, A. (2014). Discovering statistics using IBM SPSS statistics. Washington, DC: Sage
Publications.
Figlio, D. N., & Kenny, L. W. (2007). Individual teacher incentives and student performance.
Journal of Public Economics, 91(5-6), 901-914.
https://doi.org/10.1016/j.jpubeco.2006.10.001
Finlayson, M. (2009). The impact of teacher absenteeism on student performance: The case of
Cobb County School District. Kennesaw State University Dissertations, Theses and
Capstone Projects. Paper 4. Retrieved from https://digitalcommons.kennesaw.edu/etd/4

151
Fong-Yee, D., & Normore, A. H. (2006). The impact of quality teachers on student achievement.
Retrieved from
http://digitalcommons.fiu.edu/cgi/viewcontent.cgi?article=1054&context=sferc
Fryer, R. G. (2008). Teacher incentives and student achievement: Evidence from New York City
Public Schools. Cambridge, MA: Harvard University and the National Bureau of
Economic Research. Retrieved from
https://scholar.harvard.edu/files/fryer/files/teacher_incentives_and_student_achievement_
evidence_from_new_york_city_public_schools.pdf
Gallaghar, K. C., Kainz, K., Feagans, L. V., & White, K. M. (2013). Development of
student-teacher relationships in rural early elementary schools. Early Childhood
Research Quarterly, 28(3), 520-528. https://doi.org/10.1016/j.ecresq.2013.03.00
Garet, M. S., Porter, A. C., Desimone, L. Birman, F. B., & Yoon, K. S. (2001). What makes
professional development effective? Results from a national sample of teachers.
American Educational Research Journal, 38(4), 915-945. https://
doi.org/10.3102/00028312038004915
Gelda, A., Narayan, V., Mudiyam, M., Raturi, K., & Seshan, N. (2013). ‘Needs improvement’:
Despite progress, India’s primary education system has a ways to go.
Knowledge@Wharton. Retrieved from
http://knowledge.wharton.upenn.edu/article/needs-improvement-despite-progress-indias-
primary-education-system-has-a-ways-to-go/
Goe, L., & Stickler, L. M. (2008). Teacher quality and student achievement: Making the most of
recent research. Washington, DC: National Comprehensive Center for Teacher Quality.
Retrieved from ERIC database. (ED 520769)
152
Goldhaber, D. (2016). In schools, teacher quality matters most. Education Next, 16(2), 56-62.
Retrieved from http://educationnext.org/files/ednext_XVI_2_goldhaber.pdf
Goldhaber, D., & Anthony, E. (2003). Teacher quality and diversity series: Urban Diversity
Series. New York, NY: ERIC Clearinghouse on Urban Education. Retrieved from ERIC
database. (ED 477271)
Goldhaber, D. D., & Brewer, D. J. (1997). Why don’t schools and teachers seem to matter?
Assessing the impact of unobservables on educational productivity. Journal of Human
Resources, 32(3), 505-523. Retrieved from ERIC database. (ED400237)
Goldhaber, D. D., & Brewer, D. J. (2000). Does teacher certification matter? High school teacher
certification status and student achievement. Educational Evaluation and Policy Analysis,
22(2), 129-145. https://doi.org/10.3102/01623737022002129
Government of India Ministry of Human Resource Development. (2016a). National Policy on
Education 2016. New Delhi, India: Author. Retrieved from
http://www.nuepa.org/New/download/NEP2016/ReportNEP.pdf
Government of India Ministry of Human Resource Development. (2016b). Right to Education
Act. Retrieved from http://mhrd.gov.in/rte
Government of India Ministry of Human Resource Development. (2017). Quality. Retrieved
from http://mhrd.gov.in/quality
Gupta, A. (2012). Education status report-Tamil Nadu elementary education. Washington, DC:
Center for Education Innovations. Retrieved from
http://www.educationinnovations.org/sites/default/files/India%20-
%20State%20Education%20Report%20-%20Tamilnadu.pdf
153
Hanushek, E. A. (2007). Education production functions. In S. N. Durlauf & L. E. Blume (Eds.),
The new Palgrave dictionary of economics (Vol. 2) (pp. 749–752). Basingstoke, UK:
Palgrave Macmillan. Retrieved from
http://hanushek.stanford.edu/sites/default/files/publications/Hanushek%202008%20Palgr
aveDict_0.pdf
Hanushek, E. A., & Luque, J. A. (2003). Efficiency and equity among schools around the world.
Economics of Education Review, 22(5), 481-502. https:// https://doi.org/10.1016/S0272-
7757(03)00038-4
Hanushek, E. A., & Rivkin, S. G. (2003). How to improve the supply of high quality teachers.
Brookings Paper on Education Quality, 7-25. https://doi.org/10.1353/pep.2004.0001
Hanushek, E. A., & Rivkin, S. G. (2006). Teacher quality. In E. Hanushek & F. Welch (Eds.),
Handbook of the economics of education (Vol. 2) (pp. 1062-1075). Amsterdam, The
Netherlands: Elsevier. https://doi.org/10.1016/S1574-0692(06)02018-6
Hill, H. C., Rowan, B., & Ball, D. L. (2005). Effects of teachers’ mathematical knowledge for
teaching on student achievement. American Educational Research Journal, 42(2), 371-
406. Retrieved from http://www.jstor.org
Hsieh, H. F., & Shannon, S. E. (2005). Three approaches to qualitative content analysis.
Qualitative Health Research, 15(9), 1277-1288.
https://doi.org/10.1177/1049732305276687
Huisman, J., Rani, U., & Smits, J. (2010). School characteristics, socio-economic status and
culture as determinants of primary school enrolment in India (Working paper No. 10-
109). Nijmegen, The Netherlands: Nijmegen Center for Economics (NiCE). Retrieved
from http://www.ru.nl/nice/workingpapers
154
Ingersoll, R. M. (2007). A comparative study on teacher preparation in six nations. Philadelphia,
PA: Consortium for Policy Research in Education. Retrieved from
http://repository.upenn.edu/gse_pubs/145/
International Association for the Evaluation of Educational Achievement. (2013). IDB Analyzer
(Computer software and manual). Hamburg, Germany: Author.
Jain, R., & Kabra, M. (2015). Teacher incentives: Evidence from schools in Delhi. New Delhi,
India: Center for Civil Society. Retrieved from
http://ccs.in/sites/default/files/research/research-teacher-
incentives.pdfhttp://ccs.in/sites/default/files/research/research-teacher-incentives.pdf
Kennedy, M. (1997). Defining an ideal teacher education program. Retrieved from
http://citeseerx.ist.psu.edu/viewdoc/download?doi=10.1.1.483.8401&rep=rep1&type=pdf
Kidwai, H., Burnette, D., Rao, S., Nath, S., Bajaj, M., & Bajpai, N. (2013). In-service teacher
training for public primary schools in rural India: Findings from district Morigaon
(Assam) and district Medak (Andhra Pradesh). Mumbai, India: Columbia Global
Centers. https://doi.org/10.7916/D8HT2PRV
Kingdon, G. (2006). Teacher characteristics and student performance in India (Working Paper
No. GPRG-WPS-059). Oxford, UK: ESRC Global Poverty Research Group. Retrieved
from http://www.gprg.org/pubs/workingpapers/pdfs/gprg-wps-059.pdf
Kingdon, G. (2007). The progress of school education in India (Working Paper No. GPRG-
WPS-071). Oxford, UK: ESRC Global Poverty Research Group. Retrieved from
http://www.gprg.org/pubs/workingpapers/pdfs/gprg-wps-071.pdf
155
Kingdon, G. G., & Teal, F. (2007). Does performance related pay for teachers improve student
performance? Some evidence from India. Economics of Education Review, 26(4), 473-
486. https://doi.org/10.1016/j.econedurev.2006.02.007
Kohli, N. (2015, April 6). Not in the class. A story of India’s missing teachers. Hindustan Times.
Retrieved from https://www.hindustantimes.com/india/not-in-the-class-a-story-of-india-s-
missing-teachers/story-8HITtop9bbJbL18cGC5U7H.html
Kremer, M., Chaudhry, N., Rogers, F., Muralidhran, K., & Hammer, J. (2005). Teacher absence
in India: A snapshot. Journal of the European Economic Association, 3(2), 658-667.
Retrieved from http://onlinelibrary.wiley.com/journal/10.1111/(ISSN)1542-4774/
Kuckartz, U. (2014). Qualitative text analysis. London, UK: Sage Publishing.
Kumar, S. R., Dewan, H., & Subramaniam, K. (2008). The preparation and professional
development of mathematical teachers. In R. Ramanujam & K. Subramaniam (Eds.),
Mathematics education in India: Status and outlook (pp. 5-105). Mumbai, India: Homi
Bhabha Center for Science Education
Lamb, S., & Fullarton, S. (2001). Classroom and school factors affecting mathematics
achievement: A comparative study of the US and Australia using TIMSS. Paper presented
at the Annual Conference of the American Educational Research Association, Seattle,
Washington. Retrieved from
http://research.acer.edu.au/cgi/viewcontent.cgi?article=1009&context=timss_monograph
Lattimore, R. (2005). African American students’ perceptions of their preparation for a high-
stakes mathematics test. Negro Educational Review, 56(2), 135-146. Retrieved from
ERIC database. (EJ768460)
156
Lavy, V. (2002). Evaluating the effect of teachers’ performance incentives on pupil achievement
(Working Paper No. 01-5). Jerusalem, Israel: Hebrew University of Jerusalem. Retrieved
from https://papers.ssrn.com/sol3/papers.cfm?abstract_id=288814
Lechner, F. J., & Boli, J. (2005). World culture: Origins and consequences. Hong Kong:
Blackwell Publishing.
Lee, V. E., & Loeb, S. (2000). School size in Chicago elementary schools: Effects on teachers’
attitudes and student achievement. American Educational Research Journal, 37(1), 3-31.
Retrieved from http://www.jstor.org
Lee, V. E., & Zuze, T. L. (2011). School resources and academic performance in sub-Saharan
Africa. Comparative Education Review, 55(3), 369-397. Retrieved from
http://www.jstor.org
Lockheed, M. E., & Longford, N. T. (1989). A multi-level model of school effectiveness in a
developing country (Working Paper No. 242). Washington, DC: Population and Human
Resource Department, The World Bank. Retrieved from
https://econpapers.repec.org/paper/wbkwbrwps/242.htm
Lohumi, B. P. (2015, June 28). Low on quality, govt schools lose out to private ones. Tribune
News Services. Retrieved from http://www.tribuneindia.com/news/himachal/
education/low-on-quality-govt-schools-lose-out-to-private-ones/99880.html
Manswell Butty, J. (2001). Teacher instruction, student attitudes, and mathematics
performance among 10th and 12th grade Black and Hispanic students. The Journal of
Negro Education, 70(1/2), 19-37. Retrieved from http://www.jstor.org/stable/2696281
Meyer, J. W. (1977). The effects of education as an institution. American Journal of Psychology,
83(1), 55-77. Retrieved from http://www.jstor.org
157
Meyer, J. W., Boli, J., Thomas, G. M., & Ramirez, F. O. (1997). World society and the nation
state. American Journal of Sociology, 103(1), 144-181. Retrieved from
http://www.jstor.org
Miller, R. (2012). Teacher absence as a leading indicator of student achievement: New national
data offer opportunity to examine cost of teacher absence relative to learning loss.
Washington, DC: Center for American Progress. Retrieved from
https://files.eric.ed.gov/fulltext/ED536902.pdf
Miller, R., Murmane, R. J., & Willett, J. B. (2008). Do teacher absences impact student
achievement? Longitudinal evidence from one urban school district. Educational
Evaluation and Policy Analysis, 30(2), 181-200. Retrieved from
http://www.jstor.org/stable/30128059
Mincer, J. (1981). Human capital and economic growth (Working Paper No. 803). Cambridge,
MA: National Bureau of Economic Research. Retrieved from
http://www4.fe.uc.pt/mapsd/mincer_w0803.pdf
Mitra, S. (2015, February 2). India’s PISA Moment: Are we turning into a nation of nitwits? The
Quint. Retrieved from https://www.thequint.com/news/india/indias-pisa-moment-are-we-
turning-into-a-nation-of-nitwits
Mondal, A., Saha, A., & Baidya, M. N. (2015). National curriculum framework for teacher
education, 2009: A review of its perspectives and relevances. International Journal of
Applied Research, 11(9), 776-778. Retrieved from
http://www.allresearchjournal.com/archives/2015/vol1issue9/PartL/1-9-164.pdf

158
Monk, D. H. (1994). Subject area preparation of mathematics and science teachers and student
achievement. Economics of Education Review, 13(2), 124-145.
https://doi.org/10.1016/0272-7757(94)90003-5
Morey, A. I., Bezuk, N., & Chiero, R. (1997). Preservice teacher preparation in the United
States. Peabody Journal of Education, 72(1), 4-24. Retrieved from http://www.jstor.org
Muralidharan, K., Das, J., Holla, A., & Mohpal, A. (2013). The fiscal cost of weak governance:
Evidence from teacher absence in India (Working Paper No. 20299). Cambridge, MA:
National Bureau of Economic Research. Retrieved from
http://econweb.ucsd.edu/~kamurali/papers/Working%20Papers/Fiscal%20Cost%20of%2
0Weak%20Governance%20(NBER%20WP%2020299) pdf
Muralidharan, K., & Sundararaman, V. (2011). Teacher performance pay: Experimental
evidence from India. Journal of Political Economy, 119(1), 39-77. Retrieved from
http://www.jstor.org
Naik, S. (2008). Mathematics teacher education in India-demanding change and reform in
teachers’ professional development (WG2). Mumbai, India: Homi Bhabha Center for
Science Education. Retrieved from http://www.hbcse.tifr.res.in/data/subra-data/2008-
naik-subramaniam.pdf/view?searchterm=naik%202008
Nanda, P. K. (2017, April 29). Government restructures teacher training system in bid to
improve teacher quality. Live Mint. Retrieved from
http://www.livemint.com/Politics/3cT5xQiUVqokfcBBDQfl1I/Govt-restructures-teacher-
training-system-in-bid-to-improve.html
National Council of Educational Research and Training. (2005).
National curriculum framework 2005. New Delhi, India: Author. Retrieved
159
from http://www.ncert.nic.in/rightside/links/pdf/framework/english/nf2005.pdf
National Council of Educational Research and Training. (2006). Position paper on teacher
education for curriculum renewal. New Delhi, India: Author. Retrieved from
http://www.ncert.nic.in/new_ncert/ncert/rightside/links/pdf/focus_group/math.pdf
National Council for Teacher Education. (2009). National education framework for teacher
education. New Delhi, India: Author. Retrieved from http://www.ncte-
india.org/ncte_new/pdf/NCFTE_2010.pdf
Nedungadi, P., Mulki, K., & Raman, R. (2018). Improving educational outcomes and
reducing absenteeism at remote villages with mobile technology and WhatsAPP:
Findings from rural India. Education and Information Technologies, 23(1), 113-127.
https://doi.org/10.1007/s10639-017-9588-z
Neuman, W. L. (2014). Social research methods: Qualitative and quantitative approach.
Edinburgh, Scotland: Pearson.
Neuschmidt, O. (2017). International data base (IDB) analyzer demonstration. Presentation in
Baku, Azerbaijan. Retrieved from http://www.iaea.info/documents/paper_1162d3277.pdf
Newstead, K. (1998). Aspects of children’s mathematical anxiety. Educational Studies in
Mathematics, 36(1), 53-71. Retrieved from
https://link.springer.com/article/10.1023/A:1003177809664
Nirav, S. (2012). Comprehensive essay on the structure of the Indian education system. New
Delhi, India: National University of Educational Planning and Administration. Retrieved
from http:// www.nuepa.org/
Nkhoma, P. (2002). What successful black African students consider as factors of their success.
Educational Studies in Mathematics, 50(1), 103-113. Retrieved from http://www.jstor.org

160
Noah, H. J. (1984). The use and abuse of comparative education. Comparative Education
Review, 28(4), 550-562. https://doi.org/10.1086/446467
O’Brien, D., & Scott, P.S. (2012). Correlation and regression. In H. Chen (Ed.), Approaches to
quantitative research—A guide for dissertation students (pp. 1-14). Cork, Ireland: Oak
Tress Press. Retrieved from
http://arrow.dit.ie/cgi/viewcontent.cgi?article=1006&context=buschmanbk
Ojha, V. P., & Pradhan, B. K. (2002). Human capital formation and economic growth in India: A
CGE analysis (JEL Classification: D58, H5, I2). New Delhi, India: South Asia Network
of Economic Research Institutes. Retrieved from
http://www.isid.ac.in/~planning/O%20and%20P.pdf
Opdenakker, M. C., & Damme, J. (2007). Do school context, student composition and school
leadership affect school practice and outcomes in secondary education? British
Educational Research Journal, 33(2), 179-206.
https://doi.org/10.1080/01411920701208233
Organisation for Economic Co-operation and Development. (2005). Teachers matter: Attracting,
developing and retaining teachers. Paris, France: OECD Publishing. Retrieved from
http:// www.oecd.org/education/school/34990905.pdf
Organisation for Economic Co-operation and Development. (2009). Education at a glance. Paris,
France: OECD Publishing. Retrieved from http://www.oecd.org/education/skills-beyond-
school/43636332.pdf
Organisation for Economic Co-operation and Development. (2010). PISA 2009 at a glance.
Paris, France: OECD Publishing. https://doi.org/10.1787/9789264095298-en
Organisation for Economic Co-operation and Development. (2012). PISA 2009 technical report.

161
Paris, France: OECD Publishing. https://doi.org/10.1787/9789264167872-en
Organisation for Economic Co-operation and Development. (2015). OECD economic surveys
Brazil. Paris, France: OECD. Retrieved from https://www.oecd.org/eco/surveys/Brazil-
2015-overview.pdf
Pal, Y. (1993). Learning without burden. New Delhi, India: Government of India Ministry of
Human Resource Development Department of Education. Retrieved from
http://www.teindia.nic.in/Files/Reports/CCR/Yash%20Pal_committe_report_lwb.pdf
Pallant, J. (2010). SPSS survival manual. Berkshire, England: Open Universities Press.
Pandey, S. (2011). Professionalization of teacher education in India: A critique of teacher
education curriculum reforms and its effectiveness (ICSEI 007). New Delhi, India:
NCERT. Retrieved from http://www.icsei.net/icsei2011/Full%20Papers/0007.pdf
Patrinos, H. A. (2013, January 10). The hidden costs of corruption: Teacher absenteeism and loss
in schools [Education for Global Development Blog Post]. Retrieved from
http://blogs.worldbank.org/education/hidden-cost-corruption-teacher-absenteeism
Pigot, T. D. (2001). A review of methods for missing data. Educational Research and
Evaluation, 7(4), 353-383. https://doi.org/10.1076/edre.7.4.353.8937
Polly, D., McGee, J., Wang, C., Martin, C., Lambert, R., & Pugalee, D. (2015). Linking
professional development, teacher outcomes, and student achievement: The case of a
learner-centered mathematics program for elementary school teachers. International
Journal of Educational Research, 72, 26-37. https://doi.org/10.1016/j.ijer.2015.04.002
Porres, A. (2016). The impact of teacher absenteeism on student achievement: A study on U.S.
public schools using results of the 2011-2012 Civil Rights Data Collection. (Unpublished
doctoral thesis). Georgetown University, Washington, DC. Retrieved from
162
https://repository.library.georgetown.edu/bitstream/handle/10822/1040835/Porres_george
town_0076M_13267.pdf?sequence=1
Pugath, T. (2017). Is teacher certification an effective tool for developing countries?. IZA World
of Labor, 349, 1-10. https://doi.org/10.15185/izawol.349
Quiggin, J. (1999). Human capital theory and education policy in Australia. Australian Economic
Review, 32(2), 130-44. Retrieved from http://www.jstor.org
Raghavan, P. (2013, January 25). Why does the quality of education suffer [Blog post]. The
Times of India. Retrieved from
https://blogs.timesofindia.indiatimes.com/minorityview/why-does-the-quality-of-
education-suffer/
Rahimi, M., & Karkami, F. H. (2005). The role of teachers’ classroom discipline in their
teaching effectiveness and students’ language learning motivation and achievement: A
path method. Iranian Journal of Language Teaching Research, 3(1), 57-82. Retrieved
from ERIC database. (EJ1127336)
Ramachandran, V., Bhattacharjea, S., & Sheshagir, K. M. (2008). Primary school teachers. The
twists and turns of everyday practice. New Delhi, India: Educational Resource Unit.
Retrieved from
http://www.eruindia.org/files/Teacher%20booklet%20edited%20final%2028%20Oct%20
08.pdf
Rani, G. (2010). Changing landscape of higher education in India: The case of engineering
education in Tamil Nadu (Working Paper No. 36). New Delhi, India: National University
of Educational Planning and Administration.
163
Rao, A. (2013, July 11). Many private school teachers lack proper qualification. The Times of
India. Retrieved from http://timesofindia.indiatimes.com/city/hyderabad/Many-private-
school-teachers-lack-proper-qualifications/articleshow/21009574.cms
Robinson, B. (2008). Using distance education and ICT to improve access, equity and the quality
in rural teachers’ professional development in western China. International Review of
Research in Open and Distance Learning, 9(1), 1-17. Retrieved from ERIC database.
(ED 801079)
Rowan, B., Chiang, F., & Miller, R. J. (1997). Using research on employees’ performance to
study the effects of teachers on students’ achievement. Sociology of Education, 70(4),
256-284. Retrieved from http://www.jstor.org/stable/2673267
Sarkar, A., Rao, N., & Naik, P. (2008). Harnessing India’s human capital through educational
opportunities. MIT International Review, 1-13. Retrieved from
http://web.mit.edu/mitir/2008/spring/harnessing.pdf
Saxena, C. (2007). A historical overview of teacher education in India from Rig Vedic Age till
1947. Retrieved from
https://www.academia.edu/940530/A_Historical_Overview_of_Teacher_Education_in_I
ndia_from_Rig_Vedic_Age_till_1947
Schreier, M. (2012). Qualitative content analysis in practice. Thousand Oaks, CA: Sage
Publications.
Singh, R., & Sarkar, S. (2012). Teaching quality counts: How student outcomes relate to quality
in teaching in private and public schools in India (Working Paper no. 91). Oxford, UK:
Young Lives.
164
Spreen, C. A., & Fancsali, C. (2005). What can we learn about improving teaching and learning
from comparing policies across countries? A study of student achievement and teacher
quality in Southern Africa. Paper presented at the International Invitational Educational
Policy Research Conference, Paris, France. Retrieved from
http://www.sacmeq.org/research.htm
Stewart, V. (2010). Raising teacher quality around the world. The Effective Educator, 68(4), 16-
20. Retrieved from http://www.ascd.org/publications/educational-
leadership/dec10/vol68/num04/abstract.aspx
The PROBE Team. (1999). Public report on basic education in India. New Delhi, India: Center
for Development Economics. Retrieved from
http://www.in.undp.org/content/india/en/home/library/hdr/thematic-reading-
resources/education-/public-report-on-basic-education-in-india.html
Tiwari, S. (2016). Continuous professional development of school teachers in India: Learning
from international success. International Education and Research Journal, 2(12), 1-5.
Retrieved from http://ierj.in/journal/index.php/ierj/article/view/590/560
Uehara, D. L. (1999). Where are the teachers? A policy report on teacher attendance in the
pacific region. Honolulu, HI: Pacific Resources for Education and Learning. Retrieved
from ERIC database. (ED440925)
UNESCO. (2006). Teachers and educational quality: Monitoring global needs for 2015.
Montreal, Québec: UNESCO Institute of Statistics. Retrieved from
uis.unesco.org/sites/default/files/documents/teachers-and-educational-quality-monitoring-
global-needs-for-2015-en_0.pdf
165
Van der Berg, S., & Louw, M. (2007). Lessons learnt from SACMEQ II: South African student
performance in regional context (Working Paper No. wp-16-2007). Stellenbosch, South
Africa: Department of Economics and the Bureau for Economic Research, The
University of Stellenbosch.
Varmal, S. (2014, September 5). Teachers’ day: Most teachers get a pittance for pay. The Times
of India. Retrieved from
https://timesofindia.indiatimes.com/home/education/news/Teachers-Day-Most-teachers-
get-a-pittance-for-pay/articleshow/41738154.cms
Vaughan, W. (2002). Effects of cooperative learning on achievement and attitude among
children of color. The Journal of Educational Research, 95(6), 359-364.
https://doi.org/10.1080/00220670209596610
Velez, E., Schiefelbein, E., & Valenzuela, J. (1993). Factors affecting achievement in primary
education. Human Resource Development and Operations Policy (Working Paper No.
12186). Washington, DC: The World Bank. Retrieved from
http://documents.worldbank.org/curated/en/748151468739513783/pdf/multi-page.pdf
Venkatachalam, K. S. (2017, January 25). Why does India refuse to participate in global
education rankings? The Pulse. Retrieved from https://thediplomat.com/2017/01/why-
does-india-refuse-to-participate-in-global-education-rankings/
Wad, S. (2017). School consolidation in Himachal Pradesh: Achieving quality and inclusion.
Ideas for India. Retrieved from http://www.ideasforindia.in/article.aspx?article_id=1753
Walker, M. (2011). PISA 2009 plus results: Performance of 15-year-olds in reading,
mathematics, and science for 10 additional participants. Melbourne, Australia:
Australian Council for Educational Research (ACER) Press.

166
Wenglinsky, H. (2002). How schools matter: The link between teacher classroom practices and
student academic performance. Education Policy Analysis Archives, 10(12), 1-30.
Retrieved from https://epaa.asu.edu/ojs/article/viewFile/291/417
Wiseman, A. W., & Al-bakr, F. (2013). The elusiveness of teacher quality: A comparative
analysis of teacher certification and student achievement in Gulf Cooperation Council
(GCC) countries. Prospects: Quarterly Review of Comparative Education, 43(3), 289-
309.
Wiseman, A. W., Astiz, M. F., & Baker, D. P. (2014). Comparative education research framed
by neo-institutional theory: A review of diverse approaches and conflicting
assumptions. Compare: A Journal of Comparative and International Education, 44(5),
688-709.
Wu, K. B., Goldschmidt, P., Boscardin, C. K., & Sanker. D. (2009). Secondary education in
India: Universalizing opportunity. Washington, DC: The World Bank. Retrieved from
https://slidelegend.com/queue/secondary-education-in-india-world-bank-
documents_59c41bc01723dd1242168189.html
Yadav, S. K. (2013). National study on ten year school curriculum. New Delhi, India:
Department of Teacher Education National Council of Educational Research and
Training. Retrieved from http://ncert.nic.in/rightside/links/10yrsncert.pdf
Zakharov, A., Carnoy, M., & Loyalka, P. (2015). Which teaching practices improve student
performance on high-stakes exams? Evidence from Russia. International Journal of
Educational Development, 43, 1-11. https://doi.org/10.1016/j.ijedudev.2015.04.007
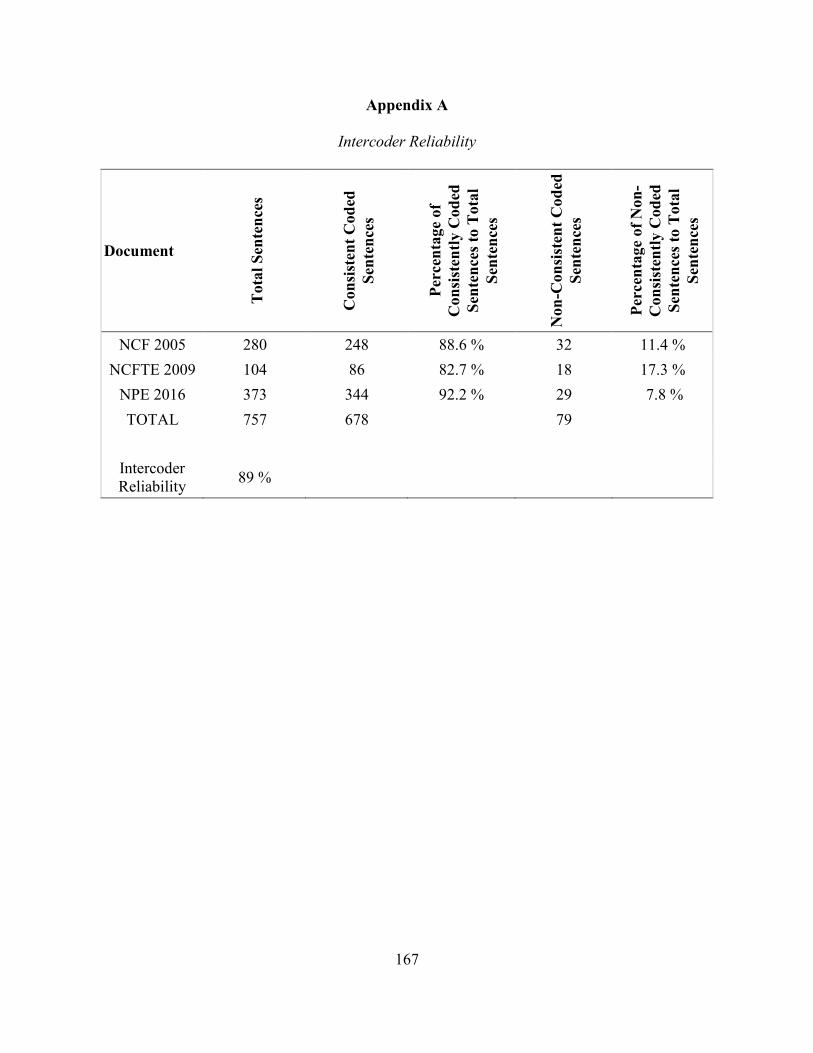
167
Appendix A
Intercoder Reliability
Document T
ota
l S
ente
nce
s
Co
nsi
sten
t C
od
ed
Sen
ten
ces
Per
cen
tag
e o
f
Co
nsi
sten
tly
Co
ded
Sen
ten
ces
to T
ota
l
Sen
ten
ces
No
n-C
on
sist
ent
Co
ded
Sen
ten
ces
Per
cen
tag
e o
f N
on
-
Co
nsi
sten
tly
Co
ded
Sen
ten
ces
to T
ota
l
Sen
ten
ces
NCF 2005 280 248 88.6 % 32 11.4 %
NCFTE 2009 104 86 82.7 % 18 17.3 %
NPE 2016 373 344 92.2 % 29 7.8 %
TOTAL 757 678 79
Intercoder Reliability
89 %

168
Appendix B
Table B1
Piloted Coding Scheme for Traditional Teacher Quality Variables
Category Description Coding Guidelines Subcategory/Keywords
Transformative society is a common keyword to all the categories.
Teacher
Qualification
Teaching degree and diploma from recognized institutions
• Includes pre-service teacher education (e.g., degree or diploma courses) from private and public institutions recognized in India. Diploma or degree should be given to recipient.
• Cannot include workshops or short-term courses conducted in schools.
• Can include any changes in teacher education as a result of globalization.
Degree: Master of Education (M.Ed.), Bachelor of Education (B.Ed.), teacher qualification, teacher education, professional preparation Diploma: entry qualification, qualification, teacher preparation, student teacher
Teacher
Certification
Teaching certification from authorized entities
• Can include teaching certificate or short-term certificate courses from authorized and recognized institutions.
• Cannot include workshops or certificates from schools or online institutions not recognized by Central or State
teacher certification, short-term certificate courses, authorized institutions, acquired skills
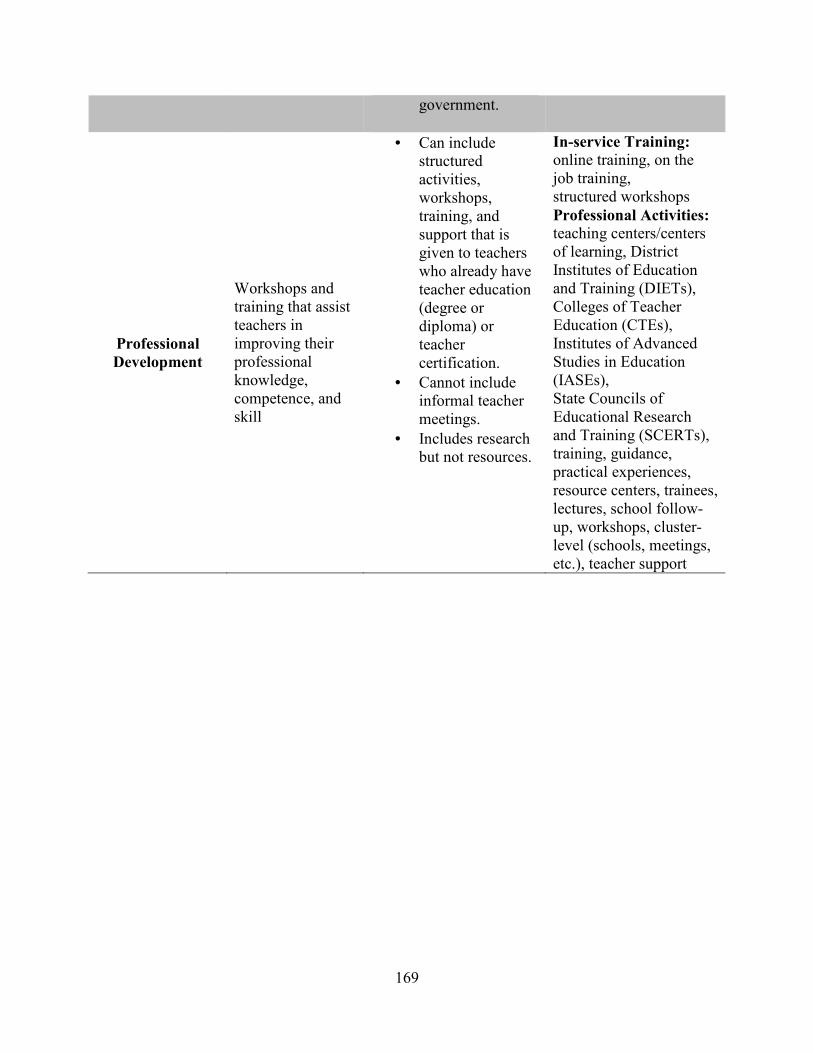
169
government.
Professional
Development
Workshops and training that assist teachers in improving their professional knowledge, competence, and skill
• Can include structured activities, workshops, training, and support that is given to teachers who already have teacher education (degree or diploma) or teacher certification.
• Cannot include informal teacher meetings.
• Includes research but not resources.
In-service Training: online training, on the job training, structured workshops
Professional Activities: teaching centers/centers of learning, District Institutes of Education and Training (DIETs), Colleges of Teacher Education (CTEs), Institutes of Advanced Studies in Education (IASEs), State Councils of Educational Research and Training (SCERTs), training, guidance, practical experiences, resource centers, trainees, lectures, school follow-up, workshops, cluster-level (schools, meetings, etc.), teacher support
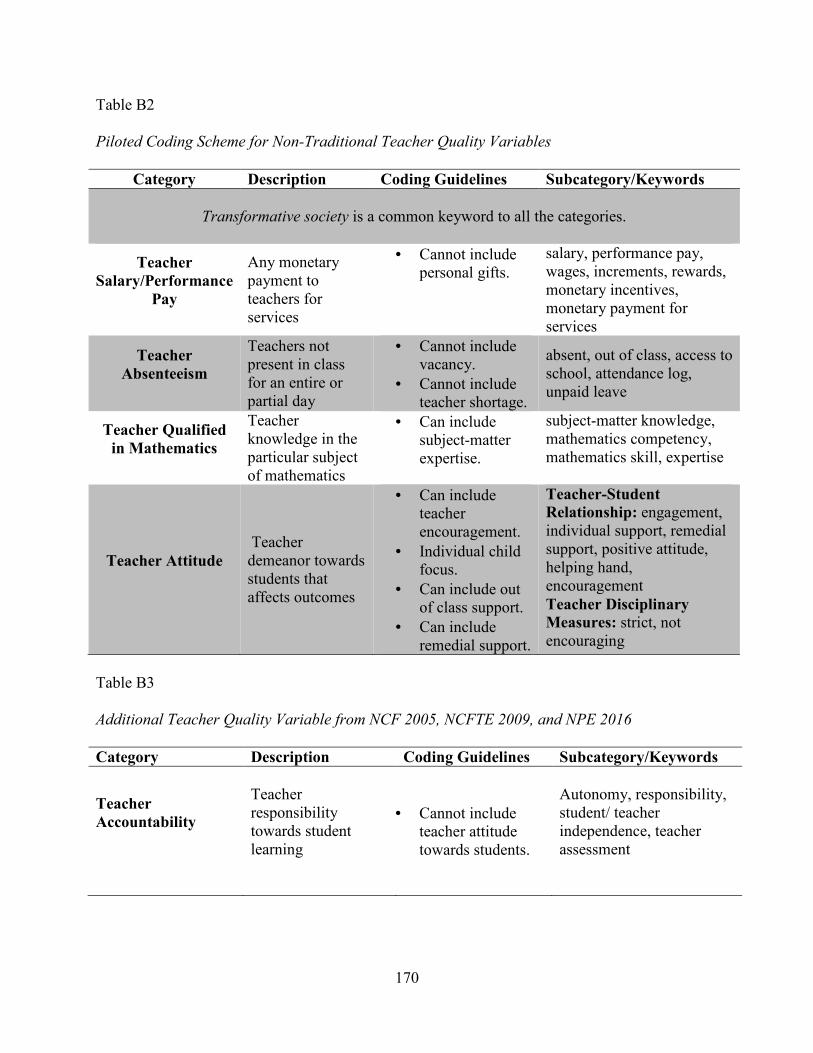
170
Table B2
Piloted Coding Scheme for Non-Traditional Teacher Quality Variables
Table B3
Additional Teacher Quality Variable from NCF 2005, NCFTE 2009, and NPE 2016
Category Description Coding Guidelines Subcategory/Keywords
Teacher
Accountability
Teacher responsibility towards student learning
• Cannot include teacher attitude towards students.
Autonomy, responsibility, student/ teacher independence, teacher assessment
Category Description Coding Guidelines Subcategory/Keywords
Transformative society is a common keyword to all the categories.
Teacher
Salary/Performance
Pay
Any monetary payment to teachers for services
• Cannot include personal gifts.
salary, performance pay, wages, increments, rewards, monetary incentives, monetary payment for services
Teacher
Absenteeism
Teachers not present in class for an entire or partial day
• Cannot include vacancy.
• Cannot include teacher shortage.
absent, out of class, access to school, attendance log, unpaid leave
Teacher Qualified in Mathematics
Teacher knowledge in the particular subject of mathematics
• Can include subject-matter expertise.
subject-matter knowledge, mathematics competency, mathematics skill, expertise
Teacher Attitude
Teacher demeanor towards students that affects outcomes
• Can include teacher encouragement.
• Individual child focus.
• Can include out of class support.
• Can include remedial support.
Teacher-Student
Relationship: engagement, individual support, remedial support, positive attitude, helping hand, encouragement
Teacher Disciplinary
Measures: strict, not encouraging
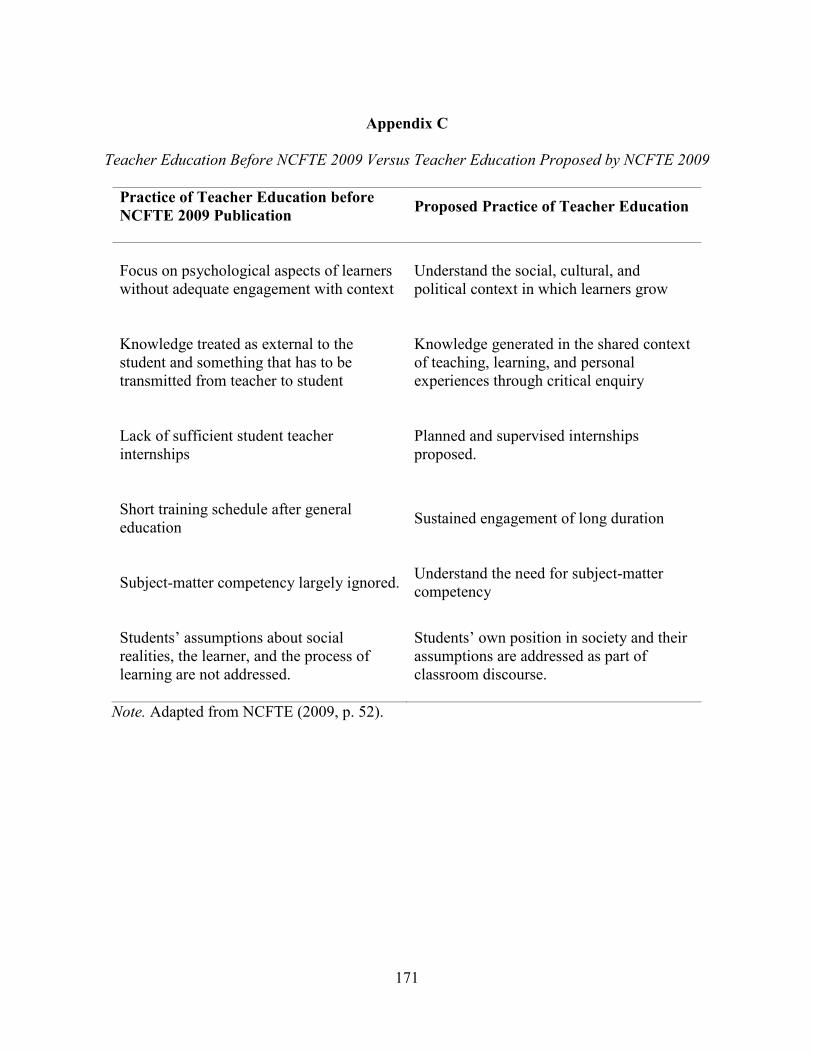
171
Appendix C
Teacher Education Before NCFTE 2009 Versus Teacher Education Proposed by NCFTE 2009
Practice of Teacher Education before
NCFTE 2009 Publication
Proposed Practice of Teacher Education
Focus on psychological aspects of learners without adequate engagement with context
Understand the social, cultural, and political context in which learners grow
Knowledge treated as external to the student and something that has to be transmitted from teacher to student
Knowledge generated in the shared context of teaching, learning, and personal experiences through critical enquiry
Lack of sufficient student teacher internships
Planned and supervised internships proposed.
Short training schedule after general education
Sustained engagement of long duration
Subject-matter competency largely ignored.
Understand the need for subject-matter competency
Students’ assumptions about social realities, the learner, and the process of learning are not addressed.
Students’ own position in society and their assumptions are addressed as part of classroom discourse.
Note. Adapted from NCFTE (2009, p. 52).
172
Biography
PREETI KUMAR
Comparative and International Education Program College of Education, Lehigh University
Iacocca Hall, 111 Research Drive Bethlehem, PA 18015
Email: [email protected]
______________________________________________________________________________
EDUCATION/
TRAINING
2013-2018 Lehigh University
Ph.D. in Comparative and International Education Bethlehem, PA, USA
2006-2010 Georgia State University Atlanta, GA, USA
M.Ed. in Behavior, Learning Disabilities and Autism
2007-2008 Academy of Orton Gillingham Atlanta, GA, USA
Teacher training program in spelling and reading
2004-2005 SNDT Women’s University Mumbai, India
Post-Graduate Diploma in Management of Learning Disabilities
1988-1992 University of Bombay Mumbai, India
Bachelor of Commerce (B.Com.)
1983-1985 Maharashtra State Board of Secondary & Mumbai, India
Higher Education
• Higher Secondary Certificate Examination
• Senior Secondary School
SUMMARY OF
QUALIFICATION
• Experience working with children who have different needs, and experience creating individual plans for them for school and home
• Familiar with the Reggio Emilia Approach to education
• Experience creating Individualized Education Plans (IEPs)

173
• Proficient in Microsoft Word, Excel, PowerPoint; Inspiration; Print Shop; G Suite; SPSS; IDB Analyzer; and MAXQDA
• Knowledge of the Promethean brand of interactive displays
WORK EXPERIENCE
Administrative Experience
September 2010-May 2015 Step by Step School New Delhi, India
Coordinator of the Learning Center
• Supervise admission procedures for children with special needs (Mentally Challenged, Autism, Celebral Palsey, Learning Disabilities) in the age group of 3-8 years
• Train teachers in creating IEPs relevant to the students
• Counsel parents
• Review progress of each child and assist teachers in creating lessons as required
• Recruit and train teachers
• Provide early identification and assessment of children at risk
Teaching Experience
2006-2010 Trinity School Atlanta, GA, USA
Teacher and Learning Support Specialist
• Handle small group instruction for children with different learning abilities in math and reading
• Create differentiated lesson plans for the classroom
• Participate in administering various standardized tests as well as scoring and interpreting the results
Pallavan Preschool New Delhi, India
2004-2005 Coordinator
• Plan the school and facility layout
• Design and adapt curriculum
• Recruit and train teachers and support staff
• Setup safety measures for children
• Supervise admission routines for students
2002-2004 Group Educator
• Design and implement cognitive curriculum for children
• Conduct monthly assessments and reporting of children’s progress o Areas of assessment included gross and fine motor skills,
cognitive development and social skills
174
• Provide regular, formal and informal updates and interactions with parents
PROFESSIONAL
SKILLS
• Assistant editor of Forum for International Research in Education (FIRE), a leading international peer reviewed publication in Comparative and International Education (2015)
• Attended a 2-day workshop on Attention-Deficit/Hyperactivity Disorder at the Trinity School, Atlanta, GA, USA (2008)
• Attended Reggio Emilia Approach training at Trinity school, Atlanta, GA, USA (2007)
• Training in the Visualizing and Verbalizing program by Lindamood-Bell, Atlanta, GA, USA (2007)
• Training in Circles of Confidence training to boost confidence in young children, University of Bristol, UK (2006)
RESEARCH
INTERESTS
• Gender studies
• Teacher quality
• Early Interventions
ADHOC REVIEWER
• Educational Researcher 2014
• Educational Researcher 2015