Embed Size (px)
Citation preview
01, August 2014 | TD Securities | Toronto
1
Commodities: CFTC Weekly Report Rates, FX and Commodities Research
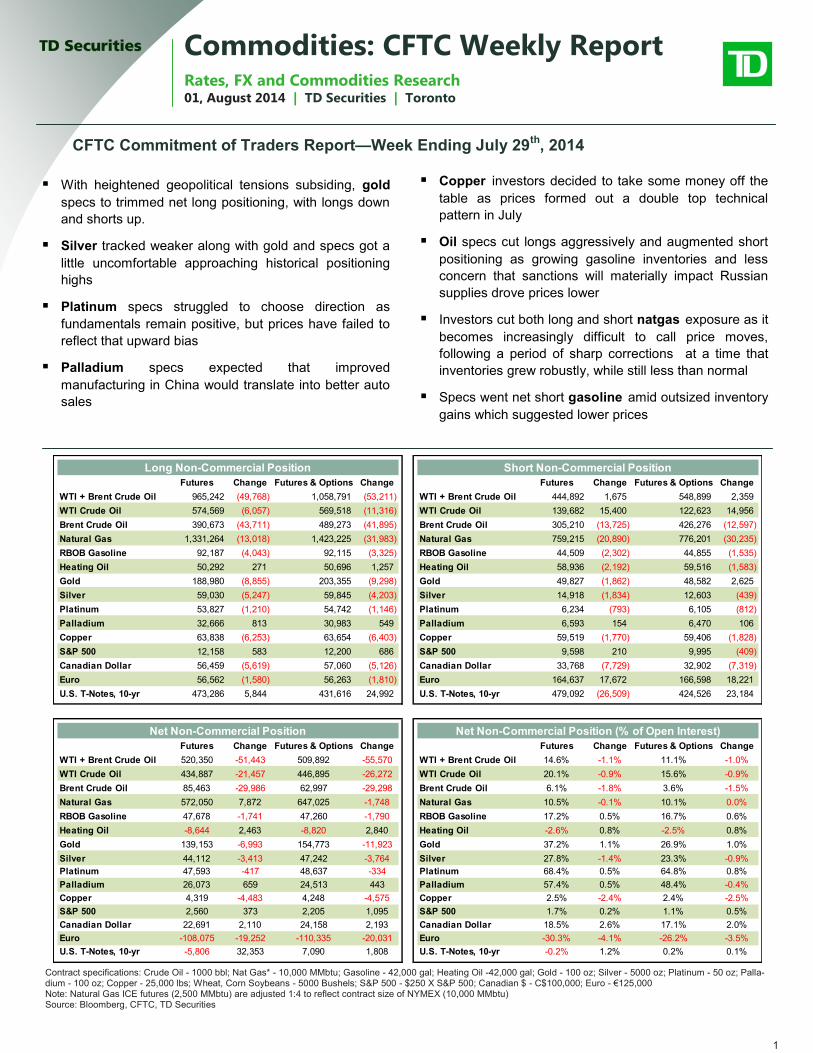
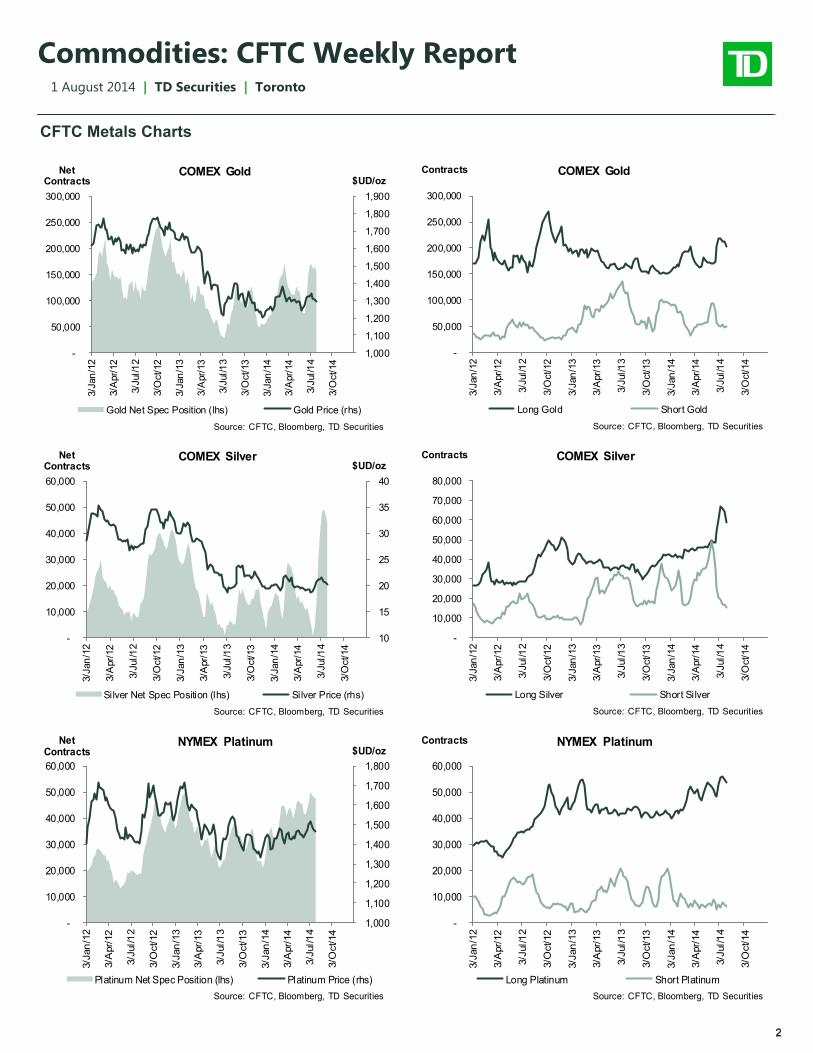
With heightened geopolitical tensions subsiding, gold
specs to trimmed net long positioning, with longs down
and shorts up.
Silver tracked weaker along with gold and specs got a
little uncomfortable approaching historical positioning
highs
Platinum specs struggled to choose direction as
fundamentals remain positive, but prices have failed to
reflect that upward bias
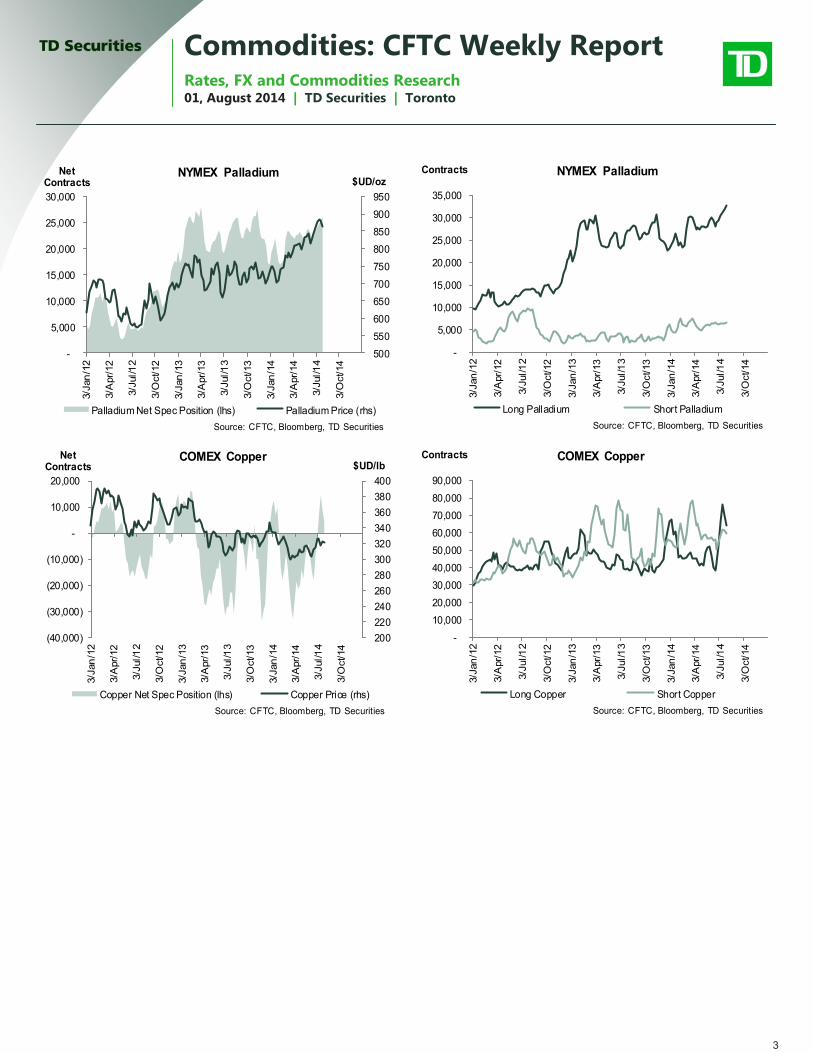
Palladium specs expected that improved
manufacturing in China would translate into better auto
sales
Copper investors decided to take some money off the
table as prices formed out a double top technical
pattern in July
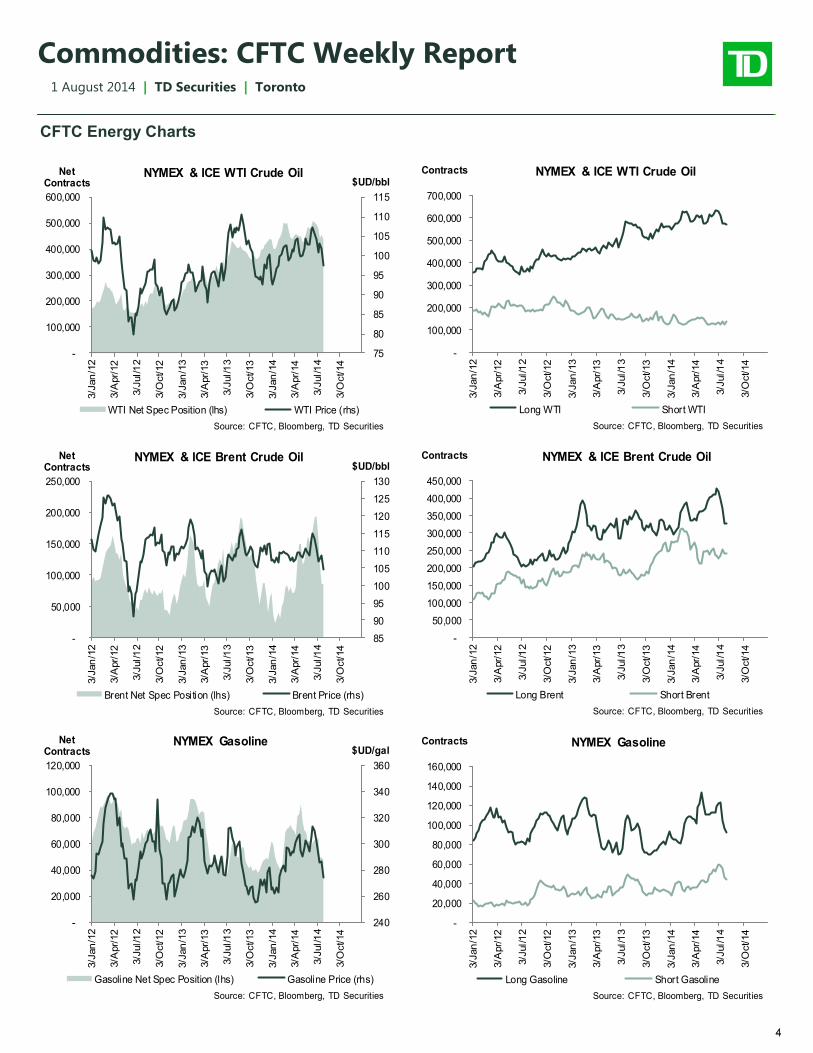
Oil specs cut longs aggressively and augmented short
positioning as growing gasoline inventories and less
concern that sanctions will materially impact Russian
supplies drove prices lower
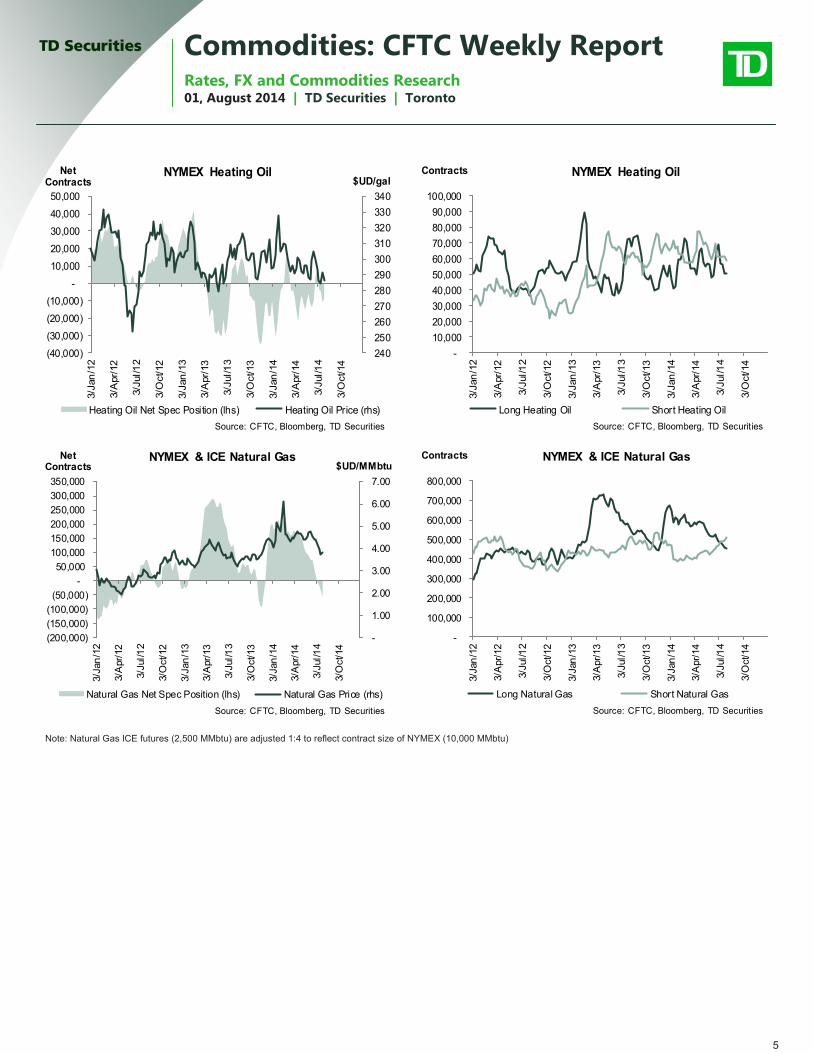
Investors cut both long and short natgas exposure as it
becomes increasingly difficult to call price moves,
following a period of sharp corrections at a time that
inventories grew robustly, while still less than normal
Specs went net short gasoline amid outsized inventory
gains which suggested lower prices
CFTC Commitment of Traders Report—Week Ending July 29th
, 2014
Contract specifications: Crude Oil - 1000 bbl; Nat Gas* - 10,000 MMbtu; Gasoline - 42,000 gal; Heating Oil -42,000 gal; Gold - 100 oz; Silver - 5000 oz; Platinum - 50 oz; Palla-dium - 100 oz; Copper - 25,000 lbs; Wheat, Corn Soybeans - 5000 Bushels; S&P 500 - $250 X S&P 500; Canadian $ - C$100,000; Euro - €125,000 Note: Natural Gas ICE futures (2,500 MMbtu) are adjusted 1:4 to reflect contract size of NYMEX (10,000 MMbtu) Source: Bloomberg, CFTC, TD Securities
Long Non-Commercial Position Short Non-Commercial Position
Futures Change Futures & Options Change Futures Change Futures & Options Change
WTI + Brent Crude Oil 965,242 (49,768) 1,058,791 (53,211) WTI + Brent Crude Oil 444,892 1,675 548,899 2,359
WTI Crude Oil 574,569 (6,057) 569,518 (11,316) WTI Crude Oil 139,682 15,400 122,623 14,956
Brent Crude Oil 390,673 (43,711) 489,273 (41,895) Brent Crude Oil 305,210 (13,725) 426,276 (12,597)
Natural Gas 1,331,264 (13,018) 1,423,225 (31,983) Natural Gas 759,215 (20,890) 776,201 (30,235)
RBOB Gasoline 92,187 (4,043) 92,115 (3,325) RBOB Gasoline 44,509 (2,302) 44,855 (1,535)
Heating Oil 50,292 271 50,696 1,257 Heating Oil 58,936 (2,192) 59,516 (1,583)
Gold 188,980 (8,855) 203,355 (9,298) Gold 49,827 (1,862) 48,582 2,625
Silver 59,030 (5,247) 59,845 (4,203) Silver 14,918 (1,834) 12,603 (439)
Platinum 53,827 (1,210) 54,742 (1,146) Platinum 6,234 (793) 6,105 (812)
Palladium 32,666 813 30,983 549 Palladium 6,593 154 6,470 106
Copper 63,838 (6,253) 63,654 (6,403) Copper 59,519 (1,770) 59,406 (1,828)
S&P 500 12,158 583 12,200 686 S&P 500 9,598 210 9,995 (409)
Canadian Dollar 56,459 (5,619) 57,060 (5,126) Canadian Dollar 33,768 (7,729) 32,902 (7,319)
Euro 56,562 (1,580) 56,263 (1,810) Euro 164,637 17,672 166,598 18,221
U.S. T-Notes, 10-yr 473,286 5,844 431,616 24,992 U.S. T-Notes, 10-yr 479,092 (26,509) 424,526 23,184
Net Non-Commercial Position Net Non-Commercial Position (% of Open Interest)
Futures Change Futures & Options Change Futures Change Futures & Options Change
WTI + Brent Crude Oil 520,350 -51,443 509,892 -55,570 WTI + Brent Crude Oil 14.6% -1.1% 11.1% -1.0%
WTI Crude Oil 434,887 -21,457 446,895 -26,272 WTI Crude Oil 20.1% -0.9% 15.6% -0.9%
Brent Crude Oil 85,463 -29,986 62,997 -29,298 Brent Crude Oil 6.1% -1.8% 3.6% -1.5%
Natural Gas 572,050 7,872 647,025 -1,748 Natural Gas 10.5% -0.1% 10.1% 0.0%
RBOB Gasoline 47,678 -1,741 47,260 -1,790 RBOB Gasoline 17.2% 0.5% 16.7% 0.6%
Heating Oil -8,644 2,463 -8,820 2,840 Heating Oil -2.6% 0.8% -2.5% 0.8%
Gold 139,153 -6,993 154,773 -11,923 Gold 37.2% 1.1% 26.9% 1.0%
Silver 44,112 -3,413 47,242 -3,764 Silver 27.8% -1.4% 23.3% -0.9%
Platinum 47,593 -417 48,637 -334 Platinum 68.4% 0.5% 64.8% 0.8%
Palladium 26,073 659 24,513 443 Palladium 57.4% 0.5% 48.4% -0.4%
Copper 4,319 -4,483 4,248 -4,575 Copper 2.5% -2.4% 2.4% -2.5%
S&P 500 2,560 373 2,205 1,095 S&P 500 1.7% 0.2% 1.1% 0.5%
Canadian Dollar 22,691 2,110 24,158 2,193 Canadian Dollar 18.5% 2.6% 17.1% 2.0%
Euro -108,075 -19,252 -110,335 -20,031 Euro -30.3% -4.1% -26.2% -3.5%
U.S. T-Notes, 10-yr -5,806 32,353 7,090 1,808 U.S. T-Notes, 10-yr -0.2% 1.2% 0.2% 0.1%
2
Commodities: CFTC Weekly Report 1 August 2014 | TD Securities | Toronto
2
CFTC Metals Charts
1,000
1,100
1,200
1,300
1,400
1,500
1,600
1,700
1,800
1,900
-
50,000
100,000
150,000
200,000
250,000
300,000
3/J
an
/12
3/A
pr/
12
3/J
ul/1
2
3/O
ct/12
3/J
an
/13
3/A
pr/
13
3/J
ul/1
3
3/O
ct/13
3/J
an
/14
3/A
pr/
14
3/J
ul/1
4
3/O
ct/14
$UD/ozNet
ContractsCOMEX Gold
Gold Net Spec Position (lhs) Gold Price (rhs)
Source: CFTC, Bloomberg, TD Securities
-
50,000
100,000
150,000
200,000
250,000
300,000
3/J
an
/12
3/A
pr/
12
3/J
ul/1
2
3/O
ct/12
3/J
an
/13
3/A
pr/
13
3/J
ul/1
3
3/O
ct/13
3/J
an
/14
3/A
pr/
14
3/J
ul/1
4
3/O
ct/14
Contracts COMEX Gold
Long Gold Short Gold
Source: CFTC, Bloomberg, TD Securities
10
15
20
25
30
35
40
-
10,000
20,000
30,000
40,000
50,000
60,000
3/J
an
/12
3/A
pr/
12
3/J
ul/1
2
3/O
ct/12
3/J
an
/13
3/A
pr/
13
3/J
ul/1
3
3/O
ct/13
3/J
an
/14
3/A
pr/
14
3/J
ul/1
4
3/O
ct/14
$UD/ozNet
ContractsCOMEX Silver
Silver Net Spec Position (lhs) Silver Price (rhs)
Source: CFTC, Bloomberg, TD Securities
-
10,000
20,000
30,000
40,000
50,000
60,000
70,000
80,0003/J
an
/12
3/A
pr/
12
3/J
ul/1
2
3/O
ct/12
3/J
an
/13
3/A
pr/
13
3/J
ul/1
3
3/O
ct/13
3/J
an
/14
3/A
pr/
14
3/J
ul/1
4
3/O
ct/14
Contracts COMEX Silver
Long Silver Short Silver
Source: CFTC, Bloomberg, TD Securities
1,000
1,100
1,200
1,300
1,400
1,500
1,600
1,700
1,800
-
10,000
20,000
30,000
40,000
50,000
60,000
3/J
an
/12
3/A
pr/
12
3/J
ul/1
2
3/O
ct/12
3/J
an
/13
3/A
pr/
13
3/J
ul/1
3
3/O
ct/13
3/J
an
/14
3/A
pr/
14
3/J
ul/1
4
3/O
ct/14
$UD/ozNet
ContractsNYMEX Platinum
Platinum Net Spec Position (lhs) Platinum Price (rhs)
Source: CFTC, Bloomberg, TD Securities
-
10,000
20,000
30,000
40,000
50,000
60,000
3/J
an
/12
3/A
pr/
12
3/J
ul/1
2
3/O
ct/12
3/J
an
/13
3/A
pr/
13
3/J
ul/1
3
3/O
ct/13
3/J
an
/14
3/A
pr/
14
3/J
ul/1
4
3/O
ct/14
Contracts NYMEX Platinum
Long Platinum Short Platinum
Source: CFTC, Bloomberg, TD Securities
01, August 2014 | TD Securities | Toronto
3
Commodities: CFTC Weekly Report Rates, FX and Commodities Research
500
550
600
650
700
750
800
850
900
950
-
5,000
10,000
15,000
20,000
25,000
30,000
3/J
an
/12
3/A
pr/
12
3/J
ul/1
2
3/O
ct/12
3/J
an
/13
3/A
pr/
13
3/J
ul/1
3
3/O
ct/13
3/J
an
/14
3/A
pr/
14
3/J
ul/1
4
3/O
ct/14
$UD/ozNet
ContractsNYMEX Palladium
Palladium Net Spec Position (lhs) Palladium Price (rhs)
Source: CFTC, Bloomberg, TD Securities
-
5,000
10,000
15,000
20,000
25,000
30,000
35,000
3/J
an
/12
3/A
pr/
12
3/J
ul/1
2
3/O
ct/12
3/J
an
/13
3/A
pr/
13
3/J
ul/1
3
3/O
ct/13
3/J
an
/14
3/A
pr/
14
3/J
ul/1
4
3/O
ct/14
Contracts NYMEX Palladium
Long Palladium Short Palladium
Source: CFTC, Bloomberg, TD Securities
200
220
240
260
280
300
320
340
360
380
400
(40,000)
(30,000)
(20,000)
(10,000)
-
10,000
20,000
3/J
an
/12
3/A
pr/
12
3/J
ul/1
2
3/O
ct/12
3/J
an
/13
3/A
pr/
13
3/J
ul/1
3
3/O
ct/13
3/J
an
/14
3/A
pr/
14
3/J
ul/1
4
3/O
ct/14
$UD/lbNet
ContractsCOMEX Copper
Copper Net Spec Position (lhs) Copper Price (rhs)
Source: CFTC, Bloomberg, TD Securities
-
10,000
20,000
30,000
40,000
50,000
60,000
70,000
80,000
90,0003/J
an
/12
3/A
pr/
12
3/J
ul/1
2
3/O
ct/12
3/J
an
/13
3/A
pr/
13
3/J
ul/1
3
3/O
ct/13
3/J
an
/14
3/A
pr/
14
3/J
ul/1
4
3/O
ct/14
Contracts COMEX Copper
Long Copper Short Copper
Source: CFTC, Bloomberg, TD Securities
4
Commodities: CFTC Weekly Report 1 August 2014 | TD Securities | Toronto
4
CFTC Energy Charts
75
80
85
90
95
100
105
110
115
-
100,000
200,000
300,000
400,000
500,000
600,000
3/J
an
/12
3/A
pr/
12
3/J
ul/1
2
3/O
ct/12
3/J
an
/13
3/A
pr/
13
3/J
ul/1
3
3/O
ct/13
3/J
an
/14
3/A
pr/
14
3/J
ul/1
4
3/O
ct/14
$UD/bblNet
ContractsNYMEX & ICE WTI Crude Oil
WTI Net Spec Position (lhs) WTI Price (rhs)
Source: CFTC, Bloomberg, TD Securities
-
100,000
200,000
300,000
400,000
500,000
600,000
700,000
3/J
an
/12
3/A
pr/
12
3/J
ul/1
2
3/O
ct/12
3/J
an
/13
3/A
pr/
13
3/J
ul/1
3
3/O
ct/13
3/J
an
/14
3/A
pr/
14
3/J
ul/1
4
3/O
ct/14
Contracts NYMEX & ICE WTI Crude Oil
Long WTI Short WTI
Source: CFTC, Bloomberg, TD Securities
85
90
95
100
105
110
115
120
125
130
-
50,000
100,000
150,000
200,000
250,000
3/J
an
/12
3/A
pr/
12
3/J
ul/1
2
3/O
ct/12
3/J
an
/13
3/A
pr/
13
3/J
ul/1
3
3/O
ct/13
3/J
an
/14
3/A
pr/
14
3/J
ul/1
4
3/O
ct/14
$UD/bblNet
ContractsNYMEX & ICE Brent Crude Oil
Brent Net Spec Position (lhs) Brent Price (rhs)
Source: CFTC, Bloomberg, TD Securities
-
50,000
100,000
150,000
200,000
250,000
300,000
350,000
400,000
450,0003/J
an
/12
3/A
pr/
12
3/J
ul/1
2
3/O
ct/12
3/J
an
/13
3/A
pr/
13
3/J
ul/1
3
3/O
ct/13
3/J
an
/14
3/A
pr/
14
3/J
ul/1
4
3/O
ct/14
Contracts NYMEX & ICE Brent Crude Oil
Long Brent Short Brent
Source: CFTC, Bloomberg, TD Securities
240
260
280
300
320
340
360
-
20,000
40,000
60,000
80,000
100,000
120,000
3/J
an
/12
3/A
pr/
12
3/J
ul/1
2
3/O
ct/12
3/J
an
/13
3/A
pr/
13
3/J
ul/1
3
3/O
ct/13
3/J
an
/14
3/A
pr/
14
3/J
ul/1
4
3/O
ct/14
$UD/galNet
ContractsNYMEX Gasoline
Gasoline Net Spec Position (lhs) Gasoline Price (rhs)
Source: CFTC, Bloomberg, TD Securities
-
20,000
40,000
60,000
80,000
100,000
120,000
140,000
160,000
3/J
an
/12
3/A
pr/
12
3/J
ul/1
2
3/O
ct/12
3/J
an
/13
3/A
pr/
13
3/J
ul/1
3
3/O
ct/13
3/J
an
/14
3/A
pr/
14
3/J
ul/1
4
3/O
ct/14
Contracts NYMEX Gasoline
Long Gasoline Short Gasoline
Source: CFTC, Bloomberg, TD Securities
01, August 2014 | TD Securities | Toronto
5
Commodities: CFTC Weekly Report Rates, FX and Commodities Research
240
250
260
270
280
290
300
310
320
330
340
(40,000)
(30,000)
(20,000)
(10,000)
-
10,000
20,000
30,000
40,000
50,000
3/J
an
/12
3/A
pr/
12
3/J
ul/1
2
3/O
ct/12
3/J
an
/13
3/A
pr/
13
3/J
ul/1
3
3/O
ct/13
3/J
an
/14
3/A
pr/
14
3/J
ul/1
4
3/O
ct/14
$UD/galNet
ContractsNYMEX Heating Oil
Heating Oil Net Spec Position (lhs) Heating Oil Price (rhs)
Source: CFTC, Bloomberg, TD Securities
-
10,000
20,000
30,000
40,000
50,000
60,000
70,000
80,000
90,000
100,000
3/J
an
/12
3/A
pr/
12
3/J
ul/1
2
3/O
ct/12
3/J
an
/13
3/A
pr/
13
3/J
ul/1
3
3/O
ct/13
3/J
an
/14
3/A
pr/
14
3/J
ul/1
4
3/O
ct/14
Contracts NYMEX Heating Oil
Long Heating Oil Short Heating Oil
Source: CFTC, Bloomberg, TD Securities
-
1.00
2.00
3.00
4.00
5.00
6.00
7.00
(200,000)
(150,000)
(100,000)
(50,000)
-
50,000
100,000
150,000
200,000
250,000
300,000
350,000
3/J
an
/12
3/A
pr/
12
3/J
ul/1
2
3/O
ct/12
3/J
an
/13
3/A
pr/
13
3/J
ul/1
3
3/O
ct/13
3/J
an
/14
3/A
pr/
14
3/J
ul/1
4
3/O
ct/14
$UD/MMbtuNet
ContractsNYMEX & ICE Natural Gas
Natural Gas Net Spec Position (lhs) Natural Gas Price (rhs)
Source: CFTC, Bloomberg, TD Securities
-
100,000
200,000
300,000
400,000
500,000
600,000
700,000
800,0003/J
an
/12
3/A
pr/
12
3/J
ul/1
2
3/O
ct/12
3/J
an
/13
3/A
pr/
13
3/J
ul/1
3
3/O
ct/13
3/J
an
/14
3/A
pr/
14
3/J
ul/1
4
3/O
ct/14
Contracts NYMEX & ICE Natural Gas
Long Natural Gas Short Natural Gas
Source: CFTC, Bloomberg, TD Securities
Note: Natural Gas ICE futures (2,500 MMbtu) are adjusted 1:4 to reflect contract size of NYMEX (10,000 MMbtu)
6
Commodities: CFTC Weekly Report 1 August 2014 | TD Securities | Toronto
6
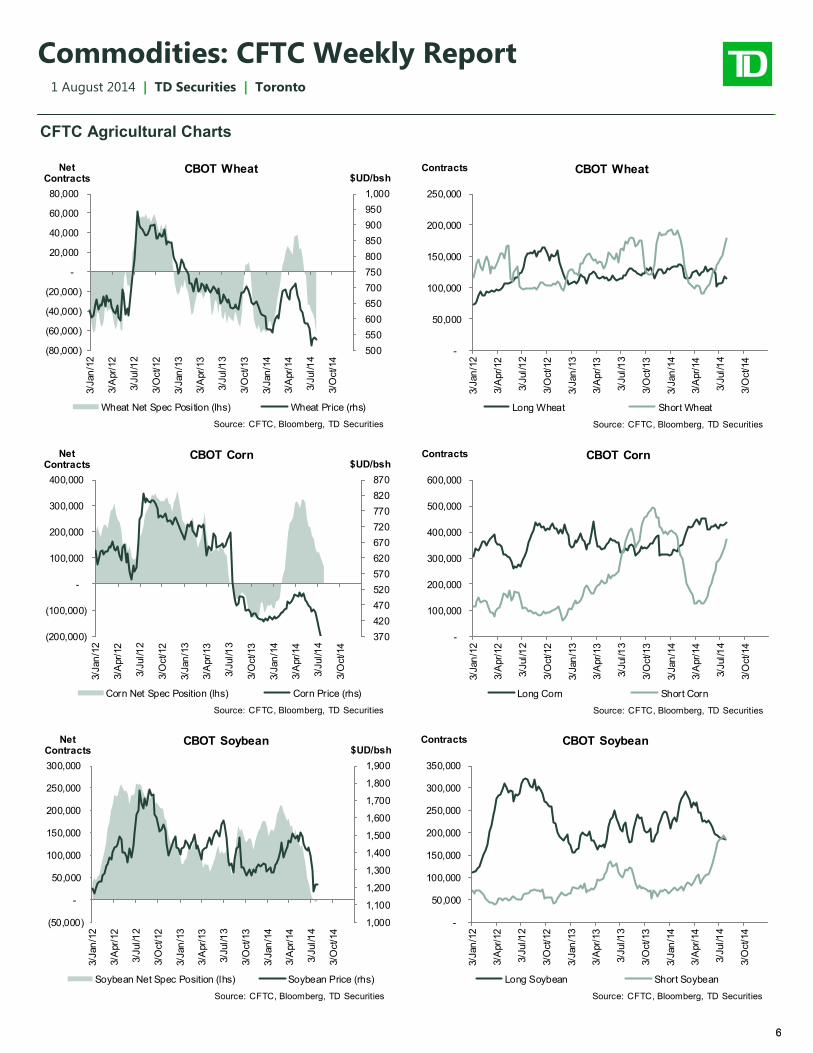
CFTC Agricultural Charts
500
550
600
650
700
750
800
850
900
950
1,000
(80,000)
(60,000)
(40,000)
(20,000)
-
20,000
40,000
60,000
80,000
3/J
an
/12
3/A
pr/
12
3/J
ul/1
2
3/O
ct/12
3/J
an
/13
3/A
pr/
13
3/J
ul/1
3
3/O
ct/13
3/J
an
/14
3/A
pr/
14
3/J
ul/1
4
3/O
ct/14
$UD/bshNet
ContractsCBOT Wheat
Wheat Net Spec Position (lhs) Wheat Price (rhs)
Source: CFTC, Bloomberg, TD Securities
-
50,000
100,000
150,000
200,000
250,000
3/J
an
/12
3/A
pr/
12
3/J
ul/1
2
3/O
ct/12
3/J
an
/13
3/A
pr/
13
3/J
ul/1
3
3/O
ct/13
3/J
an
/14
3/A
pr/
14
3/J
ul/1
4
3/O
ct/14
Contracts CBOT Wheat
Long Wheat Short Wheat
Source: CFTC, Bloomberg, TD Securities
370
420
470
520
570
620
670
720
770
820
870
(200,000)
(100,000)
-
100,000
200,000
300,000
400,000
3/J
an
/12
3/A
pr/
12
3/J
ul/1
2
3/O
ct/12
3/J
an
/13
3/A
pr/
13
3/J
ul/1
3
3/O
ct/13
3/J
an
/14
3/A
pr/
14
3/J
ul/1
4
3/O
ct/14
$UD/bshNet
ContractsCBOT Corn
Corn Net Spec Position (lhs) Corn Price (rhs)
Source: CFTC, Bloomberg, TD Securities
-
100,000
200,000
300,000
400,000
500,000
600,0003/J
an
/12
3/A
pr/
12
3/J
ul/1
2
3/O
ct/12
3/J
an
/13
3/A
pr/
13
3/J
ul/1
3
3/O
ct/13
3/J
an
/14
3/A
pr/
14
3/J
ul/1
4
3/O
ct/14
Contracts CBOT Corn
Long Corn Short Corn
Source: CFTC, Bloomberg, TD Securities
1,000
1,100
1,200
1,300
1,400
1,500
1,600
1,700
1,800
1,900
(50,000)
-
50,000
100,000
150,000
200,000
250,000
300,000
3/J
an
/12
3/A
pr/
12
3/J
ul/1
2
3/O
ct/12
3/J
an
/13
3/A
pr/
13
3/J
ul/1
3
3/O
ct/13
3/J
an
/14
3/A
pr/
14
3/J
ul/1
4
3/O
ct/14
$UD/bshNet
ContractsCBOT Soybean
Soybean Net Spec Position (lhs) Soybean Price (rhs)
Source: CFTC, Bloomberg, TD Securities
-
50,000
100,000
150,000
200,000
250,000
300,000
350,000
3/J
an
/12
3/A
pr/
12
3/J
ul/1
2
3/O
ct/12
3/J
an
/13
3/A
pr/
13
3/J
ul/1
3
3/O
ct/13
3/J
an
/14
3/A
pr/
14
3/J
ul/1
4
3/O
ct/14
Contracts CBOT Soybean
Long Soybean Short Soybean
Source: CFTC, Bloomberg, TD Securities
7
Commodities: CFTC Weekly Report 1 August 2014 | TD Securities | Toronto
7
This report has been prepared solely for information purposes and is not intended to provide financial, legal, accounting or tax advice and should not be relied upon in that regard. Information provided in this Report is believed to be accurate and reliable, but we cannot guarantee it is accurate or complete or current at all times and no representation is made in this regard. Conclusions and opinions do not guarantee any future event or performance. It is not an offer, recommendation or solicitation to buy or sell, nor is it an official confirmation of terms. It is based on public information. Changes to assumptions may have a material impact on any returns detailed. Historic information or performance is not indicative of future returns. The information is subject to change without notice. Any views expressed are those of the author and do not necessarily express those of The Toronto Dominion Bank (“TD Bank”). TD Bank or an associated company may have effected or may effect transactions for its own account in the securities described herein. Any transac-tion entered into is in reliance only upon your judgement as to both financial and suitability criteria. No proposed customer or counterparty relationship is intended or implied between TD Bank or any of its regulated subsidiaries and a recipient of this document where that recipient is not an existing customer or counterparty of TD Bank or one of its regulated subsidiaries. COPYRIGHT 2013 by TD Securities Inc. “TD Securities” is a trademark of the TD Bank, representing TD Securities Inc., TD Securities (USA) LLC and certain investment activities of the TD Bank. The Toronto-Dominion Bank is regulated by the FSA.
Commodities Research Team:
Bart Melek Head of Commodity Strategy [email protected] +1 416 983 9288
Mike Dragosits Senior Commodity Strategist [email protected] +1 416 983 8075
Michael Loewen Commodities Strategist [email protected] +1 416 982 5816
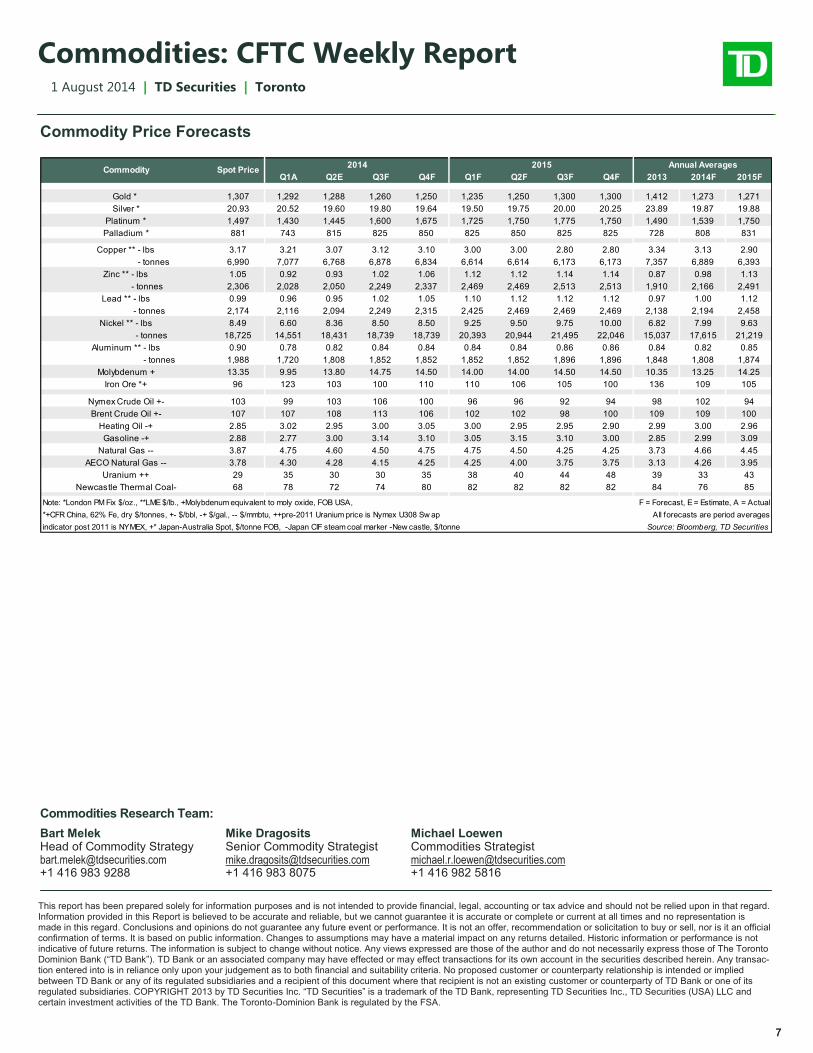
Commodity Price Forecasts
Annual Averages
Q1A Q2E Q3F Q4F Q1F Q2F Q3F Q4F 2013 2014F 2015F
Gold * 1,307 1,292 1,288 1,260 1,250 1,235 1,250 1,300 1,300 1,412 1,273 1,271
Silver * 20.93 20.52 19.60 19.80 19.64 19.50 19.75 20.00 20.25 23.89 19.87 19.88
Platinum * 1,497 1,430 1,445 1,600 1,675 1,725 1,750 1,775 1,750 1,490 1,539 1,750
Palladium * 881 743 815 825 850 825 850 825 825 728 808 831
Copper ** - lbs 3.17 3.21 3.07 3.12 3.10 3.00 3.00 2.80 2.80 3.34 3.13 2.90
- tonnes 6,990 7,077 6,768 6,878 6,834 6,614 6,614 6,173 6,173 7,357 6,889 6,393
Zinc ** - lbs 1.05 0.92 0.93 1.02 1.06 1.12 1.12 1.14 1.14 0.87 0.98 1.13
- tonnes 2,306 2,028 2,050 2,249 2,337 2,469 2,469 2,513 2,513 1,910 2,166 2,491
Lead ** - lbs 0.99 0.96 0.95 1.02 1.05 1.10 1.12 1.12 1.12 0.97 1.00 1.12
- tonnes 2,174 2,116 2,094 2,249 2,315 2,425 2,469 2,469 2,469 2,138 2,194 2,458
Nickel ** - lbs 8.49 6.60 8.36 8.50 8.50 9.25 9.50 9.75 10.00 6.82 7.99 9.63
- tonnes 18,725 14,551 18,431 18,739 18,739 20,393 20,944 21,495 22,046 15,037 17,615 21,219
Aluminum ** - lbs 0.90 0.78 0.82 0.84 0.84 0.84 0.84 0.86 0.86 0.84 0.82 0.85
- tonnes 1,988 1,720 1,808 1,852 1,852 1,852 1,852 1,896 1,896 1,848 1,808 1,874
Molybdenum + 13.35 9.95 13.80 14.75 14.50 14.00 14.00 14.50 14.50 10.35 13.25 14.25
Iron Ore *+ 96 123 103 100 110 110 106 105 100 136 109 105
Nymex Crude Oil +- 103 99 103 106 100 96 96 92 94 98 102 94
Brent Crude Oil +- 107 107 108 113 106 102 102 98 100 109 109 100
Heating Oil -+ 2.85 3.02 2.95 3.00 3.05 3.00 2.95 2.95 2.90 2.99 3.00 2.96
Gasoline -+ 2.88 2.77 3.00 3.14 3.10 3.05 3.15 3.10 3.00 2.85 2.99 3.09
Natural Gas -- 3.87 4.75 4.60 4.50 4.75 4.75 4.50 4.25 4.25 3.73 4.66 4.45
AECO Natural Gas -- 3.78 4.30 4.28 4.15 4.25 4.25 4.00 3.75 3.75 3.13 4.26 3.95
Uranium ++ 29 35 30 30 35 38 40 44 48 39 33 43
Newcastle Thermal Coal- 68 78 72 74 80 82 82 82 82 84 76 85
Note: *London PM Fix $/oz., **LME $/lb., +Molybdenum equivalent to moly oxide, FOB USA, F = Forecast, E = Estimate, A = Actual
*+CFR China, 62% Fe, dry $/tonnes, +- $/bbl, -+ $/gal., -- $/mmbtu, ++pre-2011 Uranium price is Nymex U308 Sw ap All forecasts are period averages
indicator post 2011 is NYMEX, +* Japan-Australia Spot, $/tonne FOB, -Japan CIF steam coal marker -New castle, $/tonne Source: Bloomberg, TD Securities
2015Commodity
2014Spot Price