Embed Size (px)
Citation preview

TD Bank Group Quarterly Results Presentation
Q4 2014
Thursday December 4th, 2014

2
Caution Regarding Forward-Looking Statements
From time to time, the Bank makes written and/or oral forward-looking statements, including in this document, in other filings with Canadian regulators or the U.S. Securities and Exchange Commission, and in other communications. In addition, representatives of the Bank may make forward-looking statements orally to analysts, investors, the media and others. All such statements are made pursuant to the “safe harbour” provisions of, and are intended to be forward-looking statements under, applicable Canadian and U.S. securities legislation, including the U.S. Private Securities Litigation Reform Act of 1995. Forward-looking statements include, but are not limited to, statements made in this document, including in the Management's Discussion and Analysis ("2014 MD&A") under the heading “Economic Summary and Outlook”, for each business segment under headings “Business Outlook and Focus for 2015”, and in other statements regarding the Bank’s objectives and priorities for 2015 and beyond and strategies to achieve them, and the Bank’s anticipated financial performance. Forward-looking statements are typically identified by words such as “will”, “should”, “believe”, “expect”, “anticipate”, “intend”, “estimate”, “plan”, “may”, and “could”.
By their very nature, these forward-looking statements require the Bank to make assumptions and are subject to inherent risks and uncertainties, general and specific. Especially in light of the uncertainty related to the physical, financial, economic, political, and regulatory environments, such risks and uncertainties – many of which are beyond the Bank’s control and the effects of which can be difficult to predict – may cause actual results to differ materially from the expectations expressed in the forward-looking statements. Risk factors that could cause such differences include: credit, market (including equity, commodity, foreign exchange, and interest rate), liquidity, operational (including technology), reputational, insurance, strategic, regulatory, legal, environmental, capital adequacy, and other risks. Examples of such risk factors include the general business and economic conditions in the regions in which the Bank operates; the ability of the Bank to execute on key priorities, including to successfully complete acquisitions and strategic plans and to attract, develop and retain key executives; disruptions in or attacks (including cyber attacks) on the Bank’s information technology, internet, network access or other voice or data communications systems or services; the evolution of various types of fraud or other criminal behaviour to which the Bank is exposed; the failure of third parties to comply with their obligations to the Bank or its affiliates, including relating to the care and control of information; the impact of new and changes to current laws and regulations; the overall difficult litigation environment, including in the U.S.; increased competition, including through internet and mobile banking; changes to the Bank’s credit ratings; changes in currency and interest rates; increased funding costs for credit due to market illiquidity and competition for funding; changes to accounting policies and methods used by the Bank; and the occurrence of natural and unnatural catastrophic events and claims resulting from such events. The Bank cautions that the preceding list is not exhaustive of all possible risk factors and other factors could also adversely affect the Bank’s results. For more detailed information, please see the “Risk Factors and Management” section of the 2014 MD&A, as may be updated in subsequently filed quarterly reports to shareholders and news releases (as applicable) related to any transactions discussed under the heading “Significant Events” in the relevant MD&A, which applicable releases may be found on www.td.com. All such factors should be considered carefully, as well as other uncertainties and potential events, and the inherent uncertainty of forward-looking statements, when making decisions with respect to the Bank and the Bank cautions readers not to place undue reliance on the Bank’s forward-looking statements.
Material economic assumptions underlying the forward-looking statements contained in this document are set out in the 2014 MD&A under the headings “Economic Summary and Outlook”, and for each business segment, “Business Outlook and Focus for 2015”, each as updated in subsequently filed quarterly reports to shareholders.
Any forward-looking statements contained in this document represent the views of management only as of the date hereof and are presented for the purpose of assisting the Bank’s shareholders and analysts in understanding the Bank’s financial position, objectives and priorities and anticipated financial performance as at and for the periods ended on the dates presented, and may not be appropriate for other purposes. The Bank does not undertake to update any forward-looking statements, whether written or oral, that may be made from time to time by or on its behalf, except as required under applicable securities legislation.
3
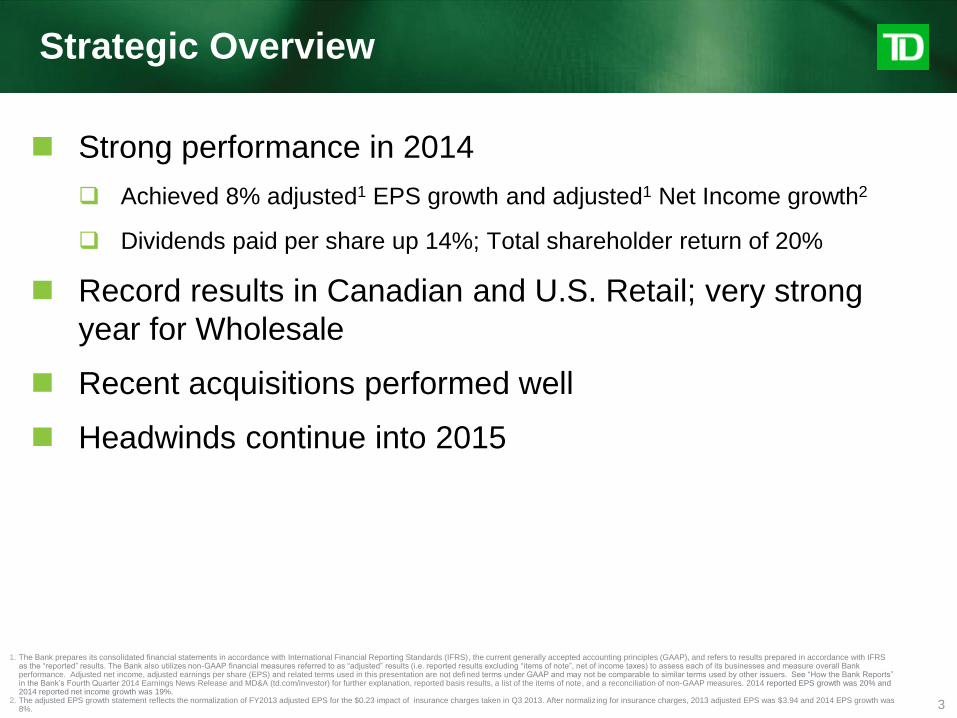
Strategic Overview
Strong performance in 2014
Achieved 8% adjusted1 EPS growth and adjusted1 Net Income growth2
Dividends paid per share up 14%; Total shareholder return of 20%
Record results in Canadian and U.S. Retail; very strong
year for Wholesale
Recent acquisitions performed well
Headwinds continue into 2015
1. The Bank prepares its consolidated financial statements in accordance with International Financial Reporting Standards (IFRS), the current generally accepted accounting principles (GAAP), and refers to results prepared in accordance with IFRS as the “reported” results. The Bank also utilizes non-GAAP financial measures referred to as “adjusted” results (i.e. reported results excluding “items of note”, net of income taxes) to assess each of its businesses and measure overall Bank performance. Adjusted net income, adjusted earnings per share (EPS) and related terms used in this presentation are not defined terms under GAAP and may not be comparable to similar terms used by other issuers. See “How the Bank Reports” in the Bank’s Fourth Quarter 2014 Earnings News Release and MD&A (td.com/investor) for further explanation, reported basis results, a list of the items of note, and a reconciliation of non-GAAP measures. 2014 reported EPS growth was 20% and 2014 reported net income growth was 19%.
2. The adjusted EPS growth statement reflects the normalization of FY2013 adjusted EPS for the $0.23 impact of insurance charges taken in Q3 2013. After normalizing for insurance charges, 2013 adjusted EPS was $3.94 and 2014 EPS growth was 8%.
4
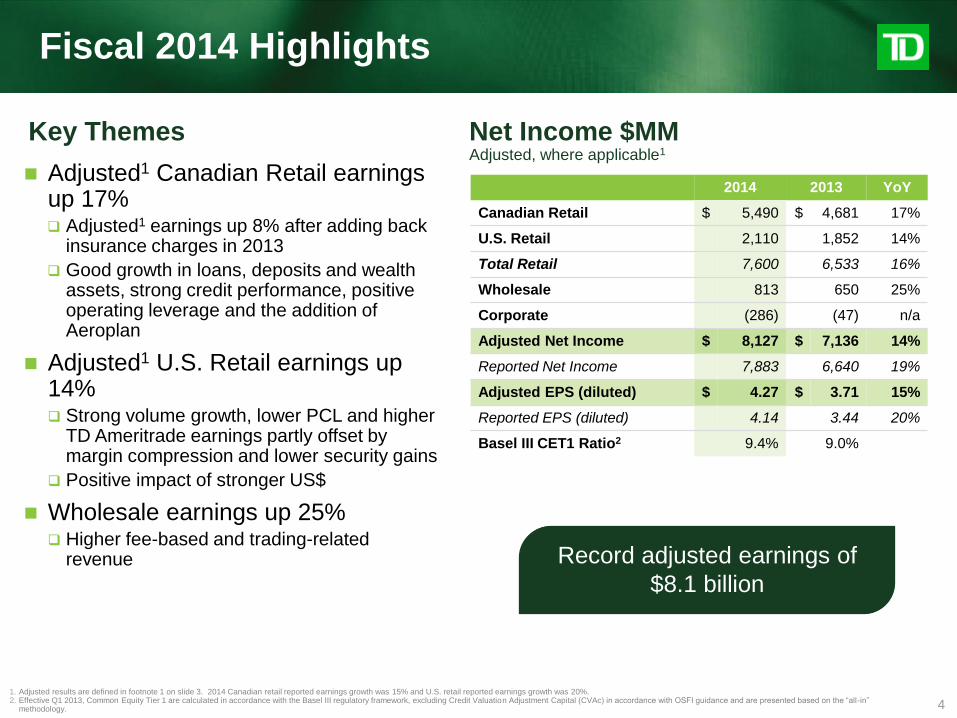
Fiscal 2014 Highlights
Key Themes Net Income $MM Adjusted, where applicable1
2014 2013 YoY
Canadian Retail $ 5,490 $ 4,681 17%
U.S. Retail 2,110 1,852 14%
Total Retail 7,600 6,533 16%
Wholesale 813 650 25%
Corporate (286) (47) n/a
Adjusted Net Income $ 8,127 $ 7,136 14%
Reported Net Income 7,883 6,640 19%
Adjusted EPS (diluted) $ 4.27 $ 3.71 15%
Reported EPS (diluted) 4.14 3.44 20%
Basel III CET1 Ratio2 9.4% 9.0%
Adjusted1 Canadian Retail earnings up 17% Adjusted1 earnings up 8% after adding back
insurance charges in 2013
Good growth in loans, deposits and wealth assets, strong credit performance, positive operating leverage and the addition of Aeroplan
Adjusted1 U.S. Retail earnings up 14% Strong volume growth, lower PCL and higher
TD Ameritrade earnings partly offset by margin compression and lower security gains
Positive impact of stronger US$
Wholesale earnings up 25% Higher fee-based and trading-related
revenue
1. Adjusted results are defined in footnote 1 on slide 3. 2014 Canadian retail reported earnings growth was 15% and U.S. retail reported earnings growth was 20%. 2. Effective Q1 2013, Common Equity Tier 1 are calculated in accordance with the Basel III regulatory framework, excluding Credit Valuation Adjustment Capital (CVAc) in accordance with OSFI guidance and are presented based on the “all-in”
methodology.
Great quarter on strong Retail and good
Wholesale results
Record adjusted earnings of
$8.1 billion

$0.425 $0.43 $0.47 $0.47 $0.47
$0.02$0.04
Q4/13 Q1/14 Q2/14 Q3/14 Q4/14
5
Q4 2014 Highlights
Key Themes
1. Adjusted results are defined in footnote 1 on slide 3. 2. “Retail” comprises Canadian Retail and U.S. Retail segments as reported in the Bank’s Fourth Quarter 2014 Earnings News Re lease and MD&A. Reported retail results were $1,813MM, down 8% QoQ and up 8% YoY.
Net Income $MM Adjusted, where applicable1
Great quarter on strong Retail and good
Wholesale results Solid operating results
Q4/14 QoQ YoY
Retail2 $ 1,867 -7% 7%
Wholesale 160 -26% 31%
Corporate (165) n/a n/a
Adjusted Net Income $ 1,862 -14% 3%
Reported Net Income 1,746 -17% 8%
Adjusted EPS (diluted) $ 0.98 -15% 3%
Reported EPS (diluted) 0.91 -18% 9%
Basel III CET1 Ratio 9.4%
Dividend per Common Share
= Announced dividend increase
Adjusted1 EPS growth of 3% YoY Earnings were impacted by Funding
Valuation Adjustments, elevated expenses and higher tax rate
Retail earnings up 7% YoY Good volume and asset growth
Good contribution from acquisitions
Wholesale earnings up 31% YoY Strong underwriting & advisory
Elevated expenses in Q4/13
Strong capital ratio of 9.4%

6
Q4 2014 Earnings: Items of Note
MM EPS
Reported net income and EPS (diluted) $1,746 $0.91
Items of Note Pre Tax
(MM) After Tax
(MM) EPS
Amortization of intangibles1 $70
$62
$0.04
Integration charges relating to the acquisition of the credit card portfolio of MBNA Canada
$73
$54
$0.03
Excluding Items of Note above
Adjusted2 net income and EPS (diluted) $1,862 $0.98
1. Includes amortization of intangibles expense of $13MM, net of tax, for TD Ameritrade Holding Corporation. Amortization of software is recorded in amortization of intangibles; however, amortization of software is not included for purposes of items of
note, which only include amortization of intangibles acquired as a result of business combinations.
2. Adjusted results are defined in footnote 1 on slide 3.

7
Canadian Retail
43.2%
41.8%
42.5%
40.9%
43.7%
Q4/13 Q1/14 Q2/14 Q3/14 Q4/14
Efficiency Ratio Adjusted1
Net Interest Margin
1. Adjusted results are defined in footnote 1 on slide 3. Q4 2014 expenses and net income exclude items of note disclosed on slide 6 and in the Bank’s Fourth Quarter 2014 Earnings News Release (td.com/investor). Reported expenses for Q4 2014 were
$2,224MM, and QoQ and YoY changes on a reported basis were 7% and 9%, respectively. Reported efficiency ratio for Q4 2014 was 45.2%, reported operating leverage was -242bps, and reported return on common equity was 40.8%.
Key Themes P&L $MM
Adjusted, where applicable1
Q4/14 QoQ YoY
Revenue $ 4,920 0% 7%
PCL 250 10% 12%
Insurance Claims 720 -7% 1%
Expenses (adjusted) 2,151 7% 8%
Net Income (adjusted) $ 1,358 -6% 7%
Net Income (reported) $ 1,304 -7% 5%
ROE (adjusted) 42.5%
Great quarter on strong Retail and good
Wholesale results Good performance for Canadian
Retail
Adjusted1 net income up 7% YoY
Revenue up 7% YoY Good volume growth, higher Wealth assets,
Insurance business growth and the addition of Aeroplan
Net interest margin down 6 bps sequentially
PCL up 12% YoY Mainly acquisition-related
Adjusted1 expenses up 8% YoY Higher variable compensation in Wealth,
initiatives to grow the business and Aeroplan partly offset by productivity gains
Strong contribution from Wealth Earnings up 10% YoY on fee-based asset
growth 2.92% 2.94% 2.97% 2.98% 2.92%
Q4/13 Q1/14 Q2/14 Q3/14 Q4/14

8
U.S. Retail
Deposits3, US$B Loans4, US$B
1. Adjusted results are defined in footnote 1 on slide 3. Reported expenses for Q4 2014 were $1,249MM, and QoQ and YoY changes on a reported basis were 2% and -4%, respectively. Reported U.S. Retail Bank Net Income was $385MM, up 8%
YoY. Reported Total U.S. Net Income was $462MM, up 7% YoY. Reported U.S. Retail Bank Net Income on a Canadian dollar basis was $426MM, up 15% YoY, and Total U.S. Net Income on a Canadian dollar basis was $509MM, up 14% YoY.
2. Security gains includes both gains on sales of securities and debt securities classified as loans.
3. Deposits includes average personal deposits, average business deposits, and average TD Ameritrade insured deposit account (IDA) balances.
4. Loans includes average personal loans and average business loans and acceptances.
Adjusted1 net income up 1% YoY
Revenue down 2% YoY Strong loan and deposit growth
Lower security gains2
Net interest margin down 11 bps QoQ on lower accretion and some core compression
PCL down 29% YoY Improved credit quality in auto loans and
Commercial portfolio
Adjusted1 expenses down 2% YoY Strong expense control; lower Target-
related costs
Continued strong
core growth Great quarter on
strong Retail and good Wholesale results
Strong volume growth and expense management
Q4/14 QoQ YoY
Revenue $ 1,851 -2% -2%
PCL 125 6% -29%
Expenses (adjusted) 1,249 2% -2%
Net Income, U.S. Retail Bank (adjusted) $ 385 -14% 0%
Net Income, TD AMTD $ 77 12% 5%
Total Net Income (adjusted) $ 462 -11% 1%
Net Income, U.S. Retail Bank (adjusted) C$ 426 -12% 6%
Net Income, TD AMTD C$ 83 9% 8%
Total Net Income (adjusted) C$ 509 -9% 6%
Efficiency Ratio 67.5% 300 bps 50 bps
ROE 7.6%
191 194
197 197 201
Q4/13 Q1/14 Q2/14 Q3/14 Q4/14
105 107 108
111 114
Q4/13 Q1/14 Q2/14 Q3/14 Q4/14
Key Themes P&L $MM
Adjusted, where applicable1

9
Wholesale Banking
Revenue $MM
Key Themes P&L $MM
Q4/14 QoQ YoY
Revenue $ 604 -11% 0%
PCL -1 -120% -120%
Expenses 381 -3% -10%
Net Income $ 160 -26% 31%
ROE 13.0%
Net income up 31% YoY
Revenue stable YoY Higher underwriting volumes and M&A
fees Funding Valuation Adjustment charge of
$65 million pre-tax impacted trading-related revenue
Expenses down 10% YoY Q4/13 included litigation matters
Great quarter on strong Retail and good
Wholesale results
Diversified model delivering solid results
343 408 365 325 296
260
310 313 355
308
603
718 678 680
604
Q4/13 Q1/14 Q2/14 Q3/14 Q4/14
Trading Related Non-Trading

10
Corporate Segment
Key Themes P&L $MM1
Q4/14 Q3/14 Q4/13
Net Corporate Expenses $ (233) $ (170) $ (142)
Other 41 90 59
Non-Controlling Interests 27 27 27
Net Income (adjusted) $ (165) $ (53) $ (56)
Reported Net Income (227) (70) (191)
Background
Corporate segment includes: Net treasury and capital management
related activities
Corporate expenses and other items not fully allocated to operating segments
Adjusted1 net income down YoY and QoQ
Reflects ongoing investment in enterprise projects and initiatives and lower positive tax items
Corporate losses expected to increase next year
TD Ameritrade share sale gains will not recur
1. Adjusted results are defined in footnote 1 on slide 3.
11
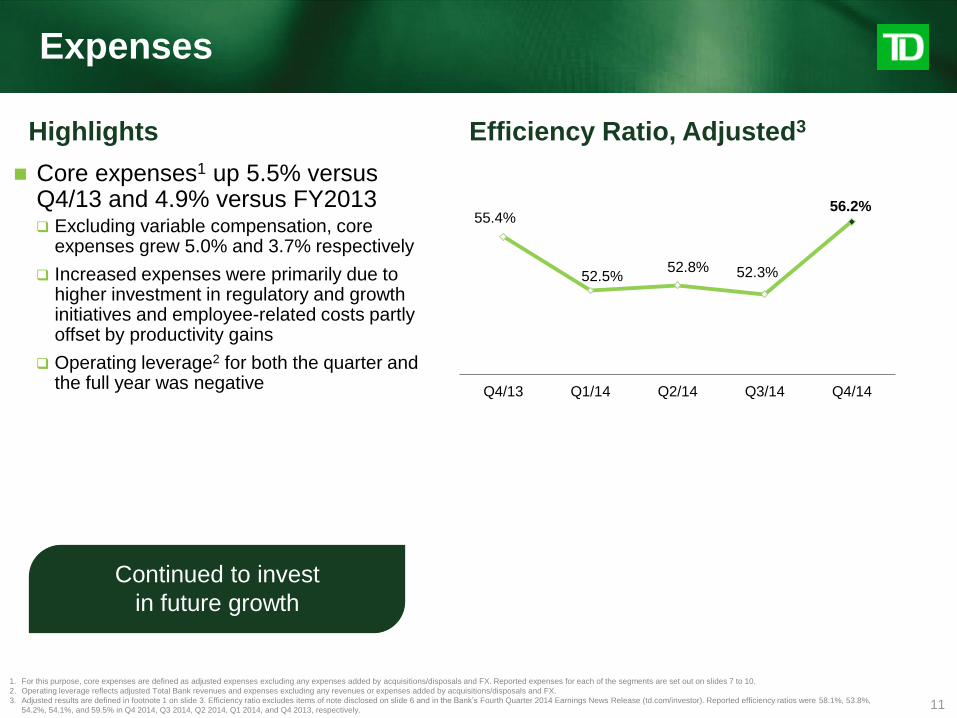
Expenses
Highlights
Great quarter on strong Retail and good
Wholesale results
Continued to invest
in future growth
Core expenses1 up 5.5% versus Q4/13 and 4.9% versus FY2013 Excluding variable compensation, core
expenses grew 5.0% and 3.7% respectively
Increased expenses were primarily due to higher investment in regulatory and growth initiatives and employee-related costs partly offset by productivity gains
Operating leverage2 for both the quarter and the full year was negative
1. For this purpose, core expenses are defined as adjusted expenses excluding any expenses added by acquisitions/disposals and FX. Reported expenses for each of the segments are set out on slides 7 to 10.
2. Operating leverage reflects adjusted Total Bank revenues and expenses excluding any revenues or expenses added by acquisitions/disposals and FX.
3. Adjusted results are defined in footnote 1 on slide 3. Efficiency ratio excludes items of note disclosed on slide 6 and in the Bank’s Fourth Quarter 2014 Earnings News Release (td.com/investor). Reported efficiency ratios were 58.1%, 53.8%,
54.2%, 54.1%, and 59.5% in Q4 2014, Q3 2014, Q2 2014, Q1 2014, and Q4 2013, respectively.
Efficiency Ratio, Adjusted3
55.4%
52.5% 52.8% 52.3%
56.2%
Q4/13 Q1/14 Q2/14 Q3/14 Q4/14
12
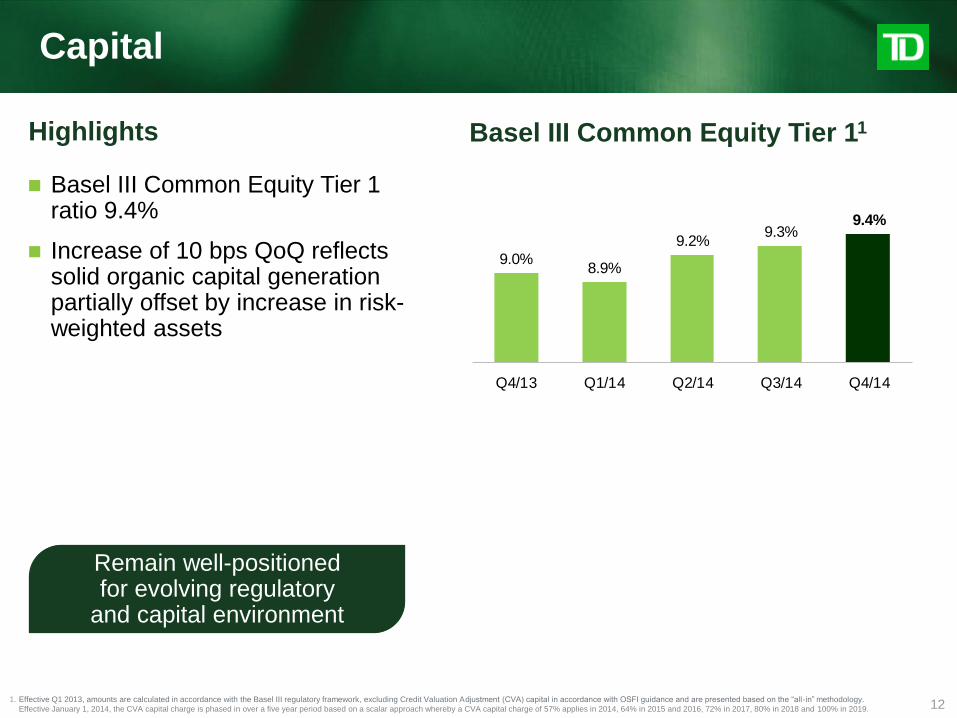
Capital
1. Effective Q1 2013, amounts are calculated in accordance with the Basel III regulatory framework, excluding Credit Valuation Adjustment (CVA) capital in accordance with OSFI guidance and are presented based on the “all-in” methodology.
Effective January 1, 2014, the CVA capital charge is phased in over a five year period based on a scalar approach whereby a CVA capital charge of 57% applies in 2014, 64% in 2015 and 2016, 72% in 2017, 80% in 2018 and 100% in 2019.
Basel III Common Equity Tier 11 Highlights
Basel III Common Equity Tier 1 ratio 9.4%
Increase of 10 bps QoQ reflects solid organic capital generation partially offset by increase in risk-weighted assets
Great quarter on strong Retail and good
Wholesale results
Remain well-positioned for evolving regulatory
and capital environment
9.0%8.9%
9.2%9.3%
9.4%
Q4/13 Q1/14 Q2/14 Q3/14 Q4/14

13
38 40
35
28
33
Q4/13 Q1/14 Q2/14 Q3/14 Q4/14
Credit Portfolio Highlights
1. PCL Ratio – Provision for Credit Losses on a quarterly annualized basis/Average Net Loans & Acceptances; Total PCL excludes the impact of acquired credit-impaired loans, debt securities classified as loans and items of note.
2. GIL Ratio – Gross Impaired Loans/Gross Loans & Acceptances (both are spot). Excludes the impact of acquired credit impaired loans and debt securities classified as loans.
Highlights
GIL Ratio (bps)2
PCL Ratio (bps)1
60 62
59
55 56
Q4/13 Q1/14 Q2/14 Q3/14 Q4/14
Great quarter on strong Retail and good
Wholesale results Solid Credit Quality
Loss rates remain at cyclically low levels
Favourable U.S. Retail performance resulted in full year PCL reduction
Ongoing strong performance across all portfolios

Appendix

15
Q4 2014 Earnings: Items of Note
MM EPS
Reported net income and EPS (diluted) $1,746 $0.91
Items of note Pre Tax
(MM) After Tax
(MM) EPS Segment
Revenue/ Expense
Line Item2
Amortization of intangibles1 $71 $62 $0.04 Corporate pg 9, line 10
Integration charges relating to the acquisition of the credit card portfolio of MBNA Canada
$72 $54 $0.03 CAD Retail pg 5, line 10
Excluding Items of Note above
Adjusted3 net income and EPS (diluted) $1,862 $0.98
1. Includes amortization of intangibles expense of $13MM, net of tax, for TD Ameritrade Holding Corporation. Amortization of software is recorded in amortization of intangibles; however, amortization of software is not included for purposes of items of
note, which only include amortization of intangibles acquired as a result of business combinations.
2. This column refers to specific pages of our Q4 2014 Supplementary Financial Information package, which is available on our website at td.com/investor.
3. Adjusted results are defined in footnote 1 on slide 3.
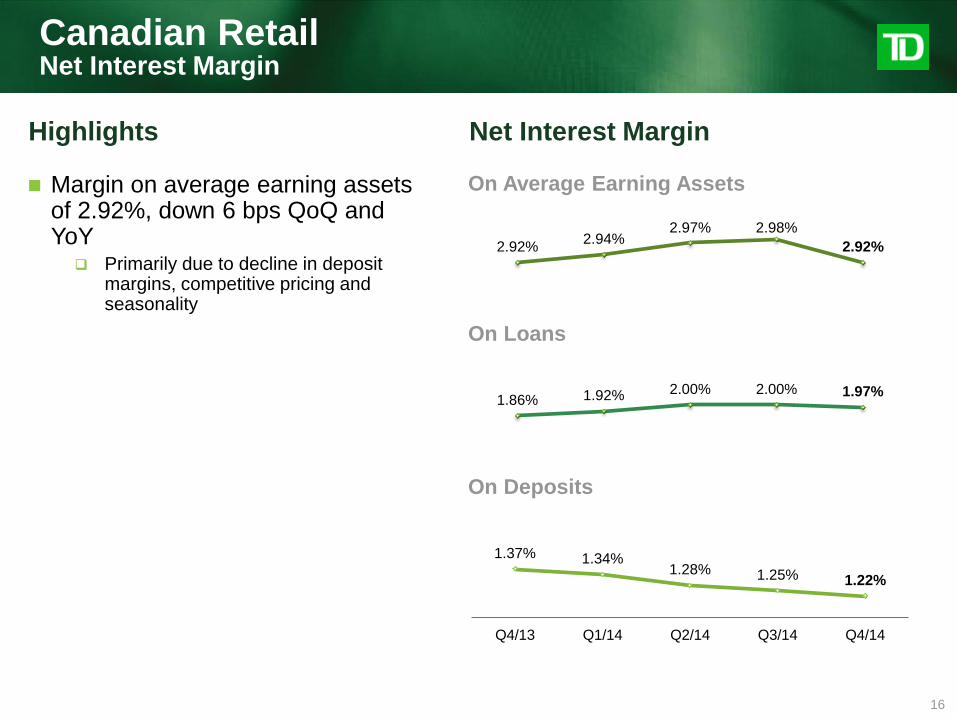
1.37% 1.34% 1.28% 1.25% 1.22%
Q4/13 Q1/14 Q2/14 Q3/14 Q4/14
On Average Earning Assets
On Loans
On Deposits
Highlights Net Interest Margin
Margin on average earning assets of 2.92%, down 6 bps QoQ and YoY
Primarily due to decline in deposit margins, competitive pricing and seasonality
1.86% 1.92% 2.00% 2.00% 1.97%
2.92% 2.94%
2.97% 2.98%
2.92%
Canadian Retail Net Interest Margin
16

17
Canadian Retail Deposit Growth
4%
Growth
YoY
Highlights Average Deposits $B
Average personal deposit volumes increased 2% YoY Chequing and savings accounts up
11%, partially offset by lower term deposits
Average business deposit volumes increased 7% YoY
153 154 154 155 157
76 77 76 78 81
17 17 17 17 18 246 248 247 250
255
Q4/13 Q1/14 Q2/14 Q3/14 Q4/14
Personal Business Wealth
18
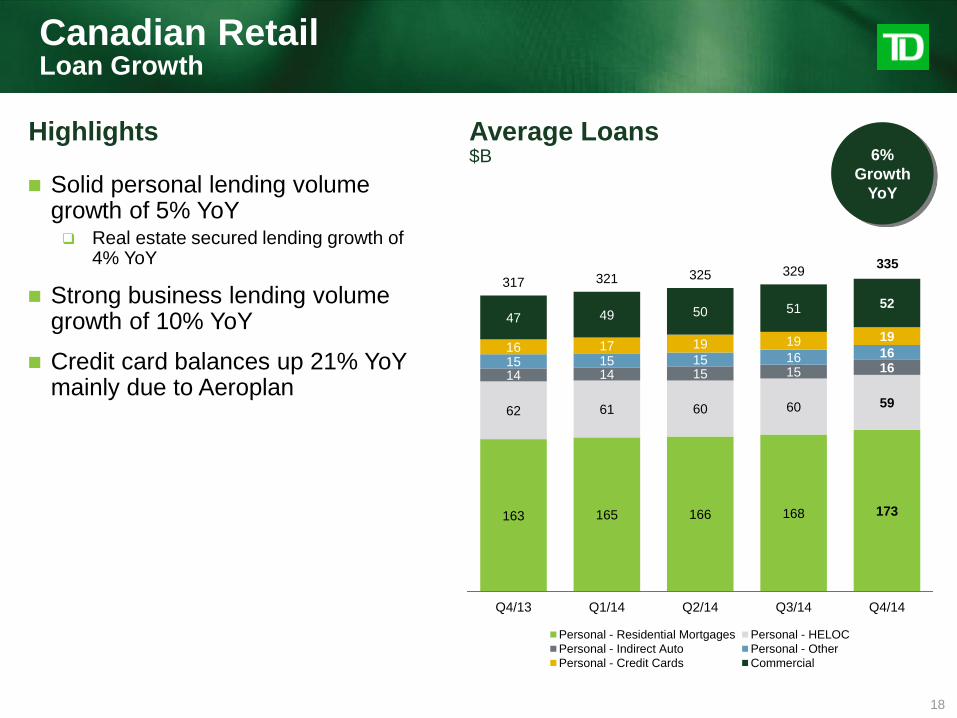
Canadian Retail Loan Growth
Highlights Average Loans $B
Solid personal lending volume growth of 5% YoY Real estate secured lending growth of
4% YoY
Strong business lending volume growth of 10% YoY
Credit card balances up 21% YoY mainly due to Aeroplan
6%
Growth
YoY
163 165 166 168 173
62 61 60 60 59
14 14 15 15 16 15 15 15 16 16 16 17 19 19 19
47 49 50 51 52
317 321 325 329 335
Q4/13 Q1/14 Q2/14 Q3/14 Q4/14
Personal - Residential Mortgages Personal - HELOC
Personal - Indirect Auto Personal - Other
Personal - Credit Cards Commercial

Canadian Retail Personal and Commercial Banking
19
2,151 2,196 2,177 2,285 2,280
680 723 729 739 755
2,831 2,919 2,906 3,024 3,035
Q4/13 Q1/14 Q2/14 Q3/14 Q4/14
Net Interest Income Non-interest Income
948
1,050 1,008
1,106
1,021
Q4/13 Q1/14 Q2/14 Q3/14 Q4/14
1. Adjusted results are defined in footnote 1 on slide 3. Q4 2014 expenses and net income exclude items of note disclosed on slide 6 and in the Bank’s Fourth Quarter 2014 Earnings News Release (td.com/investor). Reported Q4 2014 expenses and net
income were $1,469MM and $967MM, respectively.
8.3
14.9 15.4
18.7
0
5
10
15
20
25
2011 2012 2013 2014
1,316
1,260 1,295 1,292
1,396
Q4/13 Q1/14 Q2/14 Q3/14 Q4/14
Revenue $MM
Net Income, Adjusted1 $MM
Average Card Balances $B
Expenses, Adjusted1 $MM

20 1. Assets under administration. Effective the fourth quarter of 2014, includes $8 billion related to purchase of the remaining stake in NatWest Stockbrokers Limited by the Bank.
2. Assets under management. Certain comparative amounts have been restated to conform with the presentation adopted in the current period.
503 527 536 579 599
136 135 138 131 122
115 116 112 115 116
754 778 786 825 837
Q4/13 Q1/14 Q2/14 Q3/14 Q4/14
Wealth Fee & Other Wealth Transaction Wealth NII
Revenue $MM
Canadian Retail Wealth
98
101
108
113 115
104
110 111
114 112
Q4/13 Q1/14 Q2/14 Q3/14 Q4/14
Retail Institutional
182
198
192
205 201
Q4/13 Q1/14 Q2/14 Q3/14 Q4/14
285
264 278
285 293
202 211
219 227 227
Q4/13 Q1/14 Q2/14 Q3/14 Q4/14
AUA AUM
AUA1 and AUM2 $B
Net Income $MM
Retail vs. Institutional AUM2 $B

21
Canadian Retail Insurance
141 92 149 132 136
Q4/13 Q1/14 Q2/14 Q3/14 Q4/14
993
839
950
1,078 1,026
Q4/13 Q1/14 Q2/14 Q3/14 Q4/14
711 683 659771 720
Q4/13 Q1/14 Q2/14 Q3/14 Q4/14
Insurance Claims and Related Expenses $MM
1,012932
986
1,0851,048
Q4/13 Q1/14 Q2/14 Q3/14 Q4/14
Revenue $MM
Gross Originated Insurance
Premiums $MM
Net Income $MM
22
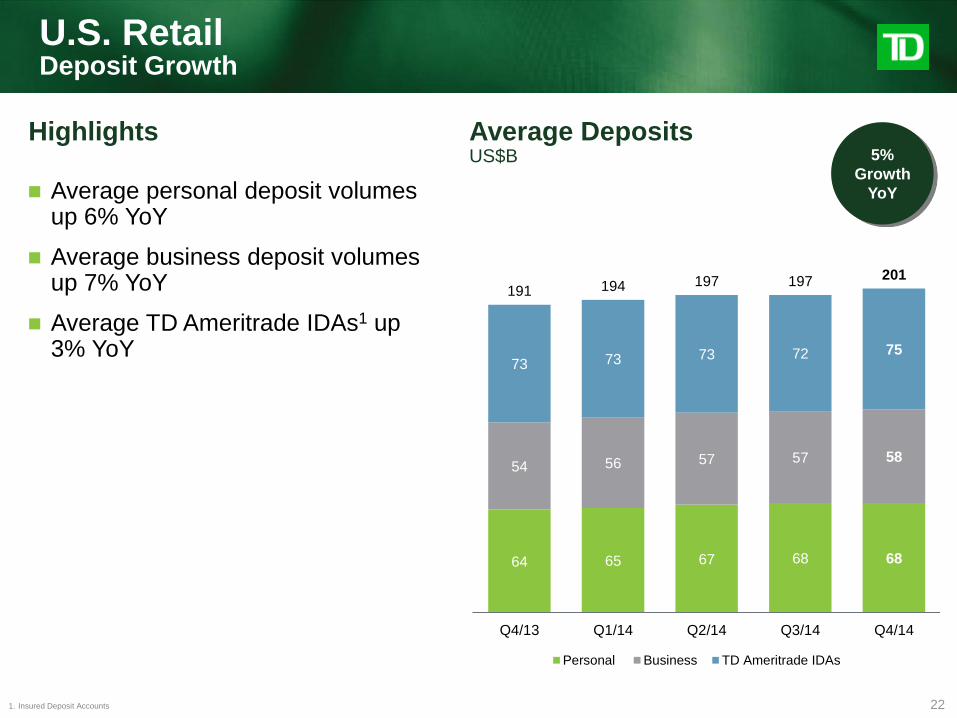
U.S. Retail Deposit Growth
Highlights Average Deposits US$B
Average personal deposit volumes up 6% YoY
Average business deposit volumes up 7% YoY
Average TD Ameritrade IDAs1 up 3% YoY
5%
Growth
YoY
64 65 67 68 68
54 56 57 57 58
73 73 73 72 75
191 194 197 197 201
Q4/13 Q1/14 Q2/14 Q3/14 Q4/14
Personal Business TD Ameritrade IDAs
1. Insured Deposit Accounts

23
U.S. Retail Loan Growth
Highlights Average Loans US$B
Average personal loans increased 3% YoY
Average business loans increased 14% YoY
8%
Growth
YoY
54 54 54 55 56
51 53 54 56 58
105 107 108 111
114
Q4/13 Q1/14 Q2/14 Q3/14 Q4/14
Personal Commercial

24
TD Ameritrade
1. TD’s share of net income in US$ is the corresponding C$ net income contribution of TD Ameritrade to the U.S. Retail segment included in the Bank’s reports to shareholders (td.com/investor) for the relevant quarters, divided by the average FX
rate. For additional information, please see TD Ameritrade’s press release available at http://www.amtd.com/newsroom/default.aspx
Highlights TD Bank Group’s Share of TD Ameritrade’s Net Income1 US$MM TD’s share of TD Ameritrade’s net
income was C$83 million in Q4/14, up 8% YoY mainly due to: Increased earnings in TD Ameritrade and
FX translation, partially offset by reduced ownership in TD Ameritrade
$73
$65 $70 $69
$77
$77 $68 $78 $76 $83
Q4/13 Q1/13 Q2/14 Q3/14 Q4/14
TD Ameritrade Results
Net income US$211 million in Q4/14 up 6% from last year
Average trades per day were 403,000, up 5% YoY
Total clients assets rose to US$653 billion, up 17% YoY
C$MM
25
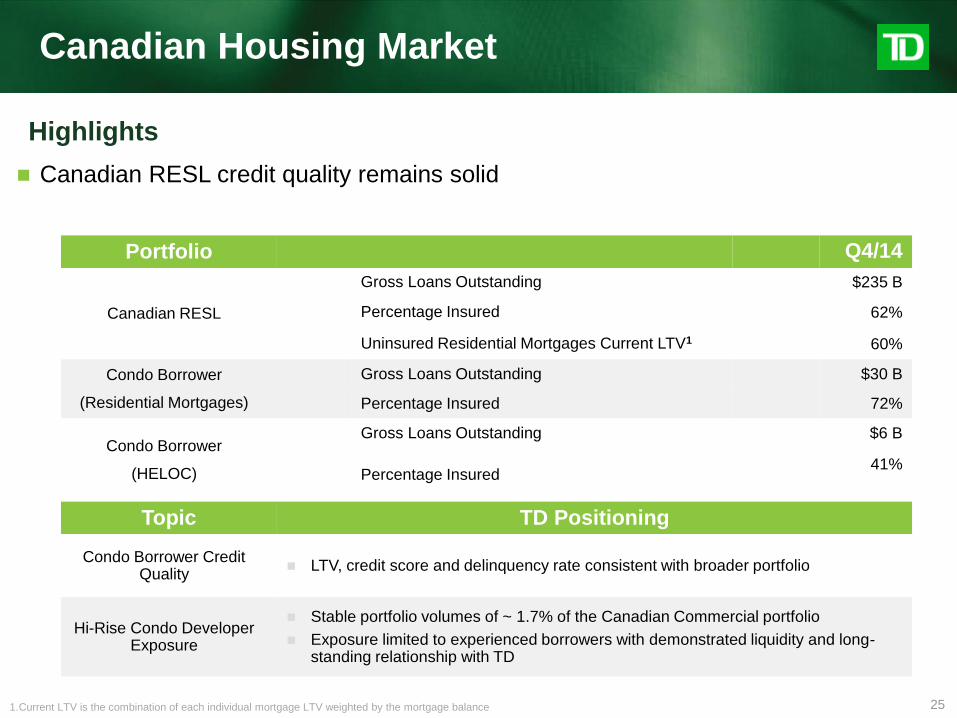
Canadian Housing Market
Portfolio Q4/14
Canadian RESL
Gross Loans Outstanding $235 B
Percentage Insured 62%
Uninsured Residential Mortgages Current LTV1 60%
Condo Borrower
(Residential Mortgages)
Gross Loans Outstanding $30 B
Percentage Insured 72%
Condo Borrower
(HELOC)
Gross Loans Outstanding $6 B
Percentage Insured 41%
Topic TD Positioning
Condo Borrower Credit Quality
LTV, credit score and delinquency rate consistent with broader portfolio
Hi-Rise Condo Developer Exposure
Stable portfolio volumes of ~ 1.7% of the Canadian Commercial portfolio
Exposure limited to experienced borrowers with demonstrated liquidity and long-standing relationship with TD
Canadian RESL credit quality remains solid
Highlights
1.Current LTV is the combination of each individual mortgage LTV weighted by the mortgage balance

26
1. U.S. HELOC includes Home Equity Lines of Credit and Home Equity Loans
2. Wholesale portfolio includes corporate lending and other Wholesale gross loans and acceptances
3. Other includes Acquired Credit-Impaired Loans and Corporate Segment Loans.
Note: Some amounts may not total due to rounding
Excludes Debt securities classified as loans
Balances (C$B unless otherwise noted)
Q3/14 Q4/14
Canadian Retail Portfolio $ 332.5 $ 337.9
Personal $ 280.2 $ 285.0
Residential Mortgages 170.9 175.3
Home Equity Lines of Credit (HELOC) 59.8 59.4
Indirect Auto 15.7 16.5
Unsecured Lines of Credit 8.6 9.1
Credit Cards 18.2 17.9
Other Personal 7.0 6.8
Commercial Banking (including Small Business Banking) $ 52.3 $ 52.9
U.S. Retail Portfolio (all amounts in US$) US$ 110.6 US$ 113.5
Personal US$ 54.5 US$ 55.0
Residential Mortgages 20.5 20.7
Home Equity Lines of Credit (HELOC)1 10.4 10.4
Indirect Auto 16.3 16.7
Credit Cards 6.8 6.7
Other Personal 0.5 0.5
Commercial Banking US$ 56.1 US$ 58.5
Non-residential Real Estate 12.4 12.3
Residential Real Estate 3.5 3.7
Commercial & Industrial (C&I) 40.2 42.5
FX on U.S. Personal & Commercial Portfolio $ 9.9 $ 14.4
U.S. Retail Portfolio (C$) $ 120.5 $ 127.9
Wholesale Portfolio2 $ 24.0 $ 26.1
Other3 $ 1.8 $ 0.4
Total $ 478.8 $ 492.3
Gross Lending Portfolio Includes B/As

27
Gross Impaired Loan Formations By Portfolio
GIL Formations1: $MM and Ratios2
1. Gross Impaired Loan formations represent additions to Impaired Loans & Acceptances during the quarter; excludes the impact of acquired credit-impaired loans and debt securities classified as loans
2. GIL Formations Ratio – Gross Impaired Loan Formations/Average Gross Loans & Acceptances
3. Other includes Acquired Credit-Impaired Loans and Corporate Segment Loans.
4. Average of Canadian Peers – BMO, BNS, CIBC, RBC; peer data includes debt securities classified as loans
5. Average of US Peers – BAC, C, JPM, USB, WFC (Non-Accrual Asset addition/Average Gross Loans)
NA: Not available
$712 / 23 bps $757 / 24 bps $722 / 22 bps $695 / 21 bps $711 / 21 bps
$476 / 45 bps $476 / 42 bps
$403 / 34 bps $397 / 33 bps
$452 / 36 bps
$22 / 11 bps
Q4/13 Q1/14 Q2/14 Q3/14 Q4/14
Canadian Retail Portfolio
U.S. Retail Portfolio
Wholesale Portfolio
Other3 27 27 24 23 24 bps
Cdn Peers4 20 16 15 14 NA bps
U.S. Peers5 29 26 25 22 NA bps
$1,210 $1,233
$1,125 $1,163
Highlights
GIL formations remain at
satisfactory levels and are
stable over 2013 $1,092
28
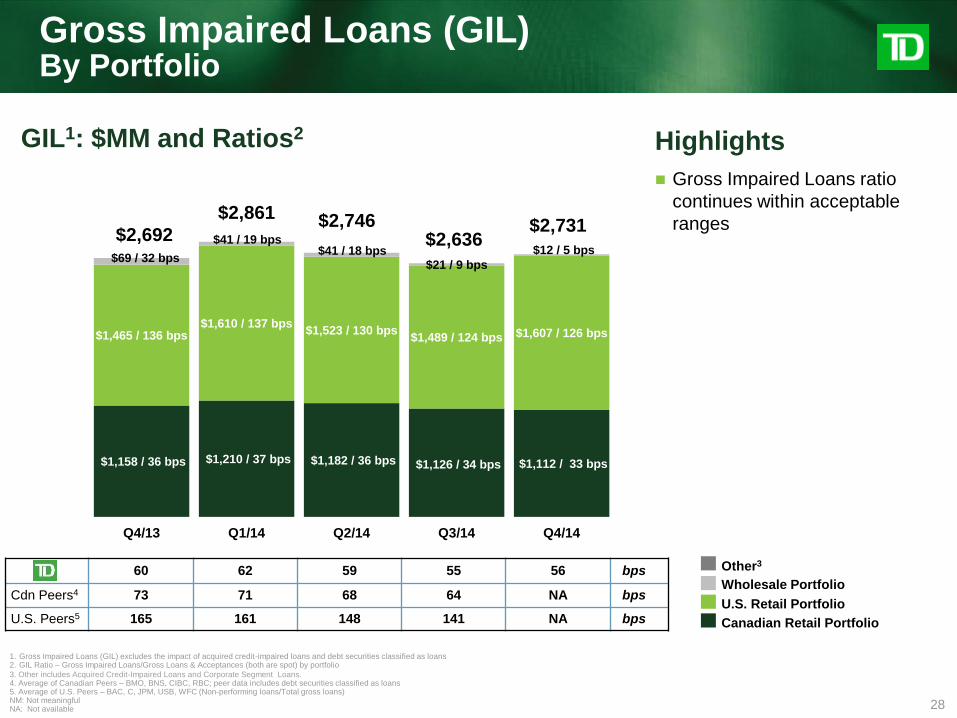
1. Gross Impaired Loans (GIL) excludes the impact of acquired credit-impaired loans and debt securities classified as loans 2. GIL Ratio – Gross Impaired Loans/Gross Loans & Acceptances (both are spot) by portfolio
3. Other includes Acquired Credit-Impaired Loans and Corporate Segment Loans. 4. Average of Canadian Peers – BMO, BNS, CIBC, RBC; peer data includes debt securities classified as loans 5. Average of U.S. Peers – BAC, C, JPM, USB, WFC (Non-performing loans/Total gross loans) NM: Not meaningful NA: Not available
GIL1: $MM and Ratios2
$1,158 / 36 bps $1,210 / 37 bps $1,182 / 36 bps $1,126 / 34 bps $1,112 / 33 bps
$1,465 / 136 bps $1,610 / 137 bps
$1,523 / 130 bps $1,489 / 124 bps $1,607 / 126 bps
$69 / 32 bps
$41 / 19 bps $41 / 18 bps
$21 / 9 bps
$12 / 5 bps
Q4/13 Q1/14 Q2/14 Q3/14 Q4/14
60 62 59 55 56 bps
Cdn Peers4 73 71 68 64 NA bps
U.S. Peers5 165 161 148 141 NA bps Canadian Retail Portfolio
U.S. Retail Portfolio
Wholesale Portfolio
Other3
$2,692
$2,861 $2,746 $2,731
Highlights
Gross Impaired Loans ratio
continues within acceptable
ranges
Gross Impaired Loans (GIL) By Portfolio
$2,636

29
$222 / 28 bps $228 / 28 bps $238 / 30 bps $227 / 27 bps $250 / 30 bps
$197 / 75 bps $236 / 84 bps
$174/ 62 bps
$119 / 40 bps
$164 / 53 bps
$ 1 / 2 bps
$ (7)/ NM $(20) / NM $(20)/ NM $(15) / NM
$ (3) / NM
$3 / NM
$3 / NM
$(2) / NM
Q4/13 Q1/14 Q2/14 Q3/14 Q4/14
PCL1: $MM and Ratios2
1. PCL excludes the impact of acquired credit-impaired loans, debt securities classified as loans and items of note. 2. PCL Ratio – Provision for Credit Losses on a quarterly annualized basis/Average Net Loans & Acceptances
3. Other includes Acquired Credit-Impaired Loans and Corporate Segment Loans. 4. Wholesale PCL excludes premiums on credit default swaps (CDS): Q3/14 $(2)MM / Q2/14 $(2)MM. 5. Average of Canadian Peers – BMO, BNS, CIBC, RBC; peer PCLs exclude increases in incurred but not identified allowance; peer data includes debt securities classified as loans 6. Average of U.S. Peers – BAC, C, JPM, USB, WFC NM: Not meaningful; NA: Not available
1 38 40 35 28 33 bps
Cdn Peers5 31 27 28 27 NA bps
U.S. Peers6 41 55 44 47 NA bps Canadian Retail Portfolio
U.S. Retail Portfolio
Wholesale Portfolio4
Other3
$420 $454
$395 $397
Highlights
PCL remains at low levels
Full year PCL rate was 34 bps, a
4 bps reduction over 2013
Provision for Credit Losses (PCL) By Portfolio
$329

5 (68%)
24 (57%)
69 (61%)
33 (67%)
15 (68%) 2 (32%)
19 (43%)
45 (39%)
16 (33%)
7 (32%)
ATLANTICPROVINCES
BRITISHCOLUMBIA
ONTARIO PRAIRIES QUEBEC
Uninsured
Insured
30
Real Estate Secured Lending Portfolio ($B) Geographic and Insured/Uninsured Distribution3
Q4/144 69 56 59 64 66
Q3/144 68 57 60 64 65
$7
$43
$114
$49
$22
Highlights
Credit quality remains strong in
the Canadian Personal portfolio
Canadian Personal Banking
Uninsured Mortgage Loan to Value (%)3
PCL2
($MM)
GIL
($MM)
38 39 0.24% 16 Indirect Auto
Q4/14
Canadian Personal Banking1 Gross Loans
($B)
GIL/ Loans
Residential Mortgages 175 0.25% 441 4
Home Equity Lines of Credit (HELOC) 60 0.45% 268 3
Unsecured Lines of Credit 9 0.50% 45 27
Credit Cards 18 0.95% 171 118
Other Personal 7 0.26% 18 15
Total Canadian Personal Banking $285 0.34% $982 $205
Change vs. Q3/14 $5 (0.01%) ($2) $10
1. Excludes acquired credit impaired loans
2. Individually insignificant PCL excludes any change in Incurred But Not Identified Allowance
3. The territories are included as follows: Yukon is included in British Columbia; Nunavut is included in Ontario; and Northwest Territories is included in the Prairies region.
4. Loan To Value based on Seasonally Adjusted Average Price by Major City (Canadian Real Estate Association) and is the combination of each individual mortgage LTV weighted by the mortgage balance consistent with peer reporting
31
1. Individually Insignificant and Counterparty Specific PCL and Allowance excludes any change in Incurred But Not Identified Allowance
2. Includes Small Business Banking
3. Resources includes: Forestry, Metals and Mining; Pipelines, Oil and Gas
4. Consumer includes: Food, Beverage and Tobacco; Retail Sector
5. Industrial/Manufacturing includes: Industrial Construction and Trade Contractors; Sundry Manufacturing and Wholesale
6. Other includes: Power and Utilities; Telecommunications, Cable and Media; Transportation; Professional and Other Services; Other
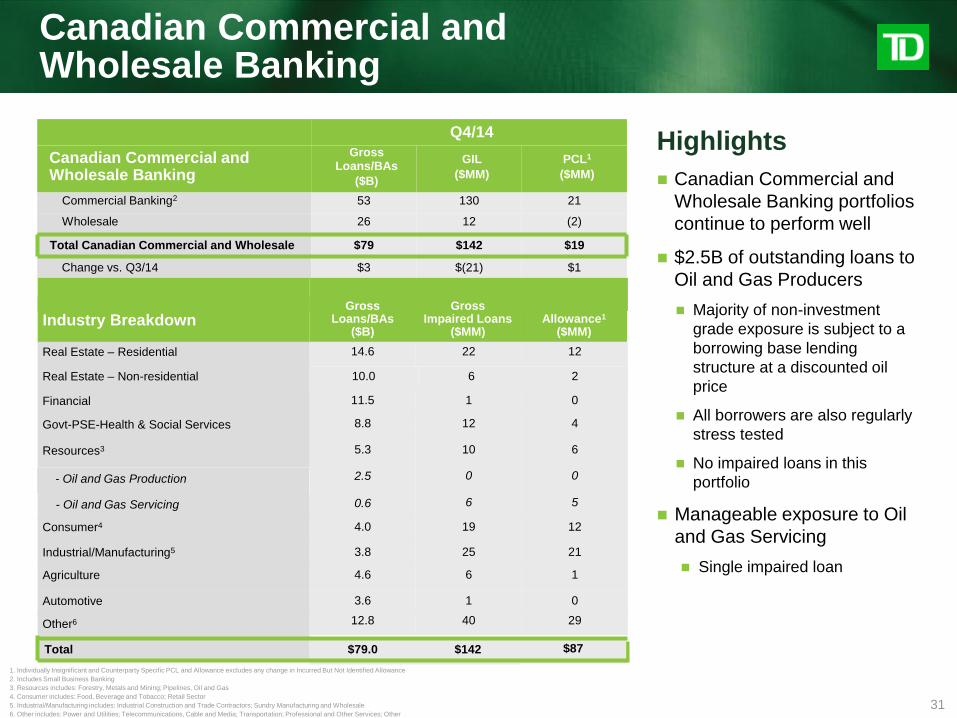
$19
Q4/14
Canadian Commercial and Wholesale Banking
Gross Loans/BAs
($B)
GIL
($MM)
PCL1
($MM)
Commercial Banking2 53 130 21
Wholesale 26 12 (2)
Total Canadian Commercial and Wholesale $79 $142
Change vs. Q3/14 $3 $(21) $1
Industry Breakdown Gross
Loans/BAs ($B)
Gross Impaired Loans
($MM) Allowance1
($MM)
Real Estate – Residential 14.6 22 12
Real Estate – Non-residential
11.5 1 0 Financial
8.8 12 4 Govt-PSE-Health & Social Services
5.3 10 6 Resources3
2.5 0 0
Consumer4 4.0 19 12
Industrial/Manufacturing5 3.8 25 21
Agriculture 4.6 6 1
Automotive 3.6 1 0
Other6 12.8 40 29
Total $79.0 $142 $87
Highlights
Canadian Commercial and
Wholesale Banking portfolios
continue to perform well
$2.5B of outstanding loans to
Oil and Gas Producers
Majority of non-investment
grade exposure is subject to a
borrowing base lending
structure at a discounted oil
price
All borrowers are also regularly
stress tested
No impaired loans in this
portfolio
Manageable exposure to Oil
and Gas Servicing
Single impaired loan
Canadian Commercial and Wholesale Banking
- Oil and Gas Servicing
- Oil and Gas Production
10.0 6 2
0.6 6 5
32
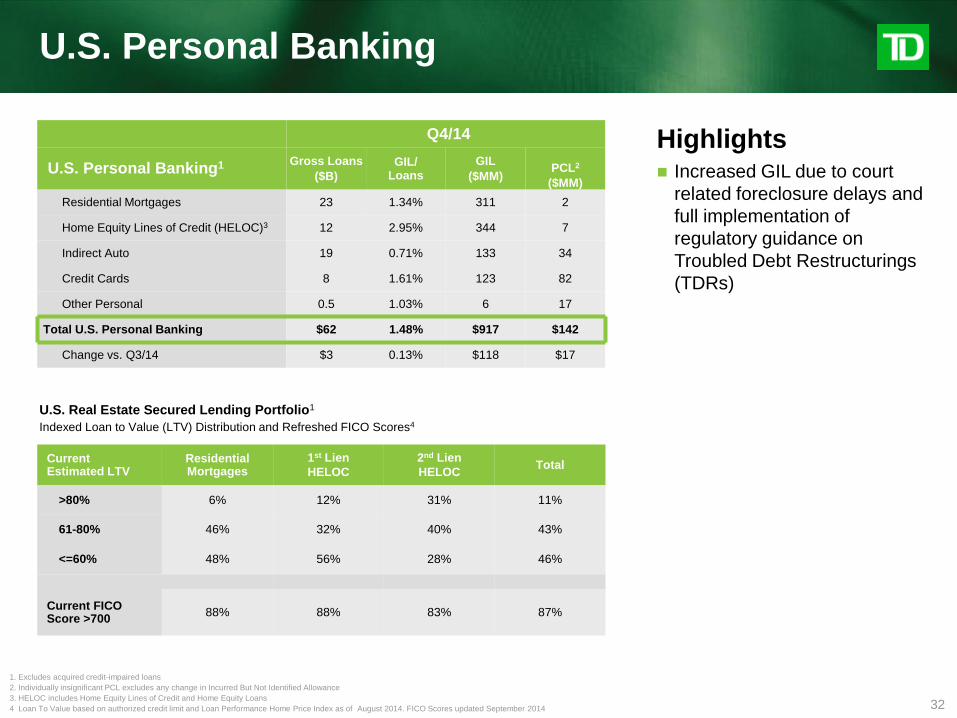
U.S. Real Estate Secured Lending Portfolio1
Indexed Loan to Value (LTV) Distribution and Refreshed FICO Scores4
Current Estimated LTV
Residential Mortgages
1st Lien
HELOC
2nd Lien
HELOC Total
>80% 6% 12% 31% 11%
61-80% 46% 32% 40% 43%
<=60% 48% 56% 28% 46%
Current FICO Score >700
88% 88% 83% 87%
Highlights Increased GIL due to court
related foreclosure delays and
full implementation of
regulatory guidance on
Troubled Debt Restructurings
(TDRs)
U.S. Personal Banking
Q4/14
U.S. Personal Banking1 Gross Loans
($B)
GIL/ Loans
GIL
($MM)
PCL2
($MM)
Residential Mortgages 23 1.34% 311 2
Home Equity Lines of Credit (HELOC)3 12 2.95% 344 7
Indirect Auto 19 0.71% 133 34
Credit Cards 8 1.61% 123 82
Other Personal 0.5 1.03% 6 17
Total U.S. Personal Banking $62 1.48% $917 $142
Change vs. Q3/14 $3 0.13% $118 $17
1. Excludes acquired credit-impaired loans
2. Individually insignificant PCL excludes any change in Incurred But Not Identified Allowance
3. HELOC includes Home Equity Lines of Credit and Home Equity Loans
4 Loan To Value based on authorized credit limit and Loan Performance Home Price Index as of August 2014. FICO Scores updated September 2014

33
1. Excludes acquired credit-impaired loans and debt securities classified as loans
2. Individually Insignificant and Counterparty Specific PCL and Allowance excludes any change in Incurred But Not Identified Allowance
3. Consumer includes: Food, beverage and tobacco; Retail sector
4. Industrial/Manufacturing includes: Industrial construction and trade contractors; Sundry manufacturing and wholesale
5. Other includes: Agriculture; Power and utilities; Telecommunications, cable and media; Transportation; Resources; Other
Total CRE $18 $253
Commercial Real
Estate Gross
Loans/BAs ($B)
GIL ($MM)
Office 4.8 54
Retail 3.9 36
Apartments 3.3 36
Residential for Sale 0.3 38
Industrial 1.4 26
Hotel 0.9 30
Commercial Land 0.1 11
Other 3.4 22
Total C&I $48 $437
Commercial &
Industrial Gross
Loans/BAs ($B)
GIL ($MM)
Health & Social Services 7.4 54
Professional &Other Services
6.1 93
Consumer3 5.1 99
Industrial/Mfg4 5.5 77
Government/PSE 6.4 17
Financial 2.7 27
Automotive 2.3 15
Other5 12.4 55
Highlights
Sustained portfolio quality in
U.S. Commercial Banking
Return to normal PCL levels after
significant recoveries in Q3/14
No exposure to Oil and Gas
U.S. Commercial Banking
$8
$21
8 437 48 Commercial & Industrial (C&I)
Q4/14
U.S. Commercial Banking1 Gross
Loans/BAs
($B)
GIL
($MM)
PCL2
($MM)
Commercial Real Estate (CRE) 18 253 0
Non-residential Real Estate 14 168 (1)
Residential Real Estate 4 85 1
Total U.S. Commercial Banking $66 $690
Change vs. Q3/14 $5 $0

34
Investor Relations Contacts
Phone: 416-308-9030
or 1-866-486-4826
Email: [email protected]
Website:
www.td.com/investor
Grand Prix for Best Overall Investor Relations: Large Cap
Best Investor Relations by
Sector: Financial Services
Best Investor Relations by a CEO: Large Cap
Best Investor Relations
by a CFO: Large Cap
Best Financial Reporting
TD Bank Group Quarterly Results Presentation
Q4 2014
Thursday December 4th, 2014