Embed Size (px)
Citation preview
TCS GroupQ1 2014 IFRS results
Disclaimer
Certain statements and/or other information included in this document may not be historical facts and may constitute “forward looking
statements” within the meaning of Section 27A of the U.S. Securities Act and Section 2(1)(e) of the U.S. Securities Exchange Act of 1934,
as amended. The words “believe”, “expect”, “anticipate”, “intend”, “estimate”, “plans”, “forecast”, “project”, “will”, “may”, “should” and
similar expressions may identify forward looking statements but are not the exclusive means of identifying such statements. Forward looking
statements include statements concerning our plans, expectations, projections, objectives, targets, goals, strategies, future events, future
revenues, operations or performance, capital expenditures, financing needs, our plans or intentions relating to the expansion or contraction
of our business as well as specific acquisitions and dispositions, our competitive strengths and weaknesses, our plans or goals relating to
forecasted production, reserves, financial position and future operations and development, our business strategy and the trends we
anticipate in the industry and the political, economic, social and legal environment in which we operate, and other information that is not
historical information, together with the assumptions underlying these forward looking statements. By their very nature, forward looking
statements involve inherent risks, uncertainties and other important factors that could cause our actual results, performance or
achievements to be materially different from results, performance or achievements expressed or implied by such forward-looking
statements. Such forward-looking statements are based on numerous assumptions regarding our present and future business strategies and
the political, economic, social and legal environment in which we will operate in the future. We do not make any representation, warranty or
prediction that the results anticipated by such forward-looking statements will be achieved, and such forward-looking statements represent,
in each case, only one of many possible scenarios and should not be viewed as the most likely or standard scenario. We expressly disclaim
any obligation or undertaking to update any forward-looking statements to reflect actual results, changes in assumptions or in any other
factors affecting such statements.
09.06.2014 TCS Group: Q1 2014 IFRS results 2
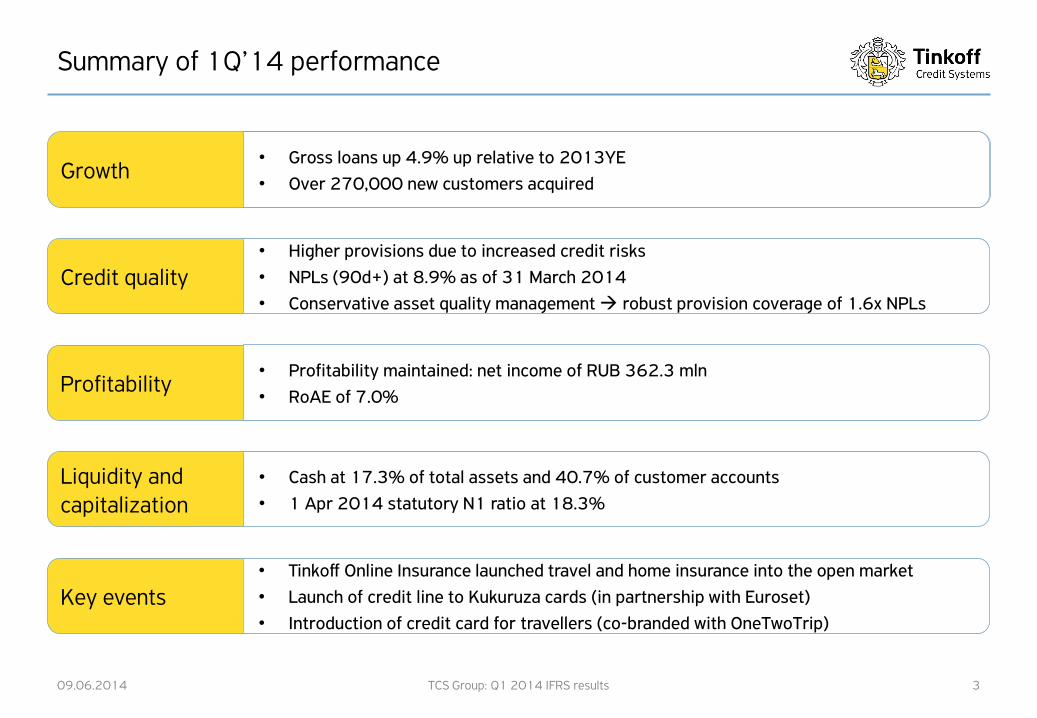
Summary of 1Q’14 performance
09.06.2014 TCS Group: Q1 2014 IFRS results 3
Credit quality• Higher provisions due to increased credit risks
• NPLs (90d+) at 8.9% as of 31 March 2014
• Conservative asset quality management robust provision coverage of 1.6x NPLs
Growth• Gross loans up 4.9% up relative to 2013YE
• Over 270,000 new customers acquired
Profitability• Profitability maintained: net income of RUB 362.3 mln
• RoAE of 7.0%
Liquidity and capitalization
• Cash at 17.3% of total assets and 40.7% of customer accounts
• 1 Apr 2014 statutory N1 ratio at 18.3%
Key events• Tinkoff Online Insurance launched travel and home insurance into the open market
• Launch of credit line to Kukuruza cards (in partnership with Euroset)
• Introduction of credit card for travellers (co-branded with OneTwoTrip)
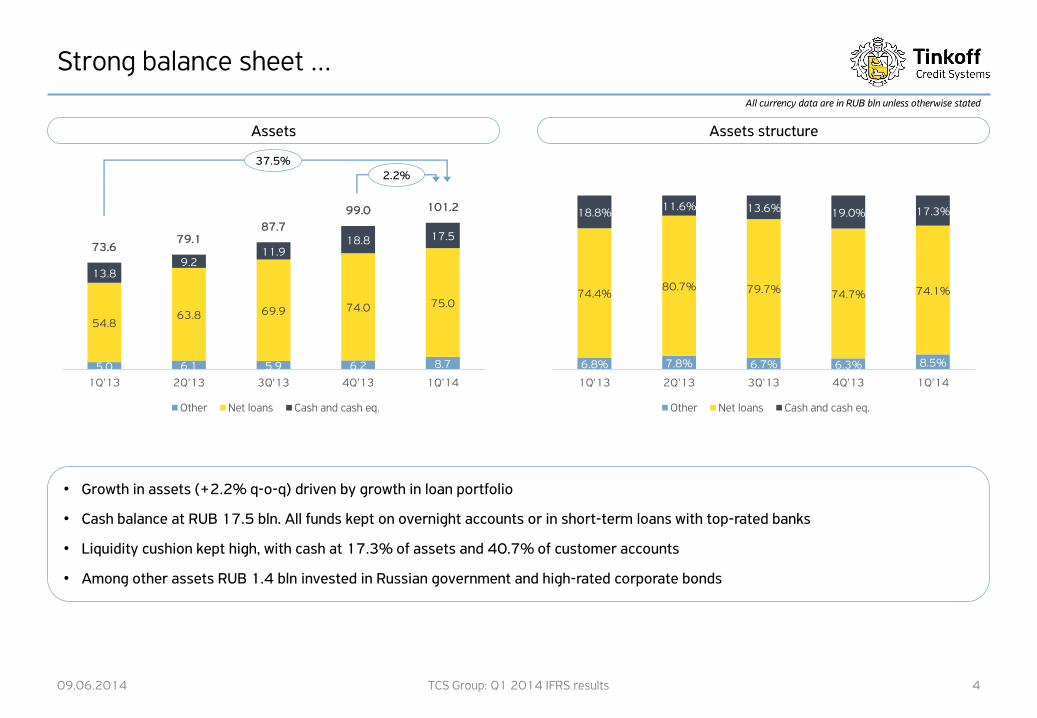
5.0 6.1 5.9 6.2 8.7
54.863.8 69.9 74.0 75.0
13.89.2
11.918.8 17.5
73.679.1
87.7
99.0 101.2
1Q'13 2Q'13 3Q'13 4Q'13 1Q'14
Other Net loans Cash and cash eq.
Strong balance sheet …
09.06.2014 TCS Group: Q1 2014 IFRS results 4
Assets Assets structure
37.5%2.2%
• Growth in assets (+2.2% q-o-q) driven by growth in loan portfolio
• Cash balance at RUB 17.5 bln. All funds kept on overnight accounts or in short-term loans with top-rated banks
• Liquidity cushion kept high, with cash at 17.3% of assets and 40.7% of customer accounts
• Among other assets RUB 1.4 bln invested in Russian government and high-rated corporate bonds
All currency data are in RUB bln unless otherwise stated
6.8% 7.8% 6.7% 6.3% 8.5%
74.4%80.7% 79.7% 74.7% 74.1%
18.8%11.6% 13.6% 19.0% 17.3%
1Q'13 2Q'13 3Q'13 4Q'13 1Q'14
Other Net loans Cash and cash eq.

54.863.8 69.9 74.0 75.0
6.1
7.18.0
9.4 12.5
60.9
70.977.9
83.487.5
1Q'13 2Q'13 3Q'13 4Q'13 1Q'14
Net loans LLP
… with moderate portfolio growth and conservative asset quality management
09.06.2014 TCS Group: Q1 2014 IFRS results 5
Gross loans Conservative credit risk policy
43.7%4.9%
• 44% growth in gross loans on year-on-year basis
• Increase in LLP is attributable to the growth in gross loans, change in channel mix towards riskier online channels and revised approach
to sale of NPL portfolios (more kept on balance sheet)
• Robust loan loss provision coverage at 1.6x
All currency data are in RUB bln unless otherwise stated
4.1% 3.9% 4.2% 4.3%6.0%
1.6% 2.1% 2.1% 2.7%
2.9%5.7% 6.0% 6.3%7.0%
8.9%
177%165% 163% 161% 160%
1Q'13 2Q'13 3Q'13 4Q'13 1Q'14
NPL ratio (w/o courts) NPL ratio (courts) LLP/NPL (incl. courts)
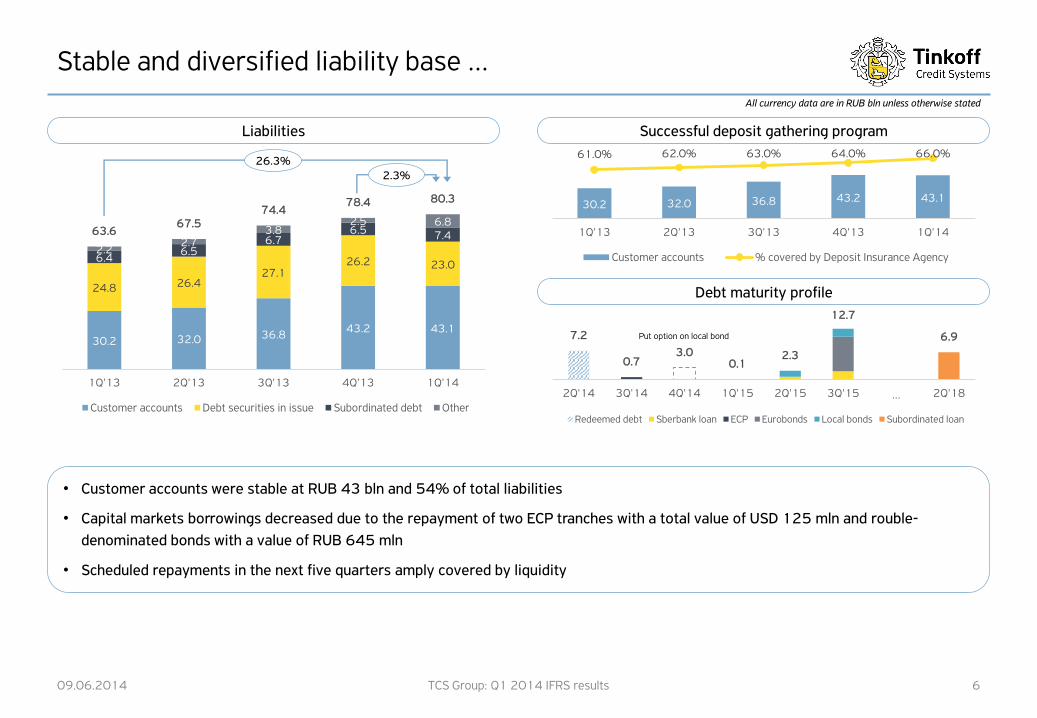
7.2
0.73.0
0.12.3
12.7
6.9
2Q'14 3Q'14 4Q'14 1Q'15 2Q'15 3Q'15 … 2Q'18
Redeemed debt Sberbank loan ECP Eurobonds Local bonds Subordinated loan
30.2 32.0 36.8 43.2 43.1
61.0% 62.0% 63.0% 64.0% 66.0%
1Q'13 2Q'13 3Q'13 4Q'13 1Q'14
Customer accounts % covered by Deposit Insurance Agency
30.2 32.0 36.843.2 43.1
24.8 26.427.1
26.2 23.06.4
6.56.7
6.5 7.42.2
2.73.8
2.5 6.863.6
67.574.4
78.4 80.3
1Q'13 2Q'13 3Q'13 4Q'13 1Q'14
Customer accounts Debt securities in issue Subordinated debt Other
Stable and diversified liability base …
09.06.2014 TCS Group: Q1 2014 IFRS results 6
Liabilities
26.3%2.3%
• Customer accounts were stable at RUB 43 bln and 54% of total liabilities
• Capital markets borrowings decreased due to the repayment of two ECP tranches with a total value of USD 125 mln and rouble-
denominated bonds with a value of RUB 645 mln
• Scheduled repayments in the next five quarters amply covered by liquidity
Successful deposit gathering program
Debt maturity profile
All currency data are in RUB bln unless otherwise stated
Put option on local bond
10.111.6
13.2
20.6 20.9
1Q'13 2Q'13 3Q'13 4Q'13 1Q'14
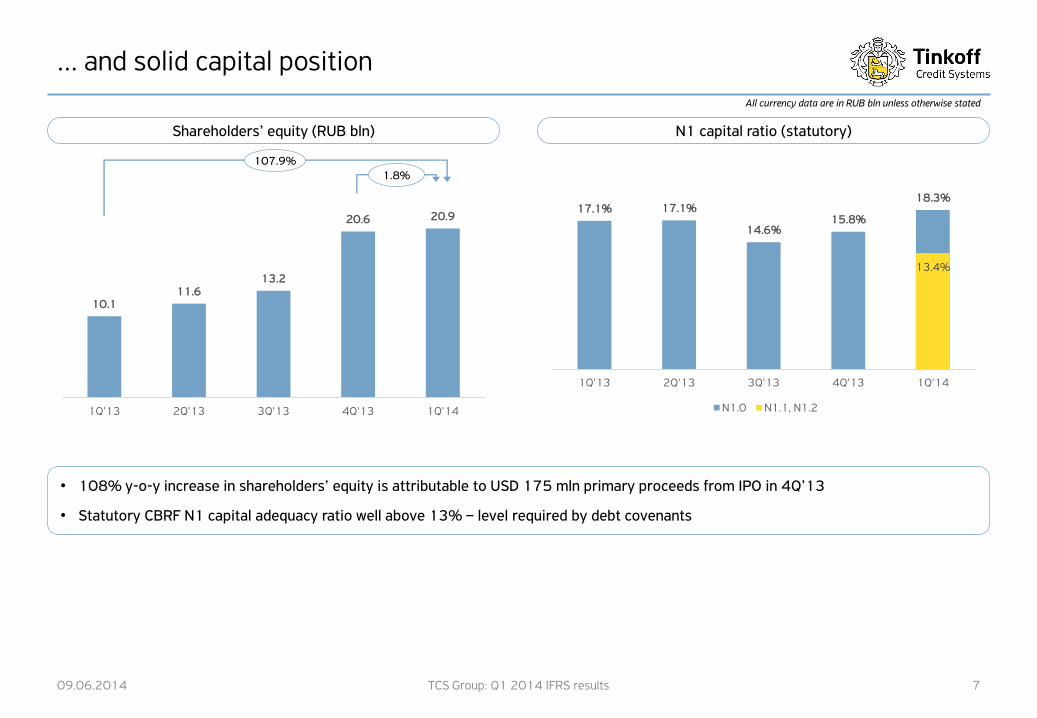
… and solid capital position
09.06.2014 TCS Group: Q1 2014 IFRS results 7
Shareholders’ equity (RUB bln) N1 capital ratio (statutory)
107.9%1.8%
• 108% y-o-y increase in shareholders’ equity is attributable to USD 175 mln primary proceeds from IPO in 4Q’13
• Statutory CBRF N1 capital adequacy ratio well above 13% – level required by debt covenants
All currency data are in RUB bln unless otherwise stated
17.1% 17.1%
14.6%15.8%
18.3%
13.4%
1Q'13 2Q'13 3Q'13 4Q'13 1Q'14
N1.0 N1.1, N1.2
51.6%53.8%
48.9% 48.6%45.3%
1Q'13 2Q'13 3Q'13 4Q'13 1Q'14
12.4%13.2%
11.6%12.3%
11.6%
1Q'13 2Q'13 3Q'13 4Q'13 1Q'14
1.8 2.1 2.0 2.3 2.2
1Q'13 2Q'13 3Q'13 4Q'13 1Q'14
7.3 8.9 9.1 9.8 9.7
1Q'13 2Q'13 3Q'13 4Q'13 1Q'14
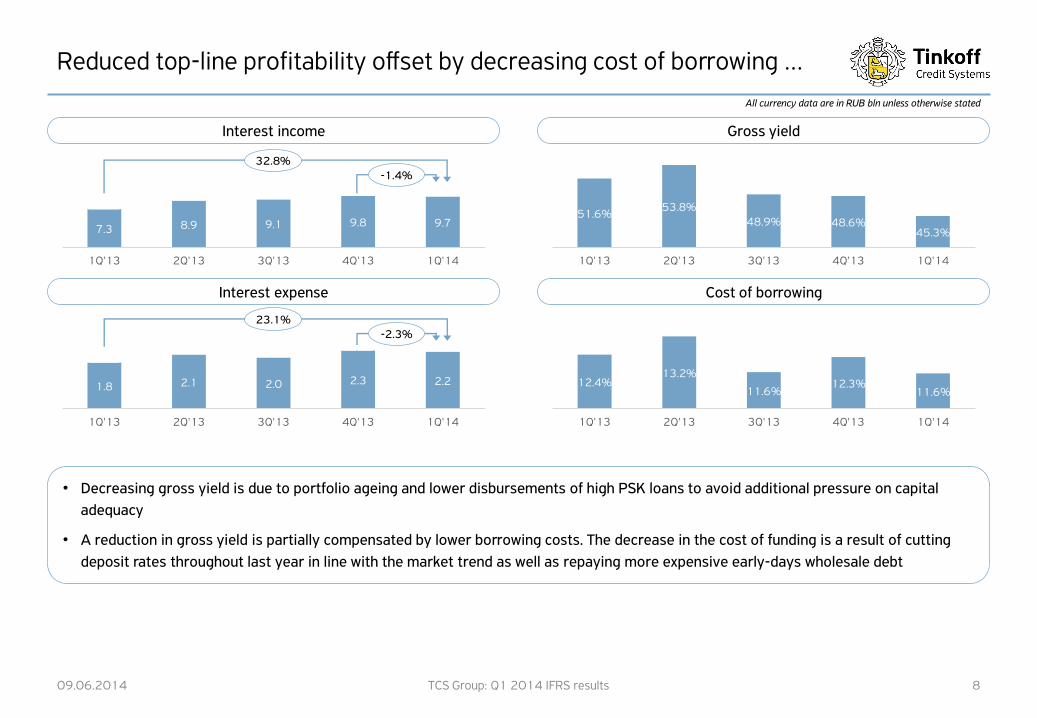
Reduced top-line profitability offset by decreasing cost of borrowing …
09.06.2014 TCS Group: Q1 2014 IFRS results 8
Cost of borrowing
Gross yield
Interest expense
Interest income
• Decreasing gross yield is due to portfolio ageing and lower disbursements of high PSK loans to avoid additional pressure on capital
adequacy
• A reduction in gross yield is partially compensated by lower borrowing costs. The decrease in the cost of funding is a result of cutting
deposit rates throughout last year in line with the market trend as well as repaying more expensive early-days wholesale debt
All currency data are in RUB bln unless otherwise stated
32.8%-1.4%
23.1%-2.3%
5.5
6.87.1
7.5 7.4
1Q'13 2Q'13 3Q'13 4Q'13 1Q'14
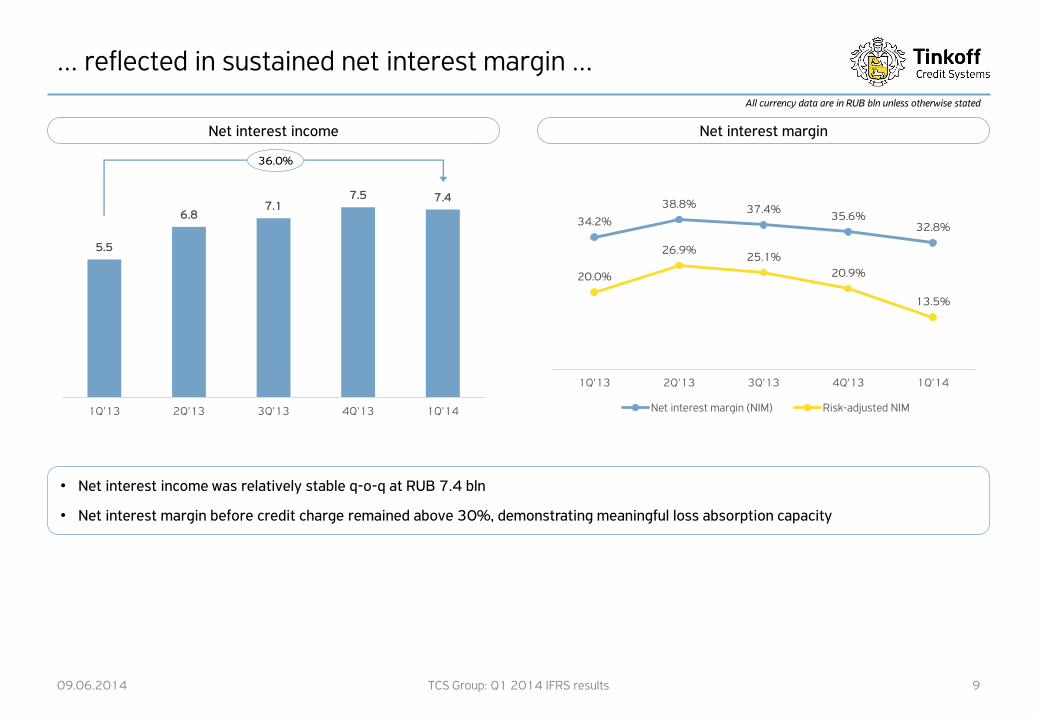
… reflected in sustained net interest margin …
09.06.2014 TCS Group: Q1 2014 IFRS results 9
Net interest income Net interest margin
36.0%
• Net interest income was relatively stable q-o-q at RUB 7.4 bln
• Net interest margin before credit charge remained above 30%, demonstrating meaningful loss absorption capacity
All currency data are in RUB bln unless otherwise stated
34.2%
38.8% 37.4%35.6%
32.8%
20.0%
26.9%25.1%
20.9%
13.5%
1Q'13 2Q'13 3Q'13 4Q'13 1Q'14
Net interest margin (NIM) Risk-adjusted NIM

2.32.1
2.3
3.1
4.4
16.2%12.6% 12.6%
15.4%
20.5%
1Q'13 2Q'13 3Q'13 4Q'13 1Q'14
Provision for loan impairment Cost of risk
… despite rising cost of risk
09.06.2014 TCS Group: Q1 2014 IFRS results 10
Cost of risk Sale of bad debts
91.8%
• Cost of risk rose above 20% in 1Q14, due to overall growth in credit risks in the Russian consumer lending segment
• TCS continues to prioritise risk management through a strict underwriting policy by maintaining low approval rates
• Bad debt sales have decelerated, as the Group strives to maximize recoveries by collecting on delinquent loans through its court and
installment processes
All currency data are in RUB bln unless otherwise stated
0.4
1.2
1.4
1.8
1.3
2.6%
7.1% 7.6%9.1%
6.3%
1Q'13 2Q'13 3Q'13 4Q'13 1Q'14
Sale of bad debts % of gross loans (annualized)
0.60.9 0.8 1.0 0.8
0.3
0.4 0.40.3
0.40.3
0.80.4 0.3 0.60.4
0.6
0.8 0.6 0.6
0.1
0.20.2
0.0
0.1
0.1
0.1
0.10.3
0.3
1.8
3.1
2.72.5
2.7
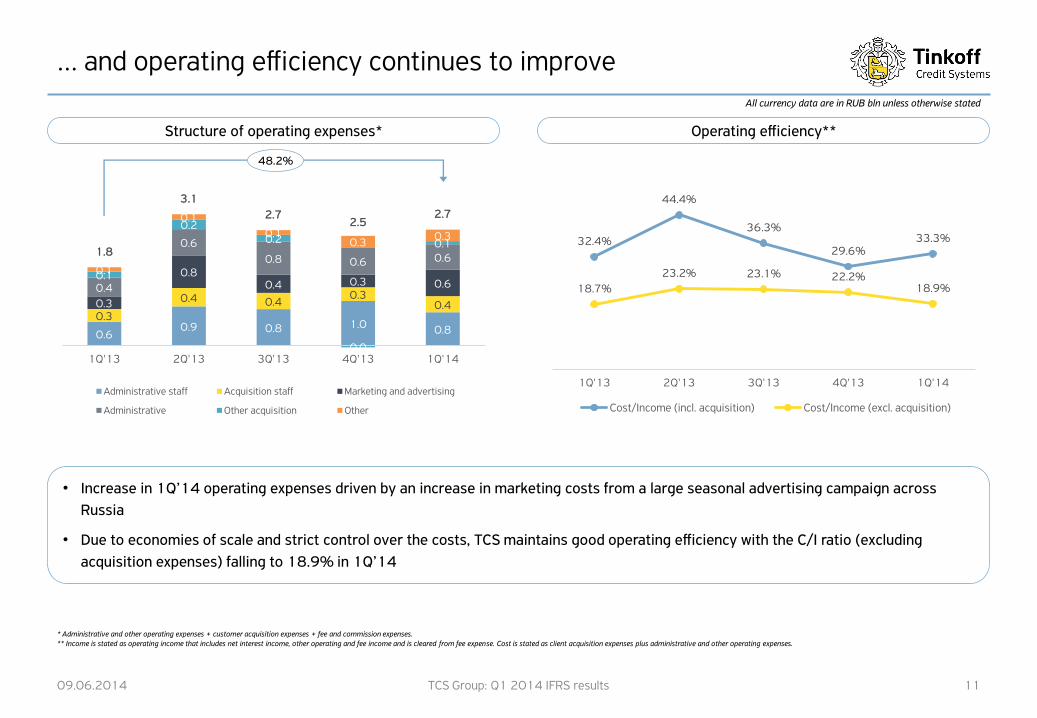
1Q'13 2Q'13 3Q'13 4Q'13 1Q'14
Administrative staff Acquisition staff Marketing and advertising
Administrative Other acquisition Other
… and operating efficiency continues to improve
09.06.2014 TCS Group: Q1 2014 IFRS results 11
Structure of operating expenses* Operating efficiency**
48.2%
• Increase in 1Q’14 operating expenses driven by an increase in marketing costs from a large seasonal advertising campaign across
Russia
• Due to economies of scale and strict control over the costs, TCS maintains good operating efficiency with the C/I ratio (excluding
acquisition expenses) falling to 18.9% in 1Q’14
* Administrative and other operating expenses + customer acquisition expenses + fee and commission expenses.** Income is stated as operating income that includes net interest income, other operating and fee income and is cleared from fee expense. Cost is stated as client acquisition expenses plus administrative and other operating expenses.
All currency data are in RUB bln unless otherwise stated
32.4%
44.4%
36.3%
29.6%33.3%
18.7%
23.2% 23.1% 22.2%18.9%
1Q'13 2Q'13 3Q'13 4Q'13 1Q'14
Cost/Income (incl. acquisition) Cost/Income (excl. acquisition)
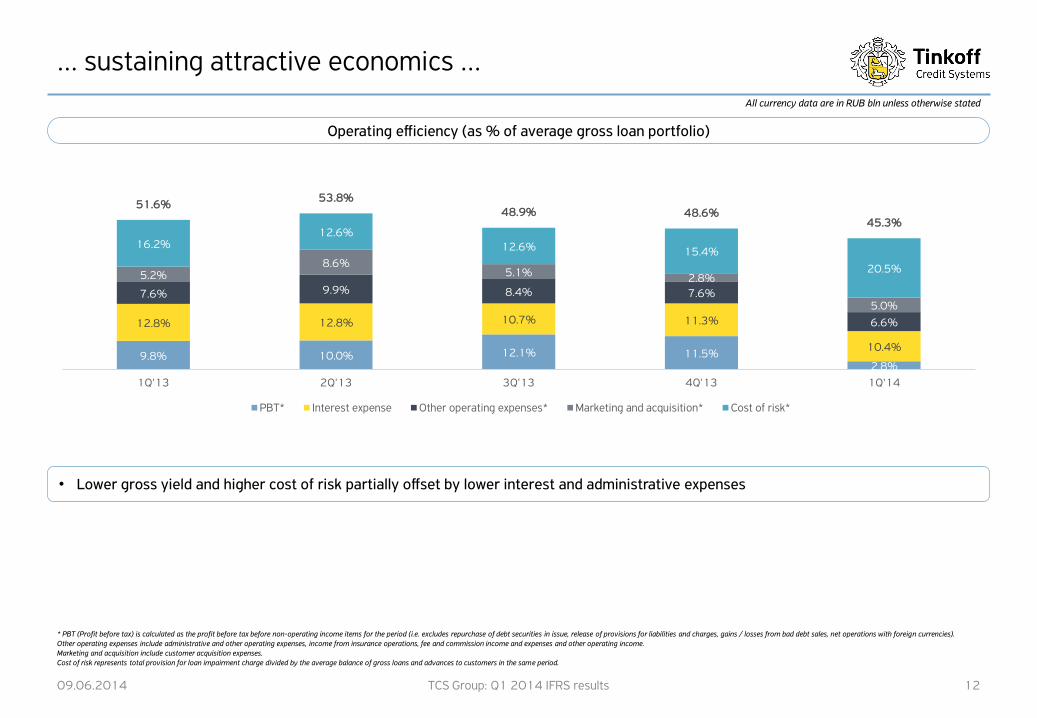
… sustaining attractive economics …
09.06.2014 TCS Group: Q1 2014 IFRS results 12
Operating efficiency (as % of average gross loan portfolio)
• Lower gross yield and higher cost of risk partially offset by lower interest and administrative expenses
* PBT (Profit before tax) is calculated as the profit before tax before non-operating income items for the period (i.e. excludes repurchase of debt securities in issue, release of provisions for liabilities and charges, gains / losses from bad debt sales, net operations with foreign currencies).Other operating expenses include administrative and other operating expenses, income from insurance operations, fee and commission income and expenses and other operating income.Marketing and acquisition include customer acquisition expenses.Cost of risk represents total provision for loan impairment charge divided by the average balance of gross loans and advances to customers in the same period.
All currency data are in RUB bln unless otherwise stated
9.8% 10.0% 12.1% 11.5%2.8%
12.8% 12.8% 10.7% 11.3%
10.4%
7.6% 9.9% 8.4% 7.6%
6.6%
5.2%8.6%
5.1% 2.8%
5.0%
16.2%12.6%
12.6% 15.4%
20.5%
51.6%53.8%
48.9% 48.6%45.3%
1Q'13 2Q'13 3Q'13 4Q'13 1Q'14
PBT* Interest expense Other operating expenses* Marketing and acquisition* Cost of risk*
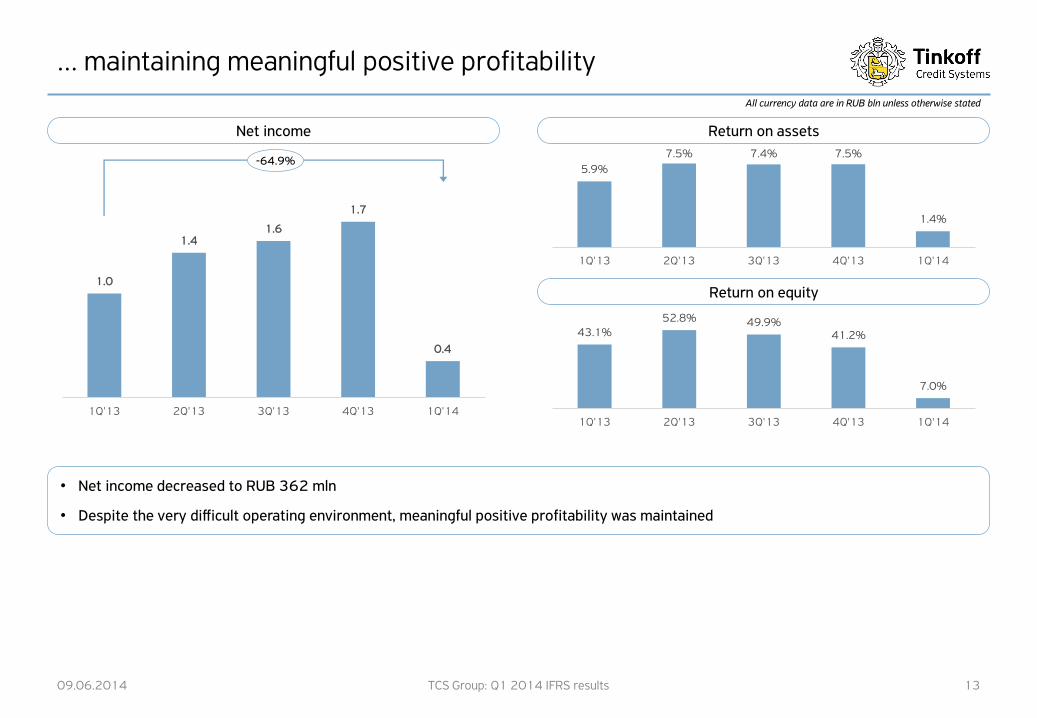
5.9%
7.5% 7.4% 7.5%
1.4%
1Q'13 2Q'13 3Q'13 4Q'13 1Q'14
43.1%52.8% 49.9%
41.2%
7.0%
1Q'13 2Q'13 3Q'13 4Q'13 1Q'14
1.0
1.41.6
1.7
0.4
1Q'13 2Q'13 3Q'13 4Q'13 1Q'14
… maintaining meaningful positive profitability
09.06.2014 TCS Group: Q1 2014 IFRS results 13
Net income Return on assets
• Net income decreased to RUB 362 mln
• Despite the very difficult operating environment, meaningful positive profitability was maintained
Return on equity
All currency data are in RUB bln unless otherwise stated
-64.9%

Appendix
09.06.2014 TCS Group: Q1 2014 IFRS results 14
11.2%17.1%
22.2%
25.5% 27.1%
49.8% 34.5% 29.2% 21.7%16.1%
15.0%
16.3%15.2%
0.4% 2.2% 2.5% 4.2%5.8%
7.2%
7.5%7.3%
10.0% 10.9%
9.4%
7.2%
6.4%6.5%
4.6%
5.7%6.1%
5.2%
4.5%
4.0%3.9%
11.8% 10.5% 8.6%
2.9%
3.6%3.4%
4.8%
3.4%3.1%
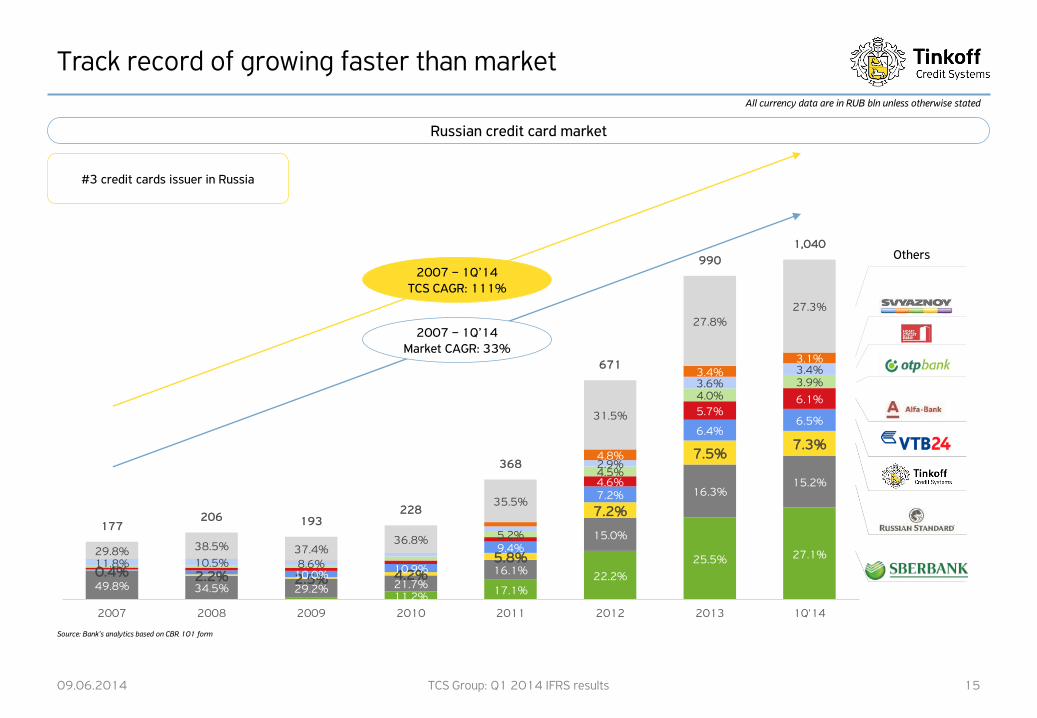
29.8% 38.5% 37.4%36.8%
35.5%
31.5%
27.8%27.3%
177206 193
228
368
671
990
1,040
2007 2008 2009 2010 2011 2012 2013 1Q'14
Track record of growing faster than market
09.06.2014 TCS Group: Q1 2014 IFRS results 15
Russian credit card market
Others
2007 – 1Q’14Market CAGR: 33%
2007 – 1Q’14TCS CAGR: 111%
Source: Bank’s analytics based on CBR 101 form
#3 credit cards issuer in Russia
All currency data are in RUB bln unless otherwise stated
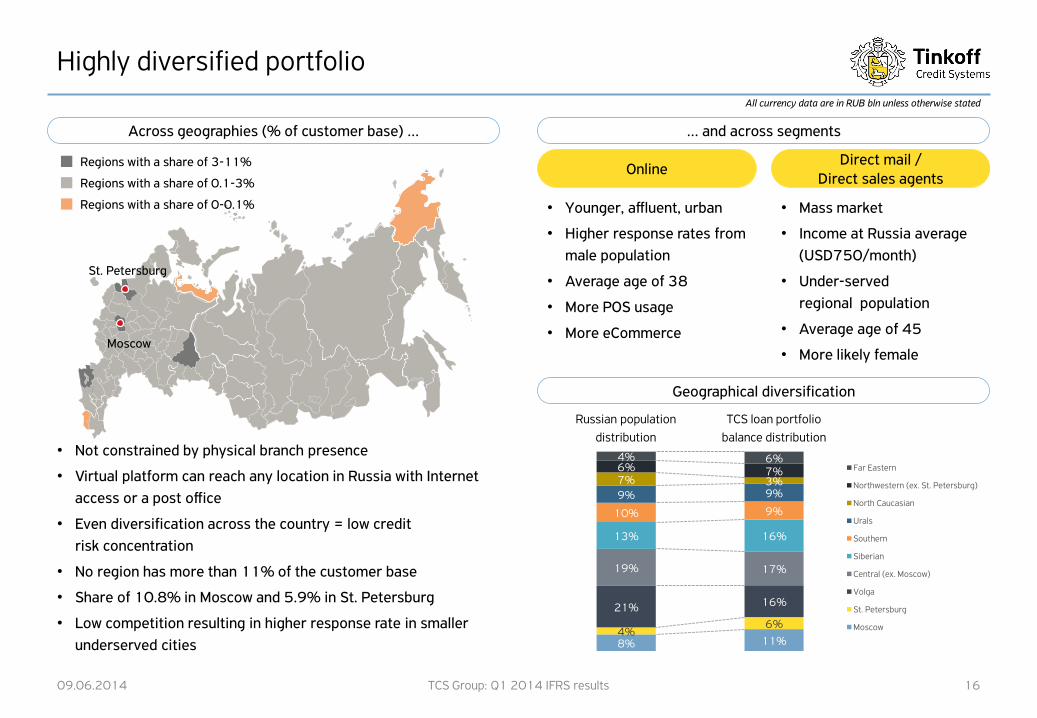
8% 11%4%
6%
21% 16%
19% 17%
13% 16%
10% 9%
9% 9%7% 3%6% 7%4% 6%
Far Eastern
Northwestern (ex. St. Petersburg)
North Caucasian
Urals
Southern
Siberian
Central (ex. Moscow)
Volga
St. Petersburg
Moscow
Moscow
St. Petersburg
Highly diversified portfolio
09.06.2014 TCS Group: Q1 2014 IFRS results 16
Across geographies (% of customer base) … … and across segments
Regions with a share of 0-0.1%
Regions with a share of 3-11%
Regions with a share of 0.1-3%
• Not constrained by physical branch presence
• Virtual platform can reach any location in Russia with Internet
access or a post office
• Even diversification across the country = low credit
risk concentration
• No region has more than 11% of the customer base
• Share of 10.8% in Moscow and 5.9% in St. Petersburg
• Low competition resulting in higher response rate in smaller
underserved cities
OnlineDirect mail /
Direct sales agents
• Younger, affluent, urban
• Higher response rates from
male population
• Average age of 38
• More POS usage
• More eCommerce
• Mass market
• Income at Russia average
(USD750/month)
• Under-served
regional population
• Average age of 45
• More likely female
Geographical diversification
Russian population
distribution
TCS loan portfolio
balance distribution
All currency data are in RUB bln unless otherwise stated

Risk weighting and liquidity regulation
09.06.2014 TCS Group: Q1 2014 IFRS results 17
As the most efficient and flexible player, TCS is best positioned to adapt to tougher consumer lending regulation and even benefit from its cooling effect on competition
Unsecured retail lending curbs
Liquidity funding & deposits
Consumer protection
Regulation How TCS adresses
Before 1 Jan 2014 Current
Higher risk-weighting factors
25-35% 1.1x 1.1x
35-45% 1.4x 1.6x
45-60% 1.7x 3.0x
> 60% 2.0x 6.0x
Higher statutory loan loss provision factors
Non-overdue loans 2% 3%
1-30 days overdue 6% 8%
Explicit interest rate caps contemplated by CBR
• Tentatively at 30% above average rate for Top-20 lenders
Current Proposed
Deposit Insurance Agency coverage of retail deposits
Limit RUB 700,000 RUB 1,000,000
Deposit rate caps recommended by CBR
• No more than 2 p.p. above the average for Top-10 largest deposit taking banks in Russia
• Reference rate at 8.465% as at the end of March 2014
• Share of high effective interest rate loans in TCS’s portfolio has been
dropping regardless of regulation
• Higher risk weights apply only to new loans, so impact will phase in
gradually, allowing TCS to take steps to cushion capital impact
• TCS already overprovisioned, so impact of new provisions not significant
• Interest rate to have negligible incremental impact
• As currently proposed would be at above 50% PSK, where TCS
has very few loans
• Excludes cash withdrawal commissions, credit protection fees and
late fees
• TCS to benefit from expanding Deposit Insurance Agency coverage
• TCS' s current maximum rouble deposit rate is 9.5%
• TCS’s internal liquidity targets substantially more stringent than regulations’
at min 15% of deposit book
• Full transparency by TCS on disclosure of ‘PSK’ (full cost of credit)
• Clean record by TCS on collection practices
• Collections mostly in-house, some outsourced to partner collection agencies
and also uses court systems for collection
• Customer disclosure
• Collection practices
• Personal data protection
All currency data are in RUB bln unless otherwise stated
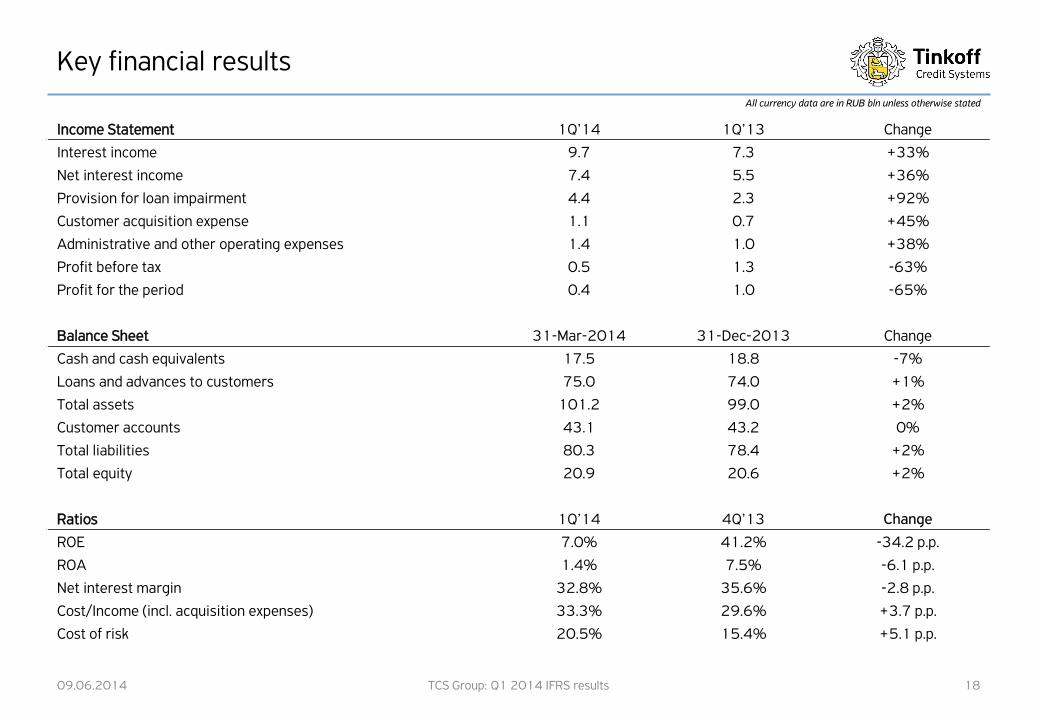
Key financial results
Income Statement 1Q’14 1Q’13 Change
Interest income 9.7 7.3 +33%
Net interest income 7.4 5.5 +36%
Provision for loan impairment 4.4 2.3 +92%
Customer acquisition expense 1.1 0.7 +45%
Administrative and other operating expenses 1.4 1.0 +38%
Profit before tax 0.5 1.3 -63%
Profit for the period 0.4 1.0 -65%
Balance Sheet 31-Mar-2014 31-Dec-2013 Change
Cash and cash equivalents 17.5 18.8 -7%
Loans and advances to customers 75.0 74.0 +1%
Total assets 101.2 99.0 +2%
Customer accounts 43.1 43.2 0%
Total liabilities 80.3 78.4 +2%
Total equity 20.9 20.6 +2%
Ratios 1Q’14 4Q’13 Change
ROE 7.0% 41.2% -34.2 p.p.
ROA 1.4% 7.5% -6.1 p.p.
Net interest margin 32.8% 35.6% -2.8 p.p.
Cost/Income (incl. acquisition expenses) 33.3% 29.6% +3.7 p.p.
Cost of risk 20.5% 15.4% +5.1 p.p.
09.06.2014 TCS Group: Q1 2014 IFRS results 18
All currency data are in RUB bln unless otherwise stated