Embed Size (px)
Citation preview
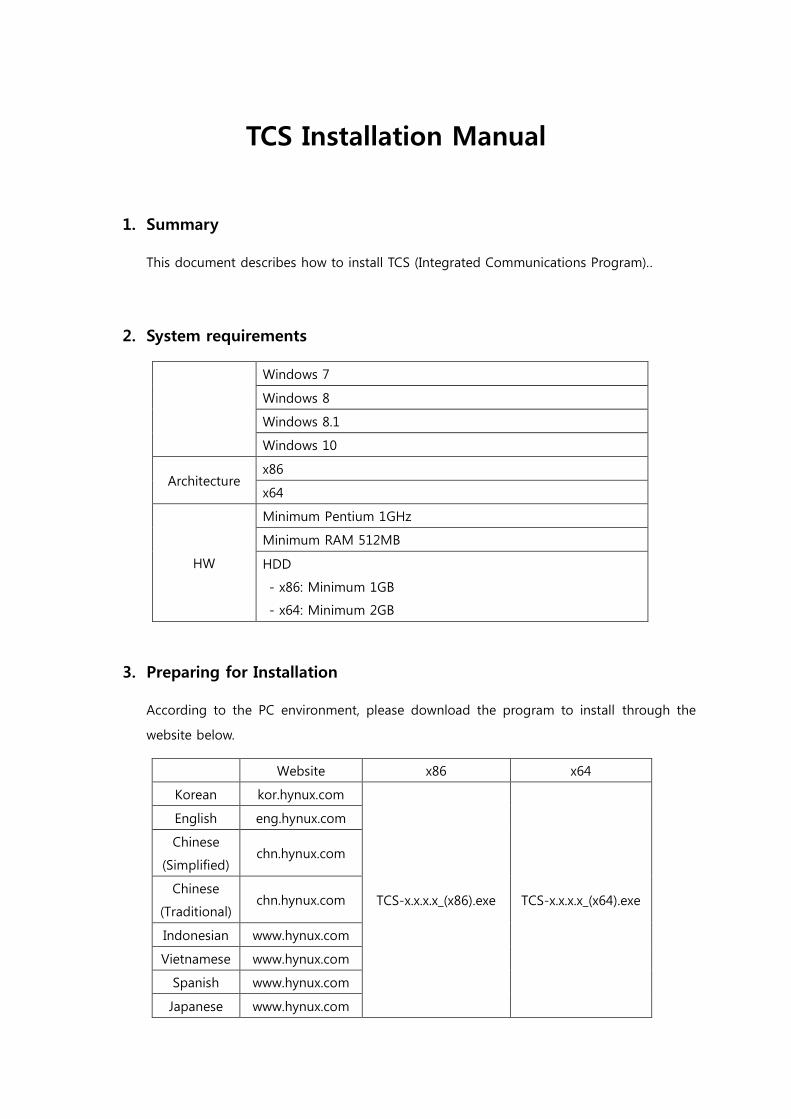
TCS Installation Manual
1. Summary
This document describes how to install TCS (Integrated Communications Program)..
2. System requirements
Windows 7
Windows 8
Windows 8.1
Windows 10
Architecture x86
x64
HW
Minimum Pentium 1GHz
Minimum RAM 512MB
HDD
- x86: Minimum 1GB
- x64: Minimum 2GB
3. Preparing for Installation
According to the PC environment, please download the program to install through the
website below.
Website x86 x64
Korean kor.hynux.com
TCS-x.x.x.x_(x86).exe TCS-x.x.x.x_(x64).exe
English eng.hynux.com
Chinese
(Simplified) chn.hynux.com
Chinese
(Traditional) chn.hynux.com
Indonesian www.hynux.com
Vietnamese www.hynux.com
Spanish www.hynux.com
Japanese www.hynux.com

4. Installation
Please click on the downloaded exe file. This TCS program must have Microsoft SQL CE 4.0
and Microsoft .NET Framework 4.0 or higher version installed..
※ If it is already installed on the PC, it may be different from the figure below
① Please click install.
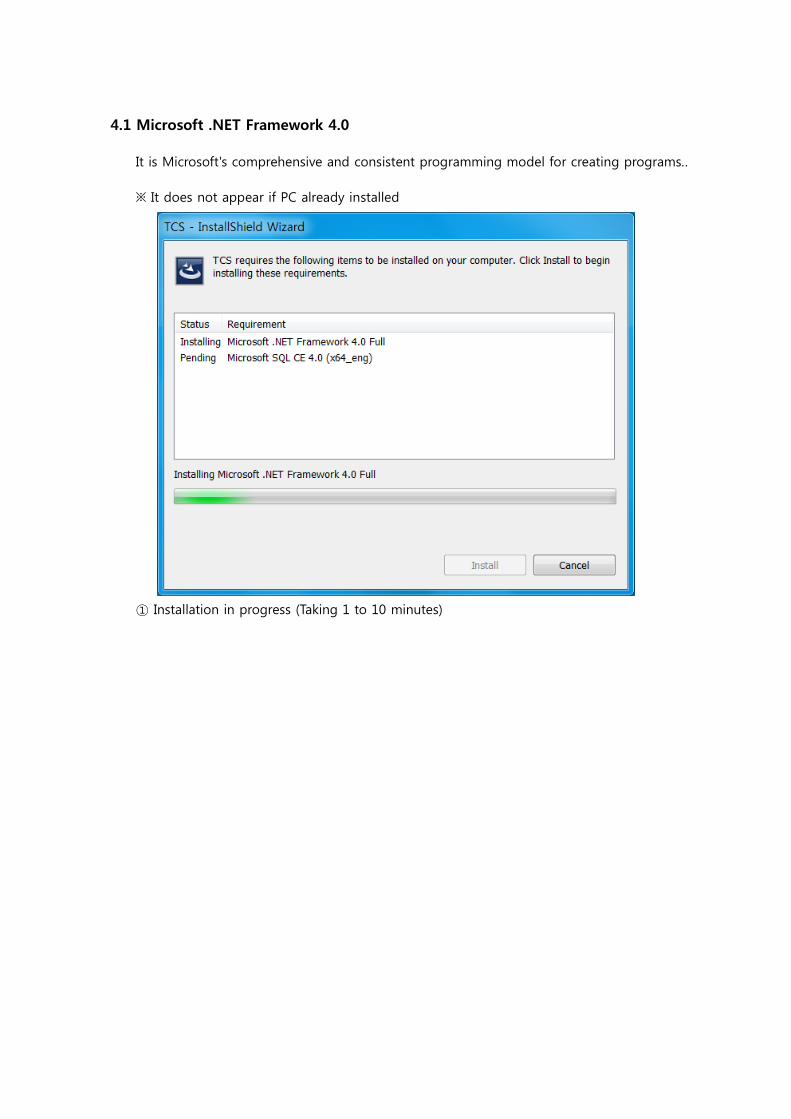
4.1 Microsoft .NET Framework 4.0
It is Microsoft's comprehensive and consistent programming model for creating programs..
※ It does not appear if PC already installed
① Installation in progress (Taking 1 to 10 minutes)
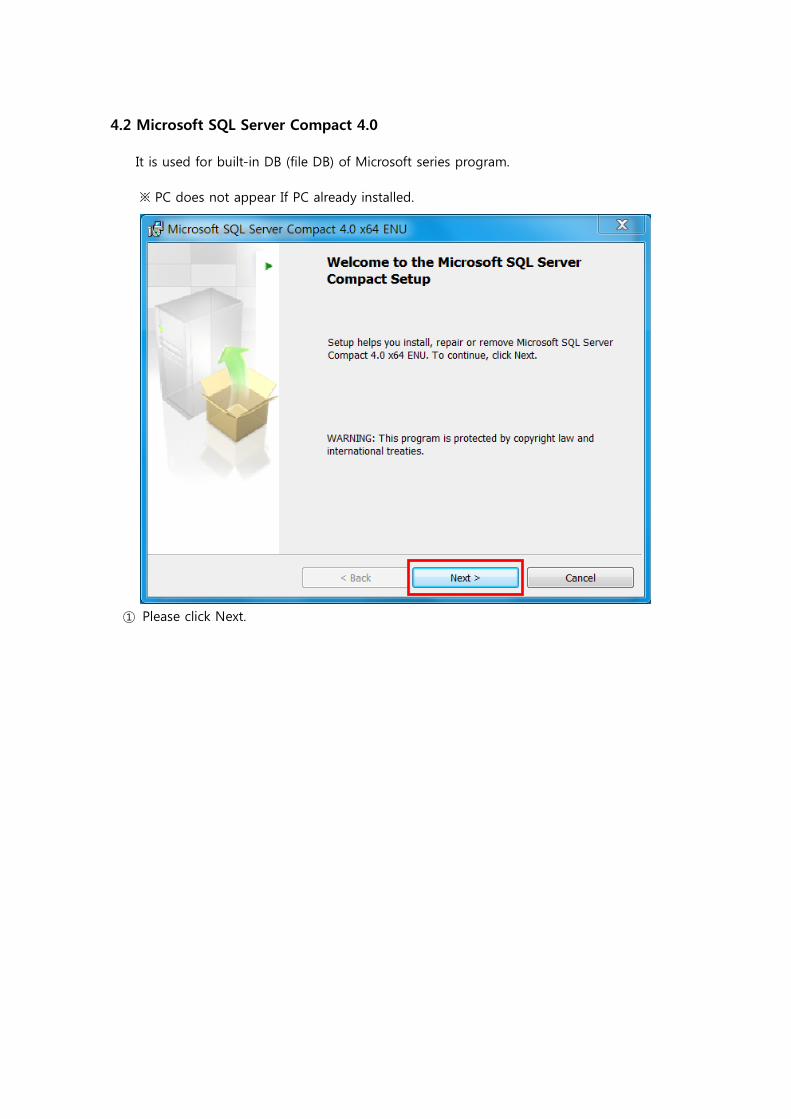
4.2 Microsoft SQL Server Compact 4.0
It is used for built-in DB (file DB) of Microsoft series program.
※ PC does not appear If PC already installed.
① Please click Next.
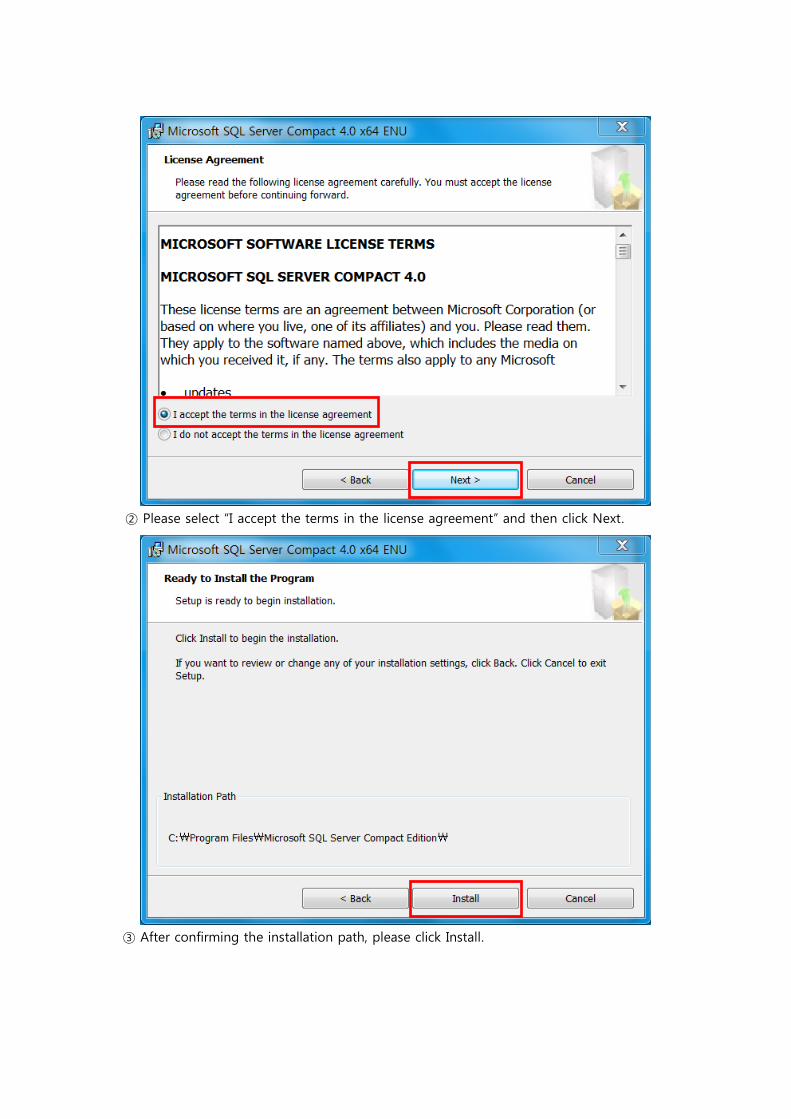
② Please select “I accept the terms in the license agreement” and then click Next.
③ After confirming the installation path, please click Install.
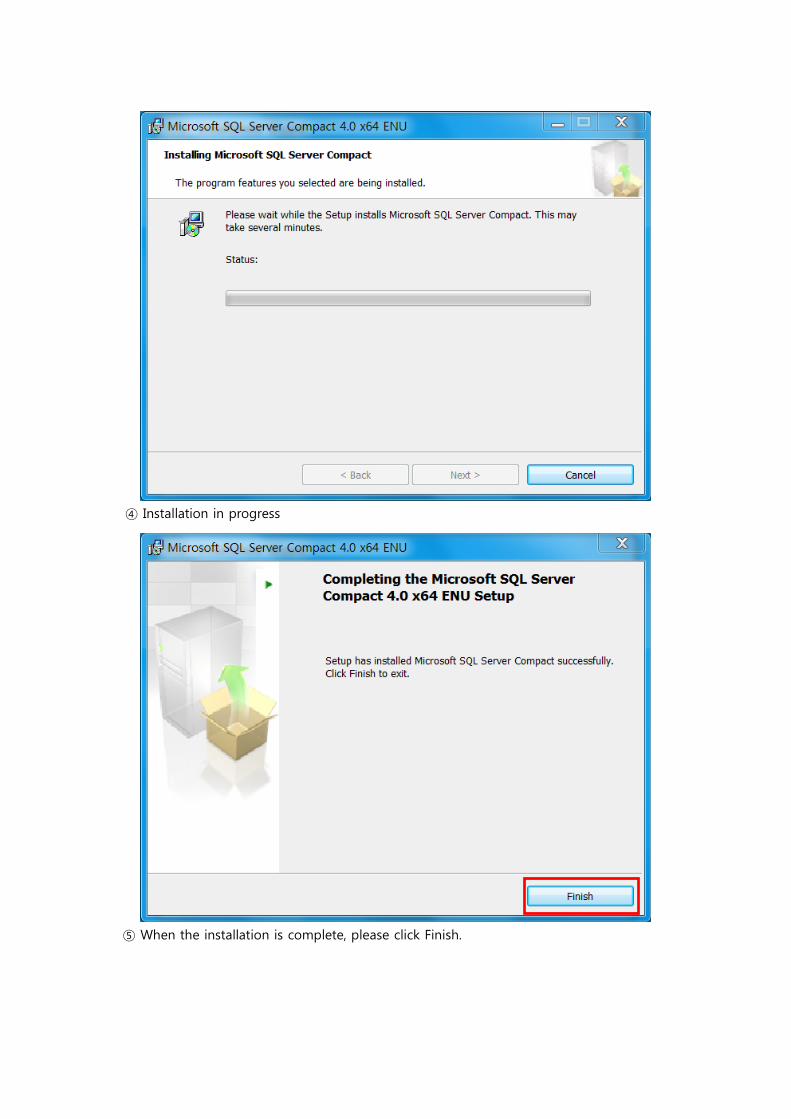
④ Installation in progress
⑤ When the installation is complete, please click Finish.
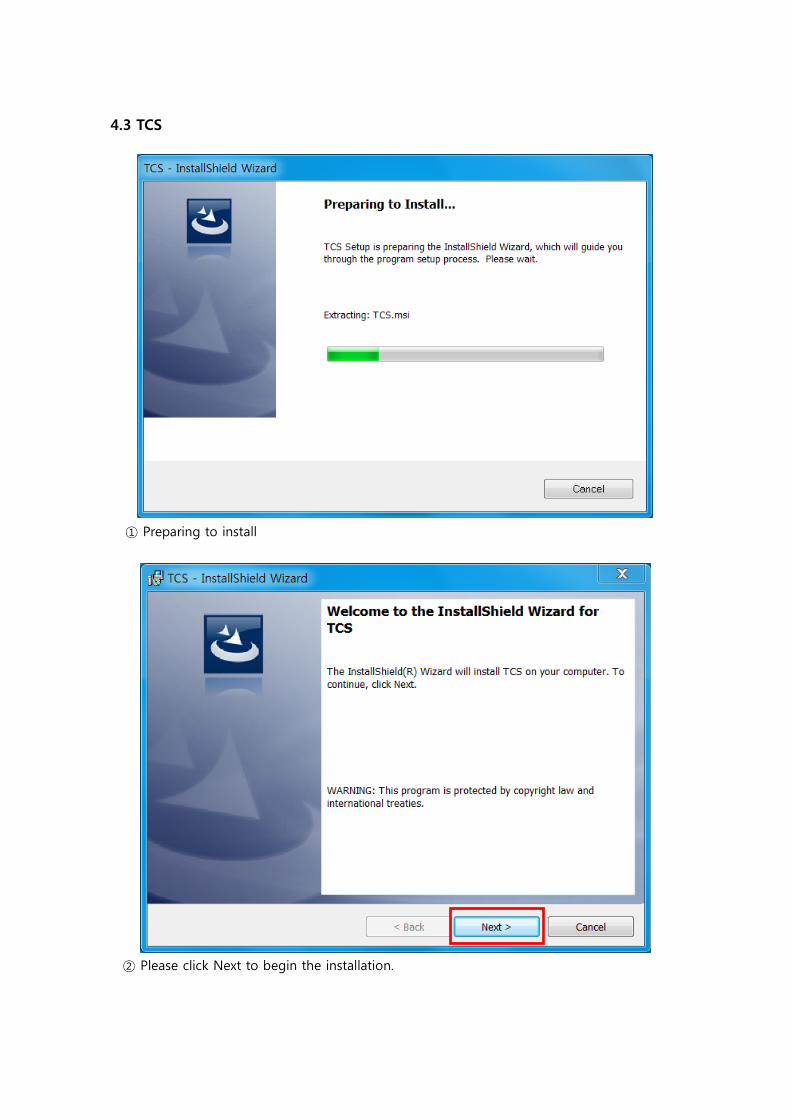
4.3 TCS
① Preparing to install
② Please click Next to begin the installation.
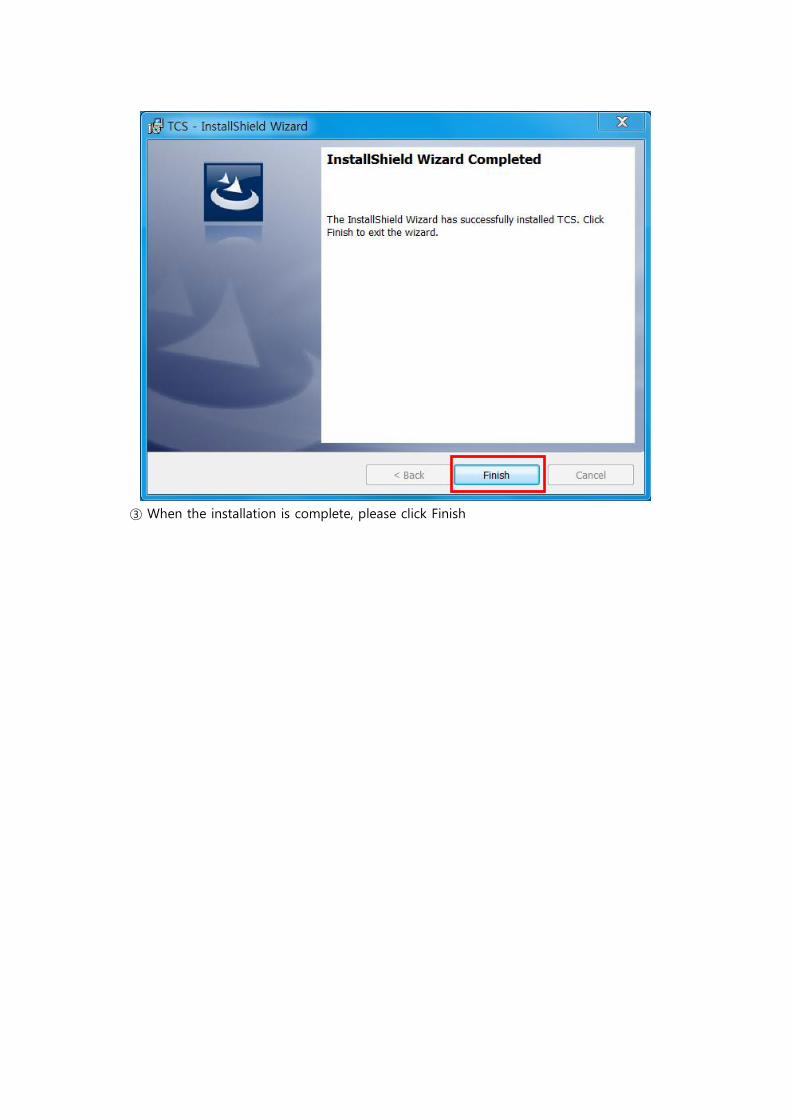
③ When the installation is complete, please click Finish
TCS Operations Manual
1. TCS Communication Program
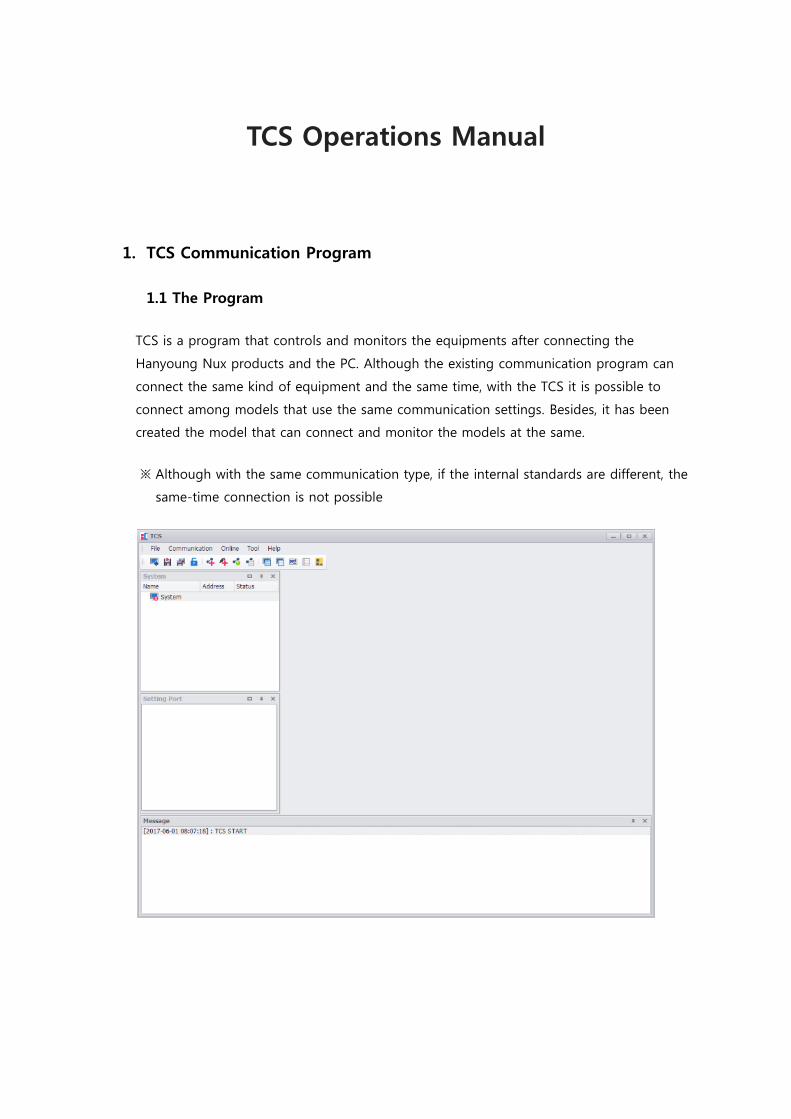
1.1 The Program
TCS is a program that controls and monitors the equipments after connecting the
Hanyoung Nux products and the PC. Although the existing communication program can
connect the same kind of equipment and the same time, with the TCS it is possible to
connect among models that use the same communication settings. Besides, it has been
created the model that can connect and monitor the models at the same.
※ Although with the same communication type, if the internal standards are different, the
same-time connection is not possible
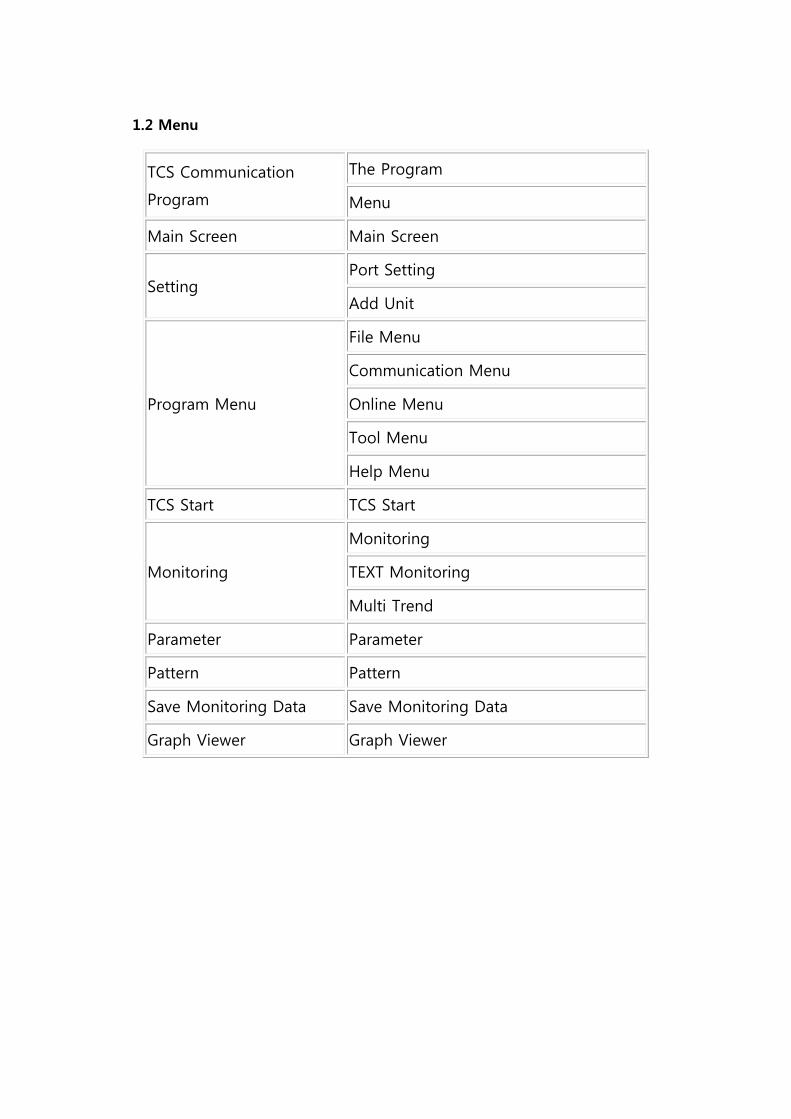
1.2 Menu
TCS Communication
Program
The Program
Menu
Main Screen Main Screen
Setting Port Setting
Add Unit
Program Menu
File Menu
Communication Menu
Online Menu
Tool Menu
Help Menu
TCS Start TCS Start
Monitoring
Monitoring
TEXT Monitoring
Multi Trend
Parameter Parameter
Pattern Pattern
Save Monitoring Data Save Monitoring Data
Graph Viewer Graph Viewer
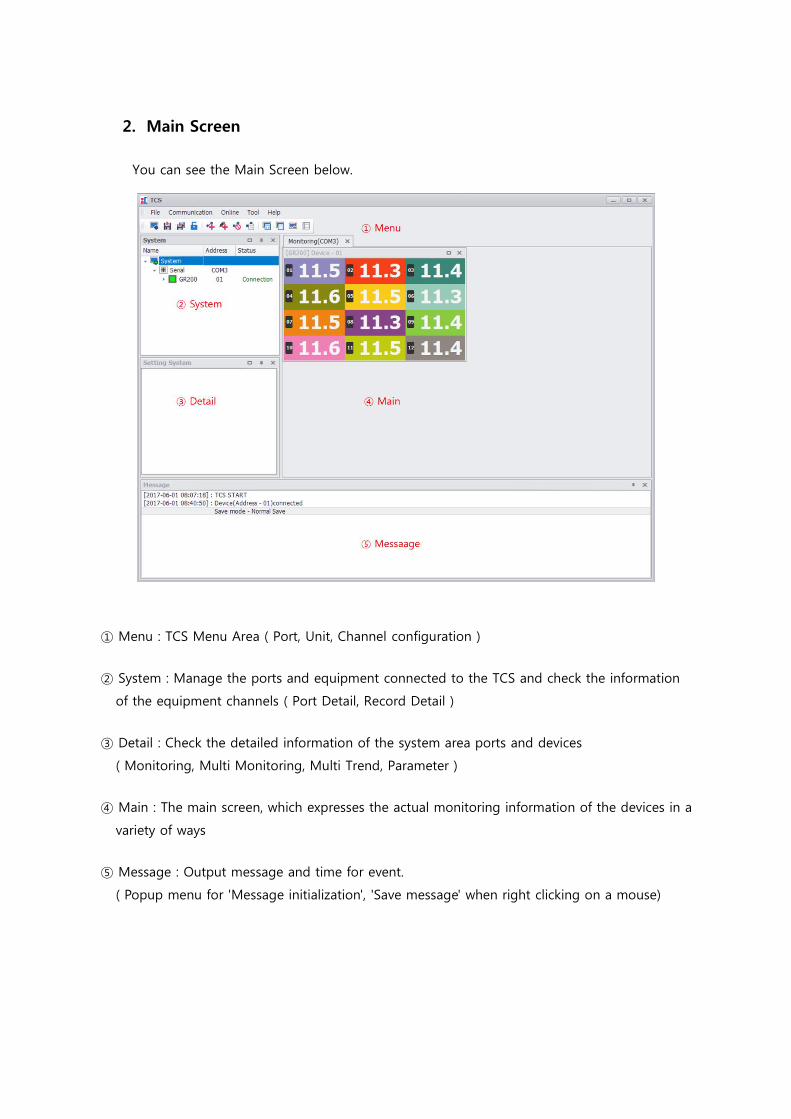
2. Main Screen
You can see the Main Screen below.
① Menu : TCS Menu Area ( Port, Unit, Channel configuration )
② System : Manage the ports and equipment connected to the TCS and check the information
of the equipment channels ( Port Detail, Record Detail )
③ Detail : Check the detailed information of the system area ports and devices
( Monitoring, Multi Monitoring, Multi Trend, Parameter )
④ Main : The main screen, which expresses the actual monitoring information of the devices in a
variety of ways
⑤ Message : Output message and time for event.
( Popup menu for 'Message initialization', 'Save message' when right clicking on a mouse)
3. Setting
3.1 Port Setting
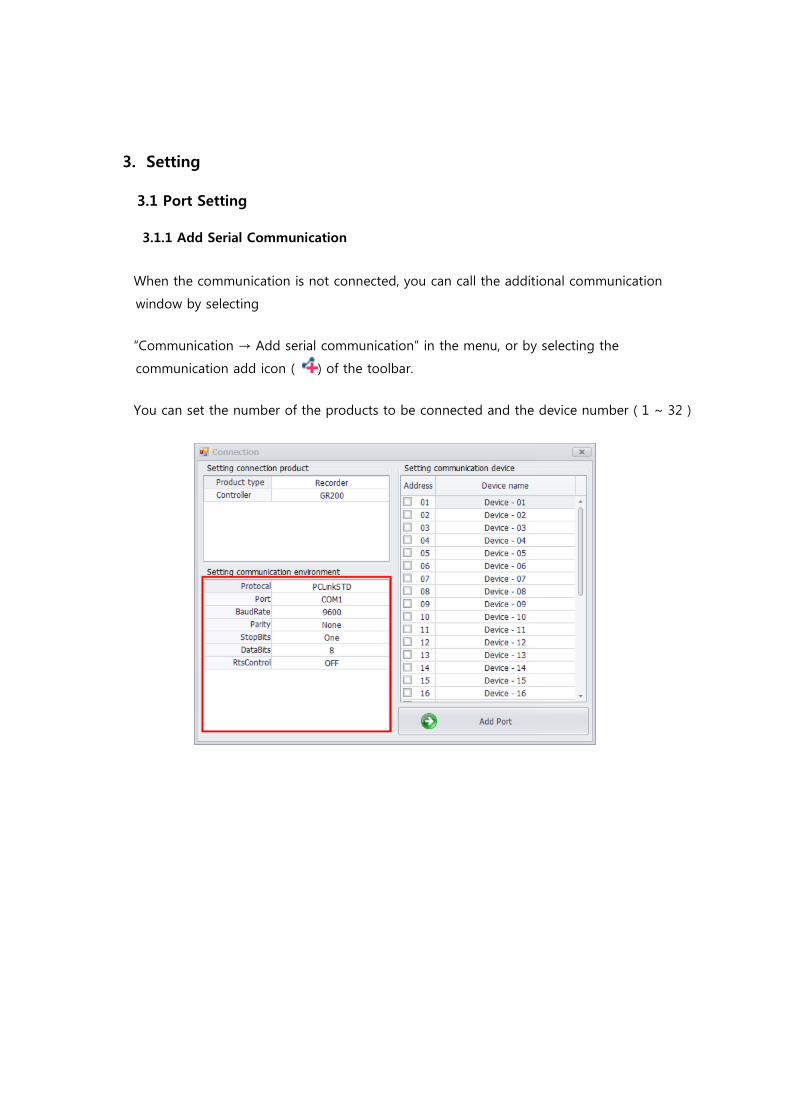
3.1.1 Add Serial Communication
When the communication is not connected, you can call the additional communication
window by selecting
“Communication → Add serial communication” in the menu, or by selecting the
communication add icon ( ) of the toolbar.
You can set the number of the products to be connected and the device number ( 1 ~ 32 )
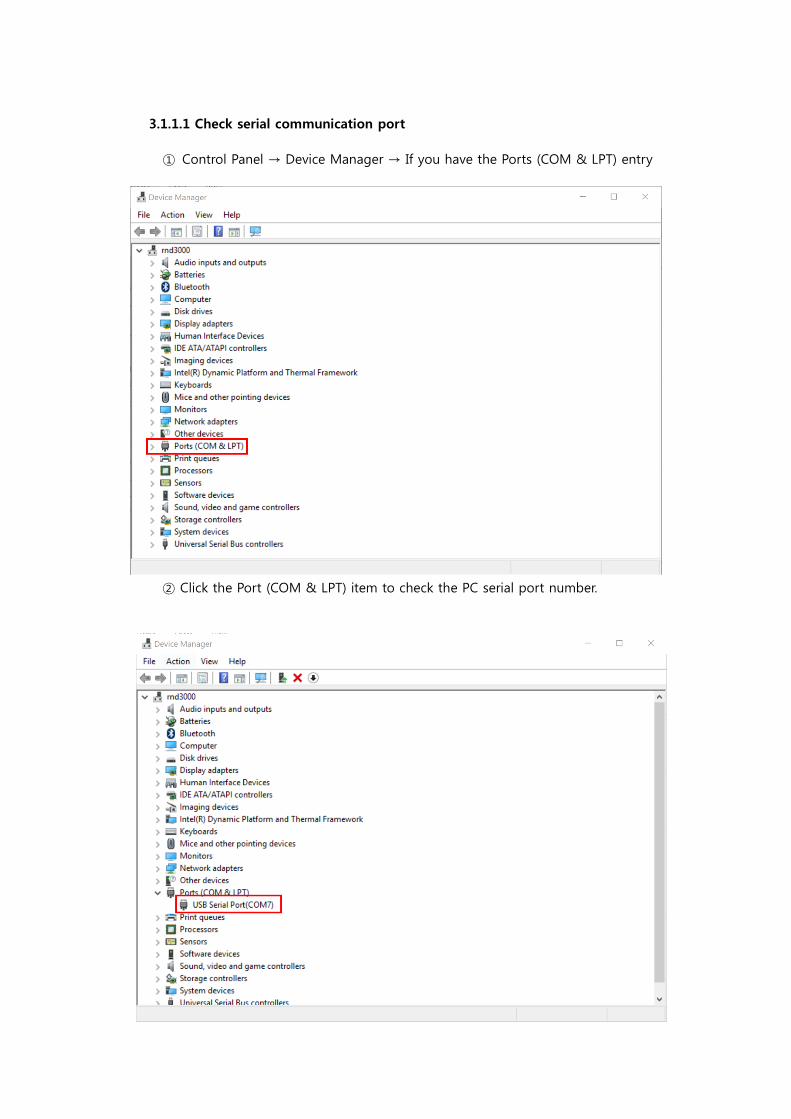
3.1.1.1 Check serial communication port
① Control Panel → Device Manager → If you have the Ports (COM & LPT) entry
② Click the Port (COM & LPT) item to check the PC serial port number.
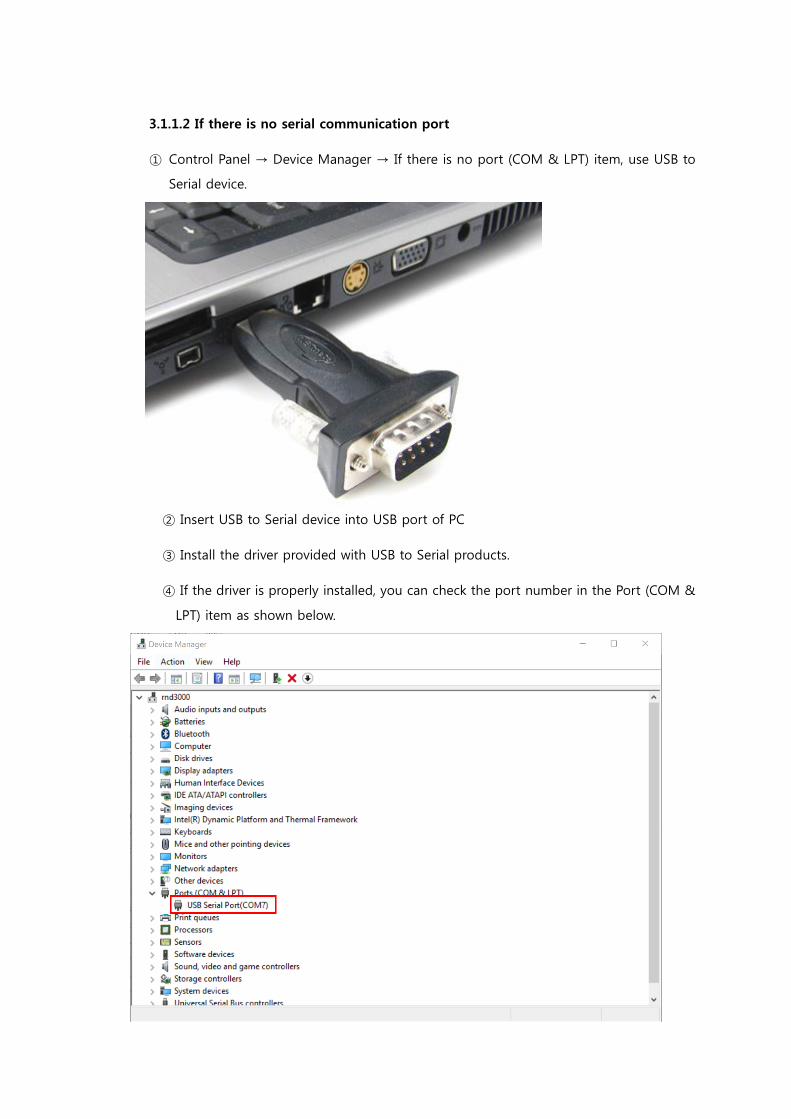
3.1.1.2 If there is no serial communication port
① Control Panel → Device Manager → If there is no port (COM & LPT) item, use USB to
Serial device.
② Insert USB to Serial device into USB port of PC
③ Install the driver provided with USB to Serial products.
④ If the driver is properly installed, you can check the port number in the Port (COM &
LPT) item as shown below.
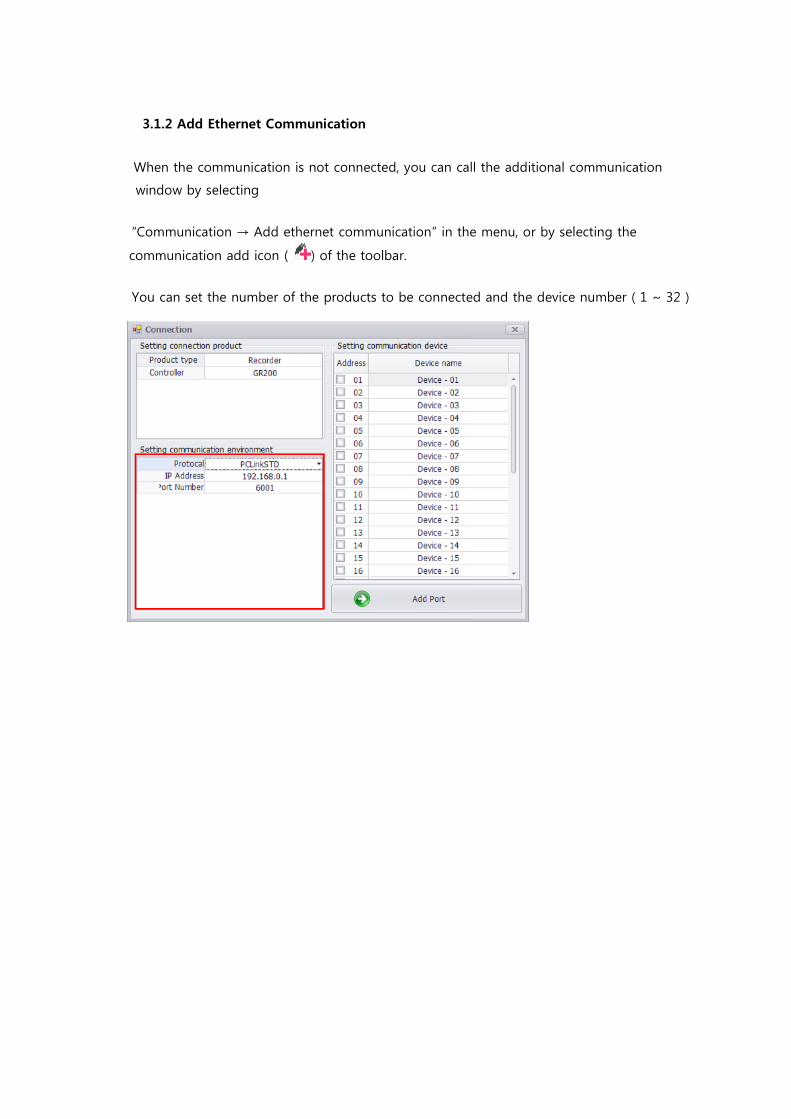
3.1.2 Add Ethernet Communication
When the communication is not connected, you can call the additional communication
window by selecting
“Communication → Add ethernet communication” in the menu, or by selecting the
communication add icon ( ) of the toolbar.
You can set the number of the products to be connected and the device number ( 1 ~ 32 )
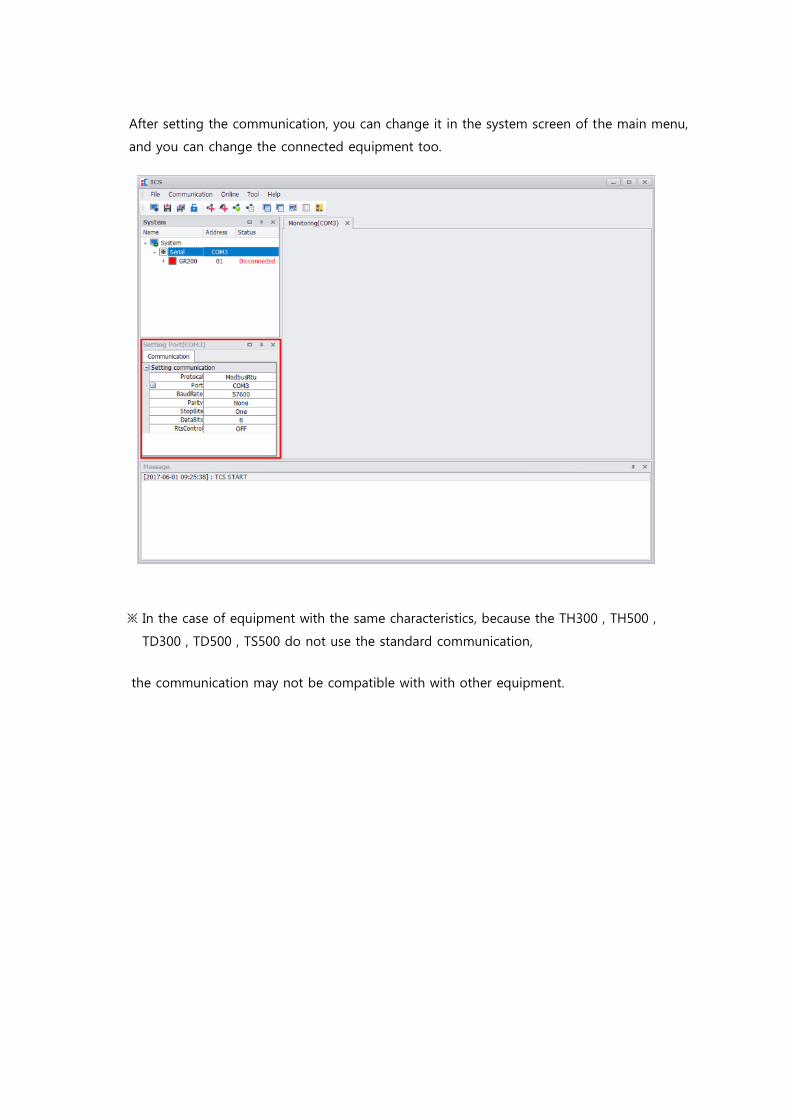
After setting the communication, you can change it in the system screen of the main menu,
and you can change the connected equipment too.
※ In the case of equipment with the same characteristics, because the TH300 , TH500 ,
TD300 , TD500 , TS500 do not use the standard communication,
the communication may not be compatible with with other equipment.
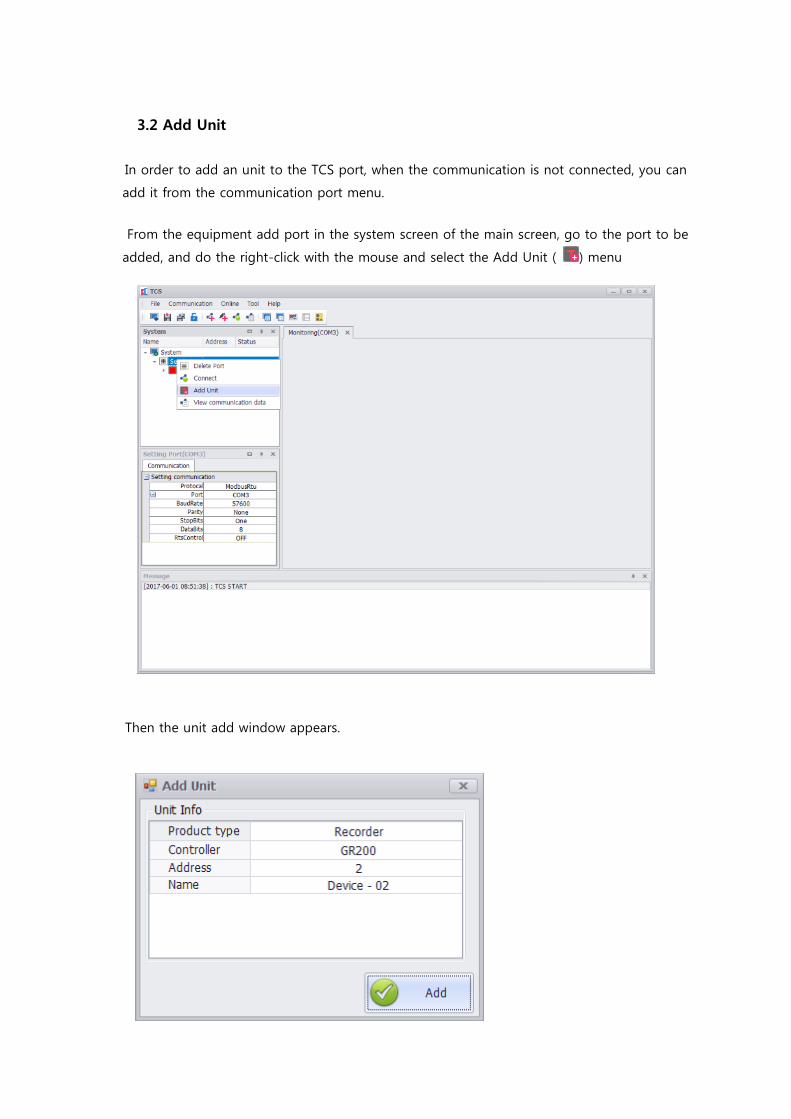
3.2 Add Unit
In order to add an unit to the TCS port, when the communication is not connected, you can
add it from the communication port menu.
From the equipment add port in the system screen of the main screen, go to the port to be
added, and do the right-click with the mouse and select the Add Unit ( ) menu
Then the unit add window appears.
From the add unit window, you can set the product type, product name, device number and
unit name. After finishing all the settings, by selecting the add button you can add the unit to
the port.
※ From the add unit window, you can set the communication. Regarding the communication
setting, please refer to the related instructions.
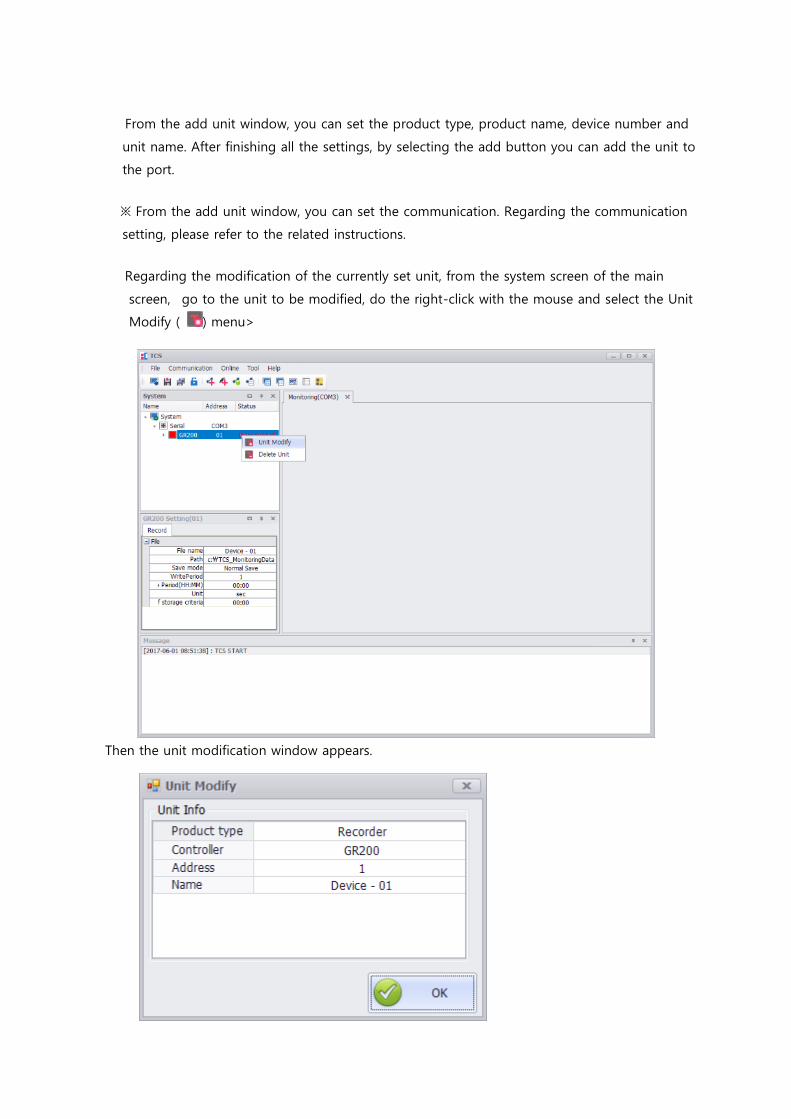
Regarding the modification of the currently set unit, from the system screen of the main
screen, go to the unit to be modified, do the right-click with the mouse and select the Unit
Modify ( ) menu>
Then the unit modification window appears.

From the unit modification window, you can set the device number and unit name.
After finishing all the unit modifications, by selecting OK you can modify the unit.
※ From the unit modification window, because it is possible to change the unit device
number and unit name only, in order to modify the product type, you must add a new one
after cancelling the unit.
In order to cancel the unit, from the unit window select the unit cancel menu.
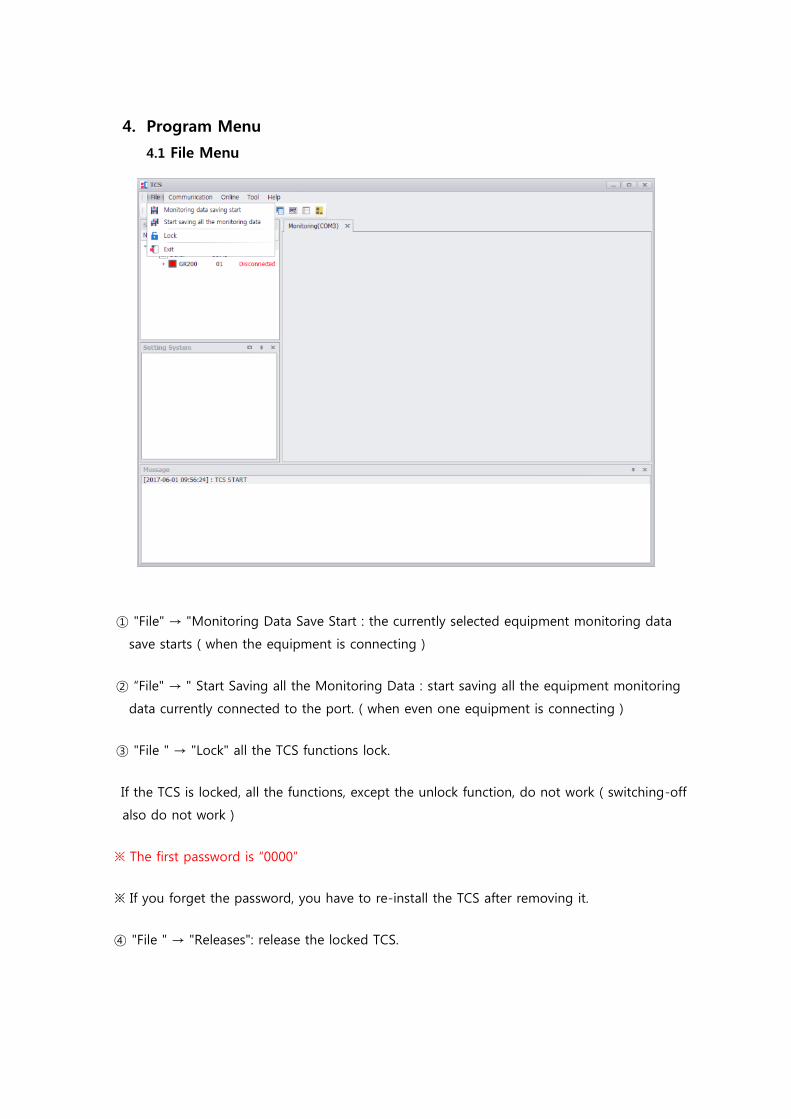
4. Program Menu
4.1 File Menu
① "File" → "Monitoring Data Save Start : the currently selected equipment monitoring data
save starts ( when the equipment is connecting )
② “File" → " Start Saving all the Monitoring Data : start saving all the equipment monitoring
data currently connected to the port. ( when even one equipment is connecting )
③ "File " → "Lock" all the TCS functions lock.
If the TCS is locked, all the functions, except the unlock function, do not work ( switching-off
also do not work )
※ The first password is “0000”
※ If you forget the password, you have to re-install the TCS after removing it.
④ "File " → "Releases": release the locked TCS.
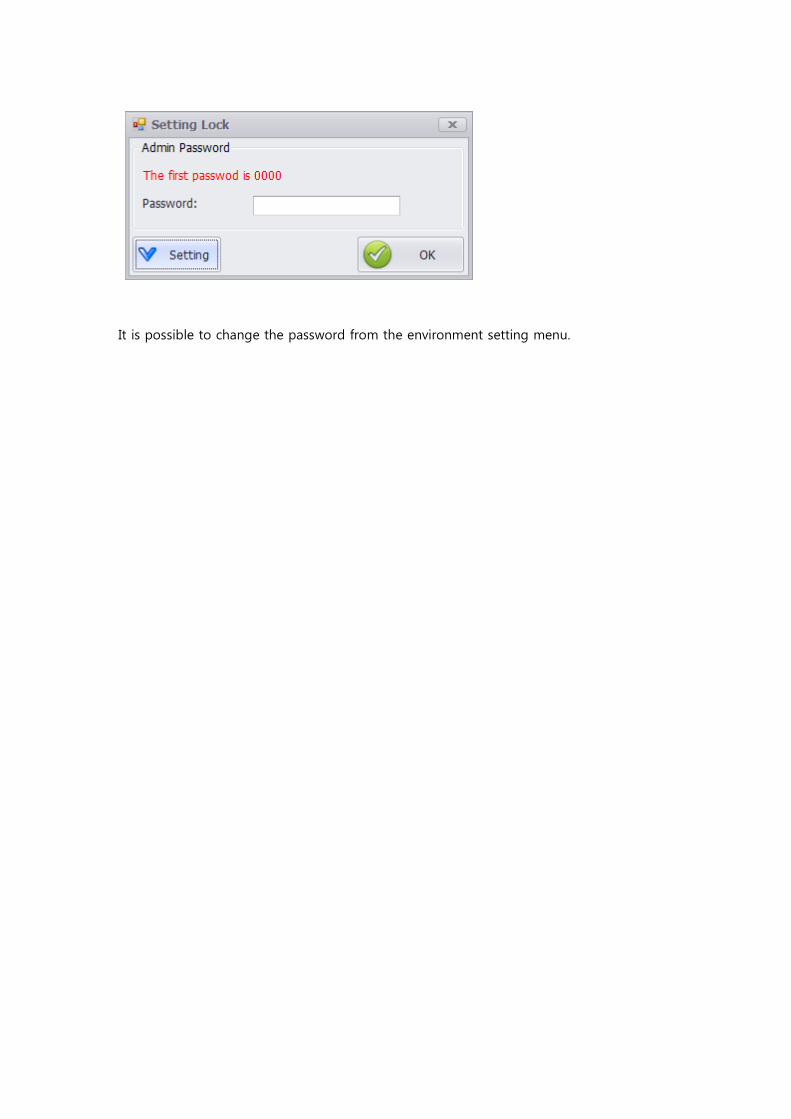
It is possible to change the password from the environment setting menu.
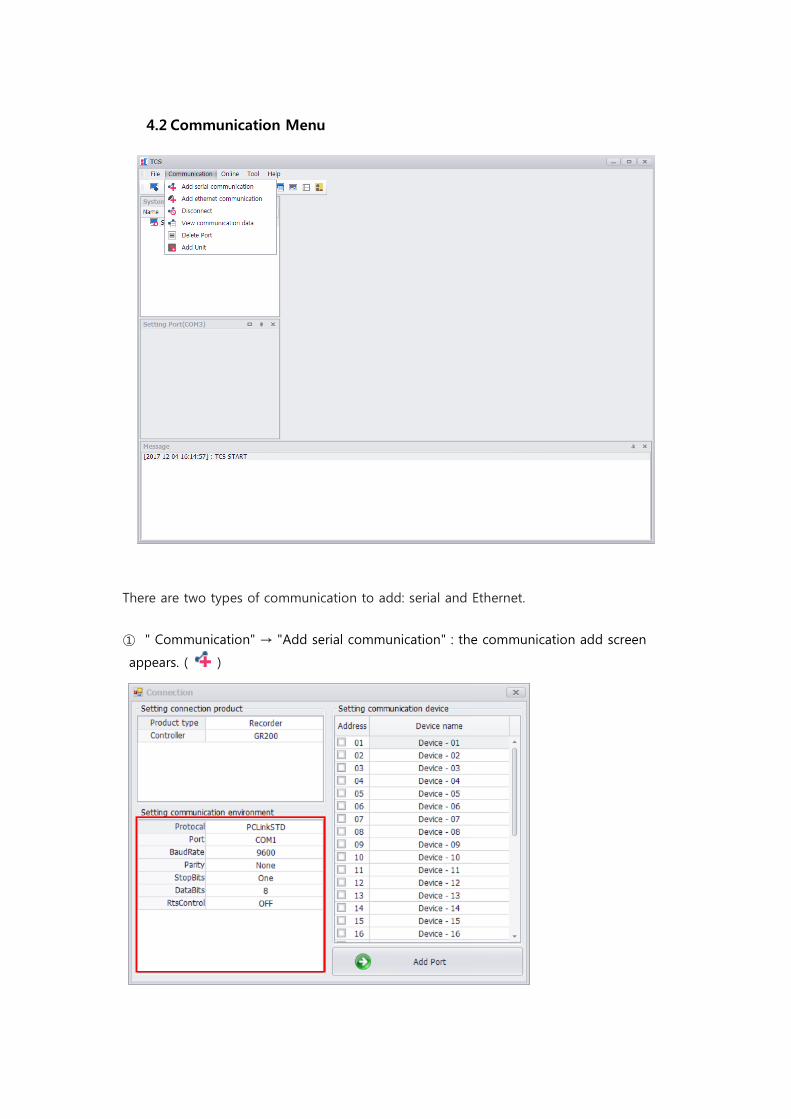
4.2 Communication Menu
There are two types of communication to add: serial and Ethernet.
① " Communication" → "Add serial communication" : the communication add screen
appears. ( )
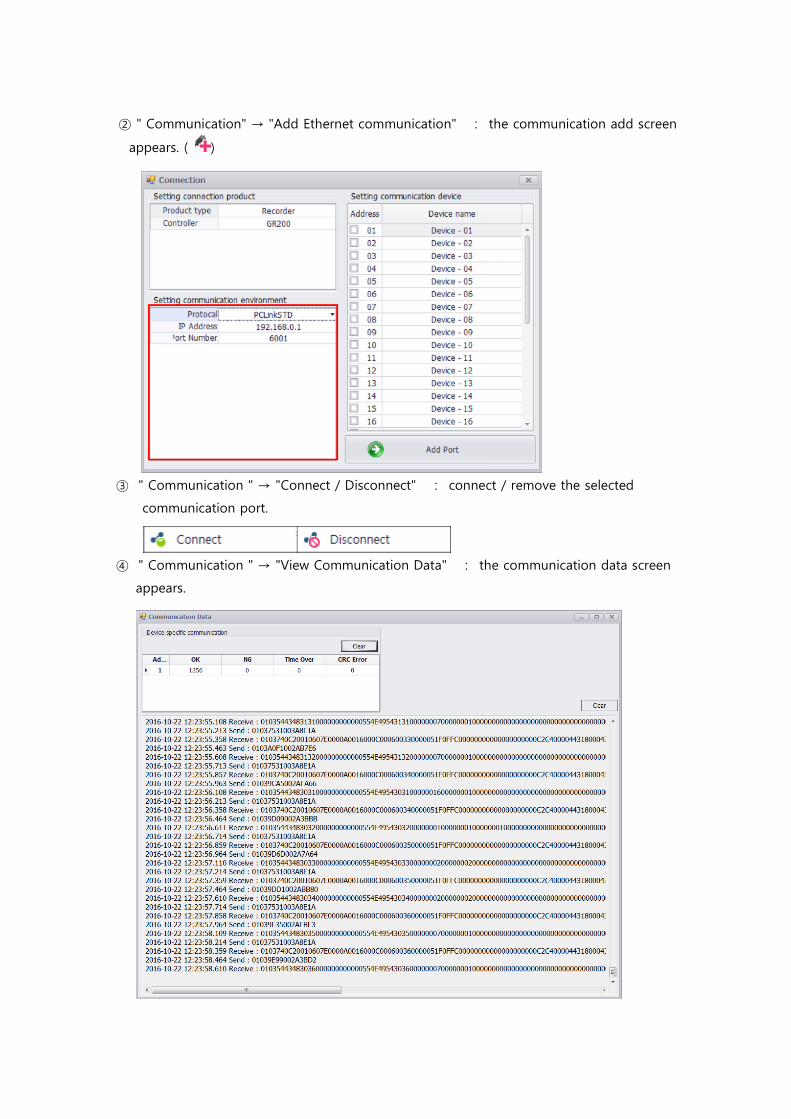
② " Communication" → "Add Ethernet communication" : the communication add screen
appears. ( )
③ " Communication " → "Connect / Disconnect" : connect / remove the selected
communication port.
④ " Communication " → "View Communication Data" : the communication data screen
appears.
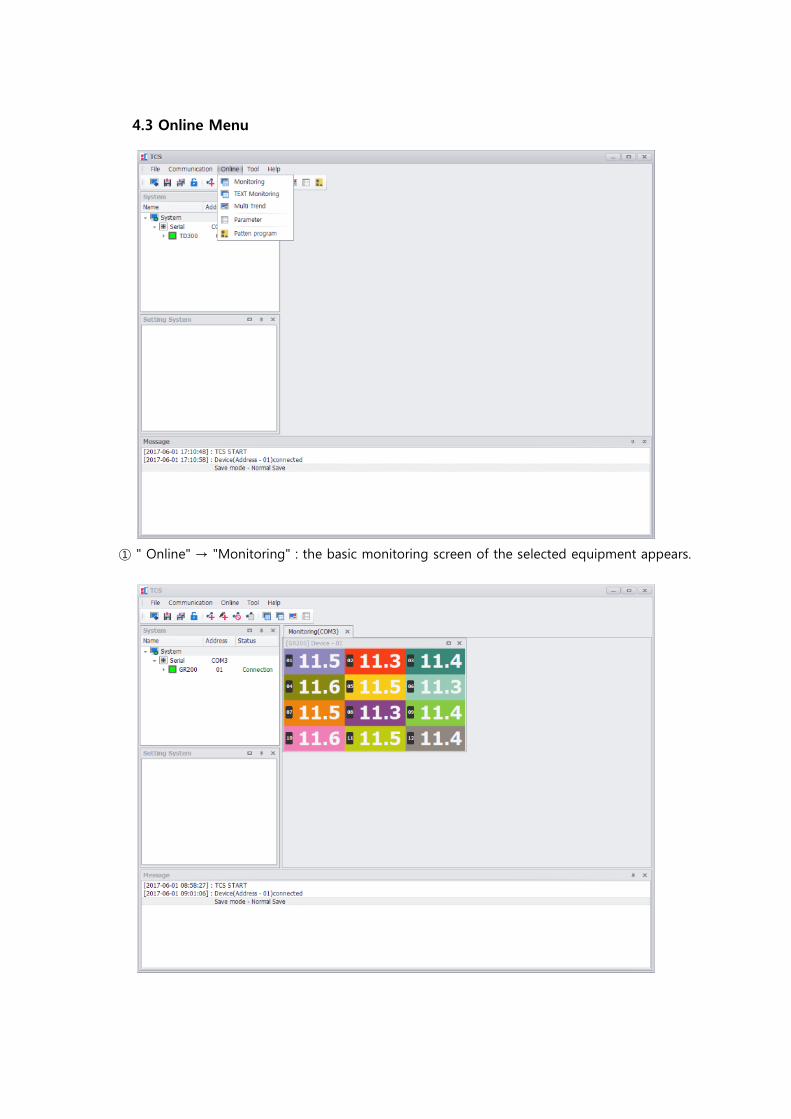
4.3 Online Menu
① " Online" → "Monitoring" : the basic monitoring screen of the selected equipment appears.
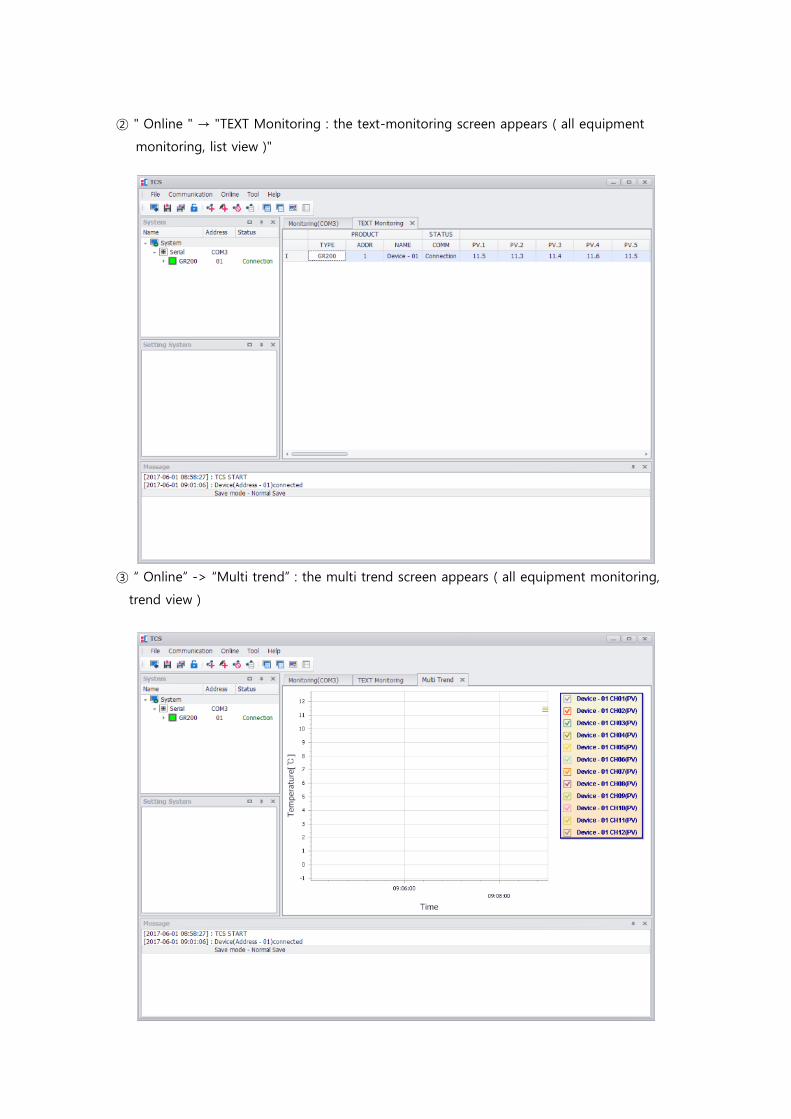
② " Online " → "TEXT Monitoring : the text-monitoring screen appears ( all equipment
monitoring, list view )"
③ “ Online” -> “Multi trend” : the multi trend screen appears ( all equipment monitoring,
trend view )
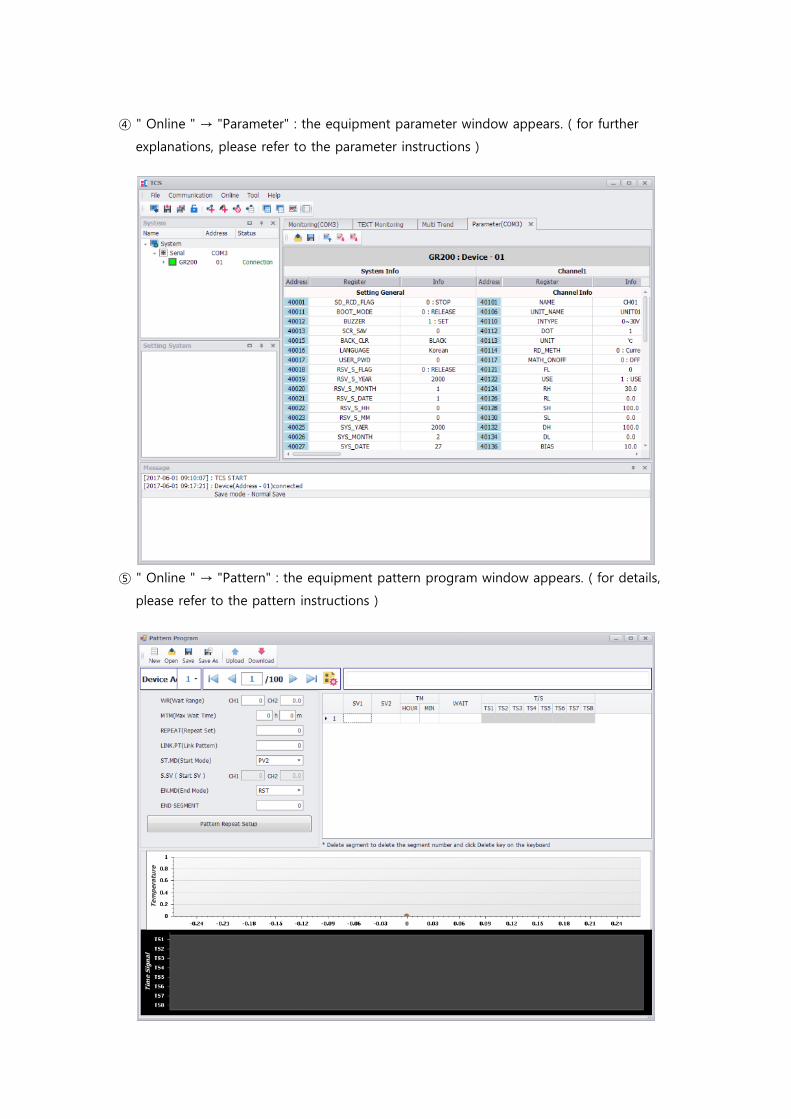
④ " Online " → "Parameter" : the equipment parameter window appears. ( for further
explanations, please refer to the parameter instructions )
⑤ " Online " → "Pattern" : the equipment pattern program window appears. ( for details,
please refer to the pattern instructions )
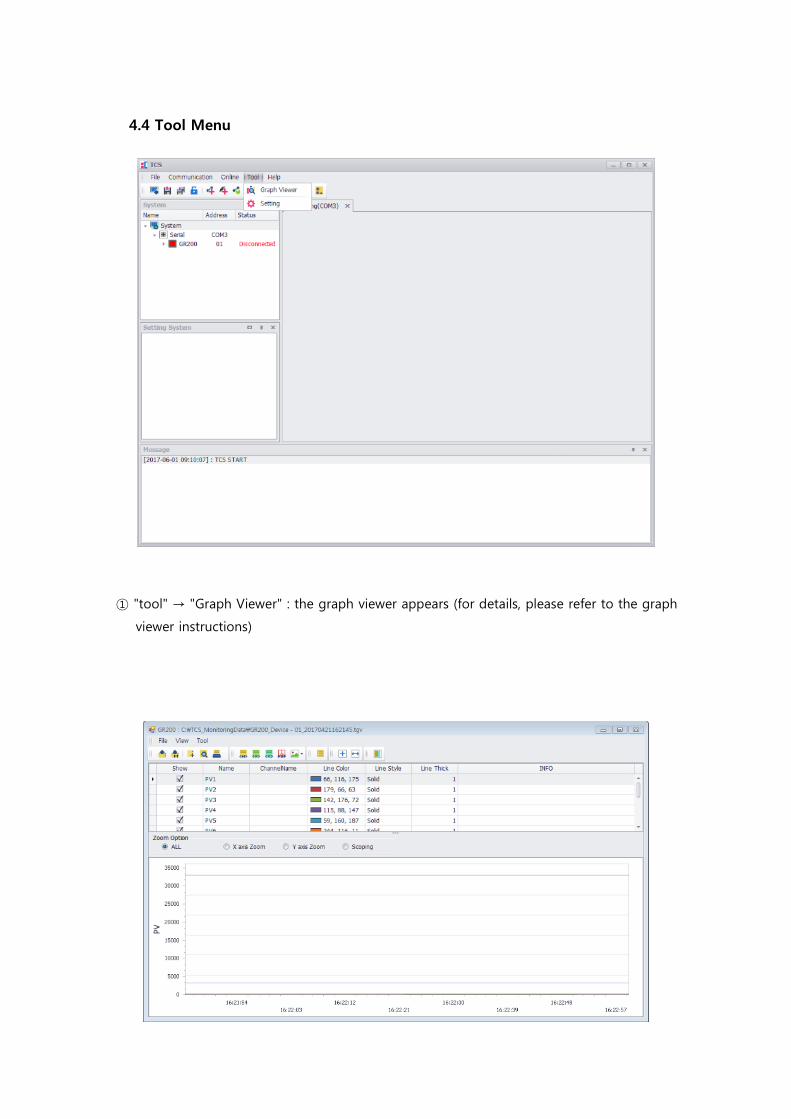
4.4 Tool Menu
① "tool" → "Graph Viewer" : the graph viewer appears (for details, please refer to the graph
viewer instructions)
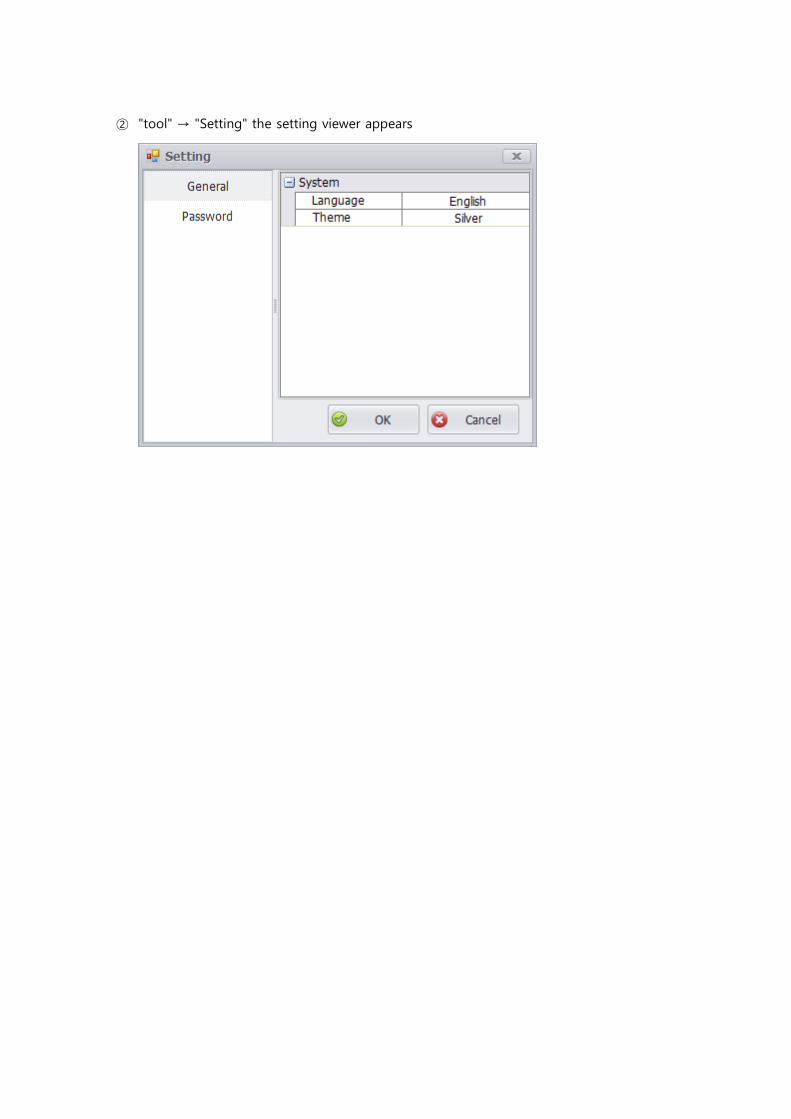
② "tool" → "Setting" the setting viewer appears
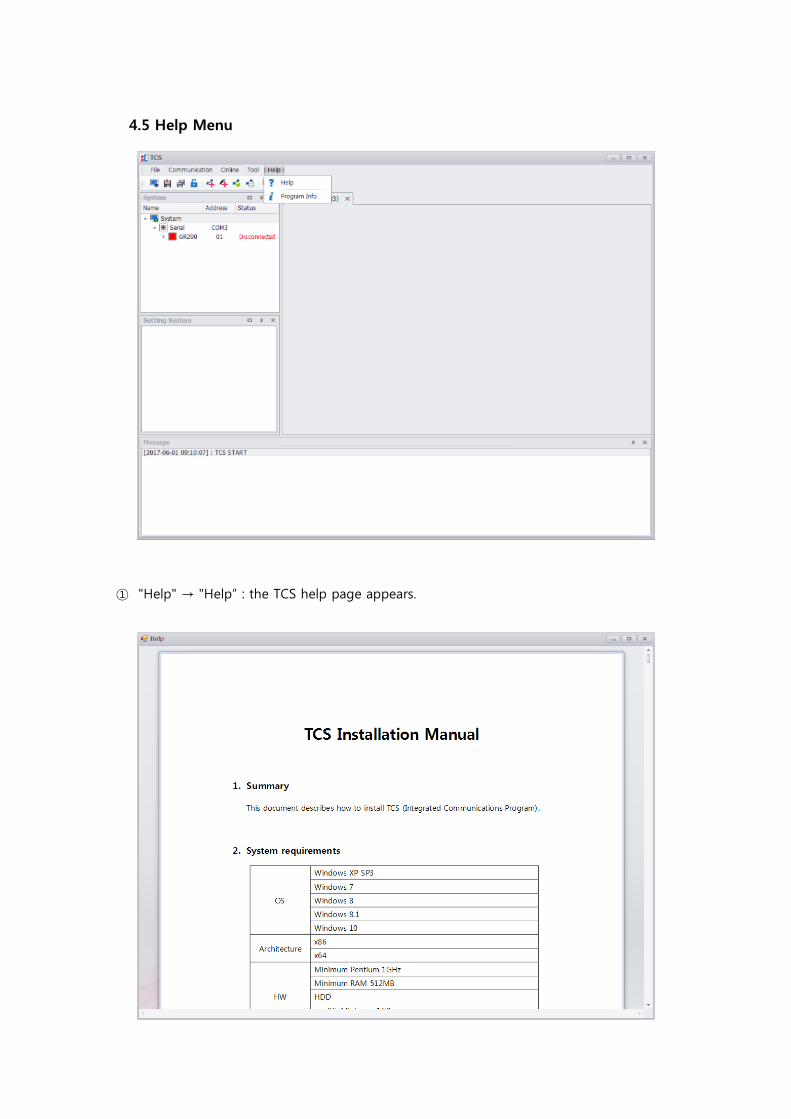
4.5 Help Menu
① "Help" → "Help” : the TCS help page appears.
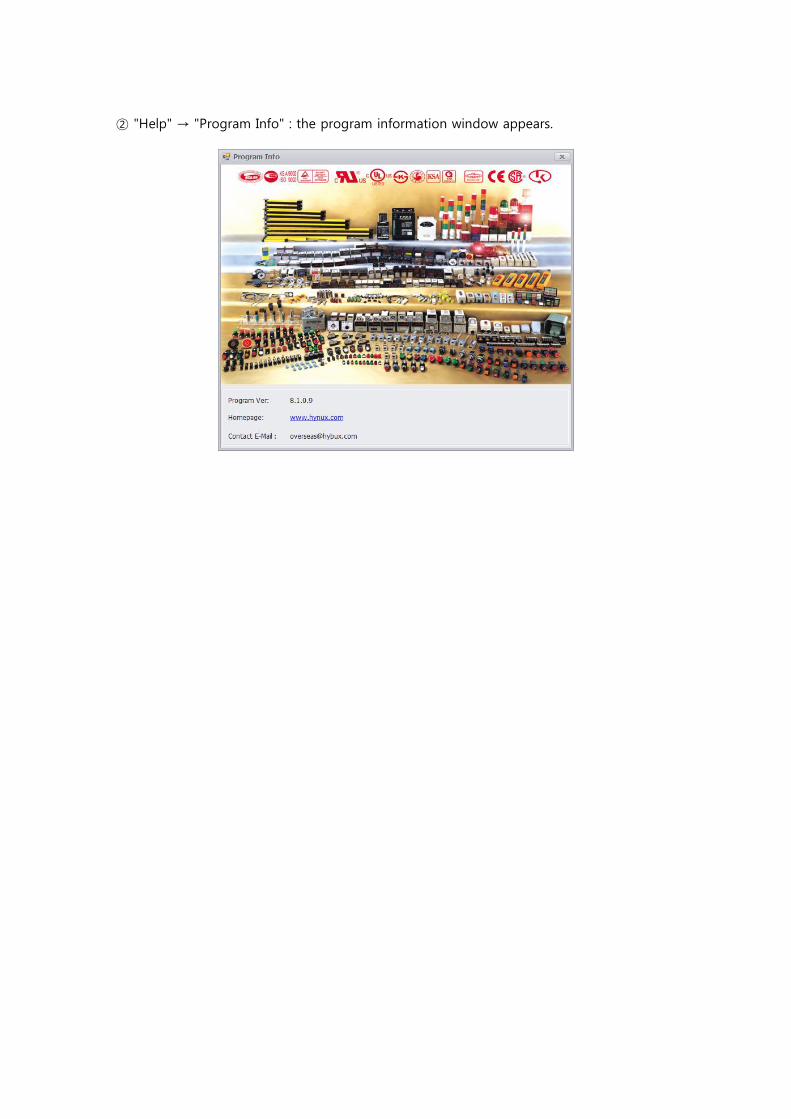
② "Help" → "Program Info" : the program information window appears.
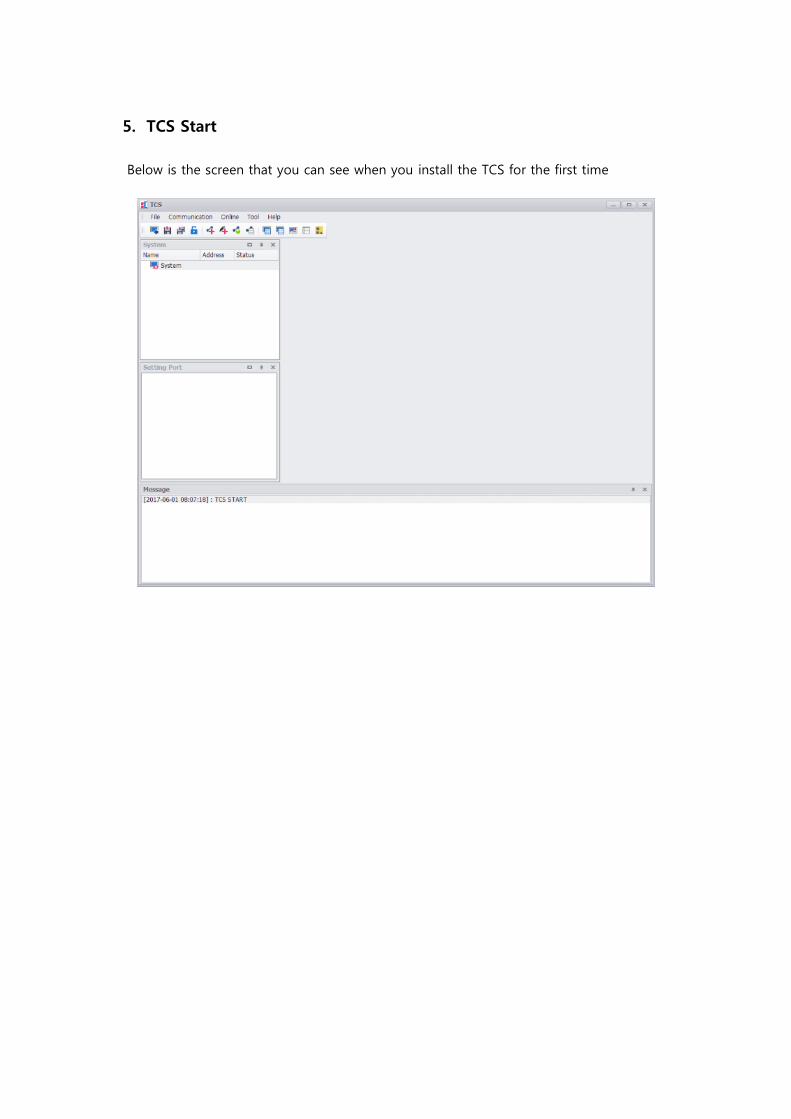
5. TCS Start
Below is the screen that you can see when you install the TCS for the first time
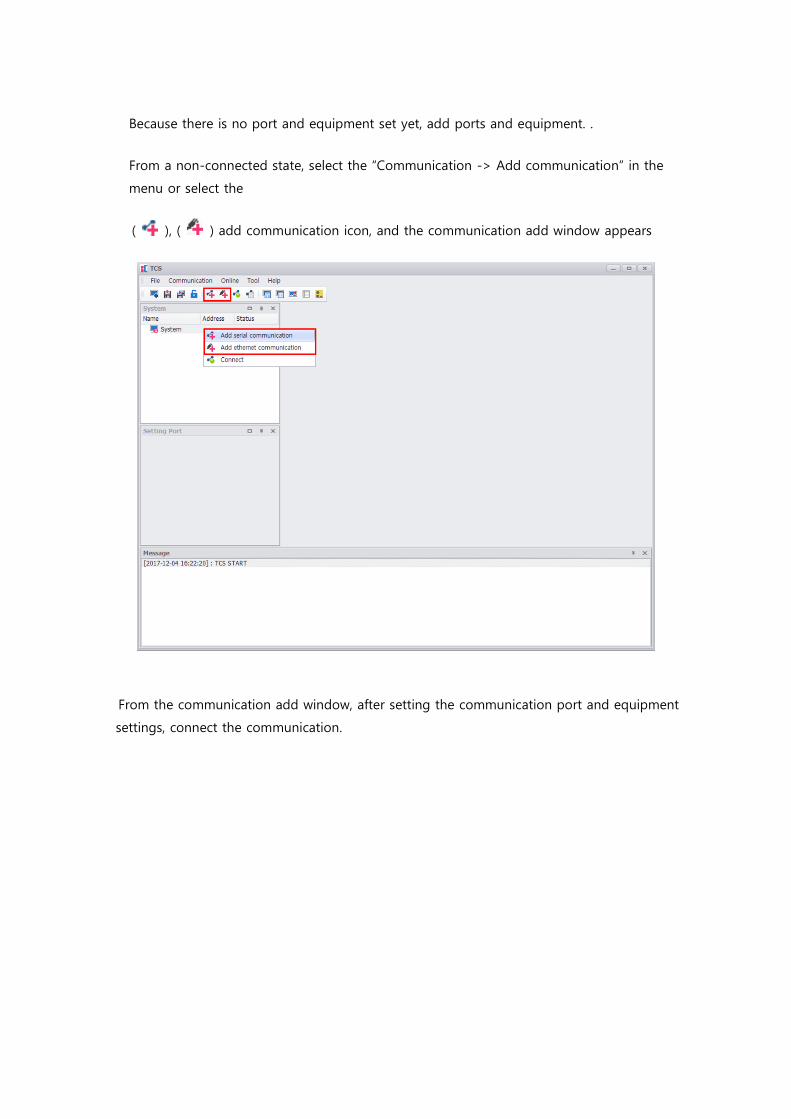
Because there is no port and equipment set yet, add ports and equipment. .
From a non-connected state, select the “Communication -> Add communication” in the
menu or select the
( ), ( ) add communication icon, and the communication add window appears
From the communication add window, after setting the communication port and equipment
settings, connect the communication.
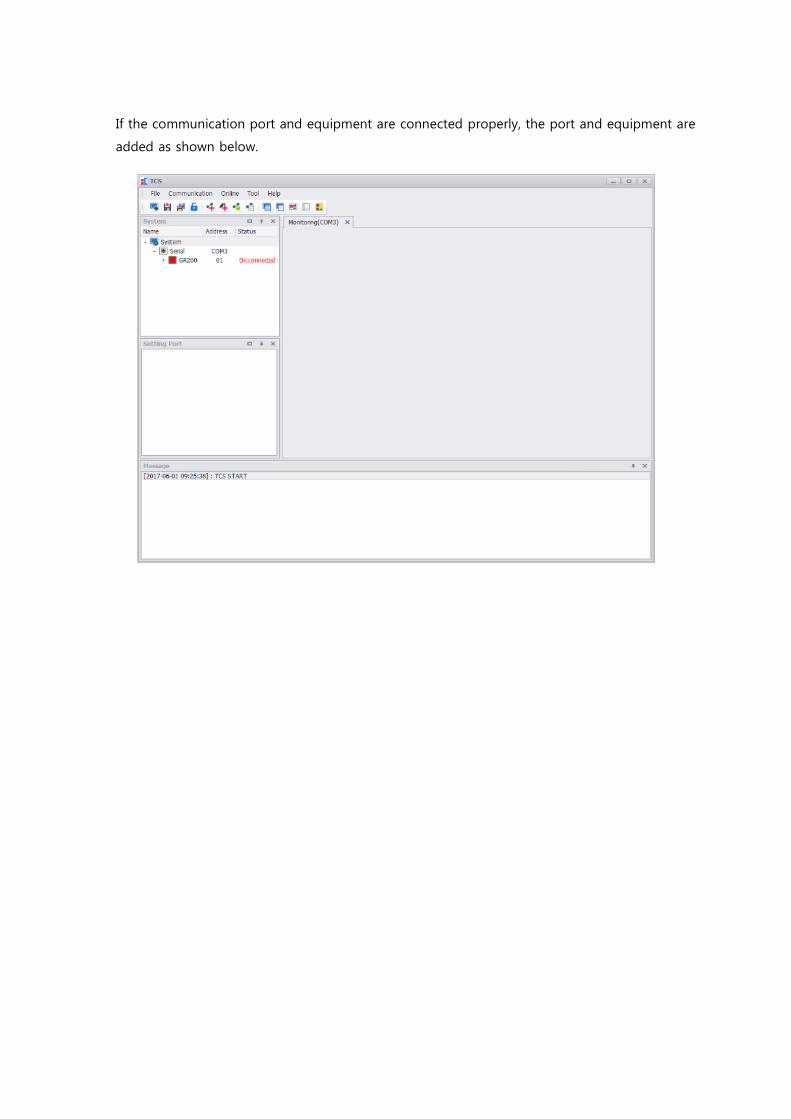
If the communication port and equipment are connected properly, the port and equipment are
added as shown below.
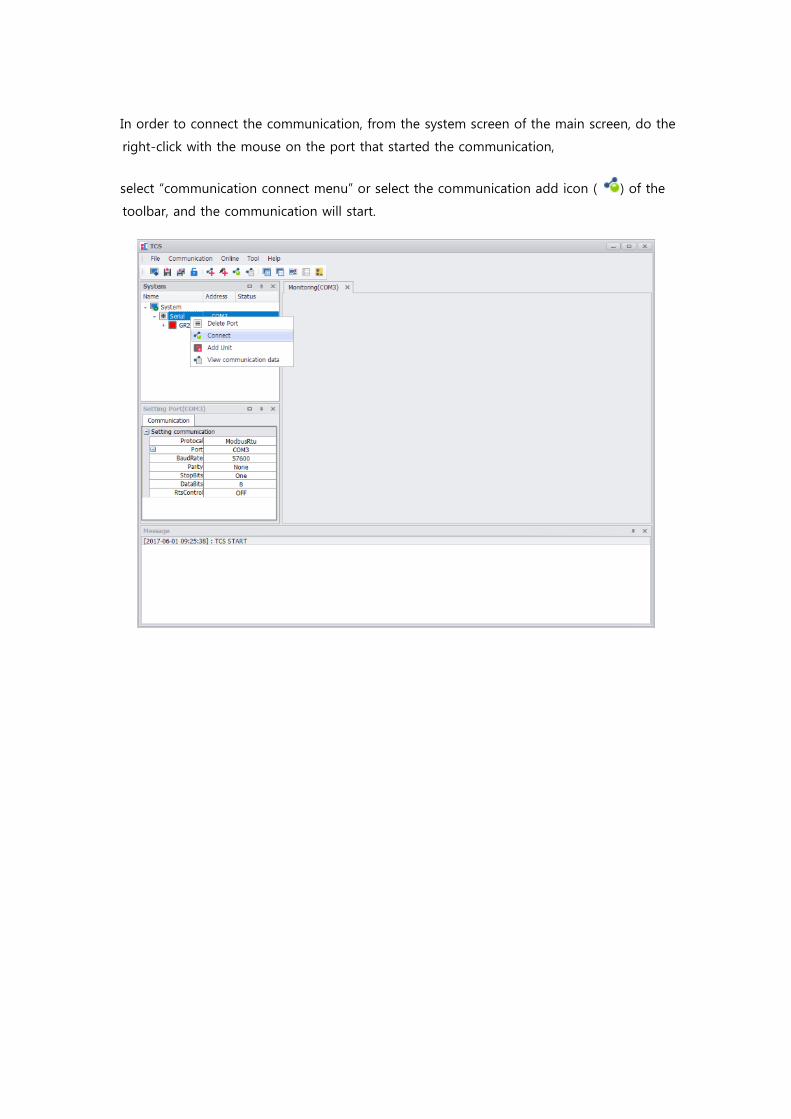
In order to connect the communication, from the system screen of the main screen, do the
right-click with the mouse on the port that started the communication,
select “communication connect menu” or select the communication add icon ( ) of the
toolbar, and the communication will start.
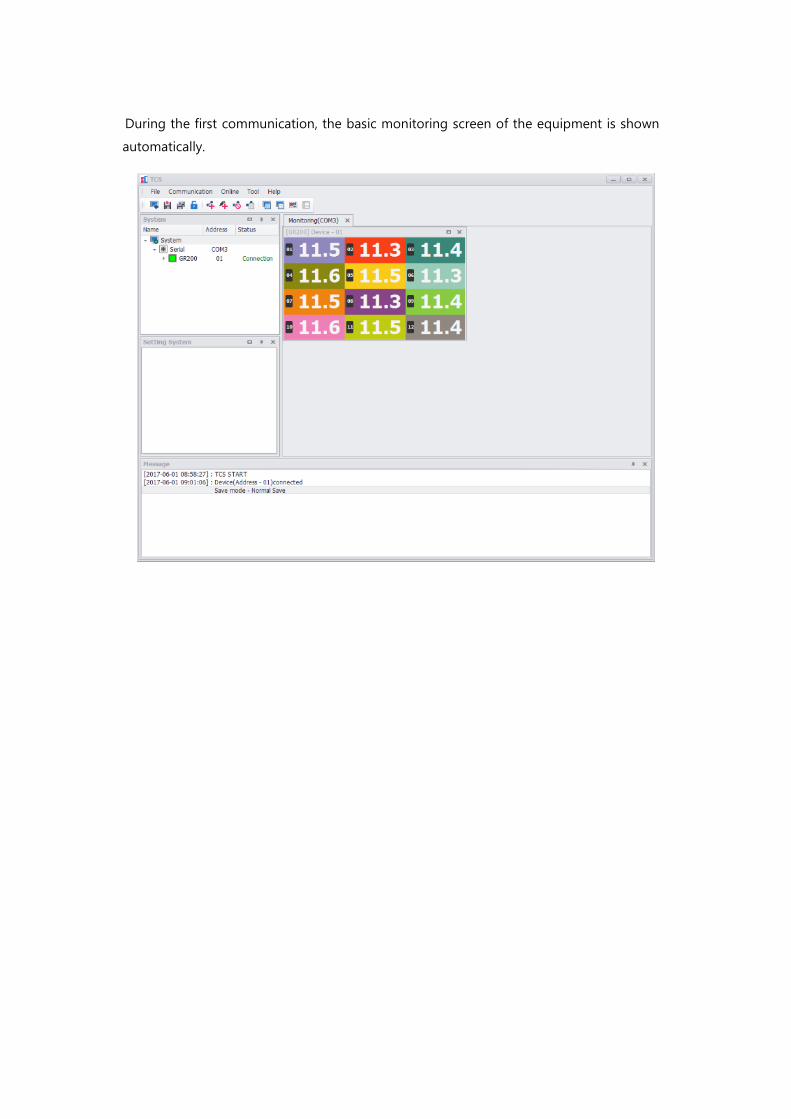
During the first communication, the basic monitoring screen of the equipment is shown
automatically.
6. Monitoring
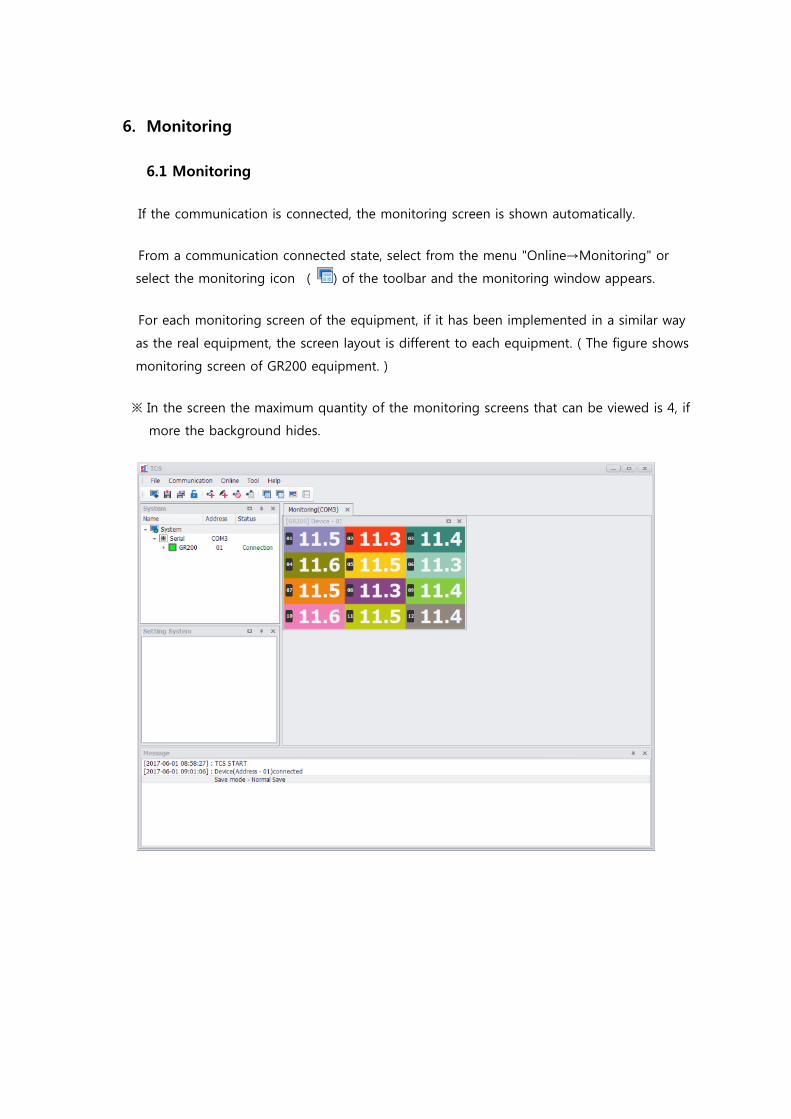
6.1 Monitoring
If the communication is connected, the monitoring screen is shown automatically.
From a communication connected state, select from the menu "Online→Monitoring" or
select the monitoring icon ( ) of the toolbar and the monitoring window appears.
For each monitoring screen of the equipment, if it has been implemented in a similar way
as the real equipment, the screen layout is different to each equipment. ( The figure shows
monitoring screen of GR200 equipment. )
※ In the screen the maximum quantity of the monitoring screens that can be viewed is 4, if
more the background hides.
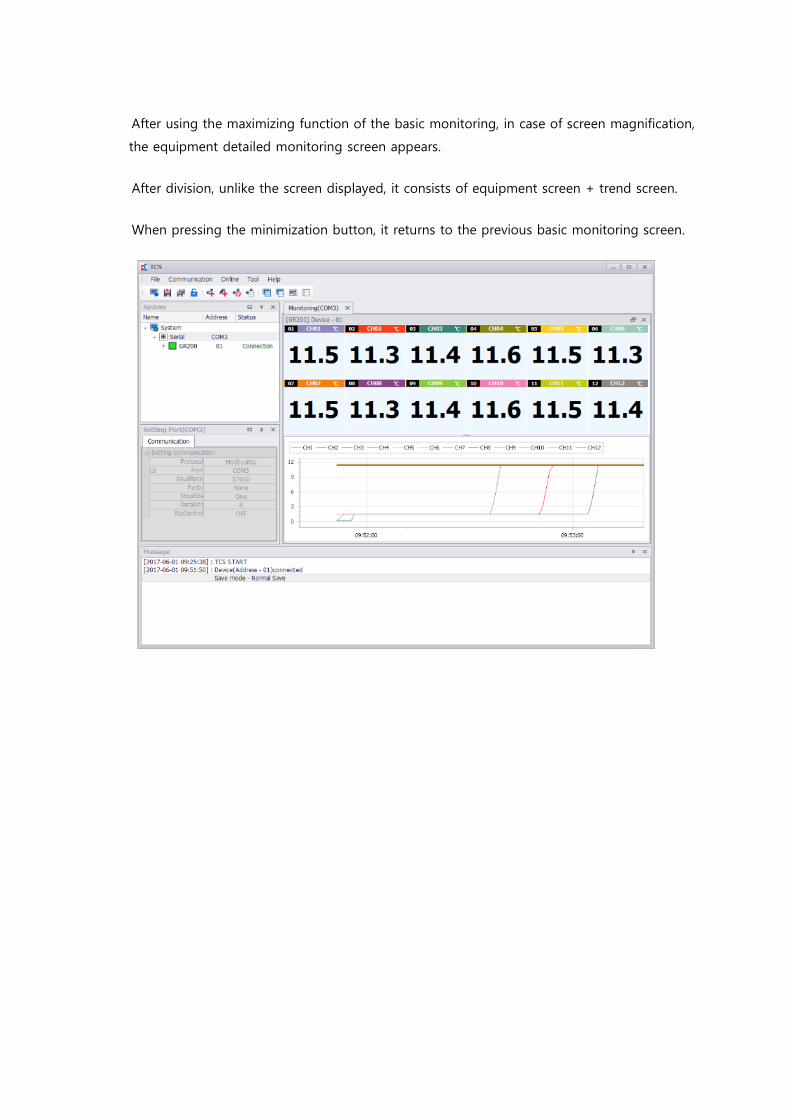
After using the maximizing function of the basic monitoring, in case of screen magnification,
the equipment detailed monitoring screen appears.
After division, unlike the screen displayed, it consists of equipment screen + trend screen.
When pressing the minimization button, it returns to the previous basic monitoring screen.
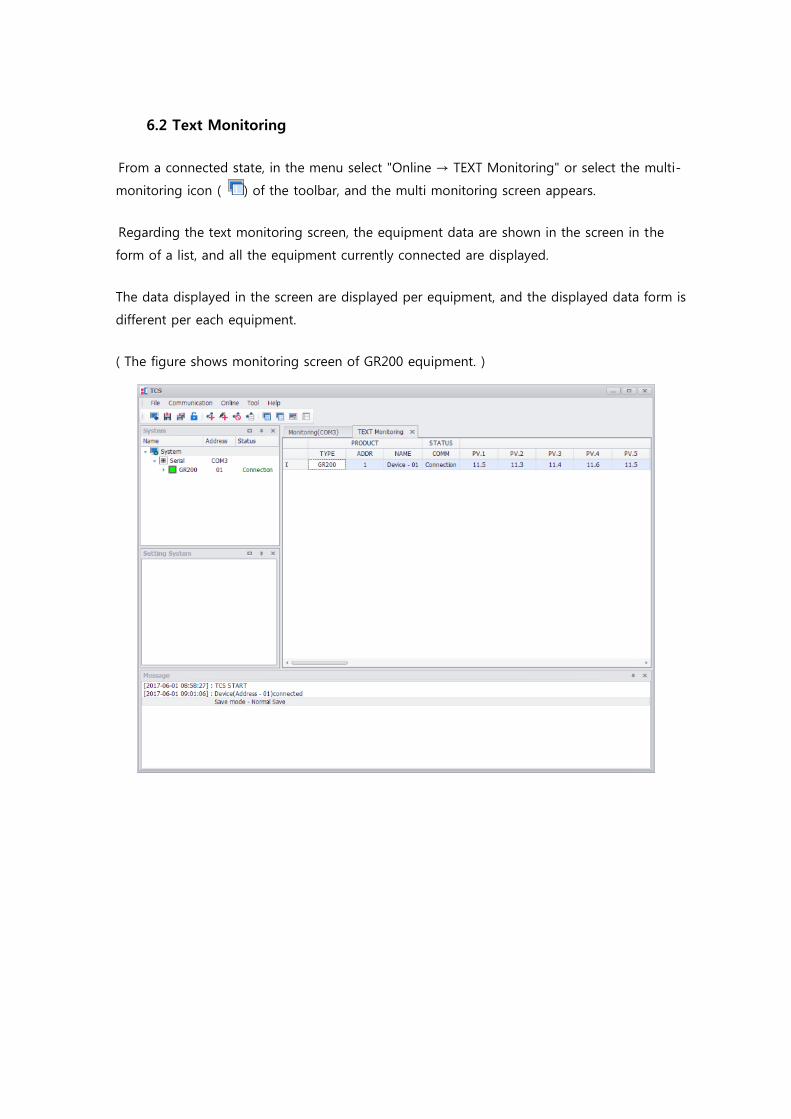
6.2 Text Monitoring
From a connected state, in the menu select "Online → TEXT Monitoring" or select the multi-
monitoring icon ( ) of the toolbar, and the multi monitoring screen appears.
Regarding the text monitoring screen, the equipment data are shown in the screen in the
form of a list, and all the equipment currently connected are displayed.
The data displayed in the screen are displayed per equipment, and the displayed data form is
different per each equipment.
( The figure shows monitoring screen of GR200 equipment. )
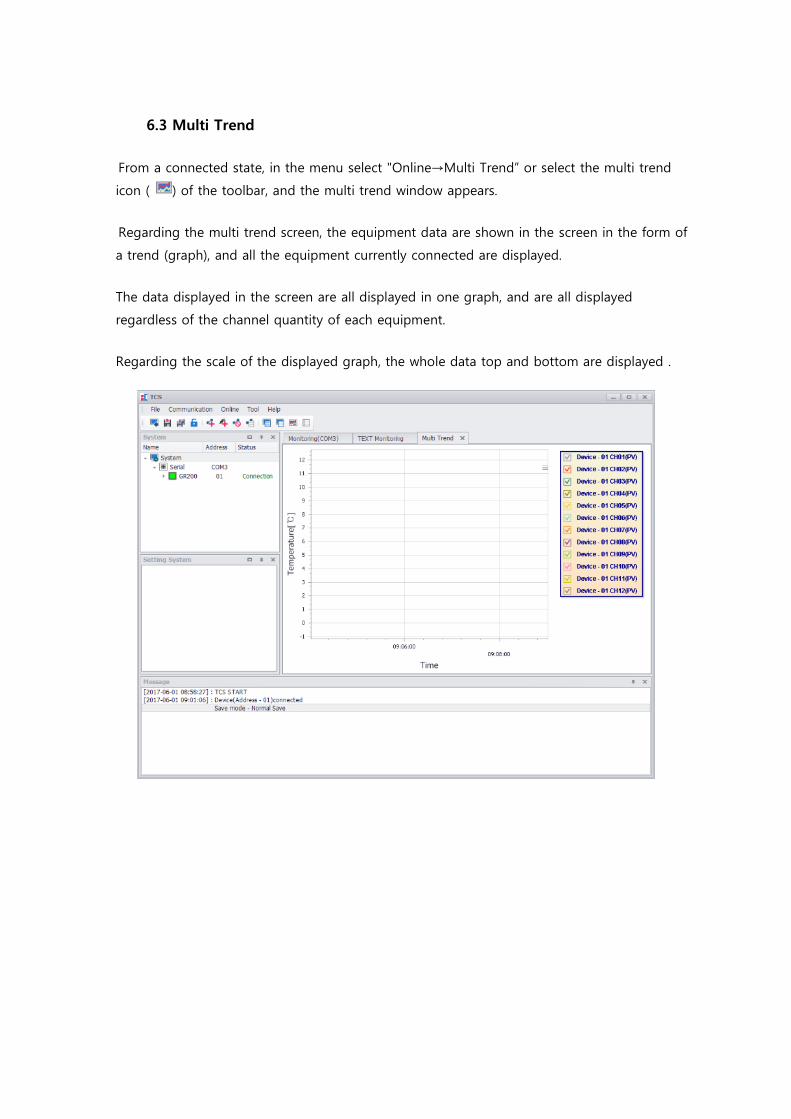
6.3 Multi Trend
From a connected state, in the menu select "Online→Multi Trend” or select the multi trend
icon ( ) of the toolbar, and the multi trend window appears.
Regarding the multi trend screen, the equipment data are shown in the screen in the form of
a trend (graph), and all the equipment currently connected are displayed.
The data displayed in the screen are all displayed in one graph, and are all displayed
regardless of the channel quantity of each equipment.
Regarding the scale of the displayed graph, the whole data top and bottom are displayed .
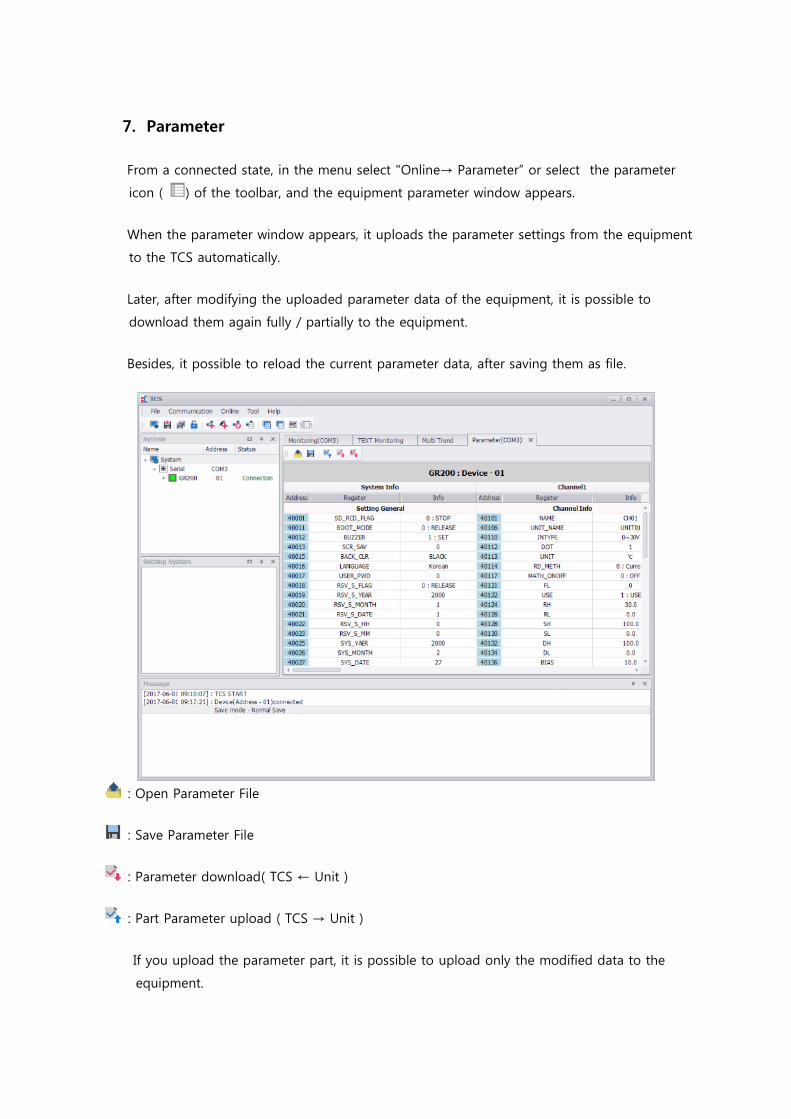
7. Parameter
From a connected state, in the menu select "Online→ Parameter” or select the parameter
icon ( ) of the toolbar, and the equipment parameter window appears.
When the parameter window appears, it uploads the parameter settings from the equipment
to the TCS automatically.
Later, after modifying the uploaded parameter data of the equipment, it is possible to
download them again fully / partially to the equipment.
Besides, it possible to reload the current parameter data, after saving them as file.
: Open Parameter File
: Save Parameter File
: Parameter download( TCS ← Unit )
: Part Parameter upload ( TCS → Unit )
If you upload the parameter part, it is possible to upload only the modified data to the
equipment.
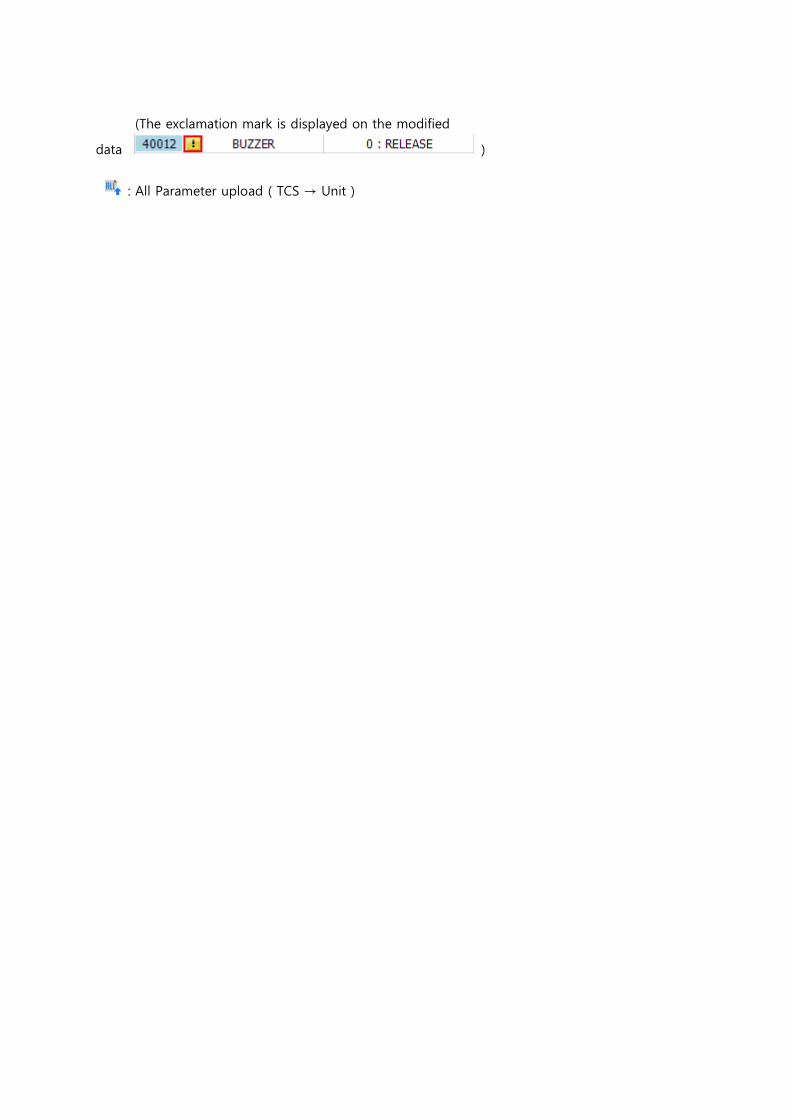
(The exclamation mark is displayed on the modified
data )
: All Parameter upload ( TCS → Unit )
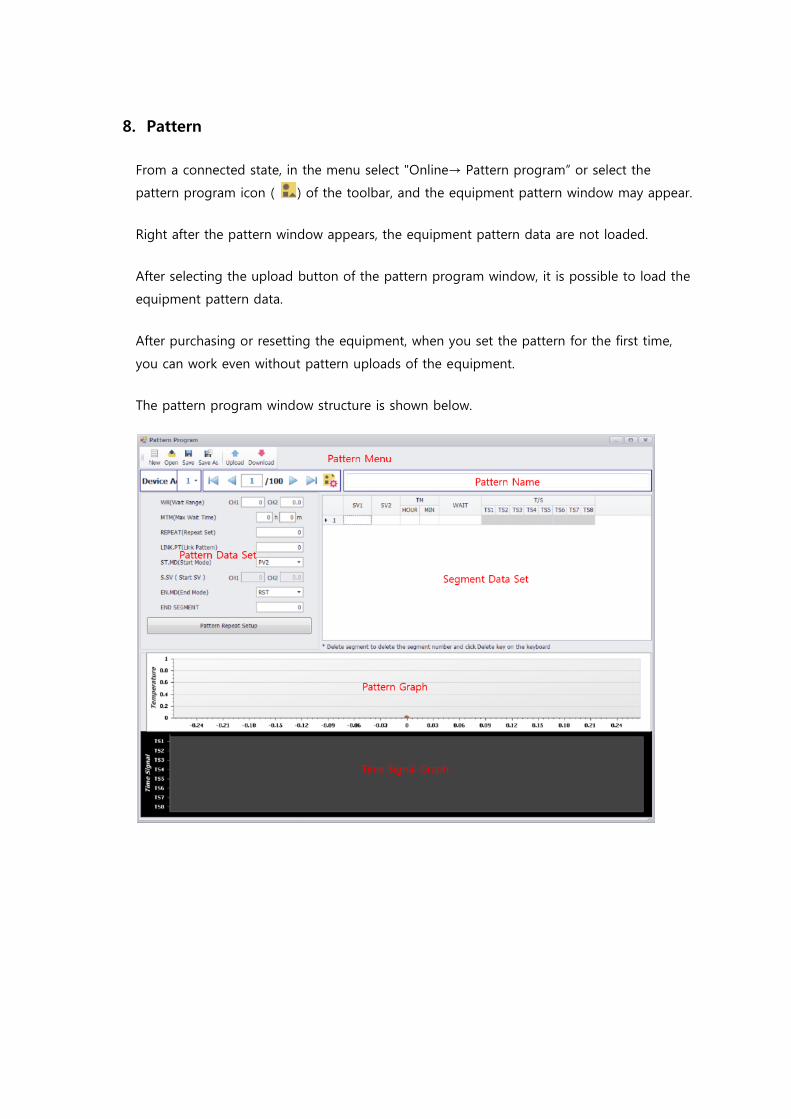
8. Pattern
From a connected state, in the menu select "Online→ Pattern program” or select the
pattern program icon ( ) of the toolbar, and the equipment pattern window may appear.
Right after the pattern window appears, the equipment pattern data are not loaded.
After selecting the upload button of the pattern program window, it is possible to load the
equipment pattern data.
After purchasing or resetting the equipment, when you set the pattern for the first time,
you can work even without pattern uploads of the equipment.
The pattern program window structure is shown below.
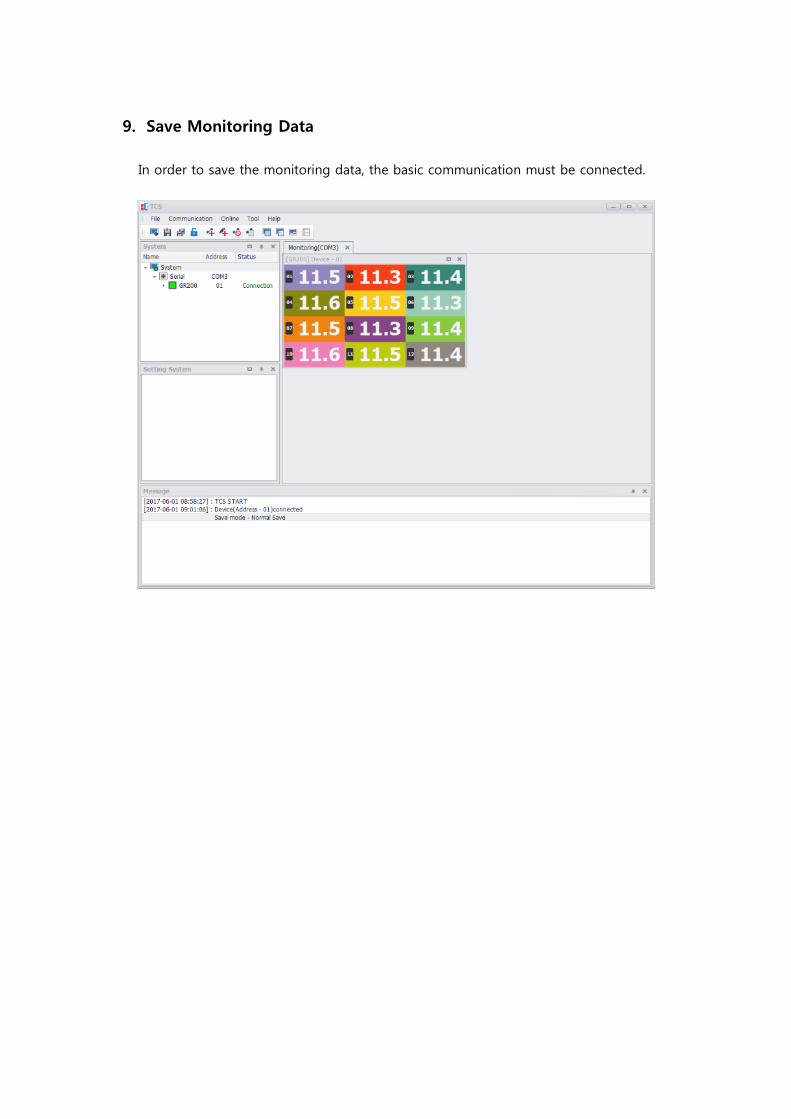
9. Save Monitoring Data
In order to save the monitoring data, the basic communication must be connected.
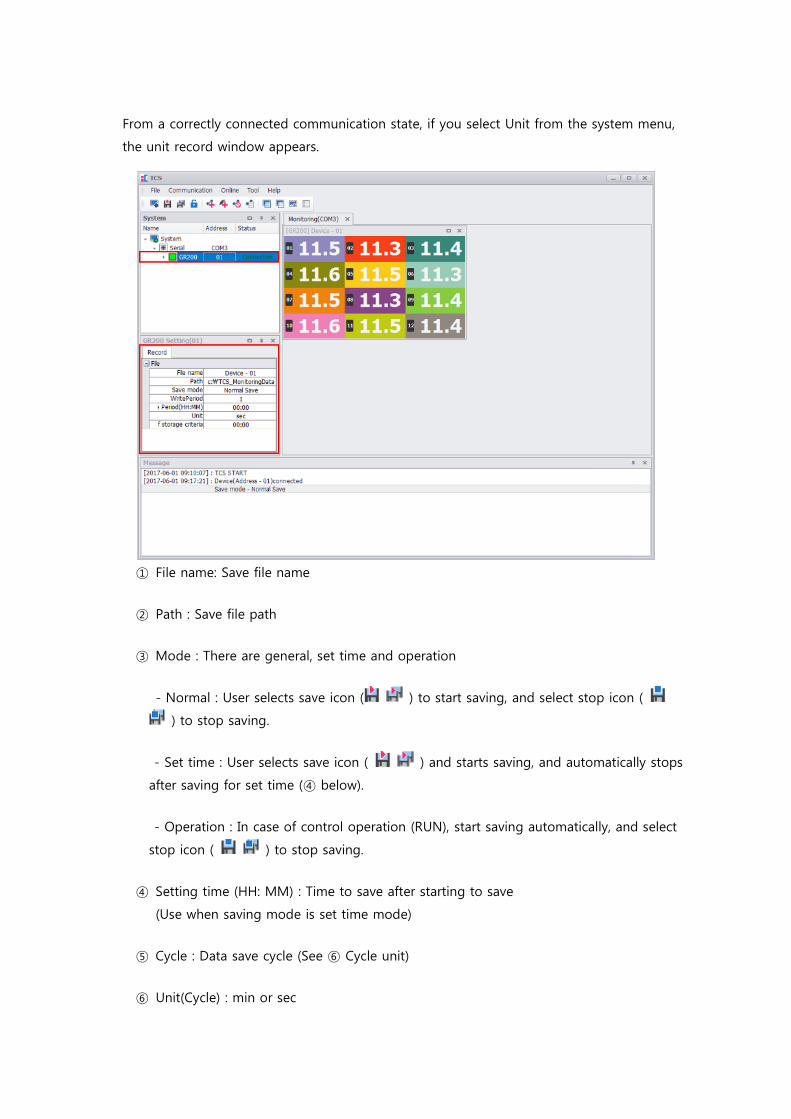
From a correctly connected communication state, if you select Unit from the system menu,
the unit record window appears.
① File name: Save file name
② Path : Save file path
③ Mode : There are general, set time and operation
- Normal : User selects save icon ( ) to start saving, and select stop icon (
) to stop saving.
- Set time : User selects save icon ( ) and starts saving, and automatically stops
after saving for set time (④ below).
- Operation : In case of control operation (RUN), start saving automatically, and select
stop icon ( ) to stop saving.
④ Setting time (HH: MM) : Time to save after starting to save
(Use when saving mode is set time mode)
⑤ Cycle : Data save cycle (See ⑥ Cycle unit)
⑥ Unit(Cycle) : min or sec
⑦ File creation time: The time when a new file is created (a
new file is created at the time set one day after the start of saving)
※ Regarding the monitoring data, in order to prevent the data enormity, a new file is created
daily basis .
※ Communication cycle and storage cycle do not match. The data at the time of storage is the
last value acquired by communication. Therefore, it may be different from the current value of
the equipment.
※ The communication cycle differs depending on the number of connected devices,
communication protocol and communication speed.
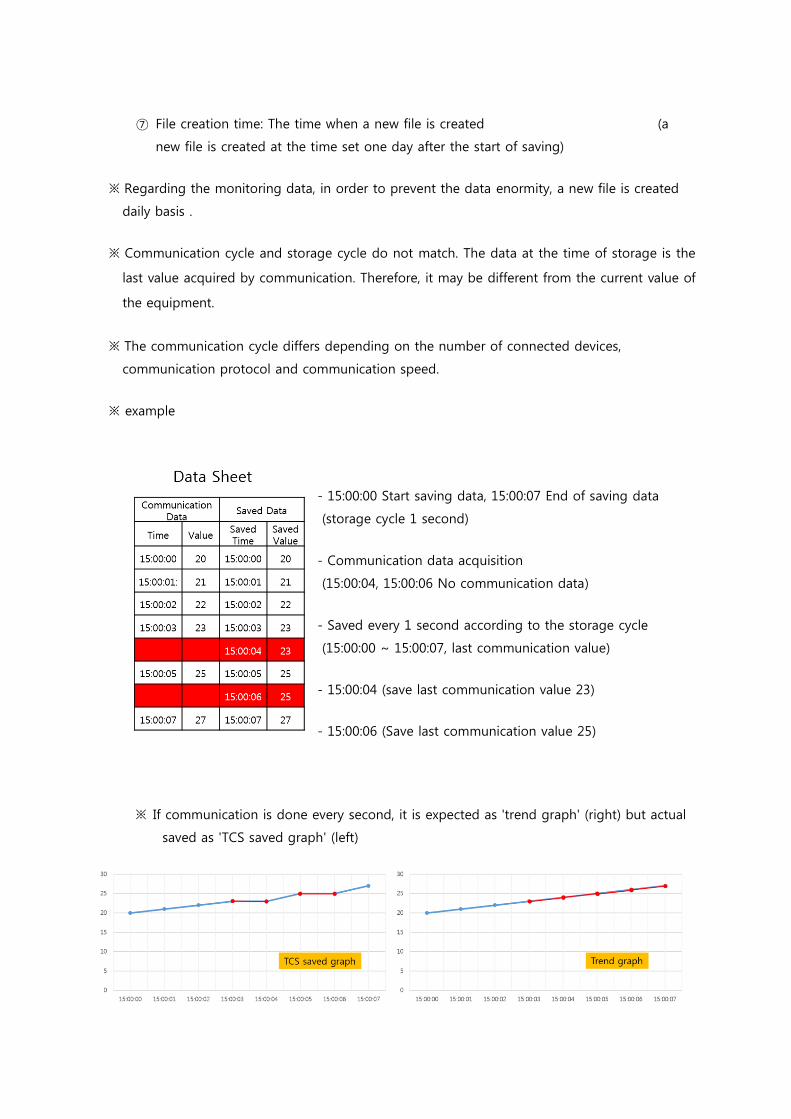
※ example
- 15:00:00 Start saving data, 15:00:07 End of saving data
(storage cycle 1 second)
- Communication data acquisition
(15:00:04, 15:00:06 No communication data)
- Saved every 1 second according to the storage cycle
(15:00:00 ~ 15:00:07, last communication value)
- 15:00:04 (save last communication value 23)
- 15:00:06 (Save last communication value 25)
※ If communication is done every second, it is expected as 'trend graph' (right) but actual
saved as 'TCS saved graph' (left)
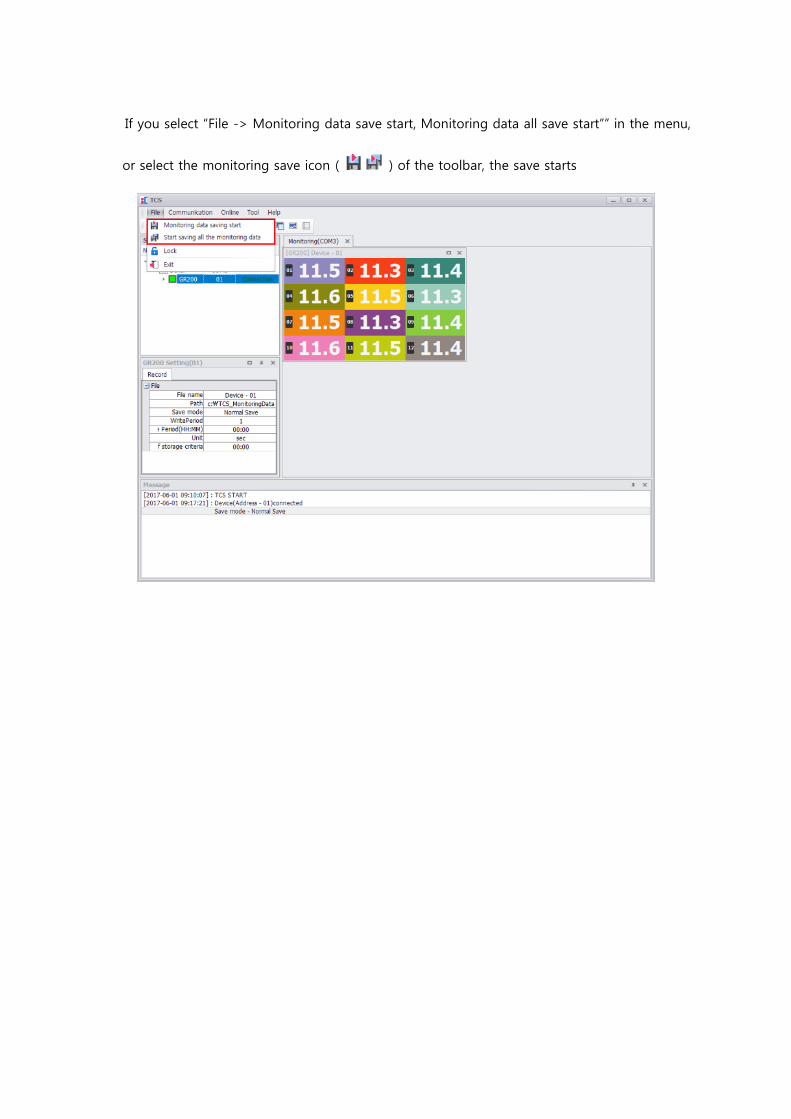
If you select “File -> Monitoring data save start, Monitoring data all save start”” in the menu,
or select the monitoring save icon ( ) of the toolbar, the save starts

If you want to stop the monitoring data saving, in the same way, you can select “File ->
Monitoring data save stop,
Monitoring data all save stop”” in the menu, or select the monitoring stop icon ( ) of
the toolbar
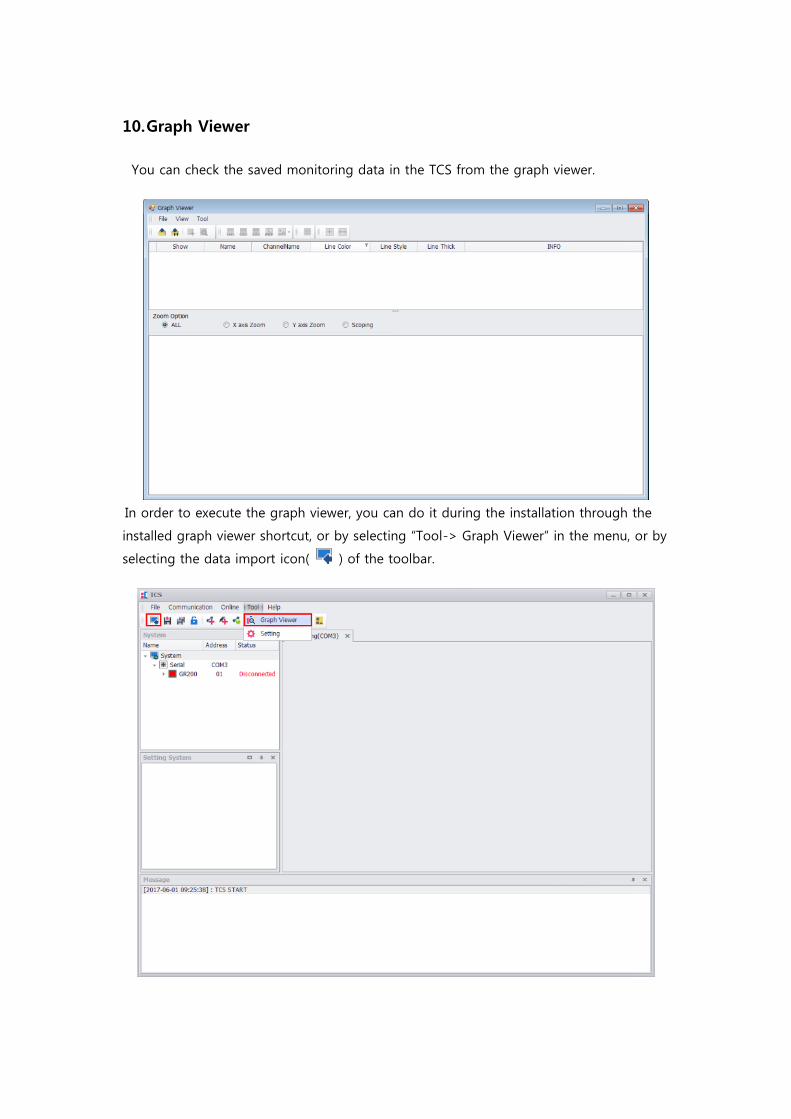
10. Graph Viewer
You can check the saved monitoring data in the TCS from the graph viewer.
In order to execute the graph viewer, you can do it during the installation through the
installed graph viewer shortcut, or by selecting “Tool-> Graph Viewer” in the menu, or by
selecting the data import icon( ) of the toolbar.
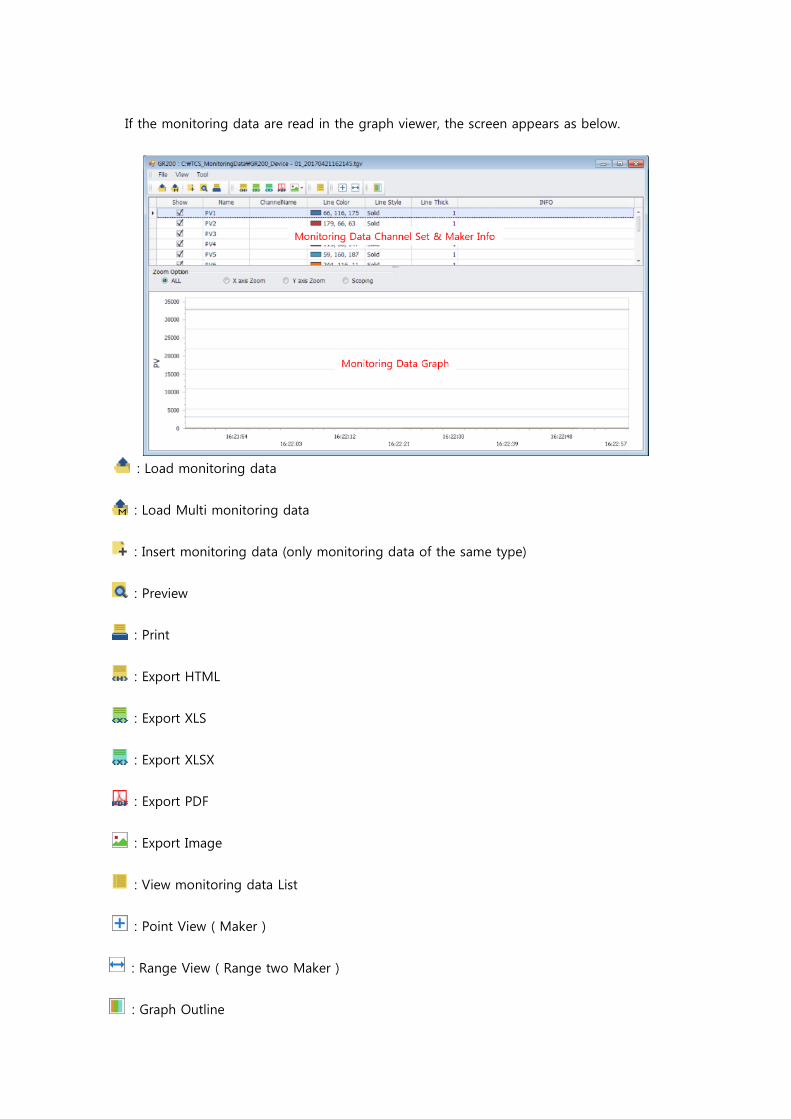
If the monitoring data are read in the graph viewer, the screen appears as below.
: Load monitoring data
: Load Multi monitoring data
: Insert monitoring data (only monitoring data of the same type)
: Preview
: Export HTML
: Export XLS
: Export XLSX
: Export PDF
: Export Image
: View monitoring data List
: Point View ( Maker )
: Range View ( Range two Maker )
: Graph Outline