Embed Size (px)
Citation preview
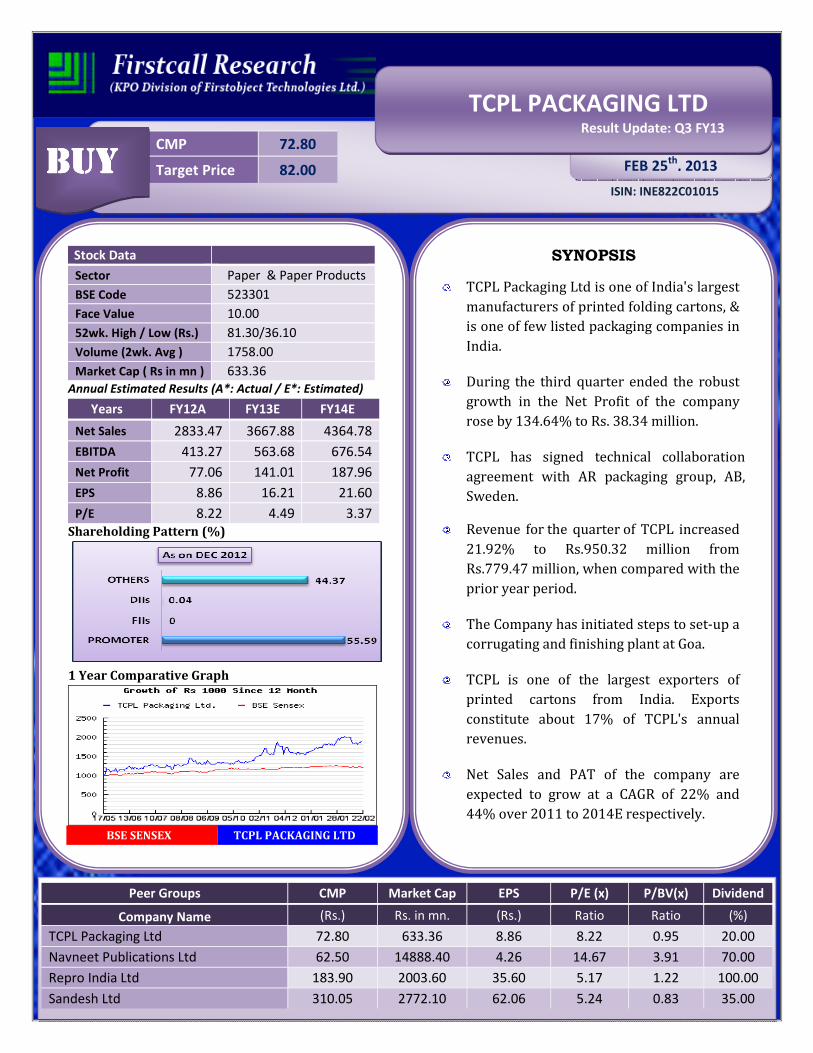
CMP 72.80
Target Price 82.00
ISIN: INE822C01015
FEB 25th
, 2013
TCPL PACKAGING LTD Result Update: Q3 FY13
BUYBUYBUYBUY
Stock Data
Sector Paper & Paper Products
BSE Code 523301
Face Value 10.00
52wk. High / Low (Rs.) 81.30/36.10
Volume (2wk. Avg ) 1758.00
Market Cap ( Rs in mn ) 633.36
Annual Estimated Results (A*: Actual / E*: Estimated)
Years FY12A FY13E FY14E
Net Sales 2833.47 3667.88 4364.78
EBITDA 413.27 563.68 676.54
Net Profit 77.06 141.01 187.96
EPS 8.86 16.21 21.60
P/E 8.22 4.49 3.37
Shareholding Pattern (%)
1 Year Comparative Graph
BSE SENSEX TCPL PACKAGING LTD
SYNOPSIS
TCPL Packaging Ltd is one of India's largest
manufacturers of printed folding cartons, &
is one of few listed packaging companies in
India.
During the third quarter ended the robust
growth in the Net Profit of the company
rose by 134.64% to Rs. 38.34 million.
TCPL has signed technical collaboration
agreement with AR packaging group, AB,
Sweden.
Revenue for the quarter of TCPL increased
21.92% to Rs.950.32 million from
Rs.779.47 million, when compared with the
prior year period.
The Company has initiated steps to set-up a
corrugating and finishing plant at Goa.
TCPL is one of the largest exporters of
printed cartons from India. Exports
constitute about 17% of TCPL's annual
revenues.
Net Sales and PAT of the company are
expected to grow at a CAGR of 22% and
44% over 2011 to 2014E respectively.
Peer Groups CMP Market Cap EPS P/E (x) P/BV(x) Dividend
Company Name (Rs.) Rs. in mn. (Rs.) Ratio Ratio (%)
TCPL Packaging Ltd 72.80 633.36 8.86 8.22 0.95 20.00
Navneet Publications Ltd 62.50 14888.40 4.26 14.67 3.91 70.00
Repro India Ltd 183.90 2003.60 35.60 5.17 1.22 100.00
Sandesh Ltd 310.05 2772.10 62.06 5.24 0.83 35.00
Investment Highlights
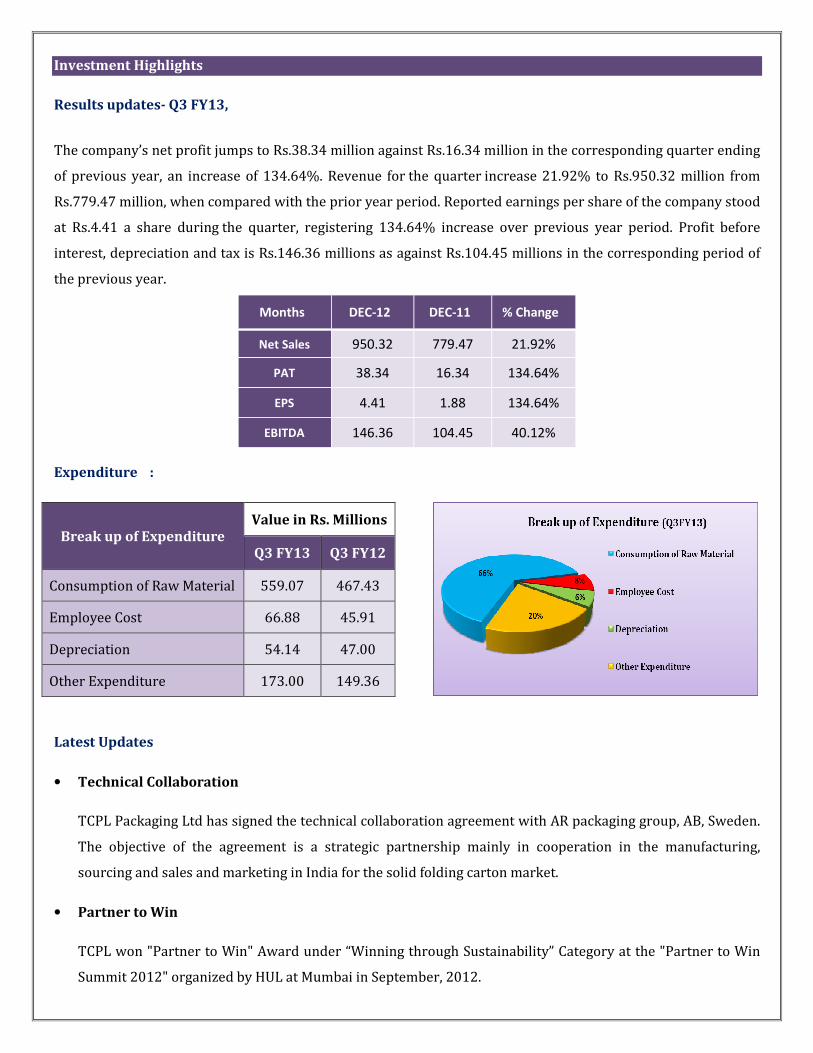
Results updates- Q3 FY13,
The company’s net profit jumps to Rs.38.34 million against Rs.16.34 million in the corresponding quarter ending
of previous year, an increase of 134.64%. Revenue for the quarter increase 21.92% to Rs.950.32 million from
Rs.779.47 million, when compared with the prior year period. Reported earnings per share of the company stood
at Rs.4.41 a share during the quarter, registering 134.64% increase over previous year period. Profit before
interest, depreciation and tax is Rs.146.36 millions as against Rs.104.45 millions in the corresponding period of
the previous year.
Months DEC-12 DEC-11 % Change
Net Sales 950.32 779.47 21.92%
PAT 38.34 16.34 134.64%
EPS 4.41 1.88 134.64%
EBITDA 146.36 104.45 40.12%
Expenditure :
Break up of Expenditure Value in Rs. Millions
Q3 FY13 Q3 FY12
Consumption of Raw Material 559.07 467.43
Employee Cost 66.88 45.91
Depreciation 54.14 47.00
Other Expenditure 173.00 149.36
Latest Updates
• Technical Collaboration
TCPL Packaging Ltd has signed the technical collaboration agreement with AR packaging group, AB, Sweden.
The objective of the agreement is a strategic partnership mainly in cooperation in the manufacturing,
sourcing and sales and marketing in India for the solid folding carton market.
• Partner to Win
TCPL won "Partner to Win" Award under “Winning through Sustainability” Category at the "Partner to Win
Summit 2012" organized by HUL at Mumbai in September, 2012.
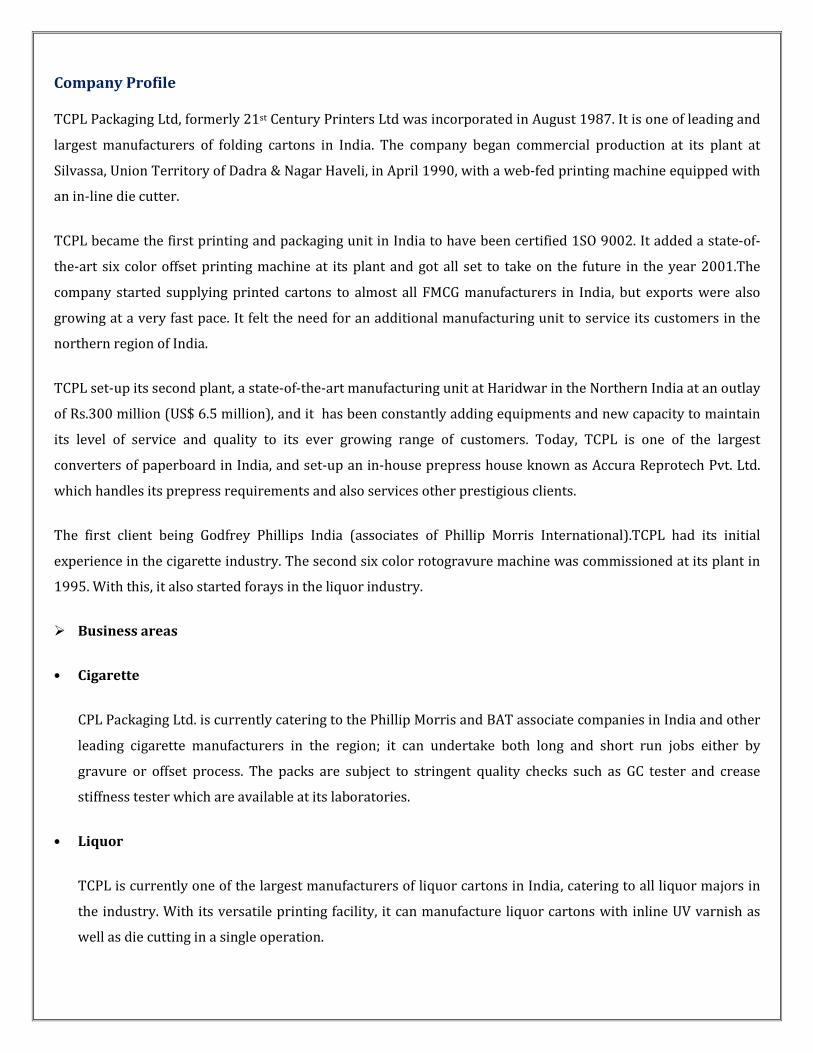
Company Profile
TCPL Packaging Ltd, formerly 21st Century Printers Ltd was incorporated in August 1987. It is one of leading and
largest manufacturers of folding cartons in India. The company began commercial production at its plant at
Silvassa, Union Territory of Dadra & Nagar Haveli, in April 1990, with a web-fed printing machine equipped with
an in-line die cutter.
TCPL became the first printing and packaging unit in India to have been certified 1SO 9002. It added a state-of-
the-art six color offset printing machine at its plant and got all set to take on the future in the year 2001.The
company started supplying printed cartons to almost all FMCG manufacturers in India, but exports were also
growing at a very fast pace. It felt the need for an additional manufacturing unit to service its customers in the
northern region of India.
TCPL set-up its second plant, a state-of-the-art manufacturing unit at Haridwar in the Northern India at an outlay
of Rs.300 million (US$ 6.5 million), and it has been constantly adding equipments and new capacity to maintain
its level of service and quality to its ever growing range of customers. Today, TCPL is one of the largest
converters of paperboard in India, and set-up an in-house prepress house known as Accura Reprotech Pvt. Ltd.
which handles its prepress requirements and also services other prestigious clients.
The first client being Godfrey Phillips India (associates of Phillip Morris International).TCPL had its initial
experience in the cigarette industry. The second six color rotogravure machine was commissioned at its plant in
1995. With this, it also started forays in the liquor industry.
� Business areas
• Cigarette
CPL Packaging Ltd. is currently catering to the Phillip Morris and BAT associate companies in India and other
leading cigarette manufacturers in the region; it can undertake both long and short run jobs either by
gravure or offset process. The packs are subject to stringent quality checks such as GC tester and crease
stiffness tester which are available at its laboratories.
• Liquor
TCPL is currently one of the largest manufacturers of liquor cartons in India, catering to all liquor majors in
the industry. With its versatile printing facility, it can manufacture liquor cartons with inline UV varnish as
well as die cutting in a single operation.
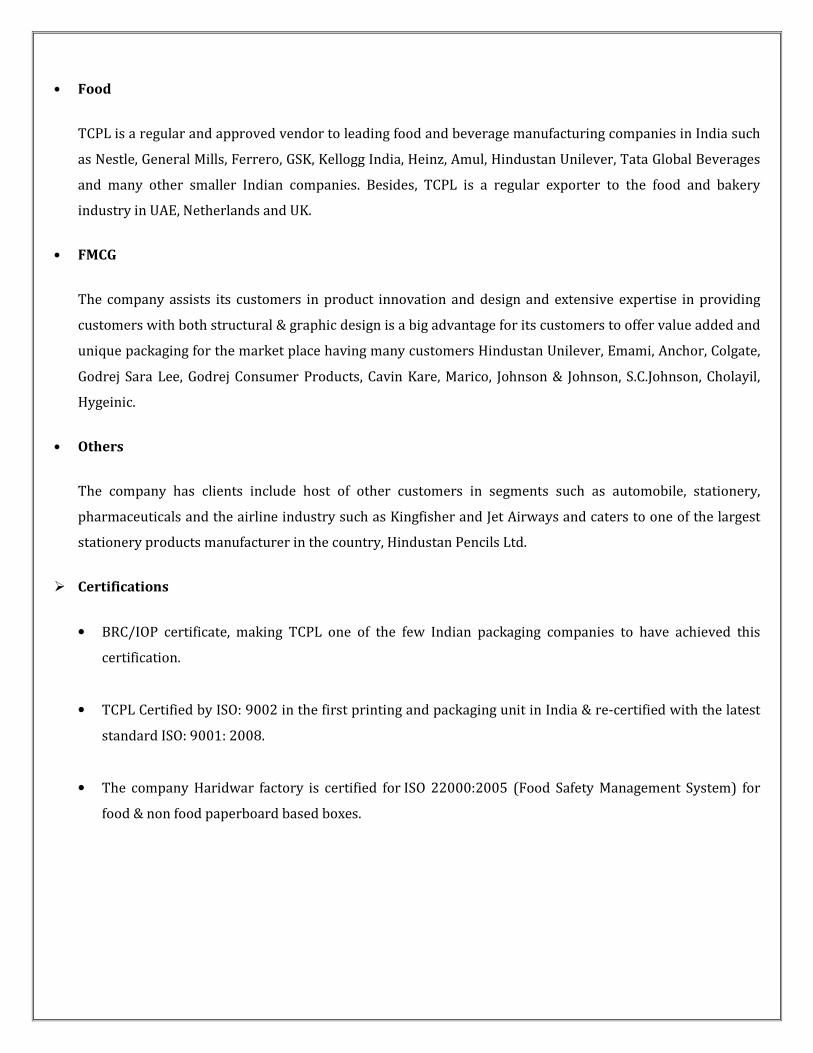
• Food
TCPL is a regular and approved vendor to leading food and beverage manufacturing companies in India such
as Nestle, General Mills, Ferrero, GSK, Kellogg India, Heinz, Amul, Hindustan Unilever, Tata Global Beverages
and many other smaller Indian companies. Besides, TCPL is a regular exporter to the food and bakery
industry in UAE, Netherlands and UK.
• FMCG
The company assists its customers in product innovation and design and extensive expertise in providing
customers with both structural & graphic design is a big advantage for its customers to offer value added and
unique packaging for the market place having many customers Hindustan Unilever, Emami, Anchor, Colgate,
Godrej Sara Lee, Godrej Consumer Products, Cavin Kare, Marico, Johnson & Johnson, S.C.Johnson, Cholayil,
Hygeinic.
• Others
The company has clients include host of other customers in segments such as automobile, stationery,
pharmaceuticals and the airline industry such as Kingfisher and Jet Airways and caters to one of the largest
stationery products manufacturer in the country, Hindustan Pencils Ltd.
� Certifications
• BRC/IOP certificate, making TCPL one of the few Indian packaging companies to have achieved this
certification.
• TCPL Certified by ISO: 9002 in the first printing and packaging unit in India & re-certified with the latest
standard ISO: 9001: 2008.
• The company Haridwar factory is certified for ISO 22000:2005 (Food Safety Management System) for
food & non food paperboard based boxes.
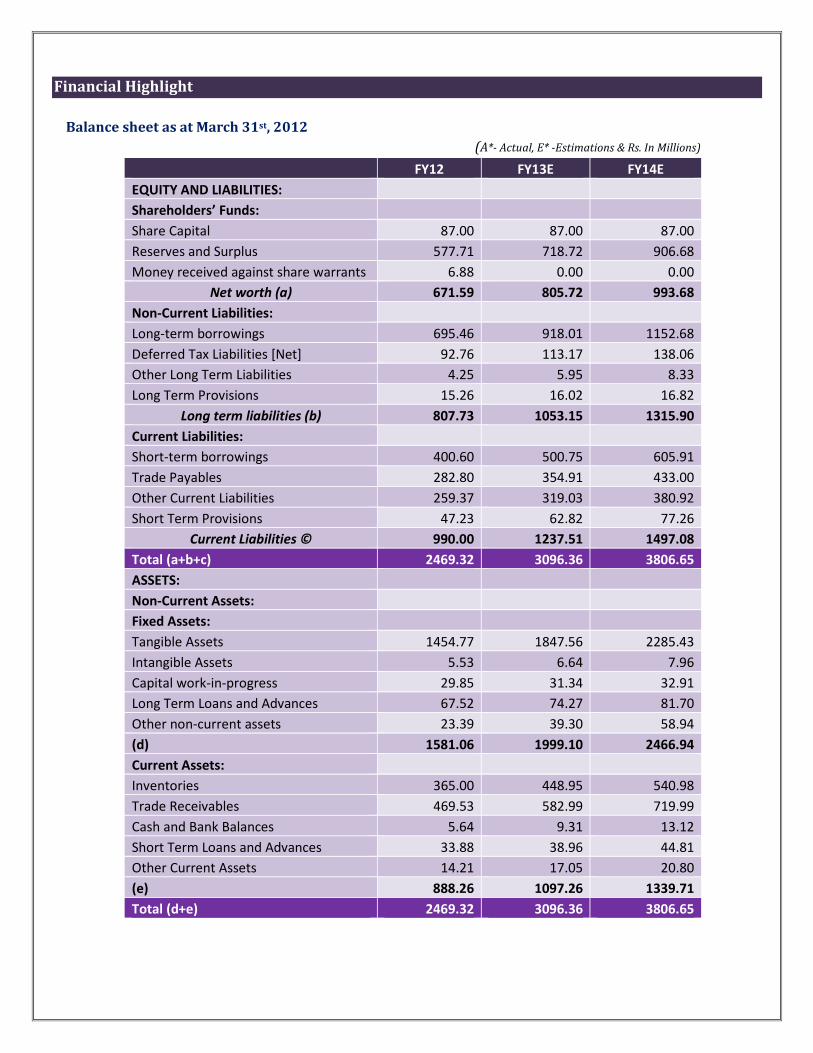
Financial Highlight
Balance sheet as at March 31st, 2012
(A*- Actual, E* -Estimations & Rs. In Millions)
FY12 FY13E FY14E
EQUITY AND LIABILITIES:
Shareholders’ Funds:
Share Capital 87.00 87.00 87.00
Reserves and Surplus 577.71 718.72 906.68
Money received against share warrants 6.88 0.00 0.00
Net worth (a) 671.59 805.72 993.68
Non-Current Liabilities:
Long-term borrowings 695.46 918.01 1152.68
Deferred Tax Liabilities [Net] 92.76 113.17 138.06
Other Long Term Liabilities 4.25 5.95 8.33
Long Term Provisions 15.26 16.02 16.82
Long term liabilities (b) 807.73 1053.15 1315.90
Current Liabilities:
Short-term borrowings 400.60 500.75 605.91
Trade Payables 282.80 354.91 433.00
Other Current Liabilities 259.37 319.03 380.92
Short Term Provisions 47.23 62.82 77.26
Current Liabilities © 990.00 1237.51 1497.08
Total (a+b+c) 2469.32 3096.36 3806.65
ASSETS:
Non-Current Assets:
Fixed Assets:
Tangible Assets 1454.77 1847.56 2285.43
Intangible Assets 5.53 6.64 7.96
Capital work-in-progress 29.85 31.34 32.91
Long Term Loans and Advances 67.52 74.27 81.70
Other non-current assets 23.39 39.30 58.94
(d) 1581.06 1999.10 2466.94
Current Assets:
Inventories 365.00 448.95 540.98
Trade Receivables 469.53 582.99 719.99
Cash and Bank Balances 5.64 9.31 13.12
Short Term Loans and Advances 33.88 38.96 44.81
Other Current Assets 14.21 17.05 20.80
(e) 888.26 1097.26 1339.71
Total (d+e) 2469.32 3096.36 3806.65
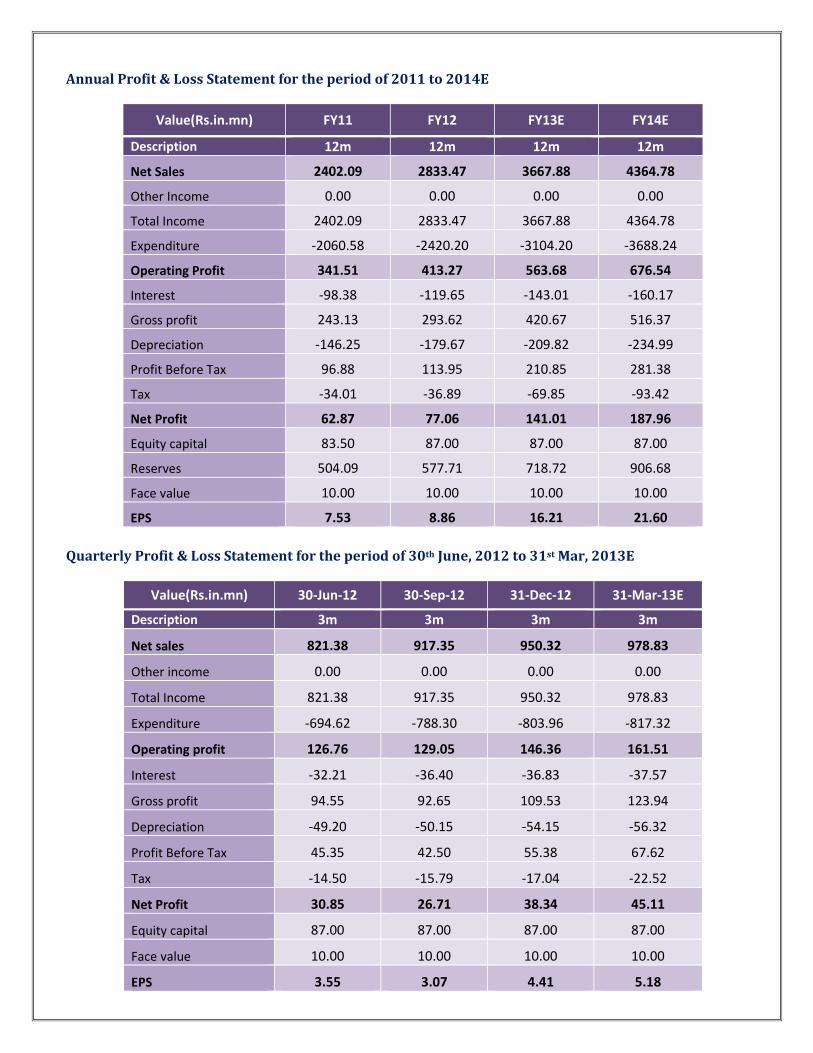
Annual Profit & Loss Statement for the period of 2011 to 2014E
Value(Rs.in.mn) FY11 FY12 FY13E FY14E
Description 12m 12m 12m 12m
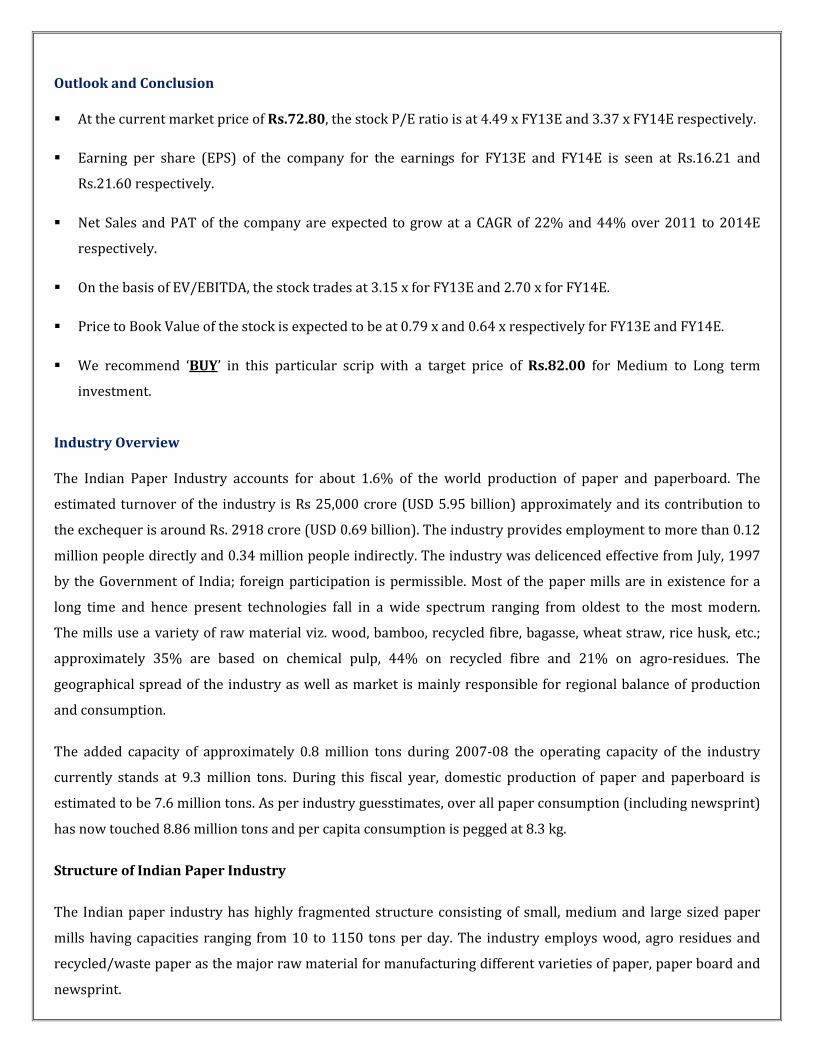
Net Sales 2402.09 2833.47 3667.88 4364.78
Other Income 0.00 0.00 0.00 0.00
Total Income 2402.09 2833.47 3667.88 4364.78
Expenditure -2060.58 -2420.20 -3104.20 -3688.24
Operating Profit 341.51 413.27 563.68 676.54
Interest -98.38 -119.65 -143.01 -160.17
Gross profit 243.13 293.62 420.67 516.37
Depreciation -146.25 -179.67 -209.82 -234.99
Profit Before Tax 96.88 113.95 210.85 281.38
Tax -34.01 -36.89 -69.85 -93.42
Net Profit 62.87 77.06 141.01 187.96
Equity capital 83.50 87.00 87.00 87.00
Reserves 504.09 577.71 718.72 906.68
Face value 10.00 10.00 10.00 10.00
EPS 7.53 8.86 16.21 21.60
Quarterly Profit & Loss Statement for the period of 30th June, 2012 to 31st Mar, 2013E
Value(Rs.in.mn) 30-Jun-12 30-Sep-12 31-Dec-12 31-Mar-13E
Description 3m 3m 3m 3m
Net sales 821.38 917.35 950.32 978.83
Other income 0.00 0.00 0.00 0.00
Total Income 821.38 917.35 950.32 978.83
Expenditure -694.62 -788.30 -803.96 -817.32
Operating profit 126.76 129.05 146.36 161.51
Interest -32.21 -36.40 -36.83 -37.57
Gross profit 94.55 92.65 109.53 123.94
Depreciation -49.20 -50.15 -54.15 -56.32
Profit Before Tax 45.35 42.50 55.38 67.62
Tax -14.50 -15.79 -17.04 -22.52
Net Profit 30.85 26.71 38.34 45.11
Equity capital 87.00 87.00 87.00 87.00
Face value 10.00 10.00 10.00 10.00
EPS 3.55 3.07 4.41 5.18
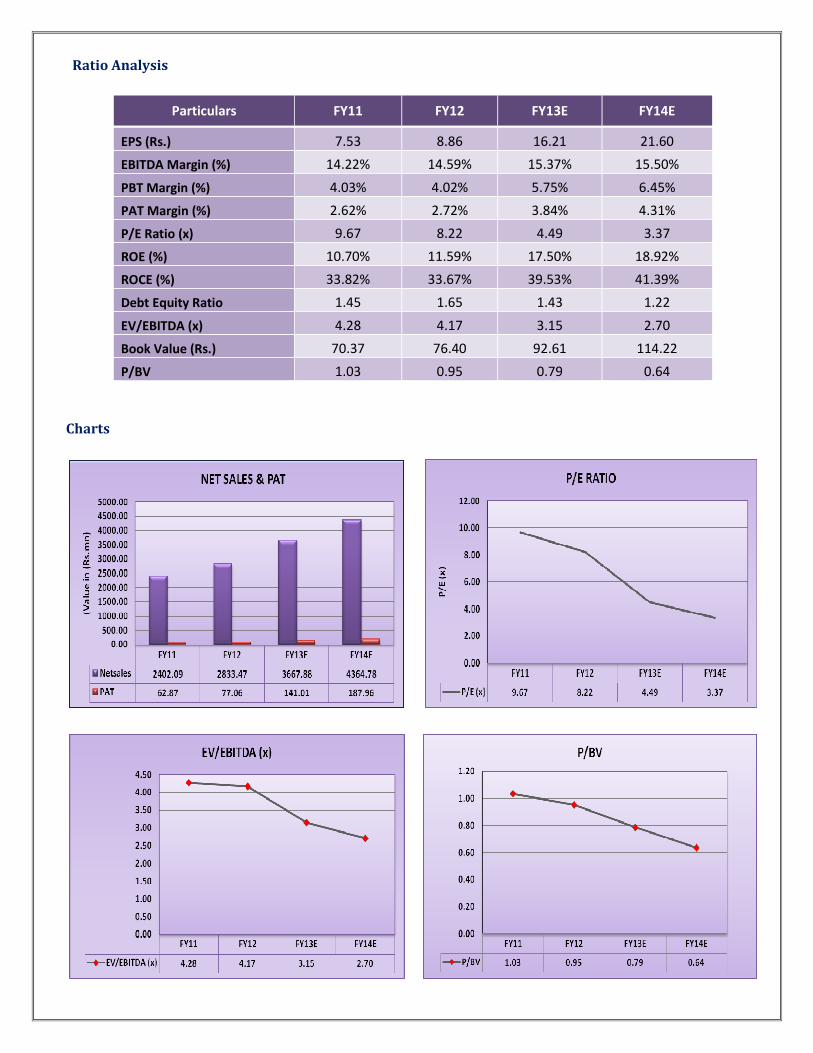
Ratio Analysis
Particulars FY11 FY12 FY13E FY14E
EPS (Rs.) 7.53 8.86 16.21 21.60
EBITDA Margin (%) 14.22% 14.59% 15.37% 15.50%
PBT Margin (%) 4.03% 4.02% 5.75% 6.45%
PAT Margin (%) 2.62% 2.72% 3.84% 4.31%
P/E Ratio (x) 9.67 8.22 4.49 3.37
ROE (%) 10.70% 11.59% 17.50% 18.92%
ROCE (%) 33.82% 33.67% 39.53% 41.39%
Debt Equity Ratio 1.45 1.65 1.43 1.22
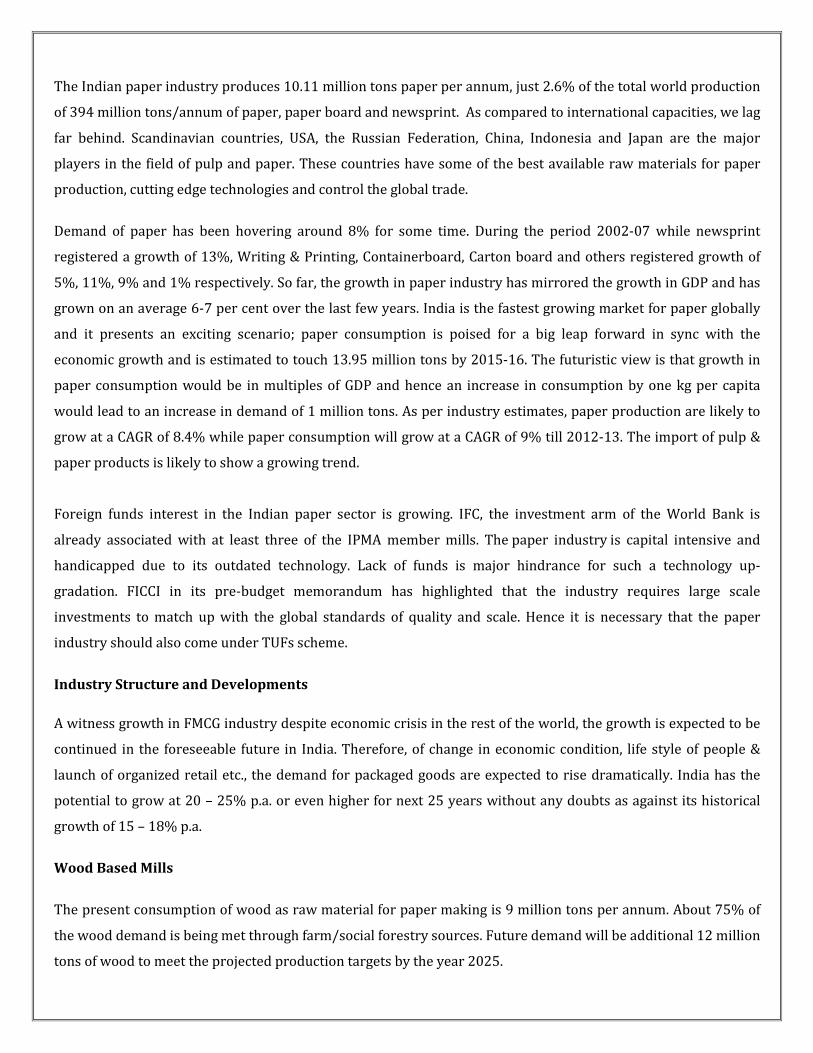
EV/EBITDA (x) 4.28 4.17 3.15 2.70
Book Value (Rs.) 70.37 76.40 92.61 114.22
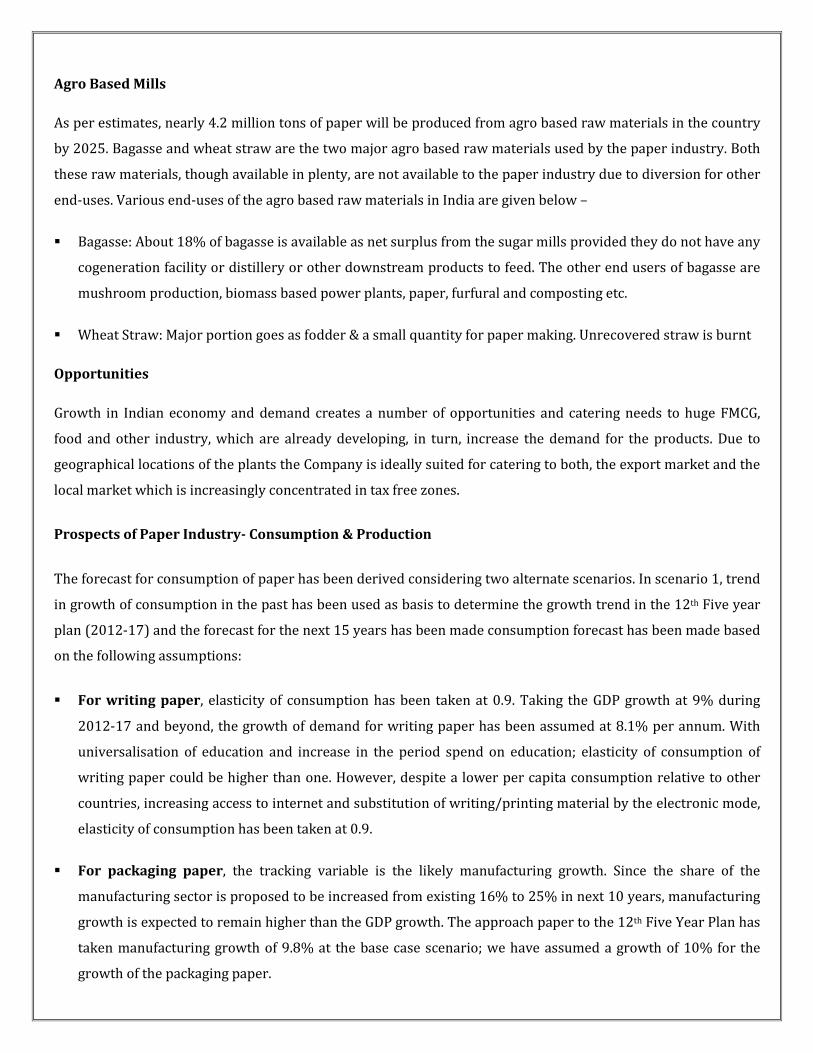
P/BV 1.03 0.95 0.79 0.64
Charts
Outlook and Conclusion
� At the current market price of Rs.72.80, the stock P/E ratio is at 4.49 x FY13E and 3.37 x FY14E respectively.
� Earning per share (EPS) of the company for the earnings for FY13E and FY14E is seen at Rs.16.21 and
Rs.21.60 respectively.
� Net Sales and PAT of the company are expected to grow at a CAGR of 22% and 44% over 2011 to 2014E
respectively.
� On the basis of EV/EBITDA, the stock trades at 3.15 x for FY13E and 2.70 x for FY14E.
� Price to Book Value of the stock is expected to be at 0.79 x and 0.64 x respectively for FY13E and FY14E.
� We recommend ‘BUY’ in this particular scrip with a target price of Rs.82.00 for Medium to Long term
investment.
Industry Overview
The Indian Paper Industry accounts for about 1.6% of the world production of paper and paperboard. The
estimated turnover of the industry is Rs 25,000 crore (USD 5.95 billion) approximately and its contribution to
the exchequer is around Rs. 2918 crore (USD 0.69 billion). The industry provides employment to more than 0.12
million people directly and 0.34 million people indirectly. The industry was delicenced effective from July, 1997
by the Government of India; foreign participation is permissible. Most of the paper mills are in existence for a
long time and hence present technologies fall in a wide spectrum ranging from oldest to the most modern.
The mills use a variety of raw material viz. wood, bamboo, recycled fibre, bagasse, wheat straw, rice husk, etc.;
approximately 35% are based on chemical pulp, 44% on recycled fibre and 21% on agro-residues. The
geographical spread of the industry as well as market is mainly responsible for regional balance of production
and consumption.
The added capacity of approximately 0.8 million tons during 2007-08 the operating capacity of the industry
currently stands at 9.3 million tons. During this fiscal year, domestic production of paper and paperboard is
estimated to be 7.6 million tons. As per industry guesstimates, over all paper consumption (including newsprint)
has now touched 8.86 million tons and per capita consumption is pegged at 8.3 kg.
Structure of Indian Paper Industry
The Indian paper industry has highly fragmented structure consisting of small, medium and large sized paper
mills having capacities ranging from 10 to 1150 tons per day. The industry employs wood, agro residues and
recycled/waste paper as the major raw material for manufacturing different varieties of paper, paper board and
newsprint.
The Indian paper industry produces 10.11 million tons paper per annum, just 2.6% of the total world production
of 394 million tons/annum of paper, paper board and newsprint. As compared to international capacities, we lag
far behind. Scandinavian countries, USA, the Russian Federation, China, Indonesia and Japan are the major
players in the field of pulp and paper. These countries have some of the best available raw materials for paper
production, cutting edge technologies and control the global trade.
Demand of paper has been hovering around 8% for some time. During the period 2002-07 while newsprint
registered a growth of 13%, Writing & Printing, Containerboard, Carton board and others registered growth of
5%, 11%, 9% and 1% respectively. So far, the growth in paper industry has mirrored the growth in GDP and has
grown on an average 6-7 per cent over the last few years. India is the fastest growing market for paper globally
and it presents an exciting scenario; paper consumption is poised for a big leap forward in sync with the
economic growth and is estimated to touch 13.95 million tons by 2015-16. The futuristic view is that growth in
paper consumption would be in multiples of GDP and hence an increase in consumption by one kg per capita
would lead to an increase in demand of 1 million tons. As per industry estimates, paper production are likely to
grow at a CAGR of 8.4% while paper consumption will grow at a CAGR of 9% till 2012-13. The import of pulp &
paper products is likely to show a growing trend.
Foreign funds interest in the Indian paper sector is growing. IFC, the investment arm of the World Bank is
already associated with at least three of the IPMA member mills. The paper industry is capital intensive and
handicapped due to its outdated technology. Lack of funds is major hindrance for such a technology up-
gradation. FICCI in its pre-budget memorandum has highlighted that the industry requires large scale
investments to match up with the global standards of quality and scale. Hence it is necessary that the paper
industry should also come under TUFs scheme.
Industry Structure and Developments
A witness growth in FMCG industry despite economic crisis in the rest of the world, the growth is expected to be
continued in the foreseeable future in India. Therefore, of change in economic condition, life style of people &
launch of organized retail etc., the demand for packaged goods are expected to rise dramatically. India has the
potential to grow at 20 – 25% p.a. or even higher for next 25 years without any doubts as against its historical
growth of 15 – 18% p.a.
Wood Based Mills
The present consumption of wood as raw material for paper making is 9 million tons per annum. About 75% of
the wood demand is being met through farm/social forestry sources. Future demand will be additional 12 million
tons of wood to meet the projected production targets by the year 2025.
Agro Based Mills
As per estimates, nearly 4.2 million tons of paper will be produced from agro based raw materials in the country
by 2025. Bagasse and wheat straw are the two major agro based raw materials used by the paper industry. Both
these raw materials, though available in plenty, are not available to the paper industry due to diversion for other
end-uses. Various end-uses of the agro based raw materials in India are given below –
� Bagasse: About 18% of bagasse is available as net surplus from the sugar mills provided they do not have any
cogeneration facility or distillery or other downstream products to feed. The other end users of bagasse are
mushroom production, biomass based power plants, paper, furfural and composting etc.
� Wheat Straw: Major portion goes as fodder & a small quantity for paper making. Unrecovered straw is burnt
Opportunities
Growth in Indian economy and demand creates a number of opportunities and catering needs to huge FMCG,
food and other industry, which are already developing, in turn, increase the demand for the products. Due to
geographical locations of the plants the Company is ideally suited for catering to both, the export market and the
local market which is increasingly concentrated in tax free zones.
Prospects of Paper Industry- Consumption & Production
The forecast for consumption of paper has been derived considering two alternate scenarios. In scenario 1, trend
in growth of consumption in the past has been used as basis to determine the growth trend in the 12th Five year
plan (2012-17) and the forecast for the next 15 years has been made consumption forecast has been made based
on the following assumptions:
� For writing paper, elasticity of consumption has been taken at 0.9. Taking the GDP growth at 9% during
2012-17 and beyond, the growth of demand for writing paper has been assumed at 8.1% per annum. With
universalisation of education and increase in the period spend on education; elasticity of consumption of
writing paper could be higher than one. However, despite a lower per capita consumption relative to other
countries, increasing access to internet and substitution of writing/printing material by the electronic mode,
elasticity of consumption has been taken at 0.9.
� For packaging paper, the tracking variable is the likely manufacturing growth. Since the share of the
manufacturing sector is proposed to be increased from existing 16% to 25% in next 10 years, manufacturing
growth is expected to remain higher than the GDP growth. The approach paper to the 12th Five Year Plan has
taken manufacturing growth of 9.8% at the base case scenario; we have assumed a growth of 10% for the
growth of the packaging paper.
� For the newsprint, the average annual growth in first two years is taken at 7%. In subsequent years, the
growth has been taken assuming an elasticity of consumption at 0.9, or a growth of 8.1% per annum.
Future Outlook
The industry foresees a serious scarcity of raw materials in future and hence would have to increasingly depend
on imports of wood/wood chips and pulp. However Indian ports do not have the necessary infrastructure for
chips handling. The industry players have to import pulp from international market the prices of which are
highly volatile. The infrastructure at the ports should be upgraded to handle wood and wood chips imports.
• Overall paper consumption in the baseline scenario is projected to increase to 16.5 million tons in 2016-17
and reach 25.3 million tons in 2026-27. In the alternative scenario, which appears to be more realistic, the
consumption increases to 18.4 million tons in 2016-17 (the terminal year of the 12th Plan) and to 43.9 million
tons in 2026-27.
• The production of paper is expected to increase to 16.7 million tons in 2016-17 and further to 39.7 million
tons in 2026-27.
• The total import of paper (mostly the newsprint) would increase from about 1 million tons in 2010-11 to 1.7
million tons in 2016-17 and further to 4.3 million tons in 2026-27.
• The focus market scheme for exports should be expanded to cover the left out countries of Latin America and
Africa.
• The industry should continue to get the benefits that it enjoys even now in terms of low level of duties/taxes
both at the Centre and the States and thereby paper industry should be kept under special list of GST.
• In order to provide a level playing field to the domestic industry the Customs duty for import of Paper/
Paperboards should be reviewed and this category kept in the Negative List (i.e., no preferential treatment)
in bi-lateral and multi-lateral trade treaties and agreements.
• Imported coal currently attracts customs duty of 5.15%. As a measure of relief to industry, it is recommended
that the paper and paperboard industry be allowed to import coal at "Nil" rate of Customs Duty.
• Customs Duty on Kraft Paper & Board falling under Central Excise Tariff Items 4804, 4805, 4810, 4811 etc.
should be reduced to nil duty so that Kraft Paper & Board can be imported at competitive prices to make
boxes of requisite quality at minimum cost and ultimately help promotion of exports from the country.
Disclaimer:
This document prepared by our research analysts does not constitute an offer or solicitation for the purchase or sale
of any financial instrument or as an official confirmation of any transaction. The information contained herein is
from publicly available data or other sources believed to be reliable but do not represent that it is accurate or
complete and it should not be relied on as such. Firstcall India Equity Advisors Pvt. Ltd. or any of it’s affiliates shall
not be in any way responsible for any loss or damage that may arise to any person from any inadvertent error in the
information contained in this report. This document is provide for assistance only and is not intended to be and must
not alone be taken as the basis for an investment decision.
Firstcall India Equity Research: Email – [email protected]
C.V.S.L.Kameswari Pharma
U. Janaki Rao Capital Goods
A.Nagaraju Cement, Reality & Infra, Oil & Gas
Ashish.Kushwaha IT, Consumer Durable & Banking
K. Jagadhishwari Devi Diversified
Abdul Khabeer Diversified
Anil Kumar Diversified
A.Ravi Diversified
Firstcall India also provides
Firstcall India Equity Advisors Pvt.Ltd focuses on, IPO’s, QIP’s, F.P.O’s,Takeover
Offers, Offer for Sale and Buy Back Offerings.
Corporate Finance Offerings include Foreign Currency Loan Syndications,
Placement of Equity / Debt with multilateral organizations, Short Term Funds
Management Debt & Equity, Working Capital Limits, Equity & Debt
Syndications and Structured Deals.
Corporate Advisory Offerings include Mergers & Acquisitions(domestic and
cross-border), divestitures, spin-offs, valuation of business, corporate
restructuring-Capital and Debt, Turnkey Corporate Revival – Planning &
Execution, Project Financing, Venture capital, Private Equity and Financial
Joint Ventures
Firstcall India also provides Financial Advisory services with respect to raising
of capital through FCCBs, GDRs, ADRs and listing of the same on International
Stock Exchanges namely AIMs, Luxembourg, Singapore Stock Exchanges and
other international stock exchanges.
For Further Details Contact:
3rd Floor,Sankalp,The Bureau,Dr.R.C.Marg,Chembur,Mumbai 400 071
Tel. : 022-2527 2510/2527 6077/25276089 Telefax : 022-25276089
E-mail: [email protected]
www.firstcallindiaequity.com