Embed Size (px)
Citation preview
_____________________________________________________________________________________________________ *Corresponding author: E-mail: [email protected];
Annual Research & Review in Biology 20(1): 1-13, 2017; Article no.ARRB.37544 ISSN: 2347-565X, NLM ID: 101632869
Taxonomic Composition and Diversity of Phytoplankton Community in Kpassa Reservoir
(Northen Benin)
Ousmane T. Boukari1*, Youssouf Abou2, Moctar L. Bawa3 and Daouda Mama1
1Laboratory of Applied Hydrology, Department of Hydrology and Integrated Management of Water
Resources, National Institute of Water, University of Abomey-Calavi, Abomey-Calavi, P.O.Box 526, Cotonou, Benin.
2Laboratory of Ecology and Aquatic Ecosystem Management, Department of Zoology, Faculty of
Sciences and Technics, University of Abomey-Calavi, Abomey-Calavi, P.O.Box 526, Cotonou, Benin. 3Laboratory of Water Chemistry, Department of Chemistry, Faculty of Sciences, University of Lomé,
P.O.Box 1515 Lomé, Togo.
Authors’ contributions
This work was carried out in collaboration between all authors. All authors read and approved the final manuscript.
Article Information
DOI: 10.9734/ARRB/2017/37544
Editor(s): (1) George Perry, Dean and Professor of Biology, University of Texas at San Antonio, USA.
Reviewers: (1) Fábio Henrique Portella Corrêa de Oliveira, Universidade Federal Rural de Pernambuco, Brazil.
(2) Ibrahim M. Magami, Usmanu Danfodiyo, Nigeria. Complete Peer review History: http://www.sciencedomain.org/review-history/21973
Received 19th
October 2017 Accepted 9
th November 2017
Published 18th November 2017
ABSTRACT Aims: The present study was conducted to determine the taxonomic composition and the diversity of phytoplankton community in Kpassa reservoir. Place and Duration of Study: The investigation occurred in Kpassa reservoir at 6 stations from August 2014 to May 2016. Methodology: Microscopic observations and identification keys allowed to index phytoplankton taxa. Diversity was evaluated using species richness index (d), Shannon-Weiner index (Hs) and species equitability index (J). Means ± standard deviation, ANOVA, Kruskal-Wallis, Kolmogorov-Smirnov and Levene test were performed using SPSS 16.0. Results: Current study recorded 52 phytoplankton taxa grouped as Conjugatophyceae (18 taxa), Diatomophyceae (16 taxa), Euglenophyceae (8 taxa), Cyanophyceae (5 taxa), Chlorophyceae (3
Original Research Article

Boukari et al.; ARRB, 20(1): 1-13, 2017; Article no.ARRB.37544
2
taxa), Dinophyceae (1 taxa) and Xanthophyceae (1 taxa). The highest abundance of phytoplankton (25828 ± 4642 individuals/mL) was recorded in January 2016 (dry season) with the arrival of the cold wind called Harmattan. High values of species richness index ranged from 1,71 to 2,67 at stations St1 and St2 while high values of diversity index varied between 2,16 and 2,98 bits/individuals at stations St1 and St6 and high values of equitability index ranged from 0,50 to 0,64 at stations St1 and St5 during rainy season. . Differences in the phytoplankton abundance, species richness index, Shannon-Weiner index and species equitability index are significant between seasons (p = .00; p = .00; p = .00; p = .00) but the differences between sampling sites are not significant (p = .76; p = .98; p = .97; p = .96). Conclusion: Diatomophyceae predominance suggests organic pollution and high enriched water of the reservoir. Phytoplankton abundance is influenced by temperature but further work is needed to confirm the link. Same to silica which was also find to be on the basis of high phytoplankton abundance. Phytoplankton abundance is likely directly dependent of Diatomophyceae abundance. Rainy season represents the stability period of the phytoplankton community in Kpassa reservoir. Station St1 close to raw water pumping point of the National Company of Benin Water is the most stable site. Low values of species richness indicate a degraded water quality of the reservoir. Low values of diversity and evenness index reveal also a eutrophic state of the reservoir. Agricultural, pastorals, washing and crockery activities undertaken in the reservoir basin may be the principal cause of the deterioration of the reservoir water quality. The presence of aquatic plants was also found to induce organic pollution. Kpassa reservoir is horizontally homogene. A couple of sites are sufficient to horizontally monitor the reservoir status.
Keywords: Phytoplankton; taxonomic composition; diversity; Kpassa reservoir; Parakou; Benin.
1. INTRODUCTION Anthropogenic activities exerce pressures resulting in numerous impacts on the aquatic ecosystems. Governed by complex interactions, these impacts can not be studied only on the basis of the chemical knowledge of water. The health of an ecosystem is better reflected by the characteristics of the biological communities [1]. The phytoplankton made up by the whole vegetal plankton, is a key component of the trophic networks [2,3]. At annual scale, phytoplankton community structure variations are observed in response to environmental conditions changes [4]. Phytoplankton blooms are evident indicator of eutrophication of aquatic systems, which arouses the interest of aquatic environment managers [5,6]. In Benin, there are four reservoir used to supply Parakou, Savalou, Djougou and Savè cities in drinking water. Because of its eutrophication since 2000, Kpassa reservoir built on Okpara river to supply Parakou city in drinking water, were the subject of several studies on its physico-chemical and biological characteristics. [7] assessed the level of heavy metals pollution of water and sediments in Kpassa reservoir. [8] recorded flora and fauna of Benin ecosystem infested by the watery plants. [9] work concerned the development of a treatment process able to remove iron and manganese overloading from
Kpassa reservoir water. [10] worked on iron and manganese speciation in sediments of Kpassa reservoir. [11] carried out a study on phosphorus speciation and trophic state in the sediments of Kpassa reservoir. [12] evaluated the degree of organochlorinated pesticides pollution in fish and water of Kpassa reservoir. To finish, [13] provided recent data on the physico-chemical characteristics of the reservoir. Of all this work, besides the eighteen phytoplankton species listed by [9] in water samples taken punctually, any study of abundance, specific richness, diversity and equitability of the phytoplankton community was carried out. However, it is to achieve such study that the present work aim at analyzing the taxonomic composition and the diversity of phytoplankton community in Kpassa reservoir.
2. MATERIALS AND METHODS
2.1 Study Area
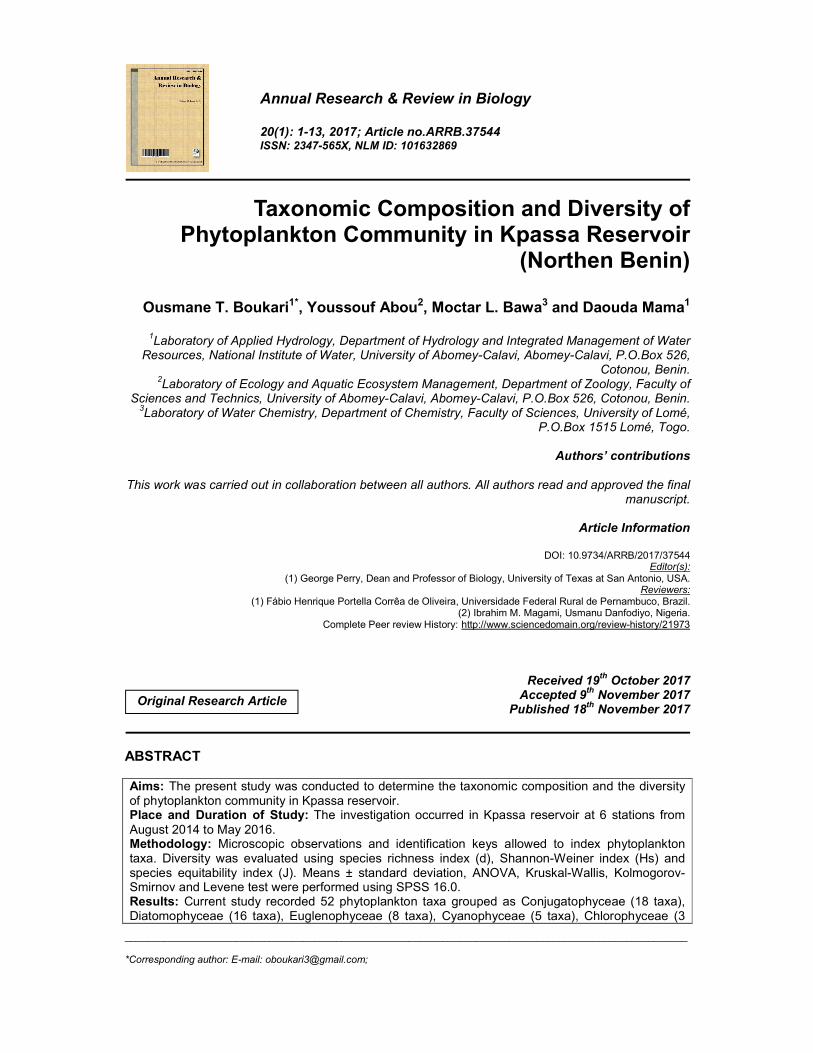
Kpassa reservoir located at 13,5 km at East of Parakou city is used for drinking water production (Fig. 1). The Benin Company of Water and Energy (current National Company of Benin Water) started to supply Parakou city in drinking water since 1975 with raw water pumped from Kpassa reservoir. The dyke of the reservoir is built in laterite over a lenght of 480 m and a height of 10 m. Two overfall located on the Southern part of the reservoir are used to control

Boukari et al.; ARRB, 20(1): 1-13, 2017; Article no.ARRB.37544
3
the water level. The pumping station, equiped with two pumps of 350 m3/h each one, is installed on the reservoir at 105 m from the Western shorline. A first treatment of the raw water is made insitu before aspired towards the treatment plant located at Banikani district in Parakou.
The basin of Kpassa reservoir covers the district of Bembèrèkè, Nikki, N’Dali, Pèrèrè, Parakou and Tchaourou [14]. The portion of Okpara river delimited by the basin and its tributaries, Niessi, Nioré and Sabi with a length respectively of 41,5 km, 32 km and 18 km supply water to Kpassa reservoir [15]. The basin is under the influence of the Soudanian wet tropical climate. The wet season go from May to October and the dry season from November to April. The area is also under the influence of the wind called harmattan. The low temperatures recorded during the dry season are related to the occurrence of this wind.
Agriculture is the main activity of the study area. Breeding and fishing are also very practised. Breeding is developed and varied with bovines, sheep, caprine, porcine and poultry. Physical characteristics of Kpassa reservoir and its basin are shown in Table 1.
2.2 Sampling Procedure Ten investigations were conducted at six sampling stations (Table 2) between August 2014 and May 2016 (Table 3). At each sampling station, samples were collected with conic phytoplankton net SDMO QUINIOU model F131P20 (mesh 20 μm, diameter 30 cm, length 90 cm) drag on 5 m in water sub-surface. The retained materials (250 ml) were preserved with 5% lugol solution and 4% formaldehyde. All samples were stored in ice containers during their transport to the laboratory.
Table 1. Physical characteristics of the studied area [14,15]
Characteristics Kpassa reservoir Basin
Latitude N 9°17’034 N 9°16’ - N 9°58’ Longitude E 2°43’975 E 2°35’ - E 3°04’ Lenght (km) 15 117 Lenght of Shorline (km) - 217 area (ha) 190 207.000 depth (m) 4,5 - 9 - Volume (m
3) 5.750.000 269.000.000
Discharge (m3/s) 0.001 - 150 -
Overflow-discharge (m3/s) 400 -
Interannual average pluviometry (mm) 1200 1200
Table 2. Description of the sampling stations established in Kpassa reservoir [13]
Sampling stations
Characteristics Reason of sampling stations choice
Station 1 (St1) closer to the raw water pumping point of the national water company
- their accessibility; - the localization of potential sources of pollution; - the phytoplankton ecology.
Station 2 (St2) closer to the East shore of the reservoir where cultural practices was made
Station 3 (St3) along the West shore of the reservoir near Kpassa village Station 4 (St4)
Station 5 (St5) in the middle of the dam Station 6 (St6) in upstream of the dam
Table 3. Description of the sampling months and corresponding seasons
Months Aug-14 Oct-14 Dec-14 Febr-15 April-15 Sept-15 Nov-15 Jan-16 March-16 May-16 Seasons rainy rainy dry dry dry rainy dry dry dry rainy
Aug-14 = August 2014; Oct-14 = October 2014; Dec-14 = December 2014; Febr-15 = February 2015; April-15 = April 2015; Sept-15 = September 2015; Nov-15 = November 2015; Jan-16 = January 2016;
March-16 = March 2016; May-16 = May 2016
Boukari et al.; ARRB, 20(1): 1-13, 2017; Article no.ARRB.37544
4
Fig. 1. Map of the location of monitoring stations in Kpassa reservoir [13]
2.3 Phytoplankton Analysis Each subsample (250ml) was homogenized carefully before enumeration and identification procedure. For qualitative analysis, one drop between slide and slip cover were observed three times using microscope Zeiss Axio Imager.M2 (magnification ×100) equipped with an image acquisition
system. Identification was made at the possible taxonomic level using the keys of [16-18]. Some additional monographs and papers were also used for taxonomic identification [19-24]. Phytoplankton sampled was enumerated using standard operational procedures [25]. A sub-sample of 1 ml was placed in the Sedgwick-Rafter counting slide. Phytoplankton taxa were counted in the entire counting slide using
Boukari et al.; ARRB, 20(1): 1-13, 2017; Article no.ARRB.37544
5
microscope Labomed Lx 400 (magnification ×100). Colonies and filaments were counted as individuals. Because of the richness of some samples in particles and organisms, dilution has been necessary.
2.4 Data Analysis Phytoplankton abundance was assessed using [25] formula as follows:
� =���
��
N = abundance in number of phytoplankton individuals per milliliter of water filtered by the net. n = average number of phytoplankton individuals counted in 1 ml of sample observed in microscope. V1 = volume of total water filtered by the net in liter. V2 = volume of plankton concentrated in milliliter.
The three indexes below were used to assess the diversity of the phytoplancton community:
1. Species richness index (d) evaluated using [26] function as follows:
� =(���)
���� �
S = number of species in the sample and n is the total number of individuals in the S species.
2. Diversity index (Hs) calculated using [27]
formula as follows:
�� = − ∑ (Pi.���� log� Pi)
i = count denoting the ith species ranging from 1 to S, S is the number of species in the sample. Pi = ratio between the number of individuals of the ith species and the total number of individuals in the sample.
3. Equitability index (J) evaluated according
to [28] formula as follows:
� =��
���� �
Hs = Shannon-Weaver index and S is the number of species in the sample.
Statistical analysis was carried out using SPSS (Statistical Package for the Social Sciences) software version 16.0. Total abundance was expressed as means ± standard deviation for each month. ANOVA and Kruskal-Wallis test was used to analyse the variance of phytoplankton abundance and diversity between sampling locations and seasons. ANOVA was used after verify the normality (One-Sample Kol-mogorov-Smirnov test) and the homogeneity of variables (Levene test). When these conditions are not verified, the Kruskal-Wallis test was used.
3. RESULTS AND DISCUSSION
3.1 Phytoplankton Community Composi-tion
The results of phytoplankton analysis in Kpassa reservoir showed the presence of 52 taxa distributed in 7 classes (Table 4). The images of some taxa recorded are shown in Fig. 2. [9] reported 18 taxa in the same reservoir. The 34 additional taxa recorded is due to the sampling frequence in the present study. The number of taxa in Kpassa reservoir is low but higher than those reported for some reservoirs of tropical and temperate area. 22 species were identified in Sidi Saâd reservoir in Tunisia [29] and 47 species in Rewalsar lake in India [30]. Conjugatophyceae and Diatomophyceae have the greatest number of taxa (respectively 18 taxa and 16 taxa), followed by Euglenophyceae (8 taxa), Cyanophyceae (5 taxa) and Chlorophyceae (3 taxa) (Table 4). Dinophyceae and Xanthophyceae are represented by only one species each one (Table 4). Similar conditions of Conjugatophyceae and Diatomophyceae prevalence were observed in south of Benin [31] and Côte-d'ivoire [32]. Diatomophyceae are more representative in Lake Ahémé with 24 taxa [31]. Conjugatophyceae are richest in taxa in Fresco lagoon, with 23 taxa [32]. Phytoplankton composition reflects the overall ‘health’ status of an aquatic system and its suitability for different uses [30]. It is considered as a good indicator of water quality and trophic conditions because of their short generation time and fast population revewal [33]. Among the two predominant taxa in the present study, Diatomophyceae are recognized to be a good indicator of the level of rivers eutrophication because of their sensitivity to nutrients and organic matter [34]. They are especially adapted to cold and turbulent water [35]. Their predominance in Kpassa reservoir could thus indicates organic pollution and high enriched water. The high enrichment of the
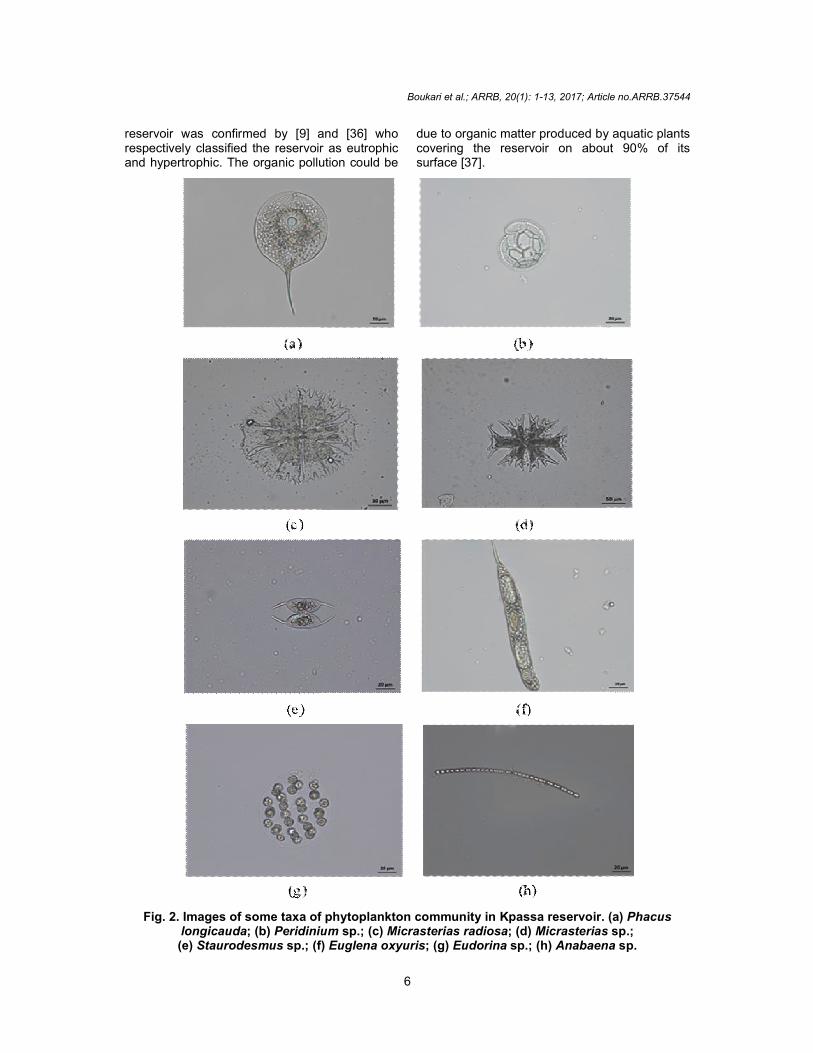
reservoir was confirmed by [9] and [36] who respectively classified the reservoir as eutrophic and hypertrophic. The organic pollution could be
Fig. 2. Images of some taxa of phytoplankton community in Kpassa reservoir. (a) longicauda; (b) Peridinium(e) Staurodesmus sp.; (f)
Boukari et al.; ARRB, 20(1): 1-13, 2017; Article no.
6
reservoir was confirmed by [9] and [36] who respectively classified the reservoir as eutrophic and hypertrophic. The organic pollution could be
due to organic matter produced by aquatic plants covering the reservoir on about 90% of its surface [37].
Fig. 2. Images of some taxa of phytoplankton community in Kpassa reservoir. (a) Peridinium sp.; (c) Micrasterias radiosa; (d) Micrasterias
sp.; (f) Euglena oxyuris; (g) Eudorina sp.; (h) Anabaena
; Article no.ARRB.37544
due to organic matter produced by aquatic plants covering the reservoir on about 90% of its
Fig. 2. Images of some taxa of phytoplankton community in Kpassa reservoir. (a) Phacus Micrasterias sp.;
Anabaena sp.

Boukari et al.; ARRB, 20(1): 1-13, 2017; Article no.ARRB.37544
7
Table 4. Taxonomic composition of phytoplankton in Kpassa reservoir
Classes Number of taxa Names of taxa Conjugatophyceae
18 taxa
Choricystis minor (Skuja) Fott, Closterium ehrenbergii Meneghini ex Ralfs, C. nordstedtii Chodat, Cosmarium sp. Corda, C. biretum Brébisson ex Ralfs, Euastrum sp., Micrasterias sp., M. muricata Bailey ex Ralfs, M. radians W.B. Turner, M. radiosa Ralfs, M. tropica Nordstedt, Pleurotaenium acerosum (Schrank) Ehrenberg, P. ovatum (Nordstedt) Nordstedt, P. tridentulum (Wolle) West, Staurastrum sp. Meyen, Staurodesmus convergens (Ehrenberg ex Ralfs) S.Lillieroth, Xanthidium sp., X. subtrilobum West & G.S.West.
Diatomophyceae
16 taxa
Asterionella sp., Aulacoseira granulata (O.F. Müller) Simonsen (ab), Cyclotella sp., Diatoma mesodon (Ehrenberg) Kützing, D. tenuis C. Agardh, Diatomella sp., Fragilaria sp. Lyngb, F. construens (Ehrenberg) Grunow (ab), F. ulna (Nitzsch) Lange-Bertalot, F. virescens Ralfs, Gyrosigma sp., Melosira varians C. Agardh (ab), Navicula sp. Bory, Pinnularia sp. Ehr., Rhizosolenia sp., R. longiseta O.Zacharias.
Euglenophyceae
8 taxa
Euglena acus (O.F. Müller) Ehrenberg, E. oxyuris Schmarda, Phacus longicuuda (Ehr.), Strombomonas fluviatilis Drezepolski, S. verrucosa (E.Daday) Deflandre, Trachelomonas sp. Ehrenberg, T. ornata (Svirenko) Skvortzov, T. superba Svirenko emend. Deflandre.
Cyanophyceae 5 taxa
Anabaena Bory de Saint-Vincent ex Bornet & Flahault (WoRMS), Chroococcus turgidus (Kützing) Nägeli (ab), Coelosphaerium sp., Microcystis aeruginosa (Kützing) kützing, Nostoc sp.
Chlorophyceae 3 taxa Eudorina sp., Pediastrum duplex Meyen (ab), Spirogyra sp.
Dinophyceae 1 taxa Peridinium sp. Xanthophyceae 1 taxa Goniochloris fallax Fott.
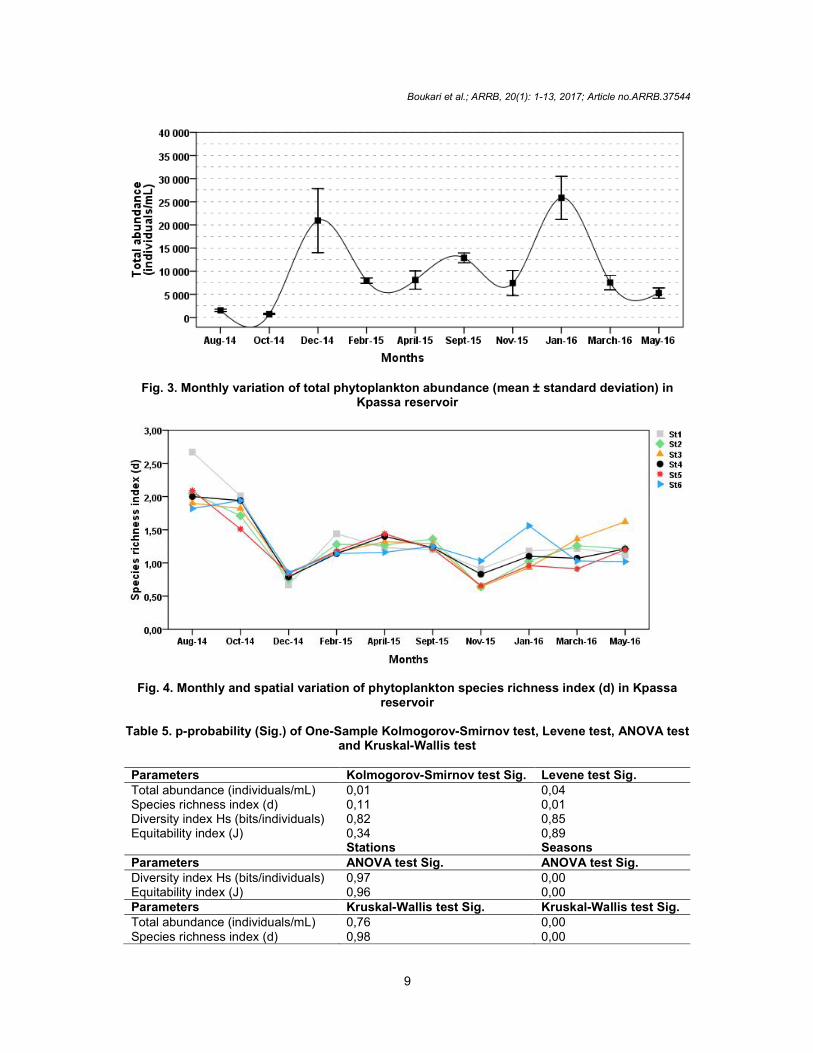
3.2 Total Abundance of Phytoplankton Fig. 3 shows the variation of total abundance of phytoplankton in Kpassa reservoir. It ranged between 706 ± 140 individuals/mL (October 2014) and 25828 ± 4642 individuals/mL (January 2016). The total abundance presents its maximum values during dry season (December 2014 and January 2016). It decreases then in rainy season where it reaches its minimal values in August and October 2014. According to [38] and [39], the tropical lakes and reservoirs do not experience marked seasonal fluctuations and thus do not exhibit variations in stocks of phytoplankton species composition. These notices are not confirm in Kpassa reservoir because the monthly distribution of the total abundance of phytoplankton reveals a clear seasonal variation so that minimum abundances are recorded in rainy season (August 2014,
October 2014, September 2015 and May 2016) and the maximum in dry season (December 2014 to April 2015 and November 2015 to March 2016). This is testify by the Kruskal-Wallis test which revealed that the total abundance showed significant differences (P = .00) between seasons (Table 5). There were no significant differences (P = .76) between sampling sites (Table 5). The peak of phytoplankton abundance recorded in December 2014 and January 2016 coincides with the arrival of Harmattan. Indeed, this wind appear in December and January inducing a significant decrease of temperature. Generally, water temperature, nutrients, light availability and hydrologic regime are the primary variables influencing phytoplankton growth [40-42]. The cold temperatures which occur in December and January could explain the phytoplankton bloom observed during this month. Phytoplankton also need nutrients like nitrogen, phosphorus and

Boukari et al.; ARRB, 20(1): 1-13, 2017; Article no.ARRB.37544
8
silica to grow [35]. These nutrients comes from grounds leaching or urban waste water. One of the geochemical particularities of our study area is the presence of silica in high proportions (57 to 74%) [9]. High values of total phytoplankton abundance recorded could be thus due to silica but further work should be done to confirm the link. Under favourable conditions, diatoms may form blooms [43]. [44] stated that the growth of diatoms is highly dependent on the presence of dissolved silica in water. Several works also presented silica like a necessary element to the growth of Diatoms [45,46]. It is therefore likely that total phytoplankton abundance is directly dependent of Diatomophyceae abundance. Low values of total abundance could be attributed to the grazing pressure of zooplankton on phytoplankton. According to [47], zooplankton contributes significantly to the clarification of water in lakes and reservoir by the chattering of phytoplankton. On the other hand, this could also due to the presence of large number of aquatic plants which lack phytoplankton get sufficient light quantity to do the photosynthesis process.
3.3 Phytoplankton Diversity 3.1.1 Species richness index (d) Fig. 4 presents the spatio-temporal variation of species richness expressed by [26] index. Highest values of species richness are recorded in August and October 2014 (rainy season), ranging from 1,71 at station St2 to 2,67 at station St1. The lowest values (0,64 to 1,03) were detected in December 2014 and November 2015 (dry season). This seasonal variability is corroborated by the Kruskal-Wallis test which revealed a significant variation (P = .00) of the specific richness between the seasons (Table 5). The spatial variation is less (P = .98) during months (Table 5). According to [48], the increase of cellular density generally coincides with the decrease of species richness and vice versa. High increase of abundance observed during December 2014 and January 2016 (Fig. 3) could justify the low values of species richness detected during this month. During the other months, the specific richness fluctuated between 0,91 at station St5 and 1,62 at station St3. Phytoplankton diversity is widely used as biological determinates of water quality in lakes and reservoirs. A high diversity suggests a healthy ecosystem; the reverse of this indicates a degraded environment [49]. High values of species richness recorded in the present study
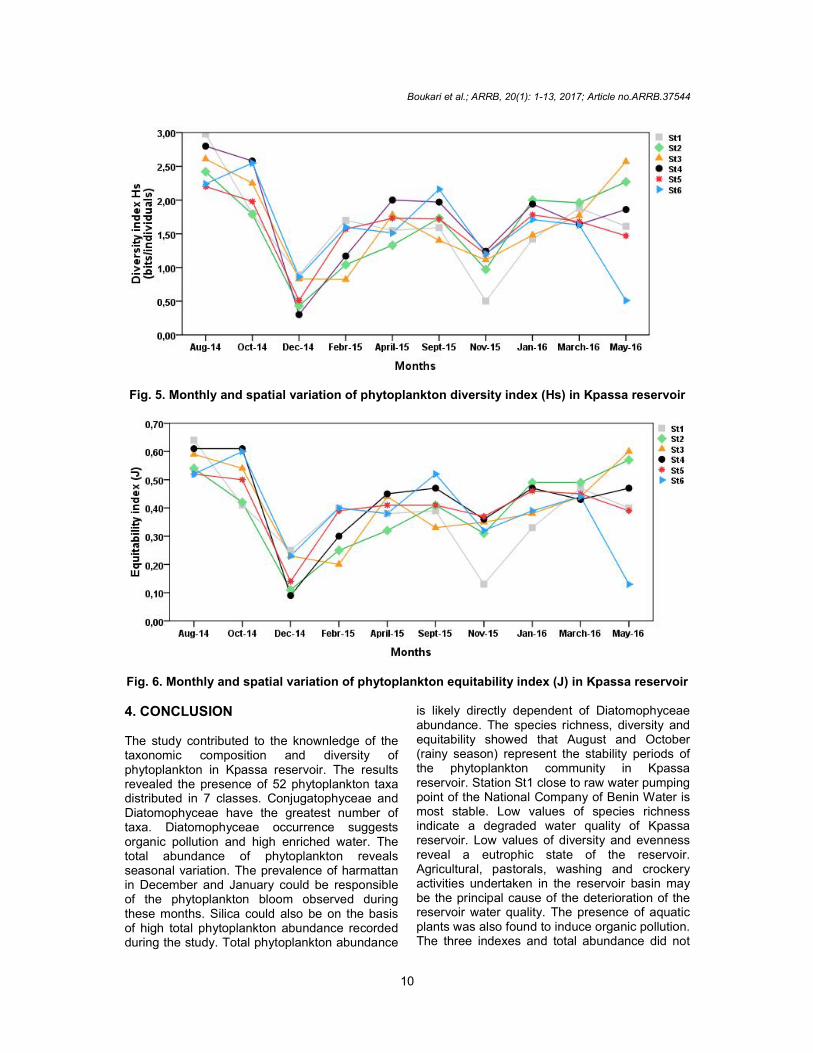
thus indicate clean water of Kpassa reservoir. Low values reflect a degraded water quality of the reservoir. 3.1.2 Diversity (Hs) and equitability (J) index Diversity index is often accompanied by equitability index to the fact that it is necessary to taking into account the two indexes to appreciate the state of an environment [50]. Figs. 5 and 6 represent the spatio-temporal variations of diversity and equitability index in Kpassa reservoir. These figures reveal a similar evolution of the two indexes in time and space. ANOVA test showed that there were no significant differences of these index (P = .97; P = .96) between sampling stations but the difference between seasons is very significant (P = .00; P = .00) (Table 5). The greatest diversity index are obtained in rainy season (August 2014, October 2014, September 2015 and May 2016) with values ranging from 2,16 bits/individuals at station St6 to 2,98 bits/individuals at station St1. Equitability follows the same evolution than diversity but the high values of equitability index ranged from 0,50 to 0,64 at station St1 and St5. The station St1 which recorded the greatest Shannon index (2,98 bits/individuals) appears being the most stable site. This stability is corroborated by its higher equitability index (0,64) but the standard value of 0,80 retained by [51] as a stable community index is not reached. Minimum values of diversity and equitability (Hs = 0,30; J = 0,09) are observed at station St4 during December (dry season) because of the high abundance obtained during this month (Fig. 3). During the other months, the diversity and equitability index values fluctuated respectively between 0,50 at station St1 and 2 bits/individuals at station St2, and 0,13 at station St1 and 0,49 at station St2. Species diversity index and evenness index could be considered as explanatory variables of eutrophication levels, which to some degree are interrelated [49]. High diversity and evenness index noted in Kpassa reservoir could be a reflection of a stable trophic status. Low values may reveal a eutrophic state of the reservoir. Fertilizers and pesticides used in agricultural and pastorals activities undertaken in the reservoir basin added to soaps used in washing and crockery activities along the reservoir river may be the principal cause of the deterioration of the reservoir water quality. The aquatic plants which cover the reservoir on about 90% of its surface [37] were also found to induce organic pollution.
Boukari et al.; ARRB, 20(1): 1-13, 2017; Article no.ARRB.37544
9
Fig. 3. Monthly variation of total phytoplankton abundance (mean ± standard deviation) in Kpassa reservoir
Fig. 4. Monthly and spatial variation of phytoplankton species richness index (d) in Kpassa reservoir
Table 5. p-probability (Sig.) of One-Sample Kolmogorov-Smirnov test, Levene test, ANOVA test
and Kruskal-Wallis test Parameters Kolmogorov-Smirnov test Sig. Levene test Sig. Total abundance (individuals/mL) 0,01 0,04 Species richness index (d) 0,11 0,01 Diversity index Hs (bits/individuals) 0,82 0,85 Equitability index (J) 0,34 0,89 Stations Seasons Parameters ANOVA test Sig. ANOVA test Sig. Diversity index Hs (bits/individuals) 0,97 0,00 Equitability index (J) 0,96 0,00 Parameters Kruskal-Wallis test Sig. Kruskal-Wallis test Sig. Total abundance (individuals/mL) 0,76 0,00 Species richness index (d) 0,98 0,00
Boukari et al.; ARRB, 20(1): 1-13, 2017; Article no.ARRB.37544
10
Fig. 5. Monthly and spatial variation of phytoplankton diversity index (Hs) in Kpassa reservoir
Fig. 6. Monthly and spatial variation of phytoplankton equitability index (J) in Kpassa reservoir
4. CONCLUSION The study contributed to the knownledge of the taxonomic composition and diversity of phytoplankton in Kpassa reservoir. The results revealed the presence of 52 phytoplankton taxa distributed in 7 classes. Conjugatophyceae and Diatomophyceae have the greatest number of taxa. Diatomophyceae occurrence suggests organic pollution and high enriched water. The total abundance of phytoplankton reveals seasonal variation. The prevalence of harmattan in December and January could be responsible of the phytoplankton bloom observed during these months. Silica could also be on the basis of high total phytoplankton abundance recorded during the study. Total phytoplankton abundance
is likely directly dependent of Diatomophyceae abundance. The species richness, diversity and equitability showed that August and October (rainy season) represent the stability periods of the phytoplankton community in Kpassa reservoir. Station St1 close to raw water pumping point of the National Company of Benin Water is most stable. Low values of species richness indicate a degraded water quality of Kpassa reservoir. Low values of diversity and evenness reveal a eutrophic state of the reservoir. Agricultural, pastorals, washing and crockery activities undertaken in the reservoir basin may be the principal cause of the deterioration of the reservoir water quality. The presence of aquatic plants was also found to induce organic pollution. The three indexes and total abundance did not
Boukari et al.; ARRB, 20(1): 1-13, 2017; Article no.ARRB.37544
11
show significant differences between sampling sites but the difference between seasons is very significant.
ACKNOWLEDGEMENTS We wish to acknowledge the CCE team of “Museum National d’Histoire Naturelle” of Paris especially Pr Alain Couté, Pr Cécile Bernard and Pr Cathérine Quiblier for their assistance. COMPETING INTERESTS Authors have declared that no competing interests exist.
REFERENCES 1. Reyjol Y, Spyratos V, Basilico L.
Bioindication: tools to assess the ecological state of the aquatic environments; perspectives for 2nd cycle DCE - continental surface water. Workshop on « Methods to assess the water state - Situation and perspectives in the context of the Water Framework Directive », proceedings of the ONEMA, Paris, France, 19 and 20 April 2011.
2. Pearl HW. Marine Plankton. In The Ecology of Cyanobacteria; Whitton, B.A.; Potts, M.; Kluwer Academic Publishers, the Netherlands. 2000;121-148.
3. Padisák J. Phytoplankton. In The Lakes Handbook; O’Sullivan, P.E.; Reynolds, C.S. Blackwell Publishing, Oxford. 2004;1: 251-308.
4. Fraisse S. Structure of the phytoplankton community of the coastal rivers in response to the hydrodynamic constraints: an approach based on the morpho-functional features. Ph.D. Thesis, University of Rennes 1, Rennes, France; 2013.
5. Codd GA, Chorus I, Burch M. Design of monitoring programmes. In Toxic Cyanobacteria in Water; Chorus I, Bartram JE, Spon FN, New York, 1999; pp. 313-328.
6. Oliver RL, Ganf GG. Freshwater blooms. In the Ecology of Cyanobacteria. Whitton, B.A.; Potts, M. Kluwer Academic Publishers, the Netherlands. 2000;149-194.
7. Agonkpahoun ED. Assessment of the continental water pollution by heavy metals: Case of the Okpara River and the lake Nokoué in Benin. Ph.D. Thesis,
University of Abomey-Calavi, Abomey-Calavi, Benin; 2006.
8. Fiogbé ED. Report on the census of freshwater infested by the proliferating aquatic plants and inventory of aquatic flora and fauna; Ministry of Agriculture, breeding and fishing, Cotonou, Benin; 2008.
9. Zogo D. Study of the elimination of iron and manganese at the time of the potabilisation of the water of a dam in the course of eutrophication: Case of Okpara at Parakou in Benin. Ph.D. Thesis, University of Abomey-Calavi, Abomey-Calavi, Benin; 2010.
10. Suanon F, Dimon B, Mama D, Tométin AL. Study of the Sediments of the Dam of Okpara (Benin): Physico-Chemical Characterization and Speciation of Iron and Manganese. J. of Water Res. and Protect. 2013;5:709-714.
DOI:https://doi.org/10.4236/jwarp.2013.57071
11. Tometin ASL, Daouda M, Zogo ND, Boukari O, Bawa LM. Eutrophication, Sediment phosphorus fractionation and short term mobility study in the surface and under profile sediment of a water dam (Okpara dam, Benin, West Africa). J. Appl. Sci., Environ. and Manage. 2013;17:517-526. DOI:http://dx.doi.org/10.4314/jasem.v17i4.9
12. Fofana R, Labintan C, Mama D, Kaki C, Afouda A, Linsoussi C. Eco-toxicological approach as a contribution to integrated water management on Okpara Dam at Kpassa in Benin: Evaluation of Contamination of Fish and Surface Water by Organochlorine Pesticides. J. of Water Res. and Protect. 2014;6:1268-1275. DOI:https://doi.org/10.4236/jwarp.2014.614116
13. Boukari TO, Mama D, Abou Y, Bawa LM. Physico-chemical features of the Kpassa reservoir, Northen Benin, with emphasis on its trophic state: A preliminary study. J. of Environ. Protect. 2016;7:2067-2080. DOI:https://doi.org/10.4236/jep.2016.713161
14. Le Barbe L. Surface water resources of Republic of Benin; ORSTOM Collection, Paris, France; 1993.
15. Société Béninoise d’Energie et d’Eau (SBEE). Report of the hydraulic and hydrological study of Parakou zone;

Boukari et al.; ARRB, 20(1): 1-13, 2017; Article no.ARRB.37544
12
Ministry of Energy and Water, Cotonou, Benin; 1990.
16. Bourrelly P. Freshwater algae: yellow and brown algae; Boubée, Paris, France; 1968.
17. Bourrelly P. Freshwater algae: systematic initiation. The blue and red algae; Boubée, Paris, France; 1985.
18. Bourrelly P. Freshwater algae: systematic initiation. The green algae; Boubée, Paris, France; 1990.
19. Couté P, Pérette C. Report on the inventory of the dulçaquicoles microalgae in the wood of Païolive. Paris, France; 2011.
20. Couté A, Iltis A. Stereoscopic ultrastructure of the small box of Trachelomonas (Algae, Euglenophyta) collected in Côte-d'ivoire. Rev. Hydrobiol. irop. 1981;2:115-133.
21. Compère P. Algae of the region of lake Tchad: Cyanophyceae. Ser. Hydrobiol. 1974;8:165-198.
22. Compère P. Algae of the region of lake Tchad: Diatomophyceae. Ser. Hydrobiol. 1975;9:203-290.
23. Compère P. Algae of the region of lake Tchad: Chorophycophyceae. Ser. Hydrobiol. 1976;10:77-118.
24. Iltis A. In Algae; Durand, J. R.; Lévêque, C.; O. R. S. T. O. M., France. 1980;9-61.
25. National Institute of Oceanography (NIO). Phytoplankton identification manual. National Institute of Oceanography, New Delhi, India; 2004.
26. Margalef R. Diversidad de especies en las cominidales naturales. Publ. Inst .Biol. Appl. 1951;9:5-27.
27. Shannon CE, Weaner WW. The mathematical theory of communications; University of Illinois press, Urbana, USA; 1963.
28. Pielou EC. An introduction to Mathematical Ecology; Witley-Interscience. New York, USA; 1969.
29. Sellami I, Romdahane SB, Guermazi W, El Bour M, Hamza A, Mhamdi MA, Pinel-Alloul B, Aleya L. Seasonal dynamics of plankton communities coupled with environmental factors in a semi arid area: Sidi Saâd reservoir (Center of Tunisia). Afric. Jrnl. of Biotech. 2012;11:865-877. DOI:https://doi.org/10.5897/AJB11.2145
30. Jindal R, Thakur RK, Uday Bhan Singh, Ahluwalia AS. Phytoplankton dynamics and species diversity in a shallow eutrophic, natural mid-altitude lake in Himachal Pradesh (India): role of
phycochemical factors. Chemist. and Ecolo. 2014;30:328-338. DOI:https://doi.org/10.1080/02757540.2013.871267
31. Olodo BI. Water quality and structure of the phytoplankton community of lake Ahémé in Benin. Master Thesis, University of Abomey-Calavi, Abomey-Calavi, Benin; 2015.
32. Konan ES, Da KP, Aka NM. Etude systématique des: Conjugatophycées, Chlorophycées et Euglénophycées d’une lagune tropicale: la lagune de Fresco (Côte d'ivoire). J. Appl. Biosci. 2012;49:3406-3414.
33. Thakur RK, Jindal R, Singh UB, Ahluwalia AS. Plankton diversty and water quality assessment of three freshwater lakes of Mandi (Himachal Pradesh, India) with special reference to planktonic indicators. Environ Monit Assess; 2013. DOI:10.1007/s10661-013-3178-3.
34. Campeau S, Lavoie I, Grenier M. Le suivi de la qualité de l’eau des rivières à l’aide de l’indice IDEC. Guide d’utilisation de l’indice Diatomées de l’Est du canada, version 3. Département des Sciences de l’environnement, Université du Québec à Trois-Rivières. 2013;25.
35. Billen G, Garnier G. Eutrophisation des cours d’eau du bassin de la Seine. Programme Interdisciplinaire de Recherche sur l’Environnement de la Seine. ISBN: 978-2-918251-05-7, Seine-Normandie, France; 2009.
36. Tometin AL. Contribution à l’identification des sources et étude de remobilisation des métaux fer et manganèse dans un contexte d’eutrophisation au sein de la retenue d’eau de l’Okpara (Bénin). Thèse de doctorat, Université d’Abomey-Calavi, Bénin; 2015.
37. PNE. Note of plea for the rehabilitation and the installation of a concerted mana-gement of Okpara dam, single source of AEP of the town of Parakou. Parakou, Benin; 2008.
38. Abbas M. Species composition and seasonal variation of phytoplankton in the Himreen Reservoir in the middle of Iraq. UOS. J. Pure App. Sci. 2009;6:35-44.
39. Figueredo C, Giani A. Phytoplankton community in the tropical lake of Lagoa Santa (Brazil): Conditions favoring a persistent bloom of Cylindrospermopsis racibordkii. Limnologica-Ecol. Manage. of Inland Waters. 2009;34:264-272.

Boukari et al.; ARRB, 20(1): 1-13, 2017; Article no.ARRB.37544
13
DOI:https://doi:10.1016/j.limno.2009.06.009
40. Cetinic I, Vilicio D, Buric Z, Olujc G. Phytoplankton seasonality in a highly stratified karstic estuary (Krka, Adriatic sea). Hydrobiologia. 2006;555:31-40. DOI:https://doi.org/10.1007/s10750-005-1103-7
41. Yang M, Bi YH, Hu J, Zhu K, Zhou G, Hu Z. Seasonal variation in functional phytoplankton groups in Xiangxi Bay, Three Gorges Reservoir. Chinese Journal of Oceanology and Limnology. 2011;29: 1057-1064. DOI:https://doi.org/10.1007/s00343-011-0255-8
42. Zhu K, Bi Y, Hu Z. Responses of phytoplankton functional groups to the hydrologic regime in the Daning River, a tributary of Three Gorges Reservoir. China. Sci. Total Environ. 2013;450-451, 169-177. DOI:https://doi.org/10.1016/j.scitotenv.2013.01.101
43. Onyema IC, Nwakwo DI, Oduleye T. Diatoms and dinoflagellates of an estuarine creek in Lagos. Journal Sci. Res. Dev. 2006;10:73-82.
44. Nabors MW. Introduction to botany. San Francisco: Pearson Education Inc. Publishers. 2004;626.
45. Drira, Z. Contribution to the comprehension of the functioning of the Gulf of Gabès: Study of the dynamic and structural characteristics of the phyto-
zooplanctonic communities in relation to the environmental variability and the hydrographic characteristics of the coastal and hydrographic zones. Ph.D. Thesis, University of SFAX, Franche-Comté, Tunisie; 2009.
46. Ivankovic A, Habul EV, Knezovic Z. Physico-chemical characteristics of shallow, high mountain Lake Blidinje (in a karst area of Bosnia and Herzegovina) with emphasis on its trophic status. Intern. Jrnl. of Oceanogr. and Hydrobio. 2011;40:19-27. DOI:https://doi.org/10.2478/s13545-011-0025-4
47. Tuzin D, Mason. La clarification des eaux dans les lacs reservoirs. 1996;56.
48. Benabdellouahad S. Structure, dynamic and physico-chemicals typologies of phytoplankton of estuary of Bou Regreg (atlantic coast of morocco). PhD thesis, University of Mohammed V-Agdal of Rabat, Rabat, Morocco; 2006.
49. Ghosh S, Barinova S, Keshri JP. Diversity and seasonal variation of phytoplankton community in the Santragachi Lake, West Bengal, India, QScience Connect. 2012;3. DOI:http://dx.doi.org/10.5339/connect.2012.3
50. Grall J, Coïc N. Report on the synthesis of the assesssment methods of benthos quality in coastal medium; Projet Rebent, France; 2005.
51. Daget J. Mathematical models in ecology; Masson, Paris, France; 1979.
_________________________________________________________________________________ © 2017 Boukari et al.; This is an Open Access article distributed under the terms of the Creative Commons Attribution License (http://creativecommons.org/licenses/by/4.0), which permits unrestricted use, distribution, and reproduction in any medium, provided the original work is properly cited.
Peer-review history: The peer review history for this paper can be accessed here:
http://sciencedomain.org/review-history/21973


![Untitled-1 [] · taxonomic characters. Zoological Nomenclature, origin of code, ICZN. UNIT V : Taxonomic Records And Publications Taxonomic keys, Taxonomic characters description,](https://img.pdfslide.us/doc/110x75/5e60819b810ee55ab507dd7d/untitled-1-taxonomic-characters-zoological-nomenclature-origin-of-code-iczn.jpg)