Embed Size (px)
Citation preview
Improved determination of particulate absorption from combined filter pad and PSICAM measurements
INA LEFERING,1* RÜDIGER RÖTTGERS,2 REBECCA WEEKS,3 DEREK
CONNOR,1 CHRISTIAN UTSCHIG,2 KERSTIN HEYMANN,2 AND DAVID MCKEE1
1Physics Department, University of Strathclyde, Glasgow, Scotland 2Remote Sensing Department, Helmholtz-Zentrum Geesthacht, Geesthacht, Germany 3Scottish Association for Marine Science, Oban, Scotland
Abstract: Filter pad light absorption measurements are subject to two major sources of
experimental uncertainty: the so-called pathlength amplification factor, β, and scattering
offsets, o, for which previous null-correction approaches are limited by recent observations of
non-zero absorption in the near infrared (NIR). A new filter pad absorption correction method
is presented here which uses linear regression against point-source integrating cavity
absorption meter (PSICAM) absorption data to simultaneously resolve both β and the
scattering offset. The PSICAM has previously been shown to provide accurate absorption
data, even in highly scattering waters. Comparisons of PSICAM and filter pad particulate
absorption data reveal linear relationships that vary on a sample by sample basis. This
regression approach provides significantly improved agreement with PSICAM data (3.2%
RMS%E) than previously published filter pad absorption corrections. Results show that direct
transmittance (T-method) filter pad absorption measurements perform effectively at the same
level as more complex geometrical configurations based on integrating cavity measurements
(IS-method and QFT-ICAM) because the linear regression correction compensates for the
sensitivity to scattering errors in the T-method. This approach produces accurate filter pad
particulate absorption data for wavelengths in the blue/UV and in the NIR where sensitivity
issues with PSICAM measurements limit performance. The combination of the filter pad
absorption and PSICAM is therefore recommended for generating full spectral, best quality
particulate absorption data as it enables correction of multiple errors sources across both
measurements.
© 2016 Optical Society of America
OCIS codes: (010.1030) Absorption; (010.4450) Oceanic optics.
References and links
1. C. D. Mobley, Light and Water. Radiative Transfer in Natural Waters (Academic, 1994).
2. S. B. Wozniak, and D. Stramski, "Modeling the optical properties of mineral particles suspended in seawater and their influence on ocean reflectance and chlorophyll estimation from remote sensing algorithms," Appl. Opt.
43, 3489-3503 (2004).
3. Z. P. Lee, K. L. Carder, and R. A. Arnone, "Deriving inherent optical properties from water color: a multiband
quasi-analytical algorithm for optically deep waters," Appl. Opt. 41, 5755-5772 (2002).
4. G. C. Chang, and T. D. Dickey, "Partitioning in situ total spectral absorption by use of moored spectral absorption-attenuation meters," Appl. Opt. 38, 3876-3887 (1999).
5. N. Hoepffner, and S. Sathyendranath, "Determination of the major groups of phytoplankton pigments from the
absorption-spectra of total particulate matter," J. Geophys. Res.-Oceans 98, 22789-22803 (1993).
6. G. Johnsen, O. Samset, L. Granskog, and E. Sakshaug, "In-vivo absorption characteristics in 10 classes of
bloom-forming phytoplankton-taxonomic characteristics and responses to photoadaptation by means of discriminant and HPLC analysis," Mar. Ecol. Prog. Ser. 105, 149-157 (1994).
7. A. M. Ciotti, M. R. Lewis, and J. J. Cullen, "Assessment of the relationships between dominant cell size in
natural phytoplankton communities and the spectral shape of the absorption coefficient," Limnol. Oceanogr. 47,
404-417 (2002).
8. M. J. Behrenfeld, and P. G. Falkowski, "A consumer's guide to phytoplankton primary productivity models," Limnol. Oceanogr. 42, 1479-1491 (1997).
9. B. G. Mitchell, "Algorithms for determining the absorption-coefficient of aquatic particulates using the
quantitative filter technique (QFT)," Proc. SPIE 1302, pp. 137-148 (1990).
10. M. Kishino, M. Takahashi, N. Okami, and S. Ichimura, "Estimation of the spectral absorption-coefficients of
phytoplankton in the sea," Bull. Mar. Sci. 37, 634-642 (1985).
11. G. M. Ferrari, and S. Tassan, "A method using chemical oxidation to remove light absorption by phytoplankton pigments," J. Phycol. 35, 1090-1098 (1999).
12. G. M. Zheng, and D. Stramski, "A model based on stacked-constraints approach for partitioning the light
absorption coefficient of seawater into phytoplankton and non-phytoplankton components," J. Geophys. Res.-
Oceans 118, 2155-2174 (2013).
13. A. Bricaud, and D. Stramski, "Spectral absorption coefficients of living phytoplankton and nonalgal biogenous matter: a comparison between the Peru upwelling area and the Sargasso Sea," Limnol. Oceanogr. 35, 562-582
(1990).
14. M. Babin, and D. Stramski, "Light absorption by aquatic particles in the near-infrared spectral region," Limnol. Oceanogr. 47, 911-915 (2002).
15. R. Röttgers, W. Schönefeld, P. R. Kipp, and R. Doerffer, "Practical test of a point-source integrating cavity
absorption meter: the performance of different collector assemblies," Appl. Opt. 44, 5549-5560 (2005).
16. R. Röttgers, and S. Gehnke, "Measurement of light absorption by aquatic particles: improvement of the
quantitative filter technique by use of an integrating sphere approach," Appl. Opt. 51, 1336-1351 (2012).
17. D. Stramski, R. A. Reynolds, S. Kaczmarek, J. Uitz, and G. M. Zheng, "Correction of pathlength amplification in the filter-pad technique for measurements of particulate absorption coefficient in the visible spectral region,"
Appl. Opt. 54, 6763-6782 (2015).
18. B. G. Mitchell, and D. A. Kiefer, "Chlorophyll-alpha specific absorption and fluorescence excitation-spectra for
light-limited phytoplankton," Deep-Sea Res. 35, 639-663 (1988).
19. C. S. Roesler, "Theoretical and experimental approaches to improve the accuracy of particulate absorption coefficients derived from the quantitative filter technique," Limnol. Oceanogr. 43, 1649-1660 (1998).
20. D. Stramski, "Artifacts in measuring absorption-spectra of phytoplankton collected on a filter," Limnol.
Oceanogr. 35, 1804-1809 (1990).
21. H. M. Sosik, "Storage of marine particulate samples for light-absorption measurements," Limnol. Oceanogr. 44,
1139-1141 (1999).
22. S. E. Lohrenz, "A novel theoretical approach to correct for pathlength amplification and variable sampling loading in measurements of particulate spectral absorption by the quantitative filter technique," J. Plankton Res.
22, 639-657 (2000).
23. D. Stramski, E. Boss, D. Bogucki, and K. J. Voss, "The role of seawater constituents in light backscattering in
the ocean," Prog. Oceanogr. 61, 27-56 (2004).
24. S. Tassan, and G. M. Ferrari, "Variability of light absorption by aquatic particles in the near-infrared spectral region," Appl. Opt. 42, 4802-4810 (2003).
25. R. Röttgers, C. Dupouy, B. B. Taylor, A. Bracher, and S. B. Wozniak, "Mass-specific light absorption
coefficients of natural aquatic particles in the near-infrared spectral region," Limnol. Oceanogr. 59, 1449-1460
(2014).
26. J. S. Cleveland, and A. D. Weidemann, "Quantifying absorption by aquatic particles - a multiple-scattering correction for glass-fiber filters," Limnol. Oceanogr. 38, 1321-1327 (1993).
27. B. Arbones, F. G. Figueiras, and M. Zapata, "Determination of phytoplankton absorption coefficient in natural
seawater samples: Evidence of a unique equation to correct the pathlength amplification on glass fiber filters,"
Mar. Ecol. Prog. Ser. 137, 293-304 (1996).
28. Z. V. Finkel, and A. J. Irwin, "Light absorption by phytoplankton and the filter amplification correction: cell size and species effects," J. Exp. Mar. Biol. Ecol. 259, 51-61 (2001).
29. R. Röttgers, D. Doxaran, and C. Dupouy, "Quantitative filter technique measurements of spectral light
absorption by aquatic particles using a portable integrating cavity absorption meter (QFT-ICAM)," Opt. Express
24, A1-A20 (2016).
30. H. G. Truper, and C. S. Yentsch, "Use of glass fiber filters for rapid preparation of in vivo absorption spectra of photosynthetic bacteria," JournJ. Bacteriol. 94, 1255-& (1967).
31. B. G. Mitchell, M. Kahru, J. Wieland, and M. Stramska, "Determination of spectral absorption coefficients of
particles, dissolved material and phytoplankton for discrete water samples," in Ocean Optics Protocols for
Satellite Ocean Color Sensor Validation - Rev.4, J. L. Mueller, G. S. Fargion, and C. R. McClain, eds. (2003), pp. 39-64.
32. S. Tassan, and G. M. Ferrari, "An alternative approach to absorption measurements of aquatic particles retained
on filters," Limnol. Oceanogr. 40, 1358-1368 (1995).
33. S. Tassan, and G. M. Ferrari, "Measurement of light absorption by aquatic particles retained on filters:
determination of the optical pathlength amplification by the 'transmittance-reflectance' method," J. Plankton Res. 20, 1699-1709 (1998).
34. H. Maske, and H. Haardt, "Quantitative invivo absorption-spectra of phytoplankton - detrital absorption and comparison with fluorescence excitation-spectra," Limnol. Oceanogr. 32, 620-633 (1987).
35. G. Neukermans, R. A. Reynolds, and D. Stramski, "Contrasting inherent optical properties and particle
characteristics between an under-ice phytoplankton bloom and open water in the Chukchi Sea," Deep-Sea Res.
Part II-Top. Stud. Oceanogr. 105, 59-73 (2014).
36. M. Babin, and D. Stramski, "Variations in the mass-specific absorption coefficient of mineral particles suspended in water," Limnol. Oceanogr. 49, 756-767 (2004).
37. D. McKee, R. Röttgers, G. Neukermans, V. S. Calzado, C. Trees, M. Ampolo-Rella, C. Neil, and A.
Cunningham, "Impact of measurement uncertainties on determination of chlorophyll-specific absorption
coefficient for marine phytoplankton," J. Geophys. Res.-Oceans 119, 9013-9025 (2014).
38. A. R. Neeley, S. A. Freeman, and L. A. Harris, "Multi-method approach to quantify uncertainties in the measurements of light absorption by particles," Opt. Express 23, 31043-31058 (2015).
39. R. Röttgers, C. Haese, and R. Doerffer, "Determination of the particulate absorption of microalgae using a
point-source integrating-cavity absorption meter: verification with a photometric technique, improvements for pigment bleaching, and correction for chlorophyll fluorescence," Limnol. Oceanogr.-Methods 5, 1-12 (2007).
40. R. Röttgers, and R. Doerffer, "Measurements of optical absorption by chromophoric dissolved organic matter
using a point-source integrating-cavity absorption meter," Limnol. Oceanogr.-Methods 5, 126-135 (2007).
41. F. P. Chavez, K. R. Buck, R. R. Bidigare, D. M. Karl, D. Hebel, M. Latasa, L. Campbell, and J. Newton, "On
the chlorophyll-a retention properties of glass-fiber GF/F filters," Limnol. Oceanogr. 40, 428-433 (1995).
42. M. Stramska, D. Stramski, R. Hapter, S. Kaczmarek, and J. Ston, "Bio-optical relationships and ocean color algorithms for the north polar region of the Atlantic," J. Geophys. Res.-Oceans 108 (2003).
43. N. B. Nelson, D. A. Siegel, and A. F. Michaels, "Seasonal dynamics of colored dissolved material in the
Sargasso Sea," Deep-Sea Res. Part I- Oceanogr. Res. Pap. 45, 931-957 (1998).
44. K. Allali, A. Bricaud, and H. Claustre, "Spatial variations in the chlorophyll-specific absorption coefficients of
phytoplankton and photosynthetically active pigments in the equatorial Pacific," J. Geophys. Res.-Oceans 102, 12413-12423 (1997).
45. L. R. Moore, R. Goericke, and S. W. Chisholm, "Comparative physiology of synechococcus and
prochlorococcus - influence of light and temperature on growth, pigments, fluorescence and absorptive
properties," Mar. Ecol. Prog. Ser. 116, 259-275 (1995).
46. N. Hoepffner, and S. Sathyendranath, "Biooptical characteristics of coastal water - absorption-spectra of phytoplankton and pigment distribution in the western North-Atlantic," Limnol. Oceanogr. 37, 1660-1679
(1992).
47. E. S. Fry, G. W. Kattawar, and R. M. Pope, "Integrating cavity absorption meter," Appl. Opt. 31, 2055-2065
(1992).
1. Introduction
The light absorption and scattering properties of marine particles are important for the
parameterisation of radiative transfer models [1] and the interpretation of ocean colour remote
sensing signals [2, 3]. Spectral absorption data can be used to assess the composition of
inorganic and organic material [4]. Light absorption by phytoplankton, in particular, is of
interest in many biological studies as it can yield information on pigment composition and
concentration [5, 6] and the size structure of phytoplankton communities [7] which can be
used to populate models of primary production and photosynthesis [8].
The most common method to determine the spectral absorption of light by particles, ap, is
to collect the particulate matter on a glass fibre filter and measure its absorption in a
spectrophotometer. This so-called filter pad technique or quantitative filter technique (QFT)
[9] benefits from having a controllable sensitivity because signal strength can be modified by
the amount of material concentrated on the filter paper. The filter pad technique therefore has
sufficient sensitivity even in oligotrophic waters with very low suspended particle
concentrations. The filter pad technique, additionally, allows the partitioning of particulate
absorption into absorption associated with phytoplankton pigments and non-algal particulate
matter, by removing light absorbing pigments from the filter paper with either an organic
solvent [10] or an oxidising agent [11]. Particulate spectral absorption coefficients can also be
partitioned through numerical decomposition [12, 13].
Alternatively, ap can be determined from measurements of particles in suspension after
subtraction of absorption by the dissolved components. Cuvette measurements in a standard
spectrophotometer, however, suffer from scattering losses that can potentially cause
systematic overestimation of absorption coefficients even for optically thin suspensions.

Recently developed methods to improve the measurement of absorption by suspensions are
based on integrating sphere approaches [14]. One example is measurement with a point-source
integrating cavity absorption meter (PSICAM), which has been shown to be virtually
insensitive to the presence of scattering by particulate material and to have a reasonably high
sensitivity (though some limitations have been identified – see Section 2.4) [15]. This makes
the PSICAM well-suited for the determination of absorption by natural water samples. The
operation of a PSICAM, however, is laborious and, to date, only very few studies using
PSICAM absorption data have been published. For the determination of particulate absorption
coefficients, current limitations of the PSICAM are (1) inability to separate algal and non-
algal particulate absorption, and (2) lower sensitivity compared to the filter pad technique.
Filter pad absorption measurements are therefore expected to be widely used for the
determination of particulate absorption coefficients in the foreseeable future [16, 17].
Great effort has gone into the identification and quantification of measurement
uncertainties and subsequent improvement of the filter pad absorption methodology. Error
sources include wetness of the filter, different filter types [18], filter-to-filter variation even
for filters of the same type [19], storage and freezing of filters [20, 21], sample loading [22],
improper filtration, and temperature and salinity effects. The major sources of uncertainty,
however, are the unknown extent of scattering offsets and limitations in the correction for
pathlength amplification [13, 19, 22]. Light loss due to sample scattering can result in a
systematic error by introducing a positive offset of unknown magnitude to measured
absorption data. In practise, negative offsets due to imperfections in the experimental
procedure can also be observed. This is problematic in both filter pad absorption and cuvette
measurements. Scattering effects are commonly corrected by applying a null-point correction
(subtracting the signal measured at wavelengths > 750 nm from the rest of the spectrum)
assuming negligible NIR absorption. This assumption, however, does not hold in coastal or
mineral-rich waters [23-25] and can lead to a systematic underestimation of particulate
absorption coefficients across the entire spectrum.
Pathlength amplification occurs when the pathlength of a photon travelling through the
sample filter is increased due to multiple scattering events within the filter/sample matrix.
Pathlength amplification will result in apparent increased sample absorption and data have to
be corrected to obtain quantitative absorption coefficients. Measurements are commonly
corrected by applying a predetermined pathlength amplification factor, β, which is defined as
the ratio of optical to geometrical pathlength. Accurate determination of β is crucial to convert
the optical density, OD, of the sample on the filter as measured in a spectrophotometer into
quantitative particulate absorption coefficients using
V
AODa
f
p
303.2 (1)
where ap is the particulate absorption coefficient (m-1
) at a given wavelength (λ, nm), ODf is
the optical density of the sample on the filter (dimensionless), A is the filter clearance area
(m2), and V is the volume of sample filtered (m
3). The factor, β, has typically been derived
from experiments with algal cultures and calculated as the ratio between the optical density of
a filter, ODf, and the optical density of the same sample in a dilute suspension, ODs [13], with
a functional relationship established that can later be applied to field samples.
An alternative, widely used approach to correct for pathlength amplification uses a
predetermined function, ODs=f(ODf), to directly convert ODf into ODs. ap is then calculated
using
V
AODa s
p
303.2 (2)
This approach was first proposed by Mitchell [9] who identified a second order
polynomial as best descriptor for the relationship. Many studies have since adapted this
approach and observed variability in the pathlength amplification correction dependent on
phytoplankton species, cell size and shape, OD or wavelength [9, 26-28]. The function
ODs=f(ODf) indirectly accounts for the β-factor.
In order to determine an accurate correction for pathlength amplification, it is necessary to
minimise uncertainties in the determination of ODf and ODs. Over the past few decades,
several geometric configurations for the measurements of ODf and ODs have been proposed
and tested. Recent literature suggests four different set-ups currently being used to determine
ODf: the transmittance method (T-method), the transmittance-reflectance method (T-R-
method) and two different set-ups measuring filters inside an integrating sphere (IS-method
and QFT-ICAM. The IS-method uses scanning monochromatic illumination of a dual-beam
spectrophotometer equipped with an integrating cavity whereas the QFT-ICAM set-up
includes a broadband white light source [29]. Trüper and Yentsch [30] first suggested
measuring the transmittance through a wet glass fibre filter relative to an empty, wet reference
filter. The T-method is the simplest and fastest approach and has been used as a standard
method for decades [see NASA protocols; 31]. It has been suggested, however, that it suffers
from limited control over measurement parameters, such as scattering errors and filter-to-filter
variation and a high sensitivity to changing wetness of the filter [e.g. 18, 22, 26, 27]. As glass
fibre filters effectively act as diffusors, measurements are potentially susceptible to large
scattering errors. Scattering errors can be reduced by placing the filters at the entrance of an
integrating sphere or close to the detector window.
The transmittance-reflectance method proposed by Tassan and Ferrari [32, 33] was
designed to reduce errors when minerogenic material changes the filter backscattering and to
help overcome some geometric limitations associated with the T-method. It can partially
correct for measurement errors due to backscattering losses and filter-to-filter differences. In
theory, the T-R method does not require null-point correction but it might be applied in
practice to reduce uncertainties originating from imperfections in the measurement set-up.
Despites its apparent benefits over the T-method, the T-R-method has not been widely used in
the past mainly because of its complex and laborious measurement protocol and the
requirement for additional experimental apparatus (an integrating sphere).
Measuring the absorptance of a sample on a filter inside an integrating sphere (IS-method
and QFT-ICAM) benefits from a significantly reduced scattering error, high sensitivity and
improved signal-to-noise ratio [16, 17, 34] but has only been used in a limited number of
studies [e.g. 35]. Measurements made with a QFT-ICAM or the IS-method do not require
null-correction.
Röttgers and Gehnke [16] showed that average β-factors vary systematically between
geometric configurations. They examined the relationship for three different configurations
(T, T-R and IS-method) and showed significant differences, with median values for IS being
two times higher than for T-R. This means that there is no universal β-factor and values
determined for one measurement geometry cannot be simply ported onto another. All other
factors being equal (e.g. availability of relevant equipment), the most favourable method is
therefore the one with the smallest associated uncertainty in the determination of β and a
quantifiable scattering correction.
Of course, determination of β requires an associated measurement of ODs. Accurate
determination of ODs using a cuvette inside a spectrophotometer is extremely difficult and can
be significantly affected by scattering losses. Scattering errors can be reduced, but not
completely eliminated, when placing the cuvette inside an integrating sphere [36]. There
remains, however, a concern about potential pathlength amplification effects for transmitted
and scattered photons subsequently re-entering the sample. At this time, the most effective
measurement set-up uses a PSICAM to determine the absorption of a sample, effectively
without any scattering errors, and provides a standard against which filter pad absorption
measurements can be validated. It should be noted that PSICAM measurements do not return
ODs but rather ap directly (after subtraction of CDOM absorption). Empirical relationships for
ap=f(ODf) can be derived, similar to ODs=f(ODf), and used to directly convert ODf into
particulate absorption coefficients [37].
Accuracy of the filter pad method as a quantitative technique has remained controversial,
at least partly because of the variety of protocols in use. As a result of improvements in
instrumentation and methodology, uncertainties in the determination of particulate absorption
coefficients were the subject of a number of recent publications. Stramski et al. [17] derived
individual functional relationship between ODs and ODf for three different geometrical
configurations (T-method, T-R method and IS-method) using samples with a variety of
optically relevant particle characteristics. They recommended the use of a power law function
for conversion of ODf into ODs for future and historic datasets. The study relied on ODs
measurements from cuvettes placed inside an integrating sphere. Neeley et al. [38] performed
a multi-analytical approach to get robust estimates of uncertainties in ap for selected ocean
colour remote sensing wavelengths. They incorporated different experimental and analytical
methods to derive ap and found a large variability between the different approaches for
different water types.
PSICAM data with minimal scattering error and baseline artefacts enables investigation of
the impact of different error sources in filter pad absorption measurements and can help to
establish a protocol for the correction for pathlength amplification and scattering offset. To
date, three studies have used PSICAM data to assess the performance of traditional pathlength
amplification corrections. All of them found that the relationships between particulate
absorption coefficients and ODf are well described using a linear function for individual
samples using the T- method [37] and the IS-method [16, 29]. This suggests that previous
significantly non-linear relationships might have been affected by errors in the determination
of ODs due to scattering errors in cuvette measurements. McKee et al. [37] established a linear
regression scheme to correct filter pad absorption measurements (T-method). The slope of the
linear function effectively represents a wavelength-independent, OD-independent β-factor.
The intercept enables correction for scattering offsets without assuming zero NIR absorption.
The aim of this work is to investigate uncertainties in filter pad absorption techniques in
comparison with PSICAM data. Three datasets will be used to quantify the variability in β-
factors determined using a linear regression approach including samples with a variety of
optical properties. This linear method will be compared to historic approaches to correct
pathlength amplification and scattering effects in quantitative filter pad absorption
measurements. This work will predominantly focus on the T-method as it is still the most
commonly used technique and draw comparisons with more involved methods, such as IS and
QFT-ICAM. The overall goal is to establish an optimised methodology for experimentally
determining ap drawing on the strengths of both PSICAM and filter pad absorption
techniques.
2. Methods
2.1 Datasets
Variability in corrected filter pad absorption measurements was assessed using three datasets:
(1) algal cultures (AC), (2) data from the Ligurian Sea (BP09) and (3) data from UK coastal
waters (UKCW). All datasets contained at least one PSICAM measurement and a filter pad
measurement (T-method) for each sample.
AC data were gathered during a series of laboratory experiments at the Scottish
Association for Marine Science (SAMS) in June 2014. The dataset contains 14 samples which
were dilutions from cultures of 8 different algal species (Table 1). The BP09 dataset contains
62 samples collected in coastal and oceanic waters in the Ligurian Sea in 2009. A detailed
description of the sampling location, methods and data can be found in [37]. For 51 samples
collected on the UKCW cruise in 2015, a more extensive dataset is available, including 3
different filter pad measurement approaches and 2 sets of independently measured PSICAM
absorption spectra. Filter pad data measured with the T-method plus one set of PSICAM data
were collected by the University of Strathclyde (‘Strath’). A second set of PSICAM
measurements and 2 additional filter pad absorption were made by the Helmholtz-Zentrum
Geesthacht (‘HZG’). The latter were based on the integrating cavity approach: (1) using an
integrating sphere with a spectrophotometer (IS) and (2) using the recently developed QFT-
ICAM. Details on methods and data were recently published in [40].
Table 1. Summary of cultured algal species, type, size and location of isolation.
species
(reference) type size isolation
Alexandrium minutum
(CCAP, 1119/50) dinoflagellate 30 µm 2008, Scapa, Orkney
(58° 55'N 003° 06' W)
Alexandrium temarense
(CCAP, 1119/28) dinoflagellate 50 µm
2008, Scapa, Orkney
(58° 55'N 003° 06' W)
Heterocapsa spp.
(CCAP, 1125/4) dinoflagellate 8 µm
2011, Argyllshire
Karenia mikimotoi
(SCCAP, K-0260) dinoflagellate 34 µm
1977,
Oslofjorden Norway
Microcystis aeruginosa (CCAP, 1450/2)
cyanobacteria 5 µm 1954, Little Rideau Lake, Ontario, Canada
Pseudonitzschia seriata
(CCAP, 1061/42) diatom
100
µm
2012,
Loch Creran, Argyll
Scripsiella sp. (CCAP, 1134/8)
dinoflagellate 25 µm 2003,
LY5 sampling site (SAMS)
Skeletonema marinoi
(CCAP, 1077/5) diatom 20 µm
1956, Long Island Sound, Milford
Harbour, Connecticut
Synechococcus sp.
(CCAP, 1479/9) cyanobacteria 1 µm
1989, South Basin, Windermere,
Cumbria, England, UK
2.2 PSICAM absorption measurements
The absorption by non-water constituents in an untreated sample (all dissolved and suspended
material) was determined in triplicate against purified water (Milli-Q; water purification
system: Simplicity UV, Millipore) as a reference (for details on calibration and measurement
protocol see [39, 40 The temperature and salinity of each sample were recorded and
absorption spectra were corrected for temperature and salinity effects using instrument
specific correction factors [40]. For separation of suspended and dissolved material, each
sample was filtered through a 0.22 µm pore size membrane filter (GSWP, Merck Millipore
Ltd., Ireland) using a low vacuum <0.2 bar (to avoid cell breakage and loss of pigments) and
the absorption by the filtrate, i.e. that of chromophoric organic matter (CDOM), was measured
following the same protocol. The absorption by particulate matter was calculated by
subtracting the CDOM absorption from the total absorption coefficient.
Data from two independent PSICAM measurements were available for samples collected
on the UKCW cruise which were used to test the overall performance of the method. To avoid
artefacts due to differences in the calibration solution, 5L of the calibration solution,
Nigrosine, were prepared every morning and two fresh sub-samples were used for each
calibration (3-5 times a day) of the two different PSICAMs. The required corresponding
measurements of Nigrosine absorption spectra were also made independently by the two
groups, using two long pathlength systems (LWCC, World Precision Instruments Inc.).
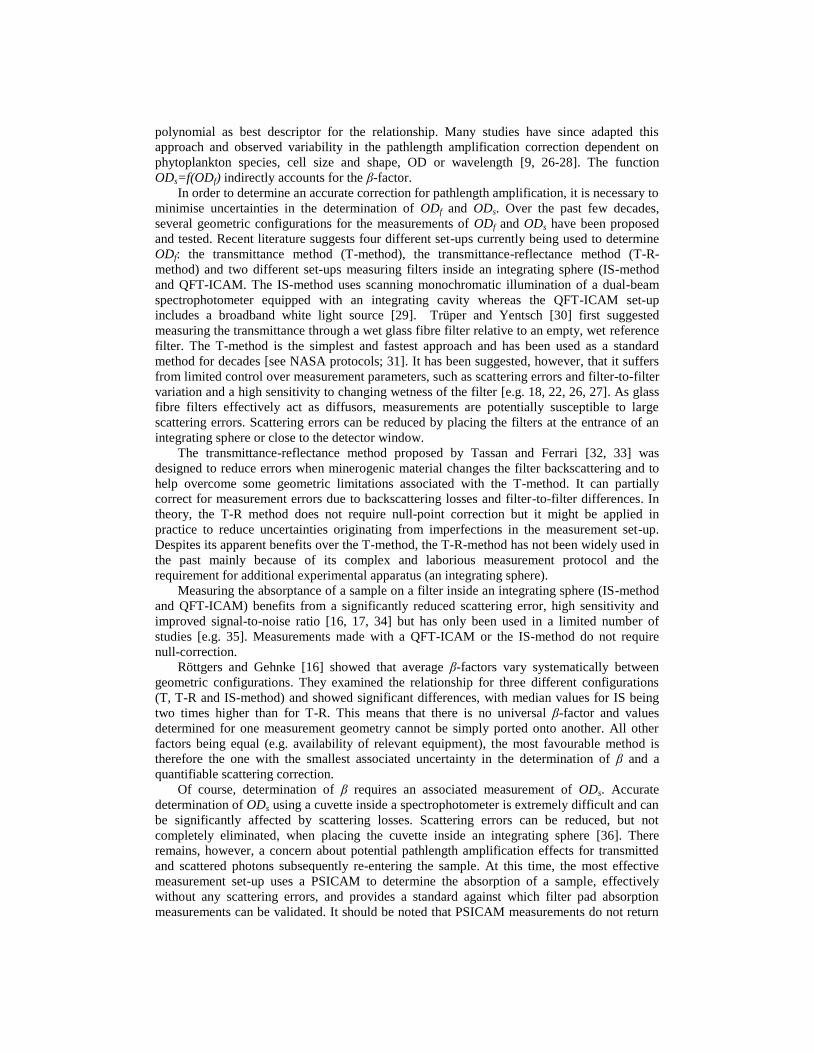
Particulate absorption spectra from natural samples measured using both PSICAMs were
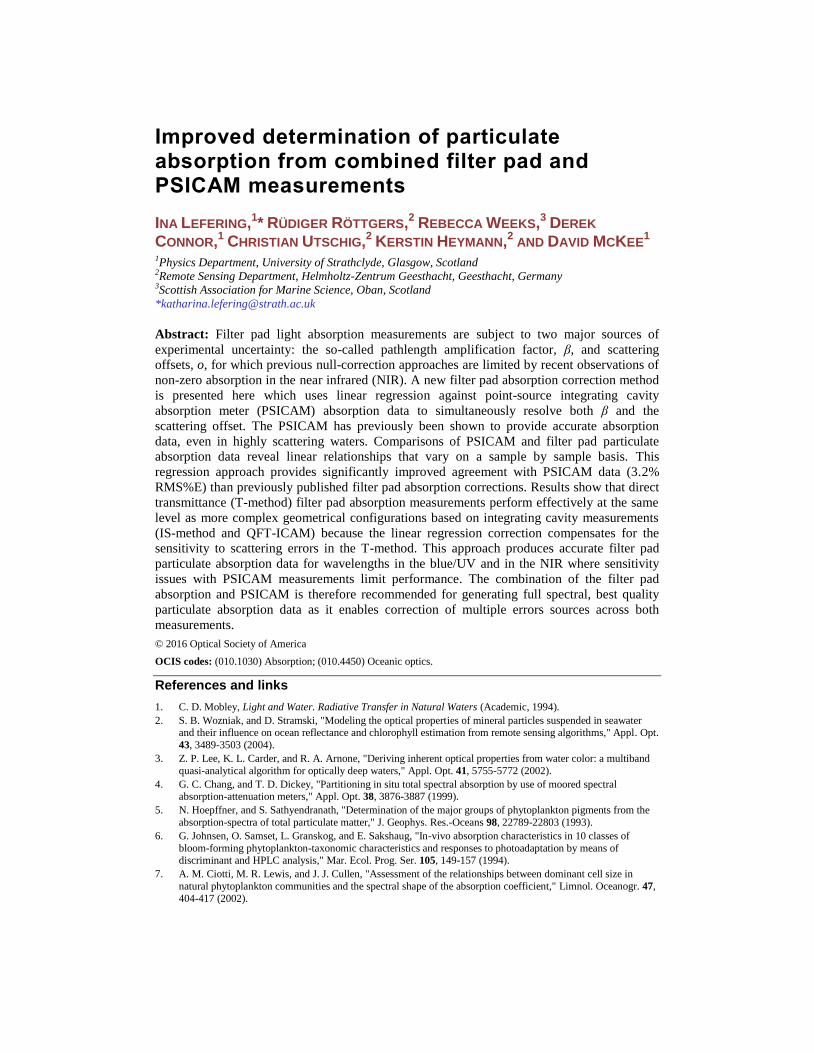
found to agree within 7.3% RMedianS%E in the visible spectrum (Fig. 1). The relative
deviation between the two instruments increased towards the NIR (typically within 30%,
maximum of 95%) where absorption coefficients were generally low. Separate comparison of
CDOM absorption coefficients against data measured with the two liquid waveguide systems
showed agreement within 15% (data not shown). This level of consistency between two
independent datasets is a very encouraging endorsement of the performance of the PSICAM
approach.
Strath ap() [m-1
]
0.001 0.01 0.1 1 10
HZ
G a
p(
) [m
-1]
0.001
0.01
0.1
1
10
Fig. 1. Comparison of particulate absorption spectra (400-700 nm) of all samples collected on the UKCW cruise using two independent PSICAMs – one
operated by the Helmholtz-Zentrum Geesthacht (HZG) and one by the
University of Strathclyde (Strath).
2.3 Filter pad absorption measurements
The OD of particulate matter collected on a filter paper was measured in a dual-beam
spectrophotometer (UV2501-PC, Shimadzu Corp., Japan) using the T-method for all three
datasets. The spectrophotometer was allowed to warm up for an hour before the first
measurement was taken. Two reference filters were prepared by running 300 mL of 0.2 µm
filtered seawater through 47 mm GF/F filter paper (Whatman) under a low vacuum. A
baseline was recorded without filters in place and a reference measurement was taken with
two reference filters attached to the alcohol-cleaned glass windows, placed directly against the
exit ports inside the spectrophotometer. Sample filters were prepared by filtering a specific
volume (0.05 L to 5 L) through a 47 mm GF/F filter [<0.5 µm; 41] using a low vacuum. The
volume filtered was adjusted for each sample so that the maximum OD measured was close
to, but did not exceed, 0.4 OD. Funnel and filter paper were kept covered at all times to avoid
contamination and filters were measured directly after filtration. Filters were hydrated with
drops of filtered seawater in between measurements when necessary. The OD of each filter
was determined in a single scan to minimise artefacts due to heating or bleaching of the filter
inside the spectrophotometer (alteration of the filter absorption by the measurement itself were
observed for multiple scans). Each filter was bleached by adding a few drops of dilute sodium
hypochlorite to the filter paper, exposing it until pigment loss was observed. The bleach was
removed by rinsing the filter with approx. 300 mL of filtered seawater and the OD spectrum
of the bleached filter determined against the Milli-Q reference filter. A reference measurement
was measured before and after each set of sample filter/bleached filter to monitor drifts in the
baseline. Observed shifts were usually smaller than the measurement error.
Additional filter pad absorption data measured using the IS-method and the QFT-ICAM
were available from the UKCW cruise. Measurements were performed following the
procedure described in [16]. All data collected by HZG has been published together with a
detailed description of set-up and measurement protocols for the new QFT-ICAM by Röttgers
et al. [29].
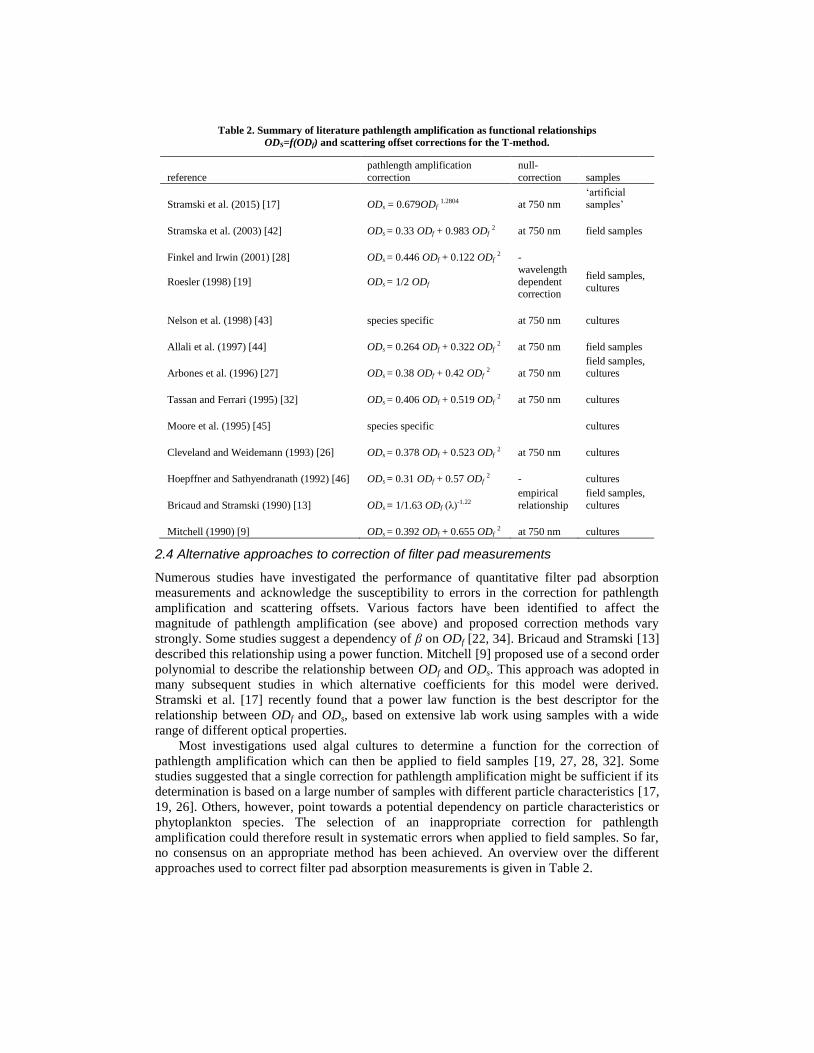
Table 2. Summary of literature pathlength amplification as functional relationships
ODS=f(ODf) and scattering offset corrections for the T-method.
reference
pathlength amplification
correction
null-
correction samples
Stramski et al. (2015) [17] ODs = 0.679ODf 1.2804 at 750 nm
‘artificial samples’
Stramska et al. (2003) [42] ODs = 0.33 ODf + 0.983 ODf 2 at 750 nm field samples
Finkel and Irwin (2001) [28] ODs = 0.446 ODf + 0.122 ODf 2 -
Roesler (1998) [19] ODs = 1/2 ODf
wavelength
dependent correction
field samples,
cultures
Nelson et al. (1998) [43] species specific at 750 nm cultures
Allali et al. (1997) [44] ODs = 0.264 ODf + 0.322 ODf 2 at 750 nm field samples
Arbones et al. (1996) [27] ODs = 0.38 ODf + 0.42 ODf 2 at 750 nm
field samples, cultures
Tassan and Ferrari (1995) [32] ODs = 0.406 ODf + 0.519 ODf 2 at 750 nm cultures
Moore et al. (1995) [45] species specific
cultures
Cleveland and Weidemann (1993) [26] ODs = 0.378 ODf + 0.523 ODf 2 at 750 nm cultures
Hoepffner and Sathyendranath (1992) [46] ODs = 0.31 ODf + 0.57 ODf 2 - cultures
Bricaud and Stramski (1990) [13] ODs = 1/1.63 ODf (λ)-1.22
empirical
relationship
field samples,
cultures
Mitchell (1990) [9] ODs = 0.392 ODf + 0.655 ODf 2 at 750 nm cultures
2.4 Alternative approaches to correction of filter pad measurements
Numerous studies have investigated the performance of quantitative filter pad absorption
measurements and acknowledge the susceptibility to errors in the correction for pathlength
amplification and scattering offsets. Various factors have been identified to affect the
magnitude of pathlength amplification (see above) and proposed correction methods vary
strongly. Some studies suggest a dependency of β on ODf [22, 34]. Bricaud and Stramski [13]
described this relationship using a power function. Mitchell [9] proposed use of a second order
polynomial to describe the relationship between ODf and ODs. This approach was adopted in
many subsequent studies in which alternative coefficients for this model were derived.
Stramski et al. [17] recently found that a power law function is the best descriptor for the
relationship between ODf and ODs, based on extensive lab work using samples with a wide
range of different optical properties.
Most investigations used algal cultures to determine a function for the correction of
pathlength amplification which can then be applied to field samples [19, 27, 28, 32]. Some
studies suggested that a single correction for pathlength amplification might be sufficient if its
determination is based on a large number of samples with different particle characteristics [17,
19, 26]. Others, however, point towards a potential dependency on particle characteristics or
phytoplankton species. The selection of an inappropriate correction for pathlength
amplification could therefore result in systematic errors when applied to field samples. So far,
no consensus on an appropriate method has been achieved. An overview over the different
approaches used to correct filter pad absorption measurements is given in Table 2.

[nm]
400 500 600 700
ap
()
[m-1
]
0.0
0.5
1.0
1.5
2.0
2.5
3.0 PSICAM
filter pad uncorrected
PSICAM ap
() [m-1
]
0.0 0.5 1.0 1.5 2.0 2.5 3.0
filter
pa
d a
U ()
[m-1
]
0.0
0.5
1.0
1.5
2.0
2.5
3.0
data excluded from analysis
data in linear range
2.35
offset = 0.07
r ² = 0.9979
[nm]
400 500 600 700
ap
()
[m-1
]
0.0
0.2
0.4
0.6
0.8
1.0
1.2 PSICAM
filter pad
(f)
(e)
(d)
[nm]
400 500 600 700
ap
()
[m-1
]
0.0
0.2
0.4
0.6
PSICAM ap
() [m-1
]
0.0 0.2 0.4 0.6
filter
pa
d a
U ()
[m-1
]
0.0
0.2
0.4
0.6
3.30
offset = 1.94e-3
r ² = 0.9972
[nm]
400 500 600 700
ap
()
[m-1
]
0.00
0.05
0.10
0.15
0.20(c)
(b)
(a)
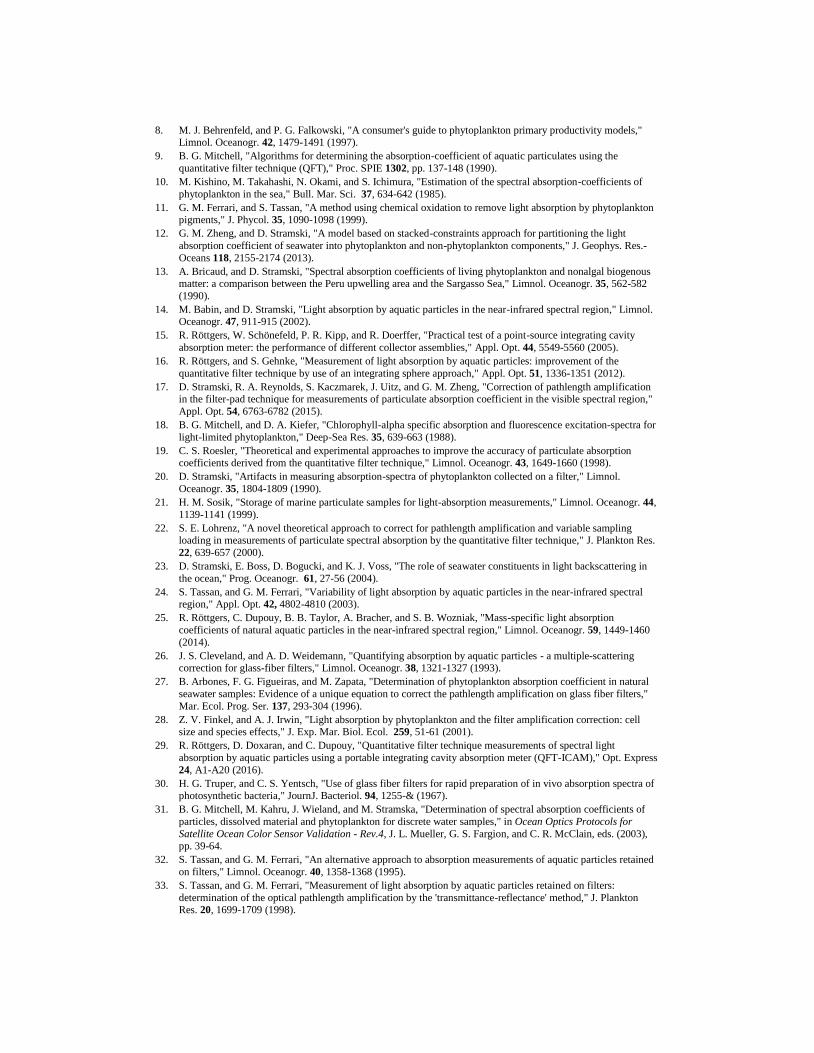
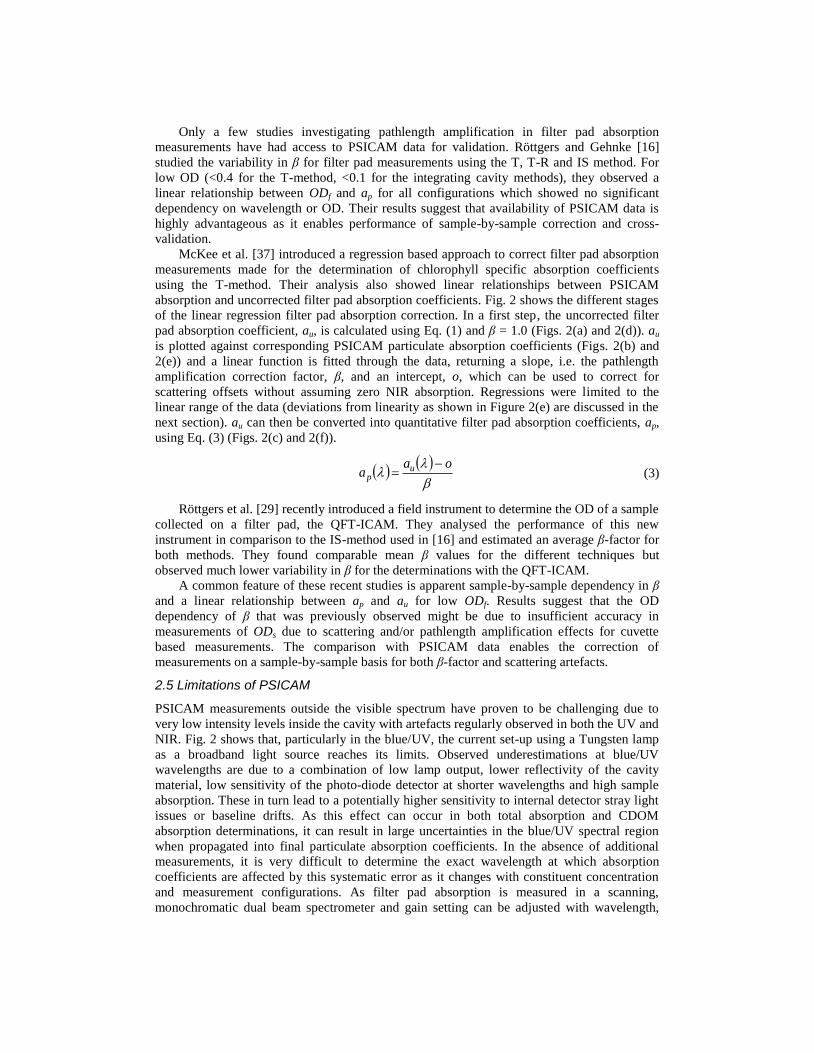
Fig. 2. (a) and (d) PSICAM data, ap, and uncorrected (β = 1) filter pad data, au,
of two different samples. (b) and (e) linear regression, coefficients and R2 for
the same samples. Data ranges for the linear regression were limited to 400 – 700 nm for (b) and 440 – 700 nm for (e). (c) and (f) show final particulate
absorption spectra measured with PSICAM and T-method. Filter pad data have
been offset corrected and re-scaled using Eq. (3) and the coefficients derived in (b) and (e) respectively.
Only a few studies investigating pathlength amplification in filter pad absorption
measurements have had access to PSICAM data for validation. Röttgers and Gehnke [16]
studied the variability in β for filter pad measurements using the T, T-R and IS method. For
low OD (<0.4 for the T-method, <0.1 for the integrating cavity methods), they observed a
linear relationship between ODf and ap for all configurations which showed no significant
dependency on wavelength or OD. Their results suggest that availability of PSICAM data is
highly advantageous as it enables performance of sample-by-sample correction and cross-
validation.
McKee et al. [37] introduced a regression based approach to correct filter pad absorption
measurements made for the determination of chlorophyll specific absorption coefficients
using the T-method. Their analysis also showed linear relationships between PSICAM
absorption and uncorrected filter pad absorption coefficients. Fig. 2 shows the different stages
of the linear regression filter pad absorption correction. In a first step, the uncorrected filter
pad absorption coefficient, au, is calculated using Eq. (1) and β = 1.0 (Figs. 2(a) and 2(d)). au
is plotted against corresponding PSICAM particulate absorption coefficients (Figs. 2(b) and
2(e)) and a linear function is fitted through the data, returning a slope, i.e. the pathlength
amplification correction factor, β, and an intercept, o, which can be used to correct for
scattering offsets without assuming zero NIR absorption. Regressions were limited to the
linear range of the data (deviations from linearity as shown in Figure 2(e) are discussed in the
next section). au can then be converted into quantitative filter pad absorption coefficients, ap,
using Eq. (3) (Figs. 2(c) and 2(f)).
oaa u
p
(3)
Röttgers et al. [29] recently introduced a field instrument to determine the OD of a sample
collected on a filter pad, the QFT-ICAM. They analysed the performance of this new
instrument in comparison to the IS-method used in [16] and estimated an average β-factor for
both methods. They found comparable mean β values for the different techniques but
observed much lower variability in β for the determinations with the QFT-ICAM.
A common feature of these recent studies is apparent sample-by-sample dependency in β
and a linear relationship between ap and au for low ODf. Results suggest that the OD
dependency of β that was previously observed might be due to insufficient accuracy in
measurements of ODs due to scattering and/or pathlength amplification effects for cuvette
based measurements. The comparison with PSICAM data enables the correction of
measurements on a sample-by-sample basis for both β-factor and scattering artefacts.
2.5 Limitations of PSICAM
PSICAM measurements outside the visible spectrum have proven to be challenging due to
very low intensity levels inside the cavity with artefacts regularly observed in both the UV and
NIR. Fig. 2 shows that, particularly in the blue/UV, the current set-up using a Tungsten lamp
as a broadband light source reaches its limits. Observed underestimations at blue/UV
wavelengths are due to a combination of low lamp output, lower reflectivity of the cavity
material, low sensitivity of the photo-diode detector at shorter wavelengths and high sample
absorption. These in turn lead to a potentially higher sensitivity to internal detector stray light
issues or baseline drifts. As this effect can occur in both total absorption and CDOM
absorption determinations, it can result in large uncertainties in the blue/UV spectral region
when propagated into final particulate absorption coefficients. In the absence of additional
measurements, it is very difficult to determine the exact wavelength at which absorption
coefficients are affected by this systematic error as it changes with constituent concentration
and measurement configurations. As filter pad absorption is measured in a scanning,
monochromatic dual beam spectrometer and gain setting can be adjusted with wavelength,
measurements are less susceptible to issues due to low intensity levels in the blue/UV. Fig. 2
shows data for two samples, only one of which exhibits PSICAM underestimation in the UV.
Plotting PSICAM and uncorrected filter pad absorption (Figs. 2(b) and 2(e)), there is a clear
point of deviation in one of the plots (Fig. 2(e)) where the effect of PSICAM underestimation
becomes obvious. The linear regression slope and offset is generated using only the
undeviating parts of the PSICAM data, but can be applied to the entire filter pad spectrum.
The approach presented here can therefore help extend the range of accurate particulate
absorption coefficients into the UV (Figs. 2(c) and 2(f)) and at the same time provide a quality
control mechanism for PSICAM measurements.
3. Results
3.1 Differences in β-factors between geometric configurations
Using the linear regression approach, distributions of β-factors were derived for three different
geometrical configurations (T-method, IS-method and QFT-ICAM), used during the UKCW
cruise in 2015. The coefficient of determination against PSICAM data was > 0.92 for all
samples. Observed mean β values varied strongly between the different methods and were
over 60% larger for the integrating sphere methods with 4.5 for the IS-method and 3.9 for the
QFT-ICAM compared to 2.5 for the T-method (Table 3). Mean β-factors vary only very
slightly from the values (4.56 and 4.06 for IS-method and QFT-ICAM, respectively) presented
in [29] because here the HZG filter pad data is compared against ‘Strath’ rather than ‘HZG’
PSICAM absorption data. Measurements made inside integrating spheres tend to amplify the
pathlength more strongly, and hence result in larger β, than the T-method. The apparent
variability in β (95% PI, Table 3) was similar across all geometries, which suggests that the
integrating cavity methods might not have a significant advantage over the T-configuration.
Table 3. Mean and 95% prediction intervals for β-distributions derived for three different
geometrical configurations used during the UKCW cruise in 2015.
Method Median
95% prediction
intervals
T-Method 2.5 ±1.3
QFT-ICAM 3.9 ±1.0
IS-method 4.5 ±1.7
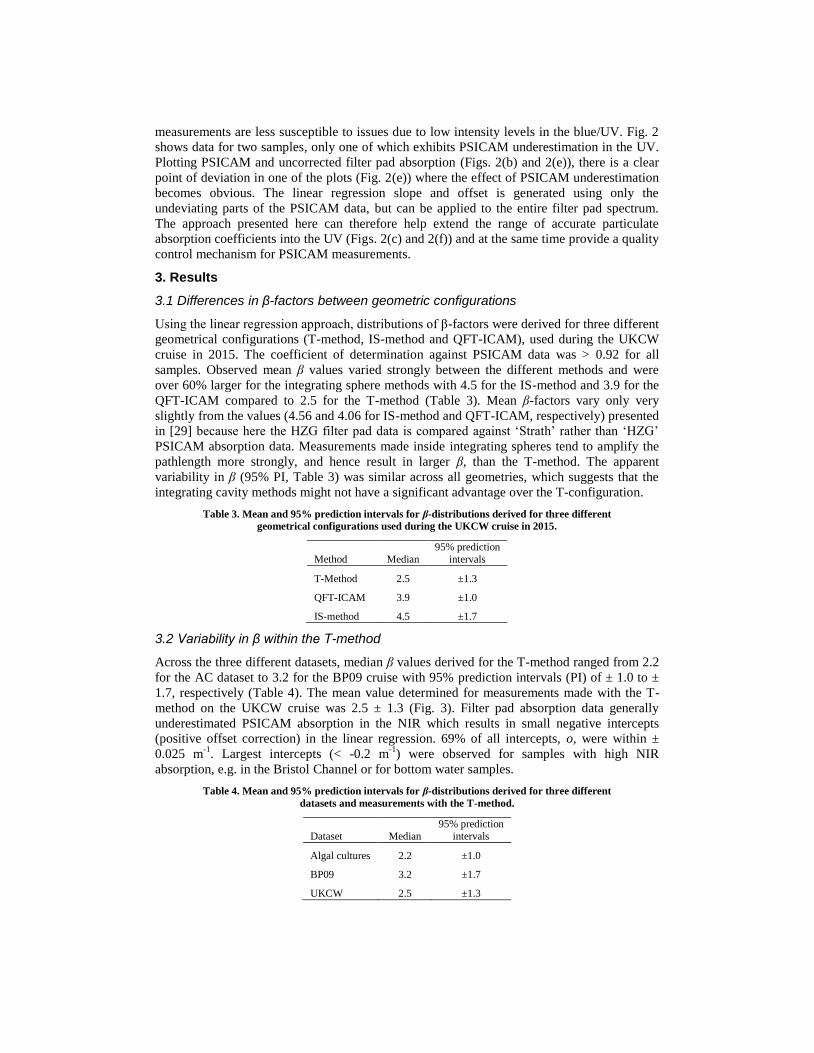
3.2 Variability in β within the T-method
Across the three different datasets, median β values derived for the T-method ranged from 2.2
for the AC dataset to 3.2 for the BP09 cruise with 95% prediction intervals (PI) of ± 1.0 to ±
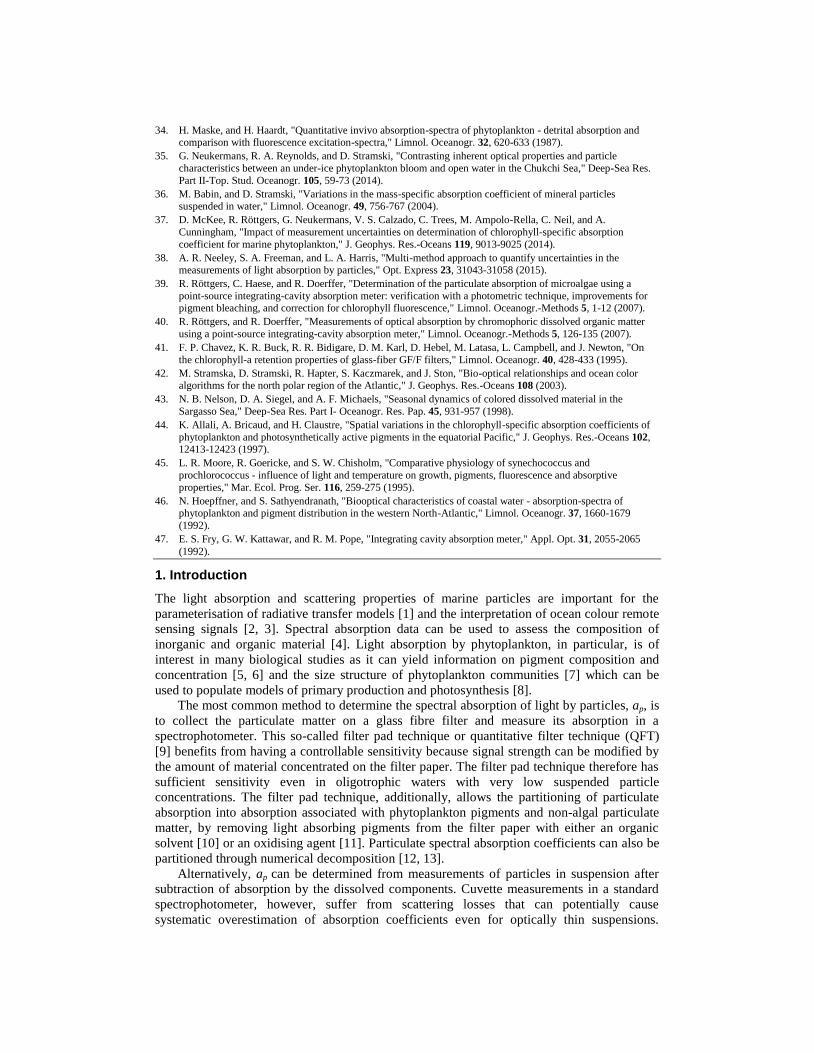
1.7, respectively (Table 4). The mean value determined for measurements made with the T-
method on the UKCW cruise was 2.5 ± 1.3 (Fig. 3). Filter pad absorption data generally
underestimated PSICAM absorption in the NIR which results in small negative intercepts
(positive offset correction) in the linear regression. 69% of all intercepts, o, were within ±
0.025 m-1
. Largest intercepts (< -0.2 m-1
) were observed for samples with high NIR
absorption, e.g. in the Bristol Channel or for bottom water samples.
Table 4. Mean and 95% prediction intervals for β-distributions derived for three different
datasets and measurements with the T-method.
Dataset Median
95% prediction
intervals
Algal cultures 2.2 ±1.0
BP09 3.2 ±1.7
UKCW 2.5 ±1.3
[-]
0 1 2 3 4 5 6
fre
que
ncy
0
2
4
6
8
10
12
14
16
b [m-1
]
-0.2 -0.1 0.0 0.1 0.2
fre
que
ncy
0
5
10
15
20
25
30(a) (b)
Fig. 3. Distributions of (a) β-factors (regression slopes) and (b) scattering offsets
(o, regression intercepts) determined for filter pad absorption measurements made using the T-method on the UKCW cruise.
3.3 The effects of filter-to-filter variation and natural variability of the sample
A small experiment was conducted to investigate the magnitude of differences between β-
factors determined for a single sample subsampled onto multiple filter papers. The aim was to
assess if the variability within measurements made with the same configuration (Table 4) can
potentially be explained by natural variability or variation between individual filter papers.
Two 5L samples, one natural sample collected from a stream in the Scottish Highlands and
one from a diluted culture (D. maritima), were divided into five 1L sub-samples and the
particulate absorption was measured with the PSICAM and T-method filter pad absorption
technique. For the natural sample, high CDOM concentration, aCDOM(440 nm) = 0.95 m-1
,
resulted in low PSICAM signal levels in the blue, and the linear range was limited to data
from 480 – 700 nm for the natural sub-samples in this experiment.
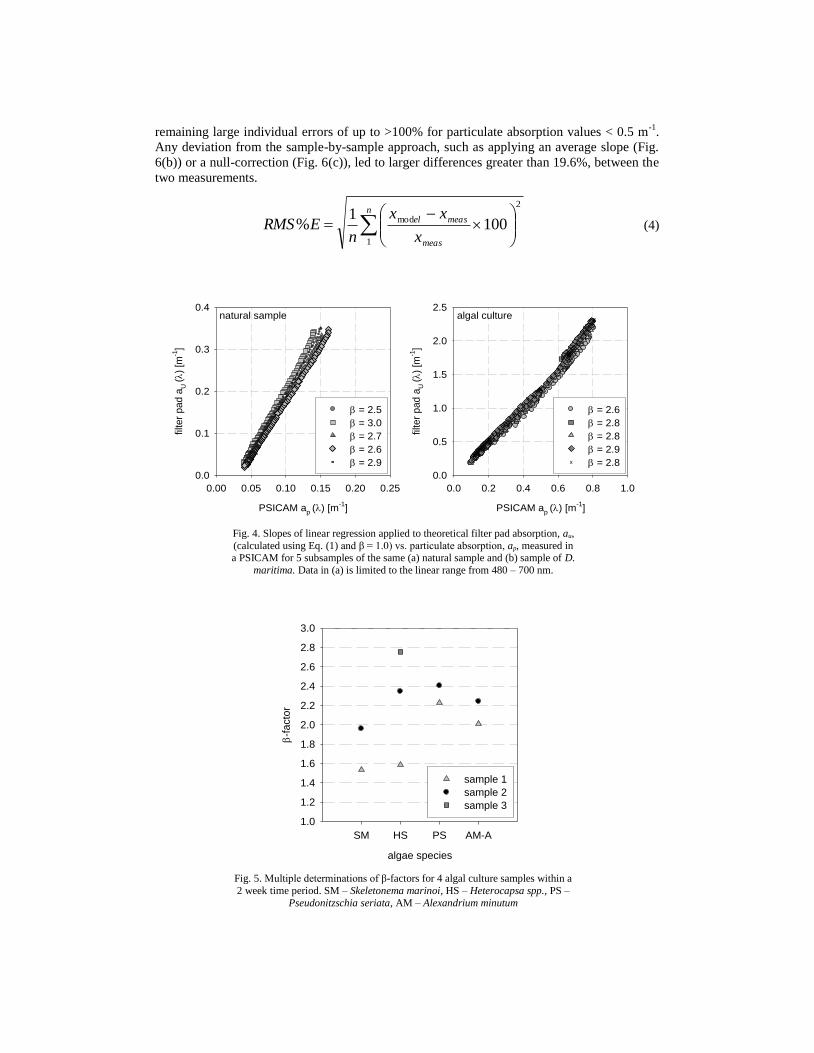
Fig. 4 shows the regression plots and determined β-factors for the different subsamples.
Observed mean β values were (by chance) similar, approx. 2.75, for both the natural sample
and the algal culture sample. The variability in β of ± 0.25 observed here, which is assumed to
be due to differences between filter pads, does not fully explain the overall variability of > ±
1.0 in β in the T-method for natural sample datasets. This suggests that variability in β is due
to both filter pads and some aspect of sample variability acting in combination.
During the AC experiments, samples from 4 cultures were measured 2 - 3 times within a
2 week period. β-factors determined for samples of the same species varied strongly and
showed a tendency to increase over time (Fig. 5), suggesting that stable species-specific β
values are not easily reproduced. Potential explanation for the observed tendency in β to
increase could be increasing concentrations of bacteria and detrital material due to aging of
the cultures which might affect the packaging of cells on the filter paper. Results, however,
remain inconclusive due to the limited amount of data available.
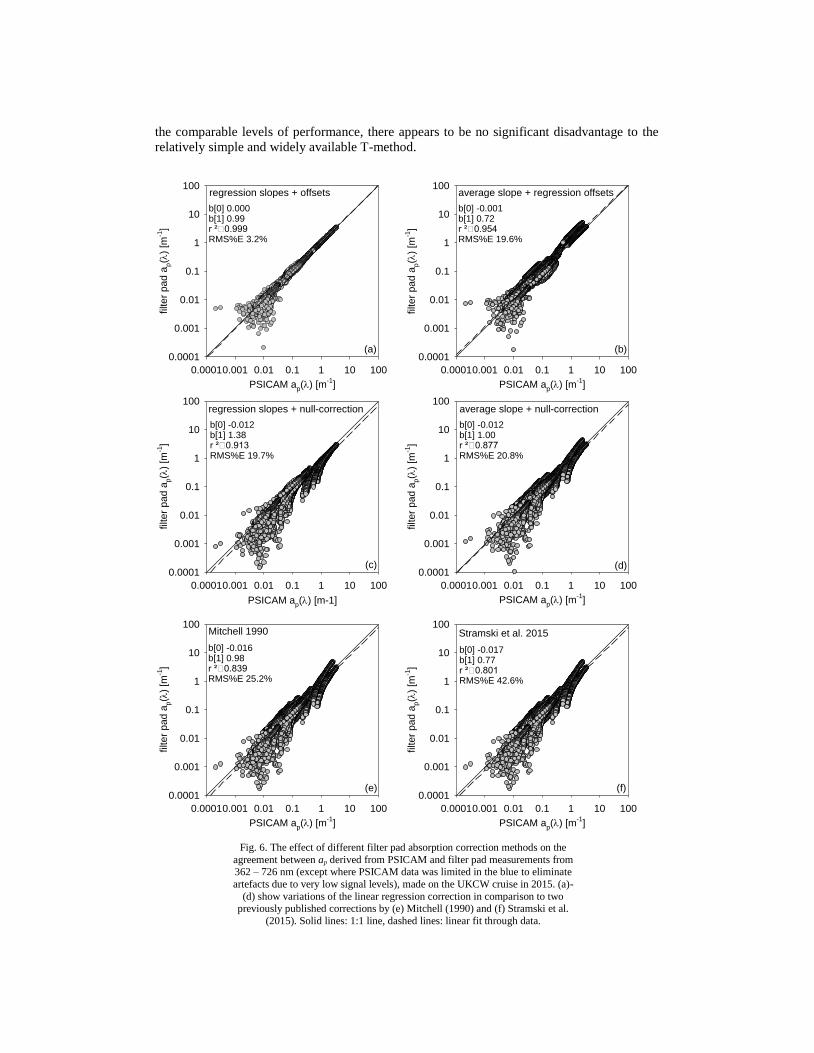
3.4 Impact of alternative correction approaches
The performance of different correction methods for filter pad absorption measurements with
the T-method was tested on data collected on the UKCW cruise in 2015. Results show
excellent agreement between measurements corrected with the linear regression approach and
ap measured with a PSICAM (Fig. 6(a), Table 5). The corresponding root mean square
percentage error, RMS%E, of 3.2% was calculated using Eq. (4). This value, however, masks
remaining large individual errors of up to >100% for particulate absorption values < 0.5 m-1
.
Any deviation from the sample-by-sample approach, such as applying an average slope (Fig.
6(b)) or a null-correction (Fig. 6(c)), led to larger differences greater than 19.6%, between the
two measurements.
n
meas
measel
x
xx
nERMS
1
2
mod 1001
% (4)
PSICAM ap
() [m-1
]
0.00 0.05 0.10 0.15 0.20 0.25
filter
pad
aU
()
[m-1
]
0.0
0.1
0.2
0.3
0.4
= 2.5
= 3.0
= 2.7
= 2.6
= 2.9
PSICAM ap () [m
-1]
0.0 0.2 0.4 0.6 0.8 1.0
filter
pad
aU
()
[m-1
]
0.0
0.5
1.0
1.5
2.0
2.5
xxxx
xxxx
xxxxxxxxxxxxxx
xx
xx
xxxxxxxxxxxxxxxxxxxx
xx
xx
xx
xx
xx
xx
xx
xx
xxxxxxxxxxxxxxxxxxxxxxxx
xxxxxxxxxxxxxxxxxxxx
xxxxxxxxxxxxxxxx
xxxx
xxxx
xx
xx
x xxxxxxx
x
x
x
x
x
x
xx
x
= 2.6
= 2.8
= 2.8
= 2.9
= 2.8x
natural sample algal culture
Fig. 4. Slopes of linear regression applied to theoretical filter pad absorption, au,
(calculated using Eq. (1) and β = 1.0) vs. particulate absorption, ap, measured in a PSICAM for 5 subsamples of the same (a) natural sample and (b) sample of D.
maritima. Data in (a) is limited to the linear range from 480 – 700 nm.
algae species
SM HS PS AM-A
-f
acto
r
1.0
1.2
1.4
1.6
1.8
2.0
2.2
2.4
2.6
2.8
3.0
sample 1
sample 2
sample 3
Fig. 5. Multiple determinations of β-factors for 4 algal culture samples within a
2 week time period. SM – Skeletonema marinoi, HS – Heterocapsa spp., PS –
Pseudonitzschia seriata, AM – Alexandrium minutum
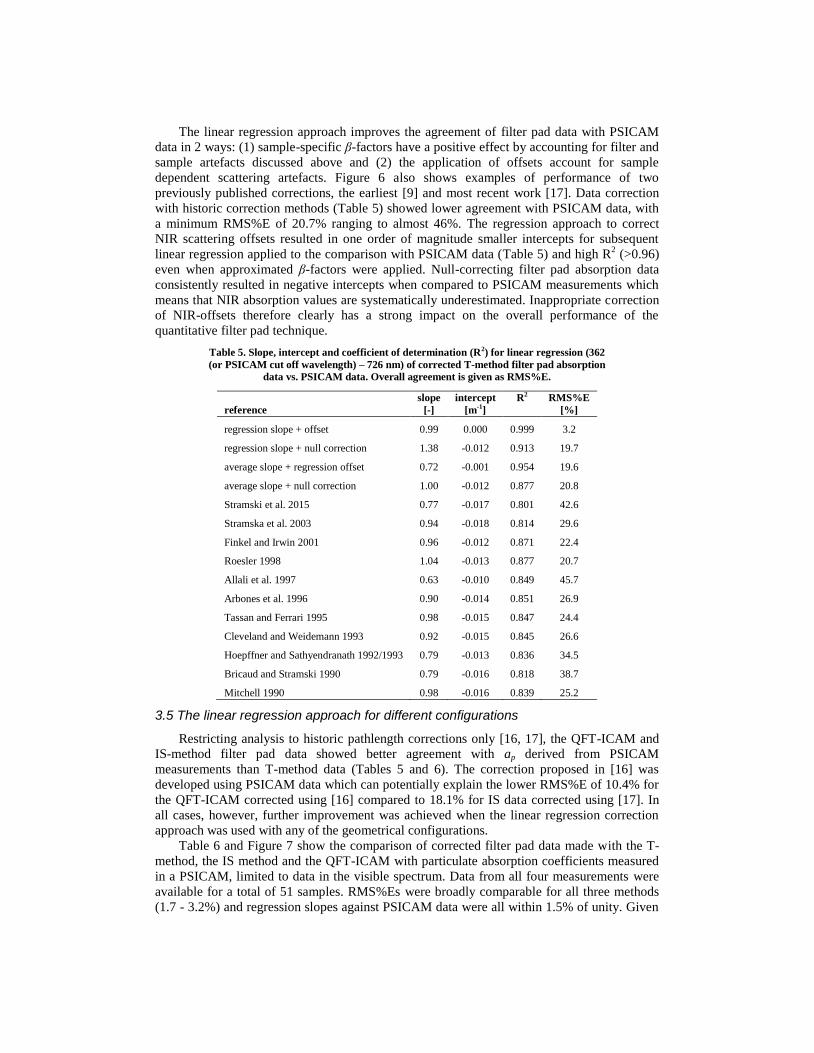
The linear regression approach improves the agreement of filter pad data with PSICAM
data in 2 ways: (1) sample-specific β-factors have a positive effect by accounting for filter and
sample artefacts discussed above and (2) the application of offsets account for sample
dependent scattering artefacts. Figure 6 also shows examples of performance of two
previously published corrections, the earliest [9] and most recent work [17]. Data correction
with historic correction methods (Table 5) showed lower agreement with PSICAM data, with
a minimum RMS%E of 20.7% ranging to almost 46%. The regression approach to correct
NIR scattering offsets resulted in one order of magnitude smaller intercepts for subsequent
linear regression applied to the comparison with PSICAM data (Table 5) and high R2 (>0.96)
even when approximated β-factors were applied. Null-correcting filter pad absorption data
consistently resulted in negative intercepts when compared to PSICAM measurements which
means that NIR absorption values are systematically underestimated. Inappropriate correction
of NIR-offsets therefore clearly has a strong impact on the overall performance of the
quantitative filter pad technique.
Table 5. Slope, intercept and coefficient of determination (R2) for linear regression (362
(or PSICAM cut off wavelength) – 726 nm) of corrected T-method filter pad absorption
data vs. PSICAM data. Overall agreement is given as RMS%E.
reference
slope
[-]
intercept
[m-1]
R2
RMS%E
[%]
regression slope + offset 0.99 0.000 0.999 3.2
regression slope + null correction 1.38 -0.012 0.913 19.7
average slope + regression offset 0.72 -0.001 0.954 19.6
average slope + null correction 1.00 -0.012 0.877 20.8
Stramski et al. 2015 0.77 -0.017 0.801 42.6
Stramska et al. 2003 0.94 -0.018 0.814 29.6
Finkel and Irwin 2001 0.96 -0.012 0.871 22.4
Roesler 1998 1.04 -0.013 0.877 20.7
Allali et al. 1997 0.63 -0.010 0.849 45.7
Arbones et al. 1996 0.90 -0.014 0.851 26.9
Tassan and Ferrari 1995 0.98 -0.015 0.847 24.4
Cleveland and Weidemann 1993 0.92 -0.015 0.845 26.6
Hoepffner and Sathyendranath 1992/1993 0.79 -0.013 0.836 34.5
Bricaud and Stramski 1990 0.79 -0.016 0.818 38.7
Mitchell 1990 0.98 -0.016 0.839 25.2
3.5 The linear regression approach for different configurations
Restricting analysis to historic pathlength corrections only [16, 17], the QFT-ICAM and
IS-method filter pad data showed better agreement with ap derived from PSICAM
measurements than T-method data (Tables 5 and 6). The correction proposed in [16] was
developed using PSICAM data which can potentially explain the lower RMS%E of 10.4% for
the QFT-ICAM corrected using [16] compared to 18.1% for IS data corrected using [17]. In
all cases, however, further improvement was achieved when the linear regression correction
approach was used with any of the geometrical configurations.
Table 6 and Figure 7 show the comparison of corrected filter pad data made with the T-
method, the IS method and the QFT-ICAM with particulate absorption coefficients measured
in a PSICAM, limited to data in the visible spectrum. Data from all four measurements were
available for a total of 51 samples. RMS%Es were broadly comparable for all three methods
(1.7 - 3.2%) and regression slopes against PSICAM data were all within 1.5% of unity. Given
the comparable levels of performance, there appears to be no significant disadvantage to the
relatively simple and widely available T-method.
PSICAM ap() [m
-1]
0.00010.001 0.01 0.1 1 10 100
filte
r p
ad
ap(
) [m
-1]
0.0001
0.001
0.01
0.1
1
10
100
PSICAM ap() [m
-1]
0.00010.001 0.01 0.1 1 10 100
filte
r p
ad
ap(
) [m
-1]
0.0001
0.001
0.01
0.1
1
10
100
b[0]0.000b[1]0.99r ²0.999RMS%E 3.2%
b[0]-0.001b[1]0.72r ²0.954RMS%E 19.6%
PSICAM ap() [m-1]
0.00010.001 0.01 0.1 1 10 100
filte
r p
ad
ap(
) [m
-1]
0.0001
0.001
0.01
0.1
1
10
100
b[0]-0.012b[1]1.38r ²0.913RMS%E 19.7%
regression slopes + offsets average slope + regression offsets
regression slopes + null-correction
PSICAM ap() [m
-1]
0.00010.001 0.01 0.1 1 10 100
filte
r p
ad
ap(
) [m
-1]
0.0001
0.001
0.01
0.1
1
10
100
b[0]-0.012b[1]1.00r ²0.877RMS%E 20.8%
PSICAM ap() [m
-1]
0.00010.001 0.01 0.1 1 10 100
filte
r p
ad
ap(
) [m
-1]
0.0001
0.001
0.01
0.1
1
10
100
average slope + null-correction
Mitchell 1990
PSICAM ap() [m
-1]
0.00010.001 0.01 0.1 1 10 100
filte
r p
ad
ap(
) [m
-1]
0.0001
0.001
0.01
0.1
1
10
100Stramski et al. 2015
b[0]-0.016b[1]0.98r ²0.839RMS%E 25.2%
b[0]-0.017b[1]0.77r ²0.801RMS%E 42.6%
(a) (b)
(c) (d)
(e) (f)
Fig. 6. The effect of different filter pad absorption correction methods on the
agreement between ap derived from PSICAM and filter pad measurements from 362 – 726 nm (except where PSICAM data was limited in the blue to eliminate
artefacts due to very low signal levels), made on the UKCW cruise in 2015. (a)-
(d) show variations of the linear regression correction in comparison to two previously published corrections by (e) Mitchell (1990) and (f) Stramski et al.
(2015). Solid lines: 1:1 line, dashed lines: linear fit through data.

PSICAM ap() [m
-1]
0.001 0.01 0.1 1 10
filte
r p
ad
ap(
) [m
-1]
0.001
0.01
0.1
1
10
PSICAM ap() [m
-1]
0.001 0.01 0.1 1 10
filte
r p
ad
ap(
) [m
-1]
0.001
0.01
0.1
1
10
b[0]-0.0004b[1] 0.988r ² 0.9901RMS%E 3.2%
b[0]-0.0001b[1] 1.000r ² 0.9995RMS%E 1.7%
PSICAM ap() [m-1]
0.001 0.01 0.1 1 10
filte
r p
ad
ap(
) [m
-1]
0.001
0.01
0.1
1
10
b[0]0.0000b[1] 0.999r ² 0.9994RMS%E 2.7%
T-method
QFT-ICAM
IS-method
(a)
(b)
(c)
Fig. 7. The effect of the linear regression filter pad absorption correction
methods on the agreement ap derived from PSICAM and filter pad
measurements using different geometric configurations: (a) T-method, (b) QFT-
ICAM and (c) IS-method. Data presented is a subset of 51 stations sampled during the UKCW cruise in May 2015, from 362 – 726 nm (except where
PSICAM data was limited in the blue to eliminate artefacts due to very low
signal levels). Solid lines: 1:1 line, dashed lines: linear fit through data.
Table. 6. Performance of geometrical configurations to measure filter pad absorption,
when corrected with different correction approaches, and compared to PSICAM data.
The analysis was performed for a subset of 51 stations sampled during the UKCW cruise
in 2015 for which data from all three filter pad measurements was available. The spectral
range was limited to 362 – 726 nm. Data where PSICAM sensitivity issues in the blue
were observed were excluded from this comparison.
method
slope
[-]
intercept
[m-1]
R2
RMS%E
[%]
T-method 0.988 -0.0004 0.9991 3.2
QFT-ICAM 1.000 -0.0001 0.9995 1.7
QFT-ICAM (corrected using [16]) 1.013 -0.0101 0.9914 10.4
IS-method 0.999 0.0000 0.9994 2.7
IS-method (corrected using [17]) 1.322 -0.0168 0.9925 18.1
4. Discussion
The PSICAM, like other integrating cavity absorption meters [47], has been shown to be
virtually insensitive to the presence of scattering material [15] and enables the determination
of accurate absorption coefficients of natural water samples. In the past, however, it has rarely
been used because calibration and measurement protocols are labour intensive and sensitive to
sample handling artefacts. This work highlights a different problem due to limitations when
signal levels are particularly low, as can be the case in the blue/UV. Here it has been shown
that cross-validation with filter pad absorption data can provide a quality control mechanism
which is useful to identify low signal measurement artefacts and improves the overall quality
of measured IOPs.
In the past, non-linear relationships between suspension and filter pad absorption data
were observed. The comparison with PSICAM data performed here and previously by
Röttgers and co-workers suggests that non-linear effects could be due to either (a)
imperfections in the determinations of absorption from suspensions in a cuvette, which are
susceptible to scattering effects, (b) incorrect baseline correction of individual samples,
introducing non-linear bias to the entire dataset or (c) intrinsic sample variability being mis-
identified as a non-linear effect when trying to fit a single relationship through multiple
samples. PSICAM data enables the derivation of linear regression coefficients for individual
samples which can be used to correct for pathlength amplification, (slope) and offsets due to
sample scattering losses compared to that of the reference filter (intercept).
The agreement within 3.2% of corrected filter pad absorption data and PSICAM data
demonstrates the excellent performance of the linear regression correction approach. This
approach clearly distinguishes between pathlength amplification and scattering offset artefacts
and potentially has the advantage that it can be extrapolated to wavelengths where the
PSICAM data is either suspect or otherwise unavailable, e.g. filter pad data beyond the
spectral range of the PSICAM data. The performance of different correction methods to
correct measurements of bleached filter pads remains inconclusive due to a lack of validation
data as there is currently no method to partition pigmented and non-pigmented absorption in
PSICAM measurements.
Comparison of β-factors between different filter pad absorption methods showed no clear
benefit to more complex approaches over the relatively simple T-method. Correction for
scattering effects using the regression approach effectively compensates the T-method for the
intrinsic insensitivity to scattering error for the two integrating cavity approaches. It is clear
that the combination of the T-method and PSICAM is capable of producing higher quality ap
data than either technique on its own, and as good as any of the other filter pad techniques in
combination with the PSICAM. Very importantly, none of the filter pad techniques offers a
satisfactory standalone solution.

5. Conclusion
The availability of PSICAM data enabled significant progress in the development of the
methodology to determine quantitative particulate absorption coefficients from filter pad
measurements. The comparison of filter pad and PSICAM data confirmed previous
observations of a linear relationship [16, 29, 37]. Fitting a linear function through the data
provides regression coefficients (slope and intercept) which can be used to correct filter pad
absorption measurements and match them with PSICAM data on a sample-by-sample basis,
resulting in agreement within 3.2% RMS%E.
It has been demonstrated here that filter pad absorption measurements benefit from
complementary PSICAM measurements to derive appropriate correction coefficients. At the
same time, PSICAM data has been shown to benefit from the availability of corresponding
filter pad data as this enables identification of wavelengths at which sensitivity issues occur.
The traditional T-method, despite its theoretically higher measurement uncertainties, is
broadly comparable in performance with more complex configurations. The simplicity of the
measurement protocol makes the T-method favourable for future field work campaigns where
time and labour are limited when ICAM-type determinations of ap are made in parallel.
The linear correction outperforms previously proposed correction methods (RMS%E >
20%) but is dependent on the availability of PSICAM data. Unfortunately, this eliminates its
application to historic datasets and imposes a significant additional experimental burden on
future work. However, new commercially available integrating cavity absorption meters, such
as the Trios OSCAR, the HOBI Labs a-Sphere and the Turner Designs flow through ICAM,
may help to make these types of measurements more accessible for the wider community in
the near future.
Acknowledgments
The authors would like to thank the skipper and crew of FS Heincke for their help and support
in assembling the UKCW dataset.

![Untitled-1 [] · taxonomic characters. Zoological Nomenclature, origin of code, ICZN. UNIT V : Taxonomic Records And Publications Taxonomic keys, Taxonomic characters description,](https://img.pdfslide.us/doc/110x75/5e60819b810ee55ab507dd7d/untitled-1-taxonomic-characters-zoological-nomenclature-origin-of-code-iczn.jpg)