Embed Size (px)
Citation preview
1
Unidad de Análisis Económico
Taxation to sin food and drinks as public policy to address obesity and diabetes in Mexico
Second Joint Meeting of the EGEP and FCAN October 14, 2015
Content
2
Food for healthy eating
Obesity in Mexico
Government intervention
National Strategy to Prevent and Control Overweight, Obesity and Diabetes (ENSOD)
Tax to sin food and drinks
Main findings
Conclusion
3
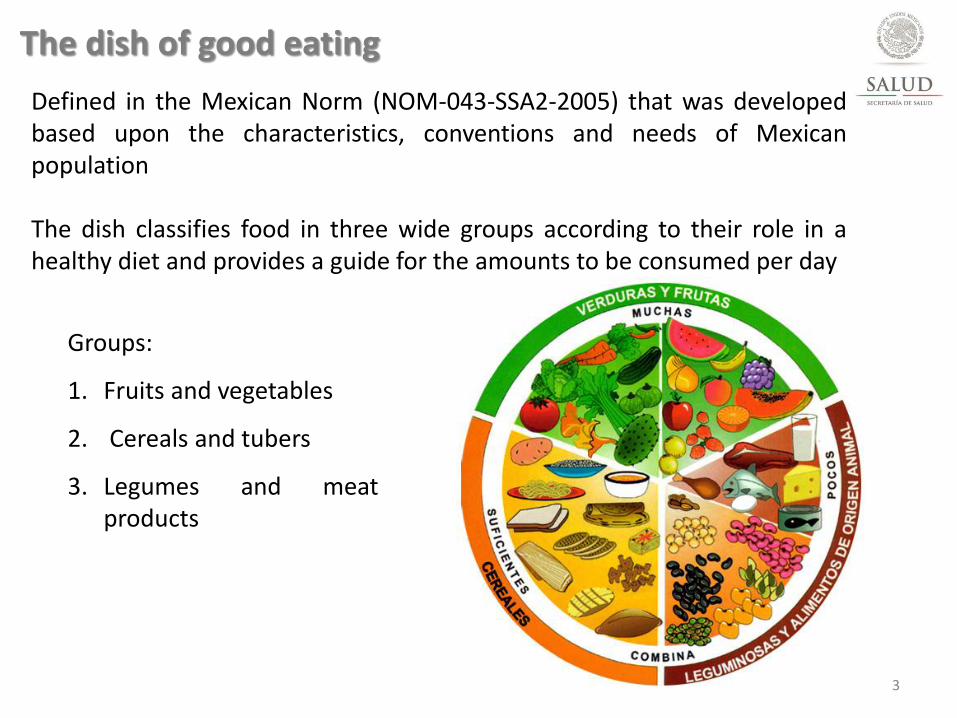
The dish of good eating
Defined in the Mexican Norm (NOM-043-SSA2-2005) that was developed based upon the characteristics, conventions and needs of Mexican population The dish classifies food in three wide groups according to their role in a healthy diet and provides a guide for the amounts to be consumed per day
Groups:
1. Fruits and vegetables
2. Cereals and tubers
3. Legumes and meat products
4
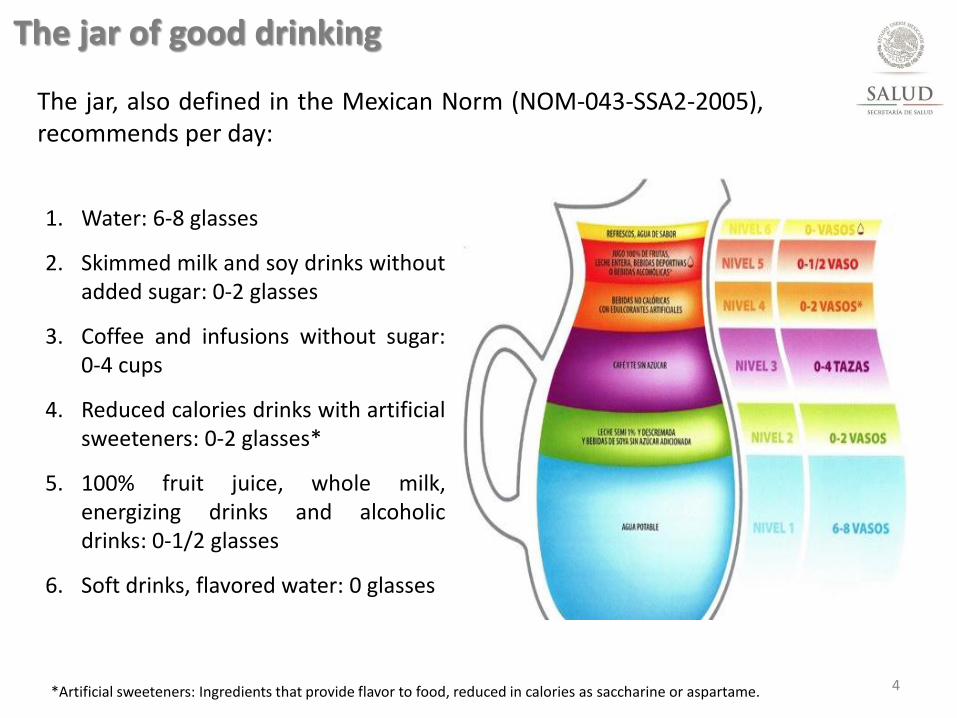
1. Water: 6-8 glasses
2. Skimmed milk and soy drinks without added sugar: 0-2 glasses
3. Coffee and infusions without sugar: 0-4 cups
4. Reduced calories drinks with artificial sweeteners: 0-2 glasses*
5. 100% fruit juice, whole milk, energizing drinks and alcoholic drinks: 0-1/2 glasses
6. Soft drinks, flavored water: 0 glasses
The jar of good drinking
*Artificial sweeteners: Ingredients that provide flavor to food, reduced in calories as saccharine or aspartame.
The jar, also defined in the Mexican Norm (NOM-043-SSA2-2005), recommends per day:
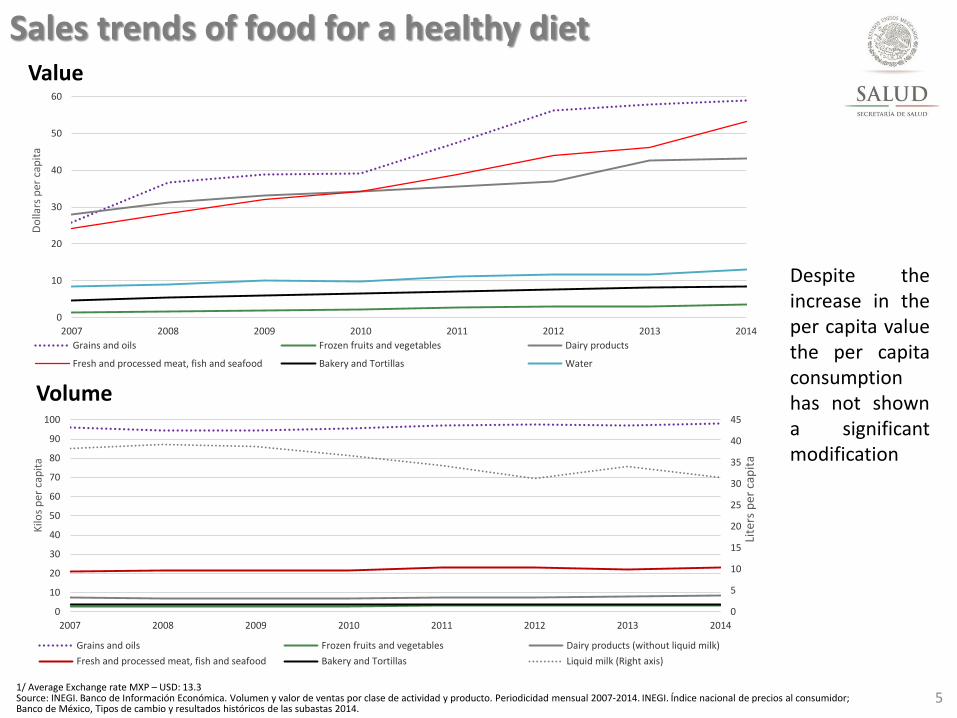
5 1/ Average Exchange rate MXP – USD: 13.3 Source: INEGI. Banco de Información Económica. Volumen y valor de ventas por clase de actividad y producto. Periodicidad mensual 2007-2014. INEGI. Índice nacional de precios al consumidor; Banco de México, Tipos de cambio y resultados históricos de las subastas 2014.
Volume
Value
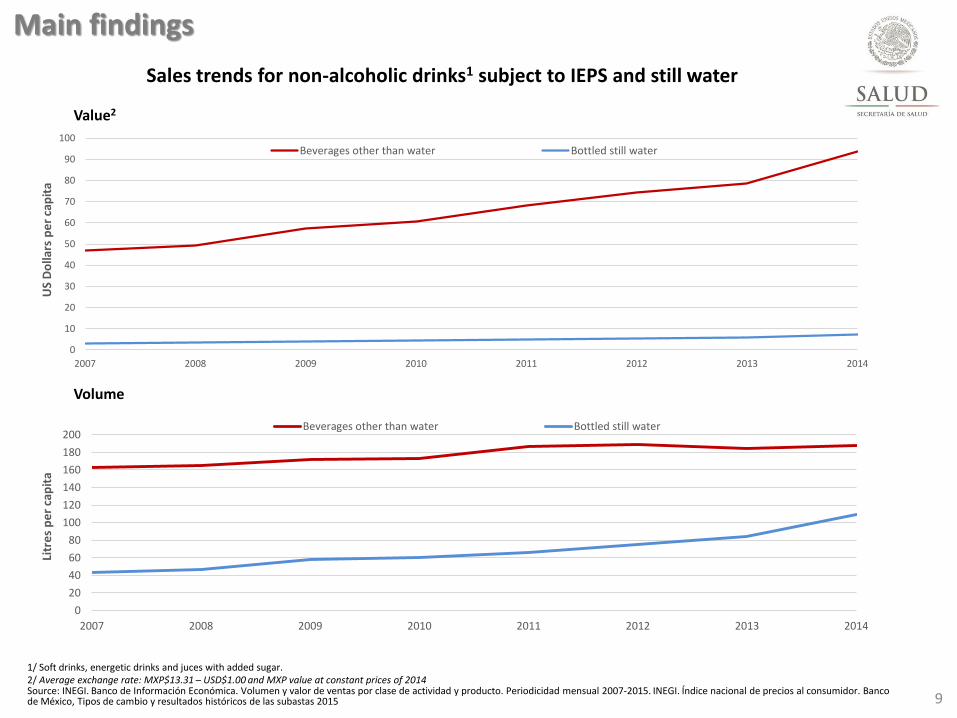
Despite the increase in the per capita value the per capita consumption has not shown a significant modification
Sales trends of food for a healthy diet
0
10
20
30
40
50
60
2007 2008 2009 2010 2011 2012 2013 2014
Grains and oils Frozen fruits and vegetables Dairy products
Fresh and processed meat, fish and seafood Bakery and Tortillas Water
Do
llars
per
cap
ita
0
5
10
15
20
25
30
35
40
45
0
10
20
30
40
50
60
70
80
90
100
2007 2008 2009 2010 2011 2012 2013 2014
Grains and oils Frozen fruits and vegetables Dairy products (without liquid milk)
Fresh and processed meat, fish and seafood Bakery and Tortillas Liquid milk (Right axis)
Kilo
s p
er c
apit
a
Lite
rs p
er c
apit
a
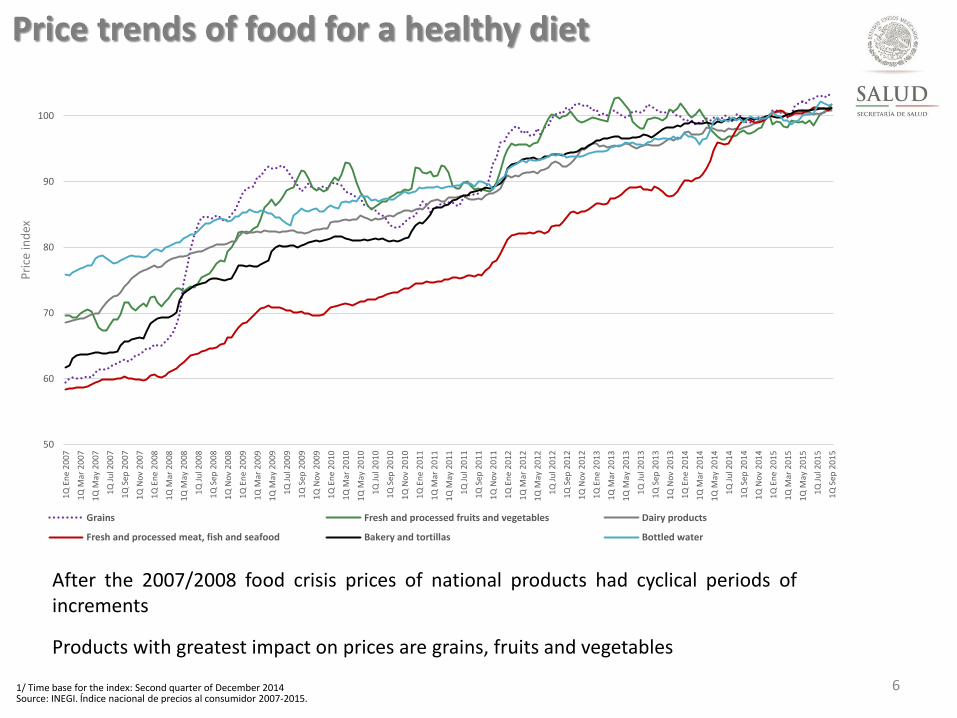
6 1/ Time base for the index: Second quarter of December 2014 Source: INEGI. Índice nacional de precios al consumidor 2007-2015.
After the 2007/2008 food crisis prices of national products had cyclical periods of increments
Products with greatest impact on prices are grains, fruits and vegetables
Price trends of food for a healthy diet
50
60
70
80
90
100
1Q
En
e 2
007
1Q
Mar
20
07
1Q
May
20
07
1Q
Ju
l 20
07
1Q
Sep
20
07
1Q
No
v 2
007
1Q
En
e 2
008
1Q
Mar
20
08
1Q
May
20
08
1Q
Ju
l 20
08
1Q
Sep
20
08
1Q
No
v 2
008
1Q
En
e 2
009
1Q
Mar
20
09
1Q
May
20
09
1Q
Ju
l 20
09
1Q
Sep
20
09
1Q
No
v 2
009
1Q
En
e 2
010
1Q
Mar
20
10
1Q
May
20
10
1Q
Ju
l 20
10
1Q
Sep
20
10
1Q
No
v 2
010
1Q
En
e 2
011
1Q
Mar
20
11
1Q
May
20
11
1Q
Ju
l 20
11
1Q
Sep
20
11
1Q
No
v 2
011
1Q
En
e 2
012
1Q
Mar
20
12
1Q
May
20
12
1Q
Ju
l 20
12
1Q
Sep
20
12
1Q
No
v 2
012
1Q
En
e 2
013
1Q
Mar
20
13
1Q
May
20
13
1Q
Ju
l 20
13
1Q
Sep
20
13
1Q
No
v 2
013
1Q
En
e 2
014
1Q
Mar
20
14
1Q
May
20
14
1Q
Ju
l 20
14
1Q
Sep
20
14
1Q
No
v 2
014
1Q
En
e 2
015
1Q
Mar
20
15
1Q
May
20
15
1Q
Ju
l 20
15
1Q
Sep
20
15
Grains Fresh and processed fruits and vegetables Dairy products
Fresh and processed meat, fish and seafood Bakery and tortillas Bottled water
Pri
ce in
dex
Main findings on food for a healthy diet
7
There is a Mexican norm that recommends a healthy diet based upon the characteristics, conventions and needs of Mexican population
Diet of Mexicans has changed for worst as the consumption of fresh fruits, vegetables whole cereals and legumes has decreased while the consumption of food with added sugar or high content of fat has increased
Prices of grains, fruits and vegetables have increased significantly in the last decade
Obesity in Mexico
8
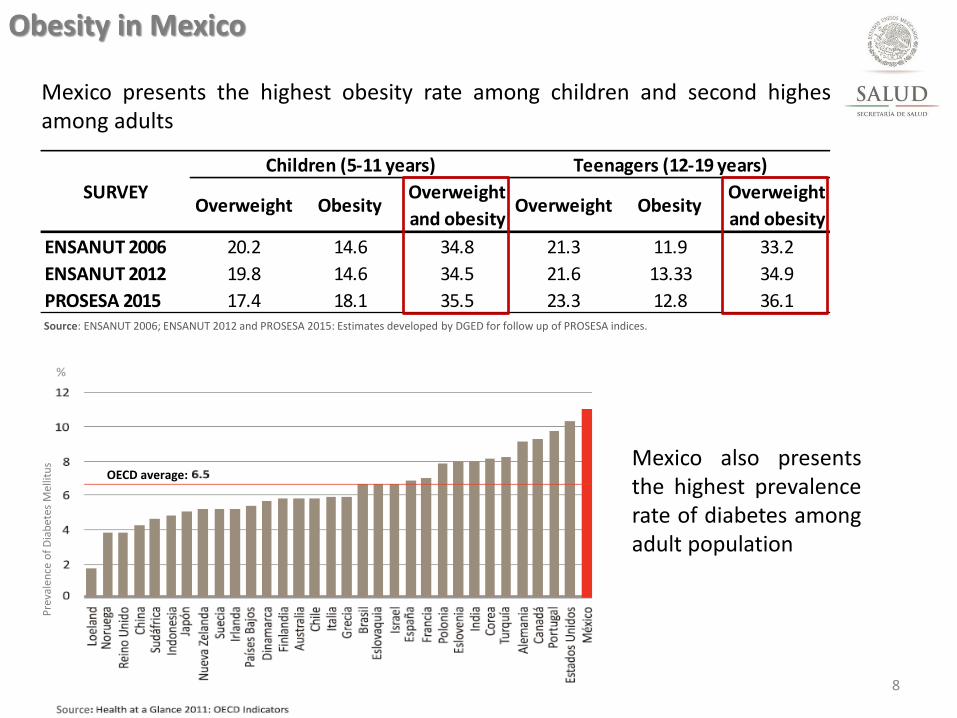
Mexico presents the highest obesity rate among children and second highes among adults
Pre
vale
nce
of
Dia
bet
es M
ellit
us Mexico also presents
the highest prevalence rate of diabetes among adult population
Overweight ObesityOverweight
and obesityOverweight Obesity
Overweight
and obesity
ENSANUT 2006 20.2 14.6 34.8 21.3 11.9 33.2
ENSANUT 2012 19.8 14.6 34.5 21.6 13.33 34.9
PROSESA 2015 17.4 18.1 35.5 23.3 12.8 36.1
SURVEY
Children (5-11 years) Teenagers (12-19 years)
Source: ENSANUT 2006; ENSANUT 2012 and PROSESA 2015: Estimates developed by DGED for follow up of PROSESA indices.
OECD average:
Source
%
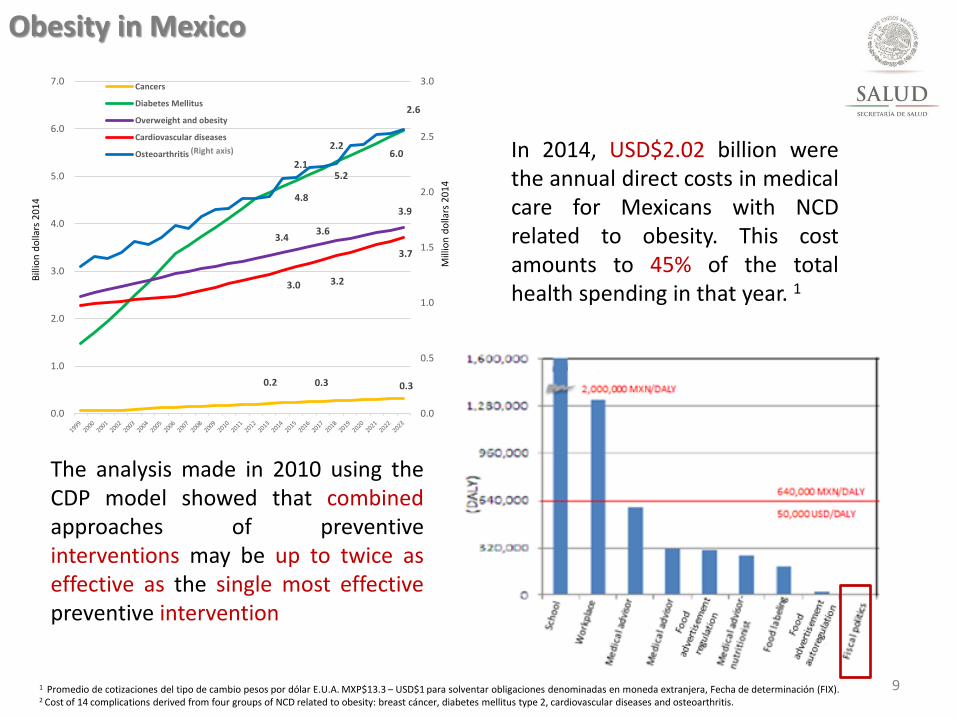
Obesity in Mexico
9 1 Promedio de cotizaciones del tipo de cambio pesos por dólar E.U.A. MXP$13.3 – USD$1 para solventar obligaciones denominadas en moneda extranjera, Fecha de determinación (FIX). 2 Cost of 14 complications derived from four groups of NCD related to obesity: breast cáncer, diabetes mellitus type 2, cardiovascular diseases and osteoarthritis.
The analysis made in 2010 using the CDP model showed that combined approaches of preventive interventions may be up to twice as effective as the single most effective preventive intervention
In 2014, USD$2.02 billion were the annual direct costs in medical care for Mexicans with NCD related to obesity. This cost amounts to 45% of the total health spending in that year. 1
0.2 0.3 0.3
4.8
5.2
6.0
3.4 3.6
3.9
3.0 3.2
3.7
2.1
2.2
2.6
0.0
0.5
1.0
1.5
2.0
2.5
3.0
0.0
1.0
2.0
3.0
4.0
5.0
6.0
7.0Cancers
Diabetes Mellitus
Overweight and obesity
Cardiovascular diseases
Osteoarthritis
Bill
ion
do
llars
20
14
(Right axis)
Mill
ion
do
llars
20
14
10
20
02
20
10
20
11
20
13
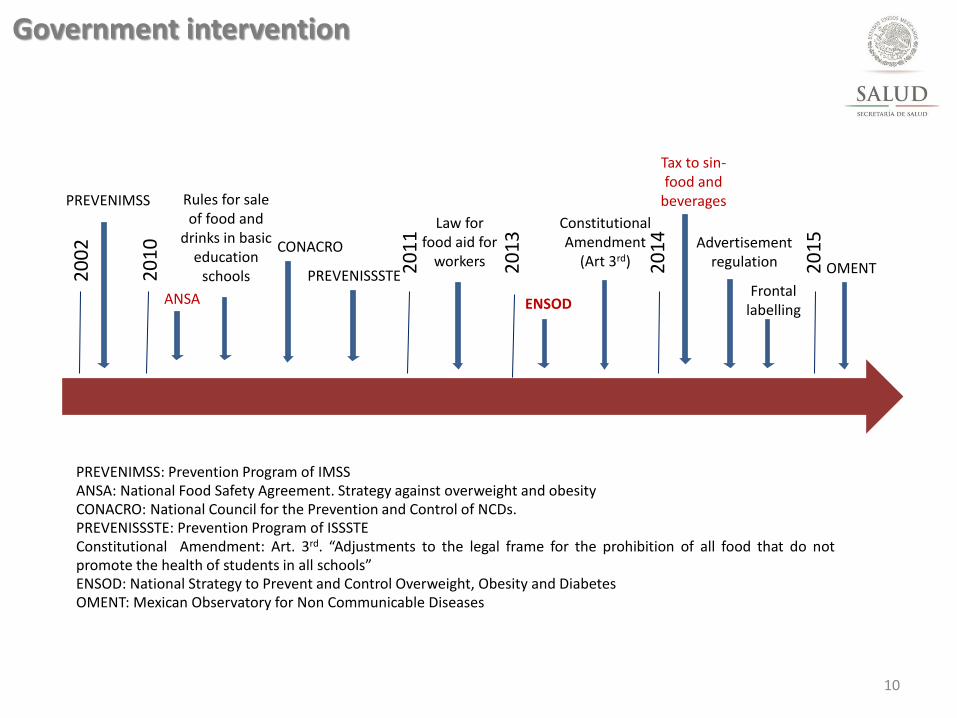
Government intervention
PREVENIMSS
ANSA
Rules for sale of food and
drinks in basic education
schools
CONACRO
PREVENISSSTE
Law for food aid for
workers
Constitutional Amendment
(Art 3rd)
PREVENIMSS: Prevention Program of IMSS ANSA: National Food Safety Agreement. Strategy against overweight and obesity CONACRO: National Council for the Prevention and Control of NCDs. PREVENISSSTE: Prevention Program of ISSSTE Constitutional Amendment: Art. 3rd. “Adjustments to the legal frame for the prohibition of all food that do not promote the health of students in all schools” ENSOD: National Strategy to Prevent and Control Overweight, Obesity and Diabetes OMENT: Mexican Observatory for Non Communicable Diseases
20
14
20
15
Tax to sin-food and
beverages
Advertisement regulation
Frontal labelling
OMENT
ENSOD
11
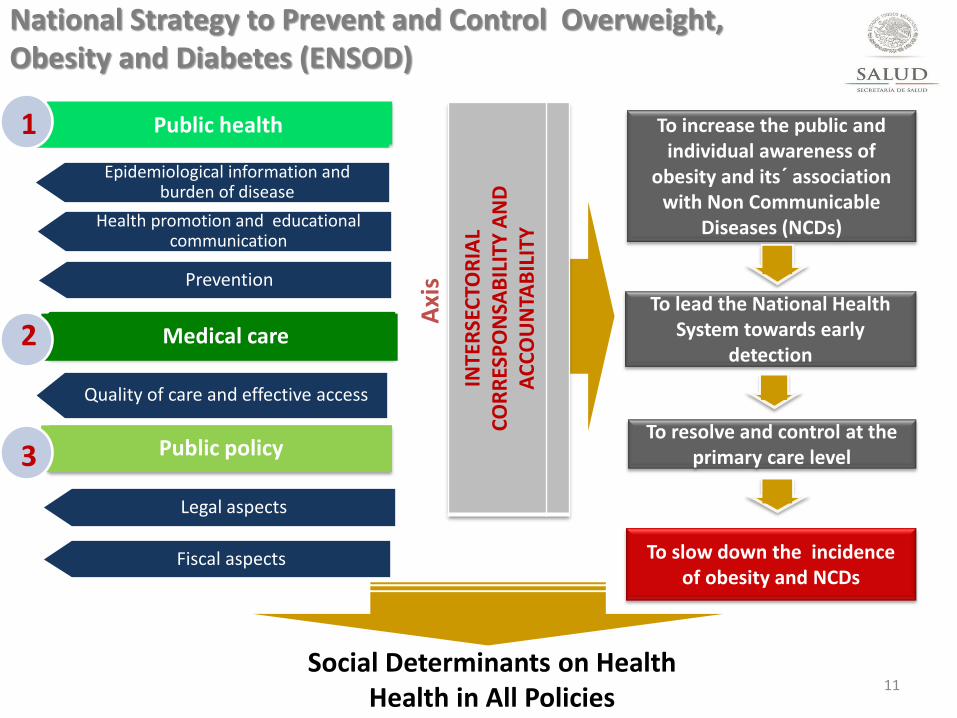
National Strategy to Prevent and Control Overweight, Obesity and Diabetes (ENSOD)
Medical care
Public policy A
xis
To increase the public and individual awareness of
obesity and its´ association with Non Communicable
Diseases (NCDs)
To lead the National Health System towards early
detection
To resolve and control at the primary care level
To slow down the incidence of obesity and NCDs
INTE
RSE
CTO
RIA
L C
OR
RES
PO
NSA
BIL
ITY
AN
D
AC
CO
UN
TAB
ILIT
Y
Social Determinants on Health Health in All Policies
Epidemiological information and burden of disease
Health promotion and educational communication
Prevention
Quality of care and effective access
Legal aspects
Fiscal aspects
Public health 1
2
3
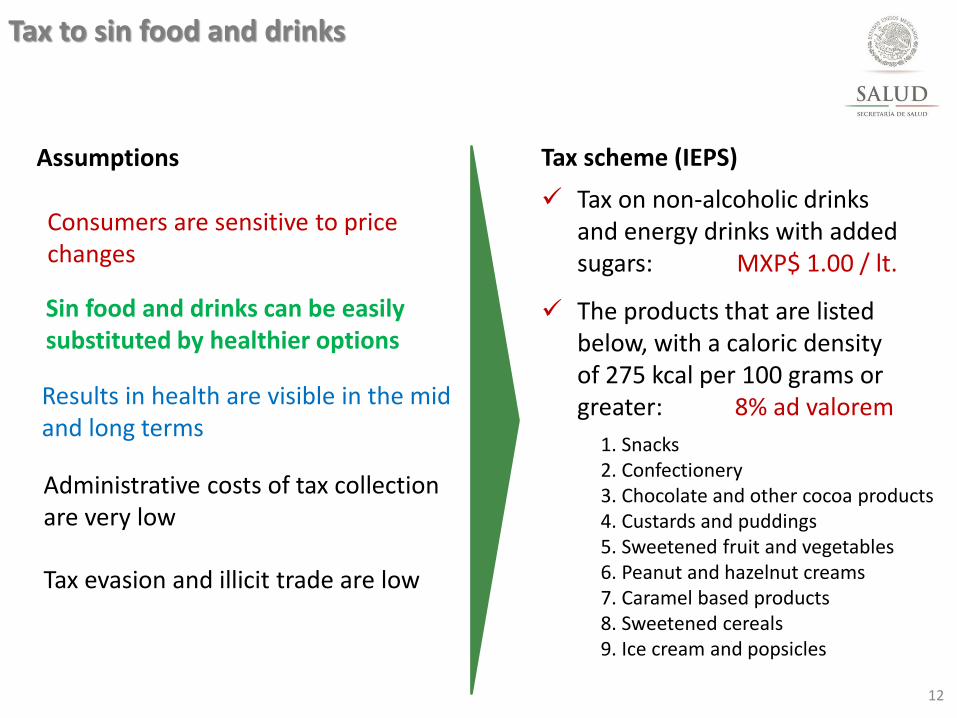
Tax to sin food and drinks
12
Assumptions
Consumers are sensitive to price changes
Sin food and drinks can be easily substituted by healthier options
Administrative costs of tax collection are very low
Tax evasion and illicit trade are low
Results in health are visible in the mid and long terms
Tax on non-alcoholic drinks and energy drinks with added sugars: MXP$ 1.00 / lt.
The products that are listed below, with a caloric density of 275 kcal per 100 grams or greater: 8% ad valorem
Tax scheme (IEPS)
1. Snacks 2. Confectionery 3. Chocolate and other cocoa products 4. Custards and puddings 5. Sweetened fruit and vegetables 6. Peanut and hazelnut creams 7. Caramel based products 8. Sweetened cereals 9. Ice cream and popsicles
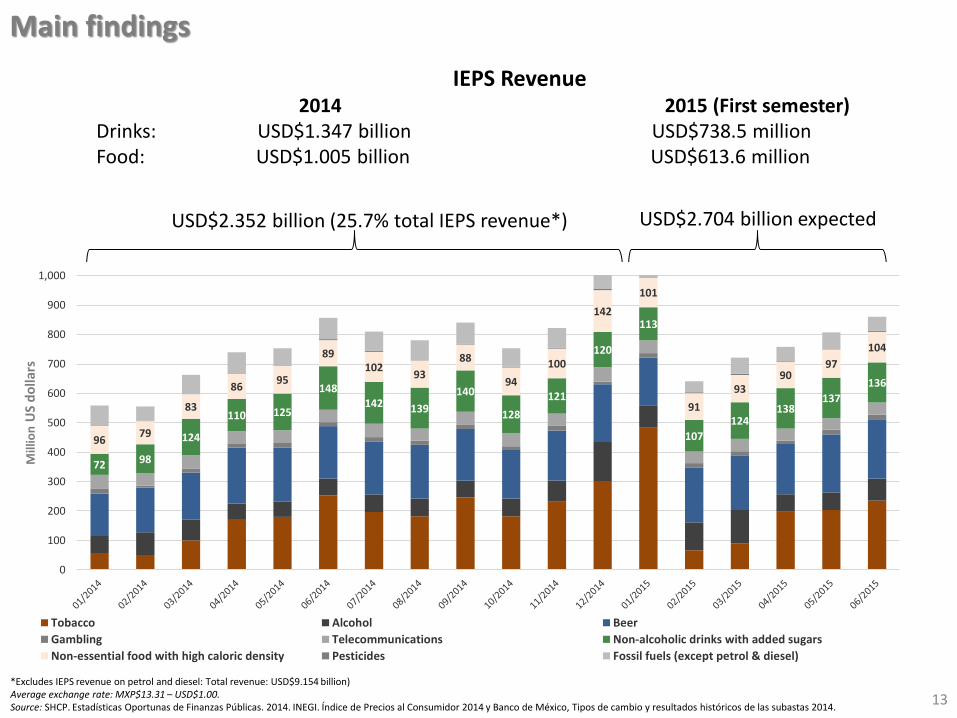
13 *Excludes IEPS revenue on petrol and diesel: Total revenue: USD$9.154 billion) Average exchange rate: MXP$13.31 – USD$1.00. Source: SHCP. Estadísticas Oportunas de Finanzas Públicas. 2014. INEGI. Índice de Precios al Consumidor 2014 y Banco de México, Tipos de cambio y resultados históricos de las subastas 2014.
Main findings
IEPS Revenue 2014 2015 (First semester) Drinks: USD$1.347 billion USD$738.5 million Food: USD$1.005 billion USD$613.6 million
USD$2.352 billion (25.7% total IEPS revenue*) USD$2.704 billion expected
72 98
124
110 125
148 142 139
140
128
121
120
113
107
124 138
137
136
96 79
83
86 95
89 102
93
88
94
100
142
101
91
93 90
97
104
0
100
200
300
400
500
600
700
800
900
1,000
Tobacco Alcohol Beer
Gambling Telecommunications Non-alcoholic drinks with added sugars
Non-essential food with high caloric density Pesticides Fossil fuels (except petrol & diesel)
Mill
ion
US
do
llars
Main findings
9
Value2
Volume
1/ Soft drinks, energetic drinks and juces with added sugar. 2/ Average exchange rate: MXP$13.31 – USD$1.00 and MXP value at constant prices of 2014 Source: INEGI. Banco de Información Económica. Volumen y valor de ventas por clase de actividad y producto. Periodicidad mensual 2007-2015. INEGI. Índice nacional de precios al consumidor. Banco de México, Tipos de cambio y resultados históricos de las subastas 2015
Sales trends for non-alcoholic drinks1 subject to IEPS and still water
0
10
20
30
40
50
60
70
80
90
100
2007 2008 2009 2010 2011 2012 2013 2014
Beverages other than water Bottled still water
US
Do
llars
pe
r ca
pit
a
0
20
40
60
80
100
120
140
160
180
200
2007 2008 2009 2010 2011 2012 2013 2014
Beverages other than water Bottled still water
Litr
es
pe
r ca
pit
a
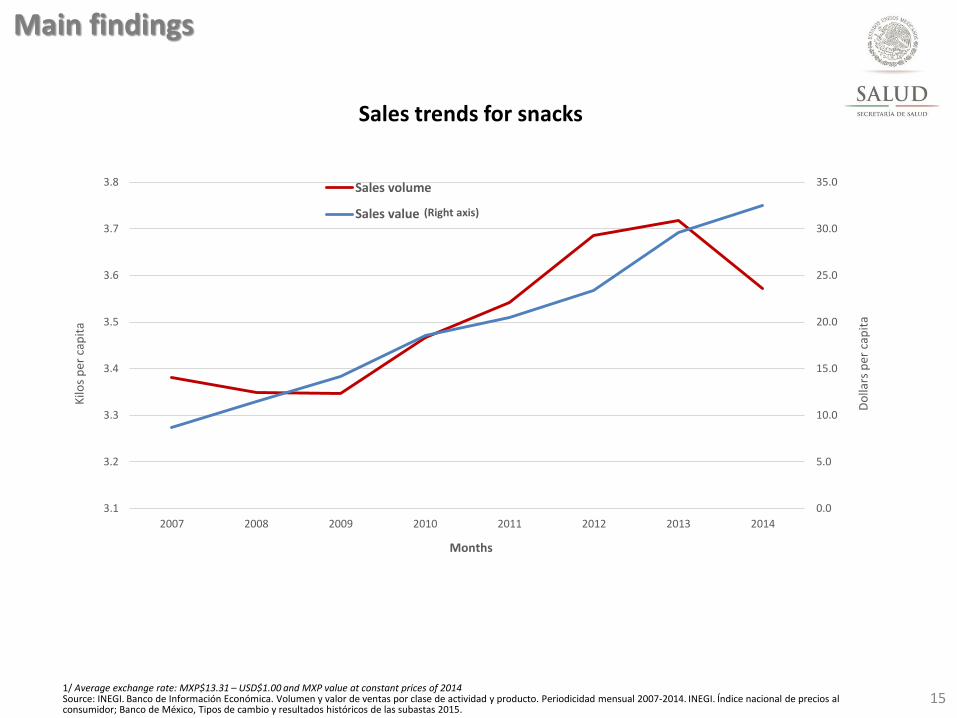
15 1/ Average exchange rate: MXP$13.31 – USD$1.00 and MXP value at constant prices of 2014 Source: INEGI. Banco de Información Económica. Volumen y valor de ventas por clase de actividad y producto. Periodicidad mensual 2007-2014. INEGI. Índice nacional de precios al consumidor; Banco de México, Tipos de cambio y resultados históricos de las subastas 2015.
Sales trends for snacks
Main findings
0.0
5.0
10.0
15.0
20.0
25.0
30.0
35.0
3.1
3.2
3.3
3.4
3.5
3.6
3.7
3.8
2007 2008 2009 2010 2011 2012 2013 2014
Sales volume
Sales value
Kilo
s p
er c
apit
a
Do
llars
per
cap
ita
Months
(Right axis)
16
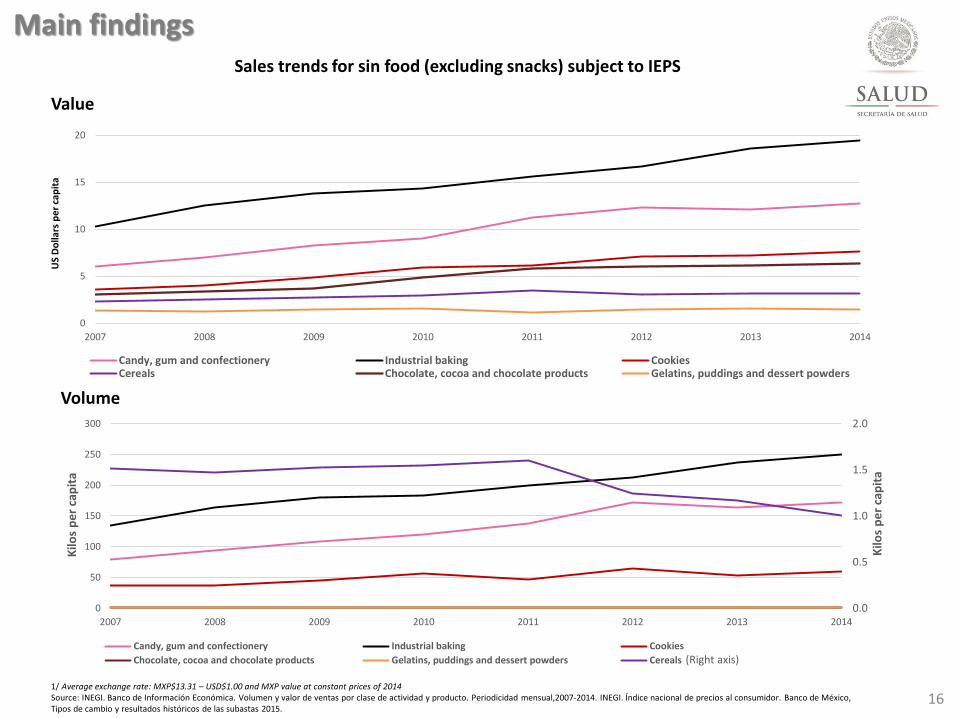
Sales trends for sin food (excluding snacks) subject to IEPS
1/ Average exchange rate: MXP$13.31 – USD$1.00 and MXP value at constant prices of 2014 Source: INEGI. Banco de Información Económica. Volumen y valor de ventas por clase de actividad y producto. Periodicidad mensual,2007-2014. INEGI. Índice nacional de precios al consumidor. Banco de México, Tipos de cambio y resultados históricos de las subastas 2015.
Main findings
Value
Volume
0
5
10
15
20
2007 2008 2009 2010 2011 2012 2013 2014
Candy, gum and confectionery Industrial baking CookiesCereals Chocolate, cocoa and chocolate products Gelatins, puddings and dessert powders
US
Do
llars
pe
r ca
pit
a
0.0
0.5
1.0
1.5
2.0
0
50
100
150
200
250
300
2007 2008 2009 2010 2011 2012 2013 2014
Candy, gum and confectionery Industrial baking Cookies
Chocolate, cocoa and chocolate products Gelatins, puddings and dessert powders Cereals
Kilo
s p
er
cap
ita
Kilo
s p
er
cap
ita
(Right axis)
17
Main findings
Preliminary results on health impact An average reduction of 6% on purchases of tax imposed beverages over 2014 This difference increased over the year to reach a reduction of 12% in December
2014 compared with the trend before tax
All socioeconomic groups reduced purchases of taxed beverages. Reductions were higher among lower-socioeconomic households, averaging an 8% decline over 2014 compared to pre-tax trends and up to a 17% decline by Dec. 2014
These preliminary results show average effects in the population studied. Future research would provide estimations on subgroups (i.e. large consumers of taxed beverages) to assess differential effects
Source: Instituto Nacional de Salud Pública and University of North Carolina. Price elasticity for soft drinks in Mexico. Working Paper, 2015.
18
Conclusions
• Overweight and obesity are among the most important risk factors to develop NCD in the Mexican case
• ENSOD includes intersectorial actions • Fiscal policies seem among the most cost-effective actions to control
consumption of sin food and drinks • Mix results in terms of sales • Some evidence of reduction on the consumption of sweetened drinks
• IEPS to sin food and drinks is a very successful measure to increase revenue
• It is urgent to negotiate with Mexican Ministry of Finance to direct part of IEPS revenue to finance the full implementation and operation of ENSOD
• Measurement of health benefits in process