Embed Size (px)
Citation preview


Sales Tax Overview
Budget, Finance and Audit CommitteeNovember 8, 2010

2
Purpose and Outline• Overview of sales tax is provided for informational
purposes– No action is required
• Outline– State Law – tax rate and taxable items– Taxable vs. non-taxable sales– Historical Trends– Forecasting model– Geographic and demographics – Internet sales– Summary

3
Tax Rate• Sales tax is governed by and capped by State law• Dallas is at maximum sales tax permitted under State
law which is 8.25%– State levies 6.25% tax– Local jurisdictions are allowed to levy up to 2% tax
• Cities• Counties• Transit authorities• Special purpose districts created to generate revenue for a specific
reason such as for crime control, libraries, emergency services• In Dallas, sales tax includes
– 6.25% - State – 1.0% - City’s general fund– 1.0% - Dallas Area Rapid Transit

4
Taxable Items• Only the sell or lease of tangible personal property or the sell of
taxable services as defined by State are subject to sales tax • Not all sales are taxable - taxable sales are a subset of gross sales• Sales tax revenue comes from much more than retail activity,
because most industries (categorized below; examples in appendix) have at least some portion of their sales that are subject to sales tax
• Retail and wholesale trade accounts for about 34% of Dallas’ sales tax revenue
Retail Trade Admin Support, /Waste, Remediation Transportation & Warehousing
Wholesale Trade Professional, Scientific, Technical Services Health Care & Social Services
Information Other Services (Except Public Administration) Public Administration
Utilities Arts, Entertainment, Recreation Educational Services
Accommodations & Food Service Real Estate, Rental, Leasing Agriculture, Forestry, Fishing. Hunting
Manufacturing Mining-Quarrying, Oil & Gas Extraction Mgmt of Companies & Enterprises
Construction Finance & Insurance Other and Nonclassifiable

5
Taxable Sales• Economic growth does not always translate into sales
tax revenue growth• For example, between 2002 and 2009, fastest growing
gross sales in City were in industries that only account for 7.3% of sales tax revenue in City– Real estate, rentals and leasing industry – 833%– Finance and insurance – 608%– Health care and social services – 519%– Educational services – 123%
• The fastest-growing industries in terms of taxable sales from 2002 to 2009 account for only 3.6% of Dallas’ sales tax revenue and were– Mining-quarrying-oil & gas extraction – 71%– Agriculture-forestry-fishing-hunting – 54%– Finance and insurance – 51%– Arts-entertainment-recreation – 38%
Note: Data for briefing from State Comptroller unless otherwise Specified.

6
Taxable and Non-Taxable Sales ($ Billion)
$22.5 $22.0
$70.6
$92.8
$0
$20
$40
$60
$80
$100
$120
$140
2002 2009
Not TaxableTaxable

7
Taxable and Non-Taxable Sales (% of Gross Sales)
24.2% 19.2%
75.8% 80.8%
0%
10%
20%
30%
40%
50%
60%
70%
80%
90%
100%
2002 2009
Not TaxableTaxable

8
Taxable Sales by IndustryType of Industry 2002 2009 Change
Retail Trade 6,070,459,589 27.0% 6,194,075,334 28.2% +2%
Information 5,326,175,189 23.7% 4,428,644,112 20.1% -17%
Utilities 2,383,700,880 10.6% 2,298,120,036 10.4% -4%
Accommodations & Food Service
1,774,202,402 7.9% 2,061,842,057 9.4% +16%
Manufacturing 1,775,366,831 7.9% 1,463,735,789 6.7% -18%
Wholesale Trade 1,243,047,608 5.5% 1,291,224,030 5.9% +4%
Construction 768,858,409 3.4% 1,012,378,818 4.6% +32%
Admin Support, Waste, Remediation
943,755,461 4.2% 914,985,054 4.2% -3%
Professional, Scientific, Technical Service
637,162,028 2.8% 584,710,641 2.7% -8%
Other Services (except Public Admin)
418,635,630 1.9% 437,839,790 2.0% +5%
All Other Industries 1,177,396,793 5.2% 1,309,856,931 6.0% +11%
22,518,760,820 100.0% 21,997,412,592 100.0% -2%

9
Taxable Sales by Industry Calendar 2009
Construction5%
Admin Support/Waste/Remediation
4%
Professional/Scientific/Technical Services
3%
Other Services (Except Public Administration)
2%All Other Industries
6%
Retail Trade28%
Information20%
Utilities10%
Accommodations & Food Service
9%
Manufacturing7%
Wholesale Trade6%

Sales Tax Revenue Historical Trend for City of Dallas
$0
$50,000,000
$100,000,000
$150,000,000
$200,000,000
$250,000,000
1991
1992
1993
1994
1995
1996
1997
1998
1999
2000
2001
2002
2003
2004
2005
2006
2007
2008
2009
2010
Est
imat
e
2011
Bud
get
Fiscal Year

11
Historical Trend – Recession Dates
• Gross sales and taxable sales are affected by national and international economics
• National Bureau of Economic Research, a private organization maintains the following dates for the three recent national recessions– July 1990 to March 1991– March 2001 to November 2001– December 2007 to June 2009
• End of a recession does not necessarily mean the economy is growing strongly, rather that most major indicators are no longer falling

12
Forecasting Model• Forecasting of sales tax is difficult due to volatile nature and
numerous variables involved• Office of Economic Development developed a sales tax forecast
model that generates short and medium-term forecasts • Model uses quarterly historic data from 1990• A large selection of statistics were evaluated to include in the model• The final model includes four variables that together provide the best
predictive ability– City of Dallas unemployment rate (source: U.S. BLS)– Occupied retail space in the city (source: Costar)– Actual sales tax revenue from two quarters prior (source: TX Comptroller)– Special seasonal variable – accounts for fourth quarter holiday shopping
season• Model explains 95.9% of historic sales tax revenue behavior in Dallas

13
Forecasting Model Performance (Quarterly Sales Tax Allocation)
-
10,000,000
20,000,000
30,000,000
40,000,000
50,000,000
60,000,000
70,000,000
1990
1991
1992
1993
1994
1995
1996
1997
1998
1999
2000
2001
2002
2003
2004
2005
2006
2007
2008
2009
ActualPredicted
The model closely tracks actual sales revenue

14
Forecasting Model• Model variables have the following effect on quarterly
revenue– Dallas unemployment rate – every percentage point change in
city’s unemployment rate changes quarterly revenue by $1.2m– Occupied retail space – every 1,000,000 square foot change of
occupied space changes revenue by $0.8m– Past sales revenue – each $1m change in revenue two quarters
prior changes current quarter revenue by $0.4m– Fourth quarter (Oct-Dec) seasonal variable – revenue will be
$2.5m higher in fourth quarters

15
Forecasting Methodology• Fiscal year budget is based on a ratio forecast
methodology and confirmed through the model developed by Office of Economic Development
• Forecast of year-end sales tax revenue uses year-to- date actual receipts– Each calendar month account for approximately the same share
of annual revenue from year to year– Uses averages from the last five years– Assumes current year revenue pattern will follow the historic
trend
• Annually City Auditor reviews upcoming fiscal year revenue projection and methodology

16
Forecasting Methodology Monthly Sales Tax Receipts
(2005-2009)
7.3%
7.6%
11.1%
7.2%
7.0%
10.0%
7.4%
7.8%
10.2%
7.5%7.4%
9.6%
0.0%
10.0%
20.0%
30.0%
40.0%
50.0%
60.0%
70.0%
80.0%
90.0%
100.0%
Oct Nov Dec Jan Feb Mar Apr May Jun Jul Aug Sep
Current MonthPrior Month Total

17
Forecasting Methodology FY11 Budget
• For FY11 Budget, sales tax revenue is forecast at $204.8m– Second largest revenue source for the general fund– Accounts for about 20.5% of revenue for general fund
FY08 Actual $228.8m
FY09 Actual $206.9m
FY10 Budget $206.6m
FY10 Estimate $203.8m
FY11 Budget $204.8m

18
Geographic Pattern of Sales (Based on Point of Sale)
• Total sales in Dallas reflects the concentration of commercial activity
• Northern and western Dallas’ retail and industrial corridors are the areas generating most of the city’s sales
• This pattern does not reflect the source of the income that generates the sales
• These sales are to all individuals, including customers that may reside in other parts of the city, outside the city or even outside the state

19
% Change in Sales Activity (Based on Point of Sale)
• Total sales activity has changed in the city
• Increases are likely due to increased commercial and retail activity
• Decreases may be due to loss of local customers or the removal of large tax payers (through closure or relocation)

20
$ Change in Sales Activity (Based on Point of Sale)
• The dollar change in sales activity matches the percent change pattern with scattered pockets of increasing and decreasing sales by ZIP code

21
Dallas ZIP Demographics
Average of all Zips Min of all Zips Max of all ZipsTotal Household Expenditure $55,264 $23,868 $137,771
Retail Expenditure $23,487 $10,472 $57,783
Median Age 34.5 27.5 44.7
Owner Occupied Housing Units 41.8% 5.6% 77.1%
Median Household Income 46,041 16,922 126,828
Average Vehicles Per Household 1.6 1.1 2.4
Per Capita Income 31,132 8,500 94,338
Average Household Size 2.7 1.5 3.8
Education Total (Bachelors or higher) 2.8 3.8 7.31
Total Population 29,457 267 75,022
• Dallas ZIP codes present a range of socioeconomic characteristics• Many of these factors drive retail and other spending behavior• Non-Dallas residents also contribute to sales tax revenue and Dallas
residents spend some income in other jurisdictions
ZIP demographic and spending statistics from Altyerix Demographics Now.

22
Socioeconomic Factors Driving Household Spending
• Household spending is an important determinant of sales activity in Dallas• Dallas households, however, spend income inside and outside their
neighborhoods and inside and outside the city overall• At the ZIP code level, there is very little correlation between where spending
power is concentrated and where actual sales take place (correlation = 0.26)• A statistical analysis of the relationship between spending and socioeconomic
variables by Dallas ZIP codes revealed the following:– Median household income and per capita income positively correlate to an
increase in spending– Average household size correlates to a lesser degree, given that a family's budget
can only expand so much as the family grows – Educational attainment tends to contribute to additional spending, but the results
vary with different statistical models (limitations in the available data may explain this inconsistency)
– Ethnicity and home ownership were not statistically associated with household spending
23
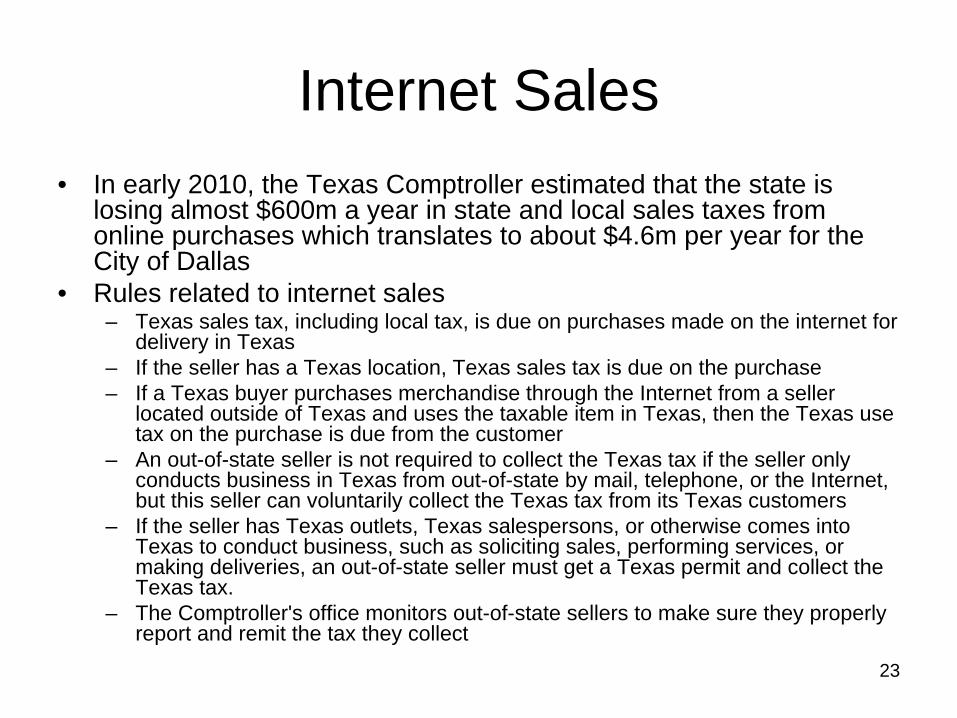
Internet Sales• In early 2010, the Texas Comptroller estimated that the state is
losing almost $600m a year in state and local sales taxes from online purchases which translates to about $4.6m per year for the City of Dallas
• Rules related to internet sales– Texas sales tax, including local tax, is due on purchases made on the internet for
delivery in Texas– If the seller has a Texas location, Texas sales tax is due on the purchase – If a Texas buyer purchases merchandise through the Internet from a seller
located outside of Texas and uses the taxable item in Texas, then the Texas use tax on the purchase is due from the customer
– An out-of-state seller is not required to collect the Texas tax if the seller only conducts business in Texas from out-of-state by mail, telephone, or the Internet, but this seller can voluntarily collect the Texas tax from its Texas customers
– If the seller has Texas outlets, Texas salespersons, or otherwise comes into Texas to conduct business, such as soliciting sales, performing services, or making deliveries, an out-of-state seller must get a Texas permit and collect the Texas tax.
– The Comptroller's office monitors out-of-state sellers to make sure they properly report and remit the tax they collect

24
Summary• Sales tax revenue is a significant revenue for the City’s
general fund• Sales tax is volatile and affected by the economy and
numerous variables• Staff will continue to monitor and report on sales tax on a
monthly basis

Appendix

26
Appendix: Example Taxable Items
• The sales tax code and the administrative rules crafted by the State Comptroller are lengthy and complex. There are hundreds of clauses, exemptions and findings that affect the taxability of goods and services
• Examples of taxable items in select industries– Information – Newsletters, data retrieval, or mailing lists– Utilities – Residential consumption of electricity when the
municipality has removed its default exempt status– Manufacturing – Hand tools, maintenance and janitorial supplies
and equipment, or machinery or equipment used to maintain or store products
– Construction – Maintenance on non-residential property, labor to repair, remodel or restore residential real property, and labor for new construction

27
Appendix: Example Non-Taxable• Examples of non-taxable items in select industries
– Administration Support/Waste Services/Remediation – Use of pesticides or regulated herbicides for mainly agricultural purposes, and the services of full-time peace officers privately employed as guards
– Professional/Scientific/Technical Services – Copyrights on photographs (in some instances), and the professional services of landscape designers and architects
– Arts/Entertainment/Recreation – Skydiving training for a person intending to be a skydiving instructor, and consignment sale by an exempt museum of artwork of less than $5,000 on one of the two days an exempt museum is allowed to make exempt sales
– Retail Trade: Items used by the disabled, such as walkers, bedside rails or talking clocks, and items sold during the sales tax holiday
– Mining/Quarrying/Oil & Gas Extraction - Labor to start or stimulate production or the labor to work on the formation outside a well
– Transportation & Warehousing – Charges by colleges, universities, and public schools for parking permits and decals for students
– Other Services (Except Public Administration) – Labor for motor vehicle repair, and qualifying sales made by groups such as PTAs
– Public Administration – Amusement services provided exclusively by a governmental entity
– Accommodation and Food Service – Baby food, fruit and vegetable juice made with more than 50% fruit and vegetable juice, or bakery goods not sold with utensils