Embed Size (px)
Citation preview
Journal of Corporate Finance 16 (2010) 572–587
Contents lists available at ScienceDirect
Journal of Corporate Finance
j ourna l homepage: www.e lsev ie r.com/ locate / j corpf in
Tax reform and payout policy: Do shareholder clienteles or payoutpolicy adjust?
Timo Korkeamaki a,b,1, Eva Liljeblom a,2, Daniel Pasternack a,⁎a Department of Finance and Statistics, Hanken School of Economics, Finlandb Bank of Finland
a r t i c l e i n f o
⁎ Corresponding author. Tel.: +358 50 569 3416; fE-mail addresses: [email protected] (T.
1 Tel.: +358 40 3521 308; fax: +358 9 431 33 3932 Tel.: +358 9 4313 3291; fax: +358 9 431 33 393
0929-1199/$ – see front matter © 2009 Elsevier B.V.doi:10.1016/j.jcorpfin.2009.12.003
a b s t r a c t
Article history:Received 31 October 2008Received in revised form 26 August 2009Accepted 11 December 2009Available online 16 December 2009
Changes in taxation of corporate dividends offer excellent opportunities to study dividendclientele effects. We explore payout policies and ownership structures around a major taxreform that took place in Finland in 2004. Consistent with dividend clienteles affecting firms'dividend policy decisions, we find that Finnish firms altered their dividend policies based onthe changed tax incentives of their largest shareholders. While firms adjust their payoutpolicies, our results also indicate that ownership structures of Finnish firms also changedaround the 2004 reform, consistent with shareholder clienteles adjusting to the new taxsystem.
© 2009 Elsevier B.V. All rights reserved.
JEL classification:G35G34
Keywords:Tax reformDividendsShare repurchasesOwnership clienteles
1. Introduction
Despite more than 40 years of studies of corporate dividend policies, questions such as whether potential dividend clientelesaffect corporate payout decisions are largely unanswered. Even the existence of dividend clienteles remains unclear. Most of earlyresearch has focused on price and volume reactions around dividend events. Those studies explore permanent dividend clientelesindirectly, and their results are mixed. In more recent work, dividend clienteles are observed more directly by studying theholdings of either institutional investors (Dhaliwal et al., 1999; Grinstein and Michaely, 2005), retail investors (Graham andKumar, 2006), or half of an entire market as in Dahlquist et al. (2006). But do firms take the tax status of their owners into account,or is it mainly investors whomake their portfolio choices based on firms' existing dividend policies? Pérez-Gonzáles (2003) arguesthat tax preferences of large shareholders influence dividend payout policies in the U.S. Findings by Chetty and Saez (2005), Blouinet al. (2007), and Brown et al. (2007) suggest that incentives of owners and managers affect firms' payout policy decisions aroundtax reforms. Jin (2006) finds that embedded capital gains of institutional holders of the firm affect its choice between sharerepurchases and dividends. In contrast, survey evidence by Brav et al. (2005) strongly indicates that firms are reluctant to changetheir dividend policies to reflect changes in tax preferences among their major shareholders. Similarly, Barclay et al. (2009) findthat when a block trade is made from individual taxed investors to corporate investors with a reduced tax burden on dividendincome, the firms fail to take into account the change in the tax preferences of their owners.
ax: +358 9 431 33 393.Korkeamaki), [email protected] (E. Liljeblom), [email protected] (D. Pasternack)...
All rights reserved.
573T. Korkeamaki et al. / Journal of Corporate Finance 16 (2010) 572–587
In Finland, taxation of dividends changed significantly in 2004 as a full imputation system was abolished, and a system ofpartial double taxation of corporate income was introduced. The magnitude of the change for individual investors was similar tothat studied in Bell and Jenkinson (2002) in the U.K., as the tax burden on dividend income at the personal level in Finland wentfrom zero to 19.6%. In this paper, we study simultaneous reactions to the change in taxation by both firms and investors. By lookingat changes in both payout policy when controlling for ownership, and ownership when controlling for payout policy and its taxtreatment, we shed light on the interactions between these two factors around a major tax reform. The firms' reaction is measuredby observing their dividend and share repurchase policies before and after a tax reform. We include measures of ownershipstructure to consider whether adjustments to the reform were affected by tax-effects of the firms' main ownership groups. Theownership data is further observed throughout the reform to estimate whether the tax change also resulted in changes inownership patterns.
One can argue that presence of a large block owner makes firms more likely to adjust their dividend policies to reflect thepreferences of such investors. Finnish ownership structures are typically muchmore concentrated than those in the U.S. and the U.K. Compared to evidence on ownership patterns in European countries by Barca and Becht (2001), the Finnish block ownershipseems to fall somewhere between the Central European countries and the U.K. Less than 20% of the firms have a block holderowning more than 50% of the shares.3 Importantly, ownership concentration varies substantially in the cross section of Finnishfirms. In the sample used in this study, the ownership share of the top five shareholders varies from 1.5% to 99.9%, with the averagefluctuating from year to year around 50%. Combined, the facts that Finnish ownership concentration is between the CentralEuropean countries and the Anglo-Saxon countries, and that substantial variation in ownership concentration exists within theFinnish sample, make Finland an interesting case to study whether firms' ownership patterns affect the likelihood for them toadjust their payout policies.
Our empirical results contrast results by Brav et al. (2005), Baker and Wurgler (2004), Denis and Osobov (2008), Brown et al.(2007), and Barclay et al. (2009), who all provide evidence suggesting that individual ownership does not affect dividend policies.In reaction to the tax reform, Finnish firms adjusted their payout levels for both dividends and share repurchases based on theirownership structures. Especially in dividend payout decisions, firms take into account the tax-effects of their shareholders. In theyear prior to the tax reform, we find that ahead of the upcoming dividend taxation at the personal level, firms whose shareholderswere more affected by the reform paid out substantially larger amounts to their shareholders. We further find that payoutvariables are significant determinants of ownership structures.
The structure of the paper is as follows. In Section 2, we discuss related literature. In Section 3, we present the main features ofthe 2004 tax reform in Finland. In Section 4, the data is presented. Empirical results are reported in Section 5, and summary andconclusions follow in Section 6.
2. Taxes and dividend policy
Tax-effects of dividends can be traded away if taxed investors sell their high yield stocks to non-taxed investors who capturethe dividend and subsequently sell the stocks back to taxed investors. The connection between firms' dividend policies andtaxation of their owners becomes irrelevant if owners with varying tax burdens engage in such tax-induced trading around the ex-dividend day. Several authors offer support for dynamic tax-induced trading by reporting abnormal trading volumes around theex-dividend day.4 However, the U.S. evidence on dividend taxation as the driving force on trading around the ex-dividend day ismixed. The results by Koski and Scruggs (1998) suggest that traders engage in dividend-capturing trading around the ex-dividendday, but that tax clienteles fail to explain the trading behaviour. More recently, Graham and Kumar (2006) study trading behaviourof a large sample of U.S. retail investors, and find that their income (and thus their marginal tax-rate) significantly affects theirtrading around the ex-dividend day. The price drop on the ex-dividend day tends to be smaller than the size of the dividend,5
which suggests that the value of dividends is not fully traded away in dividend-capturing trade. In Finland, Rantapuska (2008), andFelixson and Liljeblom (2008) both report evidence consistent with tax-induced trading around the ex-dividend day. Dividends inFinland are normally paid annually, rather than quarterly, which may increase incentives for tax-induced trading around the ex-dividend day, as the amount of dividend relative to transaction costs should increase attractiveness of the activity.
The question of whether investors adjust to firms' dividend policies is considered in several studies of investors' tradingbehaviour around changes in dividend policy, such as dividend changes, initiations or omissions. Mixed evidence on investoradjustment around dividend-altering events is provided by Richardson et al. (1986), Michaely et al. (1995) and Seida (2001), aswell as by Graham and Kumar (2006). Binay (2001) finds significant changes in institutional ownership after dividend omissionsand initiations. Grinstein and Michaely (2005) study the interactions between investor adjustments and firm payout policychanges by considering both institutional ownership and payout policy adjustments in the U.S. between 1980 and 1996. They findthat despite institutional owners in the U.S. seem to prefer dividend-paying firms over non-dividend-paying firms, the level ofdividends does not matter, as increases in dividends fail to attract increased institutional holdings. Grinstein and Michaely (2005)further fail to find evidence of an increase in institutional ownership or ownership concentration leading to changes in firms'
3 Evidence in Barca and Becht (2001) indicates that in Austria, Belgium, Germany, and Italy, a single block holder owns more than 50% of shares in more thanhalf of the listed firms.
4 See e.g. Lakonishok and Vermaelen (1986) and Michaely and Vila (1996) for the U.S., Kato and Lowenstein (1995) for Japan, and Michaely and Murgia (1995)for Italy. For a more detailed analysis of the identity of such traders, see e.g. Koski and Scruggs (1998) for the U.S., and Felixson and Liljeblom (2008) for Finland.
5 See e.g. Elton and Gruber (1970), Eades, Hess, and Kim (1984), Green and Rydqvist (1999), and Graham, Michaely, and Roberts (2003).
574 T. Korkeamaki et al. / Journal of Corporate Finance 16 (2010) 572–587
payout policy. Holmen et al. (2008) study the tax records of corporate insiders in Sweden to establish their marginal tax-rates,which allows them to explore the connection betweenmarginal tax-rates of insiders and dividend policy. They find that firmswithinsiders who have low tax rates pay higher dividends, and also that when insiders with zero tax rates sell blocks, firms tend toadjust by lowering their dividends. In a recent study, Desai and Jin (2008) explore the connection between the presence ofdividend-averse institutional investors and firms' payout ratios, and find evidence of both investors adjusting to exogenouschanges in the payout policy, and payout policies adjusting to changes in investor composition.
Two recent studies search for evidence of firms catering to dividend clienteles on a country-by-country aggregate level. Denisand Osobov (2008) and von Eije and Megginson (2008) study the connection between the valuation premium of dividend-payingfirms and firms' payout behaviour. Both studies fail to find evidence of firms adjusting their dividends to the demands of themarket.
Annual dividend changes may be too small to induce investors to adjust their holdings in a measurable way. Studying theinteractions between firms' payout policies and changes in investor holdings over a long period of time is also technicallychallenging, as both variables typically contain a time trend. Tax regime changes cause more substantial one-time effects oninvestors' preferences on dividends versus capital gains. Tax regime changes are also external to the firm, which allows studying ofsubsequent reactions by both firms and investors.
For the U.S., Pérez-Gonzáles (2003) studies changes in firms' dividend policies around the tax reforms from 1981 to 1999. Hefinds some support for firms adjusting their policies in line with investor preferences, as payout levels are negatively related to thetax disadvantage of dividends relative to capital gains according to his results. He further finds that the effect is limited to firmswhere large shareholders are affected by the tax reforms. Poterba (2004) finds a significant relationship between dividend payoutsand averagemarginal tax rates during 1935 to 2002. Chetty and Saez (2005) document a 20% increase in dividend payments in theU.S. after the dividend tax cut in 2003. The response to the tax cut was the strongest among firms with strong principals whose taxincentives changed. Brown et al. (2007) find thatmanagerial holdings explain cross-sectional differences in how the firms in the U.S. reacted in 2003.While high individual ownership in their sample fails to boost dividends, high executive ownership does increasedividend payouts. Finally, Graham and Kumar (2006) study retail investors' portfolio dividend yields around the tax reform of1993. Although portfolio holdings offer only an indirect way to test whether the firm or the investor reacts to a regulatory change,their robustness checks that consider additions to portfolios support their main finding that investors rather than firms adjust.
Tax regime changes typically affect investor preferences between dividends and share repurchases. Brown et al. (2007) andBlouin et al. (2007) find support for a substitution of dividends for share repurchases after the 2003 tax change. Blouin et al. (2007)further report that the substitution is concentrated in firms with high individual ownership, suggesting that firms adjust theirpayout channels depending on their ownership structure. Grullon and Michaely (2002) also find support for substitution in theU.S. cross section over a longer time horizon. While personal taxes are the most obvious factor affecting the choice betweendividends and repurchases, other potential factors also exist. Renneboog and Trojanowski (2005) report that dividends tend to bepreferred over share repurchases in the U.K. for firms that have block holders, regardless of those block holders' tax status. Theypropose strict insider trading rules as a possible explanation, as those rules make share repurchases less appealing for theshareholders with an insider status.
In summary, while existence of dividend clienteles is supported by numerous studies, the evidence on firm's adjusting theirpayout levels is only emerging, especially outside the U.S. Few studies consider the simultaneous reactions of the firms, and theinvestors'. Understanding the interactions is important for firms and investors alike.
3. The tax reform and ownership patterns
Prior to the 2004 tax reform, dividend income taxation in Finland was based on the 1993 legislation, which placed all capitalincome and corporate profits under a single flat tax rate. Originally, the rate was 25% (in 1993), but it was successively raised to28% (in 1996), and finally to 29% (in 2000). Furthermore, a full imputation (avoir fiscal) system applied to dividend distributions,which effectively made dividends tax-free for domestic investors at the personal level. The 2004 reform altered the tax rates bothat corporate and personal income levels, and more importantly replaced the full imputation system by introducing partial doubletaxation of corporate profits.
The reform lowered the corporate profits tax rate from 29% to 26% and the flat personal capital income tax-rate from 29% to28%. The abandonment of the full imputation system made 70% of dividends received taxable income (this rate was 57%, fordividends paid during the adjustment year of 2005). Therefore, the effective post-reform tax-rate on dividend income forindividual investors is 19.6% (0.7 times 0.28), whereas prior to the reform, the dividend income tax-rate for individual domesticinvestors was zero, due to the full imputation system.
While the 2004 tax reform increased taxation of dividend income substantially, several exceptions exist. These exceptions areinteresting, as they cause different investor groups to view the reform differently. First, several institutions are exempt fromdividend taxes, including mutual funds, mutual banking firms, and several governmental institutions, such as the Bank of Finland.Second, dividends received by a corporation from another corporation are tax-free. However, for dividends received from apublicly-listed firm, this rule applies only when the recipient is another listed non-financial firm, or when the equity stake held bythe receiving corporation is more than 10% of the shares outstanding. Finally, tax treatment of dividends paid to foreign investorswas not amended in the reform. Foreign investors are subject to a withholding tax that depends on bilateral agreements betweencountries. For most foreign owners, a tax of 15% is withheld from dividends received from a Finnish firm.
575T. Korkeamaki et al. / Journal of Corporate Finance 16 (2010) 572–587
The tax reform did not come as a surprise either to the Finnish firms or to the financial markets. A legal challenge against thedifferential treatment of foreign investors in the old tax system is seen as one of the origins of the 2004 tax reform. The challengewas made in the summer of 2002, and as it was clear that the Finnish dividend taxation was at odds with the EU standards, achange to the systemwas imminent. Later in 2002, a tax reform panel appointed by the Ministry of Finance published a report thatproposed changes to the then-current dividend taxation system. The report suggested sweeping changes, including full doubletaxation of dividends, but it was met with resistance within the government. In November of 2003, the government produced adraft of its own proposal, which was very close to the reform that eventually came into effect in the spring of 2004.6
Table 1 provides information on dividend taxation in Finland after the 2004 tax reform, by investor category. As mentionedabove, taxation of dividends increased in general, with exceptions of groups such as mutual funds and governmental institutions.The reform also left the tax preference of foreign investors intact, as they continued to face thewithholding tax (typically 15%) thatwas levied on them prior to the reform as well. Table 1 also indicates the tax preference ratio of each investor group. The ratio iscalculated following Poterba (2004). As the tax preference ratios reveal, the 2004 reform reduced the preference for dividends formost investor groups, while for some groups, the preference ratio was unaffected by the reform.
Furthermore, Table 1 shows the percentage of total ownership by different investor categories. The statistics are based on thetop five shareholders for each firm. The bottom panel of the table accumulates data combined for all investor categories. The topfive owners own a significant portion of the aggregate market. As a consequence, our ownership data covers approximately half ofthe total ownership of Finnish publicly-listed firms. Interestingly, ownership by private persons drops significantly from 2004 to2005, and mutual funds are increasing their share of ownership. The relative tax-efficiency of mutual fund holdings, compared todirect holdings, improved in the reform, so the shift in ownership pattern is consistent with a suggestion that ownership patternsare affected by the reform.
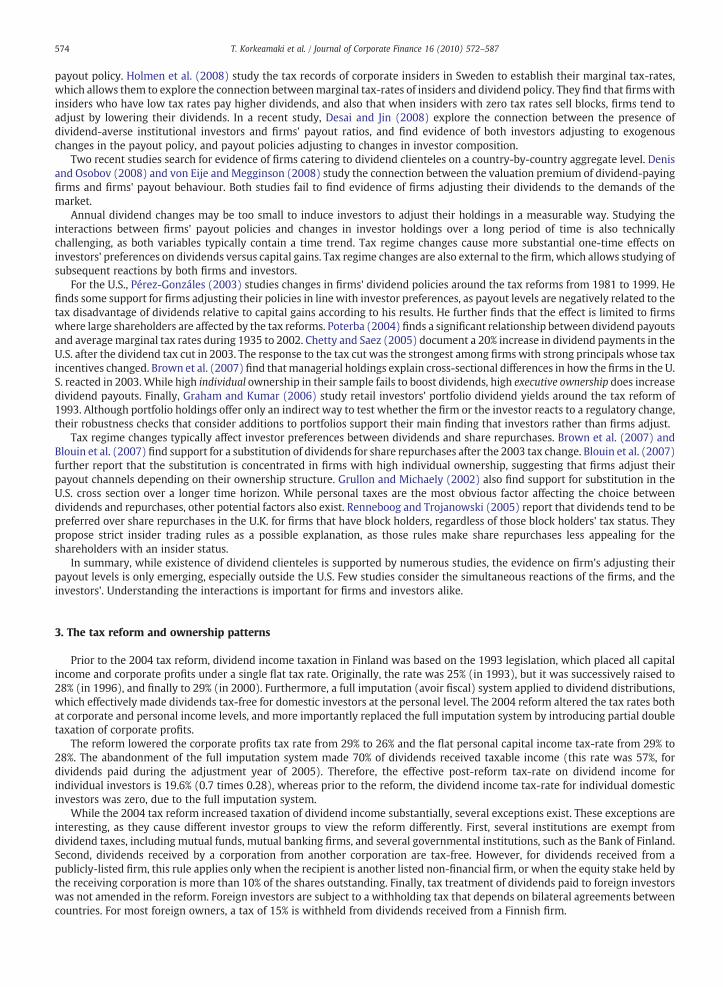
As mentioned above, block ownership in Finland is between that of the Continental Europe and the Anglo-Saxon countries.Fig. 1 indicates prevalence of block ownership in the Finnish cross section. The figure is comparable to the country-by-countrygraphs in Barca and Becht (2001). Out of the eight European countries that they study, Austria, Belgium, Germany, Italy, Sweden,Spain and The Netherlands exhibit clearly more block ownership than what our sample indicates for Finland. In the U.K., on theother hand, only the top decile contains firms with 30% block owners. It is interesting to note that according to Fig. 1, blockownership experienced a shift downwards between 2002 and 2005.
4. Data
We use dividend data from the Helsinki Stock Exchange. The data cover all dividends paid during the years 2003 to 2006 for allcompanies listed on the exchange, corresponding to corporate profits for years 2002 to 2005. In Finland, companies are required toreport on completed share repurchases. Our data on share repurchases is gathered from press releases that firms submitted inorder to fulfil their reporting requirement. Ownership data come from Pörssitieto manuals, which report holdings and investortypes for top five shareholders of each publicly-listed company in Finland.We also use the Finnish Central Securities Depository toobtain the level of foreign ownership. For financial statement data and stock return and price data, we rely on Datastream. Thevariables used in our analysis are defined in Table 2.
The number of firms listed on the Helsinki Stock Exchange during our sample years is 144 (2003), 136 (2004), 137 (2005) and131 (2006), which sums up to 548 potential data points. A small number of missing data points and delistings in the middle of theyear cause minor deterioration in our sample so that the final full sample consists of 524 firm-year observations for 148 differentfirms. To avoid further deterioration, we use a substitution method to replace missing data points for firm characteristics that weuse as control variables. In the substitutionmethod amissing data point is replaced by the cross-sectional average for the data itemin that year.7
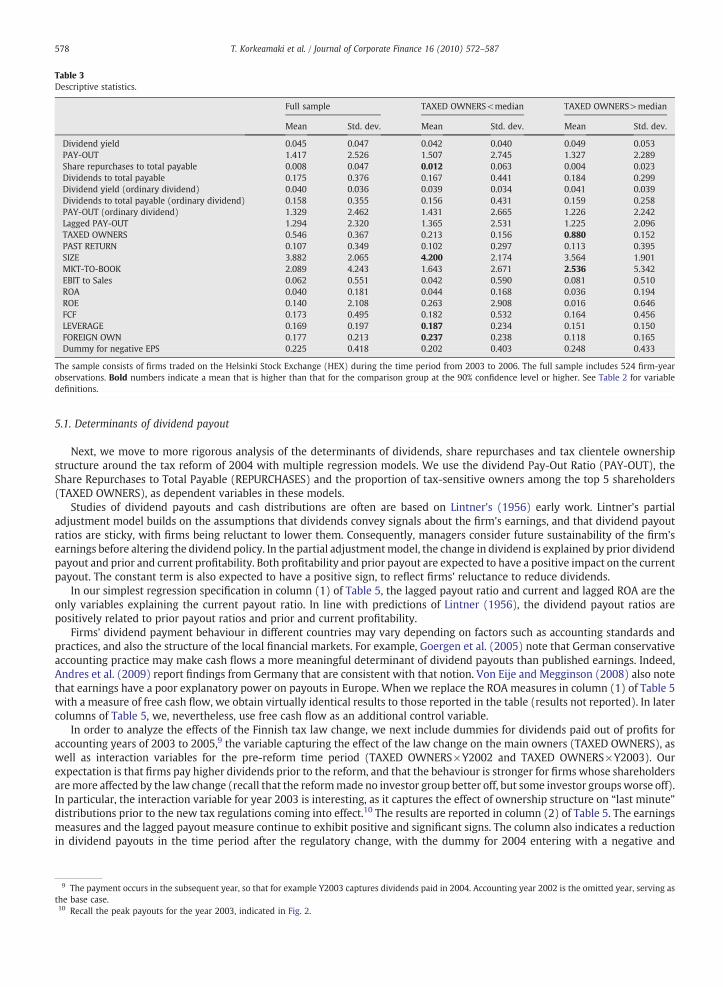
Descriptive statistics for various measures of dividend payout and profitability, along with other firm characteristics, arereported in Table 3. The table provides information regarding both the full sample and two sub-samples that are based on theextent to which the firm's top five owners were affected by the tax change. The table indicates very high dividend payouts duringthe period, as the mean payout ratio is over 140% and the mean dividend yield is 4.54%. Out of all holdings by top five owners, theproportion held by investors who were affected by the tax change is approximately 55%, but that percentage varies substantiallyacross firms (averages are 21% and 88% in the two subgroups, respectively). As Table 3 indicates, the two subgroups deviatesignificantly in size, market-to-book ratio, leverage, and foreign ownership. We control for all these factors in our regressionmodels.
5. Empirical analysis
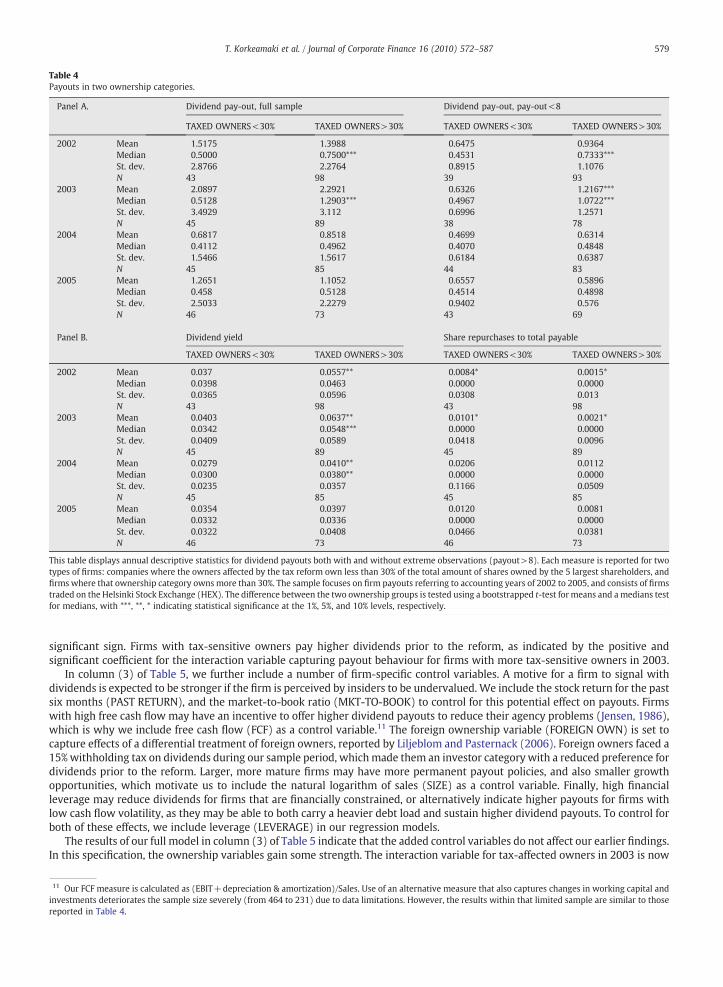
We report the evolution of dividend payouts, dividend yields, and share repurchases during our sample years in Table 4. Thetable segregates the sample into two groups of firms, based on whether the total equity ownership of those among the top 5shareholders who were affected by the tax reform is higher or lower than 30%. The 30% cut-off point is arbitrarily drawn in anattempt to identify a level of reasonably large corporate influence by the tax-affected owners. Since the dividend payout variableexhibits extreme positive skewness due to some firms paying high dividends despite low earnings, we have truncated our payout
6 See Kari et al. (2008) for more details on the proposal by the tax reform panel.7 Despite the resulting smaller sample size, our results are virtually identical when firms with any missing variables are dropped from the regressions.
8 The regression results reported in the subsequent tables are based on the restricted dividend sample, to provide more robust results, i.e. results not driven bysome extreme outliers.
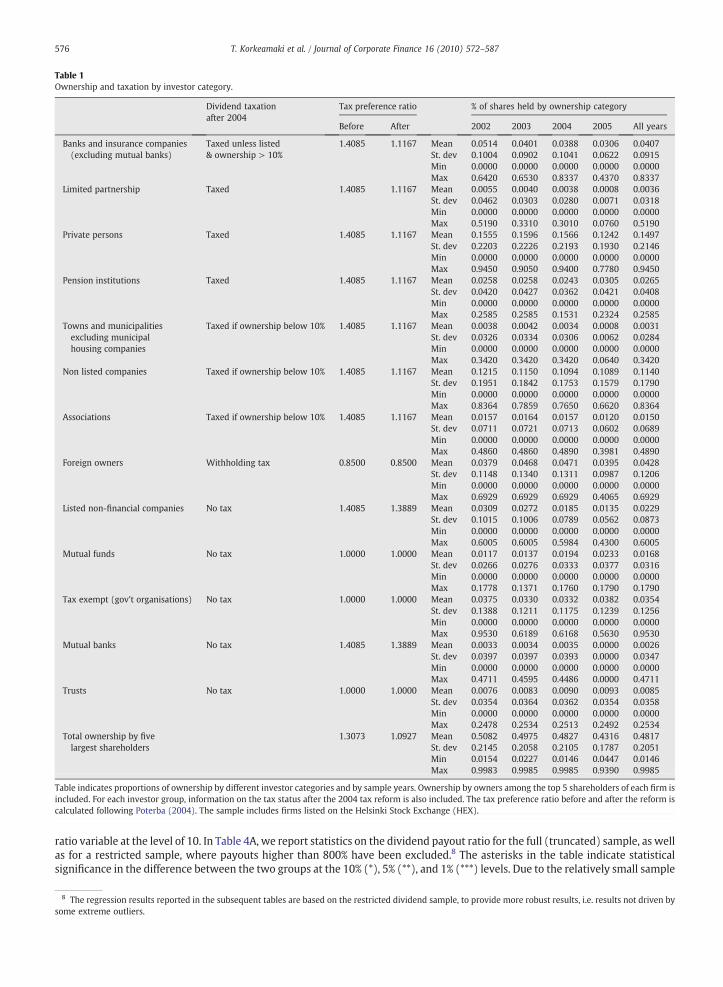
Table 1Ownership and taxation by investor category.
Dividend taxationafter 2004
Tax preference ratio % of shares held by ownership category
Before After 2002 2003 2004 2005 All years
Banks and insurance companies(excluding mutual banks)
Taxed unless listed& ownership > 10%
1.4085 1.1167 Mean 0.0514 0.0401 0.0388 0.0306 0.0407St. dev 0.1004 0.0902 0.1041 0.0622 0.0915Min 0.0000 0.0000 0.0000 0.0000 0.0000Max 0.6420 0.6530 0.8337 0.4370 0.8337
Limited partnership Taxed 1.4085 1.1167 Mean 0.0055 0.0040 0.0038 0.0008 0.0036St. dev 0.0462 0.0303 0.0280 0.0071 0.0318Min 0.0000 0.0000 0.0000 0.0000 0.0000Max 0.5190 0.3310 0.3010 0.0760 0.5190
Private persons Taxed 1.4085 1.1167 Mean 0.1555 0.1596 0.1566 0.1242 0.1497St. dev 0.2203 0.2226 0.2193 0.1930 0.2146Min 0.0000 0.0000 0.0000 0.0000 0.0000Max 0.9450 0.9050 0.9400 0.7780 0.9450
Pension institutions Taxed 1.4085 1.1167 Mean 0.0258 0.0258 0.0243 0.0305 0.0265St. dev 0.0420 0.0427 0.0362 0.0421 0.0408Min 0.0000 0.0000 0.0000 0.0000 0.0000Max 0.2585 0.2585 0.1531 0.2324 0.2585
Towns and municipalitiesexcluding municipalhousing companies
Taxed if ownership below 10% 1.4085 1.1167 Mean 0.0038 0.0042 0.0034 0.0008 0.0031St. dev 0.0326 0.0334 0.0306 0.0062 0.0284Min 0.0000 0.0000 0.0000 0.0000 0.0000Max 0.3420 0.3420 0.3420 0.0640 0.3420
Non listed companies Taxed if ownership below 10% 1.4085 1.1167 Mean 0.1215 0.1150 0.1094 0.1089 0.1140St. dev 0.1951 0.1842 0.1753 0.1579 0.1790Min 0.0000 0.0000 0.0000 0.0000 0.0000Max 0.8364 0.7859 0.7650 0.6620 0.8364
Associations Taxed if ownership below 10% 1.4085 1.1167 Mean 0.0157 0.0164 0.0157 0.0120 0.0150St. dev 0.0711 0.0721 0.0713 0.0602 0.0689Min 0.0000 0.0000 0.0000 0.0000 0.0000Max 0.4860 0.4860 0.4890 0.3981 0.4890
Foreign owners Withholding tax 0.8500 0.8500 Mean 0.0379 0.0468 0.0471 0.0395 0.0428St. dev 0.1148 0.1340 0.1311 0.0987 0.1206Min 0.0000 0.0000 0.0000 0.0000 0.0000Max 0.6929 0.6929 0.6929 0.4065 0.6929
Listed non-financial companies No tax 1.4085 1.3889 Mean 0.0309 0.0272 0.0185 0.0135 0.0229St. dev 0.1015 0.1006 0.0789 0.0562 0.0873Min 0.0000 0.0000 0.0000 0.0000 0.0000Max 0.6005 0.6005 0.5984 0.4300 0.6005
Mutual funds No tax 1.0000 1.0000 Mean 0.0117 0.0137 0.0194 0.0233 0.0168St. dev 0.0266 0.0276 0.0333 0.0377 0.0316Min 0.0000 0.0000 0.0000 0.0000 0.0000Max 0.1778 0.1371 0.1760 0.1790 0.1790
Tax exempt (gov't organisations) No tax 1.0000 1.0000 Mean 0.0375 0.0330 0.0332 0.0382 0.0354St. dev 0.1388 0.1211 0.1175 0.1239 0.1256Min 0.0000 0.0000 0.0000 0.0000 0.0000Max 0.9530 0.6189 0.6168 0.5630 0.9530
Mutual banks No tax 1.4085 1.3889 Mean 0.0033 0.0034 0.0035 0.0000 0.0026St. dev 0.0397 0.0397 0.0393 0.0000 0.0347Min 0.0000 0.0000 0.0000 0.0000 0.0000Max 0.4711 0.4595 0.4486 0.0000 0.4711
Trusts No tax 1.0000 1.0000 Mean 0.0076 0.0083 0.0090 0.0093 0.0085St. dev 0.0354 0.0364 0.0362 0.0354 0.0358Min 0.0000 0.0000 0.0000 0.0000 0.0000Max 0.2478 0.2534 0.2513 0.2492 0.2534
Total ownership by fivelargest shareholders
1.3073 1.0927 Mean 0.5082 0.4975 0.4827 0.4316 0.4817St. dev 0.2145 0.2058 0.2105 0.1787 0.2051Min 0.0154 0.0227 0.0146 0.0447 0.0146Max 0.9983 0.9985 0.9985 0.9390 0.9985
Table indicates proportions of ownership by different investor categories and by sample years. Ownership by owners among the top 5 shareholders of each firm isincluded. For each investor group, information on the tax status after the 2004 tax reform is also included. The tax preference ratio before and after the reform iscalculated following Poterba (2004). The sample includes firms listed on the Helsinki Stock Exchange (HEX).
576 T. Korkeamaki et al. / Journal of Corporate Finance 16 (2010) 572–587
ratio variable at the level of 10. In Table 4A, we report statistics on the dividend payout ratio for the full (truncated) sample, as wellas for a restricted sample, where payouts higher than 800% have been excluded.8 The asterisks in the table indicate statisticalsignificance in the difference between the two groups at the 10% (*), 5% (**), and 1% (***) levels. Due to the relatively small sample
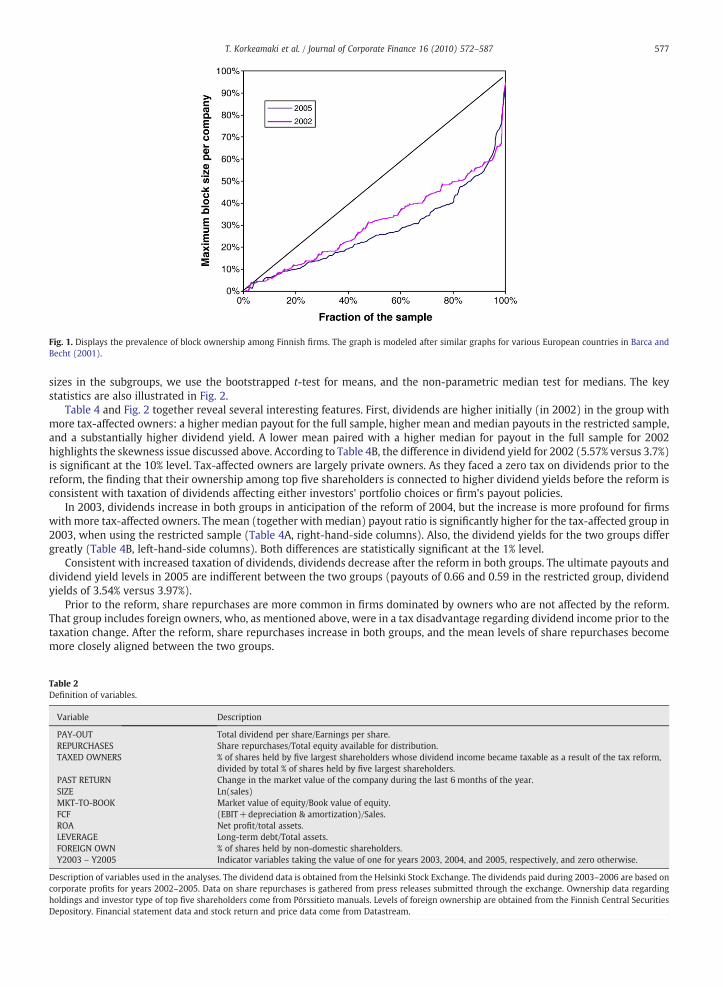
Table 2Definition of variables.
Variable Description
PAY-OUT Total dividend per share/Earnings per share.REPURCHASES Share repurchases/Total equity available for distribution.TAXED OWNERS % of shares held by five largest shareholders whose dividend income became taxable as a result of the tax reform,
divided by total % of shares held by five largest shareholders.PAST RETURN Change in the market value of the company during the last 6 months of the year.SIZE Ln(sales)MKT-TO-BOOK Market value of equity/Book value of equity.FCF (EBIT+depreciation & amortization)/Sales.ROA Net profit/total assets.LEVERAGE Long-term debt/Total assets.FOREIGN OWN % of shares held by non-domestic shareholders.Y2003 – Y2005 Indicator variables taking the value of one for years 2003, 2004, and 2005, respectively, and zero otherwise.
Description of variables used in the analyses. The dividend data is obtained from the Helsinki Stock Exchange. The dividends paid during 2003–2006 are based oncorporate profits for years 2002–2005. Data on share repurchases is gathered from press releases submitted through the exchange. Ownership data regardingholdings and investor type of top five shareholders come from Pörssitieto manuals. Levels of foreign ownership are obtained from the Finnish Central SecuritieDepository. Financial statement data and stock return and price data come from Datastream.
Fig. 1. Displays the prevalence of block ownership among Finnish firms. The graph is modeled after similar graphs for various European countries in Barca andBecht (2001).
577T. Korkeamaki et al. / Journal of Corporate Finance 16 (2010) 572–587
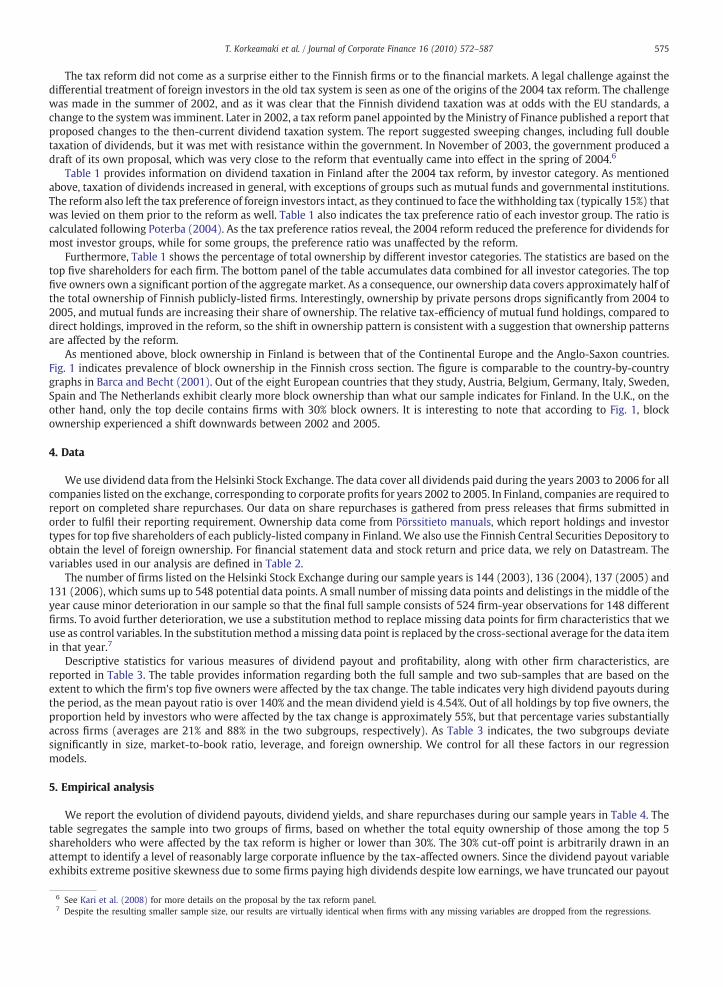
sizes in the subgroups, we use the bootstrapped t-test for means, and the non-parametric median test for medians. The keystatistics are also illustrated in Fig. 2.
Table 4 and Fig. 2 together reveal several interesting features. First, dividends are higher initially (in 2002) in the group withmore tax-affected owners: a higher median payout for the full sample, higher mean and median payouts in the restricted sample,and a substantially higher dividend yield. A lower mean paired with a higher median for payout in the full sample for 2002highlights the skewness issue discussed above. According to Table 4B, the difference in dividend yield for 2002 (5.57% versus 3.7%)is significant at the 10% level. Tax-affected owners are largely private owners. As they faced a zero tax on dividends prior to thereform, the finding that their ownership among top five shareholders is connected to higher dividend yields before the reform isconsistent with taxation of dividends affecting either investors' portfolio choices or firm's payout policies.
In 2003, dividends increase in both groups in anticipation of the reform of 2004, but the increase is more profound for firmswith more tax-affected owners. The mean (together with median) payout ratio is significantly higher for the tax-affected group in2003, when using the restricted sample (Table 4A, right-hand-side columns). Also, the dividend yields for the two groups differgreatly (Table 4B, left-hand-side columns). Both differences are statistically significant at the 1% level.
Consistent with increased taxation of dividends, dividends decrease after the reform in both groups. The ultimate payouts anddividend yield levels in 2005 are indifferent between the two groups (payouts of 0.66 and 0.59 in the restricted group, dividendyields of 3.54% versus 3.97%).
Prior to the reform, share repurchases are more common in firms dominated by owners who are not affected by the reform.That group includes foreign owners, who, as mentioned above, were in a tax disadvantage regarding dividend income prior to thetaxation change. After the reform, share repurchases increase in both groups, and the mean levels of share repurchases becomemore closely aligned between the two groups.
s
9 The payment occurs in the subsequent year, so that for example Y2003 captures dividends paid in 2004. Accounting year 2002 is the omitted year, serving asthe base case.10 Recall the peak payouts for the year 2003, indicated in Fig. 2.
Table 3Descriptive statistics.
Full sample TAXED OWNERS<median TAXED OWNERS>median
Mean Std. dev. Mean Std. dev. Mean Std. dev.
Dividend yield 0.045 0.047 0.042 0.040 0.049 0.053PAY-OUT 1.417 2.526 1.507 2.745 1.327 2.289Share repurchases to total payable 0.008 0.047 0.012 0.063 0.004 0.023Dividends to total payable 0.175 0.376 0.167 0.441 0.184 0.299Dividend yield (ordinary dividend) 0.040 0.036 0.039 0.034 0.041 0.039Dividends to total payable (ordinary dividend) 0.158 0.355 0.156 0.431 0.159 0.258PAY-OUT (ordinary dividend) 1.329 2.462 1.431 2.665 1.226 2.242Lagged PAY-OUT 1.294 2.320 1.365 2.531 1.225 2.096TAXED OWNERS 0.546 0.367 0.213 0.156 0.880 0.152PAST RETURN 0.107 0.349 0.102 0.297 0.113 0.395SIZE 3.882 2.065 4.200 2.174 3.564 1.901MKT-TO-BOOK 2.089 4.243 1.643 2.671 2.536 5.342EBIT to Sales 0.062 0.551 0.042 0.590 0.081 0.510ROA 0.040 0.181 0.044 0.168 0.036 0.194ROE 0.140 2.108 0.263 2.908 0.016 0.646FCF 0.173 0.495 0.182 0.532 0.164 0.456LEVERAGE 0.169 0.197 0.187 0.234 0.151 0.150FOREIGN OWN 0.177 0.213 0.237 0.238 0.118 0.165Dummy for negative EPS 0.225 0.418 0.202 0.403 0.248 0.433
The sample consists of firms traded on the Helsinki Stock Exchange (HEX) during the time period from 2003 to 2006. The full sample includes 524 firm-yearobservations. Bold numbers indicate a mean that is higher than that for the comparison group at the 90% confidence level or higher. See Table 2 for variabledefinitions.
578 T. Korkeamaki et al. / Journal of Corporate Finance 16 (2010) 572–587
5.1. Determinants of dividend payout
Next, we move to more rigorous analysis of the determinants of dividends, share repurchases and tax clientele ownershipstructure around the tax reform of 2004 with multiple regression models. We use the dividend Pay-Out Ratio (PAY-OUT), theShare Repurchases to Total Payable (REPURCHASES) and the proportion of tax-sensitive owners among the top 5 shareholders(TAXED OWNERS), as dependent variables in these models.
Studies of dividend payouts and cash distributions are often are based on Lintner's (1956) early work. Lintner's partialadjustment model builds on the assumptions that dividends convey signals about the firm's earnings, and that dividend payoutratios are sticky, with firms being reluctant to lower them. Consequently, managers consider future sustainability of the firm'searnings before altering the dividend policy. In the partial adjustmentmodel, the change in dividend is explained by prior dividendpayout and prior and current profitability. Both profitability and prior payout are expected to have a positive impact on the currentpayout. The constant term is also expected to have a positive sign, to reflect firms' reluctance to reduce dividends.
In our simplest regression specification in column (1) of Table 5, the lagged payout ratio and current and lagged ROA are theonly variables explaining the current payout ratio. In line with predictions of Lintner (1956), the dividend payout ratios arepositively related to prior payout ratios and prior and current profitability.
Firms' dividend payment behaviour in different countries may vary depending on factors such as accounting standards andpractices, and also the structure of the local financial markets. For example, Goergen et al. (2005) note that German conservativeaccounting practice may make cash flows a more meaningful determinant of dividend payouts than published earnings. Indeed,Andres et al. (2009) report findings from Germany that are consistent with that notion. Von Eije and Megginson (2008) also notethat earnings have a poor explanatory power on payouts in Europe. When we replace the ROA measures in column (1) of Table 5with a measure of free cash flow, we obtain virtually identical results to those reported in the table (results not reported). In latercolumns of Table 5, we, nevertheless, use free cash flow as an additional control variable.
In order to analyze the effects of the Finnish tax law change, we next include dummies for dividends paid out of profits foraccounting years of 2003 to 2005,9 the variable capturing the effect of the law change on the main owners (TAXED OWNERS), aswell as interaction variables for the pre-reform time period (TAXED OWNERS×Y2002 and TAXED OWNERS×Y2003). Ourexpectation is that firms pay higher dividends prior to the reform, and that the behaviour is stronger for firms whose shareholdersaremore affected by the law change (recall that the reformmade no investor group better off, but some investor groupsworse off).In particular, the interaction variable for year 2003 is interesting, as it captures the effect of ownership structure on “last minute”distributions prior to the new tax regulations coming into effect.10 The results are reported in column (2) of Table 5. The earningsmeasures and the lagged payout measure continue to exhibit positive and significant signs. The column also indicates a reductionin dividend payouts in the time period after the regulatory change, with the dummy for 2004 entering with a negative and
11 Our FCF measure is calculated as (EBIT+depreciation & amortization)/Sales. Use of an alternative measure that also captures changes in working capital andinvestments deteriorates the sample size severely (from 464 to 231) due to data limitations. However, the results within that limited sample are similar to thosereported in Table 4.
Table 4Payouts in two ownership categories.
Panel A. Dividend pay-out, full sample Dividend pay-out, pay-out<8
TAXED OWNERS<30% TAXED OWNERS>30% TAXED OWNERS<30% TAXED OWNERS>30%
2002 Mean 1.5175 1.3988 0.6475 0.9364Median 0.5000 0.7500*** 0.4531 0.7333***St. dev. 2.8766 2.2764 0.8915 1.1076N 43 98 39 93
2003 Mean 2.0897 2.2921 0.6326 1.2167***Median 0.5128 1.2903*** 0.4967 1.0722***St. dev. 3.4929 3.112 0.6996 1.2571N 45 89 38 78
2004 Mean 0.6817 0.8518 0.4699 0.6314Median 0.4112 0.4962 0.4070 0.4848St. dev. 1.5466 1.5617 0.6184 0.6387N 45 85 44 83
2005 Mean 1.2651 1.1052 0.6557 0.5896Median 0.458 0.5128 0.4514 0.4898St. dev. 2.5033 2.2279 0.9402 0.576N 46 73 43 69
Panel B. Dividend yield Share repurchases to total payable
TAXED OWNERS<30% TAXED OWNERS>30% TAXED OWNERS<30% TAXED OWNERS>30%
2002 Mean 0.037 0.0557** 0.0084* 0.0015*Median 0.0398 0.0463 0.0000 0.0000St. dev. 0.0365 0.0596 0.0308 0.013N 43 98 43 98
2003 Mean 0.0403 0.0637** 0.0101* 0.0021*Median 0.0342 0.0548*** 0.0000 0.0000St. dev. 0.0409 0.0589 0.0418 0.0096N 45 89 45 89
2004 Mean 0.0279 0.0410** 0.0206 0.0112Median 0.0300 0.0380** 0.0000 0.0000St. dev. 0.0235 0.0357 0.1166 0.0509N 45 85 45 85
2005 Mean 0.0354 0.0397 0.0120 0.0081Median 0.0332 0.0336 0.0000 0.0000St. dev. 0.0322 0.0408 0.0466 0.0381N 46 73 46 73
This table displays annual descriptive statistics for dividend payouts both with and without extreme observations (payout>8). Each measure is reported for twotypes of firms: companies where the owners affected by the tax reform own less than 30% of the total amount of shares owned by the 5 largest shareholders, andfirms where that ownership category owns more than 30%. The sample focuses on firm payouts referring to accounting years of 2002 to 2005, and consists of firmtraded on the Helsinki Stock Exchange (HEX). The difference between the two ownership groups is tested using a bootstrapped t-test for means and amedians tesfor medians, with ***, **, * indicating statistical significance at the 1%, 5%, and 10% levels, respectively.
579T. Korkeamaki et al. / Journal of Corporate Finance 16 (2010) 572–587
st
significant sign. Firms with tax-sensitive owners pay higher dividends prior to the reform, as indicated by the positive andsignificant coefficient for the interaction variable capturing payout behaviour for firms with more tax-sensitive owners in 2003.
In column (3) of Table 5, we further include a number of firm-specific control variables. A motive for a firm to signal withdividends is expected to be stronger if the firm is perceived by insiders to be undervalued. We include the stock return for the pastsix months (PAST RETURN), and the market-to-book ratio (MKT-TO-BOOK) to control for this potential effect on payouts. Firmswith high free cash flow may have an incentive to offer higher dividend payouts to reduce their agency problems (Jensen, 1986),which is why we include free cash flow (FCF) as a control variable.11 The foreign ownership variable (FOREIGN OWN) is set tocapture effects of a differential treatment of foreign owners, reported by Liljeblom and Pasternack (2006). Foreign owners faced a15%withholding tax on dividends during our sample period, whichmade them an investor category with a reduced preference fordividends prior to the reform. Larger, more mature firms may have more permanent payout policies, and also smaller growthopportunities, which motivate us to include the natural logarithm of sales (SIZE) as a control variable. Finally, high financialleverage may reduce dividends for firms that are financially constrained, or alternatively indicate higher payouts for firms withlow cash flow volatility, as they may be able to both carry a heavier debt load and sustain higher dividend payouts. To control forboth of these effects, we include leverage (LEVERAGE) in our regression models.
The results of our full model in column (3) of Table 5 indicate that the added control variables do not affect our earlier findings.In this specification, the ownership variables gain some strength. The interaction variable for tax-affected owners in 2003 is now
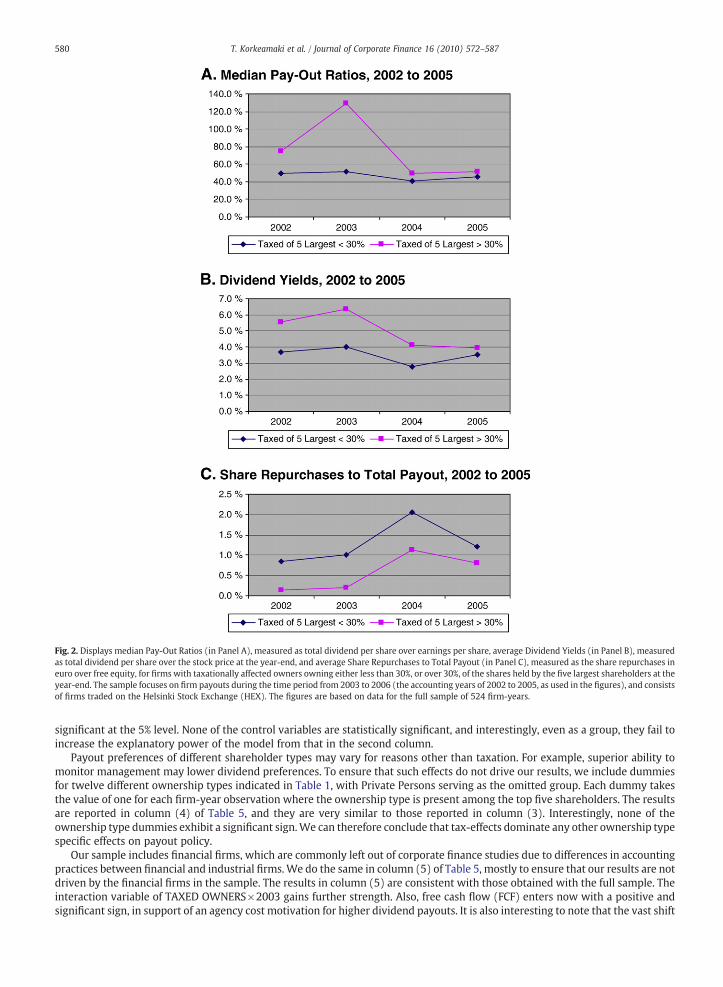
Fig. 2. Displays median Pay-Out Ratios (in Panel A), measured as total dividend per share over earnings per share, average Dividend Yields (in Panel B), measuredas total dividend per share over the stock price at the year-end, and average Share Repurchases to Total Payout (in Panel C), measured as the share repurchases ineuro over free equity, for firms with taxationally affected owners owning either less than 30%, or over 30%, of the shares held by the five largest shareholders at theyear-end. The sample focuses on firm payouts during the time period from 2003 to 2006 (the accounting years of 2002 to 2005, as used in the figures), and consistsof firms traded on the Helsinki Stock Exchange (HEX). The figures are based on data for the full sample of 524 firm-years.
580 T. Korkeamaki et al. / Journal of Corporate Finance 16 (2010) 572–587
significant at the 5% level. None of the control variables are statistically significant, and interestingly, even as a group, they fail toincrease the explanatory power of the model from that in the second column.
Payout preferences of different shareholder types may vary for reasons other than taxation. For example, superior ability tomonitor management may lower dividend preferences. To ensure that such effects do not drive our results, we include dummiesfor twelve different ownership types indicated in Table 1, with Private Persons serving as the omitted group. Each dummy takesthe value of one for each firm-year observation where the ownership type is present among the top five shareholders. The resultsare reported in column (4) of Table 5, and they are very similar to those reported in column (3). Interestingly, none of theownership type dummies exhibit a significant sign.We can therefore conclude that tax-effects dominate any other ownership typespecific effects on payout policy.
Our sample includes financial firms, which are commonly left out of corporate finance studies due to differences in accountingpractices between financial and industrial firms.We do the same in column (5) of Table 5, mostly to ensure that our results are notdriven by the financial firms in the sample. The results in column (5) are consistent with those obtained with the full sample. Theinteraction variable of TAXED OWNERS×2003 gains further strength. Also, free cash flow (FCF) enters now with a positive andsignificant sign, in support of an agency cost motivation for higher dividend payouts. It is also interesting to note that the vast shift
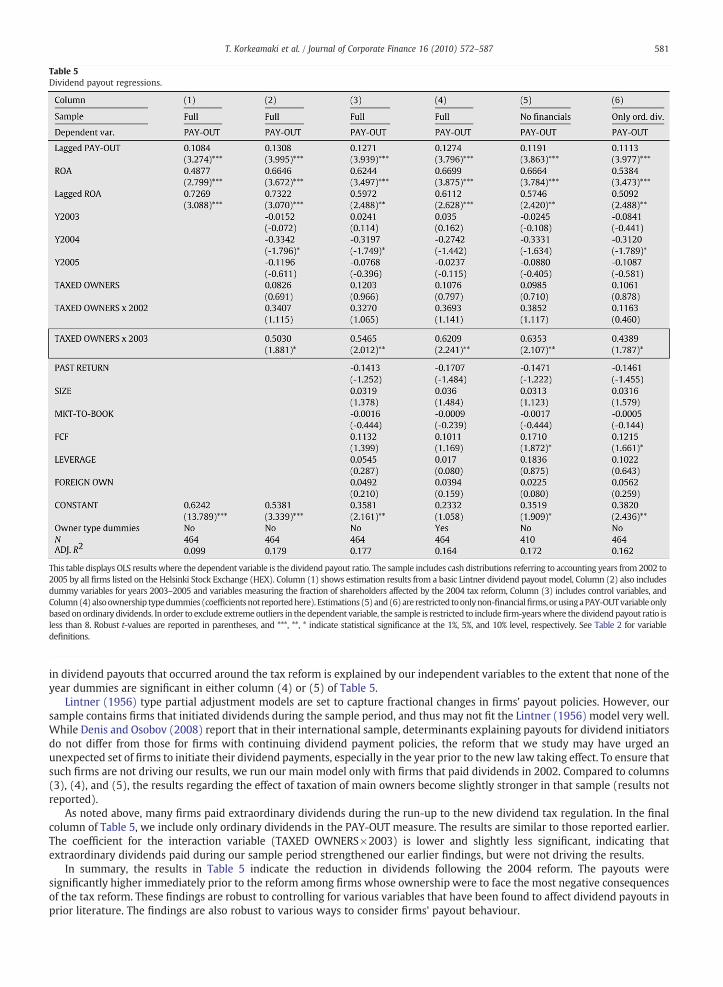
Table 5Dividend payout regressions.
This table displays OLS results where the dependent variable is the dividend payout ratio. The sample includes cash distributions referring to accounting years from 2002 to2005 by all firms listed on the Helsinki Stock Exchange (HEX). Column (1) shows estimation results from a basic Lintner dividend payout model, Column (2) also includesdummy variables for years 2003–2005 and variables measuring the fraction of shareholders affected by the 2004 tax reform, Column (3) includes control variables, andColumn(4)alsoownership typedummies (coefficientsnot reportedhere).Estimations (5)and(6)are restricted toonlynon-financialfirms,orusingaPAY-OUTvariableonlybased onordinary dividends. In order to exclude extremeoutliers in the dependent variable, the sample is restricted to includefirm-yearswhere the dividendpayout ratio isless than 8. Robust t-values are reported in parentheses, and ***, **, * indicate statistical significance at the 1%, 5%, and 10% level, respectively. See Table 2 for variabledefinitions.
581T. Korkeamaki et al. / Journal of Corporate Finance 16 (2010) 572–587
in dividend payouts that occurred around the tax reform is explained by our independent variables to the extent that none of theyear dummies are significant in either column (4) or (5) of Table 5.
Lintner (1956) type partial adjustment models are set to capture fractional changes in firms' payout policies. However, oursample contains firms that initiated dividends during the sample period, and thus may not fit the Lintner (1956) model very well.While Denis and Osobov (2008) report that in their international sample, determinants explaining payouts for dividend initiatorsdo not differ from those for firms with continuing dividend payment policies, the reform that we study may have urged anunexpected set of firms to initiate their dividend payments, especially in the year prior to the new law taking effect. To ensure thatsuch firms are not driving our results, we run our main model only with firms that paid dividends in 2002. Compared to columns(3), (4), and (5), the results regarding the effect of taxation of main owners become slightly stronger in that sample (results notreported).
As noted above, many firms paid extraordinary dividends during the run-up to the new dividend tax regulation. In the finalcolumn of Table 5, we include only ordinary dividends in the PAY-OUT measure. The results are similar to those reported earlier.The coefficient for the interaction variable (TAXED OWNERS×2003) is lower and slightly less significant, indicating thatextraordinary dividends paid during our sample period strengthened our earlier findings, but were not driving the results.
In summary, the results in Table 5 indicate the reduction in dividends following the 2004 reform. The payouts weresignificantly higher immediately prior to the reform among firms whose ownership were to face the most negative consequencesof the tax reform. These findings are robust to controlling for various variables that have been found to affect dividend payouts inprior literature. The findings are also robust to various ways to consider firms' payout behaviour.
582 T. Korkeamaki et al. / Journal of Corporate Finance 16 (2010) 572–587
5.2. Results for share repurchases
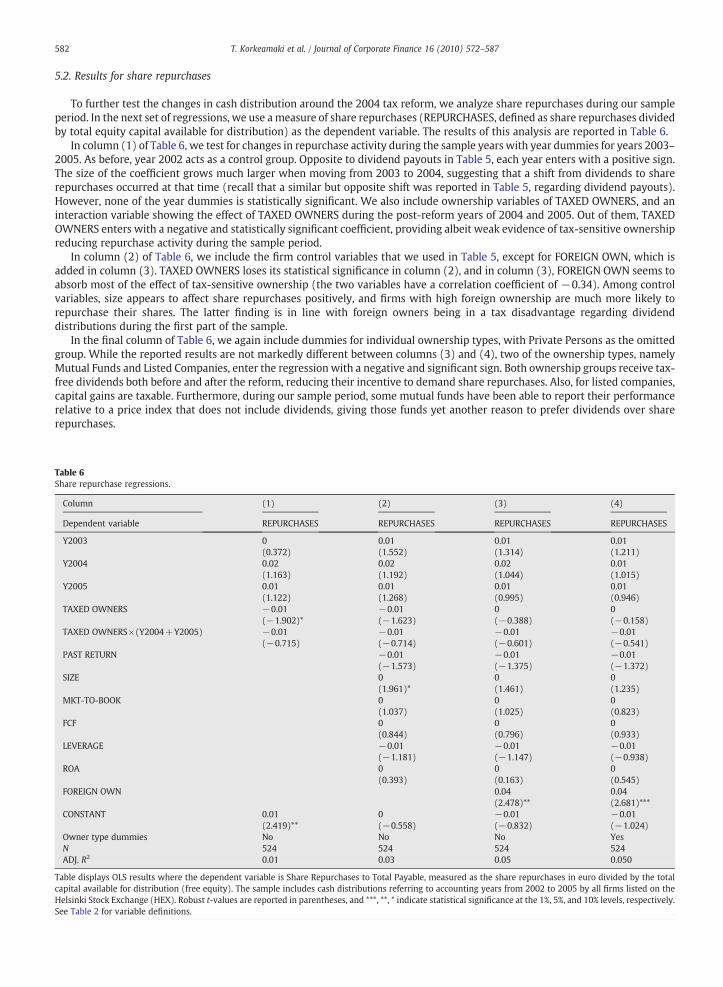
To further test the changes in cash distribution around the 2004 tax reform, we analyze share repurchases during our sampleperiod. In the next set of regressions, we use a measure of share repurchases (REPURCHASES, defined as share repurchases dividedby total equity capital available for distribution) as the dependent variable. The results of this analysis are reported in Table 6.
In column (1) of Table 6, we test for changes in repurchase activity during the sample years with year dummies for years 2003–2005. As before, year 2002 acts as a control group. Opposite to dividend payouts in Table 5, each year enters with a positive sign.The size of the coefficient grows much larger when moving from 2003 to 2004, suggesting that a shift from dividends to sharerepurchases occurred at that time (recall that a similar but opposite shift was reported in Table 5, regarding dividend payouts).However, none of the year dummies is statistically significant. We also include ownership variables of TAXED OWNERS, and aninteraction variable showing the effect of TAXED OWNERS during the post-reform years of 2004 and 2005. Out of them, TAXEDOWNERS enters with a negative and statistically significant coefficient, providing albeit weak evidence of tax-sensitive ownershipreducing repurchase activity during the sample period.
In column (2) of Table 6, we include the firm control variables that we used in Table 5, except for FOREIGN OWN, which isadded in column (3). TAXED OWNERS loses its statistical significance in column (2), and in column (3), FOREIGN OWN seems toabsorb most of the effect of tax-sensitive ownership (the two variables have a correlation coefficient of −0.34). Among controlvariables, size appears to affect share repurchases positively, and firms with high foreign ownership are much more likely torepurchase their shares. The latter finding is in line with foreign owners being in a tax disadvantage regarding dividenddistributions during the first part of the sample.
In the final column of Table 6, we again include dummies for individual ownership types, with Private Persons as the omittedgroup. While the reported results are not markedly different between columns (3) and (4), two of the ownership types, namelyMutual Funds and Listed Companies, enter the regression with a negative and significant sign. Both ownership groups receive tax-free dividends both before and after the reform, reducing their incentive to demand share repurchases. Also, for listed companies,capital gains are taxable. Furthermore, during our sample period, some mutual funds have been able to report their performancerelative to a price index that does not include dividends, giving those funds yet another reason to prefer dividends over sharerepurchases.
Table 6Share repurchase regressions.
Column (1) (2) (3) (4)
Dependent variable REPURCHASES REPURCHASES REPURCHASES REPURCHASES
Y2003 0(0.372)
0.01(1.552)
0.01(1.314)
0.01(1.211)
Y2004 0.02(1.163)
0.02(1.192)
0.02(1.044)
0.01(1.015)
Y2005 0.01(1.122)
0.01(1.268)
0.01(0.995)
0.01(0.946)
TAXED OWNERS −0.01(−1.902)*
−0.01(−1.623)
0(−0.388)
0(−0.158)
TAXED OWNERS×(Y2004+Y2005) −0.01(−0.715)
−0.01(−0.714)
−0.01(−0.601)
−0.01(−0.541)
PAST RETURN −0.01(−1.573)
−0.01(−1.375)
−0.01(−1.372)
SIZE 0(1.961)*
0(1.461)
0(1.235)
MKT-TO-BOOK 0(1.037)
0(1.025)
0(0.823)
FCF 0(0.844)
0(0.796)
0(0.933)
LEVERAGE −0.01(−1.181)
−0.01(−1.147)
−0.01(−0.938)
ROA 0(0.393)
0(0.163)
0(0.545)
FOREIGN OWN 0.04(2.478)**
0.04(2.681)***
CONSTANT 0.01(2.419)**
0(−0.558)
−0.01(−0.832)
−0.01(−1.024)
Owner type dummies No No No YesN 524 524 524 524ADJ. R2 0.01 0.03 0.05 0.050
Table displays OLS results where the dependent variable is Share Repurchases to Total Payable, measured as the share repurchases in euro divided by the totalcapital available for distribution (free equity). The sample includes cash distributions referring to accounting years from 2002 to 2005 by all firms listed on theHelsinki Stock Exchange (HEX). Robust t-values are reported in parentheses, and ***, **, * indicate statistical significance at the 1%, 5%, and 10% levels, respectively.See Table 2 for variable definitions.
583T. Korkeamaki et al. / Journal of Corporate Finance 16 (2010) 572–587
5.3. Ownership and payouts
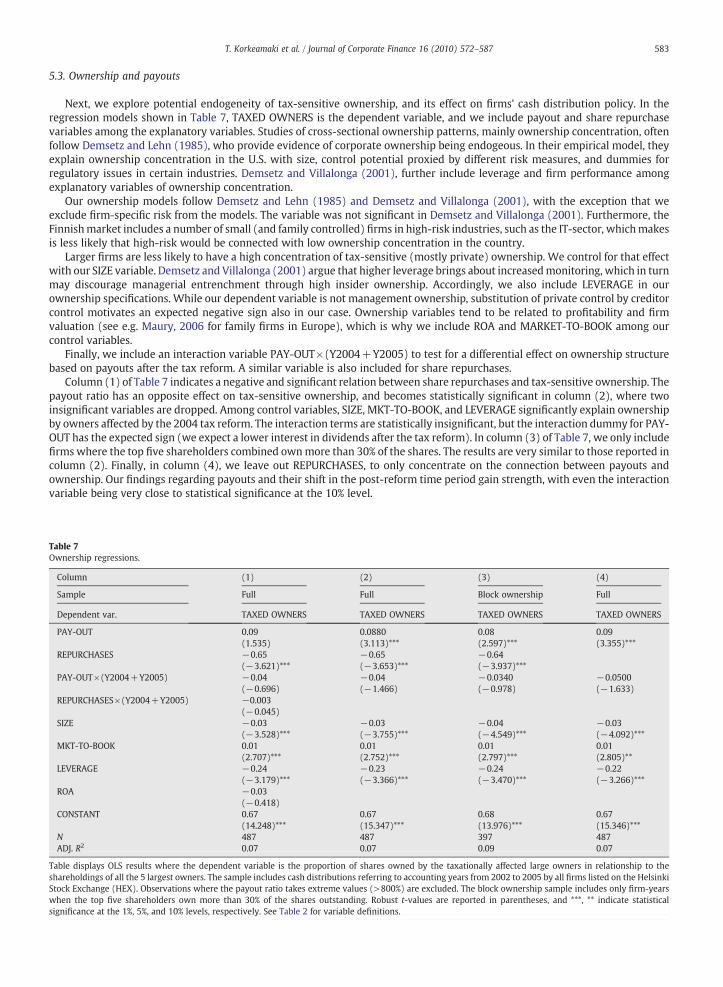
Next, we explore potential endogeneity of tax-sensitive ownership, and its effect on firms' cash distribution policy. In theregression models shown in Table 7, TAXED OWNERS is the dependent variable, and we include payout and share repurchasevariables among the explanatory variables. Studies of cross-sectional ownership patterns, mainly ownership concentration, oftenfollow Demsetz and Lehn (1985), who provide evidence of corporate ownership being endogeous. In their empirical model, theyexplain ownership concentration in the U.S. with size, control potential proxied by different risk measures, and dummies forregulatory issues in certain industries. Demsetz and Villalonga (2001), further include leverage and firm performance amongexplanatory variables of ownership concentration.
Our ownership models follow Demsetz and Lehn (1985) and Demsetz and Villalonga (2001), with the exception that weexclude firm-specific risk from the models. The variable was not significant in Demsetz and Villalonga (2001). Furthermore, theFinnishmarket includes a number of small (and family controlled) firms in high-risk industries, such as the IT-sector, whichmakesis less likely that high-risk would be connected with low ownership concentration in the country.
Larger firms are less likely to have a high concentration of tax-sensitive (mostly private) ownership. We control for that effectwith our SIZE variable. Demsetz and Villalonga (2001) argue that higher leverage brings about increasedmonitoring, which in turnmay discourage managerial entrenchment through high insider ownership. Accordingly, we also include LEVERAGE in ourownership specifications. While our dependent variable is not management ownership, substitution of private control by creditorcontrol motivates an expected negative sign also in our case. Ownership variables tend to be related to profitability and firmvaluation (see e.g. Maury, 2006 for family firms in Europe), which is why we include ROA and MARKET-TO-BOOK among ourcontrol variables.
Finally, we include an interaction variable PAY-OUT×(Y2004+Y2005) to test for a differential effect on ownership structurebased on payouts after the tax reform. A similar variable is also included for share repurchases.
Column (1) of Table 7 indicates a negative and significant relation between share repurchases and tax-sensitive ownership. Thepayout ratio has an opposite effect on tax-sensitive ownership, and becomes statistically significant in column (2), where twoinsignificant variables are dropped. Among control variables, SIZE, MKT-TO-BOOK, and LEVERAGE significantly explain ownershipby owners affected by the 2004 tax reform. The interaction terms are statistically insignificant, but the interaction dummy for PAY-OUT has the expected sign (we expect a lower interest in dividends after the tax reform). In column (3) of Table 7, we only includefirms where the top five shareholders combined ownmore than 30% of the shares. The results are very similar to those reported incolumn (2). Finally, in column (4), we leave out REPURCHASES, to only concentrate on the connection between payouts andownership. Our findings regarding payouts and their shift in the post-reform time period gain strength, with even the interactionvariable being very close to statistical significance at the 10% level.
Table 7Ownership regressions.
Column (1) (2) (3) (4)
Sample Full Full Block ownership Full
Dependent var. TAXED OWNERS TAXED OWNERS TAXED OWNERS TAXED OWNERS
PAY-OUT 0.09(1.535)
0.0880(3.113)***
0.08(2.597)***
0.09(3.355)***
REPURCHASES −0.65(−3.621)***
−0.65(−3.653)***
−0.64(−3.937)***
PAY-OUT×(Y2004+Y2005) −0.04(−0.696)
−0.04(−1.466)
−0.0340(−0.978)
−0.0500(−1.633)
REPURCHASES×(Y2004+Y2005) −0.003(−0.045)
SIZE −0.03(−3.528)***
−0.03(−3.755)***
−0.04(−4.549)***
−0.03(−4.092)***
MKT-TO-BOOK 0.01(2.707)***
0.01(2.752)***
0.01(2.797)***
0.01(2.805)**
LEVERAGE −0.24(−3.179)***
−0.23(−3.366)***
−0.24(−3.470)***
−0.22(−3.266)***
ROA −0.03(−0.418)
CONSTANT 0.67(14.248)***
0.67(15.347)***
0.68(13.976)***
0.67(15.346)***
N 487 487 397 487ADJ. R2 0.07 0.07 0.09 0.07
Table displays OLS results where the dependent variable is the proportion of shares owned by the taxationally affected large owners in relationship to theshareholdings of all the 5 largest owners. The sample includes cash distributions referring to accounting years from 2002 to 2005 by all firms listed on the HelsinkiStock Exchange (HEX). Observations where the payout ratio takes extreme values (>800%) are excluded. The block ownership sample includes only firm-yearswhen the top five shareholders own more than 30% of the shares outstanding. Robust t-values are reported in parentheses, and ***, ** indicate statisticalsignificance at the 1%, 5%, and 10% levels, respectively. See Table 2 for variable definitions.
584 T. Korkeamaki et al. / Journal of Corporate Finance 16 (2010) 572–587
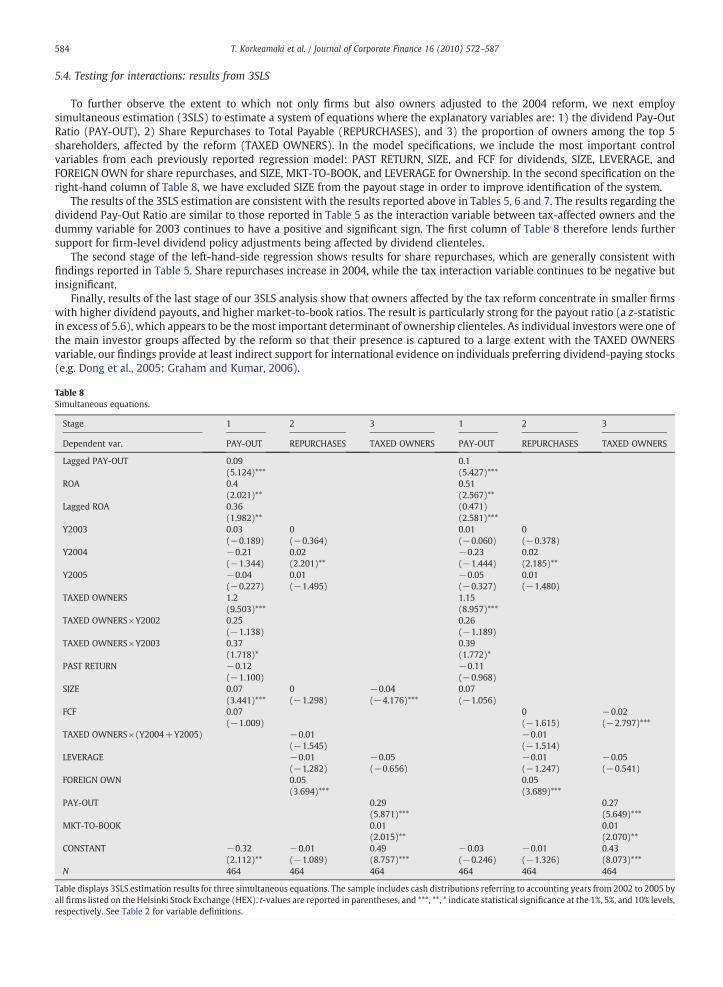
5.4. Testing for interactions: results from 3SLS
To further observe the extent to which not only firms but also owners adjusted to the 2004 reform, we next employsimultaneous estimation (3SLS) to estimate a system of equations where the explanatory variables are: 1) the dividend Pay-OutRatio (PAY-OUT), 2) Share Repurchases to Total Payable (REPURCHASES), and 3) the proportion of owners among the top 5shareholders, affected by the reform (TAXED OWNERS). In the model specifications, we include the most important controlvariables from each previously reported regression model: PAST RETURN, SIZE, and FCF for dividends, SIZE, LEVERAGE, andFOREIGN OWN for share repurchases, and SIZE, MKT-TO-BOOK, and LEVERAGE for Ownership. In the second specification on theright-hand column of Table 8, we have excluded SIZE from the payout stage in order to improve identification of the system.
The results of the 3SLS estimation are consistent with the results reported above in Tables 5, 6 and 7. The results regarding thedividend Pay-Out Ratio are similar to those reported in Table 5 as the interaction variable between tax-affected owners and thedummy variable for 2003 continues to have a positive and significant sign. The first column of Table 8 therefore lends furthersupport for firm-level dividend policy adjustments being affected by dividend clienteles.
The second stage of the left-hand-side regression shows results for share repurchases, which are generally consistent withfindings reported in Table 5. Share repurchases increase in 2004, while the tax interaction variable continues to be negative butinsignificant.
Finally, results of the last stage of our 3SLS analysis show that owners affected by the tax reform concentrate in smaller firmswith higher dividend payouts, and higher market-to-book ratios. The result is particularly strong for the payout ratio (a z-statisticin excess of 5.6), which appears to be the most important determinant of ownership clienteles. As individual investors were one ofthe main investor groups affected by the reform so that their presence is captured to a large extent with the TAXED OWNERSvariable, our findings provide at least indirect support for international evidence on individuals preferring dividend-paying stocks(e.g. Dong et al., 2005; Graham and Kumar, 2006).
Table 8Simultaneous equations.
Stage 1 2 3 1 2 3
Dependent var. PAY-OUT REPURCHASES TAXED OWNERS PAY-OUT REPURCHASES TAXED OWNERS
Lagged PAY-OUT 0.09(5.124)***
0.1(5.427)***
ROA 0.4(2.021)**
0.51(2.567)**
Lagged ROA 0.36(1.982)**
(0.471)(2.581)***
Y2003 0.03(−0.189)
0(−0.364)
0.01(−0.060)
0(−0.378)
Y2004 −0.21(−1.344)
0.02(2.201)**
−0.23(−1.444)
0.02(2.185)**
Y2005 −0.04(−0.227)
0.01(−1.495)
−0.05(−0.327)
0.01(−1.480)
TAXED OWNERS 1.2(9.503)***
1.15(8.957)***
TAXED OWNERS×Y2002 0.25(−1.138)
0.26(−1.189)
TAXED OWNERS×Y2003 0.37(1.718)*
0.39(1.772)*
PAST RETURN −0.12(−1.100)
−0.11(−0.968)
SIZE 0.07(3.441)***
0(−1.298)
−0.04(−4.176)***
0.07(−1.056)
FCF 0.07(−1.009)
0(−1.615)
−0.02(−2.797)***
TAXED OWNERS×(Y2004+Y2005) −0.01(−1.545)
−0.01(−1.514)
LEVERAGE −0.01(−1.282)
−0.05(−0.656)
−0.01(−1.247)
−0.05(−0.541)
FOREIGN OWN 0.05(3.694)***
0.05(3.689)***
PAY-OUT 0.29(5.871)***
0.27(5.649)***
MKT-TO-BOOK 0.01(2.015)**
0.01(2.070)**
CONSTANT −0.32(2.112)**
−0.01(−1.089)
0.49(8.757)***
−0.03(−0.246)
−0.01(−1.326)
0.43(8.073)***
N 464 464 464 464 464 464
Table displays 3SLS estimation results for three simultaneous equations. The sample includes cash distributions referring to accounting years from 2002 to 2005 byall firms listed on the Helsinki Stock Exchange (HEX). t-values are reported in parentheses, and ***, **, * indicate statistical significance at the 1%, 5%, and 10% levels,respectively. See Table 2 for variable definitions.
585T. Korkeamaki et al. / Journal of Corporate Finance 16 (2010) 572–587
In summary, the simultaneous analysis suggests that firms adjust dividends around the tax reform, taking into account the taxclienteles. Furthermore, payout policy appears to be an important determinant of ownership structure. The interaction betweenthese will be further studied in robustness tests in the next section.
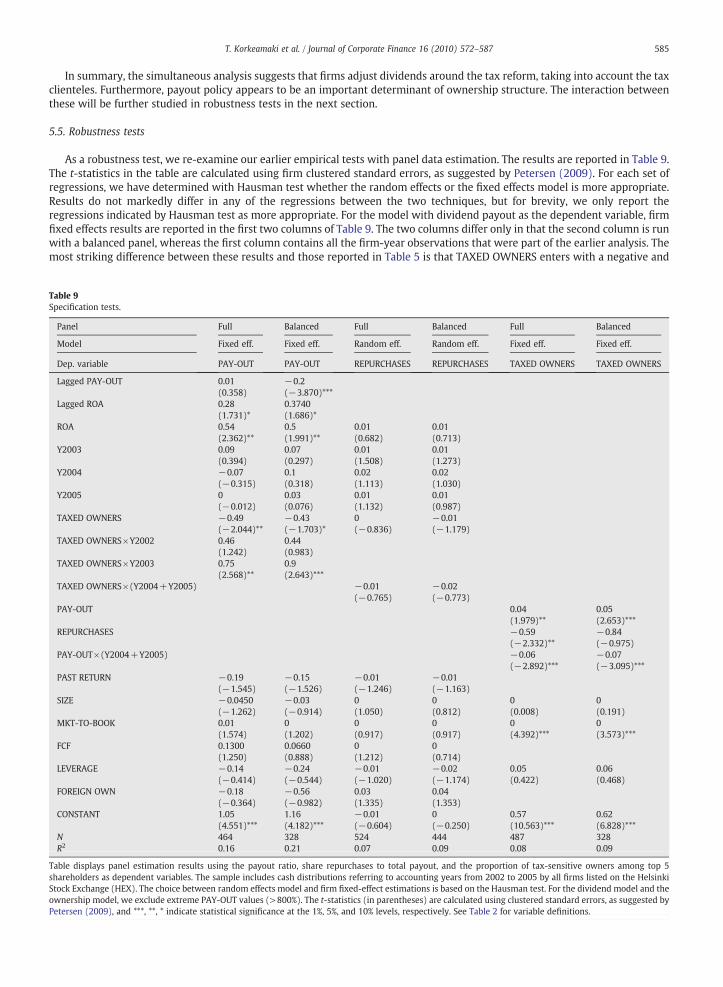
5.5. Robustness tests
As a robustness test, we re-examine our earlier empirical tests with panel data estimation. The results are reported in Table 9.The t-statistics in the table are calculated using firm clustered standard errors, as suggested by Petersen (2009). For each set ofregressions, we have determined with Hausman test whether the random effects or the fixed effects model is more appropriate.Results do not markedly differ in any of the regressions between the two techniques, but for brevity, we only report theregressions indicated by Hausman test as more appropriate. For the model with dividend payout as the dependent variable, firmfixed effects results are reported in the first two columns of Table 9. The two columns differ only in that the second column is runwith a balanced panel, whereas the first column contains all the firm-year observations that were part of the earlier analysis. Themost striking difference between these results and those reported in Table 5 is that TAXED OWNERS enters with a negative and
Table 9Specification tests.
Panel Full Balanced Full Balanced Full Balanced
Model Fixed eff. Fixed eff. Random eff. Random eff. Fixed eff. Fixed eff.
Dep. variable PAY-OUT PAY-OUT REPURCHASES REPURCHASES TAXED OWNERS TAXED OWNERS
Lagged PAY-OUT 0.01(0.358)
−0.2(−3.870)***
Lagged ROA 0.28(1.731)*
0.3740(1.686)*
ROA 0.54(2.362)**
0.5(1.991)**
0.01(0.682)
0.01(0.713)
Y2003 0.09(0.394)
0.07(0.297)
0.01(1.508)
0.01(1.273)
Y2004 −0.07(−0.315)
0.1(0.318)
0.02(1.113)
0.02(1.030)
Y2005 0(−0.012)
0.03(0.076)
0.01(1.132)
0.01(0.987)
TAXED OWNERS −0.49(−2.044)**
−0.43(−1.703)*
0(−0.836)
−0.01(−1.179)
TAXED OWNERS×Y2002 0.46(1.242)
0.44(0.983)
TAXED OWNERS×Y2003 0.75(2.568)**
0.9(2.643)***
TAXED OWNERS×(Y2004+Y2005) −0.01(−0.765)
−0.02(−0.773)
PAY-OUT 0.04(1.979)**
0.05(2.653)***
REPURCHASES −0.59(−2.332)**
−0.84(−0.975)
PAY-OUT×(Y2004+Y2005) −0.06(−2.892)***
−0.07(−3.095)***
PAST RETURN −0.19(−1.545)
−0.15(−1.526)
−0.01(−1.246)
−0.01(−1.163)
SIZE −0.0450(−1.262)
−0.03(−0.914)
0(1.050)
0(0.812)
0(0.008)
0(0.191)
MKT-TO-BOOK 0.01(1.574)
0(1.202)
0(0.917)
0(0.917)
0(4.392)***
0(3.573)***
FCF 0.1300(1.250)
0.0660(0.888)
0(1.212)
0(0.714)
LEVERAGE −0.14(−0.414)
−0.24(−0.544)
−0.01(−1.020)
−0.02(−1.174)
0.05(0.422)
0.06(0.468)
FOREIGN OWN −0.18(−0.364)
−0.56(−0.982)
0.03(1.335)
0.04(1.353)
CONSTANT 1.05(4.551)***
1.16(4.182)***
−0.01(−0.604)
0(−0.250)
0.57(10.563)***
0.62(6.828)***
N 464 328 524 444 487 328R2 0.16 0.21 0.07 0.09 0.08 0.09
Table displays panel estimation results using the payout ratio, share repurchases to total payout, and the proportion of tax-sensitive owners among top 5shareholders as dependent variables. The sample includes cash distributions referring to accounting years from 2002 to 2005 by all firms listed on the HelsinkStock Exchange (HEX). The choice between random effects model and firm fixed-effect estimations is based on the Hausman test. For the dividend model and theownership model, we exclude extreme PAY-OUT values (>800%). The t-statistics (in parentheses) are calculated using clustered standard errors, as suggested byPetersen (2009), and ***, **, * indicate statistical significance at the 1%, 5%, and 10% levels, respectively. See Table 2 for variable definitions.
i
586 T. Korkeamaki et al. / Journal of Corporate Finance 16 (2010) 572–587
significant sign. In other words, when both pre- and post-reform data is included and firm-specific effects are controlled for, tax-sensitivity of owners is inversely related to dividend payouts. This may be partially explained by the lowered preference fordividends among tax-affected owners after the reform. Namely, the indicator variables, especially that for year 2003, indicate thatin the pre-reform years, tax-sensitive ownership is having a positive effect on dividend payouts, which is consistent with ourearlier findings, and supports the hypothesis that firms with greater ownership share by shareholders who suffered from thereform distributed more cash in form of dividends during the run-up to the new law. There are no noticeable differences in resultsbetween the full data set and the balanced panel.
Hausman test indicates random effects as the more appropriate technique for the share repurchase model. In the third andfourth columns of Table 9, we report findings using that technique, again for both full sample and a balanced panel. The regressionfails to detect any statistically significant determinants of share repurchases, as none of our explanatory variables enters with asignificant coefficient. Even FOREIGN OWN, which has a positive and significant effect on share repurchases according to Table 6results, is no longer significant. These results suggest that other firm-variables may exist behind the observed share repurchasepatterns. Far fewer firms committed share repurchases than dividend payments during our sample years, which makes it difficultfor a cross-sectional regression model to detect statistical patterns behind the behaviour.
Finally, we estimate two firm fixed-effects models with TAXED OWNERSHIP as the dependent variable, in columns 5 and 6 ofTable 9. Both models indicate that the presence of tax-sensitive owners increases with high dividend payouts and decreases withhigh share repurchases (the latter finding is not statistically significant in the balanced panel, however). Furthermore, in the yearsafter the reform, payouts have a negative effect on ownership by investors whowere affected by the law change. The latter findingwas not statistically significant earlier in Table 7, but now offers added support for the connection between ownership structureand the tax treatment of dividends.
Overall, the results in Table 9 are very consistent with the findings reported earlier, suggesting that firm-level effects that arecontrolled for in the panel data estimation were not driving our earlier results. The connection between ownership structure anddividend payouts becomes only stronger in these tests.
5.6. Extraordinary dividends
We finally examine firms' probability to pay extraordinary dividends. In Finland, corporate dividends are typically paid inone annual payment. However, a firm can at an extraordinary general meeting, obtain a permission to payout a separate,extraordinary dividend. Recall that in Table 5, we considered ordinary dividend payouts separately from extraordinarydividends. In a given year, extraordinary dividends are rare in Finland. During our sample period, excluding the year 2003,extraordinary dividends were paid out in 19 firm-years out of a total sample of 524 (a probability of 3.6%). When year 2003 isincluded, the probability of extraordinary dividends jumps to 9.7%. The upcoming reform had a clear impact on extraordinarydividends. The percentage of firms paying extraordinary dividends in 2003 was thus 23.9%. Assuming that extraordinarydividend payment is a random event that follows a binomial distribution with the overall probability of 9.7% as the “successrate”, the probability of getting as many as 32 events out of 134 in 2003 is highly significant at the 1% level (with a p-value of0.0000).
Table 5 presented evidence of firms whose owners were affected by the tax reform altering their payout behaviour regardingregular dividends. In order to explore whether firms' extraordinary dividend payment behaviour was also driven by clienteleissues, we observe differences in the sub-samples of firms that paid extraordinary dividends in 2003 and firms that did not. Theaverage value for variable TAXED OWNERS is 67% for payees of extraordinary dividends, as compared to 53% for firms not payingextraordinary dividends. The difference between the averages is statistically significant at the one percent level (t=2.96). Weconclude that both ordinary dividend payouts and extraordinary dividend decisions were affected by the effect of the 2004 taxreform on firms' major shareholders.
6. Summary
Tax regime changes offer unique opportunities to study how firms as well as investors react. We provide evidence onchanges in dividend and share repurchase policies, as well as changes in large portfolio holdings, around a major dividendtax reform that occurred in Finland in 2004. The reform introduced double taxation of corporate income, as after it, 70% ofdividends are taxable income at the personal level. Among the five largest shareholders of each Finnish firm, on average 54%(25% of total equity) were affected adversely by the tax reform. We find that firms increased dividends during the last year ofthe old tax system, when dividends were still untaxed at the investor level. This behaviour was significantly more prevalentin firms where a higher percentage of ownership was in hands of shareholders who were negatively affected by the reform.After the reform, dividend payouts decline across all firms. We also find a significant increase in share repurchases after thereform.
We also explore the determinants of ownership, and ownership changes. Payout policy variables seem to affect ownershipstructure of Finnish firms, so that investor groups that were affected by the reform altered their holdings depending on dividendpayouts. However, while our evidence on firms' reaction to the tax reform is strong, we fail to find statistically significant evidenceof investors doing so.
587T. Korkeamaki et al. / Journal of Corporate Finance 16 (2010) 572–587
Acknowledgments
Authors wish to thank Steven Young, the participants at the 2009 EFMsymposium on Corporate Governance and Control atCambridge University and the participants of the 2009 EFM Annual Conference in Milan for helpful comments, and KennethJohansson for research assistance. Financial support from theAcademy of Finland is gratefully acknowledged.
References
Andres, C., Betzer, A., Goergen, M., Renneboog, L., 2009. Dividend policy of German firms. A panel data analysis of partial adjustment models. Journal of EmpiricalFinance 16, 175–187.
Baker, M., Wurgler, J., 2004. A catering theory of dividends. Journal of Finance 59, 1125–1165.Barca, F., Becht, M. (Eds.), 2001. The Control of Corporate Europe. Oxford University Press.Barclay, M.J., Holderness, C.G., Sheehan, D.P., 2009. Dividends and corporate shareholders, Review of Financial Studies 22, 2423–2455.Bell, L., Jenkinson, T., 2002. New evidence of the impact of dividend taxation and on the identity of the marginal investor. Journal of Finance 57, 1321–1346.Binay, M., 2001. Do Dividend Clienteles Exist? Institutional Investor Reaction to Dividend Events. University of Texas, Austin. Working paper.Blouin, J.L., Raedy, J.S., Schackelford, D.A., 2007. Did firms substitute dividends for share repurchases after the 2003 reductions in shareholder tax rates? NBER
working paper No. 13601.Brav, A., Graham, J.R., Harvey, C.R., Michaely, R., 2005. Payout policy in the 21st century. Journal of Financial Economics 77, 483–527.Brown, J.R., Liang, N., Weisbenner, S., 2007. Executive financial incentives and payout policy: firm responses to the 2003 dividend tax cut. Journal of Finance 62,
1935–1965.Chetty, R., Saez, E., 2005. Dividend taxes and corporate behavior: evidence from the 2003 dividend tax cut. Quarterly Journal of Economics 70, 791–833.Dahlquist, M., Robertsson, G., Rydqvist, K., 2006. Direct Evidence of Dividend Tax Clienteles. Stockholm Institute of Financial Research. Working paper.Demsetz, H., Lehn, K., 1985. The structure of corporate ownership: causes and consequences. Journal of Political Economy 93, 1155–1177.Demsetz, H., Villalonga, B., 2001. Ownership structure and corporate performance. Journal of Corporate Finance 7, 209–233.Denis, D.J., Osobov, I., 2008. Why do firms pay dividends? International evidence on the determinants of dividend policy. Journal of Financial Economics 89, 62–82.Desai, M.A., Jin, L., 2008. Institutional Tax Clienteles and Payout Policy. Harvard University. Working Paper.Dhaliwal, D., Erickson, M., Trezevant, R., 1999. A test of the theory of tax clienteles for dividend policies. National Tax Journal 52, 179–194.Dong, M., Robinson, C., Veld, C., 2005. Why individual investors want dividends. Journal of Corporate Finance 12, 121–158.Eades, K.M., Hess, P.J., Kim, E.H., 1984. On interpreting security returns during the ex-dividend period. Journal of Financial Economics 13, 3–34.Elton, E.J., Gruber, M.J., 1970. Marginal stockholder tax rates and the clientele effect. Review of Economics and Statistics 52, 68–74.Felixson, K., Liljeblom, E., 2008. Evidence of ex-dividend day trading by investor tax category. European Journal of Finance 14, 1–21.Goergen, M., Renneboog, L., Correia da Silva, L., 2005. When do German firms change their dividends? Journal of Corporate Finance 11, 375–399.Graham, J.R., Kumar, A., 2006. Do dividend clienteles exist? Evidence on dividend preferences of retail investors. Journal of Finance 61, 1305–1336.Graham, J.R., Michaely, R., Roberts, M.R., 2003. Do price discreteness and transaction costs affect stock returns? Comparing ex-dividend pricing before and after
decimalization. Journal of Finance 58, 2613–2637.Green, R.C., Rydqvist, K., 1999. Ex-day behavior with dividend preference and limitations to short-term arbitrage: the case of Swedish lottery bonds. Journal of
Financial Economics 53, 145–187.Grinstein, Y., Michaely, R., 2005. Institutional holdings and payout policy. Journal of Finance 60, 1389–1426.Grullon, G., Michaely, R., 2002. Dividends, share repurchases, and the substitution hypothesis. Journal of Finance 57, 1649–1684.Holmen, M., Knopf, J.D., Peterson, S., 2008. Inside shareholders' effective tax rates and dividends. Journal of Banking & Finance 32, 1860–1869.Jensen, M.C., 1986. Agency costs of free cash flow, corporate finance, and takeovers. American Economic Review 76, 323–329.Jin, L., 2006. Capital gain tax overhang and price pressure. Journal of Finance 61, 1399–1430.Kari, S., Karikallio, H., Pirttilä, J., 2008. Anticipating tax changes: evidence from the Finnish corporate income tax reform of 2005. Fiscal Studies 29 (2), 167–196.Kato, K., Lowenstein, U., 1995. The ex-dividend day behavior of stock prices: the case of Japan. Review of Financial Studies 8, 817–847.Koski, J., Scruggs, J.T., 1998. Who trades around the ex-dividend day? Evidence from NYSE audit file data. Financial Management 27, 58–72.Lakonishok, J., Vermaelen, T., 1986. Tax induced trading around ex-dividend days. Journal of Financial Economics 16, 287–319.Liljeblom, E., Pasternack, D., 2006. Stock repurchases, dividends, and executive options: the impact of dividend protection. European Financial Management 12,
7–28.Lintner, J., 1956. Distribution of incomes of corporations among dividends, retained earnings, and taxes. American Economic Review 46, 97–113.Maury, B., 2006. Family ownership and firm performance: empirical evidence from Western European corporations. Journal of Corporate Finance 12, 321–341.Michaely, R., Murgia, M., 1995. The effect of tax heterogeneity on prices and volume around the ex-dividend day: evidence from the Milan Stock Exchange. The
Review of Financial Studies 8, 369–399.Michaely, R., Vila, J.-L., 1996. Investors' heterogeneity, prices, and volume around the ex-dividend day. Journal of Financial and Quantitative Analysis 30, 171–198.Michaely, R., Thaler, R.H., Womack, K., 1995. Price reactions to dividend initiations and omissions: overreaction or drift? Journal of Finance 50, 573–608.Pérez-Gonzáles, F., 2003. Large Shareholders and Dividends: Evidence From U.S. Tax Reforms. Columbia University. Working paper.Petersen, M.A., 2009. Estimating standard errors in finance panel data sets: comparing approaches. Review of Financial Studies 22, 435–480.Pörssitieto-yearbooks 2002–2005, Kock, G., Tummavuoren Kirjapaino, Vantaa, Finland.Poterba, J., 2004. Taxation and corporate payout policy, NBER working paper 10321.Rantapuska, E., 2008. Ex-dividend day trading: who, how, and why? Evidence from the Finnish market. Journal of Financial Economics 88, 355–374.Renneboog, L., Trojanowski, G., 2005. Patterns in payout policy and payout channel choice of UK firms in the 1990s, TILEC discussion paper 2005-002, Tilburg
University.Richardson, G., Sefcik, S., Thompson, R., 1986. A test of dividend irrelevance using volume reactions to a change in dividend policy. Journal of Financial Economics
17, 313–333.Seida, J.A., 2001. Evidence of tax-clientele-related trading following dividend increases. Journal of the American Taxation Association 23, 1–21.von Eije, H., Megginson, W.L., 2008. Dividends and share repurchases in the European Union. Journal of Financial Economics 89, 347–374.