Embed Size (px)
Citation preview
Dividend Policy, Corporate Control and Tax Clienteles
The Case of Germany
Christian Andres, WHU – Otto Beisheim School of Management
André Betzer, University of Wuppertal
Marc Goergen, Cardiff Business School and European Corporate Governance
Institute (ECGI)
This Draft: April 2011
Abstract
This paper studies the impact of the concentration of control, the type of controlling
shareholder and the dividend tax preference of the controlling shareholder on dividend
policy for a panel of 220 German firms over 1984-2005. While the concentration of
control does not have an effect on the dividend payout, there is strong evidence that
the type of controlling shareholder matters as family controlled firms have high
dividend payouts whereas bank controlled firms have low dividend payouts.
However, there is no evidence that the dividend preference of the large shareholder
has an impact on the dividend decision.
JEL classification: G32, G35
Keywords: Dividend policy, payout policy, Lintner dividend model, tax clientele
effects, corporate governance
1
1. Introduction
There exists a vast body of empirical research on the dividend behaviour of US and
UK corporations. However, much less is known about the dividend policy of firms
based elsewhere. The literature is even sparser on the link between dividends and
control across the world. This is highly surprising given that theory predicts that there
should be such a link.
In addition to the absence of a large body of literature, the only two cross-country
studies on the link between dividend policy and control – La Porta et al. (2000) and
Faccio et al. (2001) – have both considerable limitations in terms of the measurement
of corporate control. While La Porta et al. (2000) use the quality of law which is
correlated with the average concentration of control in a country, they do not directly
measure corporate control at the level of the individual firm. In contrast, Faccio et al.
(2001) measure control at firm level. However, while they account for the fact that
control over a firm may be held indirectly, via e.g. pyramids of ownership, they make
the fairly strong assumption that any unlisted firm holding a stake in one of their
sample firms is family controlled. Hence, their study likely overestimates the
importance of family control in countries where other types of large shareholders also
hold control indirectly. Our study suggests that Germany is one of these countries. In
addition, neither study adjusts for the tax status of the controlling shareholder which
may also affect the dividend payout.
Our study purports to address these two limitations by investigating the impact of
actual ultimate control as well as the tax status of the controlling shareholder on the
dividend payout for the case of German firms during 1984-2005. Germany is a rich
laboratory for the study of the effects of control on dividends as there are sizeable
percentages of both firms with concentrated control in the hands of families, banks or
other corporations and firms that are widely held. In contrast, given the dispersion of
control in the UK and the US studies on those countries are typically only able to
analyse the impact of managerial and relatively small institutional stock holdings on
the dividend policy. In addition, our study also adjusts for country-specific
characteristics that are normally omitted in cross-country studies. These
2
characteristics include the existence of guaranteed dividends on preference stock, so
called ‘specially designated dividends’ and ‘control agreements’ that are frequently in
place in firms controlled by other firms. Hence, if there is a link between control and
dividend policy our study is well equipped to detect it.
While we find that the concentration of control as such does not have an impact on the
dividend payout, we find strong evidence that the type of controlling shareholder has
an influence on the dividend. In particular, our results suggest that firms controlled by
families have significantly higher dividend payouts while those controlled by banks
have lower payouts than all other firms. This result persists even if we adjust for the
tax status of the controlling shareholder. Surprisingly, family controlled firms pay
higher dividends even though families have a preference for capital gains rather than
dividends.
The paper is organised as follows. The next section reviews the literature on the link
between control and dividend policy, discusses the German tax system and develops
hypotheses on the impact of control, the type of controlling shareholder as well as the
tax status of the latter on the dividend payout. Section 3 focuses on sample and other
data issues as well as the measurement of control. The following section discusses the
descriptive analysis. Sections 5 and 6 are about the multivariate analysis, focusing on
the methodology and the estimation results, respectively. Finally, Section 7 concludes
the paper.
2. Literature Review and Hypotheses
This section reviews the theoretical and empirical literature on the relation between
dividend policy and ownership and control. Based on this review, we develop a series
of testable hypotheses about the impact on dividend policy of the concentration of
control, the type of controlling shareholder and the tax preference for dividends of the
controlling shareholder.
2.1 The concentration of control
The separation of ownership and control gives rise to an agency problem as the
interests of the agent (manager) may diverge from those of the principal (provider of
3
finance) (Jensen and Meckling 1976). A high dividend payout ratio is then one way of
mitigating the agency problem as it increases the likelihood that the firm has to raise
outside financing on a regular basis, thereby subjecting itself to outside monitoring
(Easterbrook 1984). According to Rozeff (1982), another way of reducing the agency
problem is the monitoring performed by a large shareholder. This monitoring is likely
to align the interests of the managers with those of the shareholders. Hence,
concentrated ownership and control may reduce the need for dividends. In support of
his prediction, Rozeff (1982) finds that firms have higher payout ratios when insiders
hold a lower fraction of the equity and/or there is a greater number of shareholders.
Several other studies (e.g. Crutchley and Hansen 1989, Dempsey and Laber 1992,
Moh’d , Perry and Rimbey 1995) provide evidence consistent with Rozeff’s
prediction.
Easterbrook (1984) theorises that high dividends are used as a self-disciplining
mechanism forcing the firm to raise outside equity, thereby facing the scrutiny of
outsiders such as financial analysts and journalists. Born and Rimbey (1993) find
support for this. Hence, concentrated control and high dividend payouts may be
alternative monitoring mechanisms. This leads us to our first hypothesis.
H1: There is a negative linear relationship between the dividend payout and the
concentration of control.
However, Morck et al. (1988) argue that, once control exceeds a certain threshold (the
point of entrenchment), the controlling shareholder will have uncontested control and
may be tempted to expropriate the minority shareholders. According to Schooley and
Barney (1994), beyond this threshold there may be a need again for high dividends. In
line with this argument, Schooley and Barney (1994), Hamid et al. (1995) and
Crutchley et al. (1999) test whether there is a non-linear relationship between
dividends and insider, i.e. management ownership. They find support for this in the
form of a convex relationship between insider ownership and dividend yields. While
the danger of minority shareholder expropriation is particularly severe in corporate
governance systems such as Germany given the significant number of firms that are
controlled by families or other large shareholders, Faccio et al. (2001) nevertheless
find evidence that Western European firms, where expropriation of minority

4
shareholders is more likely, pay higher dividends than other firms. All of the above
discussion suggests a non-linear relationship between control and the dividend payout
and leads us to our second hypothesis.
H2: The relationship between dividends and concentration of control is at first
downward sloping over some initial range of control and then upward sloping.
2.2 The type of controlling shareholder
Whereas the above two hypotheses refer to control without taking into consideration
the identity of the controlling shareholder, an emerging body of the literature deals
with the impact of various types of large shareholder on dividend policy (e.g., Gugler
2003, Perez-Gonzales 2003, and Barclay et al. 2008). Distinguishing between the
types of large shareholder may be important as different types are likely to provide
different degrees of monitoring. In particular, it is worth distinguishing between the
following three types of shareholder: families or individuals, banks and other
corporations.
A controlling stake in the hands of a family or individual rather than a corporation
may give rise to the expropriation of minority shareholders. Connelly et al. (2010)
review the empirical research on the influence of family shareholders on shareholder
value. They find empirical support for the prediction that family shareholders
expropriate minority shareholders. As a result, small shareholders may only be willing
to invest in firms controlled by families or individuals if they receive a higher
dividend payout. An alternative reason why firms controlled by families may pay
higher dividends is the family’s liquidity needs. Dividends are a way for the family to
generate “hard cash” without having to give up the control over their firm.
H3: Firms controlled by families pay higher dividends.
A second type of large shareholder is industrial and commercial corporations which in
turn have their own shareholders. Therefore, they may themselves be subject to
agency conflicts and be less effective monitors than other types of large shareholder.
Hence, for such firms there may be a need for high dividends.
H4: Firms controlled by other corporations have higher dividend payouts than firms
controlled by other types of large shareholder.

5
Accounting for control by banks is particularly appropriate given the alleged
corporate governance role played by banks in Germany. The traditional view
presented inter alia by Correia da Silva et al. (2004) is that long-term relationships
between firms and banks (in their role as creditors and owners of equity) alleviate
agency costs and asymmetries of information between outside investors and
managers. Hence, the need for costly dividends is likely to be lower in firms
controlled by banks.
However, the evidence as to the impact of bank monitoring and, in particular, the link
between bank control and firm value remains inconclusive. For example, Chirinko
and Elston (1996) do not find a robust positive effect of bank influence on
profitability. Furthermore, while their study is the only one that investigates the
impact of bank control on dividend policy, they do not find that bank influence has
any effect on dividend policy. In contrast, Cable (1985) finds a positive effect of bank
involvement on financial performance. Hence, the evidence as to the impact of banks
on dividends and performance is still out there. This leads us to our next hypothesis.
H5: Bank control is associated with lower dividend payouts.
Apart from their monitoring incentives, the types of large shareholder also differ in
terms of their tax preference for dividends as compared to capital gains. We shall
discuss the tax preference of the various types of shareholder in the following sub-
section.
2.3 The tax preference for dividends of the controlling shareholder
This sub-section describes the German tax system from 1977 until 2005 and
determines the tax preference for dividends of the various types of shareholder. It also
develops two hypotheses based on the tax status of family shareholders and corporate
shareholders.
Until the year 2000, Germany operated a split-rate corporate tax system under which
retained profits were taxed more heavily than distributed profits (see Table 1). From
1991 onwards, both retained and distributed profits were also subject to a so-called

6
‘solidarity surcharge’, which affected both tax rates equally.1 Still, there was an
additional tax on distributed profits (i.e., dividends): a 25 per cent withholding tax
was deducted at source from the dividends paid to shareholders. However, both the
corporate tax rate on distributed profits and the withholding tax (including the
‘solidarity surcharge’) could be fully claimed by shareholders as a tax credit against
their income tax liabilities. Hence, Germany operated a full imputation system of
taxation until 2001.
[INSERT TABLE 1 ABOUT HERE]
The 2001 tax reform replaced the imputation system by the so-called ‘half-income
system’ (‘Halbeinkünfteverfahren’). Retained profits and distributed dividends are no
longer taxed at different rates and now incur the same rate of 26.4 per cent (25% plus
the ‘solidarity surcharge’ of 5.5%, increasing the rate to 26.4%) at the corporate level.
Formally, a gross dividend of Deutsch Mark (DM) 1 (including the tax credit received
for corporate tax (plus the ‘solidarity surcharge’) on distributed earnings) was worth
(1-ts) - tstss to an individual shareholder, where ts stands for the shareholder’s income
tax rate and tss for the ‘solidarity surcharge’. The tax discrimination variable (for the
period prior to 2001), measuring the preference of dividends over capital gains, is
equal to:
( )
( )( ) ( )( )1
1 1
s s ss
r r ss g g ss
t t tTAX
t t t t t t
− −=
− − − − (1)
where tr stands for the corporate tax on retained earnings, and tg for the capital gains
tax rate. A shareholder has a preference for dividends over capital gains if the tax
discrimination variable TAX exceeds 1.
In what follows we examine the tax status of three types of large shareholder: (i)
individuals (ii) corporations (i.e., industrial and commercial firms, as well as banks
1 The ‘solidarity surcharge’ (‘Solidaritätszuschlag’) is a surcharge on corporate and personal earnings
and was introduced in order to meet the costs of the German reunification. The surcharge is currently
5.5 per cent.

7
and insurance companies), and (iii) foreign investors. In addition, we also examine the
tax status of firms that are widely held.
(i) Individuals. The top tax rate on personal income (i.e., ts) in Germany varies from
48.5 per cent to 56 per cent during 1977 and 2005 (see Table 1). There is no personal
capital gains tax (i.e., tg = 0) provided that shares are held for a minimum period (i.e.,
6 months until 1998, and 12 months thereafter). If we assume that the shares are held
for at least one year, the tax discrimination variable reduces to:
( )( )( )1
1
s s ss
r r ss
t t tTAX
t t t
− −=
− − (2)
For shares held for less than the minimum period, the realized capital gains are added
to an individual’s taxable income. Thus, the tax preference for dividends compared to
capital gains depends on the marginal income tax bracket of the shareholder. Under
the imputation system (i.e. before 2001), we need to consider two categories of
individuals:
a. Individuals whose marginal income tax rate is lower than the corporate tax rate
on retained earnings and capital gains are not realized within 6 months (12
months after 1998). This type of investor prefers dividends over capital gains.
b. Individuals whose marginal income tax rate is above the corporate tax rate on
retained earnings have a tax preference for long-term capital gains.
Under the new system, one half of the dividend is taxed at 26.4 per cent as in previous
years, and the other half is now taxed twice, at the personal and corporate level.
Therefore, for individuals the effective tax rate exceeds the tax rate of 26.4 per cent
incurred on retained earnings (see Table 1). Since capital gains are still tax-exempt
(on stock held for more than 12 months), individuals prefer capital gains over
dividends even if they are in the lowest tax bracket.2 The tax discrimination variable
for individuals is now as follows:
( ) ( )( ) ( )
( )
1 1 0.5 1
1
d d ss d d ss s ss
r r ss
t t t t t t t tTAX
t t t
− − − − − +=
− −
(3)
2 The tax system changed again in 2009.

8
As controlling shareholders are wealthy individuals, their annual taxable income will
most likely exceed DM 102,000 (the threshold in place at the end of our sample
period). Consequently, domestic individuals are assumed to be taxed at the highest
income tax rate (for details see Table 1). Furthermore, we assume that individuals
hold their large share stakes for a long period of time (at least 12 months) such that
capital gains tax, tg, is zero. Plugging these values into equations (2) and (3), we
obtain that the tax discrimination variable (TAX) for this type of investor is always
below 1. Hence, individuals prefer long-term capital gains over dividends. This
discussion leads us to our first hypothesis on the effect of the tax status of the type of
large shareholder on dividend policy.
H6: Given the preference of families and individuals for capital gains, firms
controlled by families or individuals have lower dividend payouts.
(ii) Corporations. Before 2001, corporate investors (similar to individuals) received
the distributed dividend plus a credit which amounted to their corporate tax liability.
Consequently, when receiving the dividend, they did not pay any tax. However, the
dividend received increased their taxable income. Under the new system, dividend
payments to corporations were tax-free until 2004. However since 2004, 5 per cent of
the dividend payment have had to be declared as revenue and have therefore been
subject to corporate tax. Since capital gains from the sale of shares held in another
company are also tax-exempt under the new system, corporations are indifferent
between retained and distributed earnings between 2001 and 2004 with a slight
preference for capital gains thereafter.
In order to obtain the income tax rate ts for corporations, we need to make an
assumption on how profits in these (parent) firms are distributed. If all profits are
distributed as dividends by the corporate shareholder, the tax rate on distributed
earnings applies. In contrast, if all profits are retained, the corporation tax on retained
earnings, tr, is applicable (see Table 1 for details). We assume that the average firm
has a dividend payout ratio of 70 per cent, roughly equal to the percentage of
published earnings that German firms pay out as gross dividends (see Andres et al.
2009). Based on this assumption, the effective (weighted average) corporate tax rate
for a firm is 42 per cent during the period up to 1989 [36%(70%)+56%(30%)].
9
Plugging these values into equation (1), we obtain a tax discrimination variable for
corporations that is always larger than 1 for the period 1984-2000. Thus, corporations
have a strong tax preference for dividends during that period. From 2001 onwards,
corporations are indifferent between capital gains and dividends. As dividends are
sticky (Lintner 1956), it makes sense to argue that the high dividend payouts fuelled
by corporations’ initial preference for dividends will not be reduced once corporations
become indifferent between dividends and capital gains.
H7: Firms controlled by corporations have higher dividend payouts than firms
controlled by individuals.
(iii) Foreign investors. As this type of investor is not entitled to a tax credit by the
German fiscal authorities, it may be subject to double taxation which includes
corporate tax on the earnings of the German firm and withholding tax on dividends as
well as income tax in the investor’s home country.3 Hence, the tax discrimination
variable for foreign investors is:
( )( )( ) ( )( )( )1 1 1 1gf sf
r r ss d d ssTAX t t t t t t t t= − − − < − − −
(4)
where tgf (tsf) stands for the tax rate on capital gains (income) in the foreign investor’s
home country and td stands for the corporate tax on distributed earnings. Thus, the
preference depends on the tax treatment by the investor’s home country and the
existence of double taxation treaties. As it is not feasible to determine the tax status of
each foreign investor in our sample firms, we ignore firm-year observations relating to
control by foreign investors in our regression analysis.
(iv) Widely held firms. As we do not have information on the individual shareholders
of these firms, we use an aggregate weighted average tax rate. The aggregate weights
are based on German surveys on share ownership (‘Gesamtwirtschaftliche
Finanzierungsrechnung Deutsche Bundesbank’) and relate to the importance of
various types of shareholder in the average listed German firm. For example in 1990,
17 per cent of all the shares listed on the German stock exchanges were owned by
individuals, 69 per cent by companies, and 14 per cent by foreign investors. We
3 The withholding tax of 25 per cent may be reduced by German double taxation treaties with other
countries.
10
assume that the tax discrimination variable for foreign investors is 1 and the tax
discrimination variables for corporations, local and federal government authorities,
banks, and insurers is 2.0. Given that the tax discrimination variable for individuals is
0.94 in 1990 (all computations are based on equation (1)), the aggregate weighted
average tax rate for widely held firms amounts to 1.68 (17%*0.94+69%*2.0+14%*1).
3. Sample and Definitions
3.1 Sample
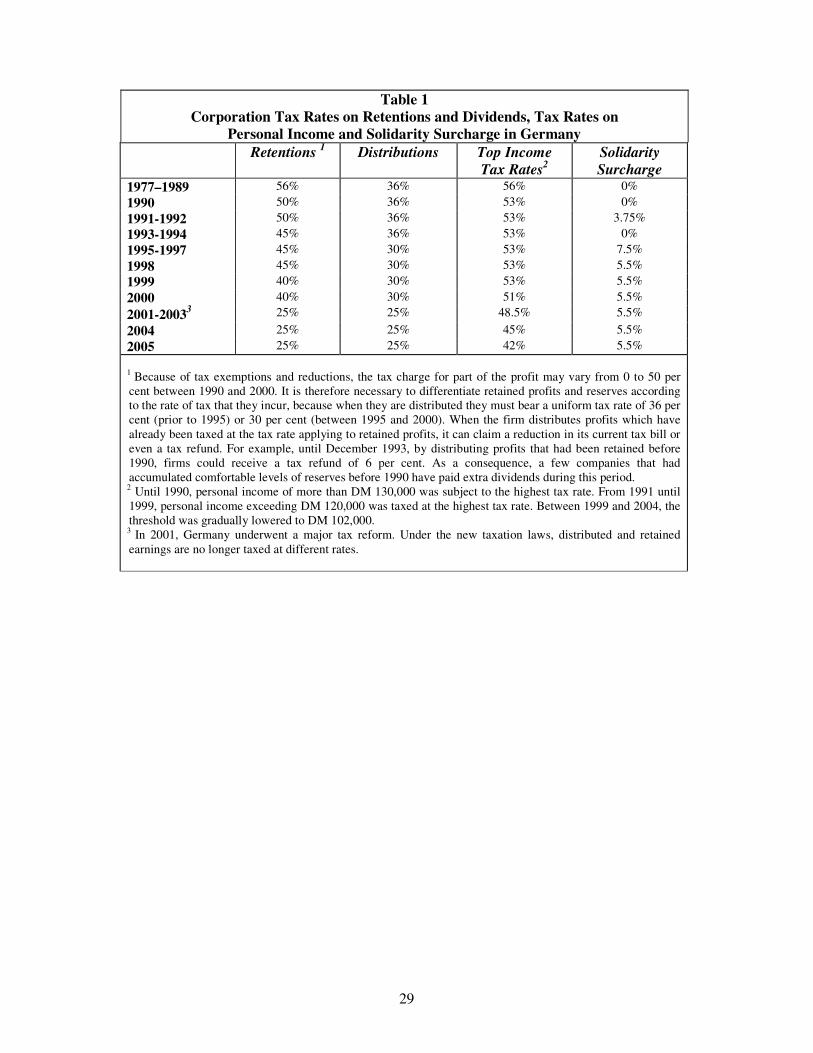
This study is based on a sample of 220 industrial and commercial firms over the
twenty-two-year period from 1984 to 2005. All firms are quoted on at least one of the
eight German stock exchanges. Thirty-six firms obtain a listing after the year 1984,
but all sample firms are quoted in 1989.4 Overall, the sample consists of an
unbalanced panel data of 3,932 firm-year observations (see Table 2).
[INSERT TABLE 2 ABOUT HERE]
Accounting data are collected from Saling/Hoppenstedt Aktienführer,5 an annual
publication which provides detailed company information, including balance sheet
and profit and loss account items, historical data on equity raised, shareholdings, share
prices, and the date of first quotation. The following data items are gathered from this
source: earnings after tax, depreciation, changes in pension provisions and other
provisions, dividends per share for both preference and ordinary shares, the number of
ordinary and preference shares outstanding, as well as information on ownership of
voting equity. The dividend-per-share figures are adjusted for stock splits.
3.2 Definitions and data issues
We use gross dividends, defined as cash dividends gross of corporation tax levied on
dividend distributions, in our analysis. About 25 per cent of our sample (58 cases out
of a total of 220) have preferred stock listed in at least one year during the period of
1984-2005. Preference shares in Germany do not grant any voting rights, but offer a
4 Thirty-six firms leave the stock market and go private, sixteen go bankrupt, thirty-eight are taken over
and twelve put in place a ‘control agreement’ during the period of analysis. 5 The name Saling Aktienführer changed to Hoppenstedt Aktienführer in 1997 with the publication of
the 90th edition of the guide.

11
guaranteed dividend (normally a fixed percentage of the face value of the share). If
the firm has sufficient earnings after tax, the holders of the preference shares will
receive their guaranteed dividend. If after the payment of the guaranteed dividend, the
firm still has earnings left, the holders of the ordinary shares will receive a (variable)
dividend. Earnings permitting, the holders of the preference shares will then receive
the equivalent amount paid to the ordinary shareholders, on top of the guaranteed
dividend. If the guaranteed dividend has been carried over twice, then the preference shares
receive a temporary voting right until the firm has paid the dividends outstanding. To
account for the dividends on preferred stock, we calculate a weighted average of the
dividend paid on ordinary and preference shares. The weights consist of the amount of
share capital issued in the form of preference shares and ordinary shares, respectively,
expressed as a proportion of the total market value of the total equity capital
outstanding.6
In contrast to our approach, UK and US studies typically ignore dividends other than
those paid on ordinary shares (see e.g., Bond et al. 1996, Edwards et al. 1986).
However contrary to UK firms which always have their ordinary shares listed, some
German firms only have their preference shares listed with all of the ordinary shares
being held by the main shareholder, typically a family. Still, even for Germany, one
may argue in favour of the exclusion of dividends on preferred equity, especially in
the context of our panel of data, given that the dividends per share for the two classes
of shares are perfectly correlated for virtually all of our sample firms. Indeed, for only
13 German firms (out of the 58 with preference shares) the change in the dividend per
ordinary share is different from that in the dividend per preference share.
Furthermore, differences are only observed in the case of dividend omissions and
dividend initiations, reflecting the fact that preference shares give rise to a guaranteed
dividend. While our data suggest that changes in the dividends earned on both types
of shares are highly correlated, we still opt for the inclusion of dividends on
6 Hence, the weighted average dividend per share is calculated as follows. Let NT be the total number
of shares outstanding, No the number of ordinary shares, and Np the number of preference shares. Thus,
NT = No+Np. Moreover, let DPSo be the dividend per share paid on ordinary shares, and DPSp the
dividend per share paid on preference shares. The weighted average dividend per share (WDPS) is then
equal to WDPS = (DPS0xN0+DPSpxNp)/NT.

12
preference shares. However, our results are qualitatively similar if dividends on
preference shares are excluded.
Another peculiarity of the German system is the high incidence of ‘specially
designated dividends’. We observe such special dividends for 343 of the 3,932 firm-
year observations, i.e. 9 per cent of the whole sample. These special dividends
predominantly reflect one-off payouts of excess cash to the shareholders. Brickley
(1983), who studies special dividends paid by US corporations, also finds that these
are motivated by the desire to return cash to the shareholders. For 44 firm-years, we
observe large one-off payments associated with ‘special anniversaries’, sales of
subsidiaries, or distributions of reserves previously accumulated at a different rate of
taxation. The fundamental problem with these large payments is one of timing as it is
not clear which accounting year(s) these payments should be allocated to. As we do
not have enough information allowing us to allocate these payments to specific
accounting years, we decide to exclude these payments.
Finally, some quoted German companies have so called ‘control agreements’ with
their parent company. There are two such types of agreements: a Profit and Loss
Agreement (PLA) and a Subordination of Management Agreement (SMA).7 An SMA
requires the controlling company to absorb any losses, but the transfer of profits is
optional. A PLA implies a transfer of both profits and losses to the controlling
company. Hence, the question arises as to whether companies with such agreements
should be included in this study. We decide to exclude these firms from our analysis
for two reasons. First, the main benefit from these control contracts for the parent is to
carry forward possible tax losses generated by the subsidiary. The parent can then
absorb these losses and offset them against its profits in order to reduce its tax bill.
Indeed, in Germany as well as the UK, but not the USA, the corporate tax liability is
based on the earnings of the individual companies in the group. Hence, the amount
transferred to the parent company is not a dividend as such, but rather the result from
the effort to reduce the tax liability of the parent company. Second, the financial
statements for firms with such agreements often do not provide any information on
7 Both agreements require the approval of at least 75 per cent of the voting capital represented at the
general meetings of both the controlling company and the subsidiary. Note that the existence of a
controlling shareholder does not necessarily imply the existence of either PLA or SMA.

13
their profit and, instead, disclose the amount (which may be positive or negative) that
is transferred to the parent company as well as the dividend per share paid to the
minority shareholders of the controlled company. One way of dealing with this data
issue is to use consolidated accounts. If the parent firm is publicly quoted, the
transfers from the quoted subsidiary to its parent company will be reflected in the
parent firm’s financial statements, and therefore these subsidiaries will be included,
albeit indirectly, in our sample. This is one reason why consolidated accounts are used
in this study.
The other reason why we use consolidated accounts is that in practice the dividend
policy of the parent company is determined by considering the annual consolidated
accounts. However, a problem arises from working with consolidated accounts as we
have 14 sample firms that are owned by other corporations which in turn are also in
our sample. Hence, there is some degree of double-counting in our data sample which
may bias our estimations. However, the size of these 14 firms is usually very small
compared to their parent companies and the bias created by the double counting is
therefore unlikely to be severe. A typical example is Renk AG, which is owned by
MAN AG during our sample period. The average market capitalization of Renk AG is
8 per cent of the market capitalization of the average sample firm, and only 3 per cent
of the market capitalization of MAN AG (which is 3 times as large as the average
listed firm).
To measure earnings, we use cash flow – defined as zero distribution profits gross of
depreciation and changes in provisions – divided by the number of shares outstanding
(including both ordinary and preference shares) at the end of the accounting year.8
Our use of cash flow rather than published earnings is in line with Andres et al. (2009)
who find that dividends of German firms move in line with the former, but not the
latter. Indeed, published earnings are subject to smoothing.
We gather information on all the disclosed holdings of voting shares over the period
of 1984 to 2005 from Saling/Hoppenstedt Aktienführer. Large shareholders
8 Behm and Zimmermann (1993) use ‘net profits’, a figure that is suggested by the German Financial
Analysts Association (DFA). However, data on net profits are not available for all firms in our sample
and, in any case, the figure is only reported if it is not negative.

14
controlling at least 25 per cent of the voting rights are classified into the following
eight categories: families or individuals, banks, industrial or commercial corporations,
insurance companies, local and federal government authorities, foreign investors,
industrial or financial holding companies, and foundations (Stiftungen). As previously
mentioned, an important feature of the German system of corporate governance is the
complexity of control structures.9 Quoted firms can be controlled by other
corporations and these, in turn, can be controlled by e.g. families or individuals,
banks, local or federal government authorities, or be widely held companies.
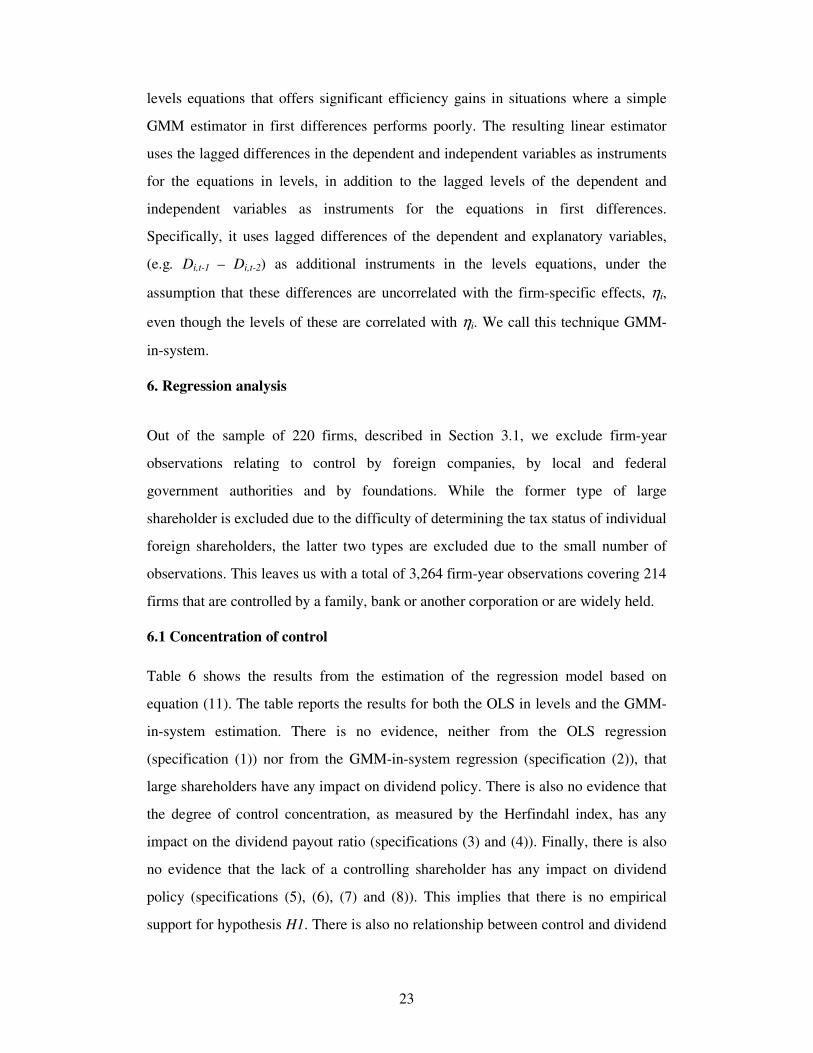
According to Franks and Mayer (2001), one of the main features of the German
capital market is the extensive use of complex shareholding structures such as
pyramids of ownership (see Figure 1).
[INSERT FIGURE 1 ABOUT HERE]
To account for the complexity of control structures in Germany, we collect data on
first-tier control as well as ultimate control. In Figure 1, at the first tier the controlling
shareholder of stock-exchange listed corporation A is corporation B. In turn,
corporation B is controlled by corporation C. As corporation C does not have a
controlling shareholder, control over corporation A ultimately resides with
corporation C. To complete the shareholder data from Saling/Hoppenstedt
Aktienführer, we also use Commerzbank - Wer gehört zu Wem, a guide that is
published every three years and which contains data on the shareholder structure of
roughly 11,000 of the larger German firms, i.e. those with equity capital of at least €
0.51 million (DM 1 million). This guide is particularly useful in cases where
companies at intermediate layers are privately held, and are therefore not covered by
Saling/Hoppenstedt Aktienführer. If there is no shareholder holding at least 25 per
cent of the voting shares of A, then A is said to be widely held. Conversely, the
ultimate controlling shareholder of a firm in our sample is said to be at the first tier if
the first-tier shareholder is a bank or insurance company, local or federal government
authorities, a foreign investor or a family. In all other cases, the ultimate shareholder
9 See e.g. Boehmer (2002), Becht and Boehmer (2001) and Franks and Mayer (2001). Franks et al. (2009) report
such complex control structures not only in Germany, but also France and Italy.

15
is located at a higher tier which is reached when one of these two criteria is satisfied
or when we find a corporation which is widely held. If we reach such a widely held
firm at a specific layer, we state that ultimate control lies with this corporation (and at
this layer). Figure 1 illustrates this point: we consider corporation C to be the ultimate
shareholder of corporation A. We can then claim that company C controls firm A
through a pyramid.
It is important to note that this procedure differs markedly from that of Faccio et al.
(2001) and Faccio and Lang (2002) in that we trace the ultimate controlling
shareholder of a firm even if one of the firms in the control chain is unlisted.
Conversely, both Faccio et al. (2001) and Faccio and Lang (2002) assume that all
unlisted firms in the control chain are family controlled, which may lead to
misclassifications. We thus agree with Franks et al. (2009, p.5) ‘that an analysis of
ultimate ownership of listed firms must take into account the true ownership
structures of private firms that are involved in controlling these listed firms’.
3.3 Measures of control
We measure both first-tier control and ultimate control. We also use two different
types of measures of control. The first type consists of three measures of the
concentration of control. First, we consider the proportion of voting shares owned by
the largest shareholder at the first or ultimate level (L1). A shareholder is considered to
be the largest shareholder if he has the highest percentage of voting rights and owns at
least 25 per cent of the votes. This shareholder may or may not be on the management
board (Vorstand) or supervisory board (Aufsichtsrat) of the firm. In the overwhelming
majority of listed German firms, the large shareholder sits on at least one of the two
boards. By law, at least fifty per cent of the supervisory board seats, including that of
the chairman, are reserved for the shareholder representatives. Goergen (1998)
analyses the management and supervisory board representation of 51 firms whose
main shareholder at the time of going public is a family. He finds that members of the
controlling family hold on average 17 per cent of the shareholder seats on the
supervisory board and almost half of the seats on the management board. Further, in
27.5 per cent of the companies, members of the family sit on both boards and in 88
per cent of the companies the family chairs at least one of the two boards. Gerum,

16
Steinmann and Fees (1988) and Franks and Mayer (2001) find similar patterns.
Second, we use the Herfindahl index (H) based on all the disclosed stakes of voting
shares at the first or ultimate level as a measure of the concentration of control.10
However, there is a data issue relating to the calculation of this index for the years
preceding 1995. Indeed, shareholders did not have to disclose shareholdings below 25
per cent until 1995 when the disclosure threshold was reduced to 5 per cent (“Zweites
Finanzförderungsgesetz”). Therefore, the Herfindahl index may be a noisy measure of
the concentration of control before 1995. However, although the disclosure threshold
before 1995 was 25 per cent, there was voluntary disclosure of some of the stakes
which fell below that threshold. Bearing in mind that our aim is to measure control, it
is highly unlikely for a shareholder to exercise any degree of control over his firm
while managing to remain unknown to the firm and the general public. However, as a
robustness check we also recalculate our Herfindahl index across the entire period of
study by ignoring any stakes below 25 per cent. We find that our results are not
affected by the exclusion of these stakes. Third, we use two dummy variables, WH1
and WH2, that equal one if there is no large shareholder holding at least 25 or 50 per
cent of the votes, respectively, at the first or ultimate level.
The second type of measure of control takes into account the type of large shareholder
(i.e. banks, families and other corporations).11
Bi,t-1 takes the value of the proportion of
votes held by the bank, if a bank is the largest shareholder of firm i at time t-1 with at
least 25 per cent of the voting shares, and is zero otherwise. Fi,t-1 and ICi,t-1 are the
equivalent variables measuring the percentage of votes held by families and
corporations, respectively.12
10
The index is defined as 2
ij
j
H s=∑ where sij is the stake of voting shares held by shareholder j in firm i.
11 As mentioned above, we exclude firms that are controlled by foreign investors from the regression analysis since
it is not possible to determine the tax status for each foreign investor in our sample firms. 12 The results do not change substantially when we use the proportion of the voting shares held by each type of
shareholder when they are the largest shareholders, irrespective of whether they hold more than 25% of the voting
rights or not.

17
4. Descriptive data analysis
4.1 Control
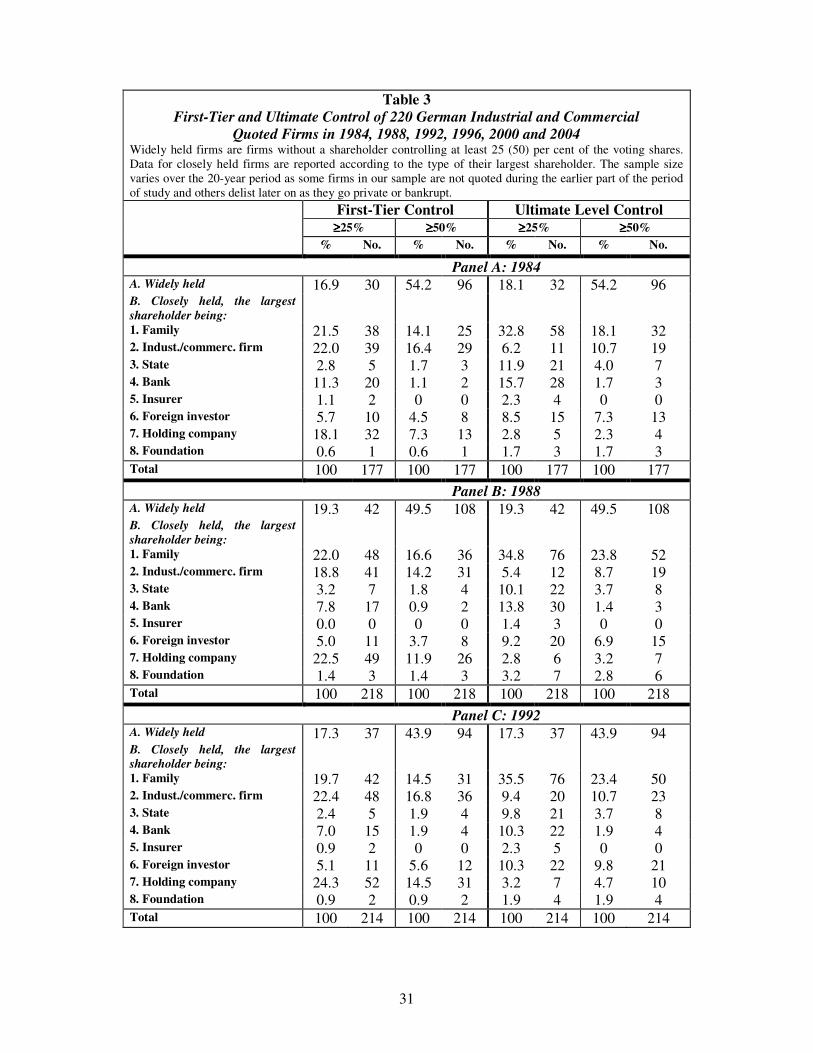
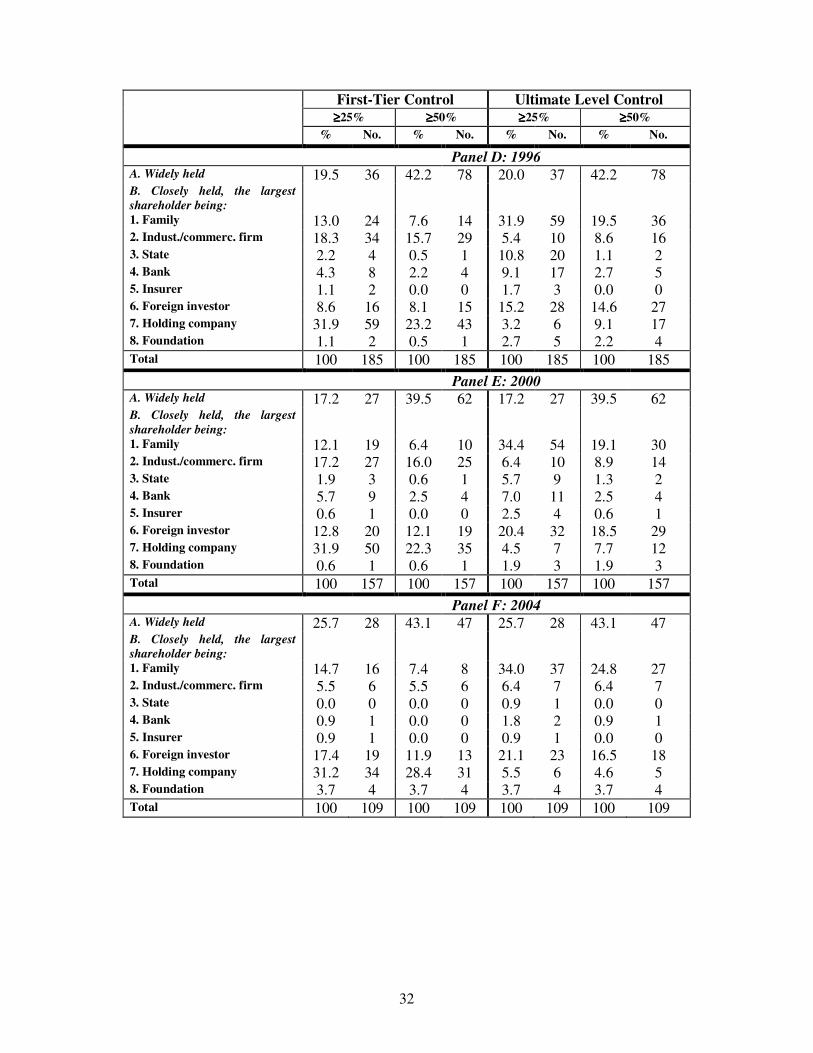
Table 3 reports first-tier control as well as ultimate control for the sample firms for
every fourth year over the period of 1984 to 2004. Both first-tier and ultimate control
are measured in two alternative ways: first as stakes exceeding 25 per cent of the
votes and, second, as majority stakes.
There are at least three important lessons to be learnt from Table 3. First, there is a
noticeable difference between the most important types of shareholder when first-tier
control is considered and when ultimate control is considered. For example, the first
three panels, Panels A, B and C, which report control for 1984, 1988 and 1992,
respectively, suggest that at the first tier families, industrial and commercial firms and
holding firms are the three most important types of shareholder, each holding a
blocking minority in roughly a fifth of the sample firms. When first-tier control is
defined as majority control, holding companies lose somewhat in importance, but they
are still among the three most important types of shareholder during 1984-1992.
However when the focus is on ultimate rather than first-tier control, families are by far
the most important type of shareholder and the other two types are dwarfed in
comparison. The increase in the importance of families as controlling shareholders
when control is measured at the ultimate tier suggests that families frequently hold
control indirectly – via intermediate holding companies or other industrial and
commercial companies – rather than directly. However, it would be over-simplistic to
assume that all unlisted holding companies and other industrial and commercial
companies are ultimately family controlled. Indeed, as e.g. Panel A suggests some of
the other types of shareholder also exercise control indirectly. One such type of
shareholder is banks. If control is measured at the ultimate level control by banks
increases by a factor of 1.2 (for 2000) and 2 (for 2004).
Second, while the importance of families as controlling shareholders remains constant
over the entire period of 1984 to 2004, the importance of other types of controlling
shareholder changes significantly. Types that lose in importance are local and federal
government authorities as well as banks which have been traditionally associated with
18
the German system of corporate governance. When control is measured at the ultimate
level local and federal government authorities and banks have control over 12% and
16% of the sample, respectively, in 1984. However, these percentages are reduced to
less than one per cent and less than 2 per cent in 2004. Dittmann et al. (2010) find a
similar decrease in bank control over time. The main cause for this decline is a change
in capital gains taxation in 2002 which reduced the tax liability caused by the sale of
stakes in other companies. In addition, the German government started a privatization
programme in the 1990s, reducing its stakes in public companies (in particular in
utility companies such as RWE, VEBA, and BEWAG). Conversely, foreign investors
have rapidly increased in importance as controlling shareholders, holding a majority
of the votes (a blocking minority) in about 7 per cent (9 per cent) of the sample at the
start of the period and 17 per cent (21 per cent) at the end of the period.
Third, there is also evidence that the percentage of widely held firms increased over
the period. However, given the selection criterion for our sample firms (firms had to
be listed in 1989) this increase may be entirely due to the increase in the size of the
firms during the period of study. Hence, it is difficult to draw any generally valid
conclusions from this pattern.
[INSERT TABLE 3 ABOUT HERE]
4.2 Dividends and control
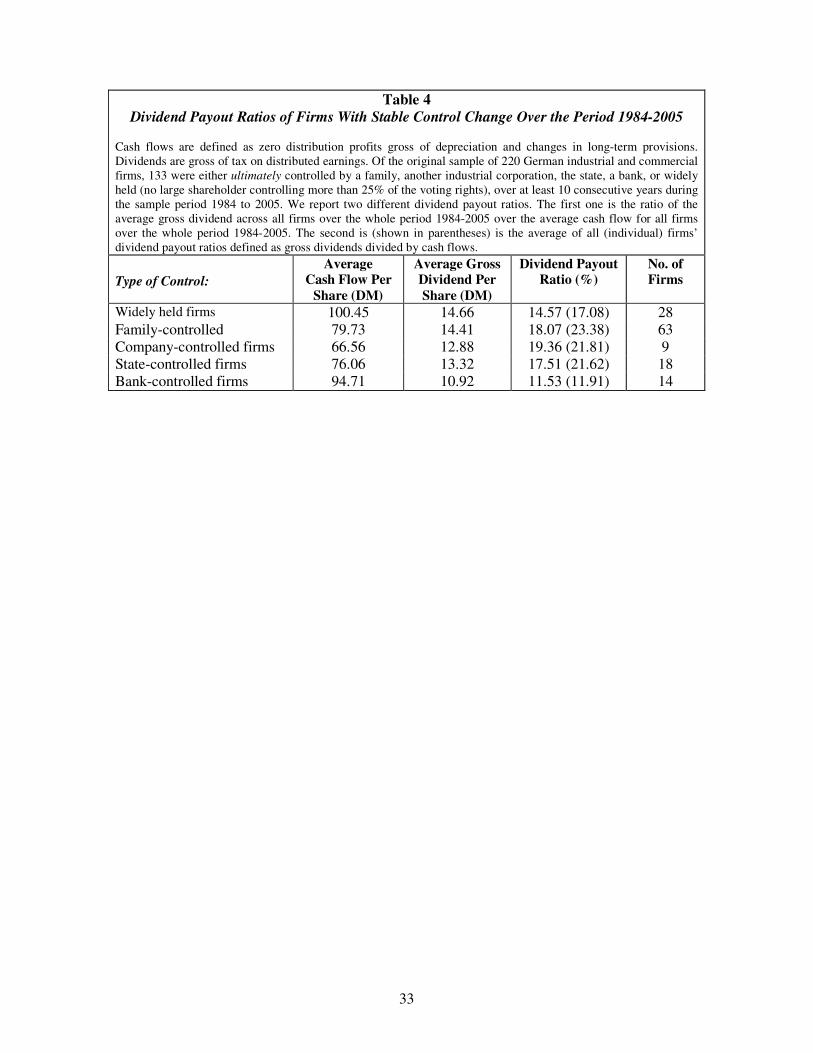
Tables 4 and 5 show the average cash flow per share, dividend per share and dividend
payout ratio for firms with stable control over the period of study and for those with a
control change, respectively.13
Table 4 defines firms with stable control as those that
do not experience a change in their ultimate shareholder holding at least 25% of the
votes during 1984-2005. The table is based on the 133 firms out of the 220 that satisfy
this criterion. Firms that stay widely held during the entire period have both the
highest average cash flow per share and dividend per share. However, their dividend
payout ratio is the second lowest, after that of bank-controlled firms. Firms controlled
13
Tables 4 and 5 focus on a smaller range of types of large shareholder than Table 3 given that there
are too few observations for the omitted types of large shareholder.

19
by families and other companies have the highest payout ratios. Table 4 suggests two
important points. First, given that widely held firms have the second lowest payout
ratio dividends do not seem to be a substitute for large-shareholder monitoring.
Second, the type of large shareholder matters as dividend payout ratios differ
substantially across the various types of shareholder. All in all, Table 4 fails to
provide support for hypothesis H1.
[INSERT TABLE 4 ABOUT HERE]
Table 5 focuses on the 56 firms that experience a change of control during 1986-2003.
The period of 1986-2003 is chosen in order to have at least two years of data before
and after the year of the control change. Twenty-two firms experience more than one
change in control, resulting in a total of 78 observations.14
The table reports the
average dividend per share and cash flow per share as well as the payout ratio for
firms changing from widely held to closely held and those that experience the exact
opposite change in control. Thirty-seven firms experience the former change in
control whereas 41 firms experience the latter. There is no evidence suggesting that
dividend policy changes significantly over the five years around the change in control
for both types of control changes. However, when the type of the new (or past)
controlling shareholder is taken into consideration there is some evidence that firms
that are originally widely held and then become controlled by a family increase their
dividend and cash flow per share as well as their dividend payout ratio. Conversely,
firms that experience the exact opposite change in control decrease their dividend
payout ratio. Further, firms that are initially widely held and then become controlled
by a bank reduce their dividend payout ratio whereas those that experience the exact
opposite change in control increase their dividend payout ratio. Hence similar to Table
4, Table 5 does not provide support for hypothesis H1 and suggests that the type of
controlling shareholder is important when considering the dividend payout.
[INSERT TABLE 5 ABOUT HERE]
14
For those firms that have more than two changes in control, none of the changes in control after the
second one renders the minimum of two years of data after the change. Hence, these changes have been
excluded from Table 5.

20
5. Methodology
5.1 Dividend model
In our empirical analysis, we extend the seminal dividend model by Lintner (1956).
Based on interviews with chief financial officers (CFOs) of 28 large US companies,
Lintner provides some of the earliest, path breaking evidence on the determinants of
dividend payouts. Although he discovers considerable differences in dividend policy
across companies, he also finds the following four common patterns. First, CFOs have
in mind a long-term target payout ratio when setting their firm’s dividend. Second,
they tend to focus on dividend changes rather than dividend levels. Third, a change in
dividends is usually caused by a major, unexpected and persistent change in earnings.
Finally, dividends are sticky, i.e. they only change if the CFO perceives that there is a
long-term change in earnings warranting this change.
Based on the above patterns, Lintner (1956) develops his model of corporate dividend
behaviour, the so called partial adjustment model. For any year t, the target level of
dividends, D*
it for firm i, is a proportion of current earnings, Eit, in line with the long-
term payout ratio ri:
itiit ErD =* (5)
In any given year the firm will only partially adjust towards the target dividend level.
Hence, we have:
ittiitiitiit uDDcaDD +−+=− −− )( 1,*
1, (6)
where ai is a constant; ci is the speed at which dividends adjust to changes in earnings,
with 0 ≤ ci ≤ 1; and D D Dit i t it− =−, 1 ∆ is the actual change in the dividend compared to
the desired change which is 1,
*
−− tiit DD .
If ai = 0 and ci = 1, then actual dividends adjust immediately and fully to any change
in earnings and the actual dividend will always coincide with the firm’s target
dividend. At the other extreme, if ci = 0, then dividends follow a random walk. The
pattern uncovered by Lintner that firms gradually adjust dividends in response to
21
changes in earnings and thus apply dividend smoothing implies that the speed-of-
adjustment coefficient ci is within the ]0; 1[ range. Furthermore, a positive ai
represents the management’s resistance towards dividend cuts. Substituting equation
(6) into (5) then yields the following equation:
ittiiitiiit uDcEbaD +−++= −1,)1( (7)
where ri = bi / ci is the payout ratio and ci the speed-of-adjustment coefficient.
Fama and Babiak (1968) extend the partial adjustment model by including a lagged
earnings variable. They assume that the process generating the annual earnings of firm
i is as follows
E E vit i i t it= + +−( ) ,1 1λ (8)
where vit is a serially uncorrelated error term. A further assumption is that there is full
adjustment of dividends to the expected earnings change λiEi,t-1, and partial
adjustment to the remainder:
[ ]ittiiititiiitiiitiit uErDEErcaDD ++−−+=− −−−− 1,1,1,1, )( λλ (9)
which rearranged gives the following equation
ittiiititiiiit uEdEbDcaD +++−+= −− 1,1,)1( (10)
where bi = ci ri , and di = ri λi (1− ci).
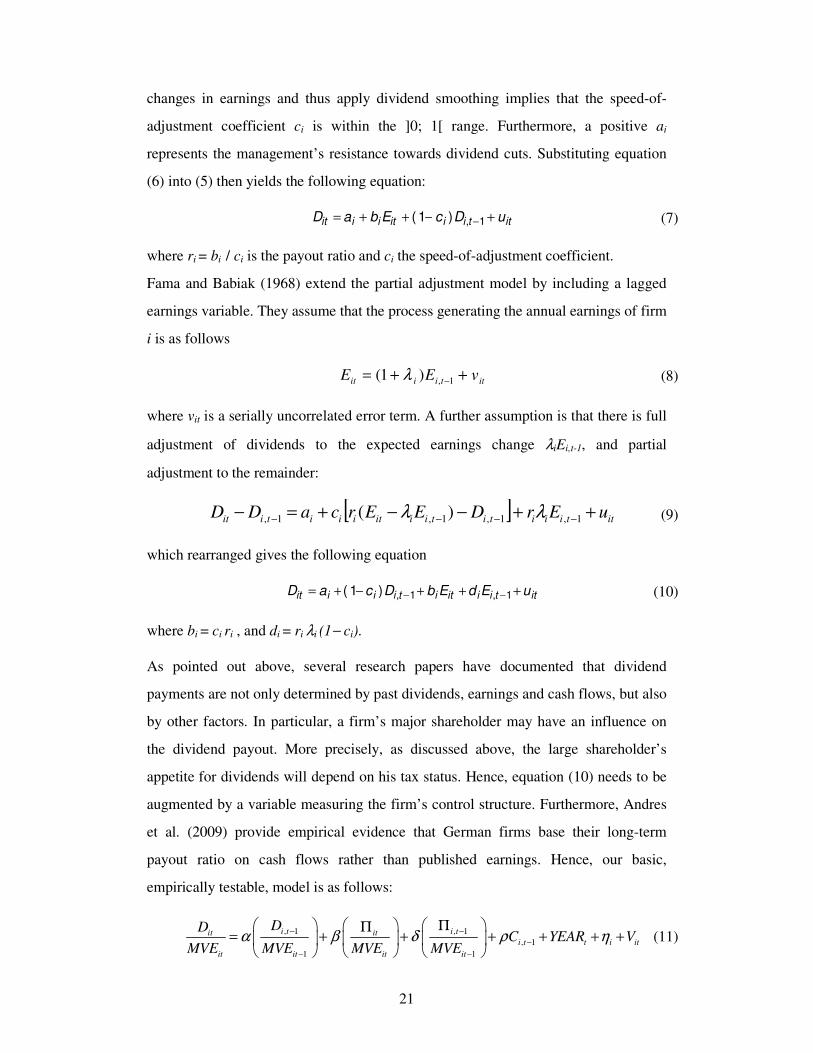
As pointed out above, several research papers have documented that dividend
payments are not only determined by past dividends, earnings and cash flows, but also
by other factors. In particular, a firm’s major shareholder may have an influence on
the dividend payout. More precisely, as discussed above, the large shareholder’s
appetite for dividends will depend on his tax status. Hence, equation (10) needs to be
augmented by a variable measuring the firm’s control structure. Furthermore, Andres
et al. (2009) provide empirical evidence that German firms base their long-term
payout ratio on cash flows rather than published earnings. Hence, our basic,
empirically testable, model is as follows:
, 1 , 1
, 1
1 1
i t i tit iti t t i it
it it it it
DDC YEAR V
MVE MVE MVE MVEα β δ ρ η− −
−
− −
Π Π= + + + + + +
(11)
22
where Dit stands for the total dividend payment for firm i at time t, Π represents total
cash flow, Ci,t-1 is a measure for control concentration at time t-1, MVEit is the market
capitalization of firm i at the beginning of each year, YEAR stands for a vector of time
dummies, ηi is the firm-specific effects and Vit is the disturbance term.
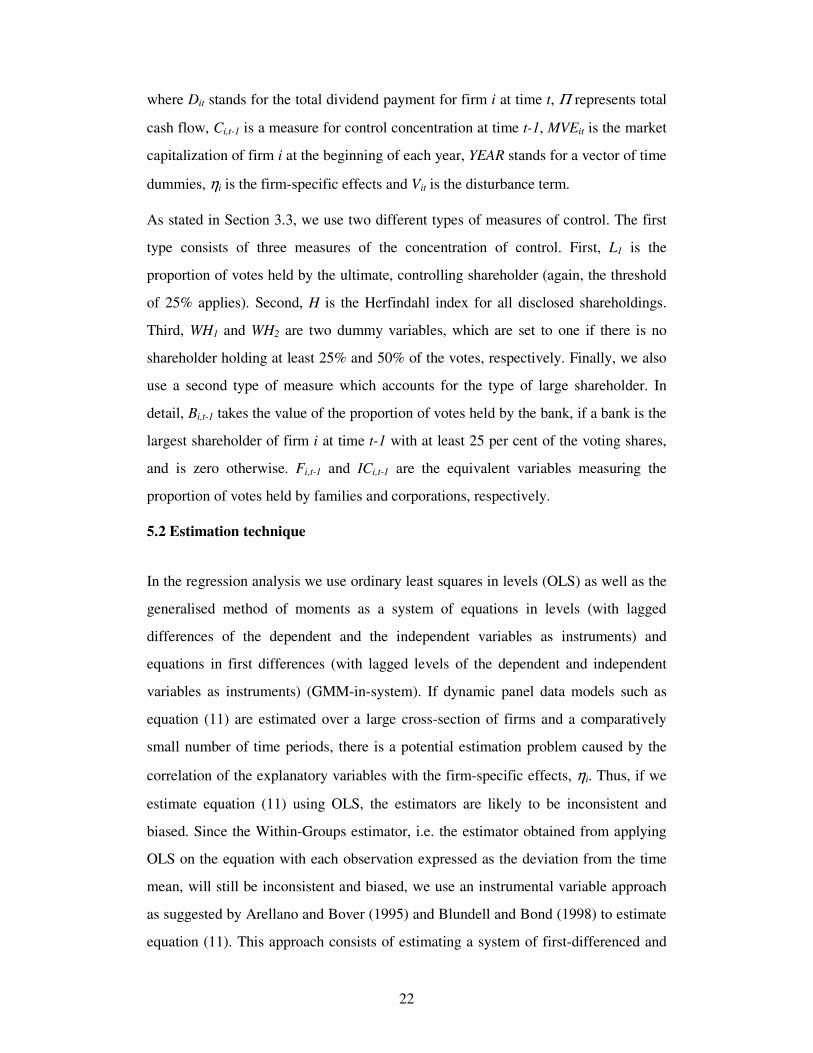
As stated in Section 3.3, we use two different types of measures of control. The first
type consists of three measures of the concentration of control. First, L1 is the
proportion of votes held by the ultimate, controlling shareholder (again, the threshold
of 25% applies). Second, H is the Herfindahl index for all disclosed shareholdings.
Third, WH1 and WH2 are two dummy variables, which are set to one if there is no
shareholder holding at least 25% and 50% of the votes, respectively. Finally, we also
use a second type of measure which accounts for the type of large shareholder. In
detail, Bi,t-1 takes the value of the proportion of votes held by the bank, if a bank is the
largest shareholder of firm i at time t-1 with at least 25 per cent of the voting shares,
and is zero otherwise. Fi,t-1 and ICi,t-1 are the equivalent variables measuring the
proportion of votes held by families and corporations, respectively.
5.2 Estimation technique
In the regression analysis we use ordinary least squares in levels (OLS) as well as the
generalised method of moments as a system of equations in levels (with lagged
differences of the dependent and the independent variables as instruments) and
equations in first differences (with lagged levels of the dependent and independent
variables as instruments) (GMM-in-system). If dynamic panel data models such as
equation (11) are estimated over a large cross-section of firms and a comparatively
small number of time periods, there is a potential estimation problem caused by the
correlation of the explanatory variables with the firm-specific effects, ηi. Thus, if we
estimate equation (11) using OLS, the estimators are likely to be inconsistent and
biased. Since the Within-Groups estimator, i.e. the estimator obtained from applying
OLS on the equation with each observation expressed as the deviation from the time
mean, will still be inconsistent and biased, we use an instrumental variable approach
as suggested by Arellano and Bover (1995) and Blundell and Bond (1998) to estimate
equation (11). This approach consists of estimating a system of first-differenced and
23
levels equations that offers significant efficiency gains in situations where a simple
GMM estimator in first differences performs poorly. The resulting linear estimator
uses the lagged differences in the dependent and independent variables as instruments
for the equations in levels, in addition to the lagged levels of the dependent and
independent variables as instruments for the equations in first differences.
Specifically, it uses lagged differences of the dependent and explanatory variables,
(e.g. Di,t-1 – Di,t-2) as additional instruments in the levels equations, under the
assumption that these differences are uncorrelated with the firm-specific effects, ηi,
even though the levels of these are correlated with ηi. We call this technique GMM-
in-system.
6. Regression analysis
Out of the sample of 220 firms, described in Section 3.1, we exclude firm-year
observations relating to control by foreign companies, by local and federal
government authorities and by foundations. While the former type of large
shareholder is excluded due to the difficulty of determining the tax status of individual
foreign shareholders, the latter two types are excluded due to the small number of
observations. This leaves us with a total of 3,264 firm-year observations covering 214
firms that are controlled by a family, bank or another corporation or are widely held.
6.1 Concentration of control
Table 6 shows the results from the estimation of the regression model based on
equation (11). The table reports the results for both the OLS in levels and the GMM-
in-system estimation. There is no evidence, neither from the OLS regression
(specification (1)) nor from the GMM-in-system regression (specification (2)), that
large shareholders have any impact on dividend policy. There is also no evidence that
the degree of control concentration, as measured by the Herfindahl index, has any
impact on the dividend payout ratio (specifications (3) and (4)). Finally, there is also
no evidence that the lack of a controlling shareholder has any impact on dividend
policy (specifications (5), (6), (7) and (8)). This implies that there is no empirical
support for hypothesis H1. There is also no relationship between control and dividend

24
policy when we allow for this relationship to take on a non-linear form (specifications
(9) and (10)). We therefore cannot confirm our hypothesis H2.
It should be noted that the lack of results is hardly surprising given the patterns
suggested by the univariate statistics presented above. While some types of large
shareholder (in particular banks) are associated with comparatively low levels of
dividend payouts, others (most notably families) seem to follow a policy of high
payouts. The variables used so far do not distinguish between the different types of
controlling shareholders and are therefore not able to capture these very different
payout policies.
[INSERT TABLE 6 ABOUT HERE]
6.2 Type of controlling shareholder
Table 7 is similar to Table 6 as it is also based on equation (11). However, control is
now measured by taking into account the type of the ultimate controlling shareholder
in addition to the concentration of control. In detail, we account for three different
types of controlling shareholder. The first type we account for is families: F takes the
value of the proportion of votes held by the family, when a family is the largest
shareholder of firm i at time t holding at least 25 per cent of the voting shares (at the
ultimate level), and is zero otherwise. The second one is the equivalent measure for
banks and the third one is the equivalent measure for other industrial or commercial
firms.
While Table 6 does not suggest a relationship between dividends and the
concentration of control, Table 7 suggests that there is such a relationship when the
type of ultimate controlling shareholder is taken into account. Indeed, there is strong
evidence that firms controlled by families have a higher dividend payout than firms
controlled by other types of shareholder and widely held firms. This result confirms
the conclusions drawn from Table 3 and provides support for hypothesis H3. Outside
investors seem to demand higher dividend payouts as protection against expropriation
by the controlling family. As an alternative interpretation, our findings are consistent

25
with the idea that families pay themselves higher dividends because their portfolios
are generally not well diversified. They therefore seem to be dependent on their
primary asset as a source of income.
However, there is no evidence that firms that are controlled by other firms have a
particular dividend policy. This calls for the rejection of hypothesis H4, which states
that firms controlled by other firms pay higher dividends than firms controlled by
other types of large shareholder. Finally, while the OLS regressions suggest that
banks pay lower dividends, the GMM-in-system regressions do not confirm that there
is such a relationship. We thus find only weak support for hypothesis H5. Still, this
result lends some support to Edwards and Fischer (1994) who argue that German
banks are not very active in monitoring the management of their investee firms.
[INSERT TABLE 7 ABOUT HERE]
6.3 Tax status of controlling shareholder
Table 8 focuses on the controlling shareholder’s tax preference for dividends. The
first specification includes the dividend tax discrimination variable, but does not
adjust for the presence of and the level of control held by a particular type of
shareholder (i.e. families, banks or industrial and commercial corporations).15
The
dividend tax discrimination variable is negative and significant. This implies that the
higher the tax advantage of dividends, the lower is the dividend paid out by the firm.
This seemingly contradictory finding may be a direct result of the effects of different
types of shareholder on the dividend payout reported above: control by banks is
associated with lower dividends (although bank control is only partly significant) even
though banks (and corporations more generally) have a strong tax preference for
dividends prior to 2001. In contrast, family control is associated with significantly
higher dividend payments even though one would expect the exact opposite pattern
given the tax status for families. In other words, specification (1) erroneously assumes
that the tax variable is the only determinant of dividends. If we add the percentage of
15
As specified in Section 4.3., we use the aggregate weighted average tax rate for firms that are widely
held.

26
votes held by the type of controlling shareholder at the first tier (specification (2)), the
tax discrimination variable is no longer statistically significant. Similarly, when
control is measured at the ultimate tier, we find that the tax discrimination variable is
now positive and not statistically significant (specification (3)). The results further
confirm that control at the ultimate level should be considered when analysing the
impact of controlling shareholders on firms’ payout policy. When family control is
measured at the ultimate level, the coefficient is again statistically significant, but falls
short of being significant if control is measured at the first tier.
[INSERT TABLE 8 ABOUT HERE]
In sum, the evidence provided in our analysis does not support the argument that the
tax status of the controlling shareholder influences dividend policy in Germany. In
other words, controlling shareholders do not seem to impose their tax preferences on
minority shareholders. In addition, we find that controlling families, despite a strong
tax disadvantage of dividends, are associated with significantly higher dividend
payouts. Hence, hypotheses H6 and H7 are not supported. Given the danger of
minority shareholder expropriation by controlling shareholders (e.g. Connelly et al.
2010), families seem to use dividends as a device to signal to outside shareholders that
they are willing to forego their private benefits of control. Higher dividend payouts
are also beneficial to minority shareholders from a tax perspective as individuals
whose marginal income tax rate is lower than the corporate tax rate on retained
earnings (which is equal to the highest income tax rate for large parts of the sample
period) prefer dividends over capital gains (see section 4.3). In conclusion, our
findings suggest that dividend payouts of German firms are not influenced by tax but
by control and/or governance considerations.
7. Conclusion
This paper has studied the dividend behaviour of 220 industrial and commercial
German firms over 1984-2005. Theory predicts a link between the concentration of
control and dividend policy. Indeed, Easterbrook (1984) and Rozeff (1982) predict
that dividends play an important role in firms with no large shareholder and no or

27
little managerial ownership. This suggests a linear and decreasing effect of the
concentration of control on the dividend payout. In contrast, Schooley and Barney
(1994) suggest that there is a convex relationship between the concentration of control
and the dividend payout. At low levels of ownership and control dividends are
important in terms of realigning the interests of the managers with those of the
shareholders. The role of dividends decreases at intermediate levels of ownership and
control. It then becomes again important as ownership and control become highly
concentrated and there is a clear danger of the large shareholder expropriating the
minority shareholders. However, we fail to find evidence in favour of both a linear
link and a non-linear link.
In contrast, when we account for the type of controlling shareholder, we find a link
between control and the dividend payout. Indeed, firms controlled by families have
significantly higher dividend payouts and firms controlled by banks have significantly
lower dividend payouts than all other firms.
However, we do not find that the tax status of the controlling shareholder has any
impact on the dividend decision. While families and individuals had a clear preference
for capital gains over dividends for the entire period, family-controlled firms paid
significantly higher dividends that all other firms.
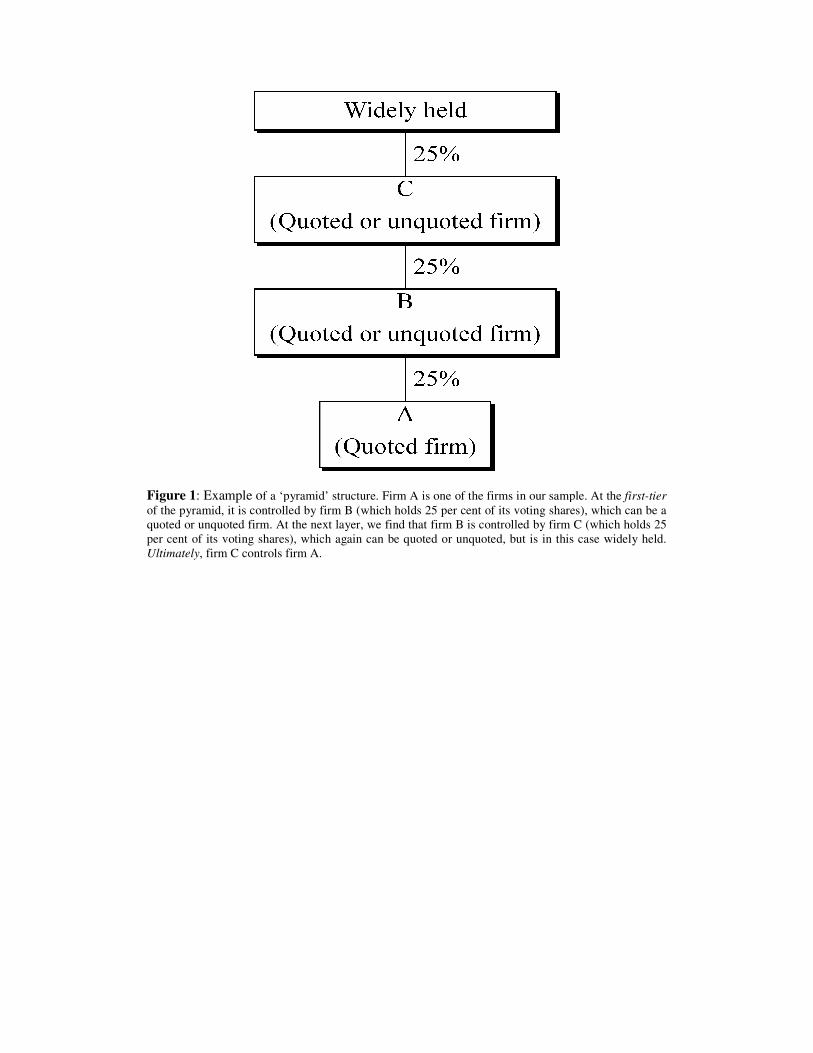
Figure 1: Example of a ‘pyramid’ structure. Firm A is one of the firms in our sample. At the
of the pyramid, it is controlled by firm B (which holds
quoted or unquoted firm. At the next layer, we find that firm B is controlled by firm C (which holds
per cent of its voting shares), which again can be quoted or unquoted, but is in this case widely held.
Ultimately, firm C controls firm A.
a ‘pyramid’ structure. Firm A is one of the firms in our sample. At the
of the pyramid, it is controlled by firm B (which holds 25 per cent of its voting shares), which can be a
quoted or unquoted firm. At the next layer, we find that firm B is controlled by firm C (which holds
per cent of its voting shares), which again can be quoted or unquoted, but is in this case widely held.
, firm C controls firm A.
a ‘pyramid’ structure. Firm A is one of the firms in our sample. At the first-tier
per cent of its voting shares), which can be a
quoted or unquoted firm. At the next layer, we find that firm B is controlled by firm C (which holds 25
per cent of its voting shares), which again can be quoted or unquoted, but is in this case widely held.
29
Table 1
Corporation Tax Rates on Retentions and Dividends, Tax Rates on
Personal Income and Solidarity Surcharge in Germany
Retentions 1 Distributions Top Income
Tax Rates2
Solidarity
Surcharge
1977–1989 56% 36% 56% 0%
1990 50% 36% 53% 0%
1991-1992 50% 36% 53% 3.75%
1993-1994 45% 36% 53% 0%
1995-1997 45% 30% 53% 7.5%
1998 45% 30% 53% 5.5%
1999 40% 30% 53% 5.5%
2000 40% 30% 51% 5.5%
2001-20033 25% 25% 48.5% 5.5%
2004 25% 25% 45% 5.5%
2005 25% 25% 42% 5.5%
1
Because of tax exemptions and reductions, the tax charge for part of the profit may vary from 0 to 50 per
cent between 1990 and 2000. It is therefore necessary to differentiate retained profits and reserves according
to the rate of tax that they incur, because when they are distributed they must bear a uniform tax rate of 36 per
cent (prior to 1995) or 30 per cent (between 1995 and 2000). When the firm distributes profits which have
already been taxed at the tax rate applying to retained profits, it can claim a reduction in its current tax bill or
even a tax refund. For example, until December 1993, by distributing profits that had been retained before
1990, firms could receive a tax refund of 6 per cent. As a consequence, a few companies that had
accumulated comfortable levels of reserves before 1990 have paid extra dividends during this period. 2 Until 1990, personal income of more than DM 130,000 was subject to the highest tax rate. From 1991 until
1999, personal income exceeding DM 120,000 was taxed at the highest tax rate. Between 1999 and 2004, the
threshold was gradually lowered to DM 102,000. 3 In 2001, Germany underwent a major tax reform. Under the new taxation laws, distributed and retained
earnings are no longer taxed at different rates.
30
Table 2
Overall Sample Composition Panel A
Sample Period 1984-2005
Number of Firms 220
Number of Firm-Year
Observations
3932
Panel B
Number of Firms Number of Records per
Firm
74 22
14 21
15 20
12 19
16 18
22 17
12 16
14 15
5 14
3 13
1 12
12 11
7 10
1 9
7 8
1 7
3 6
1 5
31
Table 3
First-Tier and Ultimate Control of 220 German Industrial and Commercial
Quoted Firms in 1984, 1988, 1992, 1996, 2000 and 2004 Widely held firms are firms without a shareholder controlling at least 25 (50) per cent of the voting shares.
Data for closely held firms are reported according to the type of their largest shareholder. The sample size
varies over the 20-year period as some firms in our sample are not quoted during the earlier part of the period
of study and others delist later on as they go private or bankrupt.
First-Tier Control Ultimate Level Control
≥≥≥≥25% ≥≥≥≥50% ≥≥≥≥25% ≥≥≥≥50%
% No. % No. % No. % No.
Panel A: 1984 A. Widely held 16.9 30 54.2 96 18.1 32 54.2 96 B. Closely held, the largest
shareholder being:
1. Family 21.5 38 14.1 25 32.8 58 18.1 32 2. Indust./commerc. firm 22.0 39 16.4 29 6.2 11 10.7 19 3. State 2.8 5 1.7 3 11.9 21 4.0 7 4. Bank 11.3 20 1.1 2 15.7 28 1.7 3 5. Insurer 1.1 2 0 0 2.3 4 0 0 6. Foreign investor 5.7 10 4.5 8 8.5 15 7.3 13 7. Holding company 18.1 32 7.3 13 2.8 5 2.3 4 8. Foundation 0.6 1 0.6 1 1.7 3 1.7 3 Total 100 177 100 177 100 177 100 177
Panel B: 1988 A. Widely held 19.3 42 49.5 108 19.3 42 49.5 108 B. Closely held, the largest
shareholder being:
1. Family 22.0 48 16.6 36 34.8 76 23.8 52 2. Indust./commerc. firm 18.8 41 14.2 31 5.4 12 8.7 19 3. State 3.2 7 1.8 4 10.1 22 3.7 8 4. Bank 7.8 17 0.9 2 13.8 30 1.4 3 5. Insurer 0.0 0 0 0 1.4 3 0 0 6. Foreign investor 5.0 11 3.7 8 9.2 20 6.9 15 7. Holding company 22.5 49 11.9 26 2.8 6 3.2 7 8. Foundation 1.4 3 1.4 3 3.2 7 2.8 6 Total 100 218 100 218 100 218 100 218
Panel C: 1992 A. Widely held 17.3 37 43.9 94 17.3 37 43.9 94 B. Closely held, the largest
shareholder being:
1. Family 19.7 42 14.5 31 35.5 76 23.4 50 2. Indust./commerc. firm 22.4 48 16.8 36 9.4 20 10.7 23 3. State 2.4 5 1.9 4 9.8 21 3.7 8 4. Bank 7.0 15 1.9 4 10.3 22 1.9 4 5. Insurer 0.9 2 0 0 2.3 5 0 0 6. Foreign investor 5.1 11 5.6 12 10.3 22 9.8 21 7. Holding company 24.3 52 14.5 31 3.2 7 4.7 10 8. Foundation 0.9 2 0.9 2 1.9 4 1.9 4 Total 100 214 100 214 100 214 100 214
32
First-Tier Control Ultimate Level Control
≥≥≥≥25% ≥≥≥≥50% ≥≥≥≥25% ≥≥≥≥50%
% No. % No. % No. % No.
Panel D: 1996 A. Widely held 19.5 36 42.2 78 20.0 37 42.2 78 B. Closely held, the largest
shareholder being:
1. Family 13.0 24 7.6 14 31.9 59 19.5 36 2. Indust./commerc. firm 18.3 34 15.7 29 5.4 10 8.6 16 3. State 2.2 4 0.5 1 10.8 20 1.1 2 4. Bank 4.3 8 2.2 4 9.1 17 2.7 5 5. Insurer 1.1 2 0.0 0 1.7 3 0.0 0 6. Foreign investor 8.6 16 8.1 15 15.2 28 14.6 27 7. Holding company 31.9 59 23.2 43 3.2 6 9.1 17 8. Foundation 1.1 2 0.5 1 2.7 5 2.2 4 Total 100 185 100 185 100 185 100 185
Panel E: 2000 A. Widely held 17.2 27 39.5 62 17.2 27 39.5 62 B. Closely held, the largest
shareholder being:
1. Family 12.1 19 6.4 10 34.4 54 19.1 30 2. Indust./commerc. firm 17.2 27 16.0 25 6.4 10 8.9 14 3. State 1.9 3 0.6 1 5.7 9 1.3 2 4. Bank 5.7 9 2.5 4 7.0 11 2.5 4 5. Insurer 0.6 1 0.0 0 2.5 4 0.6 1 6. Foreign investor 12.8 20 12.1 19 20.4 32 18.5 29 7. Holding company 31.9 50 22.3 35 4.5 7 7.7 12 8. Foundation 0.6 1 0.6 1 1.9 3 1.9 3 Total 100 157 100 157 100 157 100 157
Panel F: 2004 A. Widely held 25.7 28 43.1 47 25.7 28 43.1 47 B. Closely held, the largest
shareholder being:
1. Family 14.7 16 7.4 8 34.0 37 24.8 27 2. Indust./commerc. firm 5.5 6 5.5 6 6.4 7 6.4 7 3. State 0.0 0 0.0 0 0.9 1 0.0 0 4. Bank 0.9 1 0.0 0 1.8 2 0.9 1 5. Insurer 0.9 1 0.0 0 0.9 1 0.0 0 6. Foreign investor 17.4 19 11.9 13 21.1 23 16.5 18 7. Holding company 31.2 34 28.4 31 5.5 6 4.6 5 8. Foundation 3.7 4 3.7 4 3.7 4 3.7 4 Total 100 109 100 109 100 109 100 109
33
Table 4
Dividend Payout Ratios of Firms With Stable Control Change Over the Period 1984-2005
Cash flows are defined as zero distribution profits gross of depreciation and changes in long-term provisions.
Dividends are gross of tax on distributed earnings. Of the original sample of 220 German industrial and commercial
firms, 133 were either ultimately controlled by a family, another industrial corporation, the state, a bank, or widely
held (no large shareholder controlling more than 25% of the voting rights), over at least 10 consecutive years during
the sample period 1984 to 2005. We report two different dividend payout ratios. The first one is the ratio of the
average gross dividend across all firms over the whole period 1984-2005 over the average cash flow for all firms
over the whole period 1984-2005. The second is (shown in parentheses) is the average of all (individual) firms’
dividend payout ratios defined as gross dividends divided by cash flows.
Type of Control:
Average Cash Flow Per
Share (DM)
Average Gross Dividend Per
Share (DM)
Dividend Payout Ratio (%)
No. of Firms
Widely held firms 100.45 14.66 14.57 (17.08) 28
Family-controlled 79.73 14.41 18.07 (23.38) 63
Company-controlled firms 66.56 12.88 19.36 (21.81) 9
State-controlled firms 76.06 13.32 17.51 (21.62) 18
Bank-controlled firms 94.71 10.92 11.53 (11.91) 14

34
Table 5
Dividend Payout Ratios Around the Year of Control Changes
Widely held firms are firms without a large shareholder controlling at least 25 per cent the voting shares. Control
is measured at the ultimate level. The table is based on the 56 firms with a change in control during 1986-2003.
The period was chosen in order to have at least two years of data before and after the year of the change in
control. There are 22 firms that experience two changes in control, resulting in a total of 78 control changes.
Cash flows (CF) are defined as zero distribution profits gross of depreciation and changes in long-term
provisions. Dividends (Div) are gross of tax on distributed earnings. Dividend payout ratios (Div/CF) are defined
as the average dividend expressed as a percentage of the average cash flow across all 56 firms. The event year,
t=0, is the year of the change in control.
Nature of Control Change:
Year
Widely
held becomes Closely
held
Closely
held becomes Widely
held
Widely held becomes Family-
controlled
Family-
controlled becomes
Widely held
Widely held becomes Bank-
controlled
Bank-
controlled becomes
Widely held
-2 Div 10.5 8.7 7.9 7.2 12.6 13.5 CF 60.8 65.5 46.4 33.8 66.2 123.5
Div/CF 17.2 13.3 16.9 21.3 19.0 11.0
-1 Div 11.2 9.9 9.4 7.7 10.3 15.1 CF 60.2 52.8 55.9 29.6 68.8 123.3
Div/CF 18.6 18.8 16.8 26.2 14.9 12.2
0 Div 9.5 9.4 9.0 7.3 11.7 14.8 CF 51.7 68.9 45.0 40.2 78.1 123.5
Div/CF 18.4 13.6 20.1 18.0 15.0 12.0
1 Div 11.5 10.4 12.2 8.0 9.9 18.9 CF 79.6 74.9 79.9 46.7 108.0 107.1
Div/CF 14.5 13.9 15.2 17.2 9.1 17.6
2 Div 13.0 9.5 13.7 7.5 11.5 16.7 CF 77.9 73.3 76.2 52.1 126.6 105.5
Div/CF 16.7 12.9 18.0 14.4 9.1 15.8
No. of Firms 37 41 13 17 5 10

35
Table 6
Panel Data Estimation of the Relation Between Dividends, Cash Flows
and Different Measures of Control
The sample size is 214 firms and is obtained by excluding firms from the original sample of 220 firms that are subsidiaries of
foreign companies, state-controlled or controlled by foundations throughout the whole sample period. Dit is the dependent
variable in the specifications and is total dividends scaled by the market value of equity at the beginning of the year. CF is total
cash flows scaled by the same variable. Li is the proportion of voting shares held by the largest shareholder at the ultimate level.
H is the Herfindahl index of all the disclosed shareholdings. WH1 and WH2 are dummy variables which equal one if there is no
large shareholder with at least 25 and 50 per cent the voting shares, respectively. Time dummies are included in all models. m1
and m2 are tests for the absence of first-order and second-order serial correlation in the residuals, asymptotically distributed as
N(0,1) under the null of no serial correlation. Sargan is a test for the validity of the instruments, asymptotically distributed as χ2
under the null of valid instruments. Specifications (2), (4), (6), (8), and (10) are GMM-instrumental variable estimators based on a
GMM-in-system procedure, which consists of a linear system of first-differenced and levels equations. The set of instruments
used are levels of dividends and cash flows variables dated t-1 to t-4 in the differenced equations, and first-differences dated t-2 in
the levels equations throughout all specifications. Moreover, the specifications use levels of control variables dated t-1 to t-3 for
the differenced equations and levels of control variables dated t-1 in the levels equations. Standard-errors, asymptotically robust
to heteroskedasticity, are reported in parentheses. ***
, **
and *
represent statistical significance at the 1%, 5% and 10% level,
respectively.
(a) (b) (c) (d) (e)
OLS GMM OLS GMM OLS GMM OLS GMM OLS GMM
(1) (2) (3) (4) (5) (6) (7) (8) (9) (10) Const. 0.003
(0.010) -0.000
(0.012) 0.004
(0.009) -0.001 (0.008)
0.005
(0.008) -0.001 (0.008)
0.006
(0.008) -0.005 (0.010)
0.002
(0.010) -0.004 (0.012)
Di,t-1 0.168**
(0.067) 0.101***
(0.026) 0.167**
(0.066) 0.100***
(0.026) 0.168**
(0.067) 0.101***
(0.026) 0.167**
(0.066) 0.098***
(0.027) 0.167**
(0.067) 0.102***
(0.026) CFit 0.111***
(0.041) 0.118**
(0.047) 0.110***
(0.041) 0.118**
(0.047) 0.110***
(0.041) 0.118**
(0.047) 0.111***
(0.041) 0.119**
(0.047) 0.110***
(0.041) 0.119**
(0.047) CFi,t-1 -0.034**
(0.017) -0.022** (0.011)
-0.034**
(0.017) -0.022** (0.011)
-0.034**
(0.017) -0.022** (0.011)
-0.033**
(0.016) -0.021** (0.011)
-0.034**
(0.017) -0.023** (0.011)
Li,t-1 0.003 (0.005)
0.002
(0.011) - - - - - - 0.015
(0.009) 0.041
(0.029) Li,t-1
2 - - - - - - - - -0.012 (0.008)
-0.038
(0.029) Hi,t-1 - - 0.000
(0.000) 0.000
(0.000) - - - - - -
WH1i,t-1 - - - - -0.001 (0.003)
-0.004 (0.007)
- - - -
WH2i,t-1 - - - - - -0.004 (0.004)
-0.001 (0.001)
- -
m1 0.401 -1.99 0.377 -1.99 0.429 -2.00 0.425 -1.99 0.423 -1.99 m2 1.084 -0.59 1.061 -0.61 1.127 -0.60 1.124 -0.66 1.094 -0.59 Sargan (p-values)
- 182.12 (0.19)
- 186.34 (0.13)
- 187.99 (0.12)
- 180.90 (0.20)
- 192.03 (0.46)
No. of Observations
3264
3264
3264
3264
3264
3264
3264
3264
3264
3264
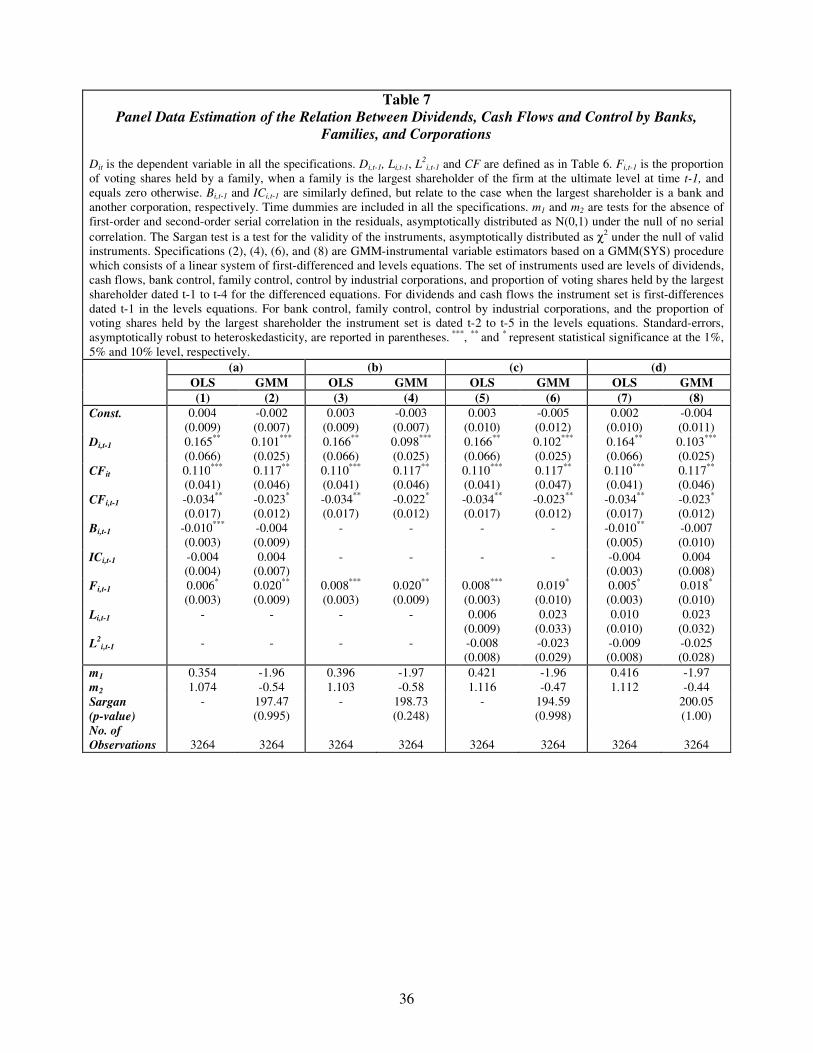
36
Table 7
Panel Data Estimation of the Relation Between Dividends, Cash Flows and Control by Banks,
Families, and Corporations
Dit is the dependent variable in all the specifications. Di,t-1, Li,t-1, L2
i,t-1 and CF are defined as in Table 6. Fi,t-1 is the proportion
of voting shares held by a family, when a family is the largest shareholder of the firm at the ultimate level at time t-1, and
equals zero otherwise. Bi,t-1 and ICi,t-1 are similarly defined, but relate to the case when the largest shareholder is a bank and
another corporation, respectively. Time dummies are included in all the specifications. m1 and m2 are tests for the absence of
first-order and second-order serial correlation in the residuals, asymptotically distributed as N(0,1) under the null of no serial
correlation. The Sargan test is a test for the validity of the instruments, asymptotically distributed as χ2 under the null of valid
instruments. Specifications (2), (4), (6), and (8) are GMM-instrumental variable estimators based on a GMM(SYS) procedure
which consists of a linear system of first-differenced and levels equations. The set of instruments used are levels of dividends,
cash flows, bank control, family control, control by industrial corporations, and proportion of voting shares held by the largest
shareholder dated t-1 to t-4 for the differenced equations. For dividends and cash flows the instrument set is first-differences
dated t-1 in the levels equations. For bank control, family control, control by industrial corporations, and the proportion of
voting shares held by the largest shareholder the instrument set is dated t-2 to t-5 in the levels equations. Standard-errors,
asymptotically robust to heteroskedasticity, are reported in parentheses. ***, ** and * represent statistical significance at the 1%,
5% and 10% level, respectively. (a) (b) (c) (d)
OLS GMM OLS GMM OLS GMM OLS GMM
(1) (2) (3) (4) (5) (6) (7) (8)
Const. 0.004
(0.009)
-0.002
(0.007)
0.003
(0.009)
-0.003
(0.007)
0.003
(0.010)
-0.005
(0.012)
0.002
(0.010)
-0.004
(0.011)
Di,t-1 0.165**
(0.066)
0.101***
(0.025)
0.166**
(0.066)
0.098***
(0.025)
0.166**
(0.066)
0.102***
(0.025)
0.164**
(0.066)
0.103***
(0.025)
CFit 0.110***
(0.041)
0.117**
(0.046)
0.110***
(0.041)
0.117**
(0.046)
0.110***
(0.041)
0.117**
(0.047)
0.110***
(0.041)
0.117**
(0.046)
CFi,t-1 -0.034**
(0.017)
-0.023*
(0.012)
-0.034**
(0.017)
-0.022*
(0.012)
-0.034**
(0.017)
-0.023**
(0.012)
-0.034**
(0.017)
-0.023*
(0.012)
Bi,t-1 -0.010***
(0.003)
-0.004
(0.009)
- - - - -0.010**
(0.005)
-0.007
(0.010)
ICi,t-1 -0.004
(0.004)
0.004
(0.007)
- - - - -0.004
(0.003)
0.004
(0.008)
Fi,t-1 0.006*
(0.003)
0.020**
(0.009)
0.008***
(0.003)
0.020**
(0.009)
0.008***
(0.003)
0.019*
(0.010)
0.005*
(0.003)
0.018*
(0.010)
Li,t-1 - - - - 0.006
(0.009)
0.023
(0.033)
0.010
(0.010)
0.023
(0.032)
L2
i,t-1 - - - - -0.008
(0.008)
-0.023
(0.029)
-0.009
(0.008)
-0.025
(0.028)
m1 0.354 -1.96 0.396 -1.97 0.421 -1.96 0.416 -1.97
m2 1.074 -0.54 1.103 -0.58 1.116 -0.47 1.112 -0.44
Sargan
(p-value)
- 197.47
(0.995)
- 198.73
(0.248)
- 194.59
(0.998)
200.05
(1.00)
No. of
Observations
3264
3264
3264
3264
3264
3264
3264
3264

37
Table 8
Panel Data Estimations of the Relation Between, Dividends, Cash Flows, Tax Discrimination and
Control Structures at the First-Tier Level
The sample size is 214 firms. Dit is the dependent variable in all models and CF is cash flows, both scaled by the market
value of equity at the beginning of the year. TAXi,t is a tax discrimination variable (see Section 4.3 for details about its
calculation). FNPi,t-1 (Fi,t-1), BNPi,t-1 (Bi,t-1), and ICNPi,t-1 (ICi,t-1) are first-tier (ultimate) control (as a percentage) by
domestic families, banks, and industrial and commercial corporations, respectively. Specification (1) estimates the
impact of the tax status of shareholders in Germany on the dividend policy. Specifications (2) and (3) contain controls at
the first-tier (2) and ultimate control (3) as additional explanatory variables. Time dummies are included in all
specifications. m1 and m2 are tests for the absence of first-order and second-order serial correlation in the residuals,
asymptotically distributed as N(0,1) under the null of no serial correlation. Sargan is a test for the validity of the
instruments, asymptotically distributed as χ2 under the null of valid instruments. All specifications are estimated using
GMM(SYS) which consists of a linear system of first-differenced and levels equations. The set of instruments used are
levels of dividends and cash flows dated t-2 and first-differences dated t-1 to t-4. For the control variables FNPi,t-1,
BNPi,t-1, and ICNPi,t-1, the set of instruments is levels dated t-2 to t-5, and first-differences dated t-2. For the tax variable,
the instruments are levels dated t-2 to t-5, and first-differences dated t-1. Standard-errors, asymptotically robust to
heteroskedasticity, are reported in parentheses. ***
, **
and *
represent statistical significance at the 1%, 5% and 10% level,
respectively.
(1) (2) (3)
Constant 0.012 (0.008)
-0.002
(0.009) -0.001
(0.008)
Di,t-1 0.097***
(0.027) 0.101***
(0.026) 0.097***
(0.026)
CFit 0.119**
(0.047) 0.118**
(0.047) 0.119**
(0.046)
CFi,t-1 -0.022** (0.011)
-0.023** (0.011)
-0.023*
(0.012)
BNPi,t-1 - 0.001
(0.018)
Bi,t-1 -0.003
(0.010)
FNPi,t-1 - 0.013 (0.013)
Fi,t-1 0.014*
(0.008)
ICNPi,t-1 - -0.004 (0.007)
ICi,t-1 0.004
(0.008)
TAXi,t -0.011*
(0.006) -0.004 (0.006)
0.003
(0.007)
m1 -2.00 -2.00 -1.97
m2 -0.65 -0.43 -0.53
Sargan (p-values) 201.46 (0.98) 182.70 (0.99) 196.31 (0.99)
No. of Observations 3264 3264 3264
38
References
Andres, C., Betzer, A., Goergen, M., and Renneboog, L. (2009), ‘Dividend Policy of German
Firms: A Panel Data Analysis of Partial Adjustment Models’, Journal of Empirical Finance
16, 175–187.
Arellano, M. and Bover, O. (1995), ‘Another look at the instrumental-variable estimation of
error-component models’, Journal of Econometrics 68, 29-52.
Barclay, M.J., Holderness, C.G., and Sheehan, D.P. (2009), ‘Dividends and corporate
shareholders’, Review of Financial Studies 22, 2423–2455.
Becht, M. and Boehmer, E. (2001), ‘Ownership and Voting Power in Germany, ’ in: Becht,
M. and Boehmer, E. (eds.), The Control of Corporate Europe, Oxford University Press,
2001, 128–53.
Behm, U. and Zimmermann, H. (1993), ‘The empirical relationship between dividends and
earnings in Germany’, Zeitschrift für Wirtschafts- und Sozialwissenschaften 113, 225-254.
Blundell, R. and Bond, S. (1998), ‘Initial conditions and moment restrictions in dynamic
panel data models’, Journal of Econometrics 87, 115-143.
Boehmer, E. (2002), ‘Who controls German corporations?’, in: Renneboog, L., J. McCahery,
P. Moerland, and T. Raaijmakers (eds.), Convergence and Diversity of Corporate
Governance Regimes and Capital Markets, Oxford University Press, 268-286.
Bond, S., Chennells, L., and Windmeijer, E. F. (1996), ‘Shareholder status and company
dividend behaviour’, mimeo, Institute of Fiscal Studies.
Born, J. and Rimbey, J. (1993), ‘A test of the Easterbrook Hypothesis regarding dividend
payments and agency costs’, Journal of Financial Research 46, 251-260.
Brickley, J. (1983), ‘Shareholder wealth, information signalling and the specially designated
dividend: an empirical study’, Journal of Financial Economics 12, 187-209.
Cable, J. (1985), ‘Capital market information and industrial performance: The role of West
German banks’, Economic Journal 95, 118-132.

39
Chirinko, R. and Elston, J. (1996), ‘Banking relationships in Germany; what should regulators
do?’, in Federal Reserve Bank of Chicago (ed.), Rethinking Bank Regulation: What Should
Regulators Do? (Chicago: Federal Reserve Bank of Chicago), 239-255.
Connelly, B. L., Hoskisson, R. E., Tihanyi, L., and Certo, S. T. (2010), ‘Ownership as a Form
of Corporate Governance’, Journal of Management Studies 47, 1561–1589.
Correia da Silva, L., Goergen, M. and Renneboog, L. (2004), Dividend policy and corporate
governance, Oxford University Press.
Crutchley, C. and Hansen, R. (1989), ‘A Test of the Agency Theory of Managerial
Ownership, Corporate Leverage, and Corporate Dividends’, Financial Management
18, 36-46.
Crutchley, C., Jensen, M., Jahera Jr., J., and Raymond, J. (1999), ‘Agency problems
and the simultaneity of financial decision making: The role of institutional
ownership’, International Review of Financial Analysis 8, 177-197.
Dempsey, S., and Laber, G. (1992), ‘Effects of Agency and Transaction Costs on
Dividend Payout Ratios: Further Evidence of the Agency-Transaction Cost
Hypothesis’, Journal of Financial Research 15, 317-321.
Dittmann, I., Maug, E., and Schneider, C. (2010), ‘Bankers on the Boards of German
Firms: What they do, what they are worth, and why they are (still) there’, Review of
Finance 14, 35-71.
Easterbrook, G. H. (1984), ‘Two Agency-Cost Explanations of Dividends’, American
Economic Review 74, 650-659.
Edwards, J. and Fischer, K. (1994), Banks, finance and investment in Germany, London and
Cambridge: CEPR and Cambridge University Press.
Edwards, J., Mayer, C., Pashardes, B., and Poterba, J. (1986), ‘The effects of taxation on
corporate dividend policy in the UK’, Working Paper No. 96, Institute of Fiscal
Studies.

40
Faccio, M. and Lang, L.H.P (2002), ‘The ultimate ownership of western European
corporations’, Journal of Financial Economics 65, 365-395.
Faccio, M., Lang, L.H.P., and Young, L. (2001), ‘Dividends and expropriation’,
American Economic Review 91, 54-78.
Fama, E., and Babiak, H. (1968), ‘Dividend policy: an empirical analysis’, American
Statistical Association Journal 63, 1132-1161.
Franks, J. and Mayer, C. (2001), ‘Ownership and Control of German Corporations’,
Review of Financial Studies 14, 943–977.
Franks, J., Mayer, C., Volpin, P., and Wagner, H. (2009), ‘The Life Cycle of Family
Ownership: A Comparative Study of France, Germany, Italy and the U.K.,
unpublished paper, 2009.
Gerum, E., Steinmann, H., and Fees, W. (1988), Der mitbestimmte Aufsichtsrat,
Stuttgart.
Goergen, M. (1998), ‘Corporate governance and financial performance – a study of
German and UK initial public offerings’, Cheltenham: Edward Elgar.
Gugler, K. (2003), ‘Corporate Governance, Dividend Payout Policy, and The
Interrelation between Dividends, R&D, and the Capital Investment’, Journal of
Banking and Finance 27, 1297-1321.
Hamid, S., Prakash, A., and Smyser, M. (1995), ‘The Role Of managerial demand and
ownership in the determination of dividend and debt policies of mature corporations’,
unpublished paper, Florida International University.
Jensen, M. and Meckling, W. (1976), ‘Theory of the Firm. Managerial Behavior, Agency
Costs and Capital Structure’, Journal of Financial Economics 3, 305–360.
La Porta, R., Lopez-de-Silanes, F., Shleifer, A., and Vishny, R. (2000), ‘Agency problems
and dividend policies around the world’, Journal of Finance 55, 1-33.
41
Lintner, J. (1956), ‘Distribution of incomes of corporations among dividends, retained
earnings and taxes’, American Economic Review 46, 97-113.
Moh'd, M. A., Perry, L. G., and Rimbey, J. N. (1995), ‘An Investigation of the
Dynamic Relationship Between Agency Theory and Dividend Policy’, Financial Review
30, 367-385.
Morck, R., Shleifer, A., and Vishny, R. (1988), ‘Management Ownership and Market
Valuation. An Empirical Analysis’, Journal of Financial Economics 20, 293–315.
Perez-Gonzalez, F. (2003), ‘Large Shareholders and Dividends: Evidence from U.S. Tax
Reforms’, unpublished paper, Columbia University, New York.
Rozeff, M. S. (1982), ‘Growth, Beta and Agency Costs as Determinants of Dividend Payout
Ratios’, Journal of Financial Research 5, 249-259.
Schooley, D.K. and Barney Jr, L.D. (1994), ‘Using dividend policy and managerial ownership
to reduce agency costs’, Journal of Financial Research, 17, 363-373.