Embed Size (px)
Citation preview
Europe Direct is a service to help you find answers
to your questions about the European Union
Freephone number (*): 00 800 6 7 8 9 10 11
(*) The information given is free, as are most calls (though some operators, phone boxes or hotels may charge you).
More information on the European Union is available on the internet (http://europa.eu).
Luxembourg: Publications Office the European Union, 2016
Print ISBN 978-92-79-63159-7 doi: 10.2778/203646 KP-01-16-984-EN-C
PDF ISBN 978-92-79-63160-3 doi: 10.2778/676768 KP-01-16-984-EN-N
© European Union, 2016
Reproduction is authorised provided the source is acknowledged.
PRINTED ON ELEMENTAL CHLORINE-FREE BLEACHED PAPER (ECF)
Tax Policies in the European Union
2016 Survey

3 | P a g e
Acknowledgements This report was prepared by DG TAXUD staff under the direction of Stephen Quest (Director-General, Taxation and Customs Union), Valère Moutarlier (Director, direct taxation, tax coordination, economic analysis and evaluation) and Gaëtan Nicodème (Head of Unit, Economic analysis, impact assessment and evaluation). It was coordinated by Gaëlle Garnier and Clare Southworth. Milena Mathe, Savino Ruà, Agnieszka Skonieczna, Clare Southworth, Astrid Van Mierlo and Savina Princen contributed to the report. Comments and suggestions by other services of the Commission are gratefully acknowledged.
Comments on the report are welcome and can be sent to:
Gaëtan Nicodème European Commission Directorate-General Taxation and Customs Union Directorate for Direct taxation, Tax Coordination, Economic Analysis and Evaluation Office SPA3 6/017 B-1049 Brussels e-mail: Functional Mailbox [email protected]
Cover: © European Union , 2016 / Source: EC - Audiovisual Service / Photo: Etienne Ansotte

4 | P a g e
Foreword
Two of the most pressing demands of European citizens right now are economic stability and social
justice. These two objectives are inter-twined. We cannot achieve sustainable economic prosperity
while current social and market imbalances persist. Nor can we redress these imbalances without
an economic environment that supports jobs, growth and investment.
Taxation has a critical role to play in delivering on these twin objectives. Tax policy has been shown
to have a major influence on employment decisions, investment levels and the willingness of
entrepreneurs to expand. Likewise, taxation can help to address the inequities in society, not only by
financing decisive spending for social mobility such as education but also by reducing market
income inequalities through a progressive tax system for example.
Therefore, across Europe, tax systems need to be designed to deliver on the dual goals of fairness
and economic growth. Both are equally important and their success is mutually dependent. If one
lags behind, the other is weakened, hampering the overall success of the reforms. Tax systems also
need to elicit trust from taxpayers. Trust that their money will be put at good use and trust that
everyone pays their fair share.
The design and reform of tax systems need to take place at two levels: European and national. At
national level, there is no one-size fits all approach. Each Member State needs to find the best
approach to address its own specific needs, challenges and priorities. Nonetheless, there are certain
general principles that apply across the board, which every Member State could take into account in
reforming its tax system to make it fairer and more growth-friendly. This is where the European
level brings value added.
This first edition of the Tax Policies in the EU survey contributes to the discussion on better taxation
by providing a summary of recent reforms in Member States to illustrate how decision-makers are
seeking to achieve these two objectives. It presents in an accessible format elements of the design
and governance of Member State tax systems which influence the key characteristics of efficiency
and fairness. It also puts forward and substantiates the tax policy priorities for the next European
Semester cycle.
Stephen Quest
Director-General
Directorate General for Taxation and Customs Union
GENERAL PRINCIPLES FOR FAIR AND EFFICIENT TAX SYSTEMS | 1
5 | P a g e
Contents
Acknowledgements ................................................................................................................................. 3
Foreword ................................................................................................................................................. 4
Executive Summary ................................................................................................................................. 9
1. General principles for fair and efficient tax systems……………………………………………………………………11
1.1 Context ............................................................................................................................................ 11
1.1.1 No optimal level of taxation ................................................................................................. 11
1.1.2 The structure of the tax system matters .............................................................................. 13
1.2 What makes a fair and efficient tax system? .................................................................................. 14
1.2.1 Stimulating investment and growth ..................................................................................... 14
1.2.2 Developing a more employment-friendly environment ...................................................... 14
1.2.3 Fighting against tax fraud evasion and avoidance ............................................................... 15
1.2.4 Correcting inequalities and promoting social justice ........................................................... 15
2. National tax systems performance .................................................................................................. 17
2.1 Encouraging investment .................................................................................................................. 17
2.1.1 Effective tax rates ................................................................................................................. 18
2.1.2 Debt-bias in corporate taxation ........................................................................................... 19
2.1.3 R&D tax incentives ............................................................................................................... 21
2.1.4 Environmental investment ................................................................................................... 24
2.1.5 Improving the efficiency of tax administration .................................................................... 26
2.2 Supporting job creation and employment ...................................................................................... 31
2.2.1 Overall tax burden on labour ............................................................................................... 31
2.2.2 Tax burden on specific groups .............................................................................................. 33
2.2.3: Scope to shift taxes towards tax bases less detrimental to growth ................................... 37
2.3 Tax compliance ................................................................................................................................ 40
2.3.1 Estimates of the non-observed economy ............................................................................ 40
2.3.2 Tax debt as share of revenue collection ............................................................................... 43
2.3.3 Estimates of tax avoidance ................................................................................................... 44
2.3.4 Overview of critical tax rules ................................................................................................ 45
2.3.5 Financial activity ................................................................................................................... 46
2.4. Redistribution ................................................................................................................................. 48
2.4.1. Addressing income inequalities .......................................................................................... 48
2.4.2. Progressivity of personal income taxation .......................................................................... 51
GENERAL PRINCIPLES FOR FAIR AND EFFICIENT TAX SYSTEMS | 1
6 | P a g e
3. Tax reforms in the EU & policy recommendations .......................................................................... 53
3.1 Recent reforms ................................................................................................................................ 53
3.1.1 Stimulating investment ........................................................................................................ 53
3.1.2 Developing a more employment-friendly environment ...................................................... 54
3.1.3 Fighting against tax fraud, evasion and avoidance .............................................................. 55
3.1.4 A fair distribution of the tax burden .................................................................................... 59
3.2 Reform options and inspiring examples .......................................................................................... 60
3.2.1 Encouraging alternatives sources of financing and designing better fiscal incentives ........ 60
3.2.2 Shifting the tax burden away from labour and focusing on the most reactive groups ....... 62
3.2.3 Strengthening administration, closing loopholes and promoting a culture of compliance 62
3.2.4 Enhancing the fair distribution of the tax burden across the population ............................ 64
Glossary ................................................................................................................................................. 67
References ............................................................................................................................................. 69
Annex A: Notes ...................................................................................................................................... 71
GENERAL PRINCIPLES FOR FAIR AND EFFICIENT TAX SYSTEMS | 1
7 | P a g e
List of Graphs
Graph 1.1: Total receipts from taxes and compulsory actual social security contributions (%GDP) .. 12
Graph 1.2: Social protection expenditure, other government expenditure & tax (%GDP), 2014 ........ 13
Graph 1.3: Structure of Taxation by Economic Function of the Tax Base, 2014 (% total taxation) ... 14
Graph 2.1: Effective Marginal Tax Rates in the EU, 2005-2015 ......................................................... 19
Graph 2.2: The debt-equity tax bias in corporate financing in EU Member States, 2015. .................. 20
Graph 2.3. Change in overall mean cost of capital for ACE and CBIT Reforms. .................................. 21
Graph 2.4: Number of R&D tax incentives in the EU countries ............................................................ 22
Graph 2.5: Tax subsidy rates to R&D in the EU, 2015 ........................................................................ 23
Graph 2.6: Benchmark Scores for R&D tax incentives ......................................................................... 24
Graph 2.7: Marginal tax rates on petrol and diesel when used as propellants, 2016 ........................ 25
Graph 2.8: Subsidy for private use of company cars, 2014 ................................................................ 26
Graph 2.9: Administrative costs of tax authorities per 100 euro of taxes collected, 2010-2013 ..... 27
Graph 2.10: Number of hours needed to comply with taxes per year for a medium-sized company,
2011-2014 ............................................................................................................................................ 28
Graph 2.12: IT expenditure for every 100 euro of total revenue body expenditure, 2010-2013 ...... 31
Graph 2.13: Level of tax wedge in EU Member States, 2015 ............................................................. 32
Graph 2.14: Composition of tax wedge in EU Member States, 2015 .................................................. 33
Graph 2.15: Tax wedge for low income earners in EU Member States ............................................... 34
Graph 2.16: Inactivity trap for low income earners in EU Member States, 2015 ............................... 35
Graph 2.17: Inactivity trap for second earners in EU Member States, 2015 ...................................... 36
Graph 2.18: Low wage trap for second earners in EU Member States, 2015 ..................................... 37
Graph 2.19: Tax revenues from consumption taxes and implicit tax rate (ITR) on consumption, 2014
............................................................................................................................................................... 38
Graph 2.20: Tax revenues from property taxes as percentage of GDP – 2014 .................................. 39
Graph 2.21: Tax revenues from environmental taxes and implicit tax rate on energy, 2010-2014 .. 40
Graph 2.22: VAT gap as percentage of VAT theoretical liability, 2012-2014 ..................................... 43
Graph 2.23: Undisputed tax debt as a percentage of net revenue collection, 2010-2013 ............... 44
Graph 2.24 on FDI positions expressed in % of GDP, 2014 ................................................................ 47
Graph 2.25: Charges paid for the use of intellectual property expressed in % of GDP ...................... 48
Graph 2.26: Level of income inequality in EU Member States, 2015 .................................................. 49
Graph 2.27: Corrective power of the tax and benefit systems in EU Member States (Gini index) ..... 50
Graph 2.28: Redistributive effect of direct taxation, 2015 .................................................................. 51
Graph 2.29: Degree of progressivity of labour income taxation in EU Member States, 2015 ........... 52
GENERAL PRINCIPLES FOR FAIR AND EFFICIENT TAX SYSTEMS | 1
8 | P a g e
List of Figures
Figure 2.1: Pre-filling of personal income tax returns using third party information, 2013 .............. 29
Figure 2.2: Undeclared work as a share of GDP, most recent estimates ............................................ 41
List of Tables
Table 2.1: Value of the non-observed economy (NOE) as % GDP, reference years as specified ....... 40
Table 2.2: Overview of tax gap estimation in selected Member States .............................................. 42
Table 2.3 on the impact of tax planning on forward-looking effective average tax rate (EATR) ....... 44
Table 2.4: Overview of some anti-tax avoidance rules missing in Member States' national laws,
2015 ...................................................................................................................................................... 45
Table 2.5: Withholding taxes in EU Member States towards third country jurisdictions, 2015 .......... 45
GENERAL PRINCIPLES FOR FAIR AND EFFICIENT TAX SYSTEMS | 1
9 | P a g e
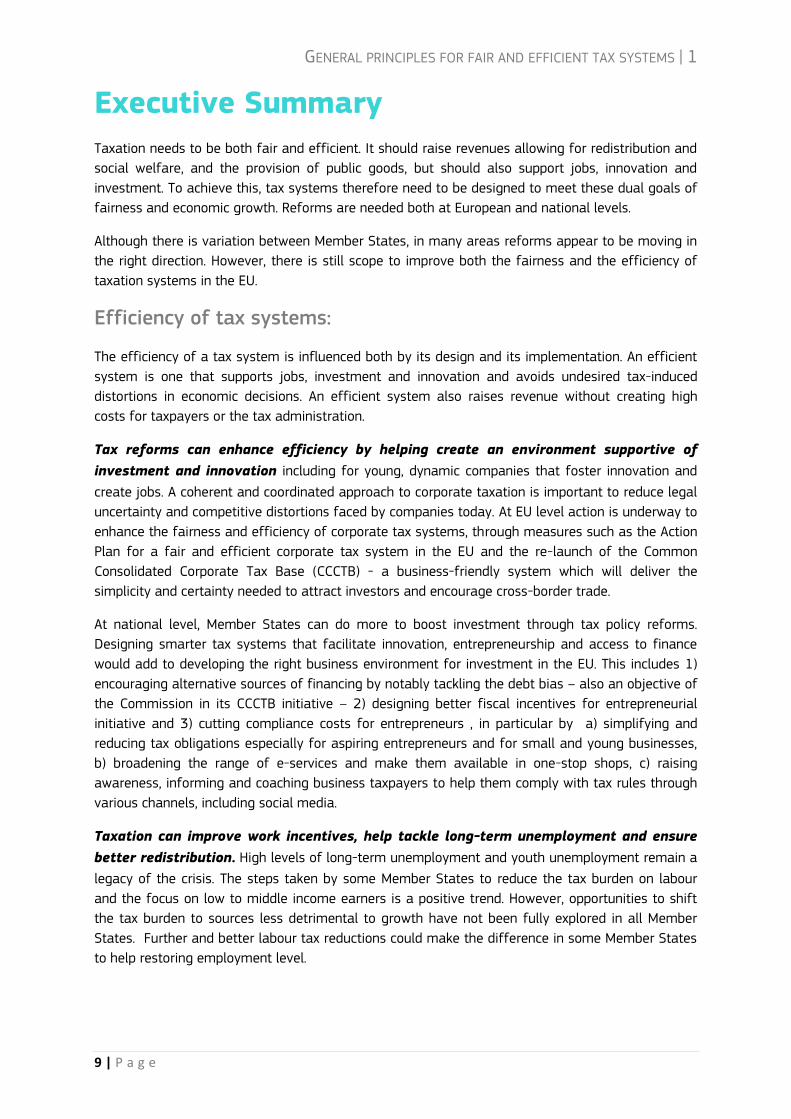
Executive Summary
Taxation needs to be both fair and efficient. It should raise revenues allowing for redistribution and
social welfare, and the provision of public goods, but should also support jobs, innovation and
investment. To achieve this, tax systems therefore need to be designed to meet these dual goals of
fairness and economic growth. Reforms are needed both at European and national levels.
Although there is variation between Member States, in many areas reforms appear to be moving in
the right direction. However, there is still scope to improve both the fairness and the efficiency of
taxation systems in the EU.
Efficiency of tax systems:
The efficiency of a tax system is influenced both by its design and its implementation. An efficient
system is one that supports jobs, investment and innovation and avoids undesired tax-induced
distortions in economic decisions. An efficient system also raises revenue without creating high
costs for taxpayers or the tax administration.
Tax reforms can enhance efficiency by helping create an environment supportive of
investment and innovation including for young, dynamic companies that foster innovation and
create jobs. A coherent and coordinated approach to corporate taxation is important to reduce legal
uncertainty and competitive distortions faced by companies today. At EU level action is underway to
enhance the fairness and efficiency of corporate tax systems, through measures such as the Action
Plan for a fair and efficient corporate tax system in the EU and the re-launch of the Common
Consolidated Corporate Tax Base (CCCTB) - a business-friendly system which will deliver the
simplicity and certainty needed to attract investors and encourage cross-border trade.
At national level, Member States can do more to boost investment through tax policy reforms.
Designing smarter tax systems that facilitate innovation, entrepreneurship and access to finance
would add to developing the right business environment for investment in the EU. This includes 1)
encouraging alternative sources of financing by notably tackling the debt bias – also an objective of
the Commission in its CCCTB initiative – 2) designing better fiscal incentives for entrepreneurial
initiative and 3) cutting compliance costs for entrepreneurs , in particular by a) simplifying and
reducing tax obligations especially for aspiring entrepreneurs and for small and young businesses,
b) broadening the range of e-services and make them available in one-stop shops, c) raising
awareness, informing and coaching business taxpayers to help them comply with tax rules through
various channels, including social media.
Taxation can improve work incentives, help tackle long-term unemployment and ensure
better redistribution. High levels of long-term unemployment and youth unemployment remain a
legacy of the crisis. The steps taken by some Member States to reduce the tax burden on labour
and the focus on low to middle income earners is a positive trend. However, opportunities to shift
the tax burden to sources less detrimental to growth have not been fully explored in all Member
States. Further and better labour tax reductions could make the difference in some Member States
to help restoring employment level.
GENERAL PRINCIPLES FOR FAIR AND EFFICIENT TAX SYSTEMS | 1
10 | P a g e
Fairness of tax systems
The fight against tax fraud, evasion and avoidance is essential to ensure fair burden-
sharing, as well as to secure tax revenues for public investment, education, healthcare or
welfare. In the EU alone, tens of billions of euro are still lost each year. Tackling tax abuse can
create the space needed to lower taxes for honest taxpayers. At EU level, a lot of progress has been
made in the fight against tax abuse, from increasing transparency on tax rulings and multinationals'
tax-related information, to securing common anti-abuse measures against the most pervasive tax
avoidance schemes and the Commission Action Plan on VAT.
The cross-border nature of tax evasion and avoidance and the integration of the Member States'
economies call for a coordinated approach, not only through European initiatives but also through
the coordination of national policies. Irrespective of progress made so far, it remains important to
keep up efforts against those who cheat the system. Member States need to fight tax evasion, tax
fraud and tax avoidance using a multichannel and coordinated approach. A multichannel approach
means using enforcement, but also prevention, by making tax authorities more modern and digital
to prevent and fight evasion, fraud and avoidance; and exploit better communication and
educational measures to promote a culture of transparency and tax compliance.
The fairness agenda is much more than the fight against fraud, evasion and avoidance.
Taxation also plays a role in reducing inequalities and promoting social justice. The crisis
has shown that our tax-and-benefits systems can be powerful instruments to reduce market
income inequalities, in particular in some Member States. In the current context of growing market
income inequalities, it remains important to consider the social impact of tax systems so as to strike
the right balance between efficiency and equity. Focusing labour tax cuts on groups facing the
greatest employment challenges and those most responsive to tax cuts, such as the long-term
unemployed, low-skilled workers and the young, can improve both the efficiency and fairness of
taxation.
Structure of the report
This report presents the state of play in Member States in relation to the twin taxation
priorities of efficiency and fairness. It aims to present in a clear and accessible fashion the
most recent reforms and the main indicators used by the Commission to assess Member States'
taxation policies in the context of the European Semester, which is the EU's annual cycle of
economic policy surveillance. This is in line with the Commission's commitment to increasing the
transparency and accountability of the European Semester process, as well as the use of
benchmarking.
Chapter 1 provides general background information on Member States' tax systems and a
description of what makes a fair and efficient tax system. Recognising that challenges are country-
specific, Chapter 2 gives an overarching picture of how national taxation systems perform according
to key indicators in the areas of investment, employment, tax compliance and redistribution. This
aims to help Member States to find the best approach to address their own specific challenges and
policy response. Chapter 3 reviews most recent tax reforms in EU countries, ending by drawing
some policy recommendations for the EU as a whole alongside inspiring examples from the
Member States.
GENERAL PRINCIPLES FOR FAIR AND EFFICIENT TAX SYSTEMS | 1
11 | P a g e
1 General principles for fair & efficient tax systems
1.1 Context
A well-designed tax system is both efficient and fair. It is able to raise revenue to finance public
expenditure, support growth, competitiveness and job creation, and also allows for socially-desired
redistribution. An 'optimal' design involves trade-offs and necessitate prioritisation of objectives
according to specific situations and choices of Member States. To ensure its legitimacy, public buy-
in is crucial for planned tax policy reforms.
1.1.1 No optimal level of taxation
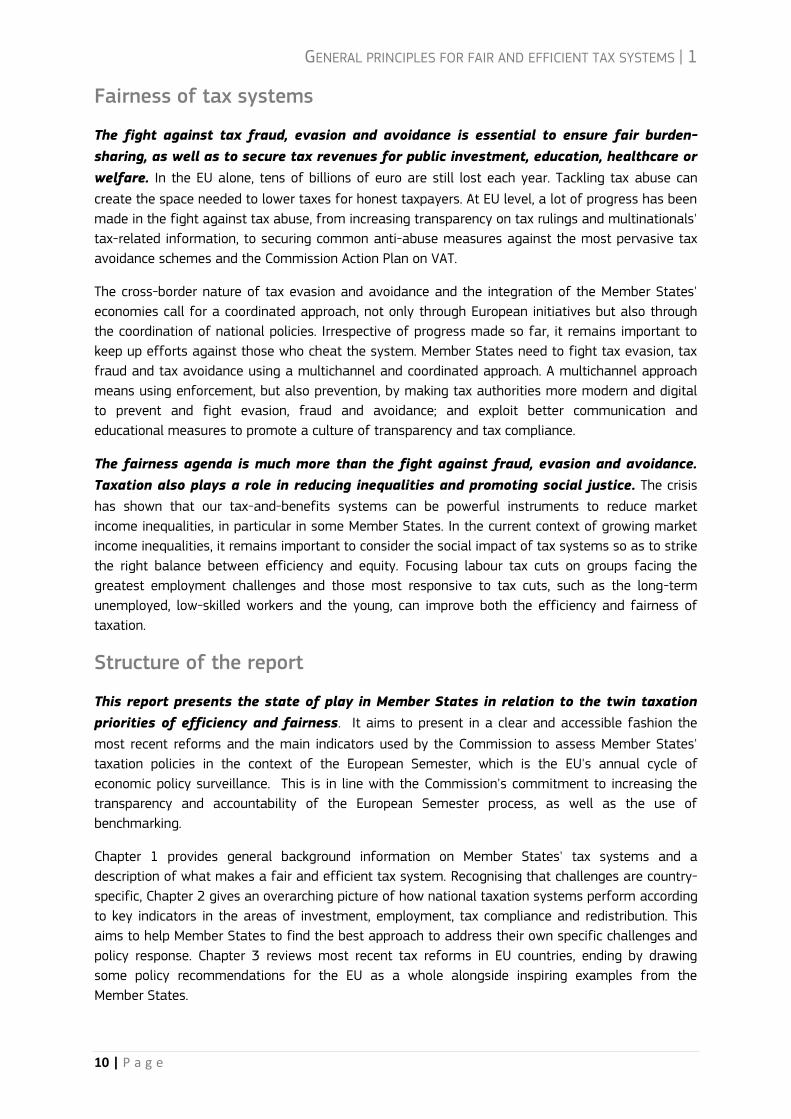
Strong evidence is lacking on the impact of the overall level of taxation on economic growth. The
level of taxation largely reflects social choices in terms of tax revenues and government
expenditure. Since 2010, the total tax revenue as a percentage of GDP has increased in most
Member States. However, the level of total taxation differs between Member States. In 2014, the
tax-to-GDP ratio varied between 49.9% in Denmark and 27.7% in Lithuania and Romania.
Graph 1.1: Total receipts from taxes and compulsory actual social security contributions (%GDP)
Source: European Commission (2016b), Taxation Trends in the European Union: Data for the EU Member States, Iceland and Norway. Edition 2016
0
10
20
30
40
50
60
Bel
giu
m
Bu
lgar
ia
Cze
ch R
epu
blic
Den
mar
k
Ger
man
y
Esto
nia
Irel
and
Gre
ece
Spai
n
Fran
ce
Cro
atia
Ital
y
Cyp
rus
Latv
ia
Lith
uan
ia
Luxe
mb
ou
rg
Hu
nga
ry
Mal
ta
Net
her
lan
ds
Au
stri
a
Po
lan
d
Po
rtu
gal
Ro
man
ia
Slo
ven
ia
Slo
vaki
a
Fin
lan
d
Swed
en
Un
ited
Kin
gdo
m
EU-2
8
% G
DP
2010 2014
GENERAL PRINCIPLES FOR FAIR AND EFFICIENT TAX SYSTEMS | 1
12 | P a g e
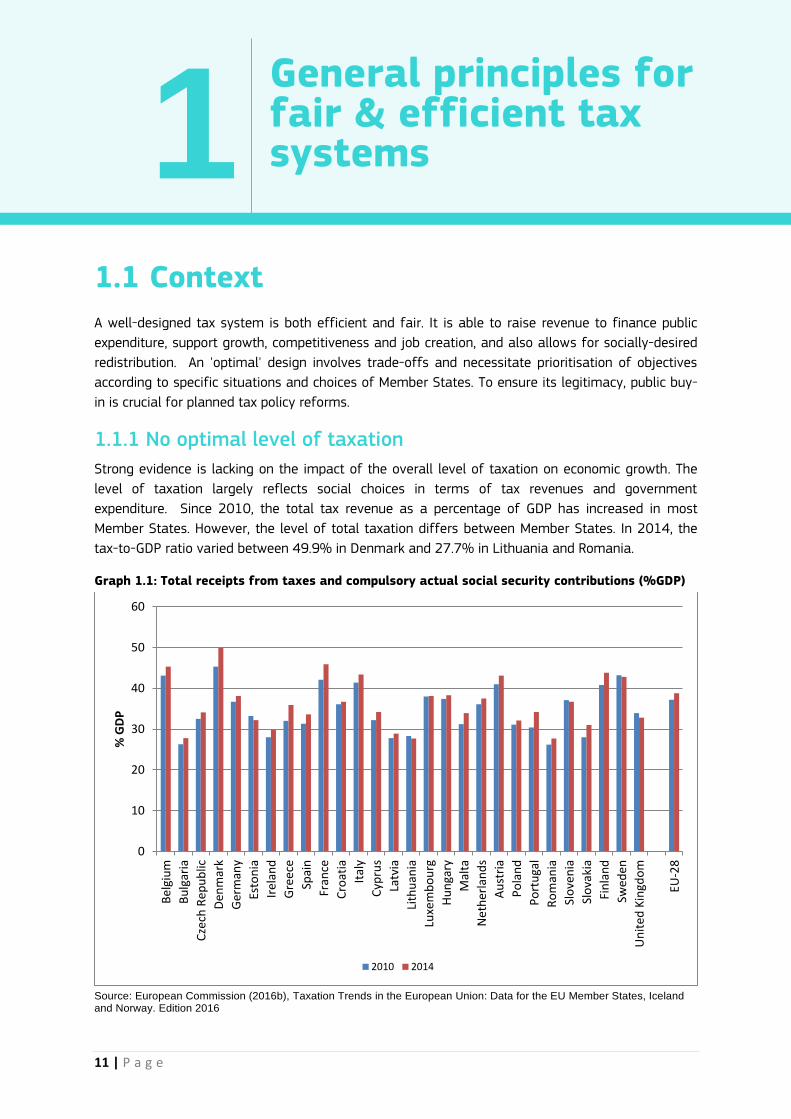
There are different social models in Europe and the amount of public money necessary to finance
them varies. Graph 1.2 (below) shows money spent on social protection in Member States. This
ranges from about one quarter of GDP in Denmark, France and Finland to less than 12% in Estonia,
Latvia, Lithuania and Romania. There is some correlation between the amount of tax collected and
that of government expenditure. Yet, in 2014 all Member States spent more than earned through
taxes, a crucial yet not exclusive mean to finance public budgets.
Graph 1.2: Social protection expenditure, other government expenditure & tax (%GDP), 2014
Source: DG Taxation and Customs Union, based on Eurostat data Note: The tax to GDP ratio shows the total receipts from taxes and compulsory actual social security contributions. Other sources of revenue (such as market output, output for own final use, payments for non-market production and property income) are not shown.
0%
10%
20%
30%
40%
50%
60%
Bel
giu
m
Bu
lgar
ia
Cze
ch R
ep.
Den
mar
k
Ger
man
y
Esto
nia
Irel
and
Gre
ece
Spai
n
Fran
ce
Cro
atia
Ital
y
Cyp
rus
Latv
ia
Lith
uan
ia
Luxe
mb
ou
rg
Hu
nga
ry
Mal
ta
Net
her
lan
ds
Au
stri
a
Po
lan
d
Po
rtu
gal
Ro
man
ia
Slo
ven
ia
Slo
vaki
a
Fin
lan
d
Swed
en UK
% o
f G
DP
Social protection Other expenditure Tax to GDP
GENERAL PRINCIPLES FOR FAIR AND EFFICIENT TAX SYSTEMS | 1
13 | P a g e
1.1.2 The structure of the tax system matters
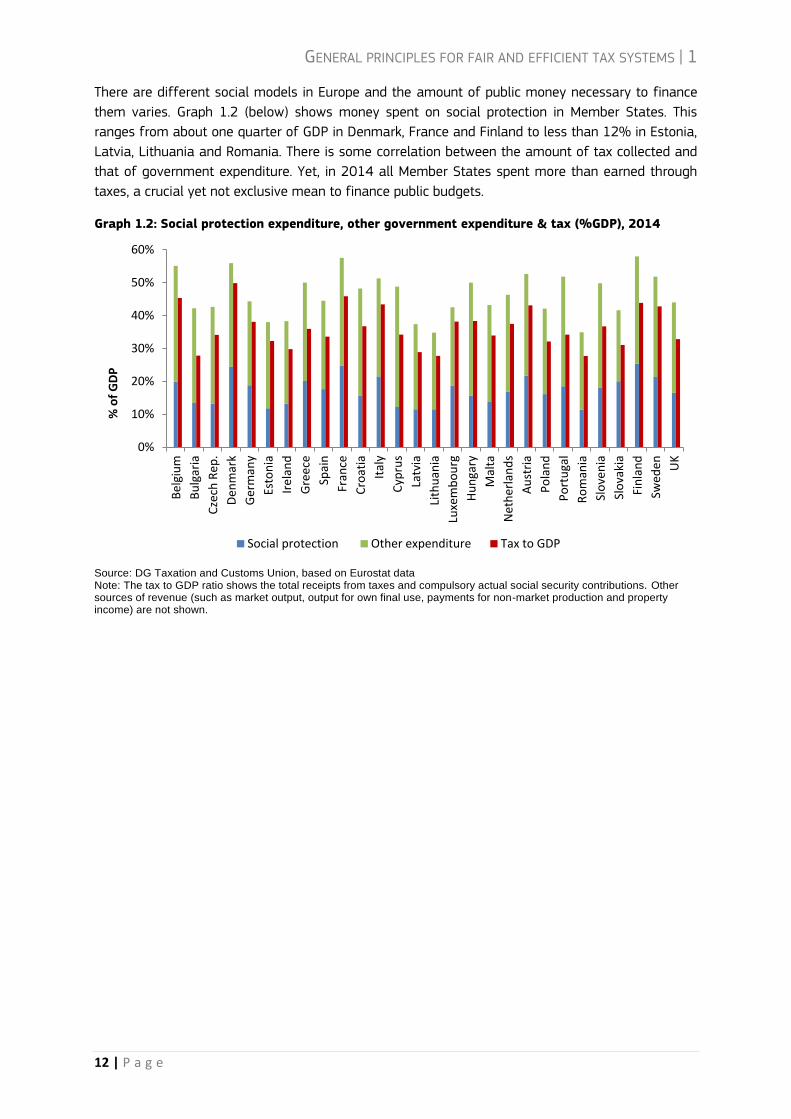
Member States also differ in the design of their tax systems according to tax rates and the choice
of which activities to tax. Improving the incentive effects of specific taxes or of the structure of
taxation overall can help improve efficiency and fairness. Graph 1.3 shows the structure of taxation
by economic function in Member States, illustrating the variation between countries.
Graph 1.3: Structure of Taxation by Economic Function of the Tax Base, 2014 (% total taxation)
Source: European Commission (2016b), Taxation Trends in the European Union Note: 'Capital' taxation includes all other categories not classed as labour or consumption.
0%10%20%30%40%50%60%70%80%90%
100%
Swed
en
Au
stri
a
Ger
man
y
Net
her
lan
ds
Bel
giu
m
Fran
ce
Slo
vaki
a
Fin
lan
d
Den
mar
k
Cze
ch R
epu
blic
Esto
nia
EU-2
8
Ital
y
Spai
n
Slo
ven
ia
Latv
ia
Lith
uan
ia
Hu
nga
ry
Luxe
mb
ou
rg
Irel
and
Po
rtu
gal
Cro
atia
Gre
ece
Po
lan
d
Ro
man
ia
Un
ited
Kin
gdo
m
Bu
lgar
ia
Cyp
rus
Mal
ta
Labour Capital Consumption
GENERAL PRINCIPLES FOR FAIR AND EFFICIENT TAX SYSTEMS | 1
14 | P a g e
1.2 What makes a fair and efficient tax system?
Key features to look at in assessing the fairness and efficiency of a tax system are the extent to
which it encourages investment and job creation, corrects inequalities and achieves high-levels of
compliance. Overall, whilst there are sometimes trade-offs between the goals of efficiency and
fairness, the two are by no means in opposition.
1.2.1 Stimulating investment and growth
European economies currently feature a pronounced weakness in corporate investment. Investment
is expected to continue to pick up gradually throughout 2016 and 2017, but it remains below
historically sustainable levels. Weak investment means lower growth, but it also depresses
productivity growth and entails poor job and growth prospects in the longer term. Boosting
investment is thus one of the Commission's top political priorities.
To avoid discouraging investment, taxes need to be simple, stable and neutral towards different
forms of investment and/or financing; tax administration needs to be efficient. Many factors
influence companies' investment decisions. Tax is one such factor since it increases the cost of
capital of companies and can create high compliance costs when tax systems are complex or
unpredictable. Taxation is thus an important element of a well-functioning business environment.
Effective and efficient tax administration, legal certainty, stability, predictability and simplicity of
tax rules matter for business and investors' decisions. Distortions in the tax system could affect
access to finance and discourage equity investments. A well-designed tax system could help
improve living standards by providing incentives for smart and green investment.
The efficiency of tax administration influences the level of public trust in the system. Taxpayers
tend to have greater trust in organisations that are perceived to be efficient and effective. In
addition to the costs of collecting taxes, one should also consider the costs related to paying taxes,
which are often referred to as tax compliance costs. Compliance costs can discourage the creation
of new businesses, incentive the underground economy, increase non-compliance and damage
businesses' and countries' competitiveness.
1.2.2 Developing a more employment-friendly environment
A long standing problem in Europe has been getting more people into work – a situation that only
worsened with the crisis. Despite recent progress made, unemployment – and especially long-term
unemployment – remains high. Half of the EU unemployed have been outside the labour market for
more than a year. Slow growth prospects and rising income inequalities are additional constraints
putting pressure on European social models. Targeted labour tax reductions for vulnerable groups
can contribute to increasing employment levels, as well as reducing poverty and social exclusion.
Labour tax cuts can be a tool promoting higher levels of employment, in particular where high
labour costs discourage hiring (i.e. labour demand issues) or where incentives to take a job are low
when work does not pay (i.e. labour supply issues). Reducing taxes on labour can be balanced by
increasing taxes elsewhere. Literature suggests that corporate and personal income tax have a
strong negative impact on growth while consumption taxes, in particular recurrent taxes on
immovable property, are found to be less harmful to growth. The potential room for a tax shift
depends on the existing tax structure. High levels of labour taxation together with a relatively low
tax burden on consumption taxes, recurrent property taxes, or environmental taxes indicate room to
shift taxes away from labour.
GENERAL PRINCIPLES FOR FAIR AND EFFICIENT TAX SYSTEMS | 1
15 | P a g e
1.2.3 Fighting against tax fraud evasion and avoidance
Tax fraud, tax evasion and tax avoidance limit the capacity of Member States to raise revenues and
to carry out their economic policy. The scale of tax evasion and avoidance is difficult to conclusively
quantify, but there is a general consensus that it is substantial, with tens of billions of euro lost
each year. Tackling tax evasion and fraud, whilst removing loopholes and mismatches that
facilitate aggressive tax planning is essential to ensure fairness and to secure tax revenues for
public investment, for education, healthcare or welfare; or for lowering taxes for honest taxpayers.
The cross-border nature of tax evasion and avoidance and the integration of the Member States'
economies call for a coordinated approach, not only through European initiatives but also through
the coordination of national policies. Member States can tackle tax abuse through increased
transparency and cross-border cooperation, a more modern and digital tax administration and by
promoting a culture of compliance.
1.2.4 Correcting inequalities and promoting social justice
The fairness agenda goes beyond the fight against fraud, evasion and avoidance. Taxation also
plays a role in reducing income inequalities and fostering social cohesion. The design of the
European social and economic model results in less inequality than in other developed economies,
such as the US. This is an important success for Europe. However, 23.7% of the EU population
remains at risk of poverty or social exclusion, with around 1 in 6 at risk of income poverty. There are
significant differences in both levels and trends between Member States. Tax-and-benefits systems
can be powerful instruments to combat income inequalities. It remains important to consider the
social impact of tax systems so as to strike the right balance between efficiency and equity of tax
design in line with countries' preferences.
Addressing income inequalities requires a broad approach: from the provision of public goods and
social spending to the way revenues are raised (i.e. the spread of the tax burden across taxpayers).
Focusing on taxation, it is first important that everyone pays their fair share. Second, the structure
of the system plays a key role. Beyond income taxation and cash benefits, the overall structure of
the tax system (including VAT, property taxes, capital gains tax, inheritance tax, progressivity of
personal income tax) can play a role to reduce inequalities and to foster social cohesion. Ensuring a
coherent and effective progressivity of the overall tax burden faced by citizens according to their
income sources can at best help to correct market income inequalities and at least avoid increasing
them.

NATIONAL TAX SYSTEMS PERFORMANCE| 2
16 | P a g e
NATIONAL TAX SYSTEMS PERFORMANCE| 2
17 | P a g e
2 National tax systems performance
At national level, there is no one-size fits all approach. Each Member State needs to find the best
approach to address its country specific situation. The following chapter presents a range of
indicators covering aspects of the tax systems of EU Member States in order to help member states
to find the best approach to address its own specific challenges and policy response.
2.1 Encouraging investment
As outlined in section 1.2, tax is one of the factors influencing companies' investment decisions. This
section examines features of Member States tax systems likely to influence decisions on
investment, looking at indicators on effective tax rates, debt-bias in corporate taxation, tax
incentives for R&D, environmental taxation and administrative efficiency.
NATIONAL TAX SYSTEMS PERFORMANCE| 2
18 | P a g e
2.1.1 Effective tax rates
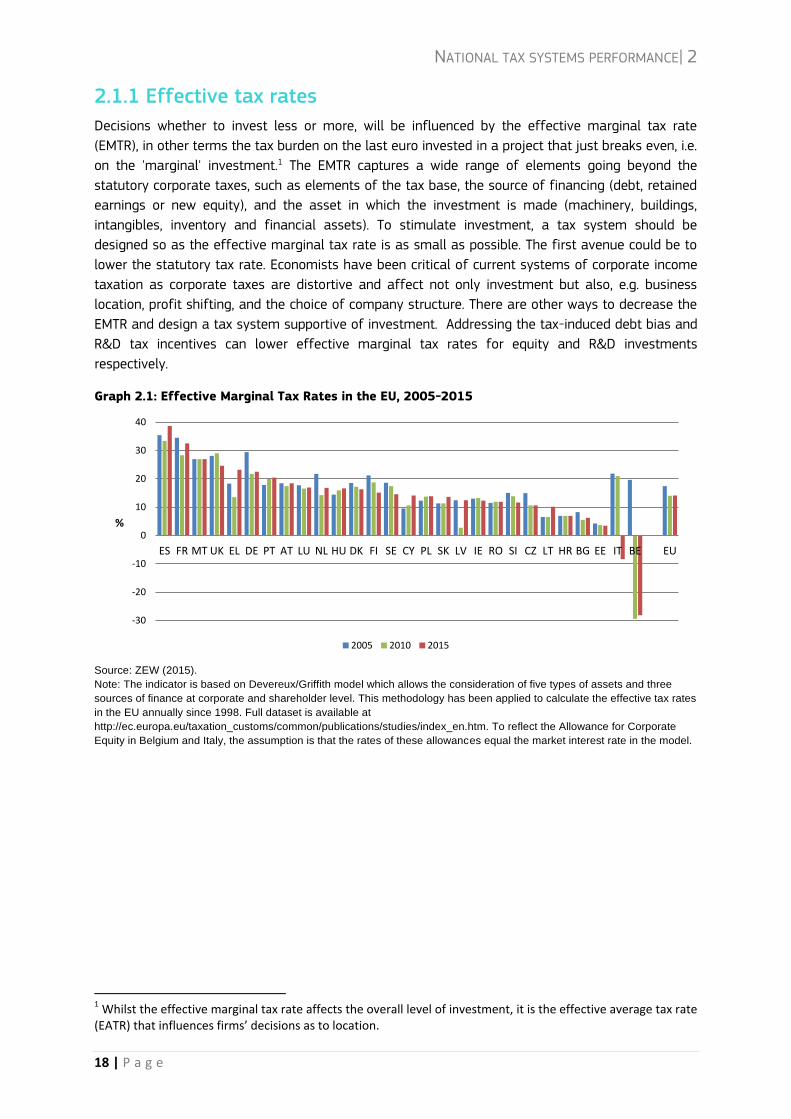
Decisions whether to invest less or more, will be influenced by the effective marginal tax rate
(EMTR), in other terms the tax burden on the last euro invested in a project that just breaks even, i.e.
on the 'marginal' investment.1 The EMTR captures a wide range of elements going beyond the
statutory corporate taxes, such as elements of the tax base, the source of financing (debt, retained
earnings or new equity), and the asset in which the investment is made (machinery, buildings,
intangibles, inventory and financial assets). To stimulate investment, a tax system should be
designed so as the effective marginal tax rate is as small as possible. The first avenue could be to
lower the statutory tax rate. Economists have been critical of current systems of corporate income
taxation as corporate taxes are distortive and affect not only investment but also, e.g. business
location, profit shifting, and the choice of company structure. There are other ways to decrease the
EMTR and design a tax system supportive of investment. Addressing the tax-induced debt bias and
R&D tax incentives can lower effective marginal tax rates for equity and R&D investments
respectively.
Graph 2.1: Effective Marginal Tax Rates in the EU, 2005-2015
Source: ZEW (2015).
Note: The indicator is based on Devereux/Griffith model which allows the consideration of five types of assets and three
sources of finance at corporate and shareholder level. This methodology has been applied to calculate the effective tax rates
in the EU annually since 1998. Full dataset is available at
http://ec.europa.eu/taxation_customs/common/publications/studies/index_en.htm. To reflect the Allowance for Corporate
Equity in Belgium and Italy, the assumption is that the rates of these allowances equal the market interest rate in the model.
1 Whilst the effective marginal tax rate affects the overall level of investment, it is the effective average tax rate (EATR) that influences firms’ decisions as to location.
-30
-20
-10
0
10
20
30
40
ES FR MT UK EL DE PT AT LU NL HU DK FI SE CY PL SK LV IE RO SI CZ LT HR BG EE IT BE EU
%
2005 2010 2015
NATIONAL TAX SYSTEMS PERFORMANCE| 2
19 | P a g e
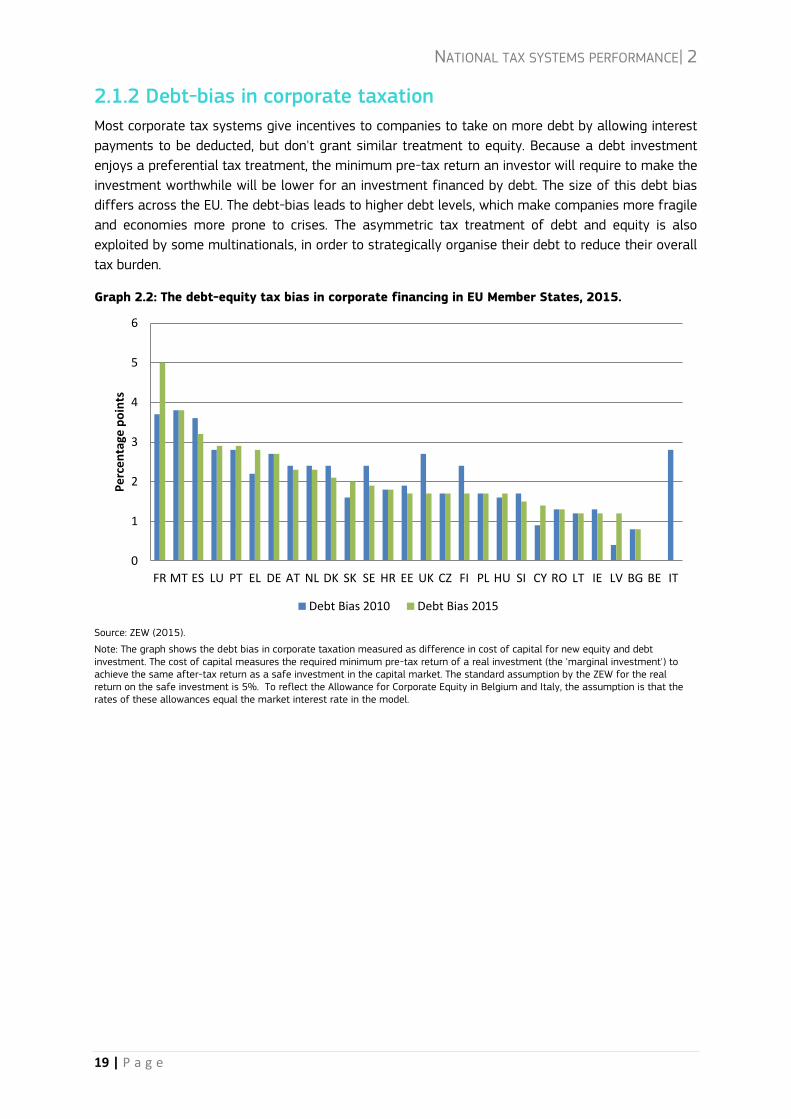
2.1.2 Debt-bias in corporate taxation
Most corporate tax systems give incentives to companies to take on more debt by allowing interest
payments to be deducted, but don't grant similar treatment to equity. Because a debt investment
enjoys a preferential tax treatment, the minimum pre-tax return an investor will require to make the
investment worthwhile will be lower for an investment financed by debt. The size of this debt bias
differs across the EU. The debt-bias leads to higher debt levels, which make companies more fragile
and economies more prone to crises. The asymmetric tax treatment of debt and equity is also
exploited by some multinationals, in order to strategically organise their debt to reduce their overall
tax burden.
Graph 2.2: The debt-equity tax bias in corporate financing in EU Member States, 2015.
Source: ZEW (2015).
Note: The graph shows the debt bias in corporate taxation measured as difference in cost of capital for new equity and debt investment. The cost of capital measures the required minimum pre-tax return of a real investment (the 'marginal investment') to achieve the same after-tax return as a safe investment in the capital market. The standard assumption by the ZEW for the real return on the safe investment is 5%. To reflect the Allowance for Corporate Equity in Belgium and Italy, the assumption is that the rates of these allowances equal the market interest rate in the model.
0
1
2
3
4
5
6
FR MT ES LU PT EL DE AT NL DK SK SE HR EE UK CZ FI PL HU SI CY RO LT IE LV BG BE IT
Pe
rce
nta
ge p
oin
ts
Debt Bias 2010 Debt Bias 2015
NATIONAL TAX SYSTEMS PERFORMANCE| 2
20 | P a g e
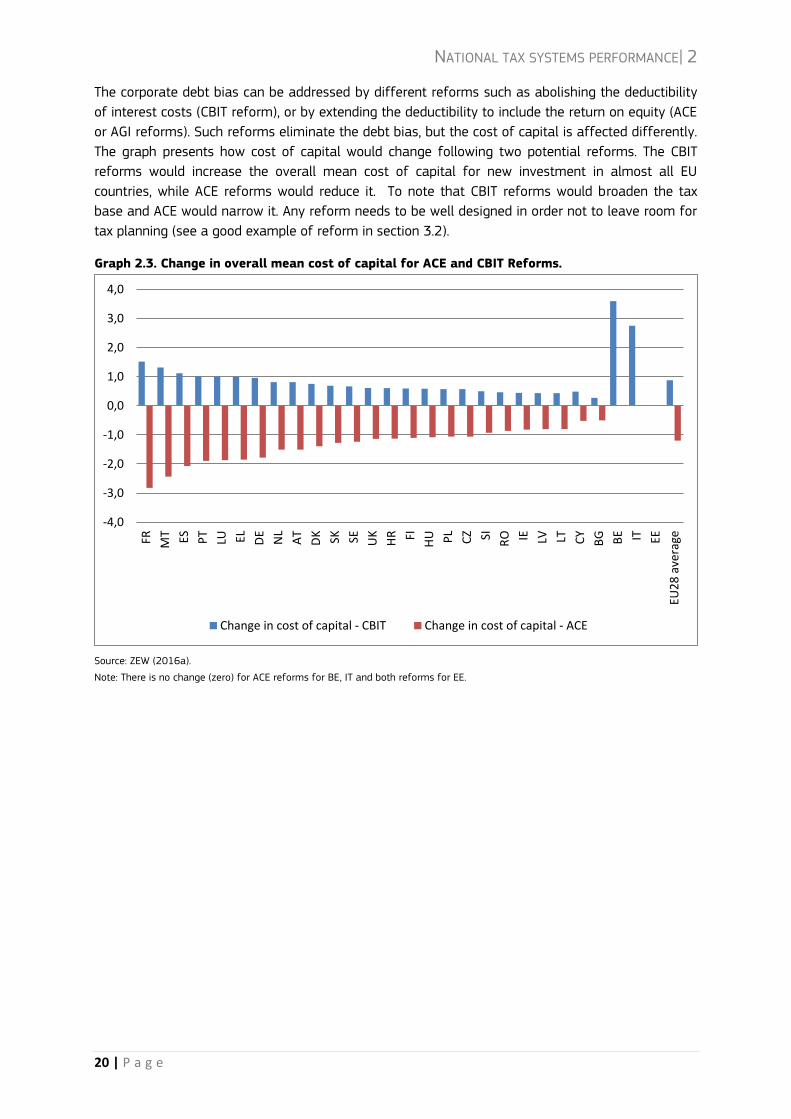
The corporate debt bias can be addressed by different reforms such as abolishing the deductibility
of interest costs (CBIT reform), or by extending the deductibility to include the return on equity (ACE
or AGI reforms). Such reforms eliminate the debt bias, but the cost of capital is affected differently.
The graph presents how cost of capital would change following two potential reforms. The CBIT
reforms would increase the overall mean cost of capital for new investment in almost all EU
countries, while ACE reforms would reduce it. To note that CBIT reforms would broaden the tax
base and ACE would narrow it. Any reform needs to be well designed in order not to leave room for
tax planning (see a good example of reform in section 3.2).
Graph 2.3. Change in overall mean cost of capital for ACE and CBIT Reforms.
Source: ZEW (2016a). Note: There is no change (zero) for ACE reforms for BE, IT and both reforms for EE.
-4,0
-3,0
-2,0
-1,0
0,0
1,0
2,0
3,0
4,0
FR MT ES PT
LU EL DE
NL
AT
DK SK SE UK
HR FI
HU PL
CZ SI RO IE LV LT CY
BG BE IT EE
EU2
8 a
vera
ge
Change in cost of capital - CBIT Change in cost of capital - ACE
NATIONAL TAX SYSTEMS PERFORMANCE| 2
21 | P a g e
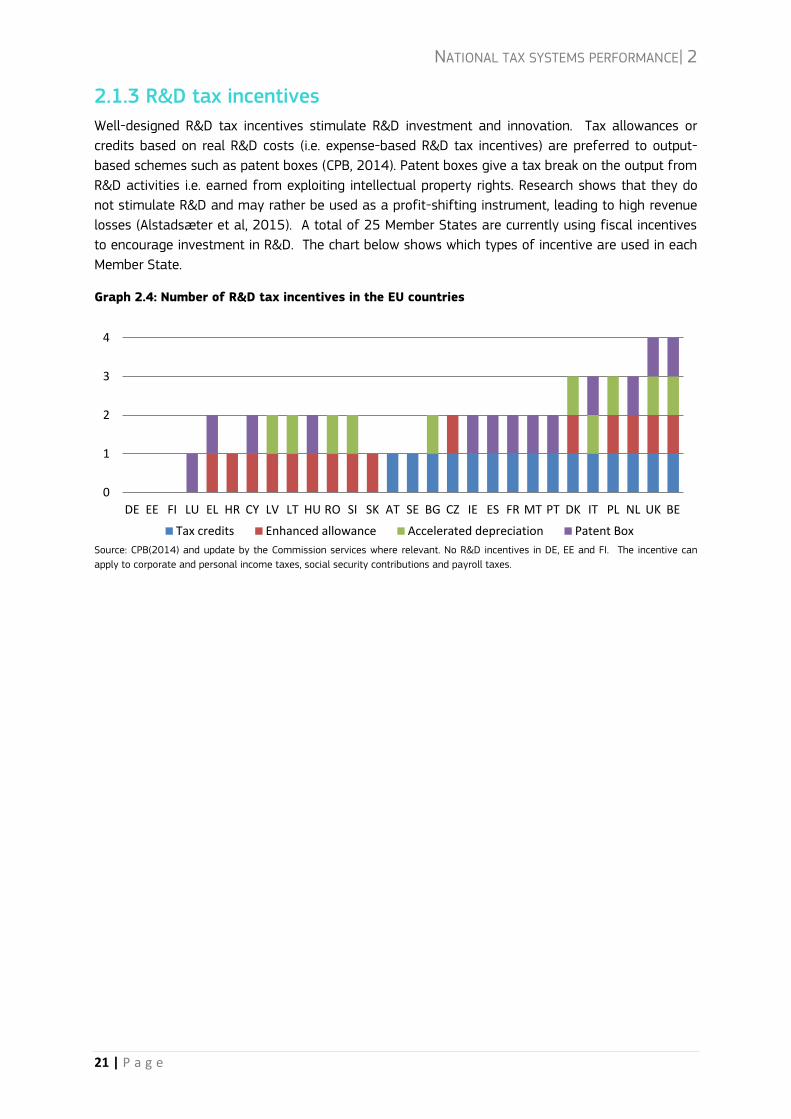
2.1.3 R&D tax incentives
Well-designed R&D tax incentives stimulate R&D investment and innovation. Tax allowances or
credits based on real R&D costs (i.e. expense-based R&D tax incentives) are preferred to output-
based schemes such as patent boxes (CPB, 2014). Patent boxes give a tax break on the output from
R&D activities i.e. earned from exploiting intellectual property rights. Research shows that they do
not stimulate R&D and may rather be used as a profit-shifting instrument, leading to high revenue
losses (Alstadsæter et al, 2015). A total of 25 Member States are currently using fiscal incentives
to encourage investment in R&D. The chart below shows which types of incentive are used in each
Member State.
Graph 2.4: Number of R&D tax incentives in the EU countries
Source: CPB(2014) and update by the Commission services where relevant. No R&D incentives in DE, EE and FI. The incentive can
apply to corporate and personal income taxes, social security contributions and payroll taxes.
0
1
2
3
4
DE EE FI LU EL HR CY LV LT HU RO SI SK AT SE BG CZ IE ES FR MT PT DK IT PL NL UK BE
Tax credits Enhanced allowance Accelerated depreciation Patent Box
NATIONAL TAX SYSTEMS PERFORMANCE| 2
22 | P a g e
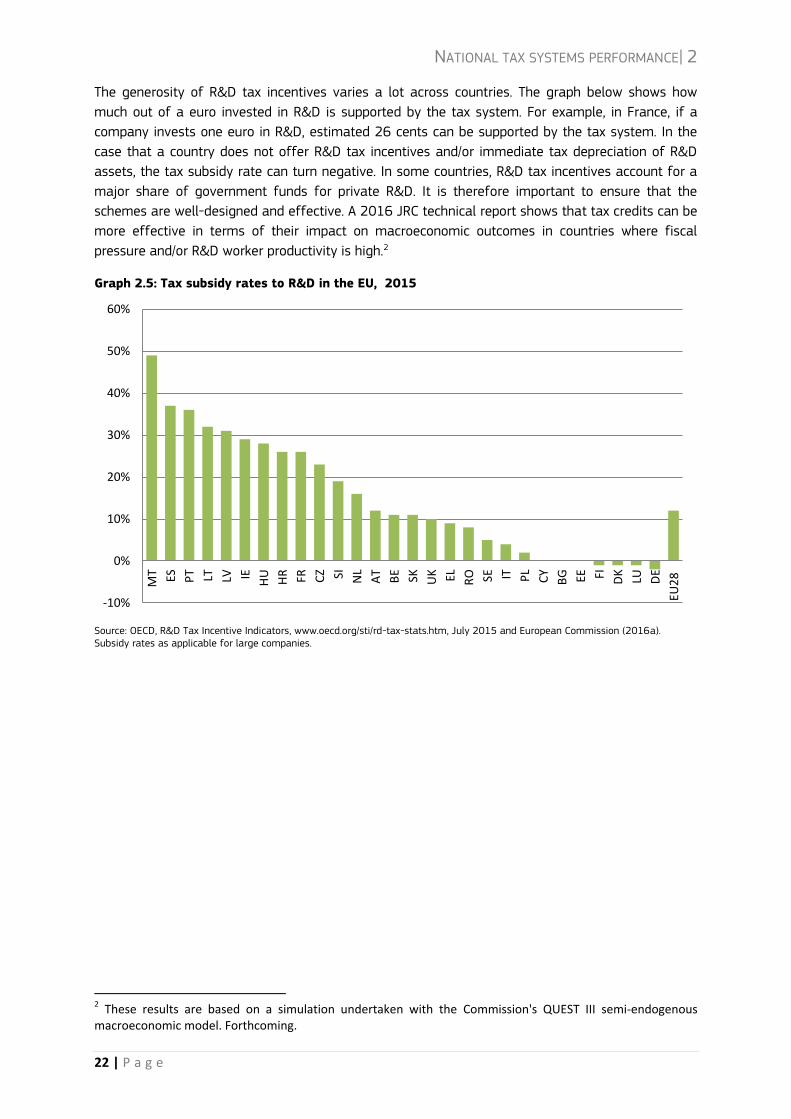
The generosity of R&D tax incentives varies a lot across countries. The graph below shows how
much out of a euro invested in R&D is supported by the tax system. For example, in France, if a
company invests one euro in R&D, estimated 26 cents can be supported by the tax system. In the
case that a country does not offer R&D tax incentives and/or immediate tax depreciation of R&D
assets, the tax subsidy rate can turn negative. In some countries, R&D tax incentives account for a
major share of government funds for private R&D. It is therefore important to ensure that the
schemes are well-designed and effective. A 2016 JRC technical report shows that tax credits can be
more effective in terms of their impact on macroeconomic outcomes in countries where fiscal
pressure and/or R&D worker productivity is high.2
Graph 2.5: Tax subsidy rates to R&D in the EU, 2015
Source: OECD, R&D Tax Incentive Indicators, www.oecd.org/sti/rd-tax-stats.htm, July 2015 and European Commission (2016a). Subsidy rates as applicable for large companies.
2 These results are based on a simulation undertaken with the Commission's QUEST III semi-endogenous macroeconomic model. Forthcoming.
-10%
0%
10%
20%
30%
40%
50%
60%
MT ES PT LT LV IE
HU
HR FR CZ SI NL
AT
BE SK UK EL RO SE IT PL
CY
BG EE FI DK
LU DE
EU2
8
NATIONAL TAX SYSTEMS PERFORMANCE| 2
23 | P a g e
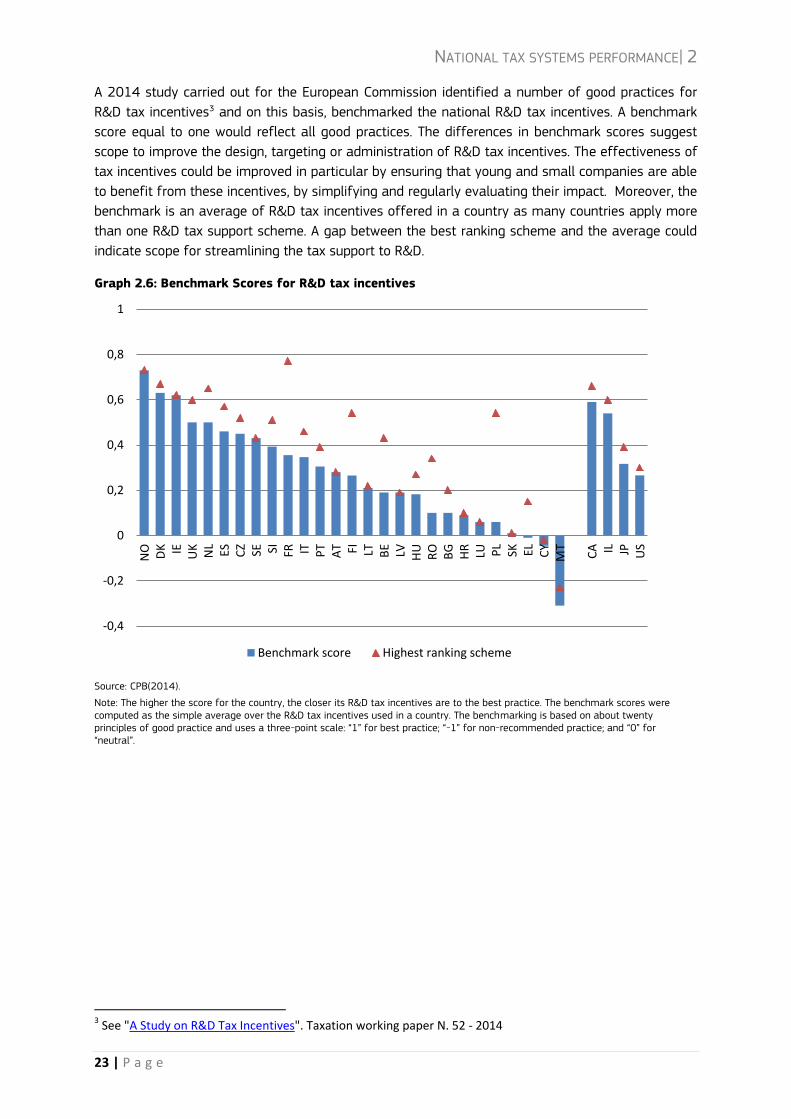
A 2014 study carried out for the European Commission identified a number of good practices for
R&D tax incentives3 and on this basis, benchmarked the national R&D tax incentives. A benchmark
score equal to one would reflect all good practices. The differences in benchmark scores suggest
scope to improve the design, targeting or administration of R&D tax incentives. The effectiveness of
tax incentives could be improved in particular by ensuring that young and small companies are able
to benefit from these incentives, by simplifying and regularly evaluating their impact. Moreover, the
benchmark is an average of R&D tax incentives offered in a country as many countries apply more
than one R&D tax support scheme. A gap between the best ranking scheme and the average could
indicate scope for streamlining the tax support to R&D.
Graph 2.6: Benchmark Scores for R&D tax incentives
Source: CPB(2014).
Note: The higher the score for the country, the closer its R&D tax incentives are to the best practice. The benchmark scores were computed as the simple average over the R&D tax incentives used in a country. The benchmarking is based on about twenty principles of good practice and uses a three-point scale: “1” for best practice; “-1” for non-recommended practice; and “0” for “neutral”.
3 See "A Study on R&D Tax Incentives". Taxation working paper N. 52 - 2014
-0,4
-0,2
0
0,2
0,4
0,6
0,8
1
NO DK IE UK
NL
ES CZ SE SI FR IT PT
AT FI LT BE LV HU
RO
BG
HR
LU PL
SK EL CY
MT
CA IL JP US
Benchmark score Highest ranking scheme
NATIONAL TAX SYSTEMS PERFORMANCE| 2
24 | P a g e
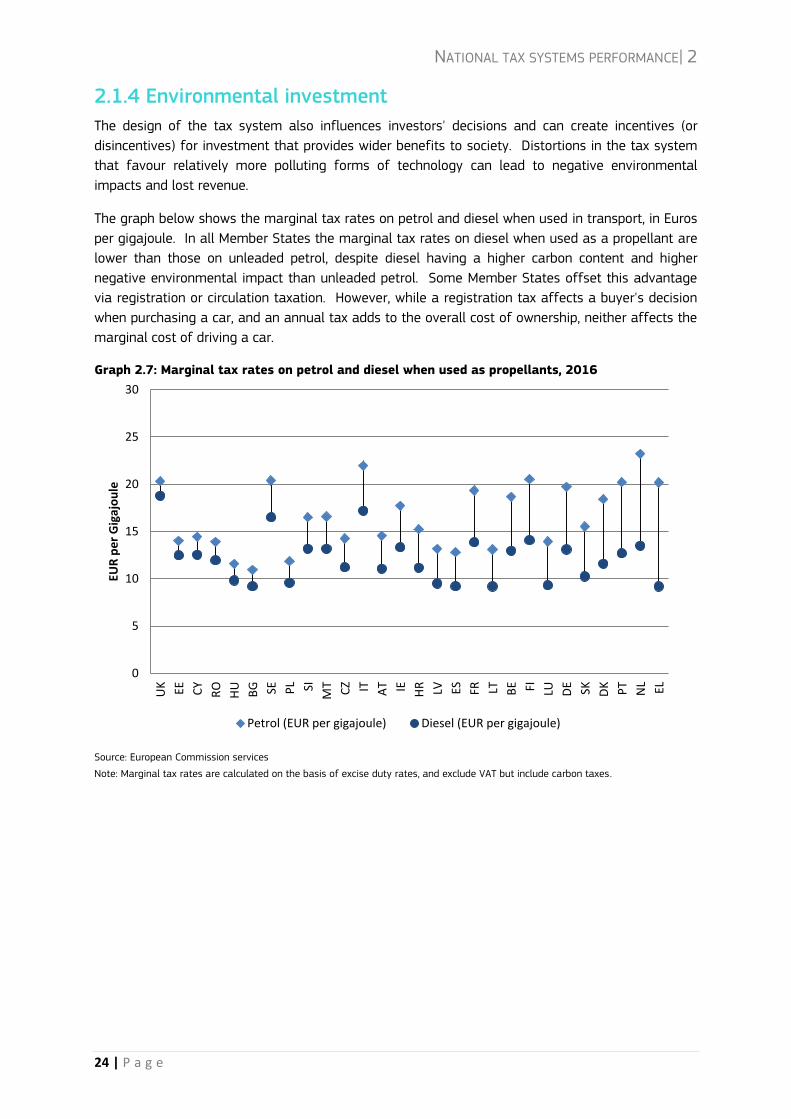
2.1.4 Environmental investment
The design of the tax system also influences investors' decisions and can create incentives (or
disincentives) for investment that provides wider benefits to society. Distortions in the tax system
that favour relatively more polluting forms of technology can lead to negative environmental
impacts and lost revenue.
The graph below shows the marginal tax rates on petrol and diesel when used in transport, in Euros
per gigajoule. In all Member States the marginal tax rates on diesel when used as a propellant are
lower than those on unleaded petrol, despite diesel having a higher carbon content and higher
negative environmental impact than unleaded petrol. Some Member States offset this advantage
via registration or circulation taxation. However, while a registration tax affects a buyer's decision
when purchasing a car, and an annual tax adds to the overall cost of ownership, neither affects the
marginal cost of driving a car.
Graph 2.7: Marginal tax rates on petrol and diesel when used as propellants, 2016
Source: European Commission services
Note: Marginal tax rates are calculated on the basis of excise duty rates, and exclude VAT but include carbon taxes.
0
5
10
15
20
25
30
UK EE CY
RO
HU
BG SE PL SI
MT
CZ IT AT IE HR LV ES FR LT BE FI LU DE SK DK PT
NL EL
EUR
pe
r G
igaj
ou
le
Petrol (EUR per gigajoule) Diesel (EUR per gigajoule)
NATIONAL TAX SYSTEMS PERFORMANCE| 2
25 | P a g e
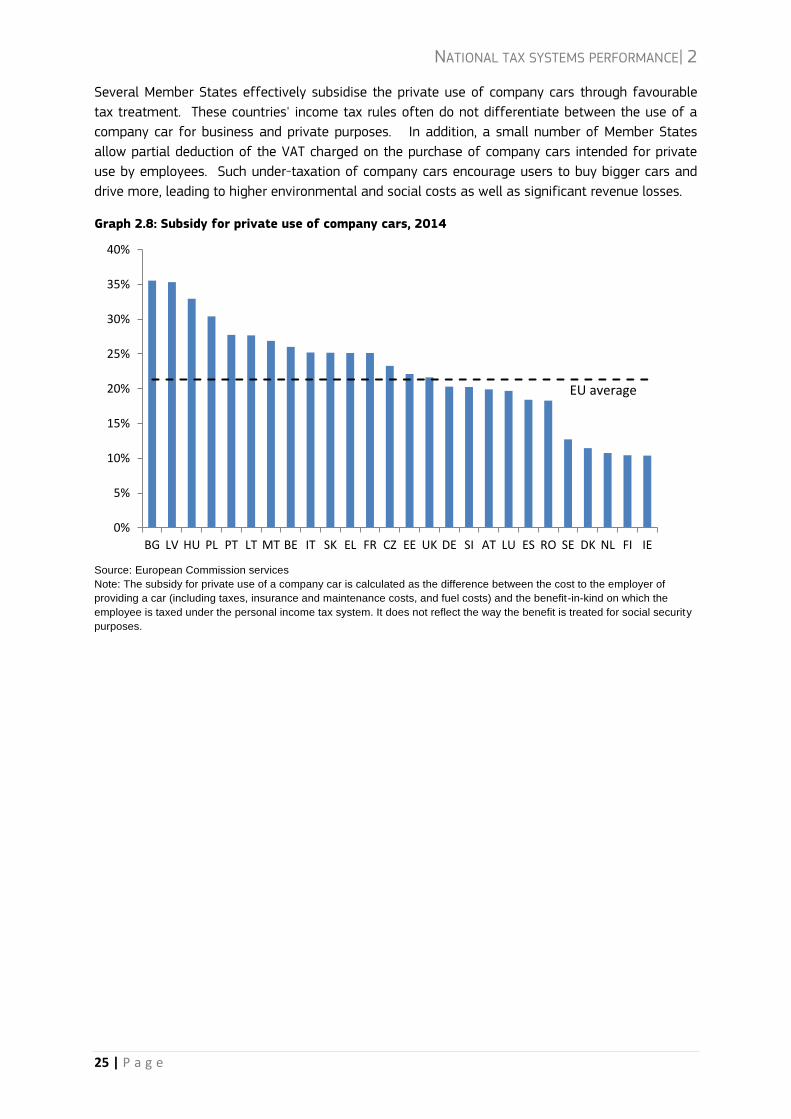
Several Member States effectively subsidise the private use of company cars through favourable
tax treatment. These countries' income tax rules often do not differentiate between the use of a
company car for business and private purposes. In addition, a small number of Member States
allow partial deduction of the VAT charged on the purchase of company cars intended for private
use by employees. Such under-taxation of company cars encourage users to buy bigger cars and
drive more, leading to higher environmental and social costs as well as significant revenue losses.
Graph 2.8: Subsidy for private use of company cars, 2014
Source: European Commission services
Note: The subsidy for private use of a company car is calculated as the difference between the cost to the employer of
providing a car (including taxes, insurance and maintenance costs, and fuel costs) and the benefit-in-kind on which the
employee is taxed under the personal income tax system. It does not reflect the way the benefit is treated for social security
purposes.
0%
5%
10%
15%
20%
25%
30%
35%
40%
BG LV HU PL PT LT MT BE IT SK EL FR CZ EE UK DE SI AT LU ES RO SE DK NL FI IE
EU average
NATIONAL TAX SYSTEMS PERFORMANCE| 2
26 | P a g e
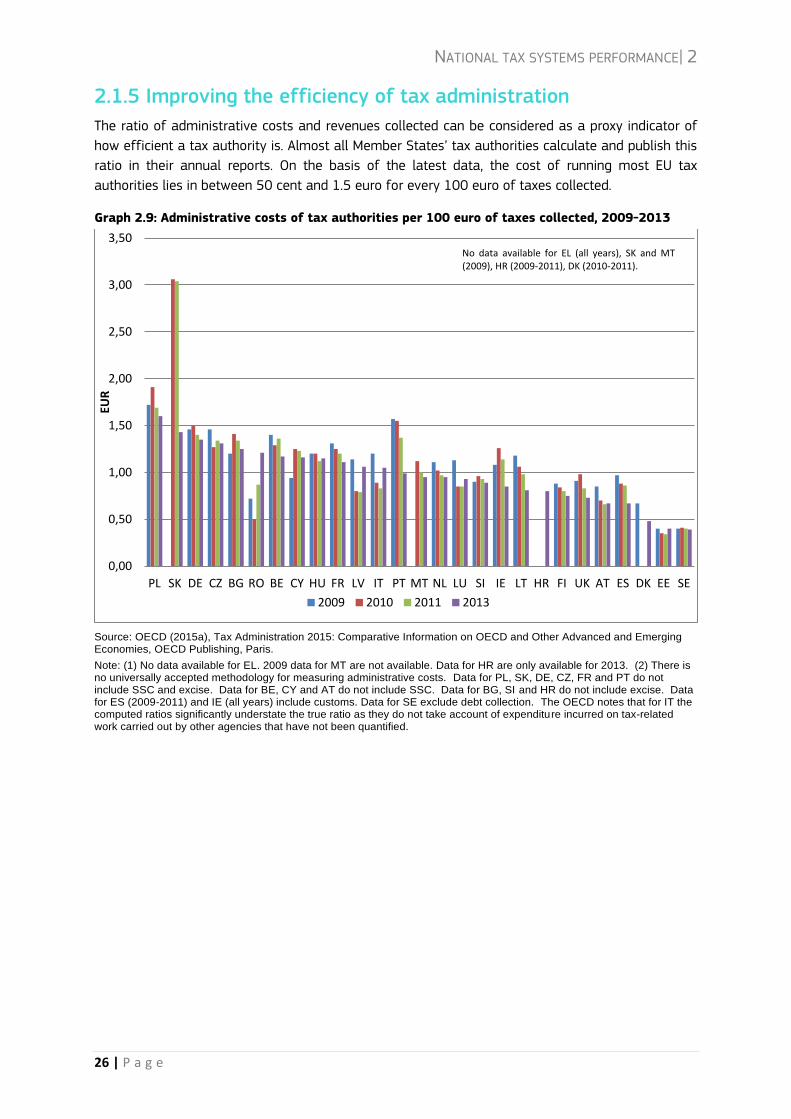
2.1.5 Improving the efficiency of tax administration
The ratio of administrative costs and revenues collected can be considered as a proxy indicator of
how efficient a tax authority is. Almost all Member States’ tax authorities calculate and publish this
ratio in their annual reports. On the basis of the latest data, the cost of running most EU tax
authorities lies in between 50 cent and 1.5 euro for every 100 euro of taxes collected.
Graph 2.9: Administrative costs of tax authorities per 100 euro of taxes collected, 2009-2013
Source: OECD (2015a), Tax Administration 2015: Comparative Information on OECD and Other Advanced and Emerging Economies, OECD Publishing, Paris.
Note: (1) No data available for EL. 2009 data for MT are not available. Data for HR are only available for 2013. (2) There is no universally accepted methodology for measuring administrative costs. Data for PL, SK, DE, CZ, FR and PT do not include SSC and excise. Data for BE, CY and AT do not include SSC. Data for BG, SI and HR do not include excise. Data for ES (2009-2011) and IE (all years) include customs. Data for SE exclude debt collection. The OECD notes that for IT the computed ratios significantly understate the true ratio as they do not take account of expenditure incurred on tax-related work carried out by other agencies that have not been quantified.
0,00
0,50
1,00
1,50
2,00
2,50
3,00
3,50
PL SK DE CZ BG RO BE CY HU FR LV IT PT MT NL LU SI IE LT HR FI UK AT ES DK EE SE
EUR
2009 2010 2011 2013
No data available for EL (all years), SK and MT (2009), HR (2009-2011), DK (2010-2011).
NATIONAL TAX SYSTEMS PERFORMANCE| 2
27 | P a g e
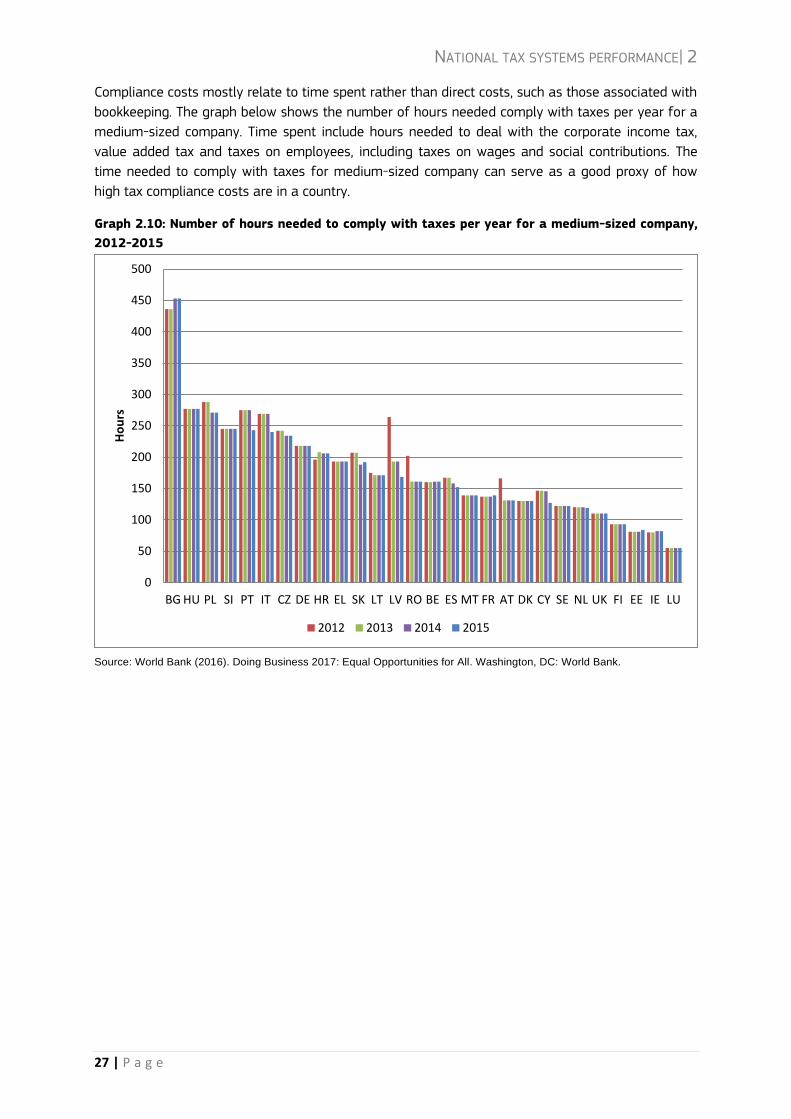
Compliance costs mostly relate to time spent rather than direct costs, such as those associated with
bookkeeping. The graph below shows the number of hours needed comply with taxes per year for a
medium-sized company. Time spent include hours needed to deal with the corporate income tax,
value added tax and taxes on employees, including taxes on wages and social contributions. The
time needed to comply with taxes for medium-sized company can serve as a good proxy of how
high tax compliance costs are in a country.
Graph 2.10: Number of hours needed to comply with taxes per year for a medium-sized company,
2012-2015
Source: World Bank (2016). Doing Business 2017: Equal Opportunities for All. Washington, DC: World Bank.
0
50
100
150
200
250
300
350
400
450
500
BG HU PL SI PT IT CZ DE HR EL SK LT LV RO BE ES MT FR AT DK CY SE NL UK FI EE IE LU
Ho
urs
2012 2013 2014 2015
NATIONAL TAX SYSTEMS PERFORMANCE| 2
28 | P a g e
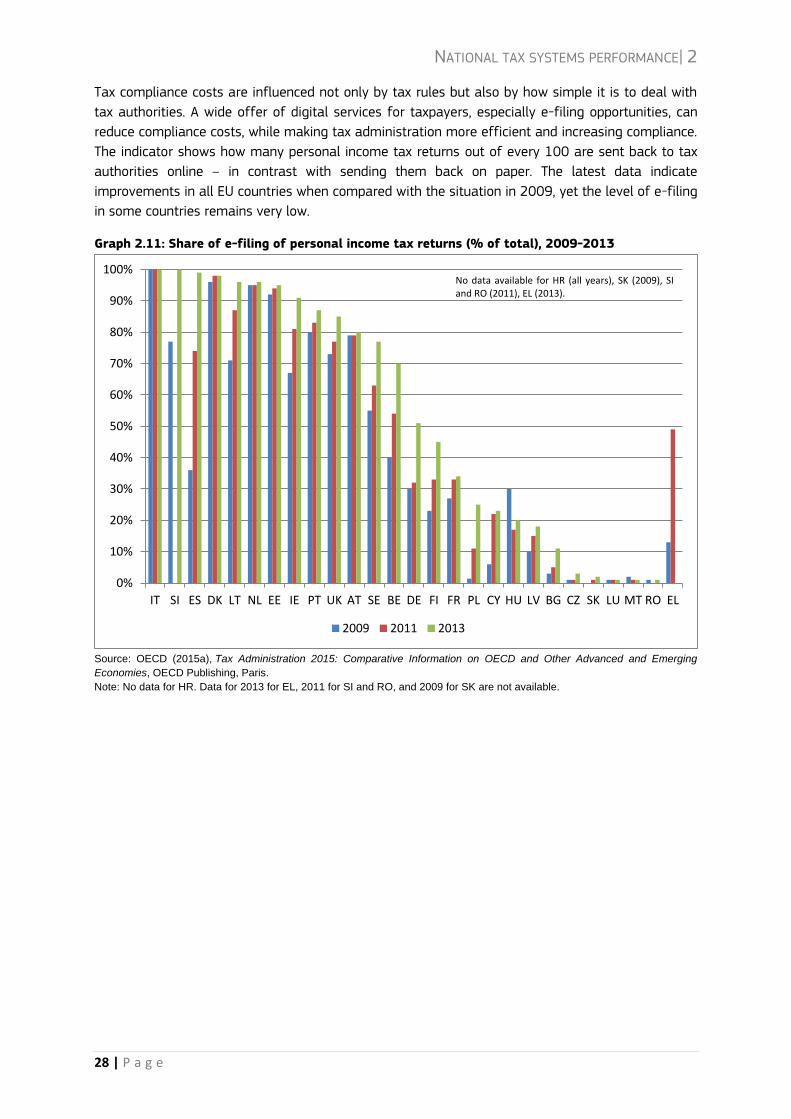
Tax compliance costs are influenced not only by tax rules but also by how simple it is to deal with
tax authorities. A wide offer of digital services for taxpayers, especially e-filing opportunities, can
reduce compliance costs, while making tax administration more efficient and increasing compliance.
The indicator shows how many personal income tax returns out of every 100 are sent back to tax
authorities online – in contrast with sending them back on paper. The latest data indicate
improvements in all EU countries when compared with the situation in 2009, yet the level of e-filing
in some countries remains very low.
Graph 2.11: Share of e-filing of personal income tax returns (% of total), 2009-2013
Source: OECD (2015a), Tax Administration 2015: Comparative Information on OECD and Other Advanced and Emerging
Economies, OECD Publishing, Paris.
Note: No data for HR. Data for 2013 for EL, 2011 for SI and RO, and 2009 for SK are not available.
0%
10%
20%
30%
40%
50%
60%
70%
80%
90%
100%
IT SI ES DK LT NL EE IE PT UK AT SE BE DE FI FR PL CY HU LV BG CZ SK LU MT RO EL
2009 2011 2013
No data available for HR (all years), SK (2009), SI and RO (2011), EL (2013).
NATIONAL TAX SYSTEMS PERFORMANCE| 2
29 | P a g e
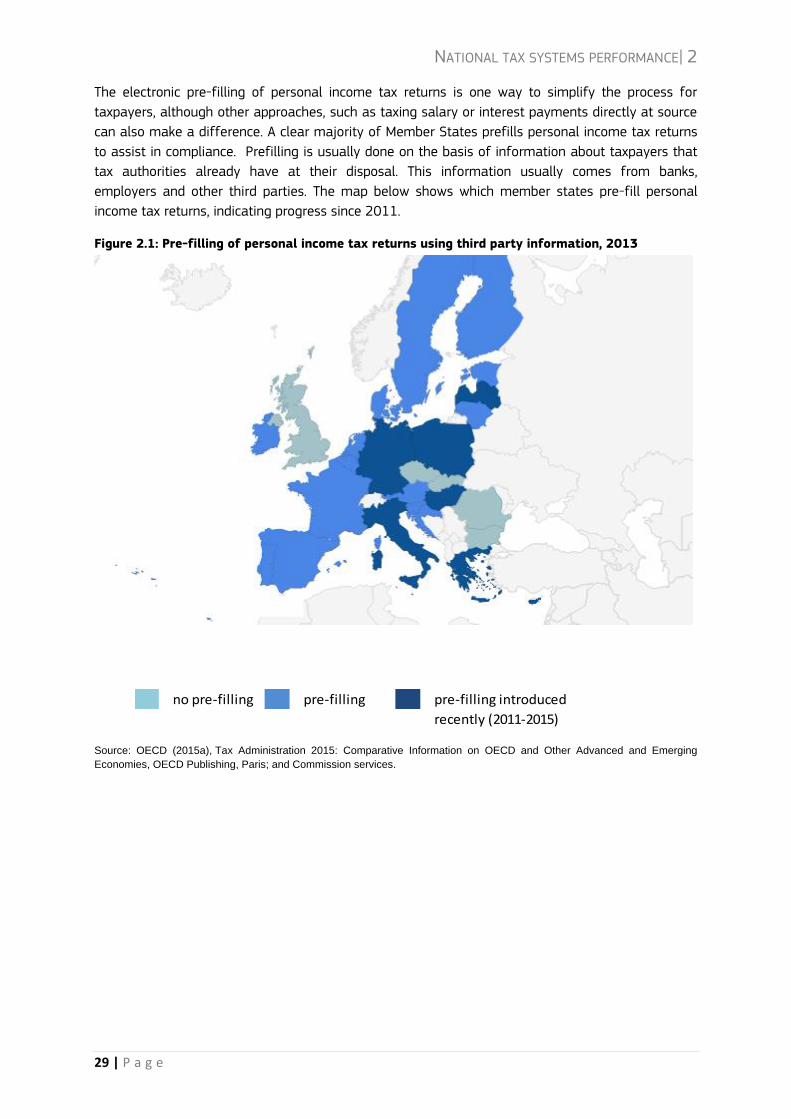
The electronic pre-filling of personal income tax returns is one way to simplify the process for
taxpayers, although other approaches, such as taxing salary or interest payments directly at source
can also make a difference. A clear majority of Member States prefills personal income tax returns
to assist in compliance. Prefilling is usually done on the basis of information about taxpayers that
tax authorities already have at their disposal. This information usually comes from banks,
employers and other third parties. The map below shows which member states pre-fill personal
income tax returns, indicating progress since 2011.
Figure 2.1: Pre-filling of personal income tax returns using third party information, 2013
Source: OECD (2015a), Tax Administration 2015: Comparative Information on OECD and Other Advanced and Emerging
Economies, OECD Publishing, Paris; and Commission services.
no pre-filling pre-filling pre-filling introduced
recently (2011-2015)
NATIONAL TAX SYSTEMS PERFORMANCE| 2
30 | P a g e
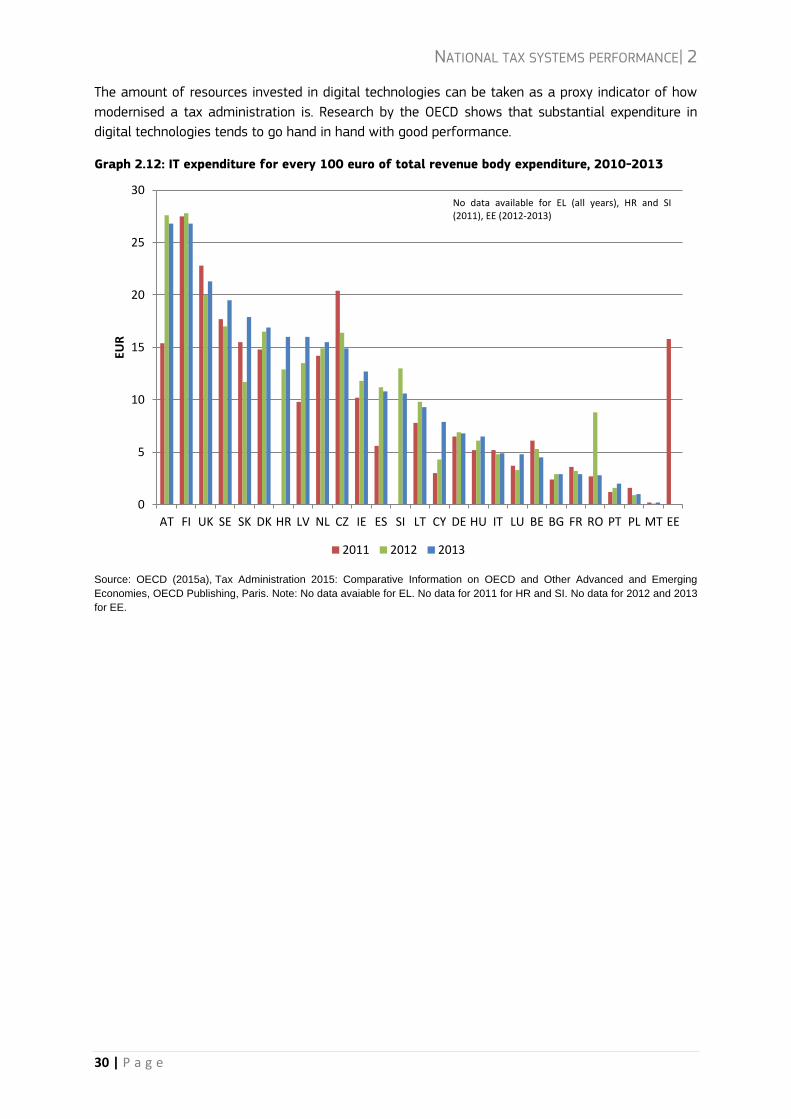
The amount of resources invested in digital technologies can be taken as a proxy indicator of how
modernised a tax administration is. Research by the OECD shows that substantial expenditure in
digital technologies tends to go hand in hand with good performance.
Graph 2.12: IT expenditure for every 100 euro of total revenue body expenditure, 2010-2013
Source: OECD (2015a), Tax Administration 2015: Comparative Information on OECD and Other Advanced and Emerging
Economies, OECD Publishing, Paris. Note: No data avaiable for EL. No data for 2011 for HR and SI. No data for 2012 and 2013
for EE.
0
5
10
15
20
25
30
AT FI UK SE SK DK HR LV NL CZ IE ES SI LT CY DE HU IT LU BE BG FR RO PT PL MT EE
EUR
2011 2012 2013
No data available for EL (all years), HR and SI (2011), EE (2012-2013)
NATIONAL TAX SYSTEMS PERFORMANCE| 2
31 | P a g e
2.2 Supporting job creation and employment
As explained in section 1.2, the design of the tax system can have an influence both demand for
and supply of labour, in particular in the short run. Shifting the tax burden from labour to bases
less detrimental to growth can help improve the efficiency of the tax system. Where scope for a
tax shift is limited, targeted tax cuts aimed at low income earners or more responsive groups can
be a way to improve both efficiency and fairness.
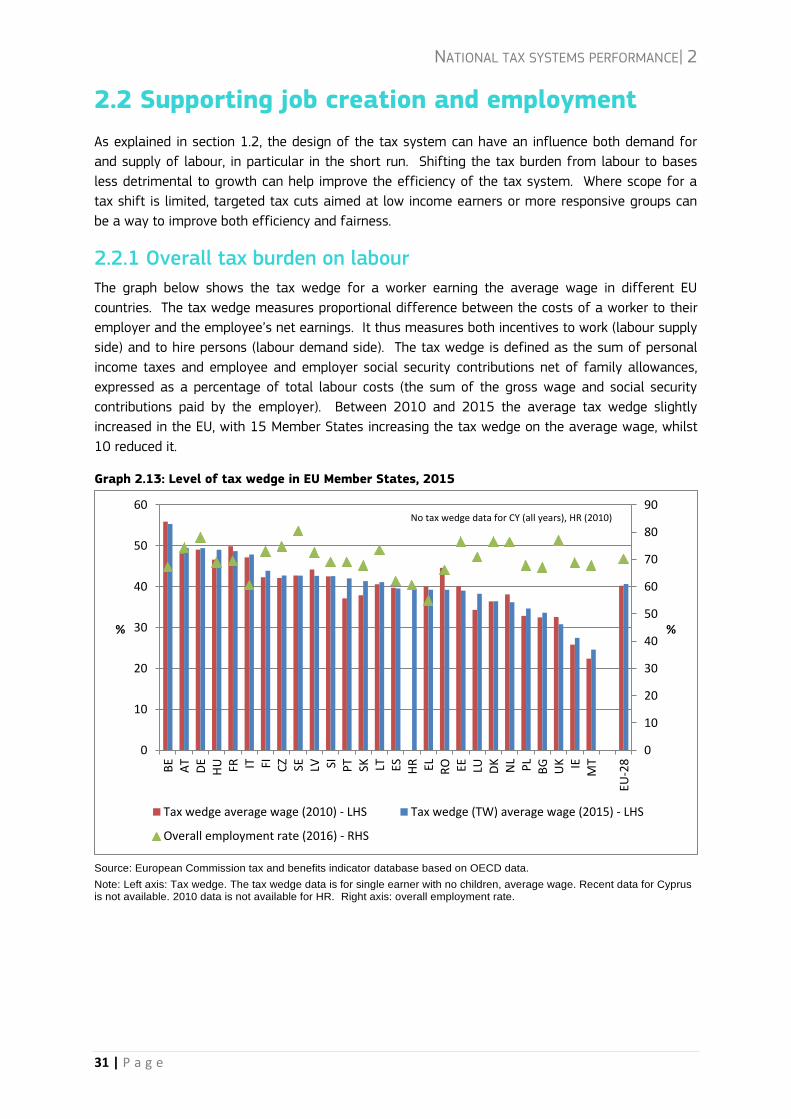
2.2.1 Overall tax burden on labour
The graph below shows the tax wedge for a worker earning the average wage in different EU
countries. The tax wedge measures proportional difference between the costs of a worker to their
employer and the employee’s net earnings. It thus measures both incentives to work (labour supply
side) and to hire persons (labour demand side). The tax wedge is defined as the sum of personal
income taxes and employee and employer social security contributions net of family allowances,
expressed as a percentage of total labour costs (the sum of the gross wage and social security
contributions paid by the employer). Between 2010 and 2015 the average tax wedge slightly
increased in the EU, with 15 Member States increasing the tax wedge on the average wage, whilst
10 reduced it.
Graph 2.13: Level of tax wedge in EU Member States, 2015
Source: European Commission tax and benefits indicator database based on OECD data.
Note: Left axis: Tax wedge. The tax wedge data is for single earner with no children, average wage. Recent data for Cyprus is not available. 2010 data is not available for HR. Right axis: overall employment rate.
0
10
20
30
40
50
60
70
80
90
0
10
20
30
40
50
60
BE
AT
DE
HU FR IT FI CZ SE LV SI PT SK LT ES HR EL RO EE LU DK
NL
PL
BG
UK IE
MT
EU-2
8%
%
Tax wedge average wage (2010) - LHS Tax wedge (TW) average wage (2015) - LHS
Overall employment rate (2016) - RHS
No tax wedge data for CY (all years), HR (2010)
NATIONAL TAX SYSTEMS PERFORMANCE| 2
32 | P a g e
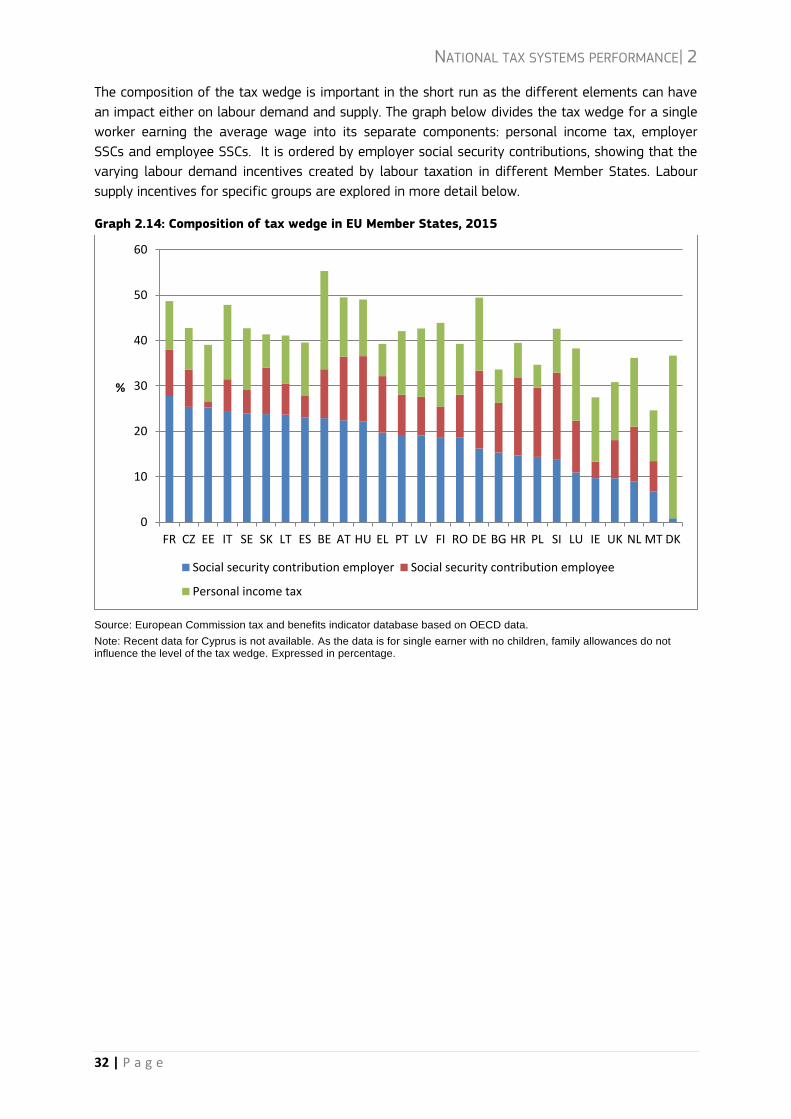
The composition of the tax wedge is important in the short run as the different elements can have
an impact either on labour demand and supply. The graph below divides the tax wedge for a single
worker earning the average wage into its separate components: personal income tax, employer
SSCs and employee SSCs. It is ordered by employer social security contributions, showing that the
varying labour demand incentives created by labour taxation in different Member States. Labour
supply incentives for specific groups are explored in more detail below.
Graph 2.14: Composition of tax wedge in EU Member States, 2015
Source: European Commission tax and benefits indicator database based on OECD data.
Note: Recent data for Cyprus is not available. As the data is for single earner with no children, family allowances do not influence the level of the tax wedge. Expressed in percentage.
0
10
20
30
40
50
60
FR CZ EE IT SE SK LT ES BE AT HU EL PT LV FI RO DE BG HR PL SI LU IE UK NL MT DK
%
Social security contribution employer Social security contribution employee
Personal income tax
NATIONAL TAX SYSTEMS PERFORMANCE| 2
33 | P a g e
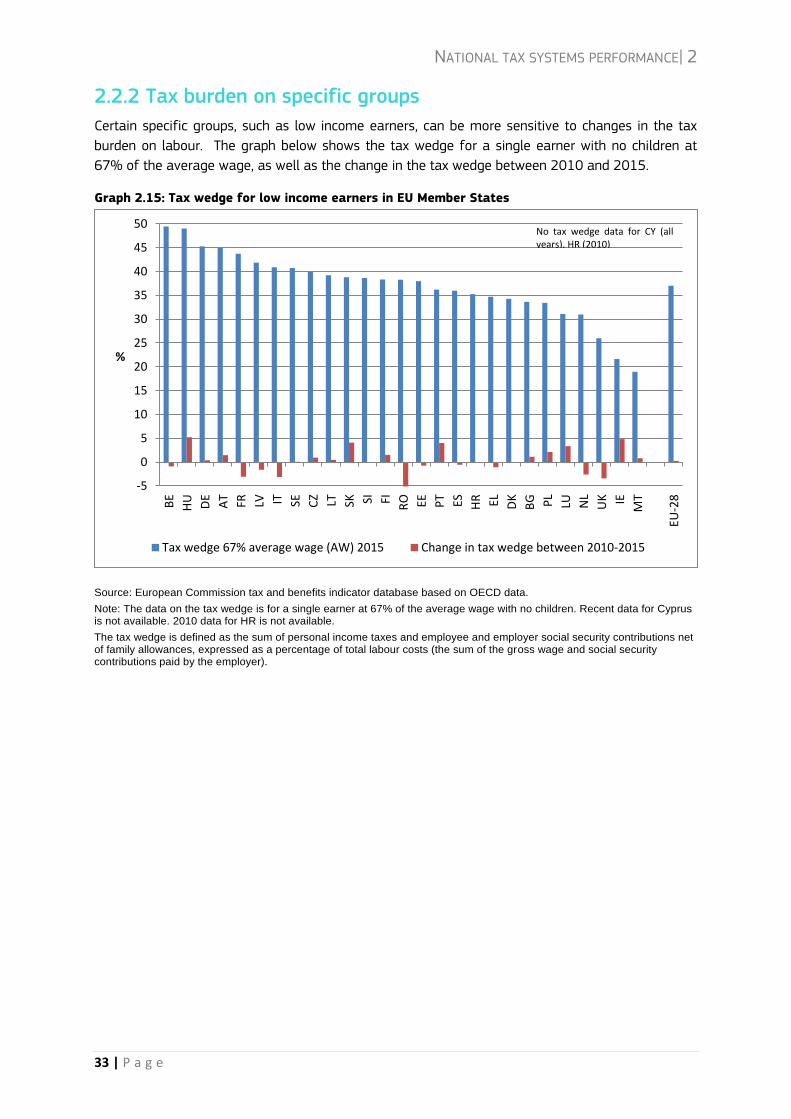
2.2.2 Tax burden on specific groups
Certain specific groups, such as low income earners, can be more sensitive to changes in the tax
burden on labour. The graph below shows the tax wedge for a single earner with no children at
67% of the average wage, as well as the change in the tax wedge between 2010 and 2015.
Graph 2.15: Tax wedge for low income earners in EU Member States
Source: European Commission tax and benefits indicator database based on OECD data.
Note: The data on the tax wedge is for a single earner at 67% of the average wage with no children. Recent data for Cyprus is not available. 2010 data for HR is not available.
The tax wedge is defined as the sum of personal income taxes and employee and employer social security contributions net of family allowances, expressed as a percentage of total labour costs (the sum of the gross wage and social security contributions paid by the employer).
-5
0
5
10
15
20
25
30
35
40
45
50
BE
HU DE
AT
FR LV IT SE CZ LT SK SI FI RO EE PT ES HR EL DK
BG PL
LU NL
UK IE
MT
EU-2
8
%
Tax wedge 67% average wage (AW) 2015 Change in tax wedge between 2010-2015
No tax wedge data for CY (all years), HR (2010)
NATIONAL TAX SYSTEMS PERFORMANCE| 2
34 | P a g e
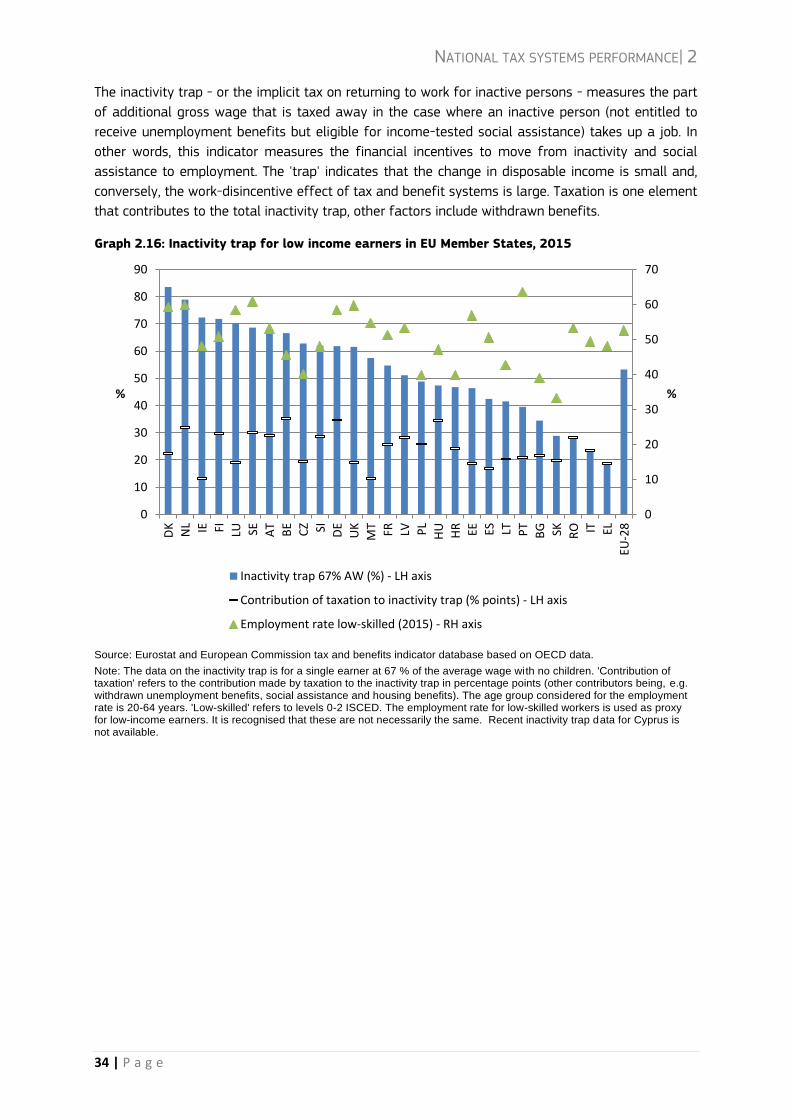
The inactivity trap - or the implicit tax on returning to work for inactive persons - measures the part
of additional gross wage that is taxed away in the case where an inactive person (not entitled to
receive unemployment benefits but eligible for income-tested social assistance) takes up a job. In
other words, this indicator measures the financial incentives to move from inactivity and social
assistance to employment. The 'trap' indicates that the change in disposable income is small and,
conversely, the work-disincentive effect of tax and benefit systems is large. Taxation is one element
that contributes to the total inactivity trap, other factors include withdrawn benefits.
Graph 2.16: Inactivity trap for low income earners in EU Member States, 2015
Source: Eurostat and European Commission tax and benefits indicator database based on OECD data.
Note: The data on the inactivity trap is for a single earner at 67 % of the average wage with no children. 'Contribution of taxation' refers to the contribution made by taxation to the inactivity trap in percentage points (other contributors being, e.g. withdrawn unemployment benefits, social assistance and housing benefits). The age group considered for the employment rate is 20-64 years. 'Low-skilled' refers to levels 0-2 ISCED. The employment rate for low-skilled workers is used as proxy for low-income earners. It is recognised that these are not necessarily the same. Recent inactivity trap data for Cyprus is not available.
0
10
20
30
40
50
60
70
0
10
20
30
40
50
60
70
80
90
DK
NL IE FI LU SE AT
BE
CZ SI DE
UK
MT
FR LV PL
HU
HR EE ES LT PT
BG SK RO IT EL
EU-2
8
%
%
Inactivity trap 67% AW (%) - LH axis
Contribution of taxation to inactivity trap (% points) - LH axis
Employment rate low-skilled (2015) - RH axis
NATIONAL TAX SYSTEMS PERFORMANCE| 2
35 | P a g e
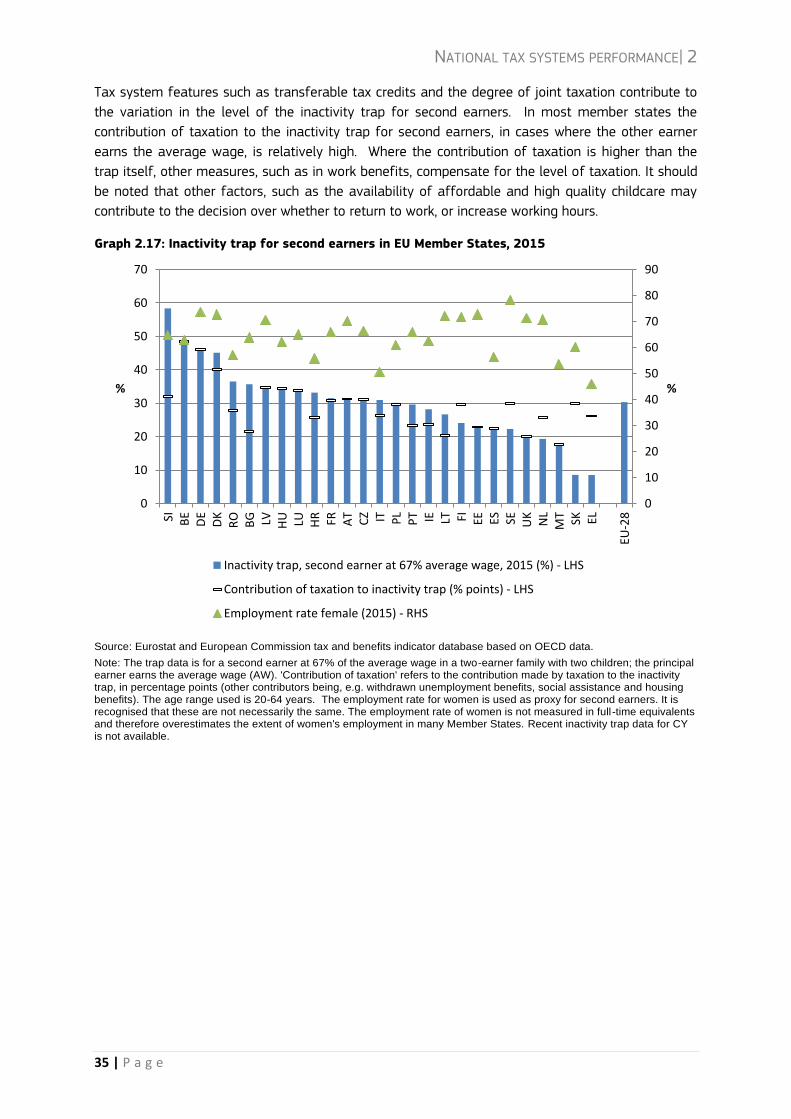
Tax system features such as transferable tax credits and the degree of joint taxation contribute to
the variation in the level of the inactivity trap for second earners. In most member states the
contribution of taxation to the inactivity trap for second earners, in cases where the other earner
earns the average wage, is relatively high. Where the contribution of taxation is higher than the
trap itself, other measures, such as in work benefits, compensate for the level of taxation. It should
be noted that other factors, such as the availability of affordable and high quality childcare may
contribute to the decision over whether to return to work, or increase working hours.
Graph 2.17: Inactivity trap for second earners in EU Member States, 2015
Source: Eurostat and European Commission tax and benefits indicator database based on OECD data.
Note: The trap data is for a second earner at 67% of the average wage in a two-earner family with two children; the principal earner earns the average wage (AW). 'Contribution of taxation' refers to the contribution made by taxation to the inactivity trap, in percentage points (other contributors being, e.g. withdrawn unemployment benefits, social assistance and housing benefits). The age range used is 20-64 years. The employment rate for women is used as proxy for second earners. It is recognised that these are not necessarily the same. The employment rate of women is not measured in full -time equivalents and therefore overestimates the extent of women's employment in many Member States. Recent inactivity trap data for CY is not available.
0
10
20
30
40
50
60
70
80
90
0
10
20
30
40
50
60
70
SI BE
DE
DK
RO
BG LV HU LU HR FR AT
CZ IT PL
PT IE LT FI EE ES SE UK
NL
MT SK EL
EU-2
8
%
%
Inactivity trap, second earner at 67% average wage, 2015 (%) - LHS
Contribution of taxation to inactivity trap (% points) - LHS
Employment rate female (2015) - RHS
NATIONAL TAX SYSTEMS PERFORMANCE| 2
36 | P a g e
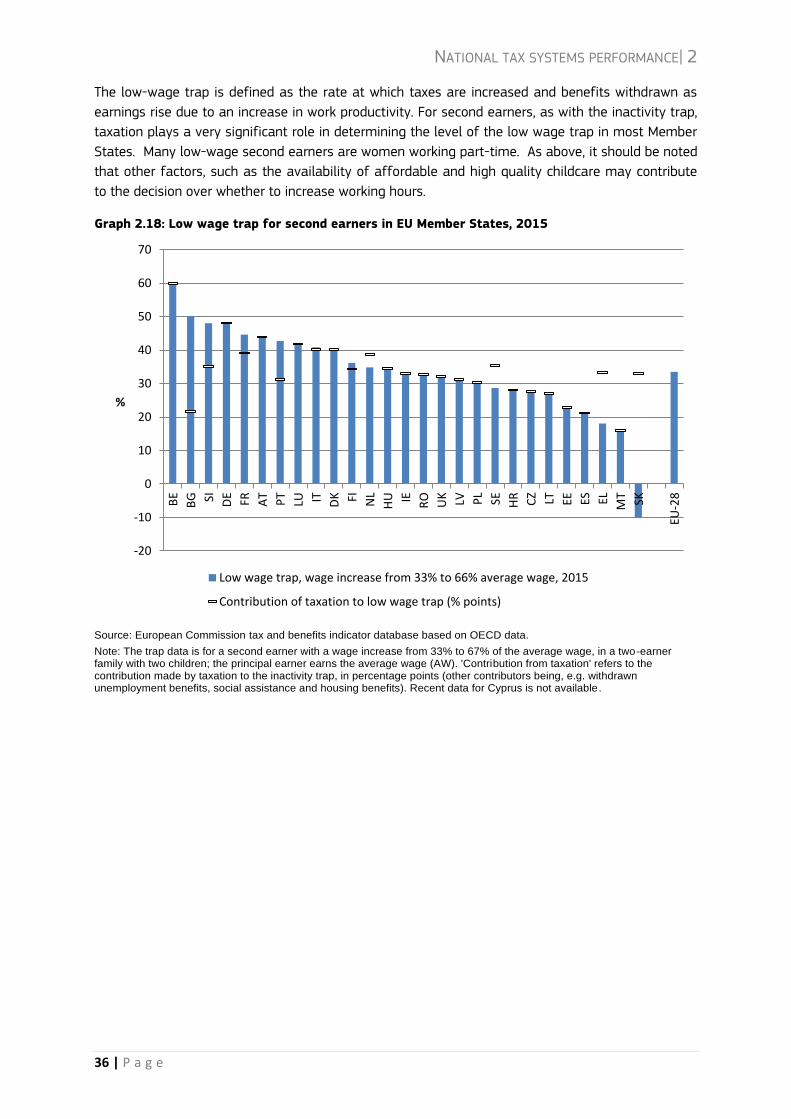
The low-wage trap is defined as the rate at which taxes are increased and benefits withdrawn as
earnings rise due to an increase in work productivity. For second earners, as with the inactivity trap,
taxation plays a very significant role in determining the level of the low wage trap in most Member
States. Many low-wage second earners are women working part-time. As above, it should be noted
that other factors, such as the availability of affordable and high quality childcare may contribute
to the decision over whether to increase working hours.
Graph 2.18: Low wage trap for second earners in EU Member States, 2015
Source: European Commission tax and benefits indicator database based on OECD data.
Note: The trap data is for a second earner with a wage increase from 33% to 67% of the average wage, in a two-earner family with two children; the principal earner earns the average wage (AW). 'Contribution from taxation' refers to the contribution made by taxation to the inactivity trap, in percentage points (other contributors being, e.g. withdrawn unemployment benefits, social assistance and housing benefits). Recent data for Cyprus is not available.
-20
-10
0
10
20
30
40
50
60
70
BE
BG SI DE
FR AT
PT
LU IT DK FI NL
HU IE RO
UK LV PL
SE HR CZ LT EE ES EL MT SK
EU-2
8
%
Low wage trap, wage increase from 33% to 66% average wage, 2015
Contribution of taxation to low wage trap (% points)
NATIONAL TAX SYSTEMS PERFORMANCE| 2
37 | P a g e
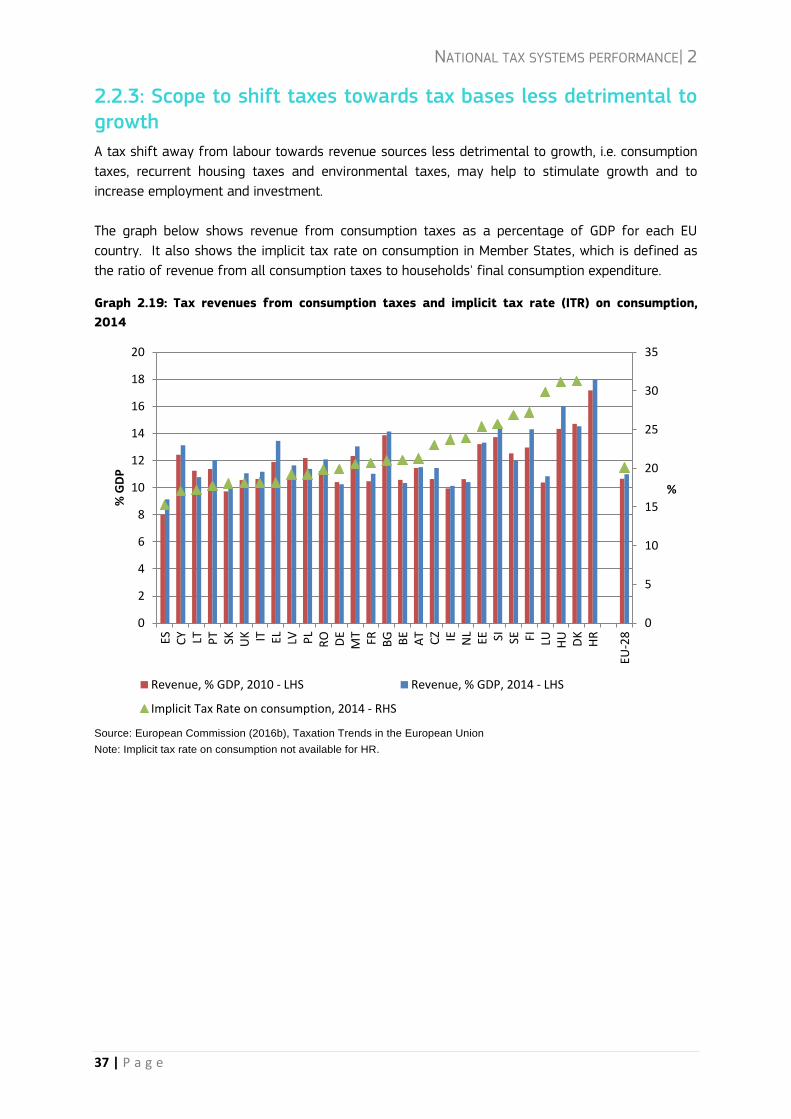
2.2.3: Scope to shift taxes towards tax bases less detrimental to growth
A tax shift away from labour towards revenue sources less detrimental to growth, i.e. consumption
taxes, recurrent housing taxes and environmental taxes, may help to stimulate growth and to
increase employment and investment.
The graph below shows revenue from consumption taxes as a percentage of GDP for each EU
country. It also shows the implicit tax rate on consumption in Member States, which is defined as
the ratio of revenue from all consumption taxes to households' final consumption expenditure.
Graph 2.19: Tax revenues from consumption taxes and implicit tax rate (ITR) on consumption,
2014
Source: European Commission (2016b), Taxation Trends in the European Union
Note: Implicit tax rate on consumption not available for HR.
0
5
10
15
20
25
30
35
0
2
4
6
8
10
12
14
16
18
20
ES CY LT PT SK UK IT EL LV PL
RO DE
MT
FR BG BE
AT
CZ IE NL
EE SI SE FI LU HU DK
HR
EU-2
8
%
% G
DP
Revenue, % GDP, 2010 - LHS Revenue, % GDP, 2014 - LHS
Implicit Tax Rate on consumption, 2014 - RHS
NATIONAL TAX SYSTEMS PERFORMANCE| 2
38 | P a g e
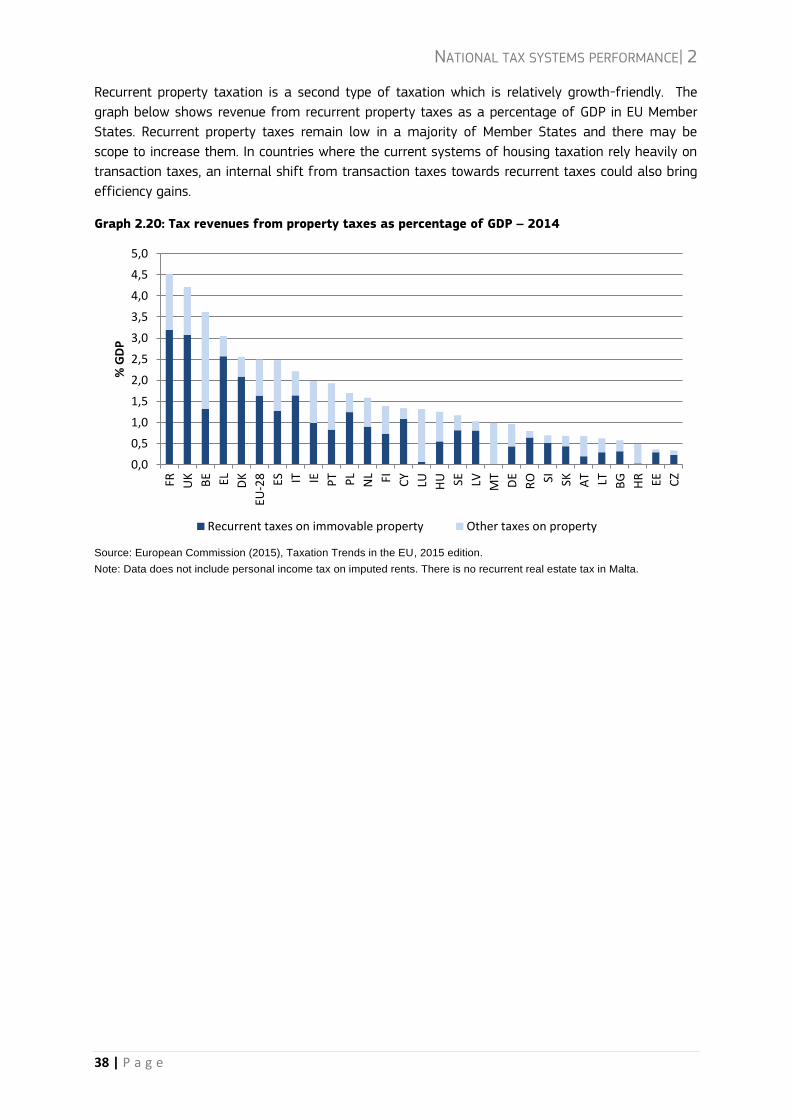
Recurrent property taxation is a second type of taxation which is relatively growth-friendly. The
graph below shows revenue from recurrent property taxes as a percentage of GDP in EU Member
States. Recurrent property taxes remain low in a majority of Member States and there may be
scope to increase them. In countries where the current systems of housing taxation rely heavily on
transaction taxes, an internal shift from transaction taxes towards recurrent taxes could also bring
efficiency gains.
Graph 2.20: Tax revenues from property taxes as percentage of GDP – 2014
Source: European Commission (2015), Taxation Trends in the EU, 2015 edition.
Note: Data does not include personal income tax on imputed rents. There is no recurrent real estate tax in Malta.
0,0
0,5
1,0
1,5
2,0
2,5
3,0
3,5
4,0
4,5
5,0
FR UK
BE EL DK
EU-2
8 ES IT IE PT PL
NL FI CY
LU HU SE LV MT
DE
RO SI SK AT LT BG
HR EE CZ
% G
DP
Recurrent taxes on immovable property Other taxes on property
NATIONAL TAX SYSTEMS PERFORMANCE| 2
39 | P a g e
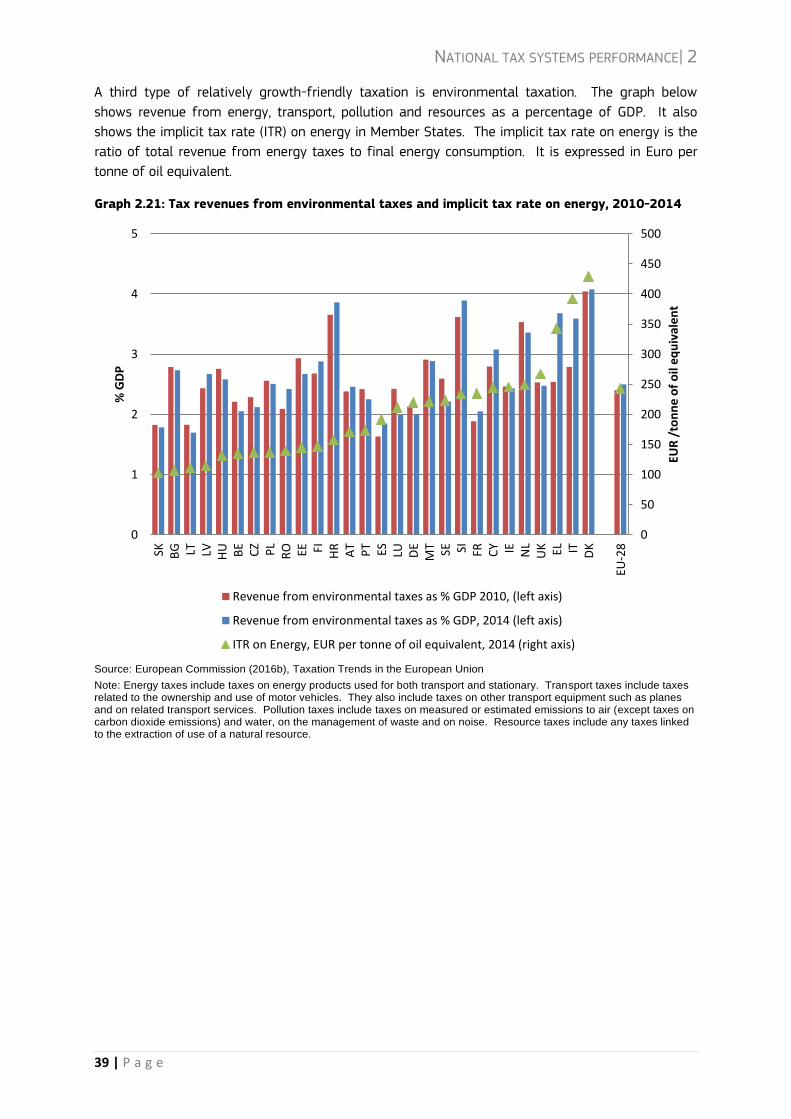
A third type of relatively growth-friendly taxation is environmental taxation. The graph below
shows revenue from energy, transport, pollution and resources as a percentage of GDP. It also
shows the implicit tax rate (ITR) on energy in Member States. The implicit tax rate on energy is the
ratio of total revenue from energy taxes to final energy consumption. It is expressed in Euro per
tonne of oil equivalent.
Graph 2.21: Tax revenues from environmental taxes and implicit tax rate on energy, 2010-2014
Source: European Commission (2016b), Taxation Trends in the European Union
Note: Energy taxes include taxes on energy products used for both transport and stationary. Transport taxes include taxes related to the ownership and use of motor vehicles. They also include taxes on other transport equipment such as planes and on related transport services. Pollution taxes include taxes on measured or estimated emissions to air (except taxes on carbon dioxide emissions) and water, on the management of waste and on noise. Resource taxes include any taxes linked to the extraction of use of a natural resource.
0
50
100
150
200
250
300
350
400
450
500
0
1
2
3
4
5
SK BG LT LV HU BE
CZ PL
RO EE FI HR
AT
PT ES LU DE
MT SE SI FR CY IE NL
UK EL IT DK
EU-2
8
EUR
/to
nn
e o
f o
il e
qu
ival
en
t
% G
DP
Revenue from environmental taxes as % GDP 2010, (left axis)
Revenue from environmental taxes as % GDP, 2014 (left axis)
ITR on Energy, EUR per tonne of oil equivalent, 2014 (right axis)
NATIONAL TAX SYSTEMS PERFORMANCE| 2
40 | P a g e
2.3 Tax compliance
As outlined in section 1.2, improving tax compliance by combatting tax fraud, evasion and
avoidance can help to improve fairness and secure tax revenues for public investment. Although it
is it is by definition difficult to estimate how much money is lost to tax fraud, evasion and
avoidance, this section presents indicators which aim to provide an indication of the scale of the
issue.
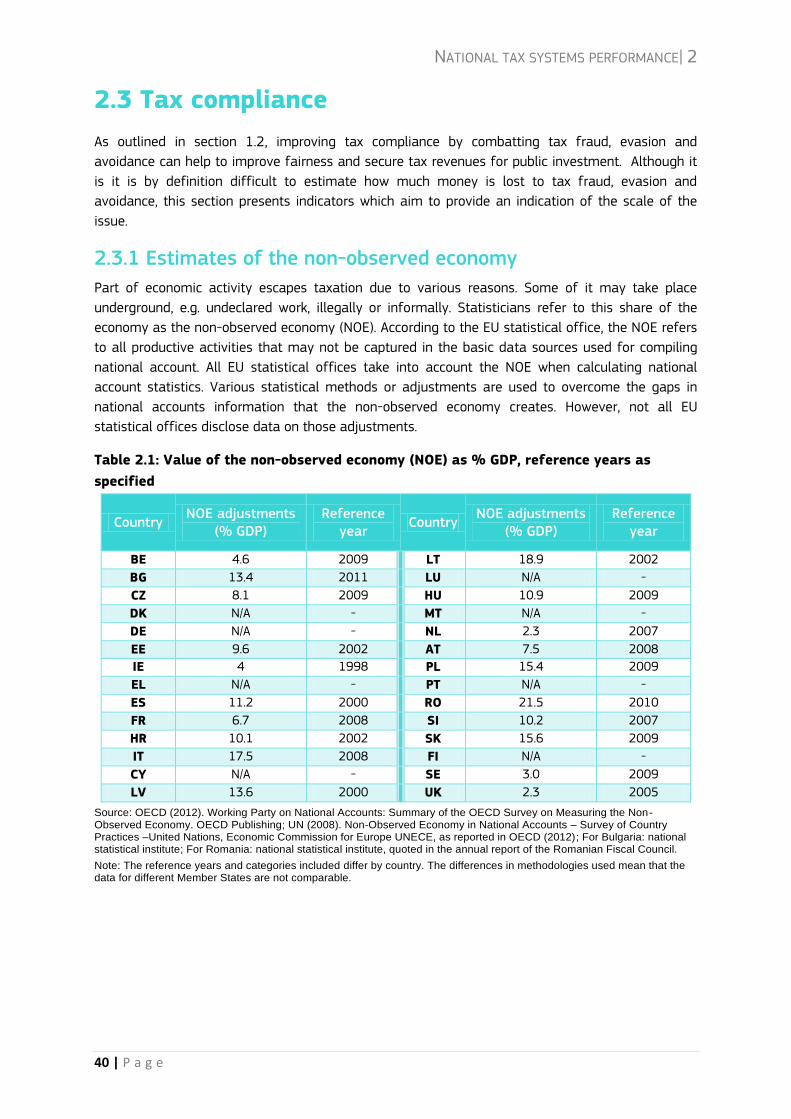
2.3.1 Estimates of the non-observed economy
Part of economic activity escapes taxation due to various reasons. Some of it may take place
underground, e.g. undeclared work, illegally or informally. Statisticians refer to this share of the
economy as the non-observed economy (NOE). According to the EU statistical office, the NOE refers
to all productive activities that may not be captured in the basic data sources used for compiling
national account. All EU statistical offices take into account the NOE when calculating national
account statistics. Various statistical methods or adjustments are used to overcome the gaps in
national accounts information that the non-observed economy creates. However, not all EU
statistical offices disclose data on those adjustments.
Table 2.1: Value of the non-observed economy (NOE) as % GDP, reference years as
specified
Country NOE adjustments
(% GDP) Reference
year Country
NOE adjustments (% GDP)
Reference year
BE 4.6 2009 LT 18.9 2002
BG 13.4 2011 LU N/A -
CZ 8.1 2009 HU 10.9 2009
DK N/A - MT N/A -
DE N/A - NL 2.3 2007
EE 9.6 2002 AT 7.5 2008
IE 4 1998 PL 15.4 2009
EL N/A - PT N/A -
ES 11.2 2000 RO 21.5 2010
FR 6.7 2008 SI 10.2 2007
HR 10.1 2002 SK 15.6 2009
IT 17.5 2008 FI N/A -
CY N/A - SE 3.0 2009
LV 13.6 2000 UK 2.3 2005
Source: OECD (2012). Working Party on National Accounts: Summary of the OECD Survey on Measuring the Non-Observed Economy. OECD Publishing; UN (2008). Non-Observed Economy in National Accounts – Survey of Country Practices –United Nations, Economic Commission for Europe UNECE, as reported in OECD (2012); For Bulgaria: national statistical institute; For Romania: national statistical institute, quoted in the annual report of the Romanian Fiscal Council.
Note: The reference years and categories included differ by country. The differences in methodologies used mean that the data for different Member States are not comparable.
NATIONAL TAX SYSTEMS PERFORMANCE| 2
41 | P a g e
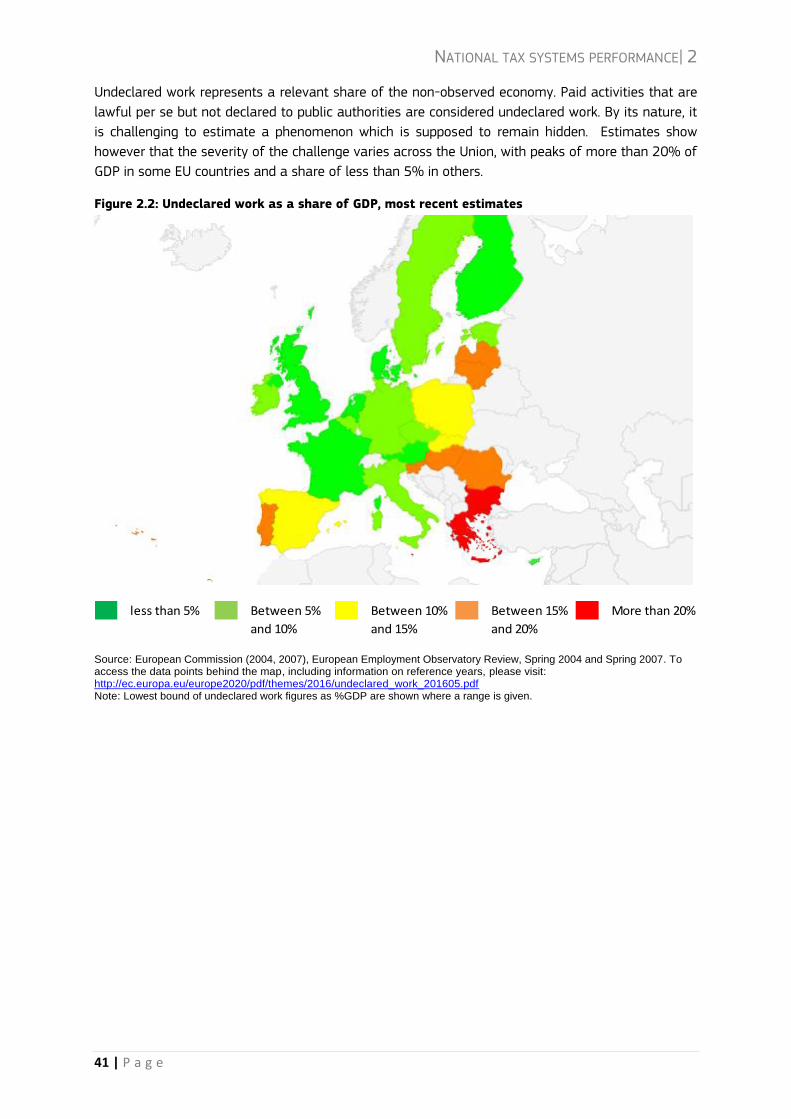
Undeclared work represents a relevant share of the non-observed economy. Paid activities that are
lawful per se but not declared to public authorities are considered undeclared work. By its nature, it
is challenging to estimate a phenomenon which is supposed to remain hidden. Estimates show
however that the severity of the challenge varies across the Union, with peaks of more than 20% of
GDP in some EU countries and a share of less than 5% in others.
Figure 2.2: Undeclared work as a share of GDP, most recent estimates
Source: European Commission (2004, 2007), European Employment Observatory Review, Spring 2004 and Spring 2007. To access the data points behind the map, including information on reference years, please visit: http://ec.europa.eu/europe2020/pdf/themes/2016/undeclared_work_201605.pdf Note: Lowest bound of undeclared work figures as %GDP are shown where a range is given.
less than 5% Between 5% Between 10% Between 15% More than 20%
and 10% and 15% and 20%
NATIONAL TAX SYSTEMS PERFORMANCE| 2
42 | P a g e
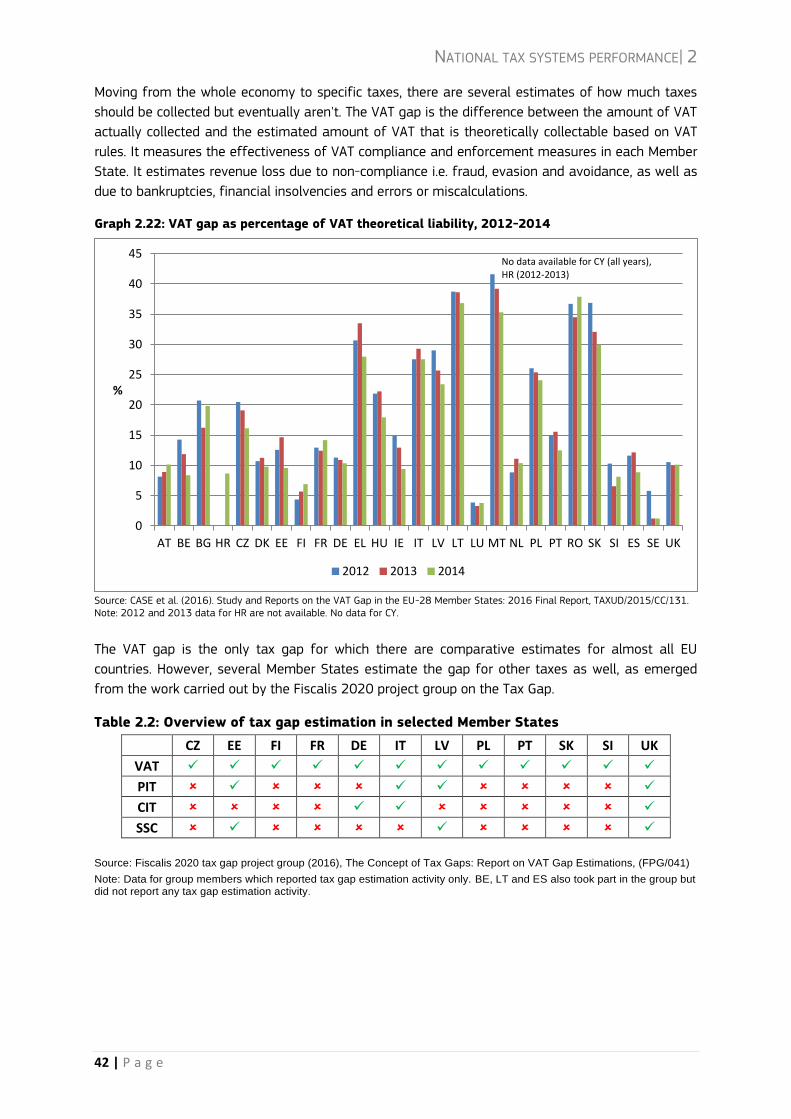
Moving from the whole economy to specific taxes, there are several estimates of how much taxes
should be collected but eventually aren't. The VAT gap is the difference between the amount of VAT
actually collected and the estimated amount of VAT that is theoretically collectable based on VAT
rules. It measures the effectiveness of VAT compliance and enforcement measures in each Member
State. It estimates revenue loss due to non-compliance i.e. fraud, evasion and avoidance, as well as
due to bankruptcies, financial insolvencies and errors or miscalculations.
Graph 2.22: VAT gap as percentage of VAT theoretical liability, 2012-2014
Source: CASE et al. (2016). Study and Reports on the VAT Gap in the EU-28 Member States: 2016 Final Report, TAXUD/2015/CC/131. Note: 2012 and 2013 data for HR are not available. No data for CY.
The VAT gap is the only tax gap for which there are comparative estimates for almost all EU
countries. However, several Member States estimate the gap for other taxes as well, as emerged
from the work carried out by the Fiscalis 2020 project group on the Tax Gap.
Table 2.2: Overview of tax gap estimation in selected Member States
CZ EE FI FR DE IT LV PL PT SK SI UK
VAT
PIT
CIT
SSC
Source: Fiscalis 2020 tax gap project group (2016), The Concept of Tax Gaps: Report on VAT Gap Estimations, (FPG/041)
Note: Data for group members which reported tax gap estimation activity only. BE, LT and ES also took part in the group but did not report any tax gap estimation activity.
0
5
10
15
20
25
30
35
40
45
AT BE BG HR CZ DK EE FI FR DE EL HU IE IT LV LT LU MT NL PL PT RO SK SI ES SE UK
%
2012 2013 2014
No data available for CY (all years), HR (2012-2013)
NATIONAL TAX SYSTEMS PERFORMANCE| 2
43 | P a g e
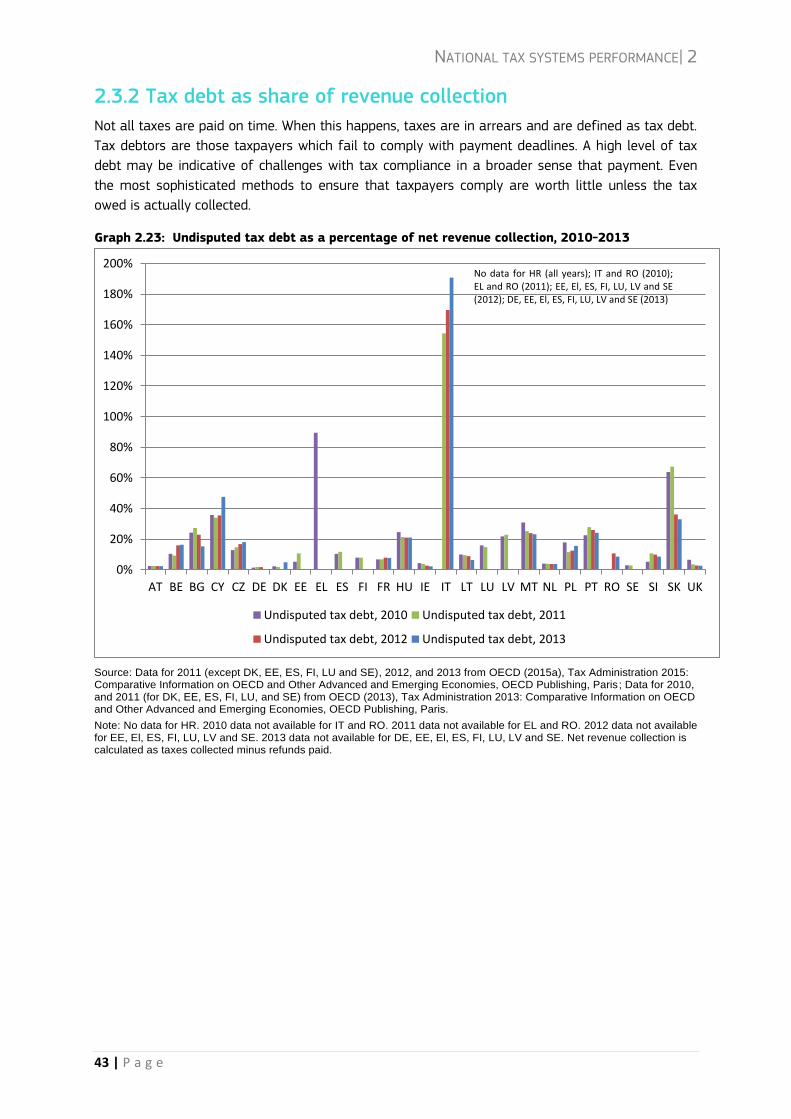
2.3.2 Tax debt as share of revenue collection
Not all taxes are paid on time. When this happens, taxes are in arrears and are defined as tax debt.
Tax debtors are those taxpayers which fail to comply with payment deadlines. A high level of tax
debt may be indicative of challenges with tax compliance in a broader sense that payment. Even
the most sophisticated methods to ensure that taxpayers comply are worth little unless the tax
owed is actually collected.
Graph 2.23: Undisputed tax debt as a percentage of net revenue collection, 2010-2013
Source: Data for 2011 (except DK, EE, ES, FI, LU and SE), 2012, and 2013 from OECD (2015a), Tax Administration 2015: Comparative Information on OECD and Other Advanced and Emerging Economies, OECD Publishing, Paris; Data for 2010, and 2011 (for DK, EE, ES, FI, LU, and SE) from OECD (2013), Tax Administration 2013: Comparative Information on OECD and Other Advanced and Emerging Economies, OECD Publishing, Paris.
Note: No data for HR. 2010 data not available for IT and RO. 2011 data not available for EL and RO. 2012 data not available for EE, El, ES, FI, LU, LV and SE. 2013 data not available for DE, EE, El, ES, FI, LU, LV and SE. Net revenue collection is calculated as taxes collected minus refunds paid.
0%
20%
40%
60%
80%
100%
120%
140%
160%
180%
200%
AT BE BG CY CZ DE DK EE EL ES FI FR HU IE IT LT LU LV MT NL PL PT RO SE SI SK UK
Undisputed tax debt, 2010 Undisputed tax debt, 2011
Undisputed tax debt, 2012 Undisputed tax debt, 2013
No data for HR (all years); IT and RO (2010); EL and RO (2011); EE, El, ES, FI, LU, LV and SE (2012); DE, EE, El, ES, FI, LU, LV and SE (2013)
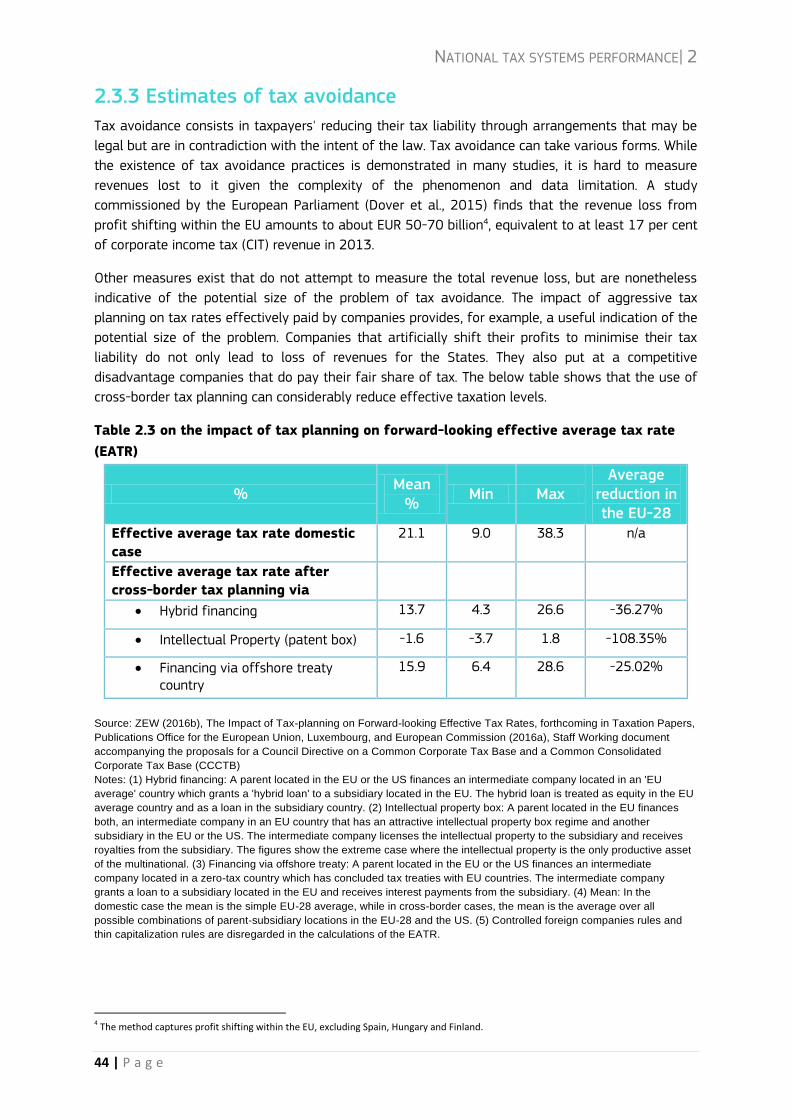
NATIONAL TAX SYSTEMS PERFORMANCE| 2
44 | P a g e
2.3.3 Estimates of tax avoidance
Tax avoidance consists in taxpayers' reducing their tax liability through arrangements that may be
legal but are in contradiction with the intent of the law. Tax avoidance can take various forms. While
the existence of tax avoidance practices is demonstrated in many studies, it is hard to measure
revenues lost to it given the complexity of the phenomenon and data limitation. A study
commissioned by the European Parliament (Dover et al., 2015) finds that the revenue loss from
profit shifting within the EU amounts to about EUR 50-70 billion4, equivalent to at least 17 per cent
of corporate income tax (CIT) revenue in 2013.
Other measures exist that do not attempt to measure the total revenue loss, but are nonetheless
indicative of the potential size of the problem of tax avoidance. The impact of aggressive tax
planning on tax rates effectively paid by companies provides, for example, a useful indication of the
potential size of the problem. Companies that artificially shift their profits to minimise their tax
liability do not only lead to loss of revenues for the States. They also put at a competitive
disadvantage companies that do pay their fair share of tax. The below table shows that the use of
cross-border tax planning can considerably reduce effective taxation levels.
Table 2.3 on the impact of tax planning on forward-looking effective average tax rate
(EATR)
% Mean
% Min Max
Average reduction in the EU-28
Effective average tax rate domestic
case
21.1 9.0 38.3 n/a
Effective average tax rate after
cross-border tax planning via
Hybrid financing 13.7 4.3 26.6 -36.27%
Intellectual Property (patent box) -1.6 -3.7 1.8 -108.35%
Financing via offshore treaty country
15.9 6.4 28.6 -25.02%
Source: ZEW (2016b), The Impact of Tax-planning on Forward-looking Effective Tax Rates, forthcoming in Taxation Papers,
Publications Office for the European Union, Luxembourg, and European Commission (2016a), Staff Working document
accompanying the proposals for a Council Directive on a Common Corporate Tax Base and a Common Consolidated
Corporate Tax Base (CCCTB)
Notes: (1) Hybrid financing: A parent located in the EU or the US finances an intermediate company located in an 'EU
average' country which grants a 'hybrid loan' to a subsidiary located in the EU. The hybrid loan is treated as equity in the EU
average country and as a loan in the subsidiary country. (2) Intellectual property box: A parent located in the EU finances
both, an intermediate company in an EU country that has an attractive intellectual property box regime and another
subsidiary in the EU or the US. The intermediate company licenses the intellectual property to the subsidiary and receives
royalties from the subsidiary. The figures show the extreme case where the intellectual property is the only productive asset
of the multinational. (3) Financing via offshore treaty: A parent located in the EU or the US finances an intermediate
company located in a zero-tax country which has concluded tax treaties with EU countries. The intermediate company
grants a loan to a subsidiary located in the EU and receives interest payments from the subsidiary. (4) Mean: In the
domestic case the mean is the simple EU-28 average, while in cross-border cases, the mean is the average over all
possible combinations of parent-subsidiary locations in the EU-28 and the US. (5) Controlled foreign companies rules and
thin capitalization rules are disregarded in the calculations of the EATR.
4 The method captures profit shifting within the EU, excluding Spain, Hungary and Finland.

NATIONAL TAX SYSTEMS PERFORMANCE| 2
45 | P a g e
2.3.4 Overview of critical tax rules
Multinationals that engage in aggressive tax planning reduce their tax liability by taking advantage
of the technicalities of a tax system or by playing on mismatches between two or more tax
systems. Aggressive tax planning can result in double deductions (e.g. the same loss is deducted
both in the state of source and in the state of residence) and double non-taxation (e.g. income
which is not taxed in the source state is exempt in the state of residence). It is therefore essential to
look at Member States' tax rules in order to assess whether they could potentially be used in
aggressive tax planning schemes. In that respect, anti-abuse rules play a crucial role in restricting
tax avoidance schemes.
The below figure gives an overview of the absence of three types of anti-abuse rules across
Member States: interest limitation and thin-capitalisation rules, which aim at discouraging artificial
debt arrangements designed to minimise taxes; controlled foreign companies rules, which aim at
deterring profit shifting to a low/no tax country, and rules to counter mismatches in tax
qualification, which aim at preventing companies from exploiting mismatches between tax systems
to avoid taxation.
Table 2.4: Overview of some anti-tax avoidance rules missing in Member States' national laws,
2015
Source: Ramboll Management Consulting and Corit Advisory (2015), 'Study on Structures of Aggressive Tax Planning and Indicators', Taxation Papers, No 61 – 2015, Publications Office for the European Union, Luxembourg.
Note: (1) The graph and table focuses on some anti-abuse rules identified in the above-mentioned study, with a cut-off date set mid-2015. (2) The study examined one way of addressing hybrid entity mismatches, which would consist in aligning the tax qualification with the one followed by the foreign state. The above table reports which Members have or do not have such rules. This should however not be interpreted as meaning that hybrid entities mismatches can only be addressed this way or should only be addressed this way. (3) A cross means that the given anti-abuse rule is missing from a Member State's national laws.
The absence of withholding taxes generally aims at preventing double taxation. For example, the
elimination of withholding taxes on dividends within a group of companies is a key principle
underpinning the EU Parent/Subsidiary Directive. However, it may also facilitate aggressive tax
planning under certain circumstances. At the same time, the existence of withholding taxes prevents
shifting profits tax-free, and thereby discourage or impede aggressive tax planning. The chart below
shows which countries apply a withholding tax (exceeding 0%) on interest, dividends or royalties
flowing to third country jurisdictions.
Table 2.5: Withholding taxes in EU Member States towards third country jurisdictions, 2015
Source: ZEW (2016b) Notes: (1) The above table focuses on the domestic withholding tax (WHT) rates, i.e. the rates that are specified in national corporate tax law. It does therefore not reflect the WHT rates specified in double tax treaties. A cross means that the Member State does not apply a withholding tax (exceeding 0%).
BE BG CY EE HR LU MT NL RO SI AT CZ IE LV LT PL SK DE EL FI HU PT FR IT SE UK DK ES
Interest limitation and thin-
capitalisation rules
Controlled Foreign Companies Rules
Rule to counter mismatches in tax
qualification of domestic companies
or partnerships between own state
and foreign state.
HU MT CY EE LU NL IE SK UK AT DE FI SE BE BG CZ DK EL ES FR HR IT LT LV PL PT RO SI
Royalties
Interests
Dividends
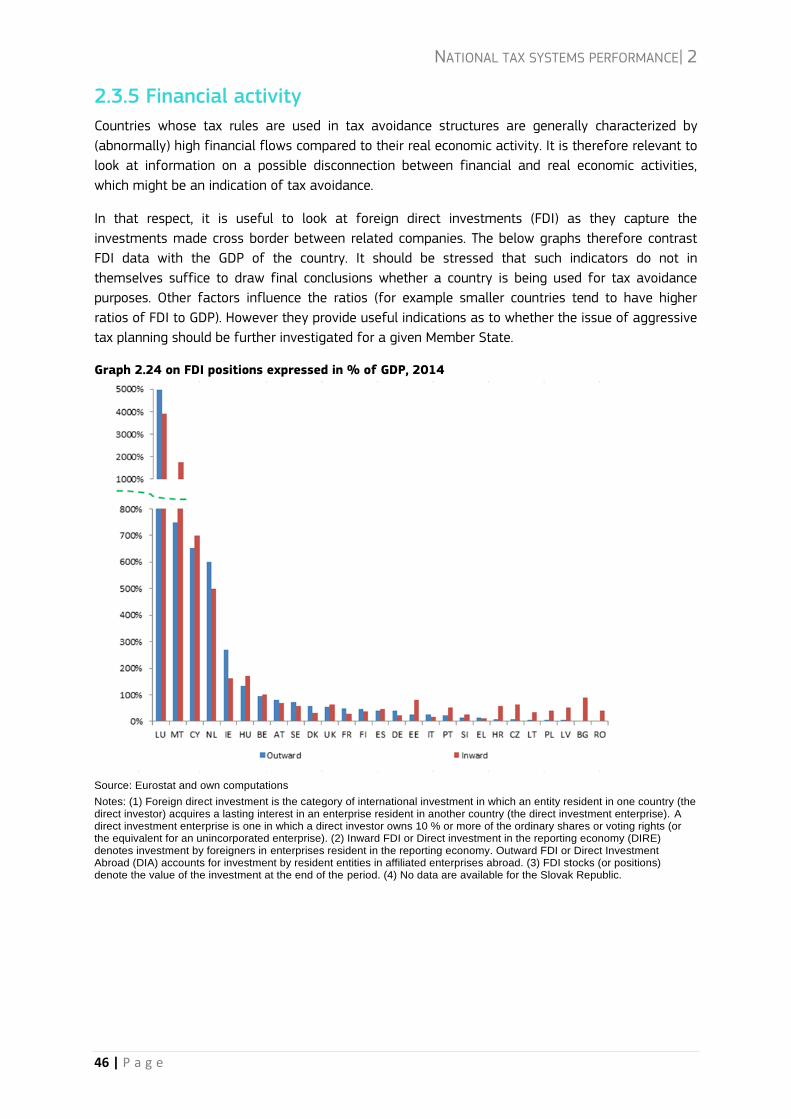
NATIONAL TAX SYSTEMS PERFORMANCE| 2
46 | P a g e
2.3.5 Financial activity
Countries whose tax rules are used in tax avoidance structures are generally characterized by
(abnormally) high financial flows compared to their real economic activity. It is therefore relevant to
look at information on a possible disconnection between financial and real economic activities,
which might be an indication of tax avoidance.
In that respect, it is useful to look at foreign direct investments (FDI) as they capture the
investments made cross border between related companies. The below graphs therefore contrast
FDI data with the GDP of the country. It should be stressed that such indicators do not in
themselves suffice to draw final conclusions whether a country is being used for tax avoidance
purposes. Other factors influence the ratios (for example smaller countries tend to have higher
ratios of FDI to GDP). However they provide useful indications as to whether the issue of aggressive
tax planning should be further investigated for a given Member State.
Graph 2.24 on FDI positions expressed in % of GDP, 2014
Source: Eurostat and own computations
Notes: (1) Foreign direct investment is the category of international investment in which an entity resident in one country (the direct investor) acquires a lasting interest in an enterprise resident in another country (the direct investment enterprise). A direct investment enterprise is one in which a direct investor owns 10 % or more of the ordinary shares or voting rights (or the equivalent for an unincorporated enterprise). (2) Inward FDI or Direct investment in the reporting economy (DIRE) denotes investment by foreigners in enterprises resident in the reporting economy. Outward FDI or Direct Investment Abroad (DIA) accounts for investment by resident entities in affiliated enterprises abroad. (3) FDI stocks (or positions) denote the value of the investment at the end of the period. (4) No data are available for the Slovak Republic.
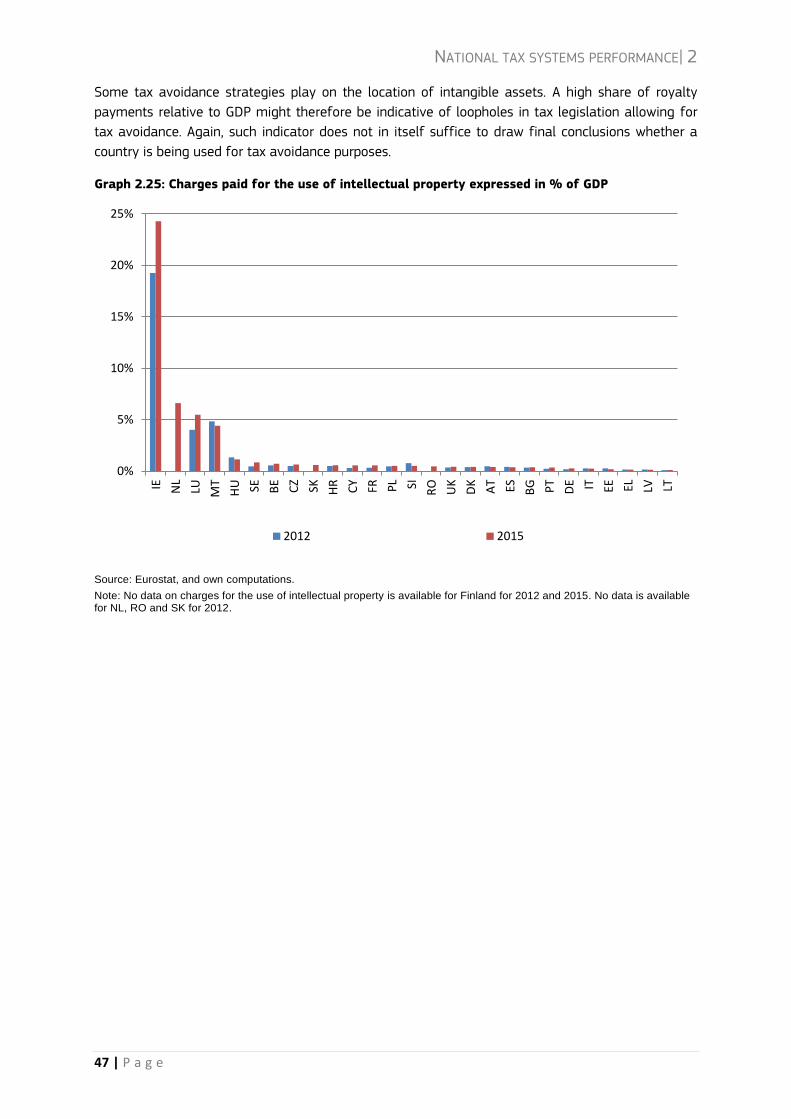
NATIONAL TAX SYSTEMS PERFORMANCE| 2
47 | P a g e
Some tax avoidance strategies play on the location of intangible assets. A high share of royalty
payments relative to GDP might therefore be indicative of loopholes in tax legislation allowing for
tax avoidance. Again, such indicator does not in itself suffice to draw final conclusions whether a
country is being used for tax avoidance purposes.
Graph 2.25: Charges paid for the use of intellectual property expressed in % of GDP
Source: Eurostat, and own computations.
Note: No data on charges for the use of intellectual property is available for Finland for 2012 and 2015. No data is available for NL, RO and SK for 2012.
0%
5%
10%
15%
20%
25%
IE NL
LU MT
HU SE BE
CZ
SK HR CY
FR PL SI R
O
UK
DK
AT ES BG PT
DE IT EE EL LV LT
2012 2015
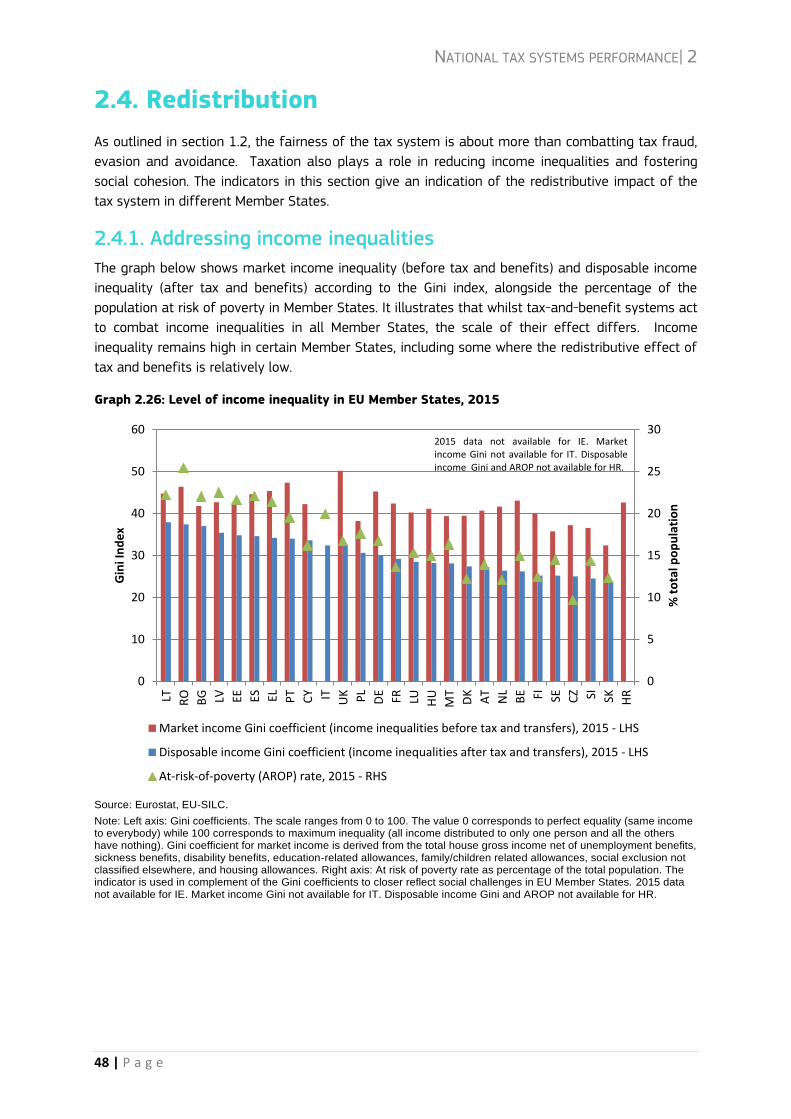
NATIONAL TAX SYSTEMS PERFORMANCE| 2
48 | P a g e
2.4. Redistribution
As outlined in section 1.2, the fairness of the tax system is about more than combatting tax fraud,
evasion and avoidance. Taxation also plays a role in reducing income inequalities and fostering
social cohesion. The indicators in this section give an indication of the redistributive impact of the
tax system in different Member States.
2.4.1. Addressing income inequalities
The graph below shows market income inequality (before tax and benefits) and disposable income
inequality (after tax and benefits) according to the Gini index, alongside the percentage of the
population at risk of poverty in Member States. It illustrates that whilst tax-and-benefit systems act
to combat income inequalities in all Member States, the scale of their effect differs. Income
inequality remains high in certain Member States, including some where the redistributive effect of
tax and benefits is relatively low.
Graph 2.26: Level of income inequality in EU Member States, 2015
Source: Eurostat, EU-SILC.
Note: Left axis: Gini coefficients. The scale ranges from 0 to 100. The value 0 corresponds to perfect equality (same income to everybody) while 100 corresponds to maximum inequality (all income distributed to only one person and all the others have nothing). Gini coefficient for market income is derived from the total house gross income net of unemployment benefits, sickness benefits, disability benefits, education-related allowances, family/children related allowances, social exclusion not classified elsewhere, and housing allowances. Right axis: At risk of poverty rate as percentage of the total population. The indicator is used in complement of the Gini coefficients to closer reflect social challenges in EU Member States. 2015 data not available for IE. Market income Gini not available for IT. Disposable income Gini and AROP not available for HR.
0
5
10
15
20
25
30
0
10
20
30
40
50
60
LT RO
BG LV EE ES EL PT
CY IT UK PL
DE
FR LU HU
MT
DK
AT
NL
BE FI SE CZ SI SK HR
% t
ota
l po
pu
lati
on
Gin
i In
de
x
Market income Gini coefficient (income inequalities before tax and transfers), 2015 - LHS
Disposable income Gini coefficient (income inequalities after tax and transfers), 2015 - LHS
At-risk-of-poverty (AROP) rate, 2015 - RHS
2015 data not available for IE. Market income Gini not available for IT. Disposable income Gini and AROP not available for HR.
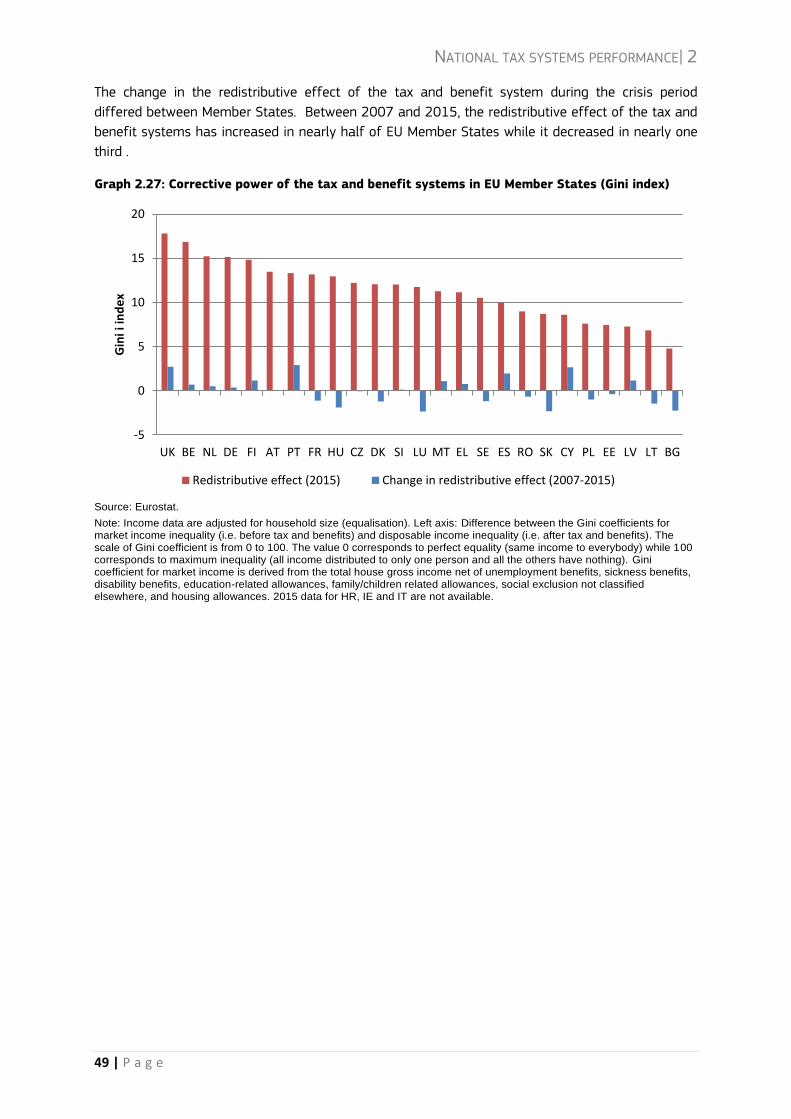
NATIONAL TAX SYSTEMS PERFORMANCE| 2
49 | P a g e
The change in the redistributive effect of the tax and benefit system during the crisis period
differed between Member States. Between 2007 and 2015, the redistributive effect of the tax and
benefit systems has increased in nearly half of EU Member States while it decreased in nearly one
third .
Graph 2.27: Corrective power of the tax and benefit systems in EU Member States (Gini index)
Source: Eurostat.
Note: Income data are adjusted for household size (equalisation). Left axis: Difference between the Gini coefficients for market income inequality (i.e. before tax and benefits) and disposable income inequality (i.e. after tax and benefits). The scale of Gini coefficient is from 0 to 100. The value 0 corresponds to perfect equality (same income to everybody) while 100 corresponds to maximum inequality (all income distributed to only one person and all the others have nothing). Gini coefficient for market income is derived from the total house gross income net of unemployment benefits, sickness benefits, disability benefits, education-related allowances, family/children related allowances, social exclusion not classified elsewhere, and housing allowances. 2015 data for HR, IE and IT are not available.
-5
0
5
10
15
20
UK BE NL DE FI AT PT FR HU CZ DK SI LU MT EL SE ES RO SK CY PL EE LV LT BG
Gin
i i in
de
x
Redistributive effect (2015) Change in redistributive effect (2007-2015)
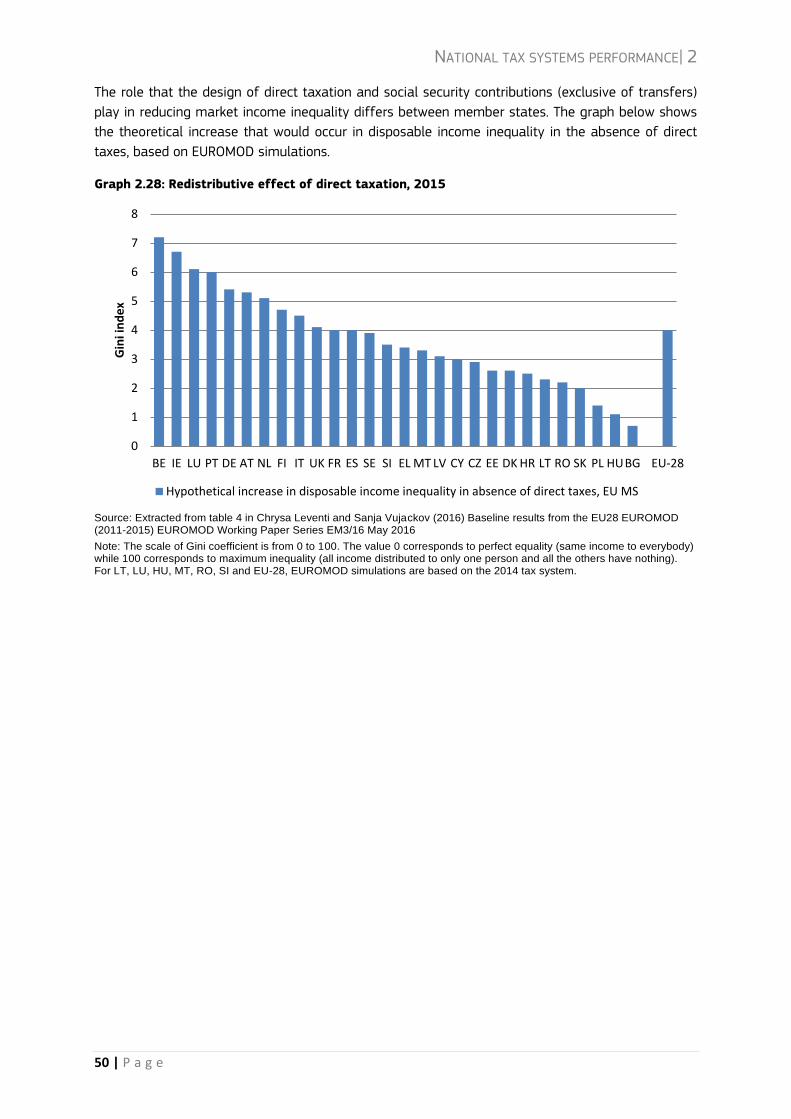
NATIONAL TAX SYSTEMS PERFORMANCE| 2
50 | P a g e
The role that the design of direct taxation and social security contributions (exclusive of transfers)
play in reducing market income inequality differs between member states. The graph below shows
the theoretical increase that would occur in disposable income inequality in the absence of direct
taxes, based on EUROMOD simulations.
Graph 2.28: Redistributive effect of direct taxation, 2015
Source: Extracted from table 4 in Chrysa Leventi and Sanja Vujackov (2016) Baseline results from the EU28 EUROMOD (2011-2015) EUROMOD Working Paper Series EM3/16 May 2016
Note: The scale of Gini coefficient is from 0 to 100. The value 0 corresponds to perfect equality (same income to everybody) while 100 corresponds to maximum inequality (all income distributed to only one person and all the others have nothing). For LT, LU, HU, MT, RO, SI and EU-28, EUROMOD simulations are based on the 2014 tax system.
0
1
2
3
4
5
6
7
8
BE IE LU PT DE AT NL FI IT UK FR ES SE SI EL MT LV CY CZ EE DK HR LT RO SK PL HUBG EU-28
Gin
i in
de
x
Hypothetical increase in disposable income inequality in absence of direct taxes, EU MS
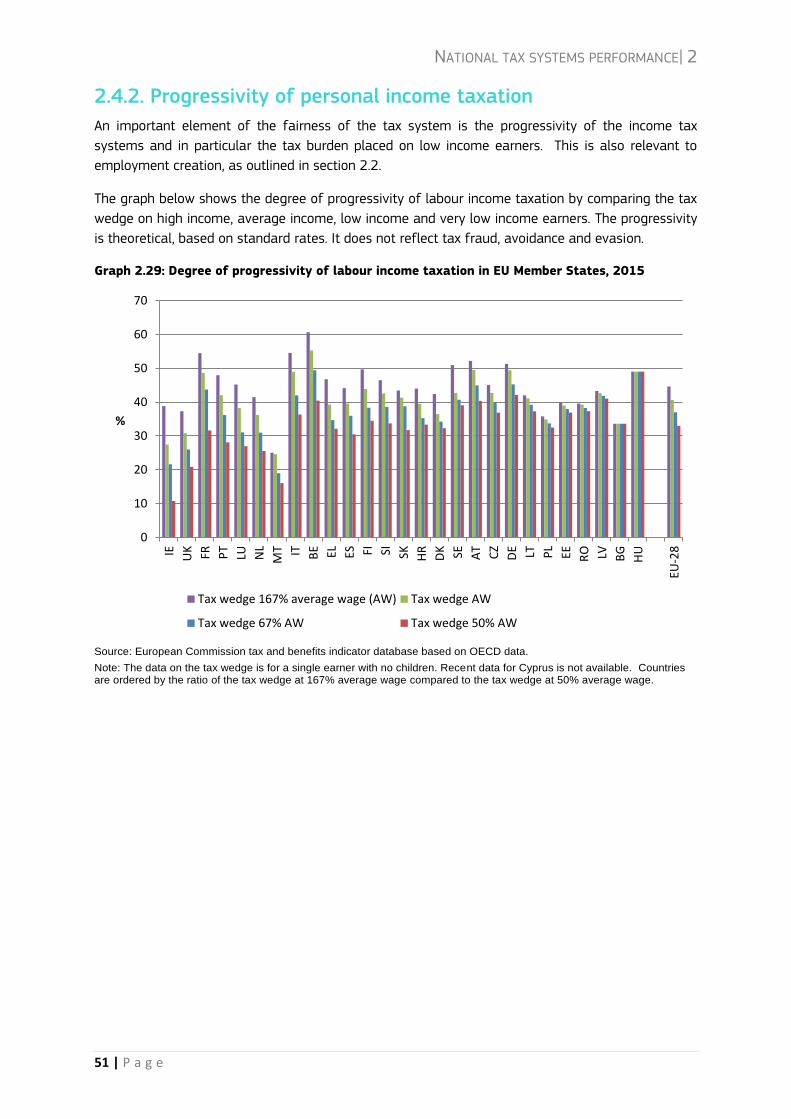
NATIONAL TAX SYSTEMS PERFORMANCE| 2
51 | P a g e
2.4.2. Progressivity of personal income taxation
An important element of the fairness of the tax system is the progressivity of the income tax
systems and in particular the tax burden placed on low income earners. This is also relevant to
employment creation, as outlined in section 2.2.
The graph below shows the degree of progressivity of labour income taxation by comparing the tax
wedge on high income, average income, low income and very low income earners. The progressivity
is theoretical, based on standard rates. It does not reflect tax fraud, avoidance and evasion.
Graph 2.29: Degree of progressivity of labour income taxation in EU Member States, 2015
Source: European Commission tax and benefits indicator database based on OECD data.
Note: The data on the tax wedge is for a single earner with no children. Recent data for Cyprus is not available. Countries are ordered by the ratio of the tax wedge at 167% average wage compared to the tax wedge at 50% average wage.
0
10
20
30
40
50
60
70
IE UK FR PT
LU NL
MT IT BE EL ES FI SI SK HR
DK SE AT
CZ
DE LT PL
EE RO LV BG
HU
EU-2
8
%
Tax wedge 167% average wage (AW) Tax wedge AW
Tax wedge 67% AW Tax wedge 50% AW

NATIONAL TAX SYSTEMS PERFORMANCE| 2
52 | P a g e
Tax reforms in the EU and policy recommendations | 3
53 | P a g e
3 Tax reforms in the EU & policy recommendations
This section presents tax reforms announced or implemented between June 2015 and June 2016 in
the areas of investment, employment, tax compliance and redistribution5. It complements the
analysis presented in Chapter 2, by looking at the most recent developments that are not yet visible
in the indicators. Building on this analysis, there are general policy recommendations and principles
that every Member State could take into account in reforming its tax system to make it fairer and
more growth-friendly. Finally, the section presents some more specific reform options and inspiring
examples.
3.1 Recent reforms
3.1.1 Stimulating investment
Stimulating investment has been an important priority in recent tax reforms. In previous
years, corporate taxation was mainly reformed at the level of the base rather than the tax rate.
Member States often narrowed their tax bases to stimulate investment (e.g. by extending tax credits
for R&D) and broaden them to curb tax planning practices and close loopholes. This pattern
continued in 2015-2016. A few countries however reduced their rates in 2015-2016, such as Spain
and the UK which followed from their announcements in earlier years, and Luxembourg and Italy
announced CIT cuts as from 2017.
Tax reforms play a role in removing barriers to financing and could help deliver a Capital Markets
Union.6 One avenue of such reforms is addressing debt bias in corporate taxation. However, in
recent years, countries have not shown much appetite for fundamental reforms that
address the debt bias. In 2015, Cyprus joined Belgium and Italy in granting an allowance for
corporate equity (ACE) which allows cost of equity to be tax deducted at par with cost of debt. Most
countries focused on limiting the effects of debt bias in terms of tax planning by introducing the
rules that limit how much interest can be deducted by companies.
Interest in R&D tax incentives continues but focuses on implementation, while countries
experiment with tax incentives for equity investors. Most countries reformed and expanded
their R&D tax incentives during the crisis years thus partly compensating for cuts in direct R&D
spending which took place due to fiscal consolidation efforts. As a result, R&D tax incentives
reforms were less frequent in 2015-2016. Austria increased the generosity of its R&D tax credit
and Slovakia and Poland overhauled their R&D tax incentives. In Malta, since 2016, companies
employing PhD students or graduates are eligible for a tax credit. In addition, some Member States
have introduced incentives for business angel and venture capital investors, for example Belgium,
Italy, and Poland, to encourage equity investment into smaller companies. Reforms in a few
5 More detail about reforms in individual member states and taxation trends since 2004 can be found in the Taxation Trends report published by DG TAXUD (European Commission 2016b). 6 European Commission, Action Plan on building a Capital Markets Union – COM(2015) 468
Tax reforms in the EU and policy recommendations | 3
54 | P a g e
countries focused on smaller taxpayers. Belgium increased the deduction rates for productive
investment, in particular for self-employed and SMEs with a top-up for start-ups and high tech
companies. Some Member States put in place stimulus measures to upgrade industrial equipment.
For example, France introduced a bonus depreciation of 140 % for such investment in 2015,
followed by a similar measure in Italy in 2016. Luxembourg planned an increase of its investment
tax credits.
There have been reforms to smoothen tax compliance, inter alia, through digital
integration. For instance, in France more taxes can now be declared and paid digitally. In Bulgaria,
self-employed taxpayers are able to submit tax returns and insurance declarations in a digital way.
In Italy, more digital services are now offered to taxpayers, including the ability to apply for a VAT
exemption and provide other information online. Transparent and predictable tax systems are
important for investments. In February 2016, in Denmark, a package of measures was proposed
with a view to increase legal certainty for taxpayers. The package includes setting up of an
ombudsman to enhance the protection of taxpayers' rights. The length of complaints is to be
reduced as from 2017, with a guarantee for the maximum duration of cases for individuals and
SMEs.
Going forward, it seems important to focus on creating a coherent framework for
investment, including by designing better fiscal incentives and making tax compliance
simpler. First, for R&D tax incentives, the focus could be on facilitating access to young and
smaller companies and monitoring implementation. Second, the design and monitoring of tax
incentives for equity investments into start-ups and innovative companies is essential to ensure
they are well targeted. The Commission is taking action under its Action Plan on Building a Capital
Markets Union to encourage best practices in tax incentives for venture capital and business angel
investment. Thirdly, the overall system of tax support could be reviewed to ensure it is coherent.
Some countries apply reduced rates for SMEs, however such rates can discourage companies from
growing as they would face higher taxation. Finally, to move towards taxpayers' empowerment, tax
administrations can build the digital services of the future adopting a "user first" approach. The use
of data analytics will become more and more important. To foster progress, tax administrations can
incentive the use of self-services. Meanwhile, tax administrations could encourage taxpayers to use
digital channels through communication, education and assistance. In parallel, tax administrations
could keep track of progress, using metrics and scoreboards to visualise and communicate to
stakeholders how well they are performing in turning tax compliance into an almost invisible and
costless day-to-day activity.
3.1.2 Developing a more employment-friendly environment
The overall tax burden on labour in the EU increased between 2010 and 2015, although reforms in
2014-15 had already began to reverse this trend. In 2015-16 several Member States reduced
labour taxation, in some cases with a particular focus on low wage earners. Indirect taxes have also
generally increased since 2010, but in 2015-16, changes were mixed.
Several member states reduced personal income tax (PIT) or social security contributions
(SSCs) for employees, in some cases with a particular focus on low to middle income
earners. Reforms included a general PIT rate decrease in Austria combined with a temporary
increase to the top income tax level. As part of a comprehensive tax package, the Netherlands
decreased the PIT rate in the middle two income brackets. Annual increases in the tax-free
allowance were announced in Estonia, as well as in the UK, where it was accompanied by an
Tax reforms in the EU and policy recommendations | 3
55 | P a g e
increase in the higher rate tax threshold. Increases to the PIT or employee SSCs were relatively few.
Germany increased contributions for long term care by 0.2 pp to 2.55%.
A number of Member States reduced employer SSC contributions, either through rate
reductions (in Belgium, Estonia, France and Luxembourg), raising minimum thresholds (in Bulgaria)
or targeted reductions or exemptions (in Belgium). By contrast, Sweden and Italy ended previous
targeted measures on young people and new hires respectively.
Nearly half of Member States reformed (or announced a reform) their excise duties on
tobacco, alcohol, beverages and unhealthy products, in most cases increasing the excise
rates. Similarly, nearly half of the Member States made changes to environmental and energy taxes
(excise and non-excise). The majority concerned energy or motor taxes, and most were to increase
taxes. For example Estonia, Lithuania, Latvia, Sweden, Bulgaria or Portugal increased their excise on
energy products. In Hungary the refund on commercial diesel was decreased. Only a few countries
reduced their taxes.
While most of the countries significantly increased VAT rate to consolidate public
finances during the crisis, this trend has come to an end over the past two years. None of
the 28 MS raised the standard rate and only a few increased the reduced rates on specific products
or limited the scope of exemptions. For example, Austria increased the VAT rate for specific supplies
(e.g. plants, museums, etc.) from 10% to 13% and Belgium set the rate on electricity for households
back to the standard rate of 21%. Conversely, nearly half of the MS introduced new reduced rates.
For example, in Slovakia a reduced rate of 10% will apply to certain foodstuffs. Romania introduced
a reduced VAT rate for drinkable water and for water used for irrigation purposes.
Despite these changes the overall tax burden on labour remains high in the EU in comparison to
other developed economies, and there remains scope for further labour tax reductions.
3.1.3 Fighting against tax fraud, evasion and avoidance
Enforcement has been and is a crucial tool to make tax systems fairer. It is about using the power
of public authority to its fullest to compel taxpayers to do the right thing, including cross-border
cooperation, effective audits and access to information and intelligence. Making the legal
framework stronger has also been central to tackle tax avoidance. In 2015-16, Member States
continued to take action to improve their systems, continuing the trend from recent years and
complementing EU-level action.
Several reforms have aimed at improving tax compliance, for example by a more
stringent surveillance and control of market transactions, reducing evasion
opportunities, and by making deterrence more effective. For instance, the Czech Republic and
Slovakia have introduced compulsory electronic cash registries. Poland has lowered the threshold
for cash payments and Latvia has made sanctions and controls on the use of cash stricter. To
improve VAT compliance, Lithuania now asks more information on VAT invoices and Italy has
expanded the use of the reverse charge mechanism. To increase excise duties compliance, Bulgaria
has strengthened the control powers of its customs authority. Moreover, Bulgaria has also stepped
up checks on the production of certain excise goods. Croatia is implementing a comprehensive
compliance risk management system, while conducting targeted audits in high risk sectors. Hungary
has introduced the concept of risky taxpayers. Latvia's tax authorities have been granted access to
a wider range of information about the financial market, as credit institutions and payment service
providers are obliged to report suspicious activities of Latvian residents to the State Revenue
Tax reforms in the EU and policy recommendations | 3
56 | P a g e
Service. To deter late or no payment of taxes due, Slovakia has started to publish and update
monthly (instead of yearly) its list of tax debtors. In Bulgaria, business licences can now be refused
in case of outstanding tax debt. There have also been reforms to make the sanctions system more
effective, for example in Slovakia, where taxpayers can now correct their tax returns also after a tax
audit has started, and in Italy, which on the one hand has extended the maximum time after which
a tax audit can be conducted in case of fraud and on the other hand has reduced penalties for
milder offences. There have also been several actions aimed at strengthening cooperation between
Member States in fighting tax fraud and tax evasion, for example Romania increased the use of
administrative cooperation instruments including multilateral controls to identify and eliminate
cross-border VAT fraud schemes.
However, despite reforms and progress achieved, tax evasion and fraud continue to pose
a major challenge for Europe. According to the latest available figures for the VAT gap, tens of
billions of euro are lost each year to non-compliance, which however includes not only fraud and
evasion but also avoidance, bankruptcies, financial insolvencies as well as miscalculations, and this
for VAT only. In some Member States (e.g. Romania) the VAT gap is almost as large as the amount
of public investment in health and education put together. In Poland, the VAT gap is about one third
of how much the country spends to support unemployment.
The fight against tax evasion, avoidance and aggressive tax planning has been a priority
of the Commission as is reflected by the numerous initiatives in this area (see box below).
Therefore, reforms at national level have to be seen in the broader context of the EU and
international agreements.
Most of the reforms undertaken to fight aggressive tax planning consisted in
strengthening the anti-abuse legislation and enhancing transparency, also at national
level. For example, in its business tax roadmap, the UK announced the introduction in 2017 of a
restriction on the tax deductibility of corporate interest expense as well as rules to address hybrid
mismatch arrangements. The transfer pricing guidelines will also be updated to reflect the outcome
of the Base Erosion and Profit Shifting (BEPS) project, including the introduction of the Country by
Country (CbCR) reporting for the attention of tax authorities. In order to prevent the shifting of
profits through royalty payments, the UK also foresees a widening of the withholding tax on royalty
(i.e. payments for the use of intangibles such as trademarks) and the introduction of a treaty abuse
rule to prevent royalty payment being made through conduits. Italy introduced a new definition of
the concept of "abuse of law", reviewed its controlled foreign companies (CFC) rules and introduced
CbCR. Another example of reforms to strengthen the anti-abuse framework is the adoption by
Poland of a general anti-abuse rule. Furthermore, several Member States have started
implementing new transfer pricing documentation requirements, including CbCR.
Some Member States have also acted in order to ensure that specific tax regimes are
less prone to tax avoidance and have addressed mismatches that arose from the
interaction between tax rules of several countries. For example, the UK announced a reform
of corporation tax loss relief. In line with the agreement reached at the OECD in the context of the
work on BEPS Action 57, which has been endorsed by the Code of Conduct for Business Taxation, all
Member States (except for France) that have a patent box regime have legislated or announced
7 OECD Countering Harmful Tax Practices More Effectively, Taking into Account Transparency and Substance, Action 5 – 2015 Final Report, (OECD 2015b)
Tax reforms in the EU and policy recommendations | 3
57 | P a g e
legislation to close their patent box regimes to new entrants and to end all benefits for existing
claimants within an agreed timeline.
Optimisation strategies used by wealthy individuals have also been specifically
addressed. For example, Denmark introduced new rules to better control foreign trusts to decrease
possibilities for aggressive tax planning. In the UK, the non-domicile status will be abolished from
April 2017 and inheritance tax should be charged on UK property even under more opaque
ownership structures.
In summary, a number of reforms have been undertaken or announced by Member States in order
to fight tax avoidance. However, more could be done. Coordination across Member States is of
importance in order to effectively tackle the issue.
EU Developments
1. Fight against tax avoidance, evasion and aggressive tax planning
The Commission has set an ambitious agenda to address tax avoidance, evasion and aggressive tax
planning and ensure fair and efficient taxation in the EU. Ensuring effective taxation whereby
companies pay taxes where they generate their profits, and enhancing tax transparency have been
at the heart of the proposed reforms.
In March 2015, the Commission launched a package of measures to boost tax transparency. It
included a proposal for an automatic exchange of information on tax rulings, which was adopted by
the Council in December 20158. All advance cross-border tax rulings and advance pricing
arrangements will be subject to an automatic exchange of information as from January 2017.
Moreover, in June 2015 the Commission adopted a proposal on country-by-country reporting
between Member States' tax authorities on key tax-related information on multinational companies
operating in the EU. Such proposal was adopted by the Member States in May 20169. Further to the
introduction of non-public Country-by-Country reporting (CbCR), the Commission adopted in April
2016 a proposal to introduce public reporting requirements for multinational entities10. Finally, in
July 2016, the Commission proposed further measures to enhance transparency and the fight
against tax evasion and avoidance. Those measures include, inter alia, a proposal aimed at enabling
Member States' tax authorities to have access to national anti-money laundering information11 (in
particular beneficial ownership and due diligence information), some targeted amendments to the
Anti-Money Laundering Directive, as well as an initiative to increase oversight of enablers and
promoters of aggressive tax planning schemes.
8 Council Directive 2014/107/EU of 9 December 2014 amending Directive 2011/16/EU as regards mandatory automatic exchange of information in the field of taxation (OJ L 359, 16.12.2014). 9 Council Directive (EU) 2016/881 of 25 May 2016 amending Directive 2011/16/EU as regards mandatory automatic exchange of information in the field of taxation (OJ L 146, 3.6.2016). 10 Proposal for a Directive of the European Parliament and of the Council amending Directive 2013/34/EU as regards disclosure of income tax information by certain undertakings and branches (COM(2016) 198 final). 11 Proposal for a Council Directive amending Directive 2011/16/EU as regards access to anti-money-laundering information by tax authorities (COM(2016) 452 final).

Tax reforms in the EU and policy recommendations | 3
58 | P a g e
The June 2015 Action Plan for Fair and Efficient Corporate Taxation12 was swiftly followed by the
adoption of the Anti-Tax Avoidance Package in January 2016. This package is made up of four
proposals to ensure that tax is paid where the value is generated and that tax information is
effectively accessed. The package complements and builds on the outcome of the OECD/G20 Base
Erosion and Profit Shifting (BEPS) project. Next to the amendment to the existing Directive on
administrative cooperation to implement the CbCR (discussed above), it includes the anti-tax
avoidance Directive13. The Directive, which was adopted by the Council in July 2016, puts forward
tax rules aimed at preventing that income goes untaxed (or taxed at very low level). It covers the
following rules: interest limitation rule, exit taxation, general anti-abuse rule, controlled foreign
company rules, and rules on hybrid mismatches. The package also includes a Recommendation on
Tax Treaty issues14, which advises Member States on how to reinforce their tax treaties against
abuse by aggressive tax planners in a way that is compliant with EU law. Finally, the
Communication on external strategy for effective taxation15 sets out a coordinated EU approach
against external risks of tax avoidance and to promote international tax good governance. Follow-
up work to this Communication is ongoing and the Commission has recently published a Scoreboard
of third country jurisdictions, which is the first step in the creation of a common EU list of non-
cooperative tax jurisdictions.
The Anti-Tax Avoidance Package complements existing initiatives and forums to ensure effective
taxation and transparency, such as the Code of Conduct or the Joint Transfer Pricing Forum.
2. CCCTB
The re-launched Common Consolidated Corporate Tax Base (CCCTB), adopted by the Commission on
25 October 2016, will make it easier and cheaper to do business in the Single Market and will act as
a powerful tool against tax avoidance. The CCCTB will offer companies solid and predictable rules, a
fair and level-playing field and reduced costs and administration. This will make the EU a more
attractive market in which to invest and do business. The re-launched CCCTB will also support R&D,
a key driver of growth. Companies will be allowed a super-deduction on their R&D costs, which will
particularly benefit young and innovative companies which choose to opt-in to the new system. The
CCCTB will take steps to address the bias in the tax system towards debt over equity, by providing
an Allowance for Growth and Investment (AGI) for equity issuance. This will encourage companies to
seek more stable sources of financing and to tap capital markets, in line with the goals of the
Capital Market Union.
12 European Commission (2015a), Communication from the Commission to the European Parliament and the Council - A Fair and Efficient Corporate Tax System in the European Union: 5 Key Areas for Action, COM(2015) 302 final. 13 Council Directive (EU) 2016/1164 of 12 July 2016 laying down rules against tax avoidance practices that directly affect the functioning of the internal market (OJ L 193 of 19.7.2016). 14 Commission Recommendation (EU) 2016/136 of 28 January 2016 on the implementation of measures against tax treaty abuse (OJ L 25, 2.2.2016) 15 European Commission (2016c), Communication from the Commission to the European Parliament and the Council on an External Strategy for Effective Taxation, COM/2016/024 final.
Tax reforms in the EU and policy recommendations | 3
59 | P a g e
3. VAT Action Plan
Although the current VAT system is a major source of tax revenues in the EU, it remains fragmented
which creates significant administrative burdens, especially for SMEs and digital companies. The
current system is complex for businesses that wish to expand beyond the Member State in which
they are established. Cross border VAT fraud has reached EUR 50 billion.
The European Commission adopted an Action Plan on VAT16 early April 2016 with the objective of
modernising the current system, to make it simpler, more fraud-proof and business-friendly. The
Action Plan sets out immediate and urgent actions to tackle the VAT gap and adapt the VAT system
to the digital economy and the needs of SMEs. The Action Plan also provides clear orientations
towards a robust single European VAT area in relation to the definitive VAT system for cross-border
supplies and proposes options to grant Member States greater flexibility in setting them17.
3.1.4 A fair distribution of the tax burden
In 2015-16 a concern for fairness as well as efficiency could be seen in reforms to
labour taxation in a number of Member States, in particular in reforms to SSCs, PIT and capital
and property taxation expecting to bring more progressivity in some tax systems. As discussed
above, several Member States reduced the tax burden on low and middle income earners. In
addition to the reforms described above, Belgium announced an increase to the basic allowance and
a change in tax schedule, which, combined with higher deductions for professional costs, and an
increase in the social work bonus for low wage-earners should increase workers' take-home pay,
especially for the low-waged. Latvia introduced a differentiated non-taxable minimum income for
individuals. In the Netherlands changes to tax credits included an increase in the maximum for both
the general tax credit and the tax credit for combining work and childcare, accompanied by a
steeper deduction rate as earnings rise.
As in previous years, these targeted labour tax cuts were sometimes accompanied by
increased tax burden on higher income earners and capital gains. This was the case in
Austria, where the tax reform included a temporary increase of the top PIT rate. Belgium will also
finance its tax shift partly through higher withholding tax on dividends and interests and a tax on
short-term capital gains. In Spain labour tax cuts of previous years will be partly financed thanks to
the extension of wealth tax for the full year 2016. Luxembourg plans an increase of the withholding
tax on interest.
A few Member States decreased property taxes, notably for equity concerns. For example,
Malta extended the stamp duty exemption for first time property buyers, France maintained some
of the tax allowances for tax payers with low revenues. Denmark nominally froze the land tax for
own-occupied properties in 2016. Conversely, Italy increased the property transfer tax on
agricultural lands for rentiers from 12% to 15%. The UK amended the Stamp duty land tax, setting
higher rates on additional properties.
16 European Commission (2016d), Communication from the Commission to the European Parliament, the Council and the European Economic and Social Committee on an action plan on VAT - Towards a single EU VAT area - Time to decide, COM(2016) 148 final. 17 http://europa.eu/rapid/press-release_MEMO-16-1024_en.htm

Tax reforms in the EU and policy recommendations | 3
60 | P a g e
Some Member States are considering reforms to the design of their tax system. In Latvia,
the Ministry of Finance is currently reflecting on the possibility to switch from a flat rate system
with allowances to a multiple-rate system to improve the effective progressivity of its tax system.
The Luxembourg government plans a comprehensive tax reform which will enter into force in 2017.
Enhancing social fairness is one of the stated objectives of the reform, which provides among
others for a greater progressivity in the lower tax brackets, an increase in the number of tax
brackets, and the introduction of higher tax rates for the top earners (with an increase of the top
PIT rate from 40% to 41% and 42%). In addition, some allowances will be reviewed, such as the
deductibility for domesticity and childcare costs that would be increased from EUR 3600 to EUR
5400. With a view to simplify labour taxation, increase compliance and fairness, Polish Deputy
Prime Minister has announced a deeper reform of integrating personal income taxation and social
society contributions including changes to the personal allowance.
However, disposable income inequality levels remain high in some Member States where
there seems to be some room for manoeuvre to improve the fairness of the tax design.
Despite last year's trend to increasingly target labour tax cuts on low income earners, further tax
reductions targeted at this group could contribute to both jobs creation and greater social fairness.
In Member States where social fairness is an issue, more efforts to consider the progressivity of the
tax system as a whole could help to fairly spread the tax burden across tax payers.
3.2 Reform options and inspiring examples
Taking into account what makes a fair and efficient tax system (Chapter 1), the specific situations
in Member States (Chapter 2) and the general reform trends outlined above, there are various
reforms options available to Member States looking to improve their taxation system.
3.2.1 Encouraging alternative sources of financing and designing better fiscal incentives
Options for Member States aiming to do more to boost investment through tax policy
means include:
Encouraging alternative sources of financing and designing better fiscal incentives:
Encouraging investment through equity as a complementary source of financing to debt,
notably by reducing the debt bias for businesses under tax provisions (see example of AGI
under the CCCTB).
Improving the effectiveness of tax incentives in promoting R&D in the private sector by
ensuring that young and small companies are able to benefit, simplifying and regularly
evaluating their impact (see example of France and R&D super-deduction under the CCCTB).
Ensuring that tax incentives for encouraging business angel and venture capital investment
are well targeted. Concentrating efforts on monitoring and simplifying tax incentives that
have the potential to boost real investment. A multitude of tax reliefs does not allow for
proper monitoring, makes the system more complex and represents public resources that
could be put to a better use.
Tax reforms in the EU and policy recommendations | 3
61 | P a g e
Making tax compliance simpler for taxpayers, especially entrepreneurs, by:
Making tax administration more customer-centric, expanding the use of digital services,
such as third-party information to prefill tax returns and of e-filing, while cutting red tape
for all taxpayers and for small and medium-sized companies and entrepreneurs in
particular (see example of Estonia).
Keeping tax laws stable, pro-actively managing changes. When changes need to happen,
engage taxpayers in advance to help them to adjust and give them timely, tailored
information, using a variety of channels.
Inspiring examples of tax reforms to boost investment in the Member States
The Commission's proposal for a CCCTB removes the debt bias distortion, by offering an
Allowance for Growth and Investment (AGI). It will allow a tax deduction for companies that
choose to increase equity for financing rather than take on debt. The deduction will be
calculated by multiplying the change in equity by a fixed rate, which is composed of a risk-free
interest rate and a risk premium. The AGI also has strong anti-avoidance provisions. This
allowance ensures that equity receives a similar level of tax benefits as debt does, creating a
more neutral and investment-friendly tax environment.
France applies a tax scheme for young innovative companies that have been benchmarked as
best practice in the recent study on R&D tax incentives. Such young innovative firms are exempt
from social security contributions on research and innovation personnel they hire for the whole
eight year period that companies qualify as young. The immediate refund option and short
response time allow firms to obtain the funding faster, which is crucial to financially constrained
firms. Since in place, evaluations have shown the positive impact on employment, sales
increases and survival rate. The Commission's CCCTB proposal offers a super-deduction for
R&D costs. To support small and innovative companies, an even more generous super-
deduction is given to start-up companies which will be allowed to deduct up to 200% of their
R&D costs.
Estonia is currently developing a new generation of tax e-services to simplify and fasten
further tax compliance. The aim of the e-tax administration (e-MTA) project is to allow taxpayers
to provide tax authorities data in real-time: as sales are made and recorded, inventories
updated, wages paid etc., minimising taxpayers' intervention. One of the key objectives of the
project is making tax compliance easy to track, accessible from a "one stop shop" and fully
automated. Estonia wishes to make sure that the e-MTA project delivers user-centric solutions,
and is built according to taxpayers' wishes of which services they desire accessing in the future.
To do so, the Estonian tax administration is asking feedback and suggestions directly from its
customers, who can simply fill and submit e-forms with ideas online from the tax administration
website.
Tax reforms in the EU and policy recommendations | 3
62 | P a g e
3.2.2 Shifting the tax burden away from labour and focusing on the most reactive groups
For Member States that face challenges around employment and the tax burden on
labour, potential reform options could include:
Finance labour tax cuts by relying on alternative tax bases less detrimental to growth:
Given budgetary constraints, labour tax cuts could be financed by relying on alternative tax
bases such as those less detrimental to growth (consumption, environmentally harmful
activities, and property) where the tax burden on those bases is comparatively low.
Focusing labour tax cuts on groups most reactive and facing the highest challenges:
Focusing labour tax cut on groups facing the greatest unemployment challenges and
precarious work conditions such as low-skilled, young people, elderly and long term
unemployment rather than generic tax reductions (see example of Belgium).
3.2.3 Strengthening administration, closing loopholes and promoting a culture of compliance
Reform options for Member States looking to combat tax fraud, evasion and avoidance
include:
More cooperation and a stronger administrative capacity & legal framework:
Combating tax fraud, evasion and evasion making full use of enhanced transparency and
cross-border cooperation tools – such as automatic exchange of information, sharing of
analysis of data between countries, multilateral controls and joint audits (see example of
Romania). Making tax authorities more modern and digital to prevent and fight evasion,
fraud and avoidance.
Strengthening the legal framework, for example by closing loopholes in domestic legislation
(see example of Ireland) or reinforcing anti-abuse provisions.
Inspiring examples of tax reforms to support employment (see also the example
under redistribution below)
At the end of 2015, as part of the on-going tax shift Belgium legislated an increase to the basic
allowance and a change in tax schedule, which, combined with higher deductions for
professional costs, should increase workers' take-home pay, especially for the low-waged.
Further measures included a gradual decrease in employer’s social contributions from 33% to
25% and a further reduction in employees' social contributions, owing to an increase in the
social work bonus for low wage-earners. The labour tax cuts are to be financed in part by a
series of tax increases on consumption and non-labour income and by stepping up the fight
against tax fraud and tax evasion.
Tax reforms in the EU and policy recommendations | 3
63 | P a g e
Promoting trust, transparency and a culture of tax compliance:
Communicating effectively to taxpayers the value delivered through tax revenues; monitor
and show results of tax administrations’ performance (see example of Latvia).
Strengthening taxpayers' tax morale using communication and education campaigns to
explain why it is important that everyone pay their fair share, targeting in particular young
people - the taxpayers of tomorrow (see example of Poland).
Cooperating with businesses to improve tax compliance while using behavioural economics
insights to nudge taxpayers to do the right thing at the right time. (See example of UK)
Inspiring examples of tax reforms to enhance tax compliance
Romania targeted its enforcement actions on cross-border VAT carousel fraud, cooperating with
other Member States. In 2014, the Romanian tax administration took part in four joint inspections
together with several other Member States' tax authorities and exchanged almost 5,000 inquiries
for suspected cases of VAT fraud and evasion with other Member States.
Ireland announced changes to the tax residency rules as part of the 2015 Budget Law. The
possibility to apply the so-called double Irish tax scheme disappeared for new companies, while a
six year transitional period was foreseen for existing companies.
With the explicit purpose of showing citizens the "value for money" of taxes paid, Latvia set up a
new interactive webpage ("Dots devējam atdodas"). Through the website, users can get a clearer
idea of how the taxes they are paying are contributing to essential public services such as pensions,
health care, schooling etc. To stimulate communication and interaction, the website allows users to
share their findings through various social media. A special communication campaign accompanied
the launch of the webpage with the aim of shaping the mind-set and attitudes of citizens, raising
awareness of the essential role that taxes play in ensuring the long term development and welfare.
Poland's tax authorities continue to organise informational and educational activities to raise
taxpayers' awareness of the importance of tax compliance and of the value that taxes help to
deliver. Concrete examples include the campaign "From our Taxes for Us" and the introduction of
tax-related topics in primary schools' textbooks.
In the UK, the Behavioural Insights Team and the tax administration have used normative
messages to nudge people to pay back their tax debts. By telling tax debtors that the greatest
majority of people in the neighbouring area had already settled their tax affairs, there was a
significant increase in tax compliance compared with another group of tax debtors to which no such
messages had been sent. This experiment provides further evidence that reference to social norms
are effective, especially when targeted to a local area.
Tax reforms in the EU and policy recommendations | 3
64 | P a g e
3.2.4 Enhancing the fair distribution of the tax burden across the population
In addition to the potential reforms outlined on labour taxation above, Member States
that face particular challenges in social fairness could consider:
Enhancing the fair distribution of the tax burden across the population:
Consider strengthening progressivity in the PIT, taxation of capital income of individuals,
property taxes and revenues from fighting against tax fraud, tax evasion and aggressive tax
planning (see example of Austria).
Inspiring example of tax reforms that enhance redistribution
In Austria, a major labour tax reform was implemented in 2016, which expanded the
progressive income tax scale for individuals to six brackets, and included the reduction of the PIT
rate at the bottom tax bracket and a temporary increase to the top PIT rate, together with higher
taxes on capital income. Other measures included an increase in the tax-exempt allowance for
children, a reduction in the minimum monthly contribution for health insurance for self-
employed workers, an increase in tax credits for employees, and the reimbursement of social
security contributions for those with a very low tax liability.

65 | P a g e

66 | P a g e
67 | P a g e
Glossary
Allowance for corporate equity (ACE) A corporate tax system where interest payments and a
defined return on equity can both be deducted from the corporate income tax base. (It moves the system closer to financing neutrality between debt and equity at the corporate level.)
Allowance for growth and investment (AGI) is a corporate tax system where interest payments
and a return on equity can both be deducted from the corporate income tax base. It moves the system closer to financing neutrality between debt and equity at the corporate level. It goes some steps further than ACE because it removes tax avoidance by cascading the benefits (the funds injected in a group benefit from deductibility only once) and uses an incremental system based on a moving reference year.
Comprehensive business income tax (CBIT) A type of corporate tax system where neither
interest payments nor the return on equity can be deducted from corporate profits, and are thus fully taxed at the normal corporate income tax rate. It equalises the tax treatment of debt and equity finance at the corporate level.
Controlled Foreign Companies (CFC) rules Rules that attribute a proportion of the income of a
controlled foreign company to its resident controlling shareholder and tax that shareholder to that income if certain conditions are met (usually that the tax rate in the foreign country is lower than a set percentage of the tax rate in the country applying the CFC charge).
Direct taxes Taxes levied on income, wealth and capital.
Effective average tax rate (EATR) is a tax rate calculated from the nominal tax rate and the definition of the tax base. Particularly, this effective tax rate is based on total investment income.
Effective marginal tax rate (EMTR) is a tax rate calculated from the combination of the nominal
(i.e. statutory) tax rate and the definition of the tax base (i.e. the taxable profit). In particular, this effective tax rate is based on additional investment income.
Environmental taxes Taxes on energy, transport, pollution and resources (excluding VAT, as this is
levied on all products). Energy taxes include taxes on energy products used for both transport (e.g.
petrol and diesel) and stationary purposes (e.g. fuel oils, natural gas, coal and electricity). Transport taxes include taxes related to the ownership and use of motor vehicles. They also
include taxes on other transport equipment such as planes and on related transport services, e.g. duties on charter or scheduled flights. Pollution taxes include taxes on measured or estimated
emissions to air (except taxes on carbon dioxide emissions) and water, on the management of waste and on noise. Resource taxes include any taxes linked to the extraction or use of a natural
resource (e.g. taxes on the extraction of gas and oil and licence fees paid for hunting and fishing rights).18
European Semester The European Semester is the first phase of the EU’s annual cycle of
economic policy guidance and surveillance. Each year, during this first phase, the European Commission analyses Member States’ budgetary and structural reform policies, provides recommendations to each Member State, and monitors their implementation. In the second phase of the annual cycle, known as the National Semester, Member States implement the policies agreed.
Implicit tax rate on consumption The ratio of revenue from all consumption taxes to
households’ final consumption expenditure.
18 This definition is based on ‘Environmental taxes — a statistical guideline’ (European Commission, 2001). National classifications may
deviate from the guidelines
68 | P a g e
Implicit tax rate on energy The ratio of total revenue from energy taxes to final energy consumption.
Inactivity trap The inactivity trap measures the financial incentive for an inactive person not
entitled to unemployment benefits (but potentially receiving other benefits such as social assistance) to move from inactivity to paid employment. It is defined as the rate at which the additional gross income of such a transition is taxed.
Indirect taxation Taxes that are levied at the production stage, and not on the income or property
resulting from economic production processes. The main examples of indirect taxation are VAT, excise duties, import levies, and energy and other environmental taxes.
Low-wage trap The low wage trap measures the financial incentive to increase a low level of
earnings by working additional hours. It is defined as the rate at which the additional gross income of such a move is taxed.
Social security contributions Mandatory contributions paid by employers and employees into a social insurance scheme set up to cover pensions, healthcare and other welfare provisions.
Tax avoidance According to the OECD glossary of tax terms, tax avoidance is defined as the
arrangement of a taxpayer’s affairs in a way that is intended to reduce his or her tax liability and that - although the arrangement may be strictly legal - is usually in contradiction with the intent of the law it purports to follow.
Tax evasion Generally comprises illegal arrangements where liability to tax is hidden or ignored,
i.e. the taxpayer pays less tax than he is legally obligated to pay by hiding income or information from the tax authorities.
Tax fraud A form of deliberate evasion of tax which is generally punishable under criminal law. The
term includes situations in which deliberately false statements are submitted or fake documents are produced.
Tax wedge on labour The difference between the wage costs to the employer of a worker and the
amount of net income that the worker receives. The difference arises as a result of taxes, including personal income tax and compulsory social security contributions.
Thin capitalisation rules Restrictions on the deductibility of interest payments made by corporations with excessive debt to equity ratios.19
VAT collection gap The difference between VAT revenue actually collected by the government and
the theoretical net VAT liability for the economy as a whole, under the country’s current VAT system. The theoretical net liability is estimated by identifying the categories of expenditure that give rise to irrecoverable VAT and applying the appropriate VAT rates to the respective estimates of expenditure in the different categories.
Withholding tax According to the OECD, a withholding tax refers to a tax on income imposed at
source, i.e. a third party is charged with the task of deducting the tax from certain kinds of payments and remitting that amount to the government. Withholding taxes are found in practically all tax systems and are widely used in respect of dividends, interest, royalties and similar tax payments. The rates of withholding tax are frequently reduced by tax treaties.
19 Adapted from Arnold & McIntyre, International Tax Primer, Second Edition, Kluwer International, 2002
69 | P a g e
References
Alstadsæter, A., Barrios, S., Nicodeme, G., Skonieczna, A., and A. Vezzani (2015). Patent Boxes Design, Patents Location and Local R&D. Taxation Paper 57, Directorate General for Taxation and Customs Union. Arnold, B., and McIntyre, M. (2002). International Tax Primer. Second Edition. Kluwer Law International. CASE et al. (2016). Study and Reports on the VAT Gap in the EU-28 Member States: 2016 Final Report, TAXUD/2015/CC/131. Chrysa Leventi and Sanja Vujackov (2016). Baseline results from the EU28 EUROMOD (2011-2015) EUROMOD Working Paper Series EM3/16 May 2016 Commission Recommendation (EU) 2016/136 of 28 January 2016 on the implementation of measures against tax treaty abuse (OJ L 25, 2.2.2016) Council Directive 2014/107/EU of 9 December 2014 amending Directive 2011/16/EU as regards mandatory automatic exchange of information in the field of taxation (OJ L 359, 16.12.2014). Council Directive (EU) 2016/881 of 25 May 2016 amending Directive 2011/16/EU as regards mandatory automatic exchange of information in the field of taxation (OJ L 146, 3.6.2016). Council Directive (EU) 2016/1164 of 12 July 2016 laying down rules against tax avoidance practices that directly affect the functioning of the internal market (OJ L 193 of 19.7.2016). Proposal for a Directive of the European Parliament and of the Council amending Directive 2013/34/EU as regards disclosure of income tax information by certain undertakings and branches (COM(2016) 198 final). Proposal for a Council Directive amending Directive 2011/16/EU as regards access to anti-money-laundering information by tax authorities (COM(2016) 452 final). CPB (2014). A Study on R&D Tax Incentives. Final Report. Study commissioned by the European Commission. Taxation Working Paper 52, 2014. Dover et al. (2015). Bringing transparency, coordination and convergence to corporate tax policies in the European Union. European Parliamentary Research Service. PE 558.773 European Commission (2004). European Employment Observatory Review, Spring 2004 European Commission (2007). European Employment Observatory Review, Spring 2007 European Commission (2015a). Communication from the Commission to the European Parliament and the Council - A Fair and Efficient Corporate Tax System in the European Union: 5 Key Areas for Action, COM(2015) 302 final. European Commission (2015b). Communication from the Commission to the European Parliament, the Council, the European Economic and Social Committee and the Committee of the Regions, Action Plan on building a Capital Markets Union – COM(2015) 468 European Commission (2015c). Taxation Trends in the EU 2015, Brussels.
70 | P a g e
European Commission (2016a). ‘Impact Assessment Accompanying the document: Proposals for a Council Directive on a Common Corporate Tax Base and a Common Consolidated Corporate Tax Base (CCCTB)'. SWD(2016) 341 final. European Commission (2016b). Taxation Trends in the European Union: Data for the EU Member States, Iceland and Norway. Edition 2016. European Commission (2016c). Communication from the Commission to the European Parliament and the Council on an External Strategy for Effective Taxation, COM/2016/024 final European Commission (2016d). Communication from the Commission to the European Parliament, the Council and the European Economic and Social Committee on an action plan on VAT - Towards a single EU VAT area - Time to decide, COM(2016) 148 final. Fiscalis 2020 tax gap project group (2016). The Concept of Tax Gaps: Report on VAT Gap Estimations, (FPG/041) OECD (2012). Working Party on National Accounts: Summary of the OECD Survey on Measuring the Non-Observed Economy. OECD Publishing. OECD (2013), Tax Administration 2013: Comparative Information on OECD and Other Advanced and Emerging Economies, OECD Publishing, Paris OECD (2015a). Tax Administration 2015, Comparative Information on OECD and Other Advanced and Emerging Economies, OECD Publishing. OECD (2015b). Countering Harmful Tax Practices More Effectively, Taking into Account Transparency and Substance, Action 5 – 2015 Final Report, OECD Publishing. Ramboll Management Consulting and Corit Advisory (2015). Study on Structures of Aggressive Tax Planning and Indicators, Taxation Papers, No 61, Publications Office for the European Union, Luxembourg. World Bank (2016). Doing Business 2017: Equal Opportunities for All. Washington, DC: World Bank. ZEW (2015). Effective Tax Levels Using the Devereux-Griffiths Methodology: Intermediate Report 2015. Project for the European Commission. TAXUD/2013/CC/120 ZEW (2016a). The Effects of Tax Reforms to Address the Debt-Equity Bias on the Cost of Capital and on Effective Tax Rates, Taxation Papers 64, Publications Office for the European Union, Luxembourg ZEW (2016b). The Impact of Tax-planning on Forward-looking Effective Tax Rates, forthcoming in Taxation Papers, Publications Office for the European Union, Luxembourg.

71 | P a g e
Annex A: Notes
Choice of indicators
The indicators in Tax Policies in the EU: 2016 Survey are drawn from various sources. The indicators
presented provide a useful tool for identifying areas where policies could be improved. However,
these results will always need to be interpreted alongside in-depth country analysis before any
conclusions can be made as to appropriate policies. This type of in-depth analysis is beyond the
scope of this report; it is instead carried out as part of the European Semester.
The Tax Policies in the EU survey does not claim to be comprehensive and there are inevitably other
indicators that could have been used. Factors taken into account in the choice of indicator include
completeness (wherever possible, data is presented for all 28 Member States), clarity and reliability.
Choosing indicators is a particular challenge in certain areas – for example, it is by definition
difficult to estimate how much money is lost to tax fraud, evasion and avoidance. Despite the
measurement challenges, this report looks into indicators which are generally considered as
relevant and which can help to better understand the size or relevance of the features or
phenomena examined.
Where available and relevant, the average for the EU-28 is presented alongside the country-specific
data. This is intended to assist readers in understanding the relative levels in different Member
States and should not be interpreted as suggesting that the EU average represents an ideal level.
State Aid
Member States must ensure the compliance of all their tax measures with EU State aid rules and
notify to the Commission all relevant measures, to the extent they are not covered by the General
Block Exemption Regulation20 and the De Minimis Regulation21. This report is without prejudice to a
possible State aid assessment of national tax measures by the Commission.
20 Commission Regulation (EU) No 651/2014 of 17 June 2014 declaring certain categories of aid compatible with the internal market in application of Articles 107 and 108 of the Treaty, OJ L 187, 26.6.2014, p.1-78 21 Commission Regulation (EC) No 1407/2013 of 18 December 2013 on the application of Articles 107 and 108 of the Treaty on the Functioning of the European Union to de minimis aid, OJ L 352, 24.12.2013, p.1-8

HOW TO OBTAIN EU PUBLICATIONS
Free publications:
One copy: via EU Bookshop (http://bookshop.europa.eu);
More than one copy or posters/maps: from the European Union’s representations (http://ec.europa.eu/represent_en.htm); from the delegations in non-EU countries (http://eeas.europa.eu/delegations/index_en.htm); by contacting the Europe Direct service (http://europa.eu/europedirect/index_en.htm) or calling 00 800 6 7 8 9 10 11 (Freephone number from anywhere in the EU) (*).
(*) The information given is free, as are most calls (though some operators, phone boxes or hotels may charge you).
Priced publications:
via EU Bookshop (http://bookshop.europa.eu).