Embed Size (px)
Citation preview
DI
SC
US
SI
ON
P
AP
ER
S
ER
IE
S
Forschungsinstitut zur Zukunft der ArbeitInstitute for the Study of Labor
Tax Evasion, Welfare Fraud, and “The Broken Windows” Effect: An Experiment in Belgium, France and the Netherlands
IZA DP No. 5609
March 2011
Mathieu LefebvrePierre PestieauArno RiedlMarie Claire Villeval
Tax Evasion, Welfare Fraud, and “The Broken Windows” Effect:
An Experiment in Belgium, France and the Netherlands
Mathieu Lefebvre University of Liège, CREPP
Pierre Pestieau
University of Liège, CREPP, CORE, University of Louvain, CEPR, PSE and IZA
Arno Riedl
Maastricht University, CESifo and IZA
Marie Claire Villeval University of Lyon, CNRS, GATE and IZA
Discussion Paper No. 5609 March 2011
IZA
P.O. Box 7240 53072 Bonn
Germany
Phone: +49-228-3894-0 Fax: +49-228-3894-180
E-mail: [email protected]
Any opinions expressed here are those of the author(s) and not those of IZA. Research published in this series may include views on policy, but the institute itself takes no institutional policy positions. The Institute for the Study of Labor (IZA) in Bonn is a local and virtual international research center and a place of communication between science, politics and business. IZA is an independent nonprofit organization supported by Deutsche Post Foundation. The center is associated with the University of Bonn and offers a stimulating research environment through its international network, workshops and conferences, data service, project support, research visits and doctoral program. IZA engages in (i) original and internationally competitive research in all fields of labor economics, (ii) development of policy concepts, and (iii) dissemination of research results and concepts to the interested public. IZA Discussion Papers often represent preliminary work and are circulated to encourage discussion. Citation of such a paper should account for its provisional character. A revised version may be available directly from the author.
IZA Discussion Paper No. 5609 March 2011
ABSTRACT
Tax Evasion, Welfare Fraud, and “The Broken Windows” Effect: An Experiment in Belgium, France and the Netherlands
In a series of experiments conducted in Belgium (Wallonia and Flanders), France and the Netherlands, we compare behavior regarding tax evasion and welfare dodging, with and without information about others’ behavior. Subjects have to decide between a ‘registered’ income, the realization of which will be known to the tax authority for sure, and an ‘unregistered’ income that will only be known with some probability. This unregistered income comes from self-employment in the Tax treatment and from black labor supplementing some unemployment compensation in the Welfare treatment. Subjects have then to decide on whether reporting their income or not, knowing the risk of detection. The results show that (i) individuals evade more in the Welfare treatment than in the Tax treatment; (ii) many subjects choose an option that allows for tax evasion or welfare fraud but report their income honestly anyway; (iii) examples of low compliance tend to increase tax evasion while examples of high compliance exert no influence; (iv) tax evasion is more frequent in France and the Netherlands; Walloons evade taxes less than the Flemish. There is no cross-country difference in welfare dodging. JEL Classification: H26, H31, I38, C91 Keywords: tax evasion, social fraud, social comparisons, cross-country comparisons,
experiments Corresponding author: Mathieu Lefebvre University of Liège CREPP Bd. du Rectorat 7 (B31) Liège 4000 Belgium E-mail: [email protected]

1. INTRODUCTION
Tax evasion and welfare frauds in both social assistance and insurance are worrisome
phenomenas, in particular, but not only, in times of economic crises when tax bases decline
while needs increase. Albeit its social and economic importance we know very little about
these informal phenomena (see Andreoni, Erard, and Feinstein, 1998; Slemrod, 2007). The
existing cross national and intertemporal estimates at the macro level pertaining to the size of
underground activities are plagued with reliability problems. For instance, the indirect
method used by Schneider (2004) and the survey method used in a recent Eurobarometer
(European Commission, 2007) provide strongly diverging figures and rankings of countries
concerning the extent of tax evasion. According to the former study the Belgian shadow
economy is much larger than the French and the Dutch ones. In contrast, according to the
latter study the Dutch seem to be much more involved in fraudulent activities than the other
countries or regions. There is even less reliable evidence on underground activities at the
micro level. However, for targeted policy action such as fighting tax evasion and curbing
welfare dodging good micro data analysis is indispensable, because it provides information on
the types of individuals that are involved and their behavioral motivations.
An important issue in policy debates concerns the relative importance of tax evasion and
welfare dodging. Indeed, in times of scarcer public resources, it is even more important to
focus spending on the deterrence of the most sizeable sources of fraud. A natural intuition is
that these two types of fraud are related to populations with different income levels. From
this perspective, the case of federal Belgium with its two main regions, Flanders and
Wallonia, is an interesting case. Indeed, the conventional belief is that in rich Flanders tax
evasion would be more widespread and welfare dodging less pervasive than in poorer
Wallonia. It may however be the case that the two types of fraud are not only a matter of
2

income level but are also associated with different social norms and levels of disapproval. In
particular, it is conceivable that individual tax or welfare morale depends on the behavior of
others in the society (Myles and Naylor, 1996; Alm and Torgler, 2006; Fortin, Lacroix, and
Villeval, 2007; Torgler, 2007; Cummings et al., 2009). Recently, field experiments have
indeed confirmed the “broken windows theory” of Wilson and Kelling (1982) which predicts
that signs of disorder or littering induce the spreading of more disorder and littering when
people can observe that others have violated a social norm (see notably Keizer et al., 2008).
Therefore, one may suspect that a high level of compliance in the group may discipline
individuals, while a low level of compliance may discourage them from behaving honestly.
However, we do not know whether others’ influence is the same on tax evasion and on
welfare dodging. In addition, it is not clear that the disciplining effect –if any- of good
examples is equivalent in size to the deteriorating impact of bad examples. Therefore this
paper aims at measuring the relative importance of tax evasion and welfare fraud and whether
and how both are influenced by social information about others behavior in both domains.
These issues are difficult to address with conventional field empirical analyses because the
available administrative data and households surveys are not accurate and informative
enough. Another concern with field data is the difficulty to identify the impact of endogenous
social interactions because of the reflection effect (Manski, 1993; Brock and Durlauf, 2001).
Laboratory experiments constitute a useful approach here. They allow the controlled
manipulation of the relevant factors of the environment, as income levels, monitoring
probabilities, and information about others' behavior. Another advantage is that experiments
allow to study individual behavior directly and to observe the causal effects to the
introduction of exogenous changes, ceteris paribus. These advantages led to a series of
experimental studies into tax evasion (see Alm, 1991; Webley et al., 1991; Andreoni, Erard,
3

and Feinstein, 1998; Anderhub et al. 2001; Gerxhani and Schram, 2006; Fortin et al., 2007;
Kirchler, 2007; Torgler, 2007; Coricelli et al., 2010), but none studied the equally important
problem of welfare fraud, which is one main research question of our paper. The basic design
of most experiments on tax compliance is as follows: subjects have to report their income
knowing tax rates, audit probabilities and fines for underreporting income. Though there are
varieties to this basic design, the results regarding tax compliance are robust. They show that
compliance: (i) decreases with the tax rate; (ii) decreases with the level of income; (iii)
increases with the audit probability; (iv) increases with the level of fines; (v) is higher when
the proceeds are used to provide a public good; (vi) is usually lower than predicted if people
are willing to maximize their earnings since a large subset of people never cheat, probably
due to lie aversion. Indeed, it has been shown that tax evasion is not a gamble (Baldry, 1986)
since it involves moral considerations and not only the maximization of individual earnings.
To analyze whether individuals have the same attitude towards tax evasion and welfare
dodging, we have designed an experiment that introduces the same monetary incentives to
cheating in both. As in Gerxhani and Schram (2006) subjects choose between a ‘registered’
random income, the realization of which will be known to the tax authority for sure and taxed
accordingly, and an ‘unregistered’ random income that will only be known with some
probability. This unregistered income comes from self-employment in our Tax treatment and
from black labor supplementing some unemployment compensation in our Welfare treatment.
If subjects choose the unregistered income, after being informed on their actual income, they
have to decide on whether reporting this income or not. If they do not report, they risk -if
detected- a fine for underreporting or for working while drawing welfare benefits. These two
treatments allow us to compare the extent of tax evasion and welfare fraud and their
respective elasticity to income level, audit probability and level of fines.
4

To measure the influence of others’ behavior on tax evasion and welfare dodging and to
compare the impact of “good” and “bad” examples, we have designed two variants of the
previous decision situations. In these treatments with information, before making their
decisions subjects received some information about the behavior of other subjects in past
sessions. More precisely, for each audit probability and each level of fine we provided the
minimum or maximum proportion of subjects in previous experimental sessions choosing the
unregistered income and the minimum or maximum proportion of subjects who decided to
report their income. In half of the sessions, we disseminated the minimum proportions, and in
the other half the maximum proportions. In this way subjects received social information
about the behavior of others that might influence their own behavior regarding tax evasion
and welfare fraud. Subjects were not informed that these values corresponded to extremes.
Importantly, all this information was conveyed in a non-deceptive way (see below for details).
We conducted the experiment in three European countries: Belgium (Flanders and Wallonia),
France and the Netherlands. Flanders and Wallonia in Belgium share the same social and
fiscal institutions but not necessarily the same values and social norms. Languages are the
same in Wallonia and France, and in Flanders and the Netherlands, shaping potential cultural
differences. We are thus able to compare behavior across countries (and within country for
Belgium) when holding both our experimental institutions and information on others’
behavior constant and, thus, contribute to the recent literature on cross-country experimental
studies of tax evasion (Alm et al., 1995; Cummings et al., 2009; Alm and Torgler, 2006;
Gerxhani and Schram, 2006; Torgler and Schneider, 2007; Lewis et al., 2009). Differences in
behavior are observed across countries that can be related to cultural differences.
One main finding is that individuals engage more into welfare dodging than into tax evasion,
independent of the social information conditions. This is surprising as the monetary
5
incentives to cheat were kept constant across treatments. A second important finding is that
many subjects choose an option that allows for tax evasion or welfare fraud but at the end
decide to report their income honestly. A third important and novel result is that tax
compliance is influenced by bad examples but not by good examples, while welfare dodging
is unaffected by social information. Finally, we observe that tax evasion is more frequent in
France and the Netherlands, that Walloons evade taxes less than the Flemish do when no
information is available, but more when they learn about high evasion rates. There is no
cross-country difference in welfare dodging.
The remainder of this paper is organized as follows. Section 2 presents our theoretical model.
Section 3 details the experimental design and the procedures and it derives our predictions.
Section 4 reports the experimental results. Section 5 discusses these results and concludes.
2. THEORY
The basic theoretical structure comes from the Allingham-Sandmo (A-S) model (Allingham
and Sandmo, 1972). The model captures in a stylized way the taxpayer at the moment of
filling in his income tax return: How much of his income should he report and how much
should he evade?
Let W be the gross income of the taxpayer and t be a proportional income tax rate. The
amount evaded, i.e. the amount of underreporting, is E, so that the reported income is W-E. If
tax evasion is not detected, the net income of the taxpayer is accordingly:1
[1] Y = W - t (W - E) = (1 - t) W + tE
1 It should be pointed out that one obviously unrealistic simplification in this model is the assumption that all income is equally unknown to the tax collector. This is clearly not the case; in most countries earnings are reported to the tax authorities by the employer, so that this part of his income cannot in fact be underreported by the employee -unless he acts in collusion with his employer. The analysis should, therefore, be interpreted as applying to that part of his income that the taxpayer can in fact evade without certainty of detection.
6
If, however, it is discovered that the taxpayer has underreported his income, he will pay a
penalty rate, Τ, on the evaded amount, so that his net income in this case is:
[2] Z = (1 - t)W -(Τ - t)E
The taxpayer's subjective probability of detection is p. He chooses the amount evaded so as
to maximize his expected utility, which is:
[3] V = (1 - p)U(Y) + pU(Z)
It is assumed that U is increasing and concave, so that the taxpayer is risk averse. The first-
order condition for an interior solution is:
[4] (1 - p)U'(Y)t - pU'(Z)(Τ - t) = 0
or
[5] U'(Z)/U'(Y) = (1 - p)t/p(Τ - t)
To see the empirical implications of the model one has to implicitly differentiate the first
order conditions with respect to the exogenous variables W, t, Τ and p. It is easily verified
that the signs of the derivatives ∂E/∂Τ and ∂E/∂p are both unambiguously negative; a higher
penalty rate or a higher probability of detection always tends to discourage tax evasion. It
seems reasonable to assume that a higher gross income will increase evasion if one believes
that people become more willing to engage in risky activities as they get richer. This is also
predicted by the model but one has to make the additional and common assumption that the
measure of absolute risk aversion is decreasing. As regards the effect of the regular marginal
tax rate, a notable feature of this model is that an increase of the tax rate has an ambiguous
effect on tax evasion. There is an income effect which is negative; higher taxes make the
taxpayer poorer and, therefore, less willing to take risks. But there is also a substitution effect
7
that works in the direction of increased evasion.
Up to now we have assumed that the individual was holding a self-employed occupation,
which allowed him to conceal part of his earned income. Let us now assume that he has the
choice between being self-employed with utility V*(W, t, T, p), the utility derived from self-
employment when the reported income is chosen optimally, and being salaried with
observable income s and utility U(s(1-t)), where compliance is fully enforced . The individual
will choose the salaried job and thus not to evade if
V*(W, t, T, p) < U(s(1-t)) + ε,
where ε denotes a parameter reflecting a taste for compliance. It has been shown that
heterogeneity among individuals regarding productivity, risk aversion (Pestieau and Possen,
1980), and taste for compliance can explain why some people decide to choose one or the
other occupation. While the discussed models consist of three-stages (occupational choice,
followed by tax report if self-employed and audits and penalties if caught cheating), we
implement a four-stage decision problem consisting of:
1. Occupational choice
2. Random draw of income
3. Possible tax evasion if self-employed
4. Audits and penalties if caught cheating.
This model has the advantage that it is flexible enough to study tax evasion and welfare
dodging in an equivalent way. The only difference is that, in the latter, stage 1, the
occupational choice, is one between salaried income and an income that can be concealed and
thus combined with a welfare benefit at the risk of a heavy penalty.
Above we have introduced a parameter of compliance denoted ε. The higher this parameter,
8
the more likely the “registered” occupation is to be chosen. This parameter can be exogenous,
reflecting ethical or cultural values. It can also be endogenous reflecting some social norm
that rests on aggregate choices. In our experiment there are conditions in which individuals
are given the proportions of those who have chosen the registered occupation and of those
who have chosen the unregistered occupation. In fact they are given either the maximum or
the minimum proportion but which one is not specified. In that state of ignorance we can
assume that the proportion given will be perceived as an average value and that individuals
will be tempted to get as close as possible to that value by conformity or for social learning.
Formally the model assumes that the probability, π, that an individual chooses the registered
occupation depends on the utility differential ∆ =U-V and the proportion of non-evaders he is
informed about, π̂ . We thus write: )πε(π,+φ(Δ)=π ˆ
and for simplicity assume:
2ˆ)πα(πA+φ(Δ)=π −− This latter expression reflects the desire to get as close as the
indicated proportion perceived as the social norm. Both A and α are positive parameters.
We easily check that π is increasing with π̂ , which means that the actual proportion of
individuals choosing the registered occupation is expected to be higher if the minimum rather
than the maximum proportion of evaders is conveyed to the individuals.
3. EXPERIMENTAL DESIGN AND PROCEDURES
3.1. Experimental design
Our experiment is based on a 2x2 design. It consists of two treatments with 30 periods each,
the Tax and the Welfare treatments, played under two conditions, the Information and No-
9
Information conditions. It uses a combined within- and between-subject design.
The treatments
The two treatments have been designed such that they deliver the same predictions under the
assumption of material self-interest and individual rationality. In both treatments people have
to choose their source of income and we manipulate the probability of an audit and the level
of sanctions in case of detected fraud.
The Tax treatment under the No-Information condition has been inspired by Gerxhani and
Schram (2006) and consists of three stages. In the first stage of each period, the subjects
choose their source of income by taking either a registered’ income (a salaried job), the
realization of which will be known to the tax authority for sure, or an ‘unregistered’ income (a
self-employed job) that will only be known with some probability. Thus, the choice of the
source of income informs on the willingness to evade taxes. Each job lasts one period and is
associated with various possible gross incomes. In a salaried job, the gross income can take
the value 200, 300, 450, 550, 650 or 750 points, while in a self-employed job it can take the
value 150, 200, 350, 550, 750 or 850 points. The term “points” refers to the experimental
currency unit. The earned points were converted into cash at the end of the experiment.
In the second stage, after the subjects have made their choice between a salaried job and a
self-employed job, the computer program selects a gross income at random. The salaried
wage is automatically taxed at 25%.2 If the individual has chosen a self-employed job, he has
to make a second choice between reporting or not reporting his income.3 A reported income
is taxed at 25% and no penalty is levied.
2 This aims at capturing the fact that in salaried jobs tax evasion is made impossible by the fact that employers report the wage paid to the employees to the tax authorities. 3 Alternatively, we could have asked the players to choose the amount to be reported. For the sake of simplicity, we only offered a binary choice.
10
In the third stage, an audit can occur with a probability p, with p ∈16
,14
,12
, depending on
the auditing condition. If an unreported income is detected, the gross income is taxed at 25%
and a fine has to be paid. The fine amounts to 25% of the gross self-employment income plus
a fixed amount Ff, with F f ∈ 5 0 , 7 5{ } depending on the fine condition in the respective
period. Before choosing between a salaried job and a self-employed job, the subjects are
informed on the values of p and Ff in the current period. At the end of each period, they are
informed on whether they have been audited and on their net payoff.
The Welfare treatment under the No-Information condition is a variant of the previous
treatment. The subjects have to choose between taking a ‘registered’ income (a salaried job),
the realization of which will be known to the tax authority for sure, or cumulating a welfare
benefit and a job on the black market. The difference with the previous treatment is that the
alternative to the salaried job is always illegal as it is not allowed to cumulate a welfare
benefit with a job on the black market, while only tax evasion in self-employed jobs is
illegal.4 Therefore, the choice of the source of income indicates the willingness to cheat on
the welfare system. The gross income in the salaried job can take the same values as in the
Tax treatment (i.e., 200, 300, 450, 550, 650 or 750 points). By cumulating a welfare benefit
and a job on the black market, the total gross income can take the value 150, 200, 350, 550,
750 or 850 points (which is equivalent to the self-employed-job income in the Tax treatment).
Depending on the period, this includes a welfare benefit of 100 or 150 points, which means
that the possible amounts earned on the black market are systematically 50 points lower when
the welfare benefit is high than when it is low.5 The lost benefits in case of detection
4 In both treatments, we mentioned that any income had to be reported. We did not specify, however, that cumulating a welfare benefit with a job on the black market is illegal but it was made clear from the payoff determination rules. Indeed, detected beneficiaries of a welfare allowance who hold a black market job automatically lose their welfare benefit –see details below.5 We vary the amount of the welfare benefit (that is lost in case of detection of fraudulent behavior) to guarantee
11

correspond to the fines in the Tax treatment and are chosen such that the two treatments are
payoff equivalent when analyzed under the classical assumptions on preferences and
rationality. After the individuals have made their choice, the computer program selects a gross
income at random. The salaried wage is automatically taxed at 25%. If the subject has
chosen to cumulate the welfare benefit and the job on the black market, he has to make a
second choice between reporting or not reporting his black market income. Any reported
income is taxed at 25% and leads to the withdrawal of the welfare benefit.6 If the income on
the black market has not been reported, the probability of an audit p is the same as in the
previous treatment ( p ∈16
,14
,12
). If there is an audit, the welfare benefit is lost, the black
market income is taxed at 25%, and a fine has to be paid that amounts to 25% of the black
market income. Before making their occupation choice, the subjects are informed on the
probability of an audit and on the amount of the welfare benefit in the current period. At the
end of the period, they learn whether they have been audited and their final payoff. Table 1
shows the payoffs associated with each possible situation. From this table the similarity of
payoffs in both treatments is easily seen. In fact, all payoffs are the same in the Tax and
Welfare treatments, except those associated with reporting decisions. This is due to the fact
that cumulating black market income and welfare benefits is illegal while self-employment is
obviously legal. We show in sub-section 3.2 that despite this difference, the classical
predictions are the same in both treatments.
(Table 1 about here)
Two social information conditions
comparability with the two levels of fines in the Tax treatment.6 If the random black market income is equal to 0 and is reported (which is very unlikely), the sanction also applies (the welfare benefit is lost).
12
In the No-Information condition, the subjects do not receive any information on others’
behavior. However, in real settings people may have information about what others do. This
information has potential effects on behavior due to social feedback effects (see Wilson and
Kellig, 1982; Keizer et al., 2008). For this reason, we have implemented two different social
information conditions for both the Tax and Welfare treatments. In the Tax (Welfare)
treatment with social information, before making their occupation decision, the subjects are
informed on the proportions of other subjects who chose the salaried job and the self-
employed job (cumulating black income and welfare benefit), respectively, in previous
sessions for the given audit probability and fixed amount of the fine (welfare benefit).
In addition, after learning their gross income the subjects who chose the self-employed job
(cumulating, resp.) are informed on the proportion of individuals in some previous sessions
who made the same choice, received the same gross income, and chose to report it, and
the proportion of those who, in the same conditions, chose not to report their income. With
this Information condition, we aimed at studying to which extent players were influenced by
others’ behavior. The design is such that we avoid the identification and reflection problems
that impair identification with survey data.
Two variants of this condition have been implemented in each treatment. In some sessions,
we implemented the “Info-Min condition”, in which we displayed the minimum proportion
of subjects choosing the self-employed job (cumulating the welfare benefit and the black
market activity) ever observed in any session played under the No-Information condition in
the Tax (Welfare) treatment. Thereafter, for those who chose self-employment (cumulating
welfare benefit with black market activity), we displayed the minimum proportion of people
choosing to not engage into fraud, i.e. reporting their self-employed income (black market
income). In the opposite, “Info-Max condition”, we displayed the corresponding maximum
13

proportions ever observed in any session played under the No-Information condition. The
subjects were not informed on the fact that we displayed extreme values as they received
exactly the same instructions in the two variants of this condition (see Appendices A and B).7
These two opposite social information conditions allows us to investigate, first, whether there
is any effect of such information and, second, whether the effect on behavior of a high and a
low compliance example is symmetric.8
Pre- and post-experimental questionnaires
While it has been found that the likelihood of tax evasion is associated with a lower degree of
risk aversion (Andreoni et al., 1998; Kirchler, 2007; Torgler, 2007), it is unknown whether
this also holds for welfare fraud and whether risk attitude mediates the influence of social
information on individual fraud behavior. To investigate this, we elicited our participants’
risk attitude at the very beginning of all the sessions, using the Holt and Laury (2002)
procedure (see also Cohen et al., 1987). Subjects made ten successive choices between two
paired lotteries, “option A” and “option B” (see Appendix A). The payoffs for option A are
either €2 or €1.60 and those for the riskier option B are either €3.85 or €0.10. In the first
decision, the high payoff in both options has a probability of one tenth and this probability
increases by steps of one tenth as the number of the decision increases. Risk neutrality should
lead subjects to cross-over from option A to option B at the fifth decision, while risk loving
individuals are expected to switch earlier and risk averse individuals later.
At the end of each session, we recorded individual demographic characteristics and elicited 7 There is no deception since we mention in the instructions “You also receive information on the decisions of participants who in some previous experiments were in the same conditions as you are now. More precisely, before making your decision, you are informed on the proportion of participants who chose the salaried job and the proportion of those who chose the self-employed job in previous experiments for the same audit probability and the same fixed amount of the fine as you.” We also mentioned: “In these previous experiments the rules were the same as in this experiment, except that the participants did not have such information.”8 The two conditions are really comparable since we used similar instructions. Thus, only the proportions indicated can possibly influence behavior. This would not have been possible if we had indicated that these proportions correspond to minimum or maximum values.
14
attitudes towards tax evasion and illegal work and political orientations. A few questions
were taken from the Eurobarometer survey on undeclared work in the European Union
(European Commission, 2007).9 We also included questions on tax morale taken from the
Taxpayer Opinion Survey (United States Department of the Treasury, 1987).10 Our aim was
to relate our subjects’ self-expressed tax morale and political orientations with their actual
behavior in our experiment. Finally, to test the cognitive abilities of our subjects we added
three questions from the Cognitive Reflection Test by Frederick (2005).
3.2. Predictions
Consider first the Tax treatment. The expected gross earnings amount to 483.33 points (S.D.
= 208.97; min = 200; max = 750) in the salaried job and to 475 points (S.D. = 289.40; min =
150; max = 850) in the self-employed job. Indeed, if incomes are reported, the expected net
earnings amount to 362.5 in the salaried job and to 356.25 in the self-employed job.
Therefore, it is clear that for a risk neutral individual, the choice of the self-employed job in
our environment should be only motivated by envisaged tax evasion. When Ff = 50, the
expected net earnings from not reporting are 427.08 points for p = 1/6, 403.13 for p = 1/4,
and 331.25 for p = 1/2. When Ff = 75, the corresponding expected net earnings from not
reporting are 422.92, 396.88 and 318.75 points. This indicates that a risk neutral player
should choose the self-employed job when the probability of an audit is lower than ½ and the
salaried job otherwise. The fixed amount of the fine should not affect this choice.11 Using
the utility function and parameters as calculated in Holt and Laury (2002), we can show that
an average risk averse player will instead choose the salaried job for p = ½ and p = ¼, but
9 In particular, we asked the subjects to which extent they find a series of behaviors related to fraud acceptable or not using a ten-point Likert-type scale.10 Subjects had to rate on a scale from 1 to 6 their feelings regarding the degree of acceptability of statements regarding tax fraud.11 These predictions hold for any income level, so learning one’s own actual income should not change the decision to report or not to report it. However, for the minimum gross income of 150 points, Ff = 75 and p = ¼, the subjects should be indifferent between reporting it or not as the expected earnings are 112.50 in both cases.
15
will choose either the salaried job or the self-employed job when p = 1/6 depending on his
degree of risk aversion. In contrast, a risk seeking individual will choose the self-employed
job for p = 1/6 and p = ¼, but will choose the salaried or the self-employed job when p = ½
depending on his degree of risk seeking. The value of Ff does not affect these decisions.
Consider now the Welfare treatment. This treatment has been designed such that the expected
net earnings when the welfare benefit amounts to 100 (150, respectively) are the same as in
the Tax treatment when the fixed amount of the fine is 50 (75, respectively). Therefore, this
treatment delivers the same rational choice predictions. The expected gross earnings also
amount to 483.33 points (S.D. = 208.97; min = 200; max = 750) in the salaried job and to 475
points (S.D. = 289.40; min = 150; max = 850) when cumulating a welfare benefit and a job in
the black market. If incomes are reported, the expected net earnings amount to 362.5 in the
salaried job and to 281.25 (243.75, respectively) when the welfare benefit is 100 (150,
respectively). When the welfare benefit equals 100 (as when Ff = 50 in the other treatment),
the expected net earnings from not reporting are 427.08 points for p = 1/6, 403.13 for p = 1/4,
and 331.25 for p = 1/2. When it equals 150 (as when Ff = 75), the corresponding expected net
earnings from not reporting are 422.92, 396.88 and 318.75 points. Therefore, a risk neutral
subject should cumulate the welfare benefit and a job on the black market when the
probability of an audit is lower than ½ and the salaried job otherwise. The predictions for
risk-seeking individuals are also the same as in the Tax treatment. Although the two
treatments deliver the same predictions, it should be noted, however, that the expected
earnings derived from reporting a self-employed job are higher than those derived from
reporting an activity on the black market (true for any income level). This is due to the fact
that reporting such an activity in the underground economy leads to the immediate withdrawal
of the welfare benefit. Note, however, that such reporting behavior can never be
16

optimal.These predictions are in line with the theoretical model of Section 2 where a higher
penalty rate or a higher probability of detection tends to discourage evasion. From this
perspective people should make the same decisions in both treatments and conditions and
there should be no difference across countries. However, individuals may have a taste for tax
compliance reflecting ethical or cultural values (ε in our model). Tax evasion may be more or
less morally questionable than welfare dodging and depending on the institutions, behavior
may differ across countries (see Alm and Torgler, 2006; Schneider, 2004; Halla and
Schneider, 2009). Moreover, being informed on the behavior of others in previous sessions
may affect individual decisions. Our model predicts that there should be more fraud in the
Info-Max condition and less in the Info-Min condition compared with the No-Information
condition.
3.3. Procedures
Our experiment was conducted in three countries and four different locations: at the
Behavioral & Experimental Economics Laboratory (BEElab) at Maastricht University (The
Netherlands), at the Catholic University of Leuven (Belgium, Flanders), at the Groupe
d’Analyse et de Théorie Economique (GATE-CNRS) in Lyon (France), and at the University
of Liège (Belgium, Wallonia).12 This was not made common information to the subjects. The
experiment was computerized using the REGATE-NG software developed at GATE
(Zeiliger, 2000). Students were recruited from undergraduate classes in economics and
business only, by means of the ORSEE software (Greiner, 2004). Only Dutch students
participated in the Maastricht sessions, Flemish students in the Leuven sessions, Walloon
students in the Liège sessions and French students in Lyon. In total, 513 people (48.73% of
whom were females) took part in 35 sessions. There were 257 subjects in the 17 sessions of
12 In Lyon and Maastricht, we could use experimental labs. In Leuven and Liège, we used large lecture halls and a mobile lab, with enough space between participants to ensure the anonymity of decisions.
17
the Tax treatment (50.19% of whom were females) and 256 in the 18 sessions of the Welfare
treatment (47.27% of whom were females). The detail of these sessions is given in Table 2.
In order to facilitate comprehension and to make sure that people understood that not
reporting one’s income means cheating on taxes, the instructions were phrased in non-neutral
terms (see Appendices A and B).13 These instructions and the text of the screenshots have
been written first in English language. Then, native speakers translated them into Dutch and
French. A reverse translation to English has then been done and adjustments were made in
each language to maximize the comparability between the French and Dutch instructions.
The instructions in Dutch were used in Leuven and Maastricht; those in French were used in
Liège and Lyon. With the help of local assistants, the same bilingual experimenter conducted
all of the sessions in the three countries to avoid experimenter effects across countries.
(Table 2 about here)
We used the same random sequence of audit probability, fixed amount of fine, welfare
benefit, and gross income in the four locations. To determine the values to be displayed in the
Info-Min and the Info-Max conditions, we ran first all sessions with the No-Information
condition. Then, by comparing these sessions, we identified for each audit probability and
each value of the fixed fine and welfare benefit the minimum and the maximum observed
proportions of participants choosing the self-employed job or cumulating the welfare benefit
and the black market job. Similarly, we determined the minimum and maximum proportions
of individuals reporting and not reporting their income for each level of gross income.
Upon arrival, each subject was assigned a computer randomly. The instructions for the first
part (i.e. risk preference elicitation) were distributed and read aloud by the experimenter.
After having their questions answered in private, subjects made their ten lottery choices. No
13 We used notions like income, tax, welfare benefit, black market job, audit, and fine. The instructions did not include any loaded terms such as fraud, cheating, or evasion.
18

feedback was given on the outcomes of this part before the end of the session. After all the
subjects completed this part, we distributed and read aloud the instructions for the next part
(the Tax or Welfare treatment). A comprehension questionnaire was administered to check
that the rules were well understood. All questions were answered in private. Once the 30
periods of this part were completed, the screens displayed the post-experimental
questionnaire. Then, at the end of the session, subjects were paid their earnings in a separate
room and in private. In the payment room, we first played the lottery of the first part. Each
subject rolled a ten-sided die to determine which decision number would be played for real.
For the selected decision, the subject rolled the die gain for determining the payoff in the
lottery chosen in the lottery task.
In each treatment, there was a conversion rate of 100 experimental points to €3. Two of the
30 periods were randomly drawn for payment at the end of the session. Average earnings
were €16.86 (standard deviation = 4.72), including a €3 show-up fee. A session lasted on
average 54 minutes excluding payment.
4. RESULTS
First, we give an overview of the choices of tax evasion and welfare dodging by country and
information condition. This descriptive analysis is followed by a regression analysis of the
determinants of fraudulent behavior in each treatment and condition.
4.1. Descriptive analysis
Table 3 displays the average percentage of individuals who chose one or another occupation
as well as the percentage of evaders (related to the total number of subjects by treatment
and/or condition) in both treatments. In the welfare treatment, we report both those who
19

decide to cumulate a black market job and the welfare benefit and those who cumulate and do
not report their income on the black market. Table 3 displays both measures.
(Table 3 about here)
Table 3 indicates that the percentage of evaders (stricto sensu –related to those who did not
chose the registered income- or not) is higher in the Welfare than in the Tax treatment
although they should be similar theoretically. This is true in almost all information
conditions. Indeed, Mann-Whitney tests (M-W thereafter), considering conservatively each
individual as one unit of observation and holding the stricto sensu definition of evasion,
indicate that the difference between treatments is significant when all data are pooled (p =
0.002), in the No-Information condition (p = 0.058), in the Info-Min condition (p = 0.064),
but not in the Info-Max condition (p = 0.139).14 When data are pooled, the difference in the
percentage of evaders between the Tax and Welfare treatments is significant in Flanders (p =
0.046) and Wallonia (p = 0.008), but not in France (p = 0.277) or the Netherlands (p = 0.544).
Regarding the Tax treatment, Table 3 shows that the percentage of individuals who choose
the self-employed job is higher in France and the Netherlands than in the Belgian regions, but
pair-wise tests indicate that only Wallonia and the Netherlands differ significantly (M-W, p =
0.027 when all data are pooled and p = 0.040 for the sole No-Information condition)15.
Looking at the proportion of evaders, Wallonia has the lowest proportion closely followed by
Flanders. The difference is significant between Wallonia and France (M-W, p = 0.066 when
all data are pooled, and p = 0.015 for the No-Information condition) and between Wallonia
and the Netherlands (M-W, p = 0.021 and p = 0.005, respectively). But there is no difference
between the two Belgian regions.
14 If we accept the broader definition of evasion, the p-values are respectively <0.001, <0.001, 0.023, and 0.008.15 The difference between Wallonia and the Netherlands is no more significant when we correct p-values for multiple testing.
20
Interestingly, we also observe that while 60.64 % of the subjects choose an occupation that
allows for tax evasion, 32.96% of them report their income anyway, which is not in line with
the theoretical predictions for risk-neutral individuals. This behavior could be attributed to
mental accounting, assigning different statuses to the two sources of money (income and
evaded taxes), to isolation if subjects valuate separately each of the two stages of the decision
process, or to excess optimism if subjects choose self-employment not because it offers the
perspective of tax evasion but in the hope of receiving the maximum possible income (i.e.
637.5 with the self-employed job and 562.5 with the registered job). In the Welfare
treatment, the percentage of those cumulating a welfare benefit and an unreported job is
similar across countries as well as the percentage of subjects who do not report their black
market income (M-W, p>0.30 in all pair-wise comparisons).
According to Table 3, the introduction of social information concerning choices in previous
experiments does not influence behavior symmetrically in the Tax and the Welfare
treatments. In the Tax treatment, the percentage of participants who choose the self-
employed job is significantly higher in the Info-Max condition than in the No-Information
condition (M-W, p = 0.065 for all the countries pooled together, and p = 0.004 for Wallonia)
and than in the Info-Min condition (M-W, p = 0.052 and p = 0.007 for Wallonia). There is no
difference between the No-Information and the Info-Min conditions (M-W, p = 0.807). There
is no significant difference either in the percentage of evaders between conditions, except for
Wallonia (M-W, p = 0.008). Regarding the Welfare treatment, the dissemination of
examples does not modify compliance (M-W, p>0.10). This is also true at the country level.
Finally, Figure 1 displays the relative frequency of evaders (stricto sensu) by treatment,
country and audit probability.
(Figure 1 about here)
21
The theoretical predictions are that a risk-neutral subject should not evade when the audit
probability is 50% and should not comply for lower audit probabilities. The observed
behavior deviates significantly from this prediction, showing evidence of risk seeking
behavior when the probability of an audit is high and risk-averse behavior when the
probability is low or medium, which is consistent with Prospect theory.16
4.2. The determinants of tax evasion and welfare dodging
We analyze the determinants of fraudulent behavior first by pooling together the data from
the Tax and the Welfare treatments and then by considering each type of fraud separately.
First, we estimate the probability of tax and welfare fraud by means of a Probit model with
robust standard errors and clustering at the individual level to control for the fact that each
subject makes 30 decisions. The dependent binary variable indicates whether the subject has
or has not concealed his income. The first set of independent variables includes dummy
variables for the Tax treatment, the Info-Min and the Info-Max conditions (with the No-
Information condition as the reference), each audit probability (with the probability 1/6 as the
reference), and the high fixed fine in case of detected fraud. The second set of independent
variables includes dummies for each country or region (with Wallonia as the reference
category).
The third set of independent variables consists of time-invariant individual characteristics.
More specifically, this includes gender, age, cognitive performance (measured by the number
of correct answers in the Cognitive Reflection Test), and the parents’ relative income category
(between 1 if the subject believes his parents’ income is among the lowest 10% compared to
that of the other students of his school and 10 if he believes it is among the highest 10%). We
16 The probability of evasion is significantly different from 0 when the audit probability is .5 both in the Tax treatment (t-tests with each individual as a unit of observation, p < 0.001) and in the Welfare treatment (p < 0.001). This probability is systematically different from 100 for the other audit probabilities (p < 0.001).
22
control for risk attitude both with the safety index given by the number of safe choices in the
Holt and Laury lottery and with the self-reported risk attitude variable for which a low value
indicates, in contrast, higher risk aversion. We also control for the individual’s opinions on
tax morale and undeclared work by considering the degree of acceptability of four statements
in the post-experimental questionnaire:
- Almost every taxpayer would cheat to some extent if s/he thought s/he could get away with it (labelled “Cheat if get away” hereafter)
- Being paid in cash for a job and then not reporting it on your tax form (labelled “Pay in cash” hereafter)
- Someone evades taxes by not or only partially declaring income (labelled “Tax evasion” hereafter)
- Someone receives welfare payments without being legally entitled (labelled “Social fraud” hereafter)17
We also include one binary measure of political opinion related to progressive tax policies
(labelled “Rich pay too much taxes”).18 Finally, we include a time trend to control for a
possible learning effect over time.
The same model is estimated on pooled data and on each condition separately. Table 4
displays the results of these regressions.
(Table 4 about here)
Table 4 indicates that individuals evade significantly less in the Tax treatment than in the
Welfare treatment although both give the same theoretical predictions. The marginal effect of
this treatment is -6% when data are pooled. Indeed, in the Tax treatment some individuals
choose the self-employment job but decide not to evade taxes, possibly due to mental
accounting, isolation, or the hope of getting the highest possible income and reporting it,. In
17 The first two statements are taken out from the TOS survey and are rated on a scale from 1 (perfectly acceptable) to 6 (perfectly unacceptable). The last two statements are taken out from the Eurobarometer and are rated in the opposite direction from 1 (absolutely unacceptable) to 10 (absolutely acceptable). 18 This variable is coded 1 if the subject has agreed or strongly agreed with the following statement: “The rich have to pay too much taxes”, and 0 otherwise.
23
the Welfare treatment reporting an illegal activity is always sanctioned; therefore it is
probably more salient than in the Tax treatment that not taking the salaried job but reporting
one’s income in the second stage leads to lower payoffs.
Interestingly, we find a small (3.16%) but significant positive effect of the Info-Max
condition on evasion (p = 0.079). This indicates that controlling for individual characteristics
and the deterrence policy, observing examples of relatively low compliance levels motivates
some individuals to evade more, while observing examples of high compliance does not
discourage fraud. At the aggregate level, the likelihood of evasion is similar across countries
except for the French participants who evade more and get closer to the theoretical predictions
than the participants from the other countries. When no information is available, the
Wallonian participants evade significantly less than the participants in any other country; but
in the Info-Max condition, Wallonians evade as much as the French participants, and
significantly more than the Flemish and the Dutch participants. In contrast, when the Info-
Min condition prevails, there are no cross-country differences.
The other results are standard. Compared with an audit probability of 1/6, an audit
probability of ¼ reduces the likelihood of evading by 23.50% and a probability of ½ reduces
it by 64.90% when all conditions are considered. The high fine also decreases evasion. The
negative impact of audits and fines is consistent with previous experiments and with evidence
based on survey data (Friedland et al., 1978; Dubin et al.,1990; Slemrod et al., 2001). As
regards individual characteristics, in accordance with the previous experimental literature,
males evade more than females (Spicer and Becker 1980, Baldry 1986). Elicited or self-
reported risk attitudes consistently indicate that more risk averse players are less likely to
evade. The self-reported risk attitude influences the evasion decision to the same extent in the
three conditions. In contrast, the impact of the risk attitude as measured by the Holt and
24
Laury (2002)’s procedure differs across information conditions although the risk associated
with the fraud decision is the same. This effect is hardly significant when no information is
available, while switching lotteries one decision later (= being more risk averse) decreases the
likelihood of evasion by 3.6% in the Info-Max condition and by 4.7% in the Info-Min
condition. Interestingly, the cognitive performance is associated with a higher probability to
evade, which makes sense since the rational behavior in this experiment is to evade provided
the audit probability is lower than 50%. This effect is mainly driven by the Info-Max
condition. The individuals who report a higher acceptability of tax evasion are more likely to
evade, but this result may be interpreted as self-justification.
In the following, we analyze the determinants of fraudulent behavior in each treatment. The
results are presented in Table 5. To supplement the previous analysis in which we do not
control for possible sample selection, we estimate here a two-step Probit model with sample
selection as the choice to evade income is conditional on the choice of the occupation. Thus,
we first estimate the determinants of the occupational choice by means of a Probit model (Eq.
1 and 3). We then explain the decision to evade, conditional on that decision, with another
Probit model (Eq. 2 and 4). In all the estimations we calculate robust standard errors and we
cluster the observations at the individual level. Equations 1 and 2 refer to the Tax treatment
and equations 3 and 4 to the Welfare treatment. Since the two treatments are symmetric, the
specifications are the same. The independent variables are the same as in Table 4, except that
we include in the conditional equations the gross income divided by 100. This is reasonable
because participants are informed on their actual income after they have made their
occupational choice but before they decide to report on not their income.
(Table 5 about here)
Table 5 indicates that the Info-Max condition exerts a significant and positive impact only on
25

the decision to choose self-employment in the Tax treatment. Its marginal effect is 6.35%.
Estimation (1) shows that France and the Netherlands have a higher probability to choose
self-employment compared to Wallonia, with no difference within Belgium. Conditional on
this decision, the French subjects are also more likely to evade than the other subjects
(Estimation (2)). A higher cognitive performance leads to a more likely choice of self-
employment, which is consistent with the fact that better cognitive abilities should help
finding the optimal choice. More risk-averse participants are less likely to choose self-
employment and, conditional on this choice, to evade. Males and females choose self-
employment with the same likelihood but males tend to evade more in the second stage (only
significant at the 10.3% level). Regarding opinions, the subjects who find tax evasion a more
acceptable behavior or think “the rich pay too much taxes” are also more likely to choose the
self-employed job. Conditional on this choice, individuals who receive a higher experimental
income are more likely to evade taxes, as well as those whose parents are relatively wealthier.
Regarding the Welfare treatment, estimation (3) shows that the choice of cumulating a black
market job and a welfare benefit reacts mainly to the audit probability, the level of the fine,
and risk attitudes. We do not find any influence of the information condition, country,
opinions or cognitive performance. The same is observed in estimation (4), except that males
are more likely to evade in the second stage of the experiment, as well as those who think that
“being paid in cash for a job and then not reporting it on the tax form” is more acceptable.
5. CONCLUSION
Research on the informal sector in general and tax evasion or welfare dodging in particular is
an important enterprise. Unfortunately, it is notoriously difficult to obtain reliable evidence on
these behaviors from the field. For that reason, we have designed a laboratory experiment in
26
which subjects can choose between a registered and an unregistered source of income like in
Gerxhani and Schram (2006). Importantly, we extended their analysis by including welfare
dodging and exploring the potential effect of social information regarding others’ behavior.
Our objectives in this study were mainly (i) to compare decisions regarding tax evasion and
welfare dodging in a framework that delivers the same predictions under classical
assumptions; (ii) to analyze whether each of these decisions are influenced by social
information about others’ behavior and if this influence, if any, is symmetric when
information conveys examples of high compliance or examples of low compliance; (iii) to
compare tax evasion and welfare dodging in various countries of the Euro zone for which
conventional beliefs predict differences in behavior. Our findings are that welfare dodging is
more frequent than tax evasion. In light of the identical theoretical predictions this is
surprising. A reason for this result may be that a fraction of the participants who chose the
self-employed job instead of the automatically reported salaried job in the first stage do not
always evade taxes in the second stage. In contrast, most of those who choose to cumulate a
black market job and the welfare benefit instead of choosing the automatically reported
salaried job have clearly no reason to report their income, because this report is punished with
certainty by the withdrawal of the welfare benefit. Therefore, the net incomes in case of
reported non-salaried activity are lower in the Welfare treatment than in the Tax treatment.
Therefore if the individuals do not base their decision on the expected profits of evasion but
on the absolute difference between the net income in case they report and the net income in
case they do not, this could explain the observed higher frequency of fraud in the Welfare
treatment than in the Tax treatment. Alternatively, the fact that some subjects choose the self-
employed job but report their income anyway could be attributed to mental accounting or to
isolation if subjects consider separately each of the two stages of the decision process. These
27
behavioral explanations, however, cannot explain the difference between the two treatments.
Finally, another possible explanation of the higher fraud in the Welfare treatment is that
welfare dodging is considered as morally more acceptable than tax evasion. Further studies
would be required to better understand the ultimate motivations driving this result.
We did not find cross-country differences in welfare dodging, while tax evasion is more
frequent in France and the Netherlands than in the Belgian regions; in the latter country,
Walloons evade taxes less than the Flemish do when no information is available, but more
when they learn about high evasion rates.
Indeed, another main finding is that there is a significant effect of social information about
others’ behavior on the individual decision to engage in tax evasion, but not in welfare fraud.
In the Tax treatment the effect is asymmetric as “bad” examples of low compliance
significantly increase tax evasion while disseminating “good” examples of high levels of
compliance does not influence evasion decisions at all. This asymmetric effect is a novel
result. The negative effect of bad examples on tax compliance is consistent with the so-called
“broken windows” theory according to which individuals feel less committed to honesty if
they can observe that others do not comply. In our experiment the effect is strongest for the
sub-population of subjects characterized by a lower level of evasion when no information
about others was available (namely, the Walloon sub-sample of participants). This
asymmetric effect suggests that in this environment social information tends to support less
conformity than social learning by reducing the moral cost of tax evasion. A pure conformity
effect should have increased average compliance when information on the highest compliance
was disseminated. This interpretation should be further explored. Our results also suggest
that, from a policy perspective, it is better not to reveal information on tax compliance
behavior. One can wonder whether informing on detection would have a different impact.
28
Acknowledgements: The authors are grateful to Sylvain Ferriol for programming the experiment. They wish to thank Frederic De Wispelaer, Jozef Pacolet and Sergio Perelman for their help in the implementation of the experiments. Financial support from Belgian Science Policy (SUBLEC AG/JJ/137) and from the Belgium’s French Community (ARC 05/10-332) is gratefully acknowledged.
ReferencesAllingham, M., A. Sandmo, 1972. “Income Tax Evasion: A Theoretical Analysis”, Journal of
Public Economics 1(3-4), 323-338.
Alm, J., 1991. “A Perspective on the Experimental Analysis of Taxpayer Reporting”, The Accounting Review 66, 577-593.
Alm, J., G.H. McClelland, and W.D. Schulze, 1992. “Why do people pay taxes?”, Journal of Public Economics 48, 21-48.
Alm, J., Sanchez, I., de Juan, A., 1995. “Economic and non-economic factors in tax compliance”, Kyklos, 48, 3-18.
Alm, J., and B. Torgler, 2006. “Culture differences and tax morale in the United States and in Europe”, Journal of Economic Psychology 27, 224-246.
Anderhub, V., S. Giese, W. Guth, A. Hoffmann and T. Otto, 2001. “Tax Evasion with Earned Income – An Experimental Study”, FinanzArchiv 58(2), 188-212
Andreoni, J., B. Erard, and J. Feinstein, 1998. “Tax Compliance”, Journal of Economic Literature 36, 818-860.
Baldry, J.C., 1986. “Tax evasion is not a gamble”, Economics Letters 22, 333-335.
Bernasconi, M., and A. Zanardi, 2004. “Tax evasion, tax rates, and reference dependence”, FinanzArchiv: Public Finance Analysis 60(3), 422-445.
Brock, W.A., Durlauf, S.N., 2001. Interactions-Based Models, in J. Heckman and E.Leamer, eds., Handbook of Econometrics 5, Elsevier Science B.V., 3297-380.
Cohen, M., J-Y. Jaffray and T. Said, 1987. “Experimental Comparison of Individual Behavior under Risk and under Uncertainty for Gains and Losses”, Organizational Behavior and Human Decision Processes, 39, 1-22.
Coricelli, G., M. Joffily, C. Montmarquette and M.C. Villeval, 2010. “Cheating, Emotions and Rationality: An Experiment on Tax Evasion”, Experimental Economics 13, 226-247.
Cowell, F., 1990. Cheating the Government: The Economics of Evasion. Cambridge, MA: MIT Press.
29

Cummings, R.G., J. Martinez-Vazquez, M. McKee, and B. Torgler, 2009. “Tax morale affects tax compliance: Evidence from surveys and artefactual field experiments”, Journal of Economic Behavior and Organization 70(3), 447-457.
Dohmen, T., A. Falk, D. Huffman, U. Sunde, J. Schupp, and G. G. Wagner, 2010. “Individual Risk Attitudes: Measurement, Determinants and Behavioral Consequences”, Forthcoming in Journal of the European Economic Association.
Dubin, J.A., Graetz, M.J., Wilde, L.L., 1990. “The Effect of Audit Rates on the Federal Individual Income Tax, 1977-1986”, National Tax Journal 43(4), 395-409.
European Commission, 2007. Eurobarometer Survey on Undeclared Work in the European Union, 284, Luxemburg.
Fortin, B., G. Lacroix, and M.C. Villeval, 2007. “Tax Evasion and Social Interactions”, Journal of Public Economics 91, 11-12, 2089-2112.
Frederick, S., 2005. “Cognitive reflection and decision making”, Journal of Economic Perspectives, 19(4), 25-42.
Friedland, N., Maital, S., Rutenberg, A., 1978. “A Simulation Study of Income Tax Evasion”, Journal of Public Economics 10, 107-116.
Gerxhani, K. and A. Schram, 2006. “Tax evasion and income source: A comparative experimental study", Journal of Economic Psychology 27(3), 402-422.
Greiner, B., 2004. An Online Recruitment System for Economic Experiments. In: K. Kremer, V. Macho, Eds, Forschung und wissenschaftliches Rechnen 2003. GWDG Bericht 63; Göttingen: Ges. für Wiss. Datenverarbeitung; 2004. p. 79-93.
Halla, M. and F.G. Schneider, 2009. Taxes and Benefits: Two Distinct Options to Cheat on the State? Research paper, IZA.
Holt, C. A., and S. K. Laury, 2002. “Risk Aversion and Incentive Effects", American Economic Review 92(5), 1644-1655.
Keizer, K., S. Lindenberg, and L. Steg, 2008. “The Spreading of Disorder”, Science 322, 1681-1685.
Kirchler, E., 2007. The Economic Psychology of Tax Behaviour. Cambridge: Cambrigde University Press.
Lewis, A., S. Carrera, J. Cullis, and P. Jones, 2009. “Individual, cognitive and cultural differences in tax compliance: UK and Italy compared”, Journal of Economic Psychology 30(3), 431-445.
Manski, C.F., 1993. Identification of Endogenous Social Effects: The Reflection Problem.Review of Economic Studies 60(3), 531-42.
Myles, G.D. and R.A. Naylor, 1996. “A Model of Tax Evasion with Group Conformity and Social Customs”, European Journal of Political Economy 12(1), 49-66.
Schneider, F., and D.H. Enste, 2002. The shadow economy – An international survey. Cambridge: Cambridge University Press.
Schneider, F., 2004. “Shadow Economies of 145 Countries all over the World: Estimation Results over the Period 1999 to 2003,” IZA Discussion Paper n° 1431, Bonn.
30
Slemrod, J., 2007. “Cheating Ourselves: The Economics of Tax Evasion”, Journal of Economic Perspectives 21(1), 25-48.
Slemrod, J.B., Blumenthal, M., Christian, C., 2001. “Taxpayer response to an increased probability of audit: evidence from a controlled experiment in Minnesota”, Journal of Public Economics 79, 455-483.
Torgler, B., 2007. Tax Compliance and Tax Morale. A Theoretical and Empirical Analysis. Cheltenham: Edward Elgar.
Torgler, B. and F. Schneider, 2007. “What Shapes Attitudes Toward Paying Taxes? Evidence from Multicultural European Countries”, Social Science Quarterly 88 , 443-470.
United States Department of the Treasury, 1987. Taxpayer Opinion Survey. Internal Revenue Service, ICPSR 8927.
Webley, P., H. Robben, H. Elffers, and D. Hessing, Eds., 1991. Tax evasion: An experimental approach. Cambridge: Cambridge University Press.
Wilson, J.Q. and G.L. Kelling, 1982. “Broken Windows: The Police and Neighborhood Safety”, Atlantic Monthly 249, 29-38.
Yitzhaki, S., 1974. “A note on 'Income Tax Evasion: A Theoretical Analysis', ” Journal of Public Economics 3(2), 201-202.
Zeiliger, R., 2000. “A Presentation of Regate”, Internet-Based Software for ExperimentalEconomics,http://www.gate.cnrs.fr/~zeiliger/regate/RegateIntro.ppt. Lyon: GATE.
31
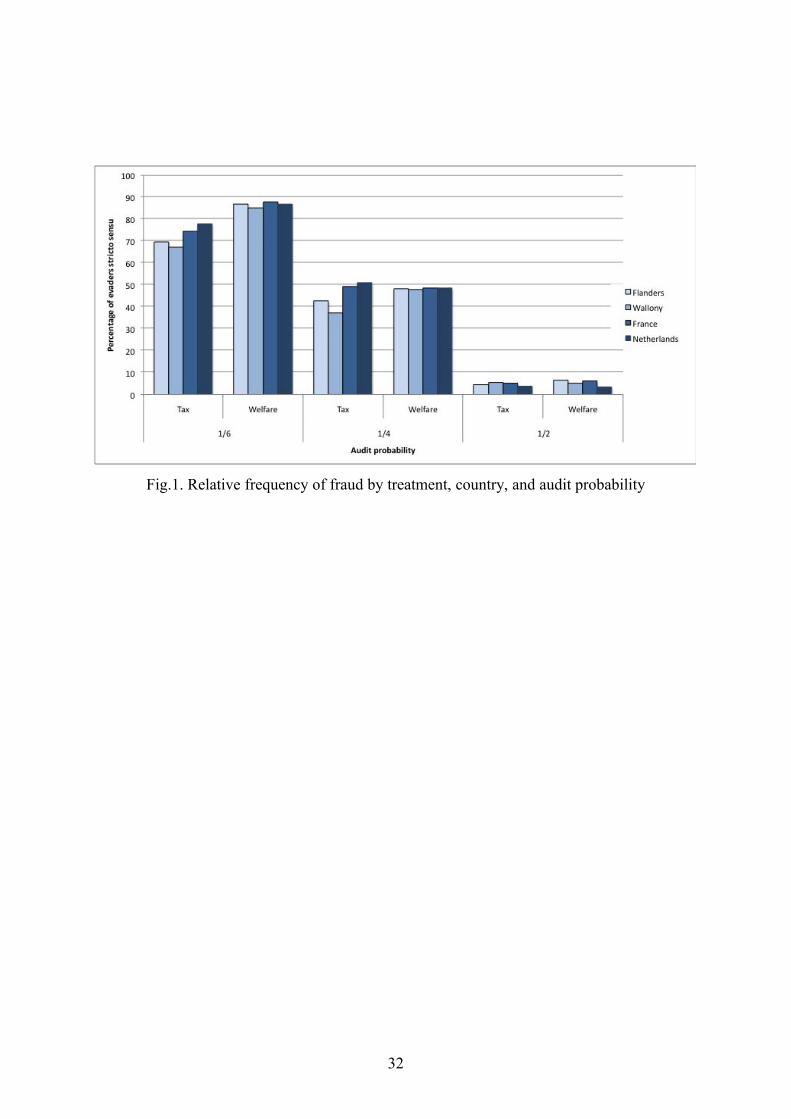
Fig.1. Relative frequency of fraud by treatment, country, and audit probability
32
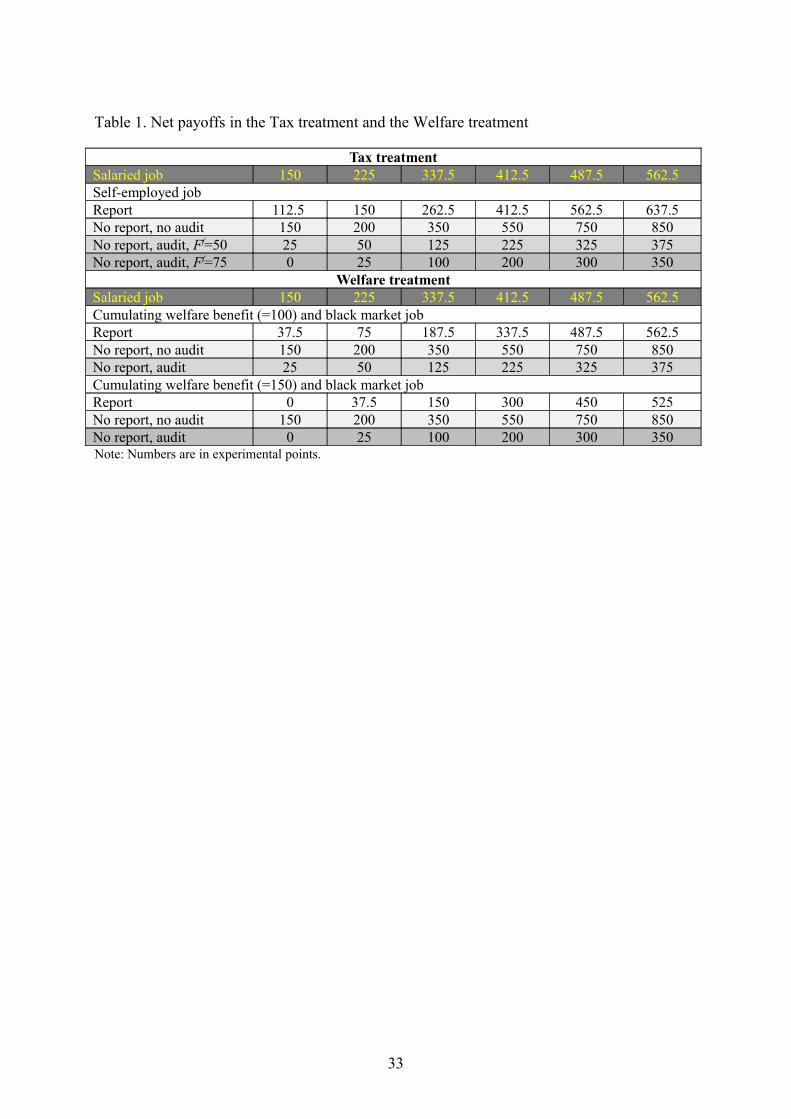
Table 1. Net payoffs in the Tax treatment and the Welfare treatment
Tax treatmentSalaried job 150 225 337.5 412.5 487.5 562.5Self-employed jobReport 112.5 150 262.5 412.5 562.5 637.5No report, no audit 150 200 350 550 750 850No report, audit, Ff=50 25 50 125 225 325 375No report, audit, Ff=75 0 25 100 200 300 350
Welfare treatmentSalaried job 150 225 337.5 412.5 487.5 562.5Cumulating welfare benefit (=100) and black market jobReport 37.5 75 187.5 337.5 487.5 562.5No report, no audit 150 200 350 550 750 850No report, audit 25 50 125 225 325 375Cumulating welfare benefit (=150) and black market jobReport 0 37.5 150 300 450 525No report, no audit 150 200 350 550 750 850No report, audit 0 25 100 200 300 350Note: Numbers are in experimental points.
33
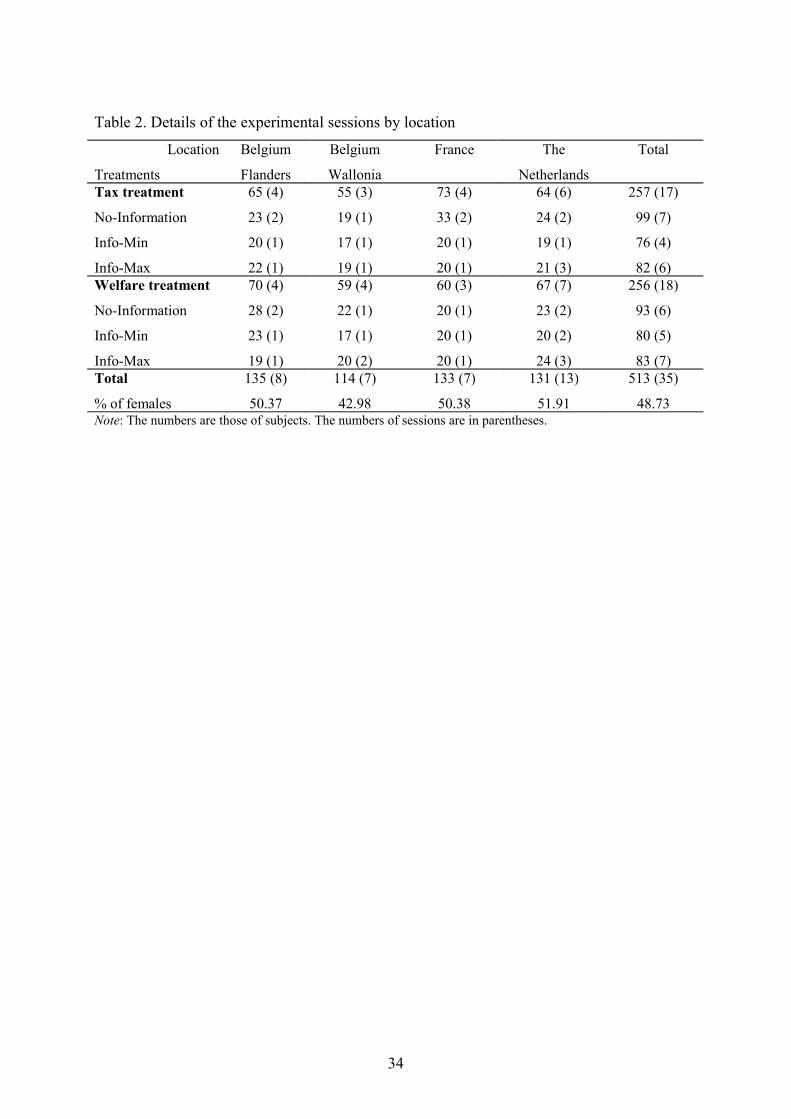
Table 2. Details of the experimental sessions by location
Location
Treatments
Belgium
Flanders
Belgium
Wallonia
France The
Netherlands
Total
Tax treatment
No-Information
Info-Min
Info-Max
65 (4)
23 (2)
20 (1)
22 (1)
55 (3)
19 (1)
17 (1)
19 (1)
73 (4)
33 (2)
20 (1)
20 (1)
64 (6)
24 (2)
19 (1)
21 (3)
257 (17)
99 (7)
76 (4)
82 (6)Welfare treatment
No-Information
Info-Min
Info-Max
70 (4)
28 (2)
23 (1)
19 (1)
59 (4)
22 (1)
17 (1)
20 (2)
60 (3)
20 (1)
20 (1)
20 (1)
67 (7)
23 (2)
20 (2)
24 (3)
256 (18)
93 (6)
80 (5)
83 (7)Total
% of females
135 (8)
50.37
114 (7)
42.98
133 (7)
50.38
131 (13)
51.91
513 (35)
48.73Note: The numbers are those of subjects. The numbers of sessions are in parentheses.
34
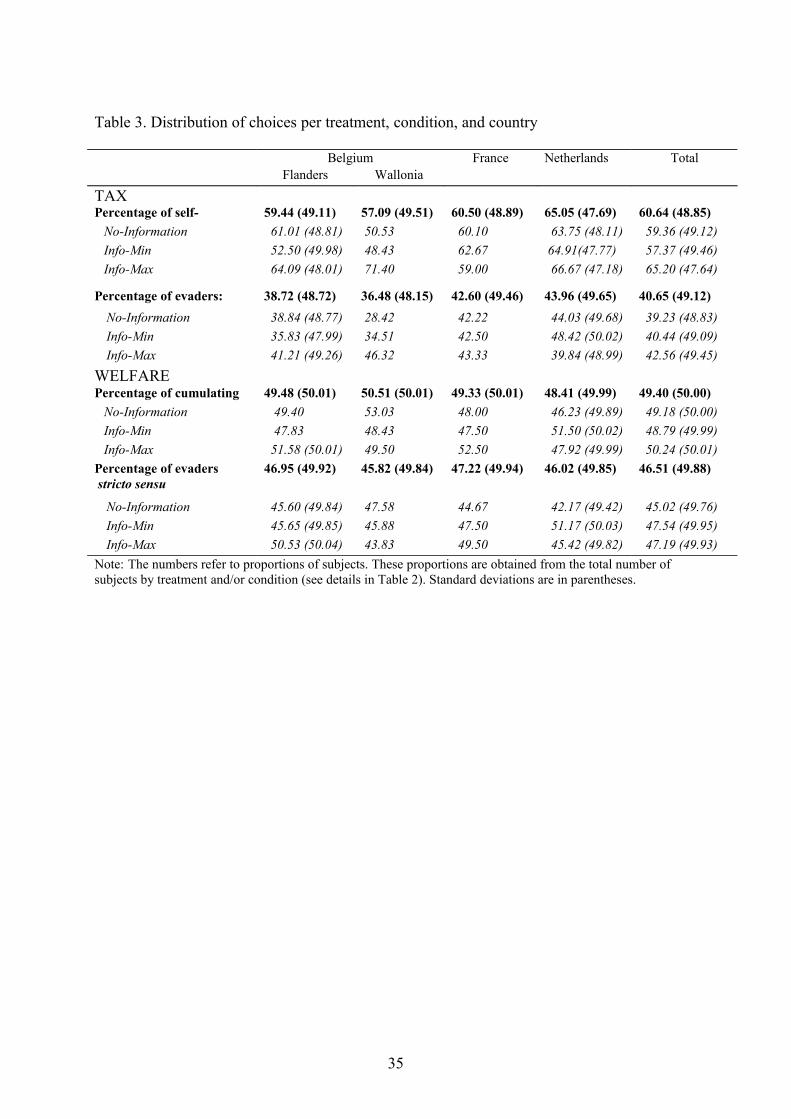
Table 3. Distribution of choices per treatment, condition, and country
Belgium France Netherlands TotalFlanders Wallonia
TAXPercentage of self-
employed
59.44 (49.11) 57.09 (49.51) 60.50 (48.89) 65.05 (47.69) 60.64 (48.85)No-Information 61.01 (48.81) 50.53
(50.04)
60.10
(48.99)
63.75 (48.11) 59.36 (49.12)Info-Min 52.50 (49.98) 48.43
(50.02)
62.67
(48.41)
64.91(47.77) 57.37 (49.46)Info-Max 64.09 (48.01) 71.40
(45.23)
59.00
(49.22)
66.67 (47.18) 65.20 (47.64)
Percentage of evaders: 38.72 (48.72) 36.48 (48.15) 42.60 (49.46) 43.96 (49.65) 40.65 (49.12)No-Information 38.84 (48.77) 28.42
(45.14)
42.22
(49.42)
44.03 (49.68) 39.23 (48.83)Info-Min 35.83 (47.99) 34.51
(47.59)
42.50
(49.48)
48.42 (50.02) 40.44 (49.09)Info-Max 41.21 (49.26) 46.32
(49.91)
43.33
(49.59)
39.84 (48.99) 42.56 (49.45)WELFAREPercentage of cumulating 49.48 (50.01) 50.51 (50.01) 49.33 (50.01) 48.41 (49.99) 49.40 (50.00)
No-Information 49.40
(50.03)
53.03
(49.95)
48.00
(50.00)
46.23 (49.89) 49.18 (50.00)Info-Min 47.83
(49.99)
48.43
(50.02)
47.50
(49.98)
51.50 (50.02) 48.79 (49.99)Info-Max 51.58 (50.01) 49.50
(50.04)
52.50
(49.98)
47.92 (49.99) 50.24 (50.01)Percentage of evaders stricto sensu
46.95 (49.92) 45.82 (49.84) 47.22 (49.94) 46.02 (49.85) 46.51 (49.88)
No-Information 45.60 (49.84) 47.58
(49.98)
44.67
(49.77)
42.17 (49.42) 45.02 (49.76)Info-Min 45.65 (49.85) 45.88
(49.88)
47.50
(49.98)
51.17 (50.03) 47.54 (49.95)Info-Max 50.53 (50.04) 43.83
(49.66)
49.50
(50.04)
45.42 (49.82) 47.19 (49.93)Note: The numbers refer to proportions of subjects. These proportions are obtained from the total number of subjects by treatment and/or condition (see details in Table 2). Standard deviations are in parentheses.
35

Table 4. Determinants of the decision to conceal income by information condition Dependent variable: no report
All conditions No-Information condition
Info-Min condition
Info-Max condition
Tax treatment
ConditionNo InformationInfo-Min condition
Info-Max condition
Audit policyAudit probability: 1/6Audit probability: ¼
Audit probability: ½
High fixed fine
Period
CountryWalloniaFlanders
France
Netherlands
Male
Age
Safety index - Holt & LaurySelf-reported risk attitude
Cognitive performance
Parents’ relative income categoryOpinion on: Cheat if get away Pay in cash
Tax evasion Social fraud Rich pay too much
taxes Constant
-.249*** (.064)/-.060/
Ref..084 (.079)
/.020/.130* (.074)
/.032/
Ref.-.971*** (.042)
/-.235/-2.677***(.074)
/-.649/-.188*** (.028)
/-.046/-.001 (.001)
/-.001/
Ref.-.013 (.090)
/-.003/.247*** (.091)
/.060/.097 (.090)
/.024/.165** (.067)
/.040/-.008 (.009)
/<-.001/-.127*** (.024)
/-.031/.098*** (.021)
/.024/.067* (.036)
/.016/.007 (.015)
/.002/
-.003 (.021)/-.001/
-.013 (.024)/-.003/
.038** (.015)/.009/
-.023 (.016)/-.005/
.054 (.065)/.013/
1.069*** (.322)
-.278***(.102)/-.067/
-
-
Ref.-1.035***(.067)
/-.250/-2.721***(.111)
/-.657/-.163***(0.046)
/-.039/-.001(.002)
/-.001/
Ref..287**(.147)
/.069/.341**(.153)
/.082/.308**(.147)
/.074/.215*(.118)
/.052/.001(.023)/<-.001/
-.065 # (.040)/-.016/
.097***(.032)/.023/
-.022(.061)/-.005/
-.011(.023)/-.003/
-.010(.035)/-.003/
-.021(.038)/-.005/
.038##(.023)/.009/
-.044(.027)/-.011/
.125(.100)/.030/
.677(.553)
-.280**(.128)/-.065/
-
-
Ref.-1.023***(.082)
/-.238/-2.759***(.142)
/-.643/-.159***(0.054)
/-.037/-.003(.003)
/-.001/
Ref.-.254(.176)
/-.059/.217(.184)
/.050/.191(.161)
/.044/.219*(.134)
/.051/-.087***(.033)
/-.020/-.201***(.043)
/-.047/.103**(.042)
/.024/.043(.076)
/.010/-.010(.030)
/-.002/
-.019(.039)/-.004/
.044(.048)/.010/
.061**(.029)/.014/
-.025(.027)/-.006/
.066(.134)/.015/
3.201***(.888)
-.218**(.101)/-.052/
-
-
Ref.-.898***(.070)
/-.215/-2.683***(.136)
/-.643/-.252***(0.049)
/-.060/-.001(.002)
/<-.001/
Ref.-.253*(.147)
/-.061/.063(.145)
/.015/-.260*(.143)
/-.062/.122(.106)
/.029/-.002(.009)
/<-.001/-.151*** (.041)
/-.036/.084***(.032)
/.020/.175***(.054)
/.042/.030(.027)
/.007/
.028(.036)/.007/
-.067(.044)/-.016/
.030(.025)/.007/
-.011(.027)/-.003/
-.022(.109)/-.005/
1.280***(.496)Number of observationsLog pseudolikelihoodWald χ2
15390-6641.2981420.97
5760-2475.234
675.91
4680-1938.784
467.63
4950-2115.248
498.91
36

Prob>χ2
Pseudo R2.0000.370
.0000.368
.0000.396
.0000.379
Note: *, **, and *** indicate significance at the 10%, 5% and 1% level, respectively. Robust standard errors are in parentheses and marginal effects between brackets. # indicates significance at 10.4% and ## at 10.3%. Tax treatment, Info-Min condition, Info-Max condition, audit probability ¼ and ½, high fixed fine, Flanders, France, the Netherlands, and male are dummy variables. The safety index is given by the number of times the participant has chosen the safe option A in the Holt and Laury lottery and can take any integer value between 0 and 10 (ex ante measure). The self-reported risk attitude takes a value between 1 (risk averse) and 9 (willing to take full risks) (ex post measure). Cognitive performance indicates the number of correct answers in the three questions of the Cognitive Reflection test. The parents’ relative income category is given by the answer to the question “how do your parents’ income compare with that of the other students of your University?). It can take a value between 1 (among the 10% the poorest) and 10 (among the 10% the richest). The opinion on “Cheat if get away” and on “Pay in cash” can take a value between 1 (this behavior is perfectly acceptable) and 6 (this behavior is not at all acceptable). The opinion on “Tax evasion” and on “Social fraud” is coded in the opposite direction: 1 indicates that the behavior is absolutely unacceptable while 10 indicates that it is absolutely acceptable. The opinion on “Rich pay too much taxes” is coded 1 if the participant answered “agree” or “strongly agree” to the following statement: “Rich pay too much taxes”, and 0 otherwise.
37
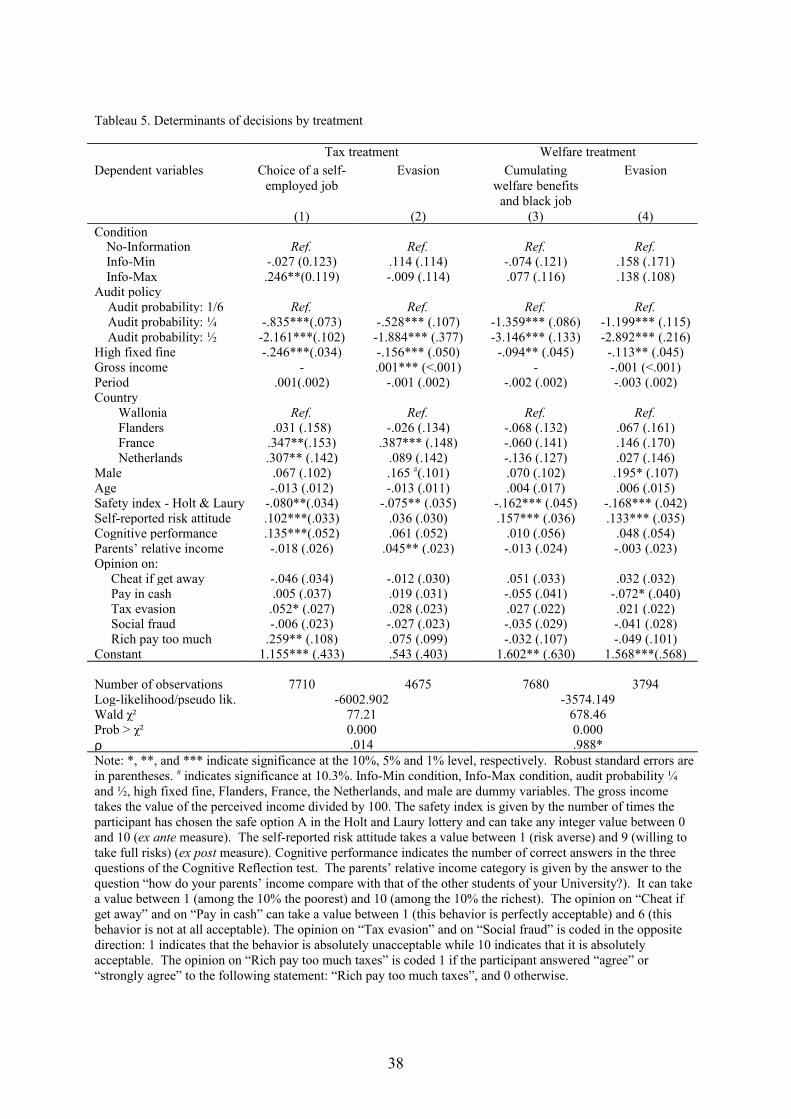
Tableau 5. Determinants of decisions by treatment
Tax treatment Welfare treatmentDependent variables Choice of a self-
employed jobEvasion Cumulating
welfare benefits and black job
Evasion
(1) (2) (3) (4)Condition
No-Information Ref. Ref. Ref. Ref.Info-Min -.027 (0.123) .114 (.114) -.074 (.121) .158 (.171)Info-Max .246**(0.119) -.009 (.114) .077 (.116) .138 (.108)
Audit policy Audit probability: 1/6 Ref. Ref. Ref. Ref. Audit probability: ¼ -.835***(.073) -.528*** (.107) -1.359*** (.086) -1.199*** (.115) Audit probability: ½ -2.161***(.102) -1.884*** (.377) -3.146*** (.133) -2.892*** (.216)High fixed fine -.246***(.034) -.156*** (.050) -.094** (.045) -.113** (.045)Gross income - .001*** (<.001) - -.001 (<.001)Period .001(.002) -.001 (.002) -.002 (.002) -.003 (.002)Country
Wallonia Ref. Ref. Ref. Ref.Flanders .031 (.158) -.026 (.134) -.068 (.132) .067 (.161)France .347**(.153) .387*** (.148) -.060 (.141) .146 (.170)Netherlands .307** (.142) .089 (.142) -.136 (.127) .027 (.146)
Male .067 (.102) .165 #(.101) .070 (.102) .195* (.107)Age -.013 (.012) -.013 (.011) .004 (.017) .006 (.015)Safety index - Holt & Laury -.080**(.034) -.075** (.035) -.162*** (.045) -.168*** (.042)Self-reported risk attitude .102***(.033) .036 (.030) .157*** (.036) .133*** (.035)Cognitive performance .135***(.052) .061 (.052) .010 (.056) .048 (.054)Parents’ relative income -.018 (.026) .045** (.023) -.013 (.024) -.003 (.023)Opinion on: Cheat if get away -.046 (.034) -.012 (.030) .051 (.033) .032 (.032) Pay in cash .005 (.037) .019 (.031) -.055 (.041) -.072* (.040) Tax evasion .052* (.027) .028 (.023) .027 (.022) .021 (.022) Social fraud -.006 (.023) -.027 (.023) -.035 (.029) -.041 (.028) Rich pay too much .259** (.108) .075 (.099) -.032 (.107) -.049 (.101)Constant 1.155*** (.433) .543 (.403) 1.602** (.630) 1.568***(.568)
Number of observations 7710 4675 7680 3794Log-likelihood/pseudo lik. -6002.902 -3574.149Wald χ² 77.21 678.46Prob > χ² 0.000 0.000ρ .014 .988*Note: *, **, and *** indicate significance at the 10%, 5% and 1% level, respectively. Robust standard errors are in parentheses. # indicates significance at 10.3%. Info-Min condition, Info-Max condition, audit probability ¼ and ½, high fixed fine, Flanders, France, the Netherlands, and male are dummy variables. The gross income takes the value of the perceived income divided by 100. The safety index is given by the number of times the participant has chosen the safe option A in the Holt and Laury lottery and can take any integer value between 0 and 10 (ex ante measure). The self-reported risk attitude takes a value between 1 (risk averse) and 9 (willing to take full risks) (ex post measure). Cognitive performance indicates the number of correct answers in the three questions of the Cognitive Reflection test. The parents’ relative income category is given by the answer to the question “how do your parents’ income compare with that of the other students of your University?). It can take a value between 1 (among the 10% the poorest) and 10 (among the 10% the richest). The opinion on “Cheat if get away” and on “Pay in cash” can take a value between 1 (this behavior is perfectly acceptable) and 6 (this behavior is not at all acceptable). The opinion on “Tax evasion” and on “Social fraud” is coded in the opposite direction: 1 indicates that the behavior is absolutely unacceptable while 10 indicates that it is absolutely acceptable. The opinion on “Rich pay too much taxes” is coded 1 if the participant answered “agree” or “strongly agree” to the following statement: “Rich pay too much taxes”, and 0 otherwise.
38

Appendix A. Instructions of the Tax treatment under the Information condition (The instructions for the No-Information are similar except for the sentences that are underlined below –but were not underlined in the instructions distributed to the subjects)
We thank you for taking part in this experiment on decision-making. In the experiment, your earnings will depend on your decisions and random events. It is important that you carefully read these instructions. The experiment consists of three independent parts. At the end of the experiment, you will be paid the sum of your earnings in these parts. In addition, you will receive 3 Euro for showing up on time. You will be paid in cash your earnings at the end of the session individually and confidentially.
All your decisions are anonymous. You will never enter your name in the computer.
During the experiment you are not allowed to communicate. If you have questions then please raise your hand. One of us will come to you to answer your question.
You have received the instructions for the first part. You will receive the instructions for the second and the third part after you have completed the first part.
Part 1
During this part, you will make ten successive decisions. At the end of the experiment, one of these decisions will be randomly drawn by the computer software for determining your earnings.
Each decision is a paired choice between “Option A” and “Option B”. All the decisions and options are displayed in the table below. They will be also displayed on your computer screen. You will have to choose between these options by clicking either option A or option B.
• Look at Decision 1. Option A pays 2 € with 1 chance out of 10 and it pays 1.6 € with 9 chances out of 10 Option B pays 3.85 € with 1 chance out of 10 and it pays 0.1 € with 9 chances out of 10
• Look at Decision 2. Option A pays 2 € with 2 chances out of 10 and it pays 1.6 € with 8 chances out of 10 Option B pays 3.85 € with 2 chances out of 10 and it pays 0.1 € with 8 chances out of 10
The other eight decisions are similar. Note that as you move down the table, the chances of a higher prize for each option increase. In fact, for Decision 10 each option pays the highest payoff for sure, so your choice here is between 2 € and 3.85 €.
To summarize:
- You make ten decisions. For each decision, you choose between Option A and Option B. You may choose A for some decisions and B for others. There are no correct or incorrect answers.
- After you have made your ten decisions, you must confirm this set of decisions by clicking the OK button. Once you have clicked this button, you can no longer change your decisions.
- At the end of the session, the computer software will select randomly one of your ten decisions. Each decision has an equal chance of being relevant for your earnings. Thereafter, with a new random draw, the computer program will determine your money earnings for the option (A or B) you chose for that decision according to the chances indicated for the option you chose.
If you have any question, please raise your hand. Your questions will be answered in private.
The ten decisions
39

Decision 1Option A: 1 chance out of 10 of receiving 2 € and 9 chances out of 10 of receiving 1.6 €Option B: 1 chance out of 10 of receiving 3.85 € and 9 chances out of 10 of receiving 0.1 €
1. Decision 2Option A: 2 chances out of 10 of receiving 2 € and 8 chances out of 10 of receiving 1.6€ Option B: 2 chances out of 10 of receiving 3.85 € and 8 chances out of 10 of receiving 0.1 €
2. Decision 3Option A: 3 chances out of 10 of receiving 2 € and 7 chances out of 10 of receiving 1.6€ Option B: 3 chances out of 10 of receiving 3.85 € and 7 chances out of 10 of receiving 0.1 €
3. Decision 4Option A: 4 chances out of 10 of receiving 2 € and 6 chances out of 10 of receiving 1.6€Option B: 4 chances out of 10 of receiving 3.85 € and 6 chances out of 10 of receiving 0.1 €
4. Decision 5Option A: 5 chances out of 10 of receiving 2 € and 5 chances out of 10 of receiving 1.6€Option B: 5 chances out of 10 of receiving 3.85 € and 5 chances out of 10 of receiving 0.1 €
5. Decision 6Option A: 6 chances out of 10 of receiving 2 € and 4 chances out of 10 of receiving 1.6€Option B: 6 chances out of 10 of receiving 3.85 € and 4 chances out of 10 of receiving 0.1 €
6. Decision 7Option A: 7 chances out of 10 of receiving 2 € and 3 chances out of 10 of receiving 1.6€Option B: 7 chances out of 10 of receiving 3.85 € and 3 chances out of 10 of receiving 0.1 €
7. Decision 8Option A: 8 chances out of 10 of receiving 2 € and 2 chances out of 10 of receiving 1.6€Option B: 8 chances out of 10 of receiving 3.85 € and 2 chances out of 10 of receiving 0.1 €
8. Decision 9Option A: 9 chances out of 10 of receiving 2 € and 1 chance out of 10 of receiving 1.6€Option B: 9 chances out of 10 of receiving 3.85 € and 1 chance out of 10 of receiving 0.1 €
9. Decision 10Option A: 10 chances out of 10 of receiving 2 € and 0 chance out of 10 of receiving 1.6€Option B: 10 chances out of 10 of receiving 3.85 € and 0 chance out of 10 of receiving 0.1 €
Part 2 (Instructions distributed after part 1 has been completed)
During this part, your earnings are counted in points. Your earnings in cash from this part will be calculated according to the following conversion rate:
100 points = €3This part consists of 30 independent periods. At the end of the experiment, the computer program will randomly select two of these periods for payment, where each period has the same chance to be chosen. Your earnings in this part will be the average of your payoffs in these two periods.
Description of each period
In each period, you must choose between taking a salaried job or a self-employed job. Each job lasts only one period.
Each job is associated with various possible gross incomes.* In a salaried job, your gross income can take the value 200, 300, 450, 550, 650 or 750 points. * In a self-employed job, your gross income can take the value 150, 200, 350, 550, 750 or 850 points.
After you have made your choice between a salaried job and a self-employed job, the computer program selects randomly your gross income for this period and you will be informed about it.
Any income should be reported such that it can be taxed. The unique tax rate is 25%.
* In a salaried job, your income will be automatically taxed and the net (= after tax) income amounts to 75% of your gross income. Therefore your net income can take the value 150, 225, 337.5, 412.5, 487.5 or 562.5 points, depending on your gross income.
* In a self-employed job, you will make a second decision. You will choose between reporting your self-
40
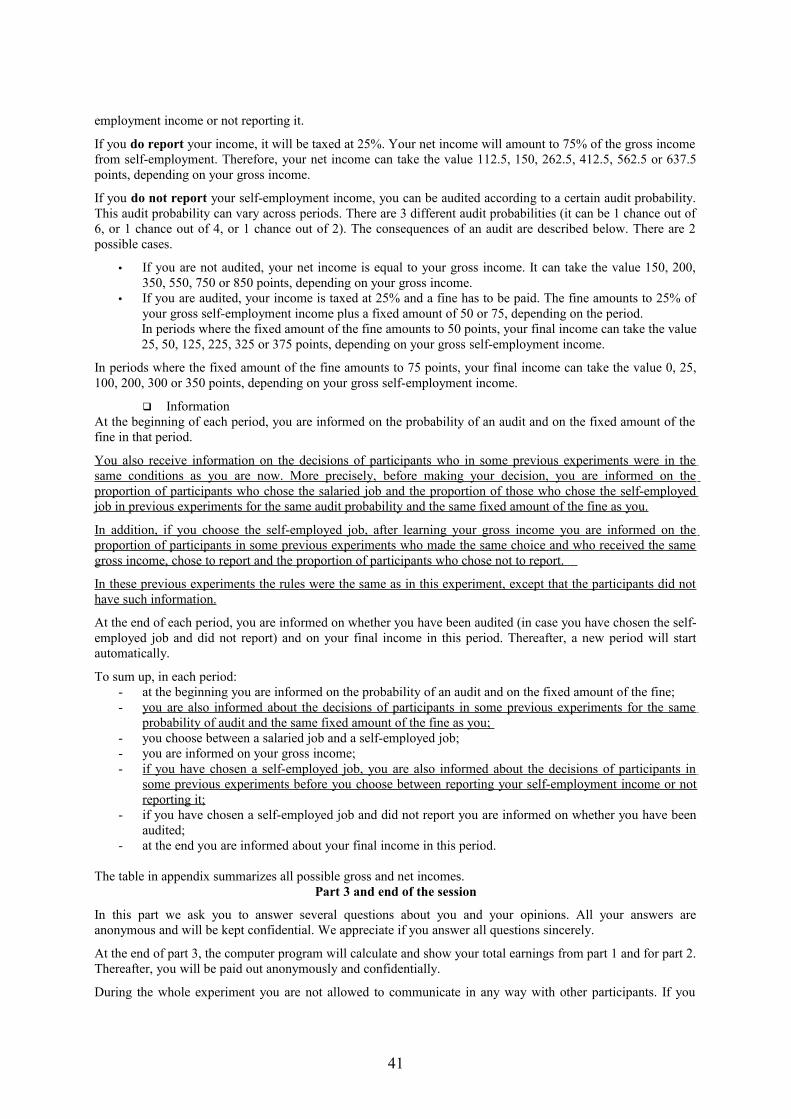
employment income or not reporting it.
If you do report your income, it will be taxed at 25%. Your net income will amount to 75% of the gross income from self-employment. Therefore, your net income can take the value 112.5, 150, 262.5, 412.5, 562.5 or 637.5 points, depending on your gross income.
If you do not report your self-employment income, you can be audited according to a certain audit probability. This audit probability can vary across periods. There are 3 different audit probabilities (it can be 1 chance out of 6, or 1 chance out of 4, or 1 chance out of 2). The consequences of an audit are described below. There are 2 possible cases.
• If you are not audited, your net income is equal to your gross income. It can take the value 150, 200, 350, 550, 750 or 850 points, depending on your gross income.
• If you are audited, your income is taxed at 25% and a fine has to be paid. The fine amounts to 25% of your gross self-employment income plus a fixed amount of 50 or 75, depending on the period.In periods where the fixed amount of the fine amounts to 50 points, your final income can take the value 25, 50, 125, 225, 325 or 375 points, depending on your gross self-employment income.
In periods where the fixed amount of the fine amounts to 75 points, your final income can take the value 0, 25, 100, 200, 300 or 350 points, depending on your gross self-employment income.
InformationAt the beginning of each period, you are informed on the probability of an audit and on the fixed amount of the fine in that period.
You also receive information on the decisions of participants who in some previous experiments were in the same conditions as you are now. More precisely, before making your decision, you are informed on the proportion of participants who chose the salaried job and the proportion of those who chose the self-employed job in previous experiments for the same audit probability and the same fixed amount of the fine as you.
In addition, if you choose the self-employed job, after learning your gross income you are informed on the proportion of participants in some previous experiments who made the same choice and who received the same gross income, chose to report and the proportion of participants who chose not to report.
In these previous experiments the rules were the same as in this experiment, except that the participants did not have such information.
At the end of each period, you are informed on whether you have been audited (in case you have chosen the self-employed job and did not report) and on your final income in this period. Thereafter, a new period will start automatically.
To sum up, in each period:- at the beginning you are informed on the probability of an audit and on the fixed amount of the fine;- you are also informed about the decisions of participants in some previous experiments for the same
probability of audit and the same fixed amount of the fine as you; - you choose between a salaried job and a self-employed job;- you are informed on your gross income;- if you have chosen a self-employed job, you are also informed about the decisions of participants in
some previous experiments before you choose between reporting your self-employment income or not reporting it;
- if you have chosen a self-employed job and did not report you are informed on whether you have been audited;
- at the end you are informed about your final income in this period.
The table in appendix summarizes all possible gross and net incomes.Part 3 and end of the session
In this part we ask you to answer several questions about you and your opinions. All your answers are anonymous and will be kept confidential. We appreciate if you answer all questions sincerely.
At the end of part 3, the computer program will calculate and show your total earnings from part 1 and for part 2. Thereafter, you will be paid out anonymously and confidentially.
During the whole experiment you are not allowed to communicate in any way with other participants. If you
41
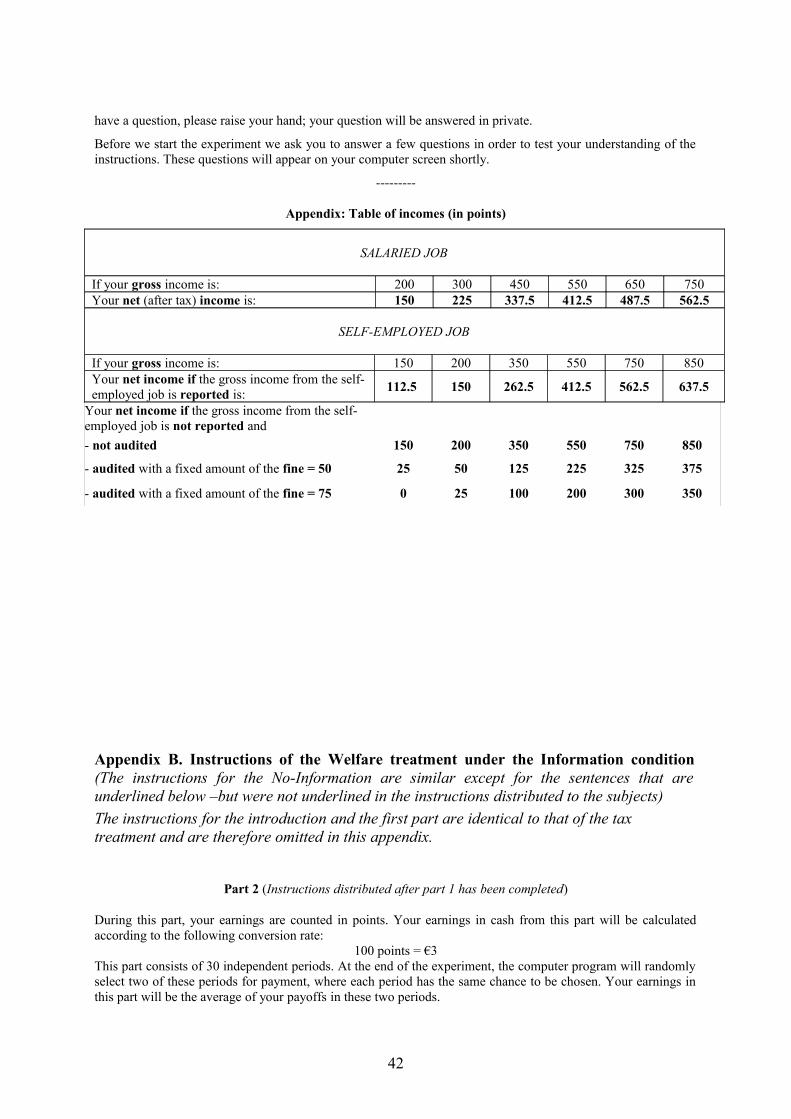
have a question, please raise your hand; your question will be answered in private.
Before we start the experiment we ask you to answer a few questions in order to test your understanding of the instructions. These questions will appear on your computer screen shortly.
---------
Appendix: Table of incomes (in points)
SALARIED JOB
If your gross income is: 200 300 450 550 650 750Your net (after tax) income is: 150 225 337.5 412.5 487.5 562.5
SELF-EMPLOYED JOB
If your gross income is: 150 200 350 550 750 850Your net income if the gross income from the self-employed job is reported is: 112.5 150 262.5 412.5 562.5 637.5
Your net income if the gross income from the self-employed job is not reported and- not audited 150 200 350 550 750 850
- audited with a fixed amount of the fine = 50 25 50 125 225 325 375
- audited with a fixed amount of the fine = 75 0 25 100 200 300 350
Appendix B. Instructions of the Welfare treatment under the Information condition (The instructions for the No-Information are similar except for the sentences that are underlined below –but were not underlined in the instructions distributed to the subjects)The instructions for the introduction and the first part are identical to that of the tax treatment and are therefore omitted in this appendix.
Part 2 (Instructions distributed after part 1 has been completed)
During this part, your earnings are counted in points. Your earnings in cash from this part will be calculated according to the following conversion rate:
100 points = €3This part consists of 30 independent periods. At the end of the experiment, the computer program will randomly select two of these periods for payment, where each period has the same chance to be chosen. Your earnings in this part will be the average of your payoffs in these two periods.
42
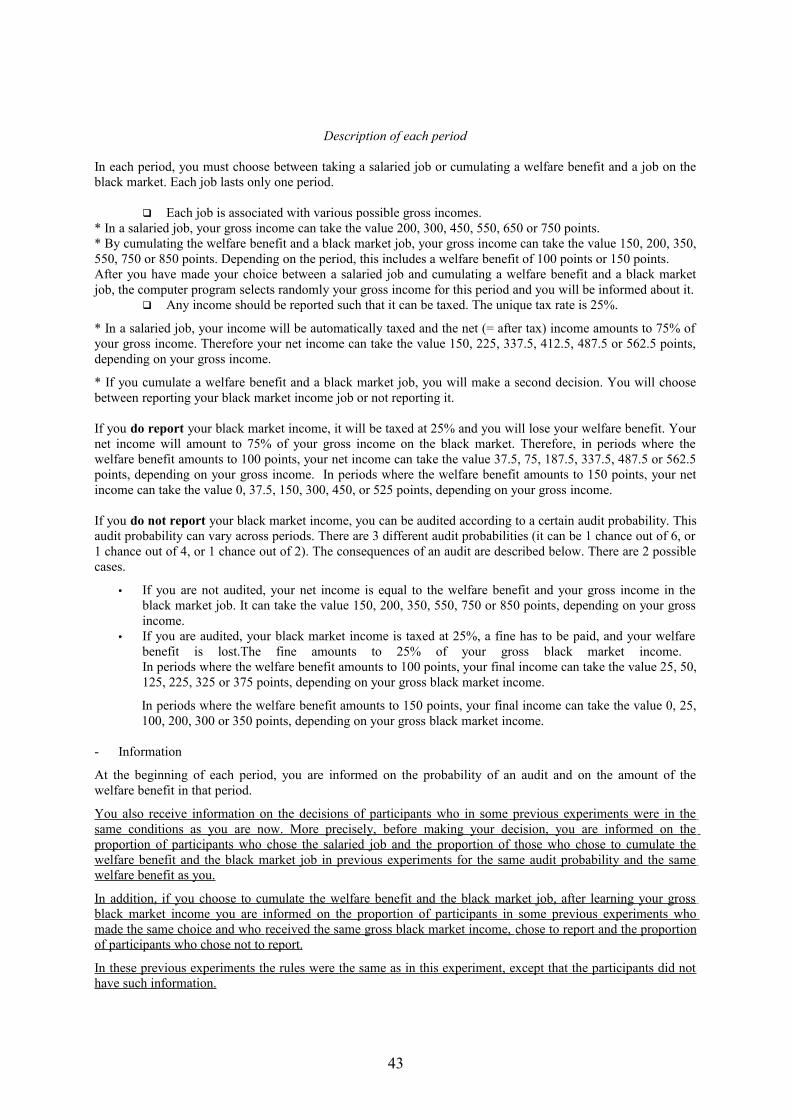
Description of each period
In each period, you must choose between taking a salaried job or cumulating a welfare benefit and a job on the black market. Each job lasts only one period.
Each job is associated with various possible gross incomes.* In a salaried job, your gross income can take the value 200, 300, 450, 550, 650 or 750 points. * By cumulating the welfare benefit and a black market job, your gross income can take the value 150, 200, 350, 550, 750 or 850 points. Depending on the period, this includes a welfare benefit of 100 points or 150 points.After you have made your choice between a salaried job and cumulating a welfare benefit and a black market job, the computer program selects randomly your gross income for this period and you will be informed about it.
Any income should be reported such that it can be taxed. The unique tax rate is 25%.
* In a salaried job, your income will be automatically taxed and the net (= after tax) income amounts to 75% of your gross income. Therefore your net income can take the value 150, 225, 337.5, 412.5, 487.5 or 562.5 points, depending on your gross income.
* If you cumulate a welfare benefit and a black market job, you will make a second decision. You will choose between reporting your black market income job or not reporting it.
If you do report your black market income, it will be taxed at 25% and you will lose your welfare benefit. Your net income will amount to 75% of your gross income on the black market. Therefore, in periods where the welfare benefit amounts to 100 points, your net income can take the value 37.5, 75, 187.5, 337.5, 487.5 or 562.5 points, depending on your gross income. In periods where the welfare benefit amounts to 150 points, your net income can take the value 0, 37.5, 150, 300, 450, or 525 points, depending on your gross income.
If you do not report your black market income, you can be audited according to a certain audit probability. This audit probability can vary across periods. There are 3 different audit probabilities (it can be 1 chance out of 6, or 1 chance out of 4, or 1 chance out of 2). The consequences of an audit are described below. There are 2 possible cases.
• If you are not audited, your net income is equal to the welfare benefit and your gross income in the black market job. It can take the value 150, 200, 350, 550, 750 or 850 points, depending on your gross income.
• If you are audited, your black market income is taxed at 25%, a fine has to be paid, and your welfare benefit is lost.The fine amounts to 25% of your gross black market income. In periods where the welfare benefit amounts to 100 points, your final income can take the value 25, 50, 125, 225, 325 or 375 points, depending on your gross black market income.
In periods where the welfare benefit amounts to 150 points, your final income can take the value 0, 25, 100, 200, 300 or 350 points, depending on your gross black market income.
- Information
At the beginning of each period, you are informed on the probability of an audit and on the amount of the welfare benefit in that period.
You also receive information on the decisions of participants who in some previous experiments were in the same conditions as you are now. More precisely, before making your decision, you are informed on the proportion of participants who chose the salaried job and the proportion of those who chose to cumulate the welfare benefit and the black market job in previous experiments for the same audit probability and the same welfare benefit as you.
In addition, if you choose to cumulate the welfare benefit and the black market job, after learning your gross black market income you are informed on the proportion of participants in some previous experiments who made the same choice and who received the same gross black market income, chose to report and the proportion of participants who chose not to report.
In these previous experiments the rules were the same as in this experiment, except that the participants did not have such information.
43

At the end of each period, you are informed on whether you have been audited (in case you have chosen to cumulate a welfare benefit and a black market job and did not report) and on your final income in this period. Thereafter, a new period will start automatically.
To sum up, in each period:
at the beginning you are informed on the probability of an audit and on the amount of the welfare benefit;
you are also informed about the decisions of participants in some previous experiments for the same probability of audit and the same welfare benefit as you;
you choose between a salaried job and cumulating a welfare benefit and a black market job; you are informed on your gross income; if you have chosen to cumulate a welfare benefit and a black market job, you are also informed about
the decisions of participants in some previous experiments before you choose between reporting your black market income or not reporting it;
if you have chosen to cumulate a welfare benefit and a black market job and did not report it, you are informed on whether you have been audited;
at the end you are informed about your final income in this period.
The table in appendix summarizes all possible gross and net incomes.
Part 3 and end of the session
In this part we ask you to answer several questions about you and your opinions. All your answers are anonymous and will be kept confidential. We appreciate if you answer all questions sincerely.
At the end of part 3, the computer program will calculate and show your total earnings for part 1 and for part 2. Thereafter, you will be paid out anonymously and confidentially.
During the whole experiment you are not allowed to communicate in any way with other participants. If you have a question, please raise your hand; your question will be answered in private.
Before we start the experiment we ask you to answer a few questions in order to test your understanding of the instructions. These questions will appear on your computer screen shortly.
44
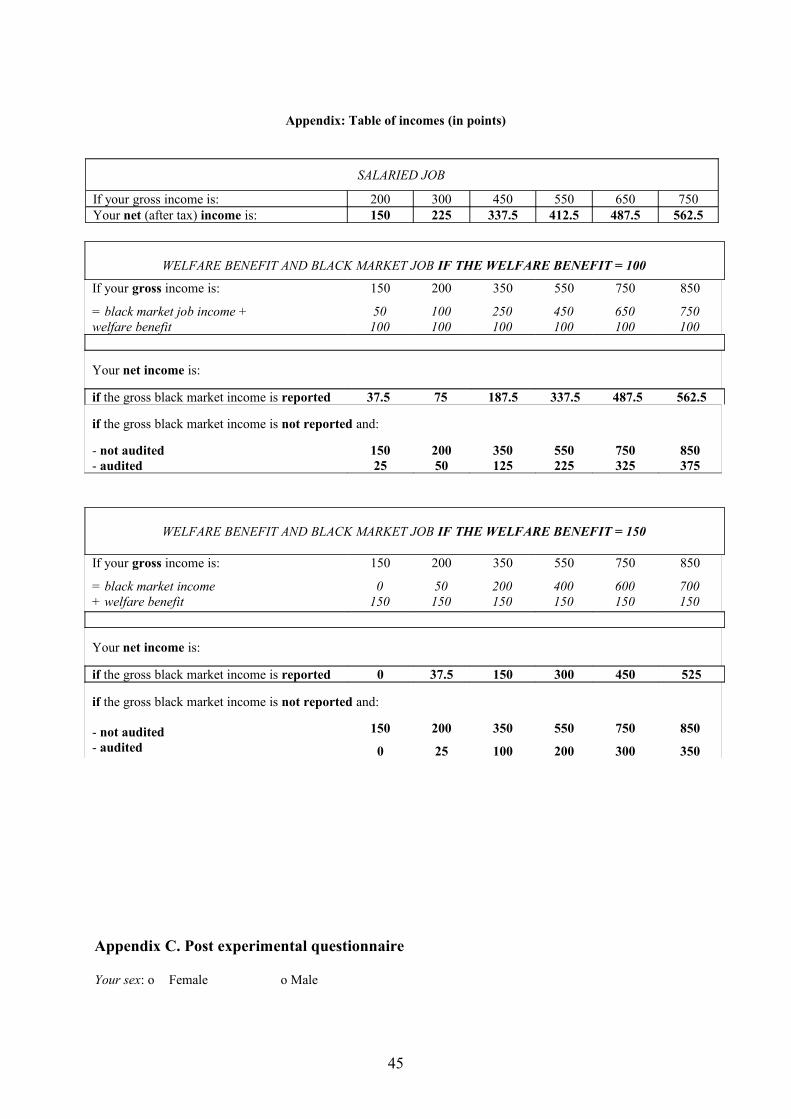
Appendix: Table of incomes (in points)
SALARIED JOB
If your gross income is: 200 300 450 550 650 750Your net (after tax) income is: 150 225 337.5 412.5 487.5 562.5
WELFARE BENEFIT AND BLACK MARKET JOB IF THE WELFARE BENEFIT = 100
If your gross income is:
= black market job income +welfare benefit
150
50100
200
100100
350
250100
550
450100
750
650100
850
750100
Your net income is:
if the gross black market income is reported 37.5 75 187.5 337.5 487.5 562.5
if the gross black market income is not reported and:
- not audited- audited
15025
20050
350125
550225
750325
850375
WELFARE BENEFIT AND BLACK MARKET JOB IF THE WELFARE BENEFIT = 150
If your gross income is:
= black market income+ welfare benefit
150
0150
200
50150
350
200150
550
400150
750
600150
850
700150
Your net income is:
if the gross black market income is reported 0 37.5 150 300 450 525
if the gross black market income is not reported and:
- not audited- audited
150
0
200
25
350
100
550
200
750
300
850
350
Appendix C. Post experimental questionnaire
Your sex: o Female o Male
45

Your age: ________ years
Your nationality:
Your study discipline: o businesso economicso engineering, computer scienceso maths, physics, chemistryo medicineo others
Your school or university:
Your father's highest finished education:o no certificateo vocational training certificateo high school final exam (baccalaureat)o university degree
Your mother's highest finished educationo no certificateo vocational training certificateo high school final exam (baccalaureat)o university degree
How many paid hours per week do you work on average next to your study:
Did you take a loan to pay your education?
Do you own a personal car? o yes o no
In your opinion, how do your parents' income compare with that of the other students of your university/school? Your parents are
1 2 3 4 5 6 7 8 9 10 among the 10% in the among the 10% the poorest average the richestClick 1 if you believe your parents's income is among the lowest 10%, 2 for the lower 20%, etc. . Click 5 if you believe your parents' income are average. Click 10 if you believe your parents' incomes are among the highest 10%.
How do you see yourself: Are you generally a person who is fully prepared to take risks or do you try to avoid taking risks?(1=Risk averse ......9=Willing to take full risk)
Would you define your political opinions as (multiple options possible with a maximum of 2)rightmiddleleftliberalconservativegreen/ecologicalreligiously inspirednone of the aboveDon't know
Please rate the following statements:
46

Most crime...... is committed by unworthy beings, and the government must protect law-abiding citizens and their property.... is committed by fallen human beings, and the government is honor-bound to help them recover and become good citizens again.... is a fact of life, and it is the responsibility of each individual to protect him- or herself. The government should not intervene.none of the aboveDon't know
Progressive taxation (i.e. higher tax rates for people with a higher income than for people with lower income)...... is a just form of taxation, because it takes from those who have and give to those who don't have.... is bad like all taxation.... is bad because it is detrimental to efficiency.none of the aboveDon't know
The rich have to pay too much taxes.Strongly DisagreeDisagreeAgreeStrongly AgreeDon't know
The freer the economy, the freer the people.Strongly DisagreeDisagreeAgreeStrongly AgreeDon't know
Life on earth was created by some supreme being.Strongly DisagreeDisagreeAgreeStrongly AgreeDon't know
There is evidence that part of the population is engaged in undeclared work, in the sense of activities which circumvent declaration to tax authorities or social security institutions, but which are otherwise legal. Payment may be in money or in kind. This could be people working in certain sectors of activity like construction, transport or agriculture for example but also in hotels, restaurants and cafes. Undeclared work is also common in the whole range of household services - such as gardening, babysitting and elderly care -, personal services - like hairdressing, cosmetic or medical treatment - and repair services for cars, clothes, or computers.
What would you estimate is the share of the population which works without declaring the income or part of the income to tax or social security institutions in each of the following countries/regions?
Belgium Belgium France Former East Former West Netherlands Wallonia Flanders Germany GermanyLess than 1 % From 1 % to less than 5 % From 5 % to less than 10 % From 10 % to less than 20 % From 20 % to less than 30 %From 30 % to less than 40 %From 40 % to less than 50 %50 % or moreDon't know
47
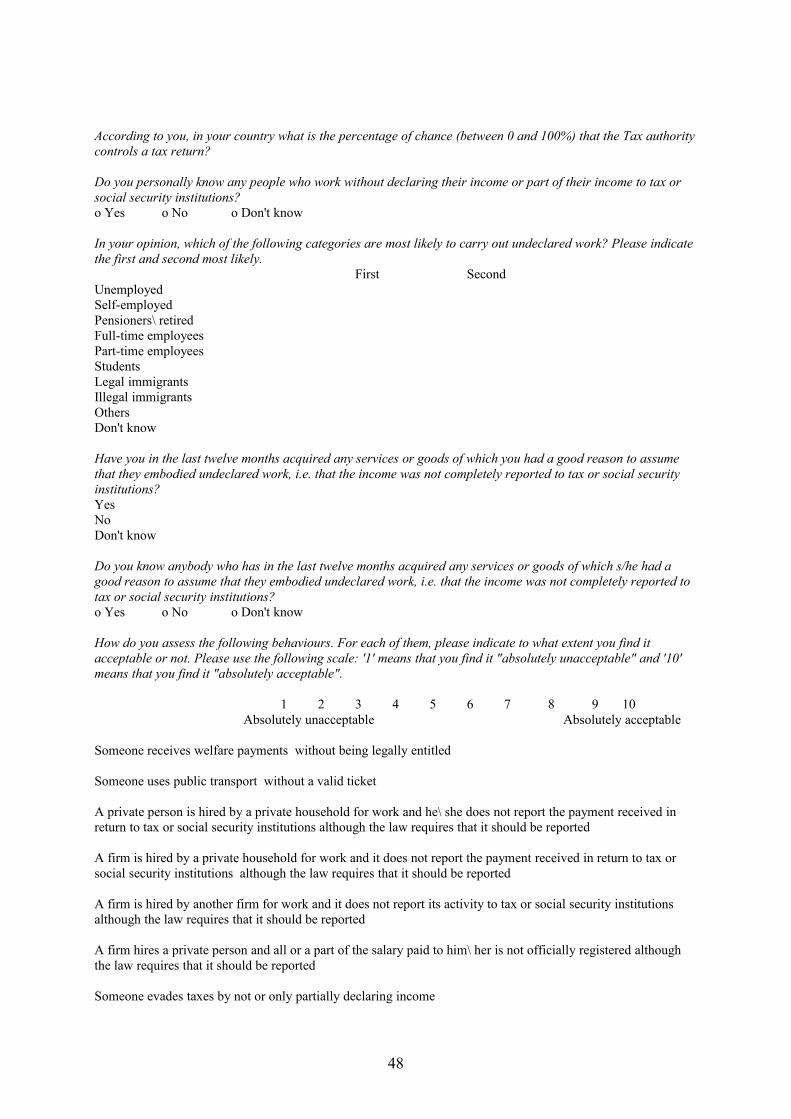
According to you, in your country what is the percentage of chance (between 0 and 100%) that the Tax authority controls a tax return?
Do you personally know any people who work without declaring their income or part of their income to tax or social security institutions? o Yes o No o Don't know In your opinion, which of the following categories are most likely to carry out undeclared work? Please indicate the first and second most likely.
First SecondUnemployed Self-employedPensioners\ retired Full-time employeesPart-time employeesStudents Legal immigrantsIllegal immigrants Others Don't know
Have you in the last twelve months acquired any services or goods of which you had a good reason to assume that they embodied undeclared work, i.e. that the income was not completely reported to tax or social security institutions? YesNoDon't know
Do you know anybody who has in the last twelve months acquired any services or goods of which s/he had a good reason to assume that they embodied undeclared work, i.e. that the income was not completely reported to tax or social security institutions? o Yes o No o Don't know
How do you assess the following behaviours. For each of them, please indicate to what extent you find it acceptable or not. Please use the following scale: '1' means that you find it "absolutely unacceptable" and '10' means that you find it "absolutely acceptable".
1 2 3 4 5 6 7 8 9 10Absolutely unacceptable Absolutely acceptable
Someone receives welfare payments without being legally entitled
Someone uses public transport without a valid ticket
A private person is hired by a private household for work and he\ she does not report the payment received in return to tax or social security institutions although the law requires that it should be reported
A firm is hired by a private household for work and it does not report the payment received in return to tax or social security institutions although the law requires that it should be reported
A firm is hired by another firm for work and it does not report its activity to tax or social security institutions although the law requires that it should be reported
A firm hires a private person and all or a part of the salary paid to him\ her is not officially registered although the law requires that it should be reported
Someone evades taxes by not or only partially declaring income
48

Please answer the following questions on a scale from 1 to 6, where 6 means that in your opinion the described behavior is not at all acceptable and 1 means that it is perfectly acceptable.
1. Trading or exchanging goods or services with a friend or neighbor and not reporting it on your tax form.
2. Reporting your main income fully, but not including some small outside income.
3. Being paid in cash for a job and then not reporting it on your tax form.
4. Not reporting some earnings from investments or interest that the government would not be able to find out about.
5. Almost every taxpayer would cheat to some extent if s/he thought s/he could get away with it.
6. The chances of getting caught are so low that it is worthwhile trying to cut corners a little on your taxes.
49