Embed Size (px)
Citation preview

Page 2
1 Introduction
This Review supersedes the “Tauranga City Population and Household Projection Review 2016 (Growth Allocations 2013-2063)” (The 2016 Review) and the earlier “Tauranga City Population and Household Projection Review 2014 (Growth Allocations 2013-2028)”1 (the 2014 Review).
Revised household and population projections (the revised projections) have been produced by the National Institute of Demographic and Economic Analysis (NIDEA) for SmartGrowth and the Bay of Plenty Regional Council. The revised projections are in five yearly increments from 2013 to 2063. The revised projections will be used as base assumptions for a range of services modelling and planning projects including:
Traffic modelling; Water modelling; Wastewater modelling; Development contributions; The Long Term Plan 2018-2028 (LTP).
The attached appendices provide the following information:
Appendix 1: Growth Management Area and Sub-Unit Projections, 2013-2063. Appendix 2: Growth Management Area and Sub-Unit Map. Appendix 3: Growth Management Area, Sub-Unit and Meshblock Map Series. Appendix 4: Meshblock Allocation of SmartGrowth Projections – 2013-2043. Appendix 5: Census Area Unit Allocation of SmartGrowth Projections – 2013-2063. Appendix 6: Census Area Unit Map, 2013.
2 Background
Revised population and household projections were commissioned specifically by SmartGrowth and the Bay of Plenty Regional Council after the 2013 Census to update previous projections for the territorial authorities in the Bay of Plenty Region. The revised projections were adopted by the SmartGrowth Committee on 28 May 2014. The revised projections for Tauranga City were adopted by Tauranga City Council (the Council) on 18 August 2014.
A report was produced by NIDEA2 which provided a range of projections. After a series of workshops with NIDEA on the many factors and methodology influencing the projections the median (50th percentile) projection was adopted. Under the median projection the population of Tauranga City is projected to grow from 119,800 in 2013 to around 164,100 in 2033 (+37 percent) and to around 198,400 in 2063 (+21 percent). The median population projections for the Western Bay of Plenty sub-region are:
Western Bay of Plenty District; 60,608 in 2063 Tauranga City; 198,373 in 2063 Western Bay sub-region; 258,980 in 2063.
While NIDEA population projections have been adopted by the SmartGrowth Council’s, household projections were adjusted in response to concern expressed by technical staff that the NIDEA household projections showed a considerable change from the household occupancy rates from the 2013 Census and the declining trend in household occupancy observed over the last few census periods. The SmartGrowth Implementation Committee and the SmartGrowth Council’s
1 Tauranga City Population and Household Projection Review 2014, Tauranga City Council, August 2014. 2 2014 Review of Demographic and Labour Force Projections for the Bay of Plenty Region for the Period 2013-
2063 prepared by the National Institute of Demographic and Economic Analysis (NIDEA), University of Waikato, April 2014. Note the 30 June 2013 Estimated Residential Population has been updated in this report from 117,280 to 119,800.
Page 3
endorsed an approach to use a lower dwelling growth rate to 2025 and then apply the same dwelling growth rate as NIDEA for the 2025 to 2063 period. This was considered a prudent approach for the LTP planning period, with the benefit of continued monitoring through the corresponding period. In this review the 2013-2018 household projection has been increased from 4,207 households (4,628 total dwellings) adopted in the 2014 Review to 6,409 households (7,050 total dwellings). The adjusted, additional household projection for Tauranga City is +44,836 by 2063, (2,334 less additional households than projected by NIDEA to 2063). This adjustment has been informed by 3.5 years of dwelling consent issue monitoring. Shortly after the release of the 2016 Review report and allocations in December 2016, Statistics NZ released updated subnational population projections including projections for Tauranga City. The revised Statistics NZ population projections were significantly higher than NIDEA forecast for 2013-2018 period (+5000 people), and due to this the Stats medium projection remained higher than the NIDEA projection until 2033. From 2033 the NIDEA projection is higher than the Stats medium and remains slightly above the Stats medium projection to 2043 (the extent of the Stats NZ projection period). In order to ensure that the projections remained as accurate as possible, particularly for LTP and infrastructure modelling purposes, the population projections were adjusted to bring some growth forward in the 2013-2018 period and this was offset by reducing growth in the 2018 to 2033 period to align with Stats NZ medium projection to 2033. This revision responds to the current high rate of population and dwelling growth signalled by high levels of dwelling consent issue and migration. Correspondingly adjustments were also made to the dwelling projections in the 2013 to 2033 projection period. The 2033 to 2063 NIDEA projection remains unchanged from the 2016 Review, as does the total population and household projection to 2033 and 2063.
The revised projections have been allocated down to statistical meshblocks from 2013 to 2043, and down to Census Area Units and Growth Management Area sub-units from 2013 to 2063. As census cycles are 5 yearly the sub-level allocations are provided in 5 yearly increments.
3 Methodology
3.1 Allocation Considerations
To inform the allocation of the revised projections the information considered included:
March 2013 Census population and dwelling counts, and change over previous censuses; Significant consented and proposed developments (e.g.: The Vines Retirement Village) to
February 2016. Reports of relevance including SmartGrowth Development Trends (2016), SmartGrowth
Settlement Pattern Review projects including Option 3b project, - Te Tumu , Western Corridor and Compact City, Project 3e Confirm Infill Allocation3.
Special Housing areas approved under the HASHA legislation. Dwelling consent issue from March 2013 Census to February 2016. Remaining capacity based on current zoning provisions4. Latest Statistics NZ Population Projections and Estimates – released December 2016 and
updated in February 2017.
3 See ‘SmartGrowth Settlement Pattern Review: Report – Project 3e: Confirm Infill Allocation”, Tauranga City Council and Western Bay of Plenty District, April 2014. In determining remaining development potential this study assessed lot sizes, topography (e.g.: relic slips), hazards (e.g.: flood risk, compressible soils), land ownership, and building footprints in particular. 4 Original capacity calculations were reviewed to determine whether a greater or lesser yield was being achieved than anticipated. Generally all original yields were increased, particularly in Bethlehem, Papamoa and Pyes Pa east SP areas where retirement village developments have absorbed a large portion of the assumed capacity, leaving further land to develop.
Page 4
3.2 Allocation Levels
In this Review (as with the 2016 Review), Tauranga City projected growth was allocated to Growth Management Areas (GMA’s), GMA Sub-units, Census Area Units and at Meshblock level (see Table 1).
Table 1: Allocation Levels for Revised Projections
Growth Management Area Subunits Census Area Units Meshblocks Mount Maunganui 6 5 185
Papamoa 6 7 198 Tauranga Central 16 9 268 Tauranga South 18 7 132 Tauranga West 13 9 271
44 35 1,041
3.3 Growth Type
At Sub-unit and meshblock level, areas were defined by growth type. This classification allows the different growth types to be identified and monitored. Each subunit, and the meshblocks that comprise them, were classified as either:
Intensification area Infill/ Intensification Rural Infill Greenfield Urban Growth Area Potential Future Urban Growth Area
Intensification Areas: Areas which have City Plan zoning that enables intensification to occur. Three intensification areas are identified in this Review; Mount Maunganui North, City Living Zone and City Centre Zone intensification areas.
Infill/ Intensification areas Generally these areas have a Suburban Residential zoning, though some residential growth is anticipated in other zones within the infill area such as in some Commercial Business zoned areas. Work to date on the Compact City Project (a SmartGrowth Settlement Pattern Option 3b project) was considered in the allocation of intensification in the City.
Rural Infill: Areas of the City with Rural zoning outside the Greenfield UGA’s. Matapihi and Kairua and parts of Kaitemako and Welcome Bay East subunits are identified as Rural Infill. Greenfield Urban Growth Areas: These are the second and third generation UGA’s as identified in SmartGrowth. They have operative zoning to enable residential development. The second generation UGA’s are Bethlehem, Pyes Pa East, Ohauiti, Welcome Bay and Papamoa. The third generation UGA’s are Wairakei, Bethlehem West and Pyes Pa West (see Appendix 2). Potential Future Urban Growth Areas: These areas are generally comprised of areas assessed via the SmartGrowth – Settlement Pattern Review – Option 3b project which examined the potential for projected residential growth to be accommodated in Te Tumu (Papamoa East) and in the Western Corridor (Tauriko West, Keenan Road, Merrick Road, Upper Joyce and Upper Belk areas). In addition to these areas limited growth has also been allocated in the longer term to areas assessed as part of work completed for the urban limits line (Ohauiti South, and Pukemapu)5. Only Tauriko West, and Te Tumu have been endorsed by SmartGrowth to proceed to structure planning. The other potential future urban growth areas remain indicative.
5 See “SmartGrowth Implementation, Possible Urban Areas Assessment to Establish Urban Limits Line, February 2005”

Page 5
3.4 Indicative Meshblocks
As Statistics NZ does not generally split large meshblocks until a population threshold is reached, finer grain modelling based on meshblock boundaries is restricted in Greenfield UGA’s, and accurately splitting out structure plan areas (SP areas) is sometimes difficult. To overcome this, a number of indicative meshblocks have been created in this Review in Greenfield UGA’s by splitting large ‘parent’ meshblocks to form a number of smaller meshblocks6. The ‘parent’ meshblock number has been retained with an alpha (“A”, “B”, “C” etc) added to allow the smaller indicative meshblocks to be combined to form the ‘parent’ meshblock if required.
Indicative meshblocks enable the Bethlehem West, Bethlehem South, Carmichael (West) Bethlehem, Bethlehem North West, Welcome Bay/ Kaitemako, and Wairakei/ Marjorie Lane/ Parton Road SP areas to be defined. Several Western Bay of Plenty District meshblocks have also been included to the south of Tauranga City, and split to define potential future urban growth areas to the south of the City. They also capture potential future Greenfield areas to the south of Tauranga City in Western Bay District.
3.1 Population Divisors
Generally the number of people per household declines over the projection period, as population ages, and correspondingly the proportion of single occupancy and couple households increases. In the 2014 Review (and earlier reviews) projected population was divided by projected occupied dwellings to provide a population divisor to apply to all new dwellings. Dwellings were allocated across the City, then population assigned to the area based on the number of dwellings allocated. The weakness with this approach is that the projected divisor is considerably lower than the total city population/ occupied dwelling divisor which results in population assigned to new areas being lower than would be expected. One approach to overcome this issue is to use the “total city population”/ “total city occupied dwellings” and apply this divisor to cumulative growth in each area. However applying the city wide total divisor across the city results in significant, immediate and unrealistic falls in population is some established areas. As such both approaches have inherent weaknesses.
The adopted approach in this review is to apply different divisors based on growth type to established infill areas, established Greenfield areas, intensification areas, new greenfield areas, and potential future urban growth areas, while ensuring that the “bottom line” occupied dwelling and population figures remain as projected. This approach allows greater population to be assigned to new areas and future growth areas resulting in a more realistic and expected outcome than the 2014 Review approach. While this approach avoids rapid and significant declines in established areas, a decline in population is generally assumed in established areas as the number of people per household declines over time. This is consistent with the current projection which anticipates a significant and rapidly aging population characterised by more couples and people living alone.
3.1 National Policy Statement on Urban Development Capacity
The National Policy Statement on Urban Development Capacity (the NPS) came into effect on 1 December 2016. The NPS directs local authorities to provide sufficient capacity in their resource management plans for housing and business growth to meet demand. Development capacity refers to the amount of development allowed by zoning and regulations in plans that is supported by infrastructure. Under the NPS Tauranga City is classified as a High-Growth Urban Area and is required to produce a “housing and business development capacity assessment” by late 2017 and a “future development strategy” by late 2018. This Review will inform these NPS requirements.
6 Where indicative meshblocks have been created the meshblock “number” is coloured red in the Appendix 3 Meshblock map series.
Page 6
4 Assumptions
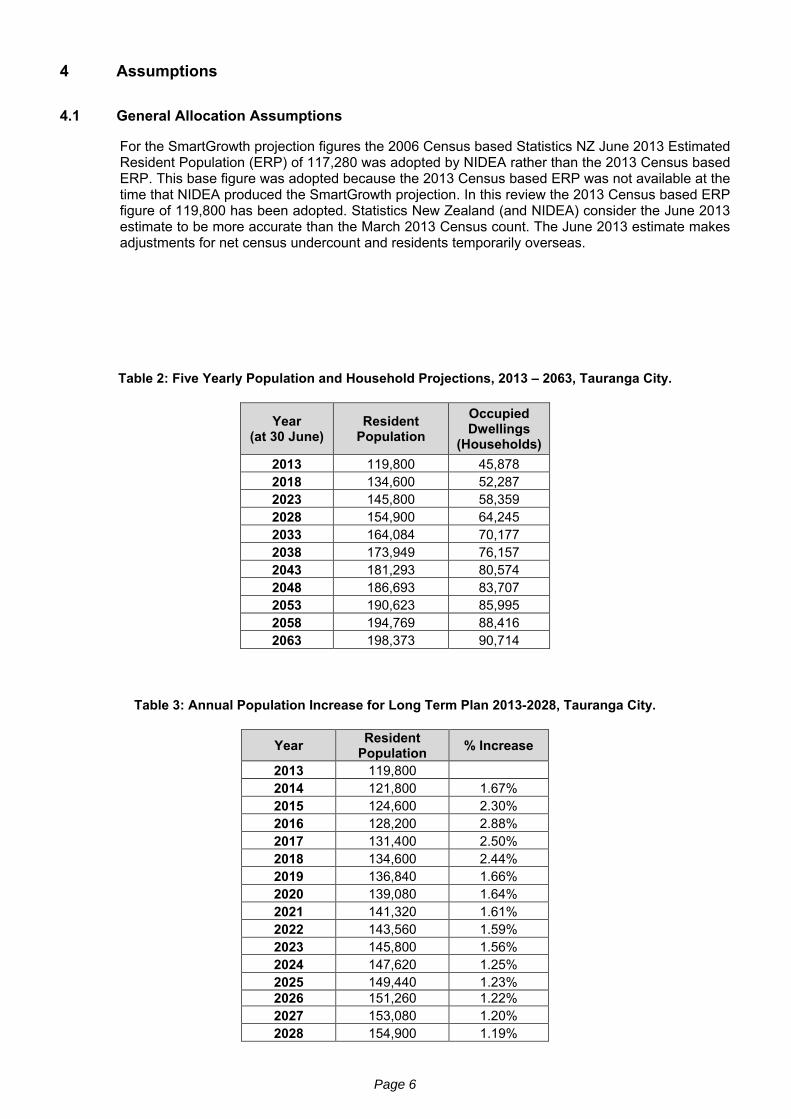
4.1 General Allocation Assumptions
For the SmartGrowth projection figures the 2006 Census based Statistics NZ June 2013 Estimated Resident Population (ERP) of 117,280 was adopted by NIDEA rather than the 2013 Census based ERP. This base figure was adopted because the 2013 Census based ERP was not available at the time that NIDEA produced the SmartGrowth projection. In this review the 2013 Census based ERP figure of 119,800 has been adopted. Statistics New Zealand (and NIDEA) consider the June 2013 estimate to be more accurate than the March 2013 Census count. The June 2013 estimate makes adjustments for net census undercount and residents temporarily overseas.
Table 2: Five Yearly Population and Household Projections, 2013 – 2063, Tauranga City.
Year (at 30 June)
Resident Population
Occupied Dwellings
(Households) 2013 119,800 45,878 2018 134,600 52,287 2023 145,800 58,359 2028 154,900 64,245 2033 164,084 70,177 2038 173,949 76,157 2043 181,293 80,574 2048 186,693 83,707 2053 190,623 85,995 2058 194,769 88,416 2063 198,373 90,714
Table 3: Annual Population Increase for Long Term Plan 2013-2028, Tauranga City.
Year Resident
Population % Increase
2013 119,800 2014 121,800 1.67% 2015 124,600 2.30% 2016 128,200 2.88% 2017 131,400 2.50% 2018 134,600 2.44% 2019 136,840 1.66% 2020 139,080 1.64% 2021 141,320 1.61% 2022 143,560 1.59% 2023 145,800 1.56% 2024 147,620 1.25% 2025 149,440 1.23% 2026 151,260 1.22% 2027 153,080 1.20% 2028 154,900 1.19%
Page 7
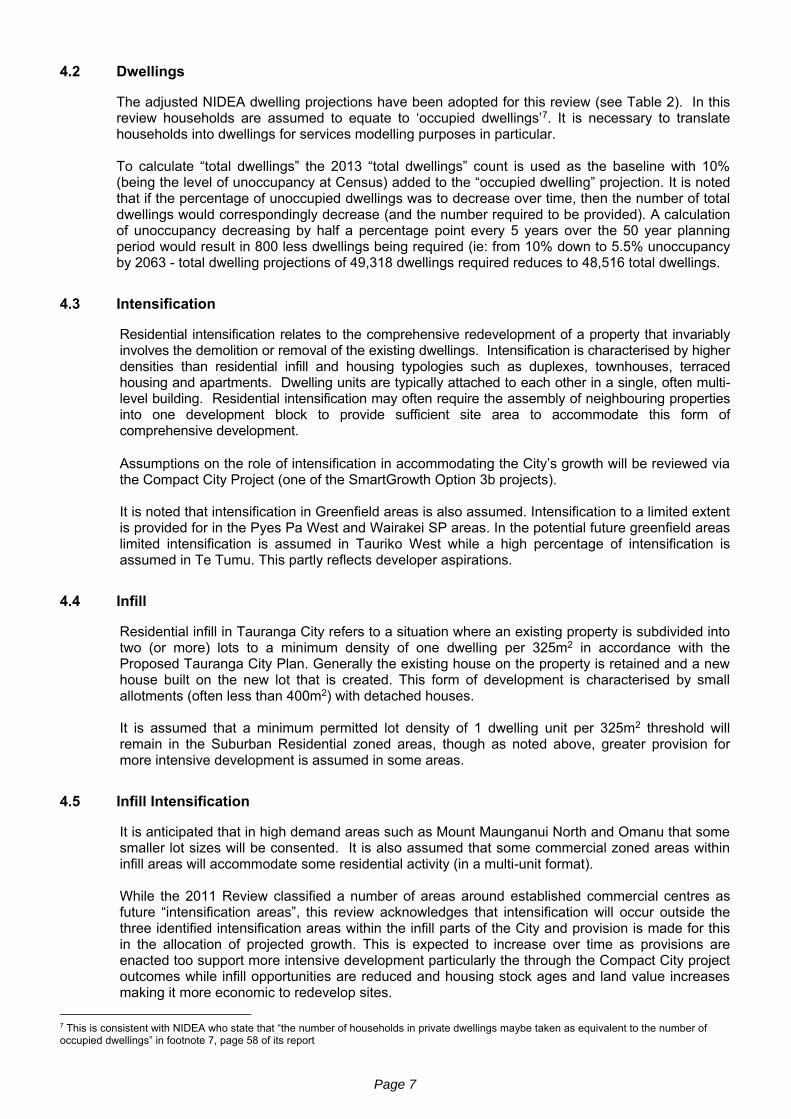
4.2 Dwellings
The adjusted NIDEA dwelling projections have been adopted for this review (see Table 2). In this review households are assumed to equate to ‘occupied dwellings’7. It is necessary to translate households into dwellings for services modelling purposes in particular. To calculate “total dwellings” the 2013 “total dwellings” count is used as the baseline with 10% (being the level of unoccupancy at Census) added to the “occupied dwelling” projection. It is noted that if the percentage of unoccupied dwellings was to decrease over time, then the number of total dwellings would correspondingly decrease (and the number required to be provided). A calculation of unoccupancy decreasing by half a percentage point every 5 years over the 50 year planning period would result in 800 less dwellings being required (ie: from 10% down to 5.5% unoccupancy by 2063 - total dwelling projections of 49,318 dwellings required reduces to 48,516 total dwellings.
4.3 Intensification
Residential intensification relates to the comprehensive redevelopment of a property that invariably involves the demolition or removal of the existing dwellings. Intensification is characterised by higher densities than residential infill and housing typologies such as duplexes, townhouses, terraced housing and apartments. Dwelling units are typically attached to each other in a single, often multi-level building. Residential intensification may often require the assembly of neighbouring properties into one development block to provide sufficient site area to accommodate this form of comprehensive development. Assumptions on the role of intensification in accommodating the City’s growth will be reviewed via the Compact City Project (one of the SmartGrowth Option 3b projects). It is noted that intensification in Greenfield areas is also assumed. Intensification to a limited extent is provided for in the Pyes Pa West and Wairakei SP areas. In the potential future greenfield areas limited intensification is assumed in Tauriko West while a high percentage of intensification is assumed in Te Tumu. This partly reflects developer aspirations.
4.4 Infill
Residential infill in Tauranga City refers to a situation where an existing property is subdivided into two (or more) lots to a minimum density of one dwelling per 325m2 in accordance with the Proposed Tauranga City Plan. Generally the existing house on the property is retained and a new house built on the new lot that is created. This form of development is characterised by small allotments (often less than 400m2) with detached houses. It is assumed that a minimum permitted lot density of 1 dwelling unit per 325m2 threshold will remain in the Suburban Residential zoned areas, though as noted above, greater provision for more intensive development is assumed in some areas.
4.5 Infill Intensification
It is anticipated that in high demand areas such as Mount Maunganui North and Omanu that some smaller lot sizes will be consented. It is also assumed that some commercial zoned areas within infill areas will accommodate some residential activity (in a multi-unit format). While the 2011 Review classified a number of areas around established commercial centres as future “intensification areas”, this review acknowledges that intensification will occur outside the three identified intensification areas within the infill parts of the City and provision is made for this in the allocation of projected growth. This is expected to increase over time as provisions are enacted too support more intensive development particularly the through the Compact City project outcomes while infill opportunities are reduced and housing stock ages and land value increases making it more economic to redevelop sites.
7 This is consistent with NIDEA who state that “the number of households in private dwellings maybe taken as equivalent to the number of occupied dwellings” in footnote 7, page 58 of its report
Page 8
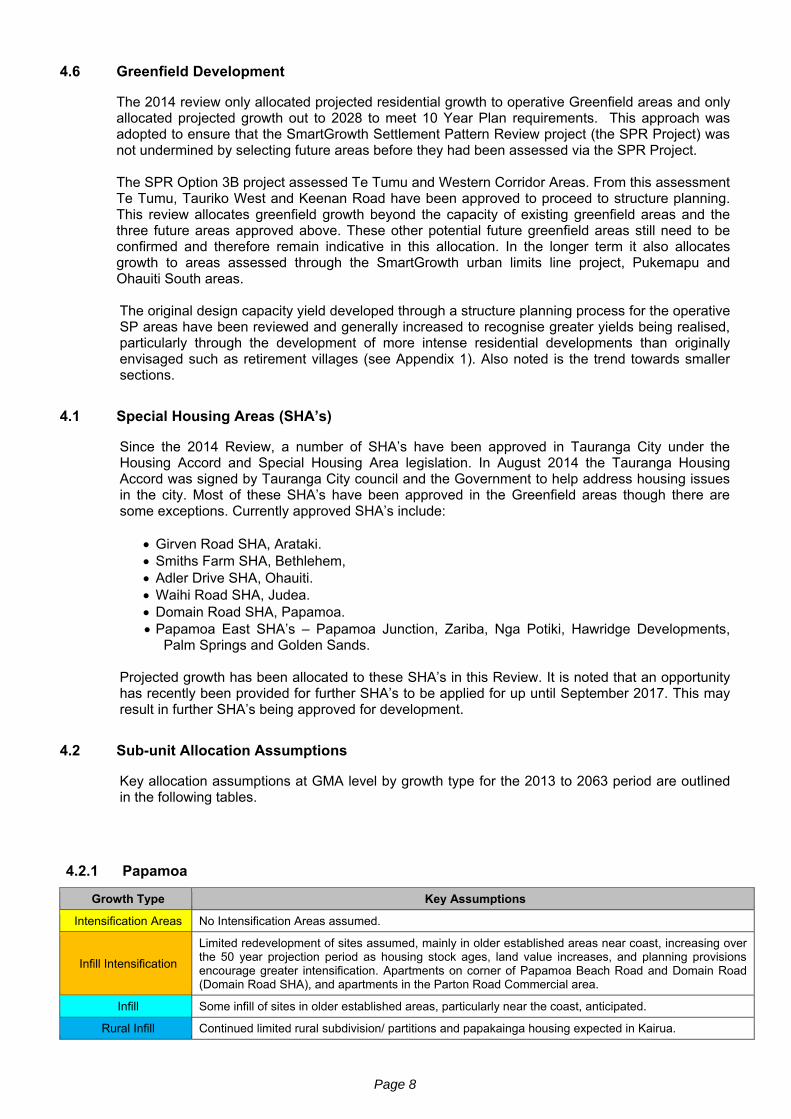
4.6 Greenfield Development
The 2014 review only allocated projected residential growth to operative Greenfield areas and only allocated projected growth out to 2028 to meet 10 Year Plan requirements. This approach was adopted to ensure that the SmartGrowth Settlement Pattern Review project (the SPR Project) was not undermined by selecting future areas before they had been assessed via the SPR Project. The SPR Option 3B project assessed Te Tumu and Western Corridor Areas. From this assessment Te Tumu, Tauriko West and Keenan Road have been approved to proceed to structure planning. This review allocates greenfield growth beyond the capacity of existing greenfield areas and the three future areas approved above. These other potential future greenfield areas still need to be confirmed and therefore remain indicative in this allocation. In the longer term it also allocates growth to areas assessed through the SmartGrowth urban limits line project, Pukemapu and Ohauiti South areas.
The original design capacity yield developed through a structure planning process for the operative SP areas have been reviewed and generally increased to recognise greater yields being realised, particularly through the development of more intense residential developments than originally envisaged such as retirement villages (see Appendix 1). Also noted is the trend towards smaller sections.
4.1 Special Housing Areas (SHA’s)
Since the 2014 Review, a number of SHA’s have been approved in Tauranga City under the Housing Accord and Special Housing Area legislation. In August 2014 the Tauranga Housing Accord was signed by Tauranga City council and the Government to help address housing issues in the city. Most of these SHA’s have been approved in the Greenfield areas though there are some exceptions. Currently approved SHA’s include:
Girven Road SHA, Arataki. Smiths Farm SHA, Bethlehem, Adler Drive SHA, Ohauiti. Waihi Road SHA, Judea. Domain Road SHA, Papamoa. Papamoa East SHA’s – Papamoa Junction, Zariba, Nga Potiki, Hawridge Developments,
Palm Springs and Golden Sands.
Projected growth has been allocated to these SHA’s in this Review. It is noted that an opportunity has recently been provided for further SHA’s to be applied for up until September 2017. This may result in further SHA’s being approved for development.
4.2 Sub-unit Allocation Assumptions
Key allocation assumptions at GMA level by growth type for the 2013 to 2063 period are outlined in the following tables.
4.2.1 Papamoa
Growth Type Key Assumptions
Intensification Areas No Intensification Areas assumed.
Infill Intensification
Limited redevelopment of sites assumed, mainly in older established areas near coast, increasing over the 50 year projection period as housing stock ages, land value increases, and planning provisions encourage greater intensification. Apartments on corner of Papamoa Beach Road and Domain Road (Domain Road SHA), and apartments in the Parton Road Commercial area.
Infill Some infill of sites in older established areas, particularly near the coast, anticipated.
Rural Infill Continued limited rural subdivision/ partitions and papakainga housing expected in Kairua.
Page 9
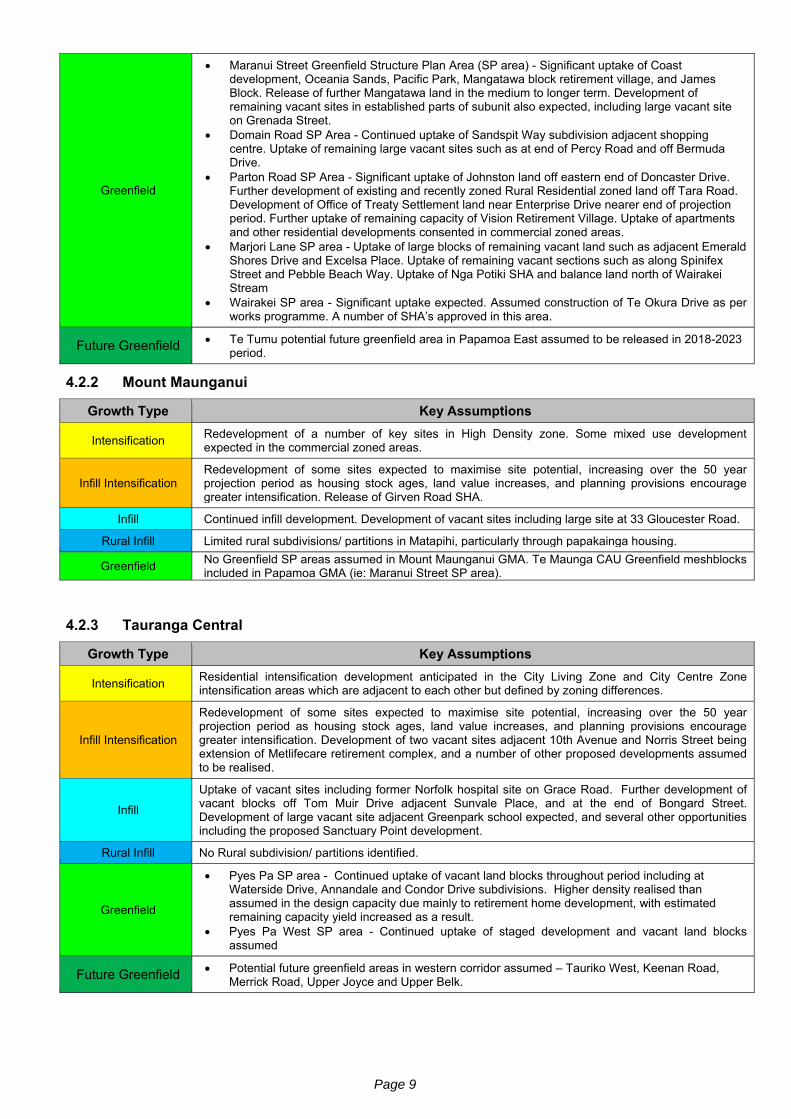
Greenfield
Maranui Street Greenfield Structure Plan Area (SP area) - Significant uptake of Coast development, Oceania Sands, Pacific Park, Mangatawa block retirement village, and James Block. Release of further Mangatawa land in the medium to longer term. Development of remaining vacant sites in established parts of subunit also expected, including large vacant site on Grenada Street.
Domain Road SP Area - Continued uptake of Sandspit Way subdivision adjacent shopping centre. Uptake of remaining large vacant sites such as at end of Percy Road and off Bermuda Drive.
Parton Road SP Area - Significant uptake of Johnston land off eastern end of Doncaster Drive. Further development of existing and recently zoned Rural Residential zoned land off Tara Road. Development of Office of Treaty Settlement land near Enterprise Drive nearer end of projection period. Further uptake of remaining capacity of Vision Retirement Village. Uptake of apartments and other residential developments consented in commercial zoned areas.
Marjori Lane SP area - Uptake of large blocks of remaining vacant land such as adjacent Emerald Shores Drive and Excelsa Place. Uptake of remaining vacant sections such as along Spinifex Street and Pebble Beach Way. Uptake of Nga Potiki SHA and balance land north of Wairakei Stream
Wairakei SP area - Significant uptake expected. Assumed construction of Te Okura Drive as per works programme. A number of SHA’s approved in this area.
Future Greenfield Te Tumu potential future greenfield area in Papamoa East assumed to be released in 2018-2023 period.
4.2.2 Mount Maunganui
Growth Type Key Assumptions
Intensification Redevelopment of a number of key sites in High Density zone. Some mixed use development expected in the commercial zoned areas.
Infill Intensification Redevelopment of some sites expected to maximise site potential, increasing over the 50 year projection period as housing stock ages, land value increases, and planning provisions encourage greater intensification. Release of Girven Road SHA.
Infill Continued infill development. Development of vacant sites including large site at 33 Gloucester Road. Rural Infill Limited rural subdivisions/ partitions in Matapihi, particularly through papakainga housing.
Greenfield No Greenfield SP areas assumed in Mount Maunganui GMA. Te Maunga CAU Greenfield meshblocks included in Papamoa GMA (ie: Maranui Street SP area).
4.2.3 Tauranga Central
Growth Type Key Assumptions
Intensification Residential intensification development anticipated in the City Living Zone and City Centre Zone intensification areas which are adjacent to each other but defined by zoning differences.
Infill Intensification
Redevelopment of some sites expected to maximise site potential, increasing over the 50 year projection period as housing stock ages, land value increases, and planning provisions encourage greater intensification. Development of two vacant sites adjacent 10th Avenue and Norris Street being extension of Metlifecare retirement complex, and a number of other proposed developments assumed to be realised.
Infill
Uptake of vacant sites including former Norfolk hospital site on Grace Road. Further development of vacant blocks off Tom Muir Drive adjacent Sunvale Place, and at the end of Bongard Street. Development of large vacant site adjacent Greenpark school expected, and several other opportunities including the proposed Sanctuary Point development.
Rural Infill No Rural subdivision/ partitions identified.
Greenfield
Pyes Pa SP area - Continued uptake of vacant land blocks throughout period including at Waterside Drive, Annandale and Condor Drive subdivisions. Higher density realised than assumed in the design capacity due mainly to retirement home development, with estimated remaining capacity yield increased as a result.
Pyes Pa West SP area - Continued uptake of staged development and vacant land blocks assumed
Future Greenfield Potential future greenfield areas in western corridor assumed – Tauriko West, Keenan Road, Merrick Road, Upper Joyce and Upper Belk.
Page 10
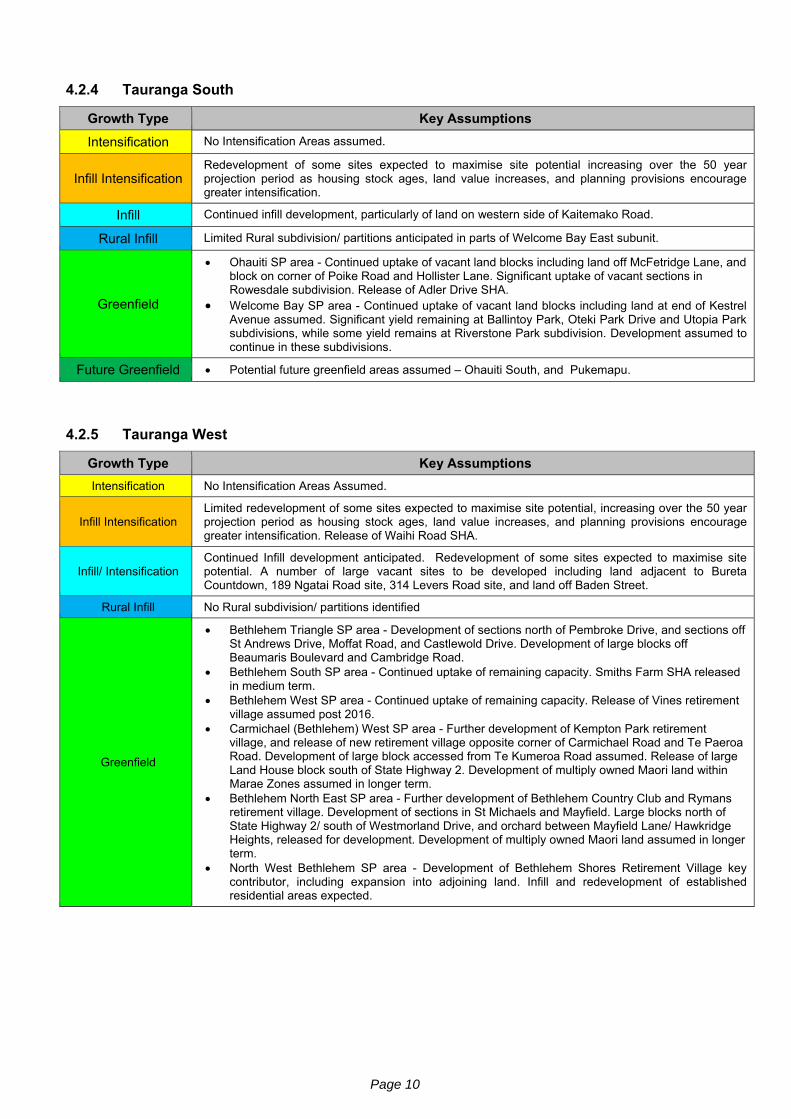
4.2.4 Tauranga South
Growth Type Key Assumptions
Intensification No Intensification Areas assumed.
Infill Intensification Redevelopment of some sites expected to maximise site potential increasing over the 50 year projection period as housing stock ages, land value increases, and planning provisions encourage greater intensification.
Infill Continued infill development, particularly of land on western side of Kaitemako Road.
Rural Infill Limited Rural subdivision/ partitions anticipated in parts of Welcome Bay East subunit.
Greenfield
Ohauiti SP area - Continued uptake of vacant land blocks including land off McFetridge Lane, and block on corner of Poike Road and Hollister Lane. Significant uptake of vacant sections in Rowesdale subdivision. Release of Adler Drive SHA.
Welcome Bay SP area - Continued uptake of vacant land blocks including land at end of Kestrel Avenue assumed. Significant yield remaining at Ballintoy Park, Oteki Park Drive and Utopia Park subdivisions, while some yield remains at Riverstone Park subdivision. Development assumed to continue in these subdivisions.
Future Greenfield Potential future greenfield areas assumed – Ohauiti South, and Pukemapu.
4.2.5 Tauranga West
Growth Type Key Assumptions Intensification No Intensification Areas Assumed.
Infill Intensification Limited redevelopment of some sites expected to maximise site potential, increasing over the 50 year projection period as housing stock ages, land value increases, and planning provisions encourage greater intensification. Release of Waihi Road SHA.
Infill/ Intensification Continued Infill development anticipated. Redevelopment of some sites expected to maximise site potential. A number of large vacant sites to be developed including land adjacent to Bureta Countdown, 189 Ngatai Road site, 314 Levers Road site, and land off Baden Street.
Rural Infill No Rural subdivision/ partitions identified
Greenfield
Bethlehem Triangle SP area - Development of sections north of Pembroke Drive, and sections off St Andrews Drive, Moffat Road, and Castlewold Drive. Development of large blocks off Beaumaris Boulevard and Cambridge Road.
Bethlehem South SP area - Continued uptake of remaining capacity. Smiths Farm SHA released in medium term.
Bethlehem West SP area - Continued uptake of remaining capacity. Release of Vines retirement village assumed post 2016.
Carmichael (Bethlehem) West SP area - Further development of Kempton Park retirement village, and release of new retirement village opposite corner of Carmichael Road and Te Paeroa Road. Development of large block accessed from Te Kumeroa Road assumed. Release of large Land House block south of State Highway 2. Development of multiply owned Maori land within Marae Zones assumed in longer term.
Bethlehem North East SP area - Further development of Bethlehem Country Club and Rymans retirement village. Development of sections in St Michaels and Mayfield. Large blocks north of State Highway 2/ south of Westmorland Drive, and orchard between Mayfield Lane/ Hawkridge Heights, released for development. Development of multiply owned Maori land assumed in longer term.
North West Bethlehem SP area - Development of Bethlehem Shores Retirement Village key contributor, including expansion into adjoining land. Infill and redevelopment of established residential areas expected.

Page 11
5 Revised Projection Allocations 2013-2063
5.1 General Overview
As outlined in Table 4 , at 2013 Tauranga City accommodated 72% of the Subregion’s population, by 2033 it is projected to increase to 74%, and by 2063 to 77%.
Table 4: Western Bay of Plenty Sub-Region Projected Population Allocation.
Year
Population
TCC WBOPDC Sub-Region
Projection Subregion % Projection Subregion % 2013 119,800 72% 46,110 28% 165,910 2033 164,085 74% 57,516 26% 221,601 2063 198,373 77% 60,608 23% 258,980
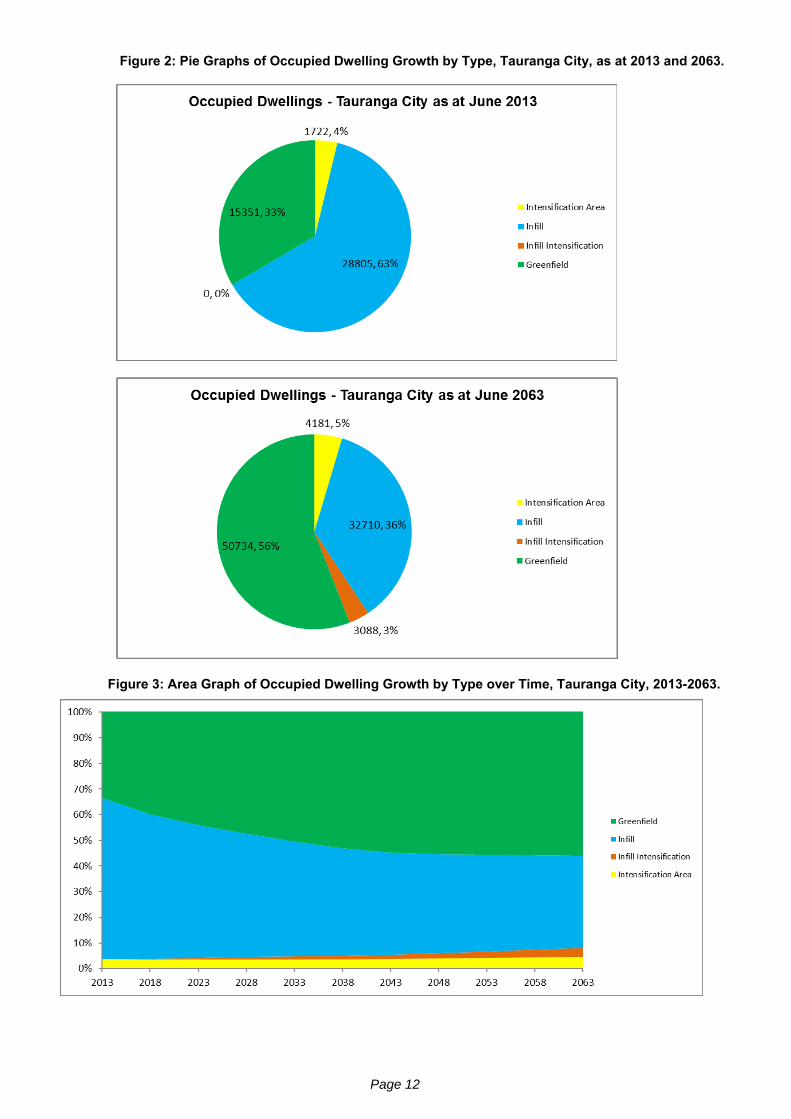
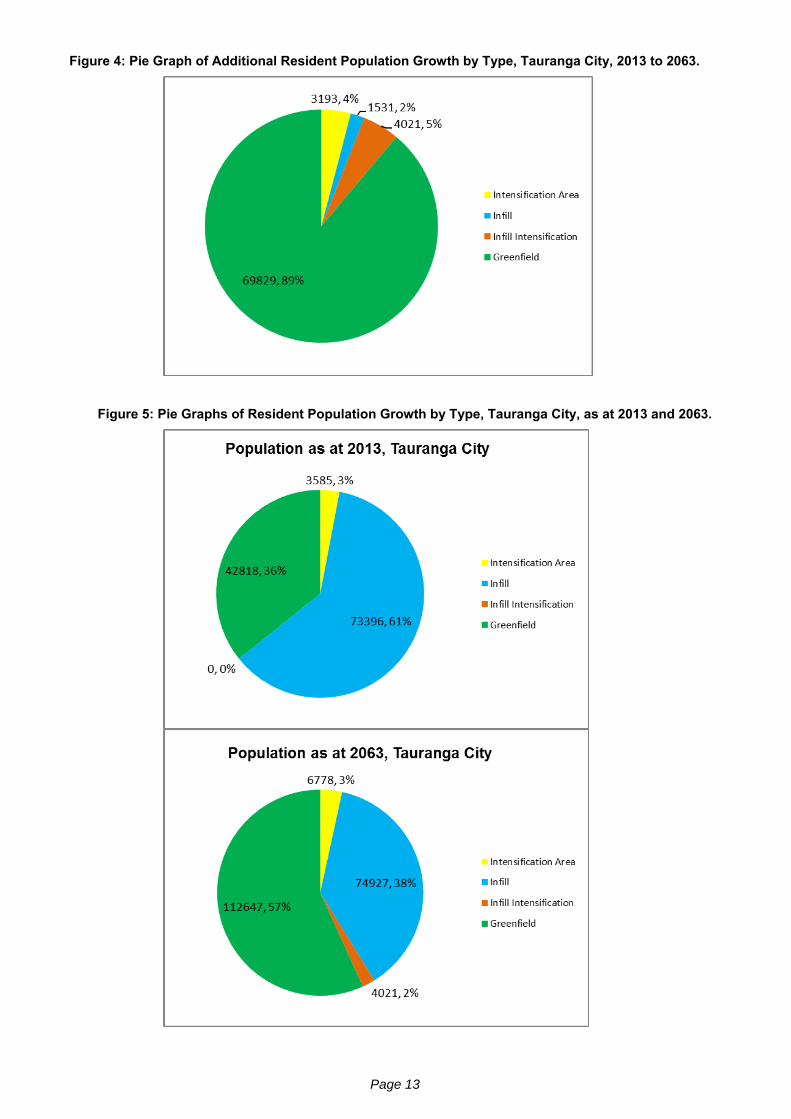
Figures 1 and 4 outline additional occupied dwelling and resident population by growth type. Figures 2 and 5 outline total occupied dwelling and resident population by growth type as at 2013 and as projected at 2063. Figures 3 and 6 illustrate assumed change over the 50 year projection period. These allocations are provided at GMA sub-unit level (Appendix 1), at statistical meshblock level (Appendix 4), and at CAU level (Appendix 5).
By 2033 it is projected that Tauranga’s population will be 164,085 people and Tauranga’s occupied dwelling count is projected to be 70,117 occupied dwellings, an increase of 24,299 (or +53%) on the occupied dwellings at June 2013.
Figure 1: Pie Graph of Additional Occupied Dwelling Growth by Type, Tauranga City, 2013 to 2063
Page 12
Figure 2: Pie Graphs of Occupied Dwelling Growth by Type, Tauranga City, as at 2013 and 2063.
Figure 3: Area Graph of Occupied Dwelling Growth by Type over Time, Tauranga City, 2013-2063.
Page 13
Figure 4: Pie Graph of Additional Resident Population Growth by Type, Tauranga City, 2013 to 2063.
Figure 5: Pie Graphs of Resident Population Growth by Type, Tauranga City, as at 2013 and 2063.
Page 14
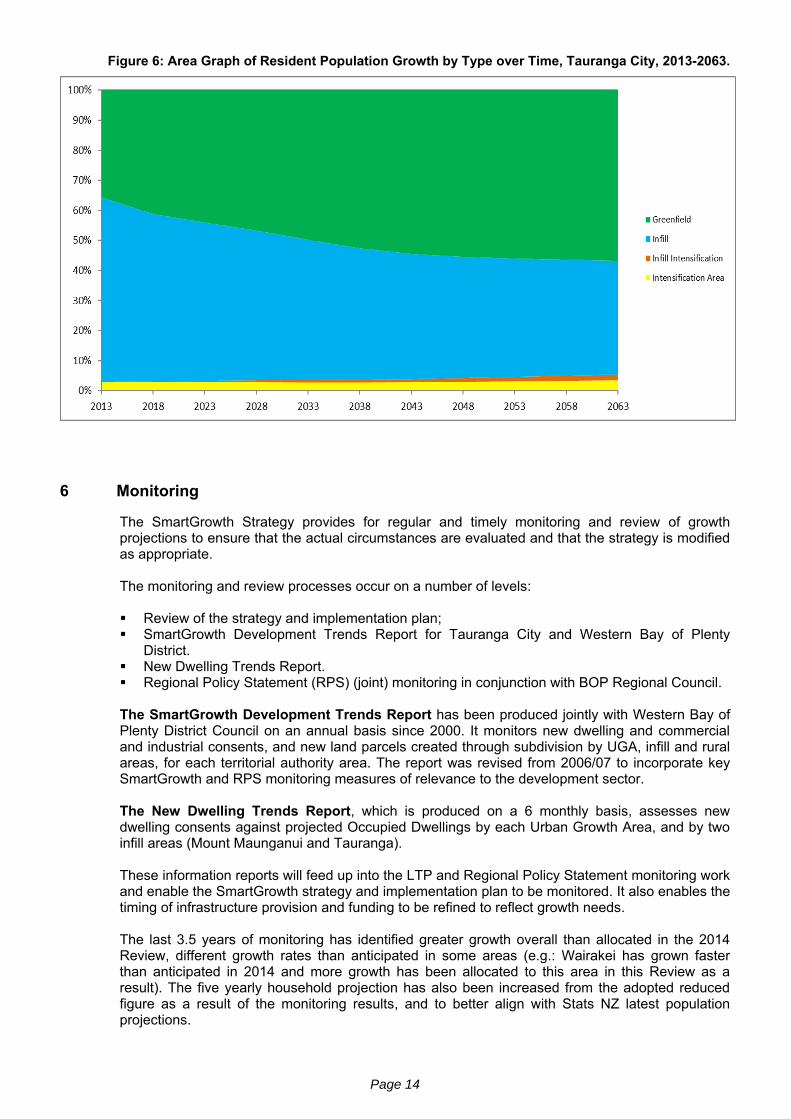
Figure 6: Area Graph of Resident Population Growth by Type over Time, Tauranga City, 2013-2063.
6 Monitoring
The SmartGrowth Strategy provides for regular and timely monitoring and review of growth projections to ensure that the actual circumstances are evaluated and that the strategy is modified as appropriate.
The monitoring and review processes occur on a number of levels:
Review of the strategy and implementation plan; SmartGrowth Development Trends Report for Tauranga City and Western Bay of Plenty
District. New Dwelling Trends Report. Regional Policy Statement (RPS) (joint) monitoring in conjunction with BOP Regional Council.
The SmartGrowth Development Trends Report has been produced jointly with Western Bay of Plenty District Council on an annual basis since 2000. It monitors new dwelling and commercial and industrial consents, and new land parcels created through subdivision by UGA, infill and rural areas, for each territorial authority area. The report was revised from 2006/07 to incorporate key SmartGrowth and RPS monitoring measures of relevance to the development sector.
The New Dwelling Trends Report, which is produced on a 6 monthly basis, assesses new dwelling consents against projected Occupied Dwellings by each Urban Growth Area, and by two infill areas (Mount Maunganui and Tauranga).
These information reports will feed up into the LTP and Regional Policy Statement monitoring work and enable the SmartGrowth strategy and implementation plan to be monitored. It also enables the timing of infrastructure provision and funding to be refined to reflect growth needs.
The last 3.5 years of monitoring has identified greater growth overall than allocated in the 2014 Review, different growth rates than anticipated in some areas (e.g.: Wairakei has grown faster than anticipated in 2014 and more growth has been allocated to this area in this Review as a result). The five yearly household projection has also been increased from the adopted reduced figure as a result of the monitoring results, and to better align with Stats NZ latest population projections.
Page 15
The National Policy Statement on Urban Development Capacity (the NPS), The NPS, which was given effect on 1 December 2016 includes a raft of monitoring measures in respect to both residential and business land development capacity and availability. Council’s monitoring regime is currently being reviewed in response to this new legislation which may result in changes to the monitoring programme outlined above.
7 Conclusions
The projected population and dwelling increases for Tauranga City to 2063 are significant. A review of the SmartGrowth population and household projection and its allocation is expected late 2018/ early 2019 following the release of 2018 Census results.
The importance of ongoing and accurate growth monitoring is essential to ensure decisions are founded on the best information. This Review endeavours to provide an indication of how much, where and when development is likely to occur in the city over the 50 year projection period. Ongoing monitoring will provide a measure of the accuracy of these allocations, in the absence of actual counts which will be available at the end of each Census cycle. Census results will signal where any further realignment is required to address the “unders and overs” inherent in this type of work.
This is also important for Tauranga City Council as it endeavours to balance growth management with financial management through its Long Term Plan and strategic planning.
8 Appendices
Appendix 1: Growth Management Area and Sub-Unit Projections, 2013-2063.
Appendix 2: Growth Management Area and Sub-Unit Map.
Appendix 3: Growth Management Area, Sub-Unit and Meshblock Map Series.
Appendix 4: Meshblock Allocation of SmartGrowth Projections – 2013-2043.
Appendix 5: Census Area Unit Allocation of SmartGrowth Projections – 2013-2063.
Appendix 6: Census Area Unit Map, 2013.