Embed Size (px)
Citation preview
G P SIonospheric
E r r o r
Student:Tatiana Quercia
Space Environment and Instrumentation, Prof. L. Iess, Sept. 2014

Agenda
● GPS● Ionospheric error● Computation example● Single frequency users' correction

GPSGlobal Positioning System (USA, 1978)
32 satellites in 6 different orbital planes
Correlation between TX and RX signals based on a code
Globally available since 1994

TT
T
RXisatisatisati
RXTXRX
TXTXRXRX
GGGX
XG
xxx
tczzyyxx
tcttc
ttttc
1
RX
j
iij
i
i2
,2
,2
,
:onminimizatiroot square Using
)tz,y,(x,X and X̂
fG being
:orderfirst the tillseries sTaylor'by f expanding and
ˆ :relationssuch gConsiderin
least)at 1,...,4(i f̂)ˆ()ˆ()ˆ(ˆ
)(
)( Pseudorange (observable); δtTX
<< ΔtRX
^: estimation
Δ: correction

Ionospheric errorIonosphere: From about 85 km to 600 km altitude (upper atmosphere)
Ionization of neutrals/molecules by UV rays, X rays or cosmic rays
Plasma state with diurnal variation of density
Plasma produces refraction of electromagnetic wavesIonospheric refraction model: vertical layers
density electrons theN(h) being
medium dispersive a is Ionosphere [km] 0 )(6.80
1
0 1
)(
index refractive :
2
hf
hN
h
hn
v
cn
222
2
22
2
2
3.401
3.402
3.401
3.402
3.401
3.401
:
f
N
c
N
c
Nn
c
N
d
dn
c
N
f
Nn
d
dnnn
g
g
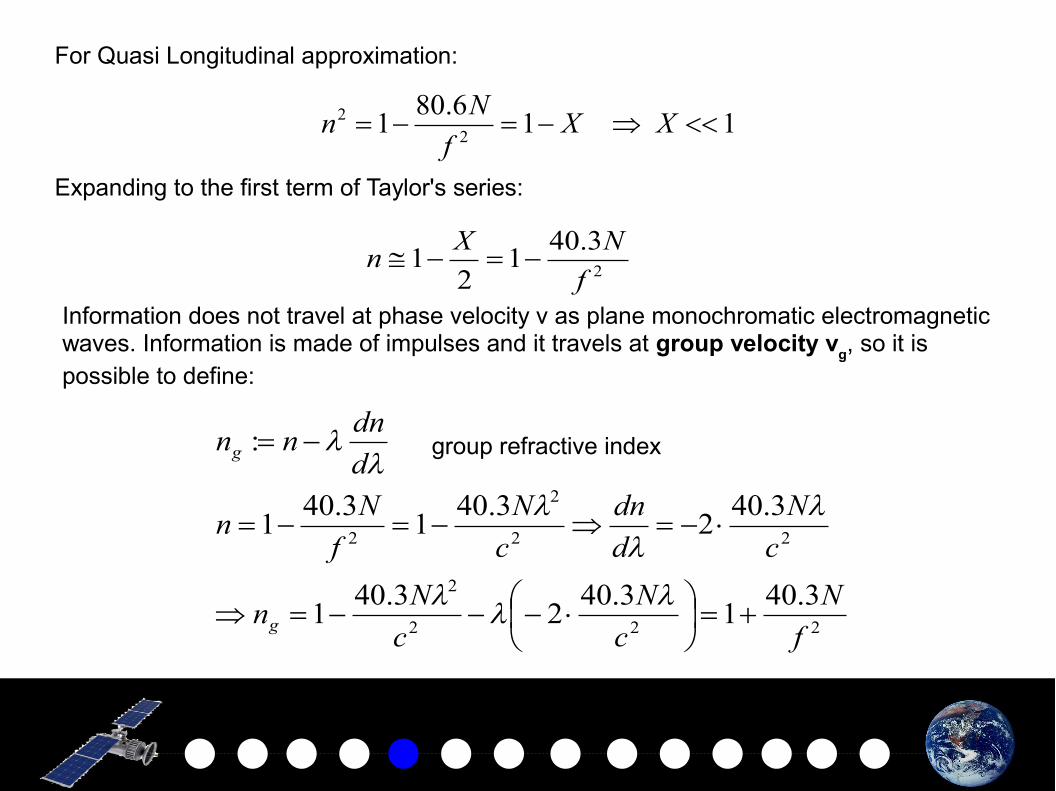
For Quasi Longitudinal approximation:
1 16.80
12
2 XXf
Nn
Expanding to the first term of Taylor's series:
2
3.401
21
f
NXn
Information does not travel at phase velocity v as plane monochromatic electromagnetic waves. Information is made of impulses and it travels at group velocity v
g, so it is
possible to define:
group refractive index

Then the range difference due to ionospheric delay can be computed in two ways:
Content Electron Total :TEC
]/m[electrons[N]
signal) (modulated vofdown slow TEC3.40
)1(
ave)(carrier w vofon acceleratiTEC3.403.40
)1(
3
g2
22
RX
Sat
ggroupiono
RX
Sat
RX
Sat
phaseiono
fdrnR
fNdr
fdrnR
If the propagation is not along the zenith, then the factor of obliquity 1/sinΦ must be pre-multiplied.
[1]
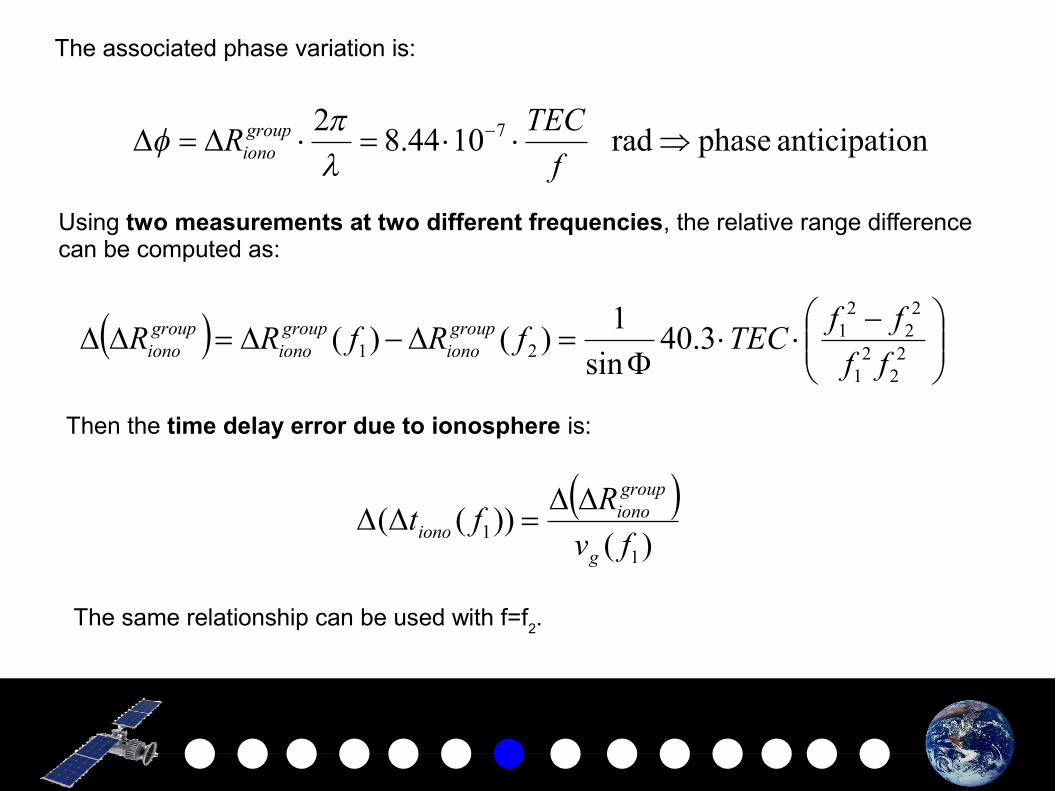
The associated phase variation is:
onanticipati phaserad 1044.82 7
f
TECR group
iono
Using two measurements at two different frequencies, the relative range difference can be computed as:
22
21
22
21
21 3.40sin
1)()(
ff
ffTECfRfRR group
ionogroupiono
groupiono
Then the time delay error due to ionosphere is:
)(
))((1
1 fv
Rft
g
groupiono
iono
The same relationship can be used with f=f2.

Computation example
example 45
sfrequencieion transmissGPS 1227
1575
22
11
MHzLf
MHzLf

312 /10)layer F2( melectronsN
[3]

216 /1020TECu 20) UT55:17 ,08/19/2014 ,( melectronsEuropeTEC
[2]

ns 10))t(L(
m 3)(
1 group
ionoR
1000032.0
00002.1)( 1
X
Lng

Single Frequency Users' Correction
Empirical approach [Klobuchar, 1987]
Reduction of about the 50% RMS ionospheric range error worldwide
Assumption: electron content is concentrated in a thin layer at 350 kilometres in height
Model:● constant value at night time● half-cosine function in daytime● amplitude and period given as function of eight parameters● parameters broadcast in the GPS navigation message

[4]

[4]

Bibliography[1] Iess, L. - Class notes - www.radioscience.dima.uniroma1.it[2] NASA JPL – Real-Time Ionospheric Maps - www.iono.jpl.nasa.gov[3] INGV- Ionosphere - www.roma2.rm.ingv.it[4] ESA – Klobuchar Ionospheric Model – www.navipedia.net


