Embed Size (px)
Citation preview
CMP 1825.00
Target Price 2100.00
ISIN: INE670A01012
OCTOBER 31st
, 2015
TATA ELXSI LIMITED
Result Update (PARENT BASIS): Q2 FY16
BUYBUYBUYBUY
Index Details
Stock Data
Sector IT Software products
BSE Code 500408
Face Value 10.00
52wk. High / Low (Rs.) 2317.00/551.10
Volume (2wk. Avg.) 174000
Market Cap (Rs. in mn.) 56826.85
Annual Estimated Results (A*: Actual / E*: Estimated)
YEARS FY15A FY16E FY17E
Net Sales 8494.01 10651.49 12142.70
EBITDA 1815.17 2531.55 2970.29
Net Profit 1028.99 1507.54 1790.98
EPS 33.05 48.41 57.52
P/E 55.23 37.70 31.73
Shareholding Pattern (%)
As on Sep 2015 As on Jun 2015
PROMOTER 44.95 44.95
FIIs 10.60 8.38
DIIs 3.34 3.89
OTHERS 41.11 42.78
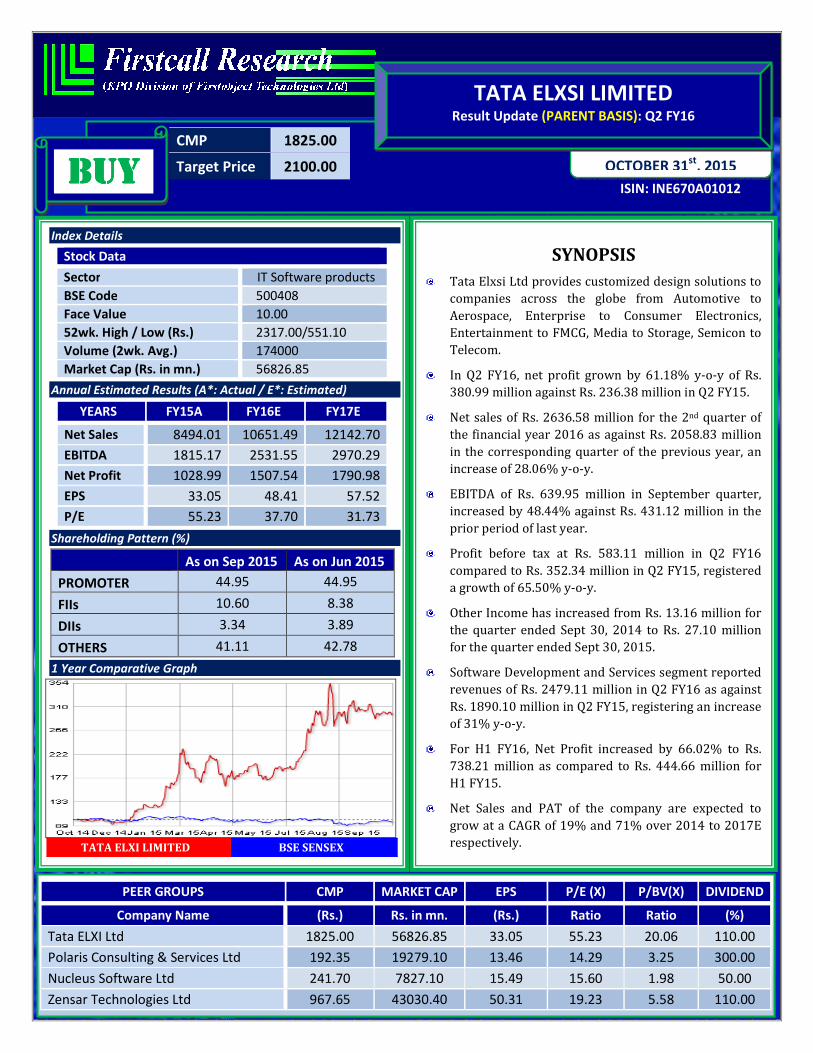
1 Year Comparative Graph
TATA ELXI LIMITED BSE SENSEX
SYNOPSIS
Tata Elxsi Ltd provides customized design solutions to
companies across the globe from Automotive to
Aerospace, Enterprise to Consumer Electronics,
Entertainment to FMCG, Media to Storage, Semicon to
Telecom.
In Q2 FY16, net profit grown by 61.18% y-o-y of Rs.
380.99 million against Rs. 236.38 million in Q2 FY15.
Net sales of Rs. 2636.58 million for the 2nd quarter of
the financial year 2016 as against Rs. 2058.83 million
in the corresponding quarter of the previous year, an
increase of 28.06% y-o-y.
EBITDA of Rs. 639.95 million in September quarter,
increased by 48.44% against Rs. 431.12 million in the
prior period of last year.
Profit before tax at Rs. 583.11 million in Q2 FY16
compared to Rs. 352.34 million in Q2 FY15, registered
a growth of 65.50% y-o-y.
Other Income has increased from Rs. 13.16 million for
the quarter ended Sept 30, 2014 to Rs. 27.10 million
for the quarter ended Sept 30, 2015.
Software Development and Services segment reported
revenues of Rs. 2479.11 million in Q2 FY16 as against
Rs. 1890.10 million in Q2 FY15, registering an increase
of 31% y-o-y.
For H1 FY16, Net Profit increased by 66.02% to Rs.
738.21 million as compared to Rs. 444.66 million for
H1 FY15.
Net Sales and PAT of the company are expected to
grow at a CAGR of 19% and 71% over 2014 to 2017E
respectively.
PEER GROUPS CMP MARKET CAP EPS P/E (X) P/BV(X) DIVIDEND
Company Name (Rs.) Rs. in mn. (Rs.) Ratio Ratio (%)
Tata ELXI Ltd 1825.00 56826.85 33.05 55.23 20.06 110.00
Polaris Consulting & Services Ltd 192.35 19279.10 13.46 14.29 3.25 300.00
Nucleus Software Ltd 241.70 7827.10 15.49 15.60 1.98 50.00
Zensar Technologies Ltd 967.65 43030.40 50.31 19.23 5.58 110.00
QUARTERLY HIGHLIGHTS (PARENT BASIS)
Results updates- Q2 FY16,
Tata Elxsi, a design company focusing on a mix of
engineering, creativity and technology based in
India, has seen impressive growth this year and is
looking to continue expanding by gaining a stronger
presence in broadcasting. Reported its financial
result for the quarter ended 30th September, 2015.
The company has achieved a turnover of Rs. 2636.58 million for the 2nd quarter of the financial year 2016 as
against Rs. 2058.83 million in the corresponding quarter of the previous year, an increase of 28.06% y-o-y. In Q2
FY16, net profit grown by 61.18% y-o-y of Rs. 380.99 million against Rs. 236.38 million in Q2 FY15. EBITDA of
Rs. 639.95 million in September quarter, increased by 48.44% against Rs. 431.12 million in the prior period of
last year. The company has reported an EPS of Rs. 12.24 for the September quarter as against an EPS of Rs. 7.59
in the corresponding quarter of the previous year.
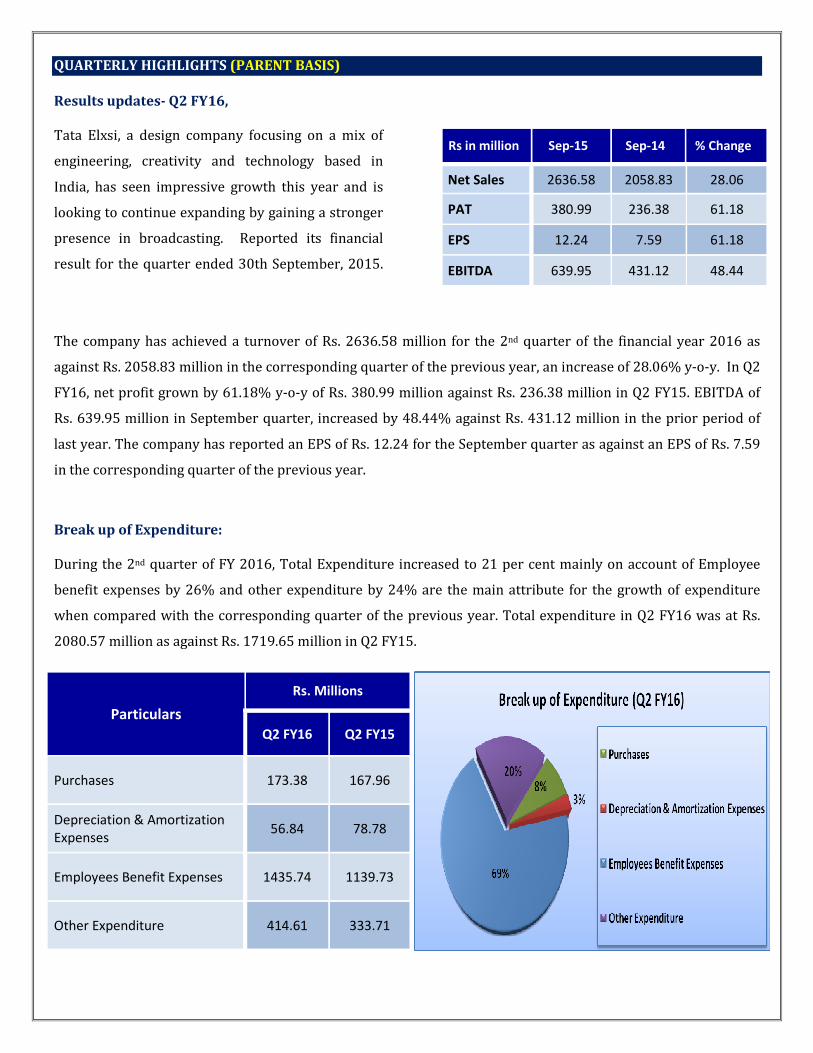
Break up of Expenditure:
During the 2nd quarter of FY 2016, Total Expenditure increased to 21 per cent mainly on account of Employee
benefit expenses by 26% and other expenditure by 24% are the main attribute for the growth of expenditure
when compared with the corresponding quarter of the previous year. Total expenditure in Q2 FY16 was at Rs.
2080.57 million as against Rs. 1719.65 million in Q2 FY15.
Particulars
Rs. Millions
Q2 FY16 Q2 FY15
Purchases 173.38 167.96
Depreciation & Amortization
Expenses 56.84 78.78
Employees Benefit Expenses 1435.74 1139.73
Other Expenditure 414.61 333.71
Rs in million Sep-15 Sep-14 % Change
Net Sales 2636.58 2058.83 28.06
PAT 380.99 236.38 61.18
EPS 12.24 7.59 61.18
EBITDA 639.95 431.12 48.44
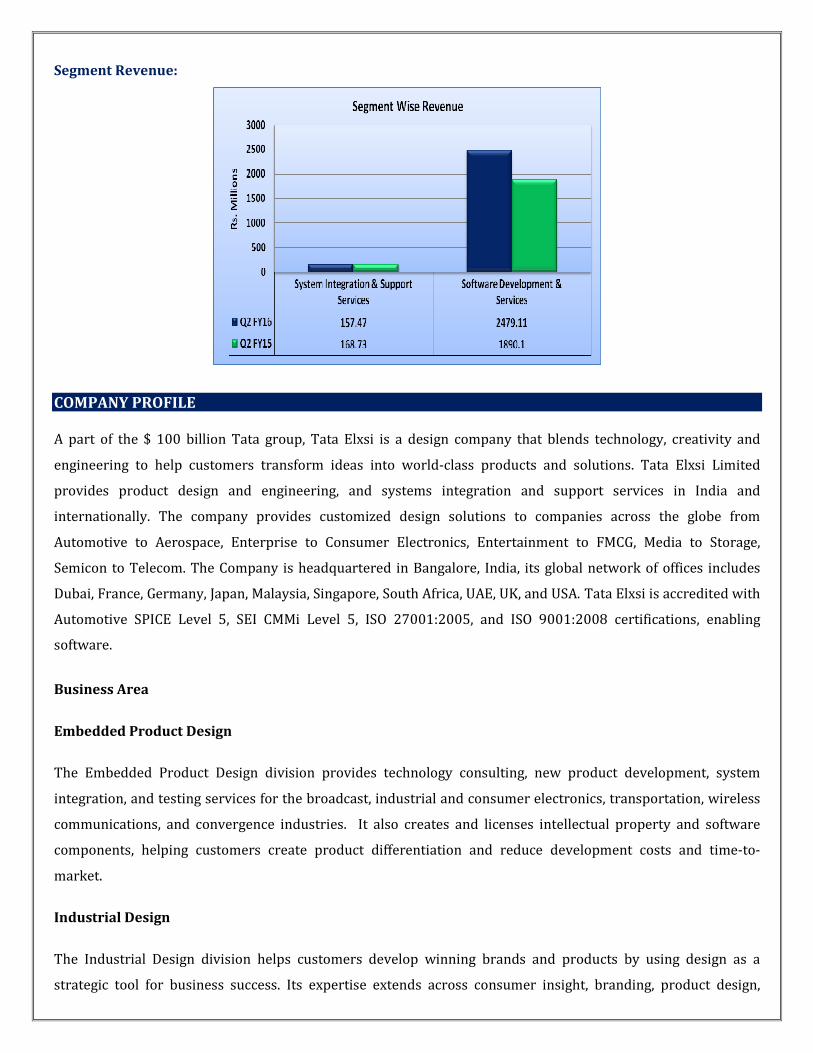
Segment Revenue:
COMPANY PROFILE
A part of the $ 100 billion Tata group, Tata Elxsi is a design company that blends technology, creativity and
engineering to help customers transform ideas into world-class products and solutions. Tata Elxsi Limited
provides product design and engineering, and systems integration and support services in India and
internationally. The company provides customized design solutions to companies across the globe from
Automotive to Aerospace, Enterprise to Consumer Electronics, Entertainment to FMCG, Media to Storage,
Semicon to Telecom. The Company is headquartered in Bangalore, India, its global network of offices includes
Dubai, France, Germany, Japan, Malaysia, Singapore, South Africa, UAE, UK, and USA. Tata Elxsi is accredited with
Automotive SPICE Level 5, SEI CMMi Level 5, ISO 27001:2005, and ISO 9001:2008 certifications, enabling
software.
Business Area
Embedded Product Design
The Embedded Product Design division provides technology consulting, new product development, system
integration, and testing services for the broadcast, industrial and consumer electronics, transportation, wireless
communications, and convergence industries. It also creates and licenses intellectual property and software
components, helping customers create product differentiation and reduce development costs and time-to-
market.
Industrial Design
The Industrial Design division helps customers develop winning brands and products by using design as a
strategic tool for business success. Its expertise extends across consumer insight, branding, product design,
packaging design, transportation design, visual design, design engineering, and manufacturing support. This
division has worked with prestigious FMCG brands in packaging design. It has developed award-winning designs
in the food, beverage, personal and home care segments, for leading brands in India and Overseas.
Visual Computing Labs
Visual Computing Labs offers Animation, Visual Effects (VFX), and 3D stereoscopic content for feature films,
episodic television and advertising. It also offers custom content development for visualization and product
marketing, and is a leading provider of engineering and animation services for mobile, online and console games.
VCL has worked with leading international studios like FOX, Disney, Sony and Columbia Pictures, Industrial Light
& Magic, MGM, on some of their features including Jack The Giant Slayer, Gullivers Travels, The Darkest Hour,
Terminator 4, Ironman, Indiana Jones, Spiderman 3, Into the blue, Ghostrider, XXX 2 etc. VCL continues to
execute visual effects for a number of Bollywood films like Ra-One, New York, Prince, Rab Ne Bana DI Jodi, Drona,
Bachna Ae Haseeno, Jodhaa Akbar, Taare Zameen Par, Dhoom 2, Rang De Basanti and many more.
VCL has also worked on numerous television commercials for leading brands like Bisleri Mountain Water,
Videocon Innovation Labs, Panasonic Eco Navi, Samsung Mobile, Sony, Toyota Corolla Altis, Chevrolet, Honda, Elf
Moto, MSN, Nissin, Reebok, Lux, Kelloggs, Pillsbury, Coke, Colgate, Pepsi, Thums Up, Wrigley, Cheetos, Pillsbusy,
to name a few.

FINANCIAL HIGHLIGHT (PARENT BASIS) (A*- Actual, E* -Estimations & Rs. In Millions)
Balance Sheet as at March31, 2014 -2017E
TATA ELXSI LIMITED FY14A FY15A FY16E FY17E
I. EQUITY AND LIABILITIES:
A) Shareholders’ Funds:
a) Share Capital 311.38 311.38 311.38 311.38
b) Reserves and Surplus 2023.81 2522.13 3354.43 4075.64
Sub-Total-Net worth 2335.19 2833.51 3665.81 4387.02
B) Non-Current Liabilities:
a) Long-term borrowings 0.00 0.00 0.00 0.00
b) Deferred Tax Liabilities [Net] 68.40 0.00 0.00 0.00
c) Long Term Provisions 51.13 107.65 142.10 167.68
Sub-Total-Non-Current Liabilities 119.53 107.65 142.10 167.68
C) Current Liabilities:
a) Short-term borrowings 0.00 0.00 0.00 0.00
b) Trade Payables 653.62 661.07 682.22 695.87
c) Other Current Liabilities 336.43 477.85 539.97 581.01
d) Short Term Provisions 424.42 573.51 458.81 389.99
Sub-Total-Current Liabilities 1414.47 1712.43 1681.00 1666.86
TOTAL EQUITY AND LIABILITIES (A + B + C) 3869.19 4653.59 5488.91 6221.56
II. ASSETS:
D) Non-Current Liabilities:
Fixed Assets
i. Tangible Assets 700.69 755.13 868.40 972.61
ii. Intangible Assets 267.62 229.75 240.32 257.14
iii. Capital work-in-progress 95.97 22.27 19.60 17.64
iv. Intangible Asset under Development 30.24 3.59 8.90 11.49
a) Total Fixed Assets 1094.52 1010.74 1137.22 1258.87
b) Deferred tax assets 0.00 4.36 32.24 41.91
c) Non Current Investments 2.87 2.87 2.87 2.87
d) Long Term Loans and Advances 405.88 357.60 386.21 424.83
Sub-Total-Non-Current Liabilities 1503.27 1375.57 1558.54 1728.48
E) Current Assets:
a) Inventories 0.00 2.89 7.39 10.20
b) Trade Receivables 1555.77 1540.82 2064.70 2426.02
c) Cash and Bank Balances 498.23 1327.95 1257.66 1330.10
d) Short Term Loans and Advances 120.00 146.87 221.77 268.35
e) Other Current Assets 191.92 259.49 378.86 458.42
Sub-Total-Current Assets 2365.92 3278.02 3930.37 4493.08
TOTAL ASSETS (D + E) 3869.19 4653.59 5488.91 6221.56
Annual Profit & Loss Statement for the period of 2014 to 2017E
Value(Rs.in.mn) FY14A FY15A FY16E FY17E
Description 12m 12m 12m 12m
Net Sales 7720.98 8494.01 10651.49 12142.70
Other Income 156.84 41.40 134.96 159.26
Total Income 7877.82 8535.41 10786.45 12301.95
Expenditure -6359.83 -6720.24 -8254.90 -9331.66
Operating Profit 1517.99 1815.17 2531.55 2970.29
Interest -18.27 -0.03 -0.12 -0.21
Gross profit 1499.72 1815.14 2531.43 2970.09
Depreciation -349.87 -255.38 -229.84 -248.23
Profit Before Tax 1149.85 1559.76 2301.58 2721.86
Tax -398.78 -530.77 -794.05 -930.88
Net Profit 751.07 1028.99 1507.54 1790.98
Equity capital 311.38 311.38 311.38 311.38
Reserves 2023.81 2522.13 3354.43 4075.64
Face value 10.00 10.00 10.00 10.00
EPS 24.12 33.05 48.41 57.52
Quarterly Profit & Loss Statement for the period of 31st Mar, 2015 to 31st Dec, 2015E
Value(Rs.in.mn) 31-Mar-15 30-Jun-15 30-Sep-15 31-Dec-15E
Description 3m 3m 3m 3m
Net Sales 2312.76 2435.21 2636.58 2755.23
Other income -5.08 75.66 27.10 21.03
Total Income 2307.68 2510.87 2663.68 2776.26
Expenditure -1838.80 -1874.76 -2023.73 -2121.52
Operating profit 468.88 636.11 639.95 654.73
Interest -0.01 -0.08 0.00 0.00
Gross profit 468.87 636.03 639.95 654.73
Depreciation -14.08 -90.04 -56.84 -58.55
Profit Before Tax 454.79 545.99 583.11 596.19
Tax -156.43 -188.77 -202.12 -207.47
Net Profit 298.36 357.22 380.99 388.71
Equity capital 311.38 311.38 311.38 311.38
Face value 10.00 10.00 10.00 10.00
EPS 9.58 11.47 12.24 12.48

Ratio Analysis
Particulars FY14A FY15A FY16E FY17E
EPS (Rs.) 24.12 33.05 48.41 57.52
EBITDA Margin (%) 19.66 21.37 23.77 24.46
PBT Margin (%) 14.89 18.36 21.61 22.42
PAT Margin (%) 9.73 12.11 14.15 14.75
P/E Ratio (x) 75.66 55.23 37.70 31.73
ROE (%) 32.16 36.32% 41.12 40.82
ROCE (%) 79.99 73.07 75.33 73.36
EV/EBITDA (x) 37.11 30.58 21.95 18.68
Book Value (Rs.) 74.99 91.00 117.73 140.89
P/BV 24.34 20.06 15.50 12.95
Charts

OUTLOOK AND CONCLUSION
� At the current market price of Rs. 1825.00, the stock P/E ratio is at 37.70 x FY16E and 31.73 x FY17E
respectively.
� Earning per share (EPS) of the company for the earnings for FY16E and FY17E is seen at Rs.48.41 and
Rs.57.52 respectively.
� Net Sales and PAT of the company are expected to grow at a CAGR of 19% and 71% over 2014 to 2017E
respectively.
� On the basis of EV/EBITDA, the stock trades at 21.95 x for FY16E and 18.68 x for FY17E.
� Price to Book Value of the stock is expected to be at 15.50 x and 12.95 x respectively for FY16E and FY17E.
� We expect that the company surplus scenario is likely to continue for the next three years, will keep its
growth story in the coming quarters also. We recommend ‘BUY’ in this particular scrip with a target price of
Rs.2100.00 for Medium to Long term investment.
INDUSTRY OVERVIEW
India is the world's largest sourcing destination for the information technology (IT) industry, accounting for
approximately 52 per cent of the US$ 124-130 billion market. The industry employs about 10 million Indians and
continues to contribute significantly to the social and economic transformation in the country.
The Indian IT and ITeS industry is divided into four major segments – IT services, business process management
(BPM), software products and engineering services, and hardware.
The IT-BPM sector in India grew at a compound annual growth rate (CAGR) of 25 per cent over 2000-2013,
which is 3-4 times higher than the global IT-BPM spend, and is estimated to expand at a CAGR of 9.5 per cent to
US$ 300 billion by 2020. India has emerged as the fastest growing market for Dell globally and the third largest
market in terms of revenue after the US and China, as per Managing Director, Dell India.
Market Size
India, the fourth largest base for young businesses in the world and home to 3,000 tech start-ups, is set to
increase its base to 11,500 tech start-ups by 2020.
India’s internet economy is expected to touch Rs 10 trillion (US$ 161.26 billion) by 2018, accounting for 5 per
cent of the country’s gross domestic product (GDP), according to a report by the Boston Consulting Group (BCG)
and Internet and Mobile Association of India (IAMAI). In December 2014, India’s internet user base reached 300
million, the third largest in the world, while the number of social media users and smart phones grew to 100
million.
Public cloud services revenue in India is expected to reach US$ 838 million in 2015, growing by 33 per cent year-
on-year (y-o-y), as per a report by Gartner Inc. In yet another Gartner report, the public cloud market alone in the
country was estimated to treble to US$ 1.9 billion by 2018 from US$ 638 million in 2014. The increased internet
penetration and rise of e-commerce are the main reasons for continued growth of the data centre co-location and
hosting market in India.
Investments
Indian IT's core competencies and strengths have placed it on the international canvas, attracting investments
from major countries. The computer software and hardware sector in India attracted cumulative foreign direct
investment (FDI) inflows worth US$ 13,788.56 million between April 2000 and December 2014, according to
data released by the Department of Industrial Policy and Promotion (DIPP).
The private equity (PE) deals increased the number of mergers and acquisitions (M&A) especially in the e-
commerce space in 2014. The IT space, including e-commerce, witnessed 240 deals worth US$ 3.8 billion in
2014, as per data from Dealogic.
India also saw a ten-fold increase in the venture funding that went into internet companies in 2014 as compared
to 2013. More than 800 internet start-ups got funding in 2014 as compared to 200 in 2012, said Rajan Anandan,
Managing Director, Google India Pvt Ltd and Chairman, IAMA.
Most large technology companies may have so far focused primarily on bigger enterprises, but a report from
market research firm Zinnov highlighted that the small and medium businesses will present a lucrative
opportunity worth US$ 11.6 billion in 2015 and US$ 25.8 billion in 2020. Moreover, India has nearly 51 million
such businesses of which 12 million have a high degree of technology influence and are looking to adopt newer
IT products, as per the report.
Some of the major investments in the Indian IT and ITeS sector are as follows:
• Wipro has won a US$ 400 million, multi-year IT infrastructure management contract from Swiss engineering
giant ABB, making it the largest deal for the technology company.
• Tech Mahindra has signed a definitive agreement to acquire Geneva-based SOFGEN Holdings. The acquisition
is expected to strengthen Tech Mahindra’s presence in the banking segment.
• Tata Consultancy Services (TCS) plans to set up offshore development centres in India for Japanese clients in
a bid to boost the company's margin in the market.
• Reliance is building a 650,000 square feet (sq ft) data centre in India—its 10th data centre in the country—
with a combined capacity of about 1 million sq ft and an overall investment of US$ 200 million.
• Intel Corp plans to invest about US$ 62 million in 16 technology companies, working on wearable, data
analytics and the Internet of Things (IoT), in 2015 through its investment arm Intel Capital. The Indian IoT
industry is expected be worth US$ 15 billion and to connect 28 billion devices to the internet by 2020.
• Keiretsu Forum, a global angel investor network, has forayed into India by opening a chapter in Chennai.
With this, the Silicon Valley-based network will have 34 chapters across three continents.
Government Initiatives
The adoption of key technologies across sectors spurred by the 'Digital India Initiative' could help boost India's
gross domestic product (GDP) by US$ 550 billion to US$ 1 trillion by 2025, as per research firm McKinsey.
Some of the major initiatives taken by the government to promote IT and ITeS sector in India are as follows:
� India and the United States (US) have agreed to jointly explore opportunities for collaboration on
implementing India's ambitious Rs 1.13 trillion (US$ 18.22 billion) ‘Digital India Initiative’. The two sides also
agreed to hold the US-India Information and Communication Technology (ICT) Working Group in India later
this year.
� India and Japan held a Joint Working Group conference for Comprehensive Cooperation Framework for ICT.
India also offered Japan to manufacture ICT equipment in India.
� The Government of Telangana began construction of a technology incubator in Hyderabad—dubbed T-Hub—
to reposition the city as a technology destination. The state government is initially investing Rs 35 crore (US$
5.64 million) to set up a 60,000 sq ft space, labelled the largest start-up incubator in the county, at the
campus of International Institute of Information Technology-Hyderabad (IIIT-H). Once completed, the
project is proposed to be the world’s biggest start-up incubator housing 1,000 start-ups.
� Bengaluru has received US$ 2.6 billion in venture capital (VC) investments in 2014, making it the fifth largest
recipient globally during the year, an indication of the growing vibrancy of its startup ecosystem. Among
countries, India received the third highest VC funding worth US$ 4.6 billion.
Industry Outlook
The global economic outlook in the year under review was divergent, with growth in the United States, weaker
recoveries in Europe and Japan, while emerging economies including China slowed down in growth rates. IT
Exports were impacted by significant exchange rate volatility especially with the Euro and Pound Sterling
weakening in the second half of FY15.
As per NASSCOM, Indian IT export revenues is expected to grow by 12-14% in FY16, while domestic IT revenues
excluding e-commerce is expected to grow at a similar rate.

Disclaimer:
This document is prepared by our research analysts and it does not constitute an offer or solicitation for the
purchase or sale of any financial instrument or as an official confirmation of any transaction. The information
contained herein is from publicly available data or other sources believed to be reliable but we do not represent that
it is accurate or complete and it should not be relied on as such. Firstcall Research or any of its affiliates shall not be
in any way responsible for any loss or damage that may arise to any person from any inadvertent error in the
information contained in this report. Firstcall Research and/ or its affiliates and/or employees will not be liable for
the recipients’ investment decision based on this document.
Firstcall India Equity Research: Email – [email protected]
C.V.S.L.Kameswari Pharma & Diversified
U. Janaki Rao Capital Goods
B. Anil Kumar Auto, IT & FMCG
M. Vinayak Rao Diversified
G. Amarender Diversified
Firstcall Research Provides
Industry Research on all the Sectors and Equity Research on Major Companies
forming part of Listed and Unlisted Segments
For Further Details Contact:
Tel.: 022-2527 2510/2527 6077 / 25276089 Telefax: 022-25276089
040-20000235 /20000233
E-mail: [email protected]
www.firstcallresearch.com