Embed Size (px)
Citation preview
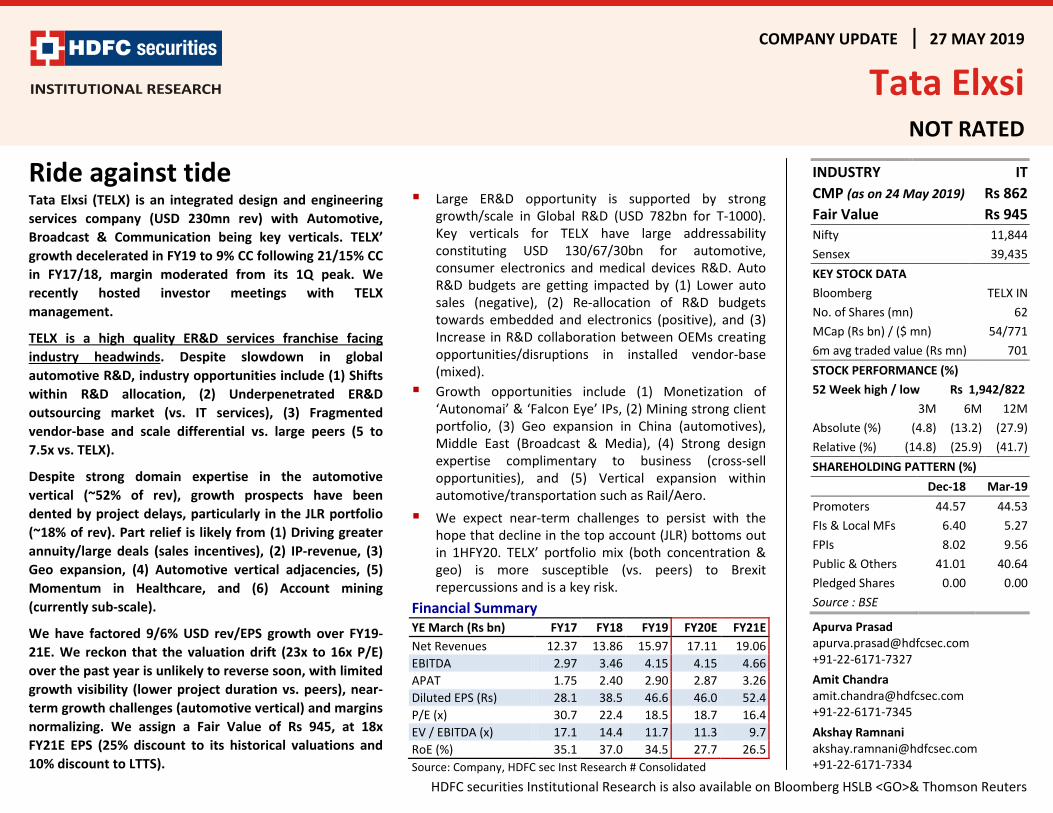
COMPANY UPDATE 27 MAY 2019
Tata Elxsi NOT RATED
HDFC securities Institutional Research is also available on Bloomberg HSLB <GO>& Thomson Reuters
Ride against tideTata Elxsi (TELX) is an integrated design and engineering services company (USD 230mn rev) with Automotive, Broadcast & Communication being key verticals. TELX’ growth decelerated in FY19 to 9% CC following 21/15% CC in FY17/18, margin moderated from its 1Q peak. We recently hosted investor meetings with TELX management.
TELX is a high quality ER&D services franchise facing industry headwinds. Despite slowdown in global automotive R&D, industry opportunities include (1) Shifts within R&D allocation, (2) Underpenetrated ER&D outsourcing market (vs. IT services), (3) Fragmented vendor-base and scale differential vs. large peers (5 to 7.5x vs. TELX).
Despite strong domain expertise in the automotive vertical (~52% of rev), growth prospects have been dented by project delays, particularly in the JLR portfolio (~18% of rev). Part relief is likely from (1) Driving greater annuity/large deals (sales incentives), (2) IP-revenue, (3) Geo expansion, (4) Automotive vertical adjacencies, (5) Momentum in Healthcare, and (6) Account mining (currently sub-scale).
We have factored 9/6% USD rev/EPS growth over FY19-21E. We reckon that the valuation drift (23x to 16x P/E) over the past year is unlikely to reverse soon, with limited growth visibility (lower project duration vs. peers), near-term growth challenges (automotive vertical) and margins normalizing. We assign a Fair Value of Rs 945, at 18x FY21E EPS (25% discount to its historical valuations and 10% discount to LTTS).
Large ER&D opportunity is supported by strong growth/scale in Global R&D (USD 782bn for T-1000). Key verticals for TELX have large addressability constituting USD 130/67/30bn for automotive, consumer electronics and medical devices R&D. Auto R&D budgets are getting impacted by (1) Lower auto sales (negative), (2) Re-allocation of R&D budgets towards embedded and electronics (positive), and (3) Increase in R&D collaboration between OEMs creating opportunities/disruptions in installed vendor-base (mixed).
Growth opportunities include (1) Monetization of ‘Autonomai’ & ‘Falcon Eye’ IPs, (2) Mining strong client portfolio, (3) Geo expansion in China (automotives), Middle East (Broadcast & Media), (4) Strong design expertise complimentary to business (cross-sell opportunities), and (5) Vertical expansion within automotive/transportation such as Rail/Aero.
We expect near-term challenges to persist with the hope that decline in the top account (JLR) bottoms out in 1HFY20. TELX’ portfolio mix (both concentration & geo) is more susceptible (vs. peers) to Brexit repercussions and is a key risk.
Financial Summary YE March (Rs bn) FY17 FY18 FY19 FY20E FY21E Net Revenues 12.37 13.86 15.97 17.11 19.06 EBITDA 2.97 3.46 4.15 4.15 4.66 APAT 1.75 2.40 2.90 2.87 3.26 Diluted EPS (Rs) 28.1 38.5 46.6 46.0 52.4 P/E (x) 30.7 22.4 18.5 18.7 16.4 EV / EBITDA (x) 17.1 14.4 11.7 11.3 9.7 RoE (%) 35.1 37.0 34.5 27.7 26.5 Source: Company, HDFC sec Inst Research # Consolidated
INDUSTRY IT CMP (as on 24 May 2019) Rs 862 Fair Value Rs 945 Nifty 11,844 Sensex 39,435 KEY STOCK DATA Bloomberg TELX IN No. of Shares (mn) 62 MCap (Rs bn) / ($ mn) 54/771 6m avg traded value (Rs mn) 701 STOCK PERFORMANCE (%) 52 Week high / low Rs 1,942/822 3M 6M 12M Absolute (%) (4.8) (13.2) (27.9) Relative (%) (14.8) (25.9) (41.7) SHAREHOLDING PATTERN (%) Dec-18 Mar-19 Promoters 44.57 44.53 FIs & Local MFs 6.40 5.27 FPIs 8.02 9.56 Public & Others 41.01 40.64 Pledged Shares 0.00 0.00 Source : BSE
Apurva Prasad [email protected] +91-22-6171-7327 Amit Chandra [email protected] +91-22-6171-7345 Akshay Ramnani [email protected] +91-22-6171-7334
TATA ELXSI: COMPANY UPDATE
Page | 2
Contents Tata Elxsi at a glance .................................................................................................................................................................. 3
Large and underpenetrated ER&D opportunity ................................................................................................................ 4
Automotive ER&D: Rising R&D budgets in electronics offsets falling sales ........................................................................ 5
TELX’ automotive portfolio .............................................................................................................................................. 8
Broadcast vertical & Industrial Design segment ............................................................................................................. 10
Growth Frontiers ........................................................................................................................................................... 11
Financials and operating metrics ................................................................................................................................... 12
Relative IT Sector valuation ............................................................................................................................................ 16
Financials and operating metrics .................................................................................................................................... 17
TATA ELXSI: COMPANY UPDATE
Page | 3
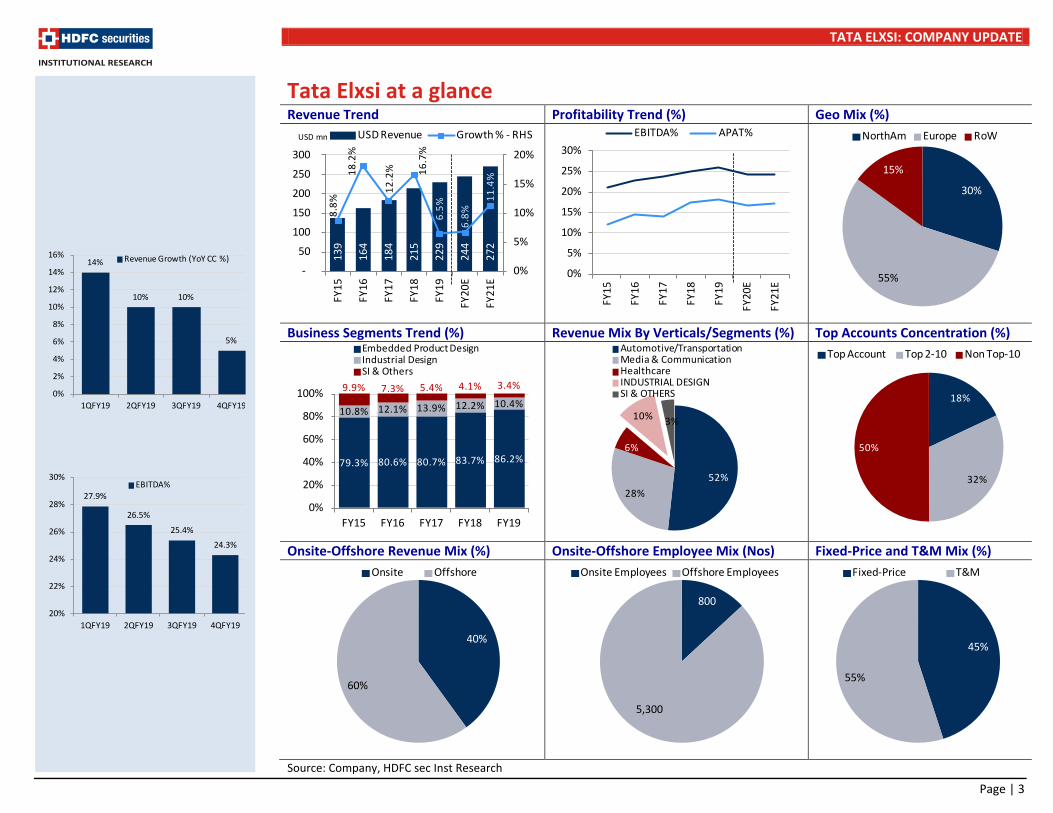
Tata Elxsi at a glance Revenue Trend Profitability Trend (%) Geo Mix (%)
Business Segments Trend (%) Revenue Mix By Verticals/Segments (%) Top Accounts Concentration (%)
Onsite-Offshore Revenue Mix (%) Onsite-Offshore Employee Mix (Nos) Fixed-Price and T&M Mix (%)
Source: Company, HDFC sec Inst Research
139
164
184
215
229
244
272
8.8%
18.2
%
12.2
% 16.7
%6.
5%
6.8%
11.4
%
0%
5%
10%
15%
20%
-
50
100
150
200
250
300
FY15
FY16
FY17
FY18
FY19
FY20
E
FY21
E
USD Revenue Growth % - RHSUSD mn
0%
5%
10%
15%
20%
25%
30%
FY15
FY16
FY17
FY18
FY19
FY20
E
FY21
E
EBITDA% APAT%
79.3% 80.6% 80.7% 83.7% 86.2%
10.8% 12.1% 13.9% 12.2% 10.4%9.9% 7.3% 5.4% 4.1% 3.4%
0%
20%
40%
60%
80%
100%
FY15 FY16 FY17 FY18 FY19
Embedded Product DesignIndustrial DesignSI & Others
52%28%
6%
10% 3%
Automotive/TransportationMedia & CommunicationHealthcareINDUSTRIAL DESIGNSI & OTHERS
45%
55%
Fixed-Price T&M
14%
10% 10%
5%
0%
2%
4%
6%
8%
10%
12%
14%
16%
1QFY19 2QFY19 3QFY19 4QFY19
Revenue Growth (YoY CC %)
27.9%
26.5%
25.4%
24.3%
20%
22%
24%
26%
28%
30%
1QFY19 2QFY19 3QFY19 4QFY19
EBITDA%
30%
55%
15%
NorthAm Europe RoW
18%
32%
50%
Top Account Top 2-10 Non Top-10
40%
60%
Onsite Offshore
800
5,300
Onsite Employees Offshore Employees
TATA ELXSI: COMPANY UPDATE
Page | 4
Large and underpenetrated ER&D opportunity
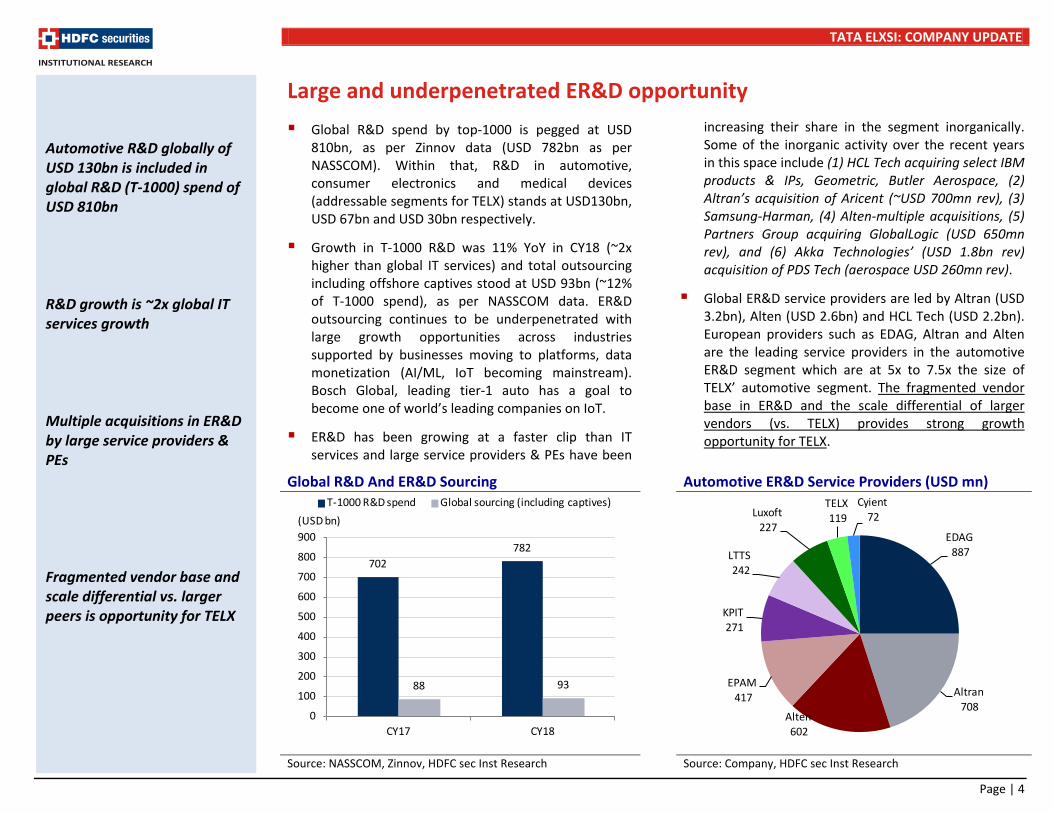
Global R&D spend by top-1000 is pegged at USD 810bn, as per Zinnov data (USD 782bn as per NASSCOM). Within that, R&D in automotive, consumer electronics and medical devices (addressable segments for TELX) stands at USD130bn, USD 67bn and USD 30bn respectively.
Growth in T-1000 R&D was 11% YoY in CY18 (~2x higher than global IT services) and total outsourcing including offshore captives stood at USD 93bn (~12% of T-1000 spend), as per NASSCOM data. ER&D outsourcing continues to be underpenetrated with large growth opportunities across industries supported by businesses moving to platforms, data monetization (AI/ML, IoT becoming mainstream). Bosch Global, leading tier-1 auto has a goal to become one of world’s leading companies on IoT.
ER&D has been growing at a faster clip than IT services and large service providers & PEs have been
increasing their share in the segment inorganically. Some of the inorganic activity over the recent years in this space include (1) HCL Tech acquiring select IBM products & IPs, Geometric, Butler Aerospace, (2) Altran’s acquisition of Aricent (~USD 700mn rev), (3) Samsung-Harman, (4) Alten-multiple acquisitions, (5) Partners Group acquiring GlobalLogic (USD 650mn rev), and (6) Akka Technologies’ (USD 1.8bn rev) acquisition of PDS Tech (aerospace USD 260mn rev).
Global ER&D service providers are led by Altran (USD 3.2bn), Alten (USD 2.6bn) and HCL Tech (USD 2.2bn). European providers such as EDAG, Altran and Alten are the leading service providers in the automotive ER&D segment which are at 5x to 7.5x the size of TELX’ automotive segment. The fragmented vendor base in ER&D and the scale differential of larger vendors (vs. TELX) provides strong growth opportunity for TELX.
Global R&D And ER&D Sourcing
Automotive ER&D Service Providers (USD mn)
Source: NASSCOM, Zinnov, HDFC sec Inst Research Source: Company, HDFC sec Inst Research
EDAG887
Altran708
Alten602
EPAM417
KPIT271
LTTS242
Luxoft227
TELX119
Cyient72
Automotive R&D globally of USD 130bn is included in global R&D (T-1000) spend of USD 810bn R&D growth is ~2x global IT services growth Multiple acquisitions in ER&D by large service providers & PEs Fragmented vendor base and scale differential vs. larger peers is opportunity for TELX
702782
88 93
0
100
200
300
400
500
600
700
800
900
CY17 CY18
(USD bn)T-1000 R&D spend Global sourcing (including captives)
TATA ELXSI: COMPANY UPDATE
Page | 5
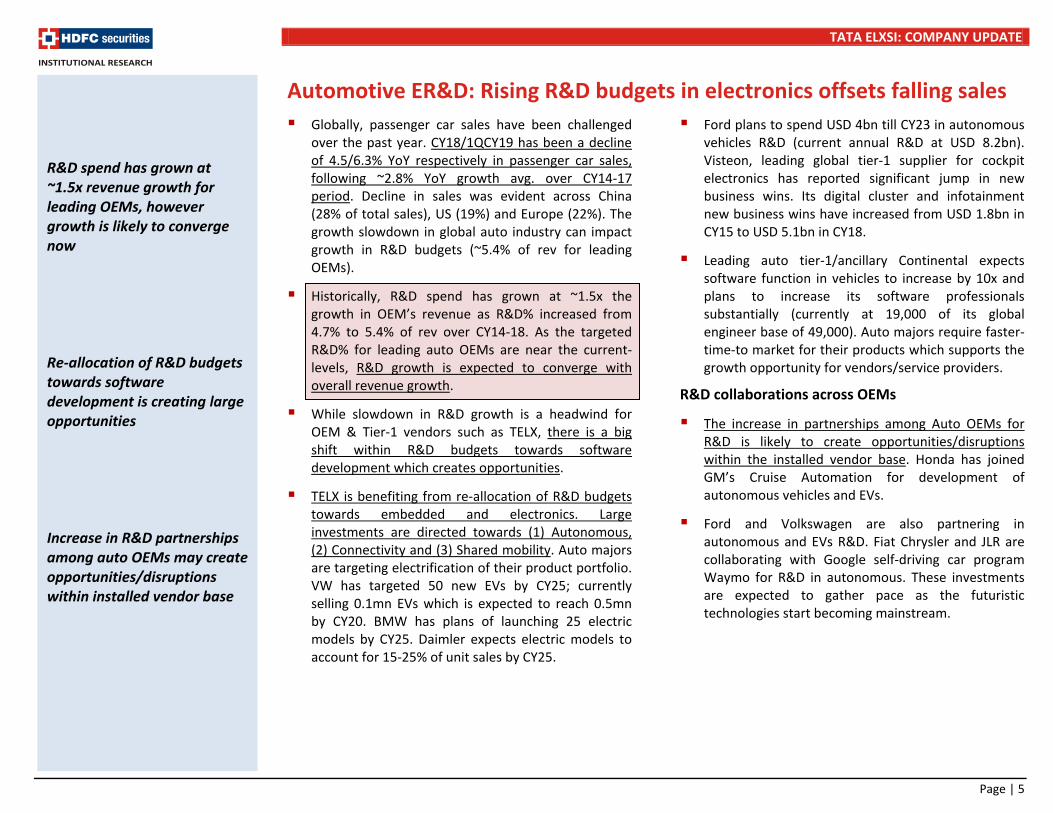
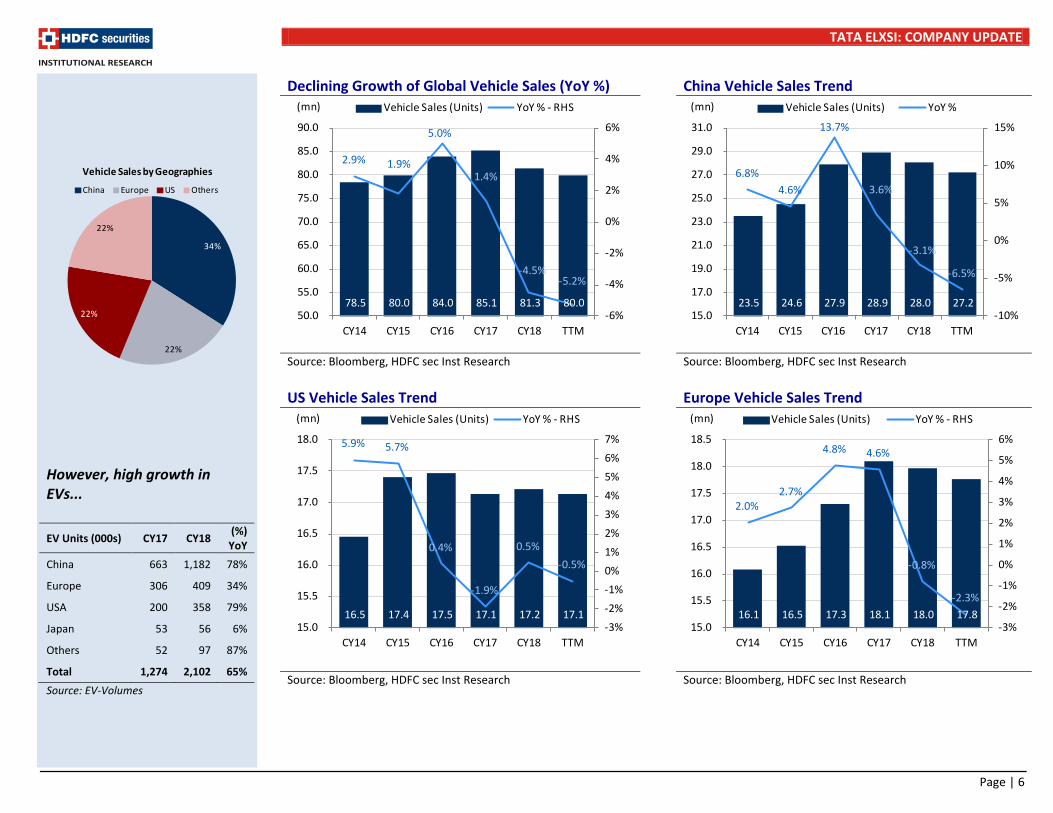
Automotive ER&D: Rising R&D budgets in electronics offsets falling sales Globally, passenger car sales have been challenged
over the past year. CY18/1QCY19 has been a decline of 4.5/6.3% YoY respectively in passenger car sales, following ~2.8% YoY growth avg. over CY14-17 period. Decline in sales was evident across China (28% of total sales), US (19%) and Europe (22%). The growth slowdown in global auto industry can impact growth in R&D budgets (~5.4% of rev for leading OEMs).
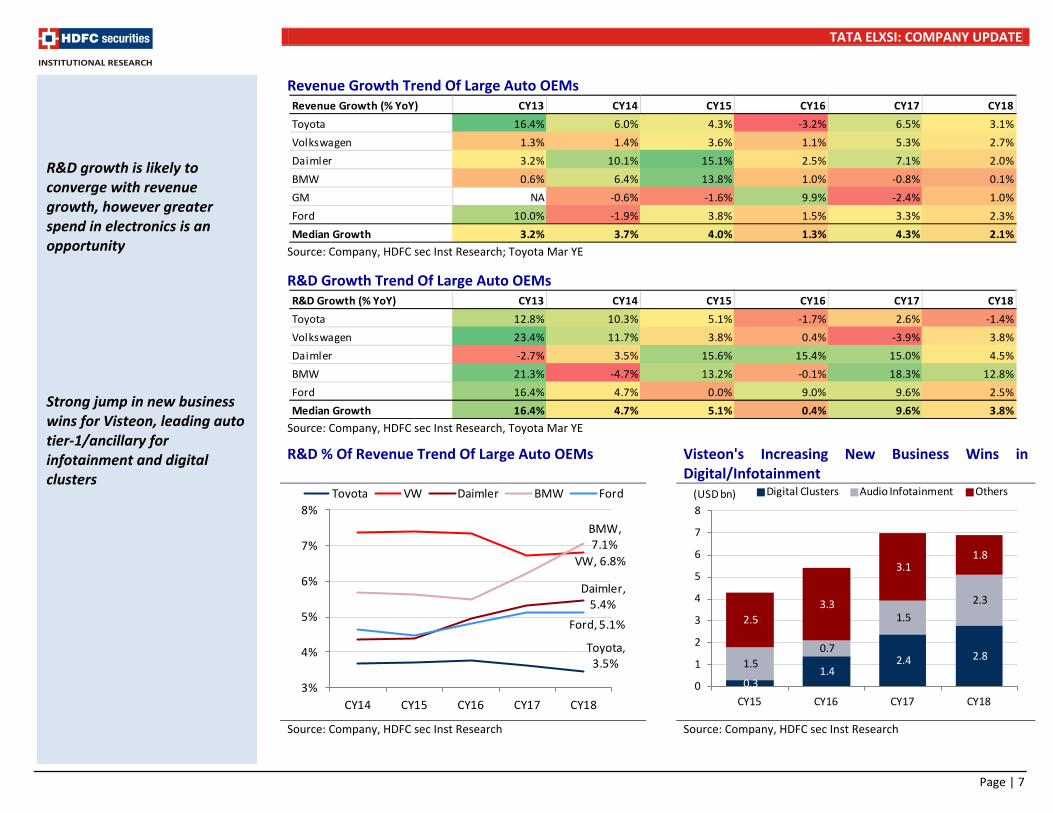
Historically, R&D spend has grown at ~1.5x the growth in OEM’s revenue as R&D% increased from 4.7% to 5.4% of rev over CY14-18. As the targeted R&D% for leading auto OEMs are near the current-levels, R&D growth is expected to converge with overall revenue growth.
While slowdown in R&D growth is a headwind for OEM & Tier-1 vendors such as TELX, there is a big shift within R&D budgets towards software development which creates opportunities.
TELX is benefiting from re-allocation of R&D budgets towards embedded and electronics. Large investments are directed towards (1) Autonomous, (2) Connectivity and (3) Shared mobility. Auto majors are targeting electrification of their product portfolio. VW has targeted 50 new EVs by CY25; currently selling 0.1mn EVs which is expected to reach 0.5mn by CY20. BMW has plans of launching 25 electric models by CY25. Daimler expects electric models to account for 15-25% of unit sales by CY25.
Ford plans to spend USD 4bn till CY23 in autonomous vehicles R&D (current annual R&D at USD 8.2bn). Visteon, leading global tier-1 supplier for cockpit electronics has reported significant jump in new business wins. Its digital cluster and infotainment new business wins have increased from USD 1.8bn in CY15 to USD 5.1bn in CY18.
Leading auto tier-1/ancillary Continental expects software function in vehicles to increase by 10x and plans to increase its software professionals substantially (currently at 19,000 of its global engineer base of 49,000). Auto majors require faster-time-to market for their products which supports the growth opportunity for vendors/service providers.
R&D collaborations across OEMs
The increase in partnerships among Auto OEMs for R&D is likely to create opportunities/disruptions within the installed vendor base. Honda has joined GM’s Cruise Automation for development of autonomous vehicles and EVs.
Ford and Volkswagen are also partnering in autonomous and EVs R&D. Fiat Chrysler and JLR are collaborating with Google self-driving car program Waymo for R&D in autonomous. These investments are expected to gather pace as the futuristic technologies start becoming mainstream.
R&D spend has grown at ~1.5x revenue growth for leading OEMs, however growth is likely to converge now Re-allocation of R&D budgets towards software development is creating large opportunities Increase in R&D partnerships among auto OEMs may create opportunities/disruptions within installed vendor base
TATA ELXSI: COMPANY UPDATE
Page | 6
Declining Growth of Global Vehicle Sales (YoY %) China Vehicle Sales Trend
Source: Bloomberg, HDFC sec Inst Research Source: Bloomberg, HDFC sec Inst Research US Vehicle Sales Trend Europe Vehicle Sales Trend
Source: Bloomberg, HDFC sec Inst Research Source: Bloomberg, HDFC sec Inst Research
However, high growth in EVs... EV Units (000s) CY17 CY18 (%)
YoY China 663 1,182 78%
Europe 306 409 34%
USA 200 358 79%
Japan 53 56 6%
Others 52 97 87%
Total 1,274 2,102 65% Source: EV-Volumes
34%
22%
22%
22%
China Europe US Others
Vehicle Sales by Geographies
78.5 80.0 84.0 85.1 81.3 80.0
2.9% 1.9%
5.0%
1.4%
-4.5%-5.2%
-6%
-4%
-2%
0%
2%
4%
6%
50.0
55.0
60.0
65.0
70.0
75.0
80.0
85.0
90.0
CY14 CY15 CY16 CY17 CY18 TTM
(mn) Vehicle Sales (Units) YoY % - RHS
23.5 24.6 27.9 28.9 28.0 27.2
6.8%4.6%
13.7%
3.6%
-3.1%
-6.5%
-10%
-5%
0%
5%
10%
15%
15.0
17.0
19.0
21.0
23.0
25.0
27.0
29.0
31.0
CY14 CY15 CY16 CY17 CY18 TTM
(mn) Vehicle Sales (Units) YoY %
16.5 17.4 17.5 17.1 17.2 17.1
5.9% 5.7%
0.4%
-1.9%
0.5%-0.5%
-3%-2%-1%0%1%2%3%4%5%6%7%
15.0
15.5
16.0
16.5
17.0
17.5
18.0
CY14 CY15 CY16 CY17 CY18 TTM
(mn) Vehicle Sales (Units) YoY % - RHS
16.1 16.5 17.3 18.1 18.0 17.8
2.0%2.7%
4.8% 4.6%
-0.8%
-2.3%
-3%
-2%
-1%
0%
1%
2%
3%
4%
5%
6%
15.0
15.5
16.0
16.5
17.0
17.5
18.0
18.5
CY14 CY15 CY16 CY17 CY18 TTM
(mn) Vehicle Sales (Units) YoY % - RHS
TATA ELXSI: COMPANY UPDATE
Page | 7
Revenue Growth Trend Of Large Auto OEMs
Source: Company, HDFC sec Inst Research; Toyota Mar YE
R&D Growth Trend Of Large Auto OEMs
Source: Company, HDFC sec Inst Research, Toyota Mar YE
R&D % Of Revenue Trend Of Large Auto OEMs Visteon's Increasing New Business Wins in Digital/Infotainment
Source: Company, HDFC sec Inst Research Source: Company, HDFC sec Inst Research
Revenue Growth (% YoY) CY13 CY14 CY15 CY16 CY17 CY18Toyota 16.4% 6.0% 4.3% -3.2% 6.5% 3.1%Volkswagen 1.3% 1.4% 3.6% 1.1% 5.3% 2.7%Daimler 3.2% 10.1% 15.1% 2.5% 7.1% 2.0%BMW 0.6% 6.4% 13.8% 1.0% -0.8% 0.1%GM NA -0.6% -1.6% 9.9% -2.4% 1.0%Ford 10.0% -1.9% 3.8% 1.5% 3.3% 2.3%Median Growth 3.2% 3.7% 4.0% 1.3% 4.3% 2.1%
R&D Growth (% YoY) CY13 CY14 CY15 CY16 CY17 CY18Toyota 12.8% 10.3% 5.1% -1.7% 2.6% -1.4%Volkswagen 23.4% 11.7% 3.8% 0.4% -3.9% 3.8%Daimler -2.7% 3.5% 15.6% 15.4% 15.0% 4.5%BMW 21.3% -4.7% 13.2% -0.1% 18.3% 12.8%Ford 16.4% 4.7% 0.0% 9.0% 9.6% 2.5%Median Growth 16.4% 4.7% 5.1% 0.4% 9.6% 3.8%
R&D growth is likely to converge with revenue growth, however greater spend in electronics is an opportunity Strong jump in new business wins for Visteon, leading auto tier-1/ancillary for infotainment and digital clusters
0.3 1.4
2.4 2.8 1.5
0.7
1.5 2.3
2.5 3.3
3.1 1.8
0
1
2
3
4
5
6
7
8
CY15 CY16 CY17 CY18
(USD bn) Digital Clusters Audio Infotainment Others
Toyota, 3.5%
VW, 6.8%
Daimler, 5.4%
BMW, 7.1%
Ford, 5.1%
3%
4%
5%
6%
7%
8%
CY14 CY15 CY16 CY17 CY18
Toyota VW Daimler BMW Ford
TATA ELXSI: COMPANY UPDATE
Page | 8
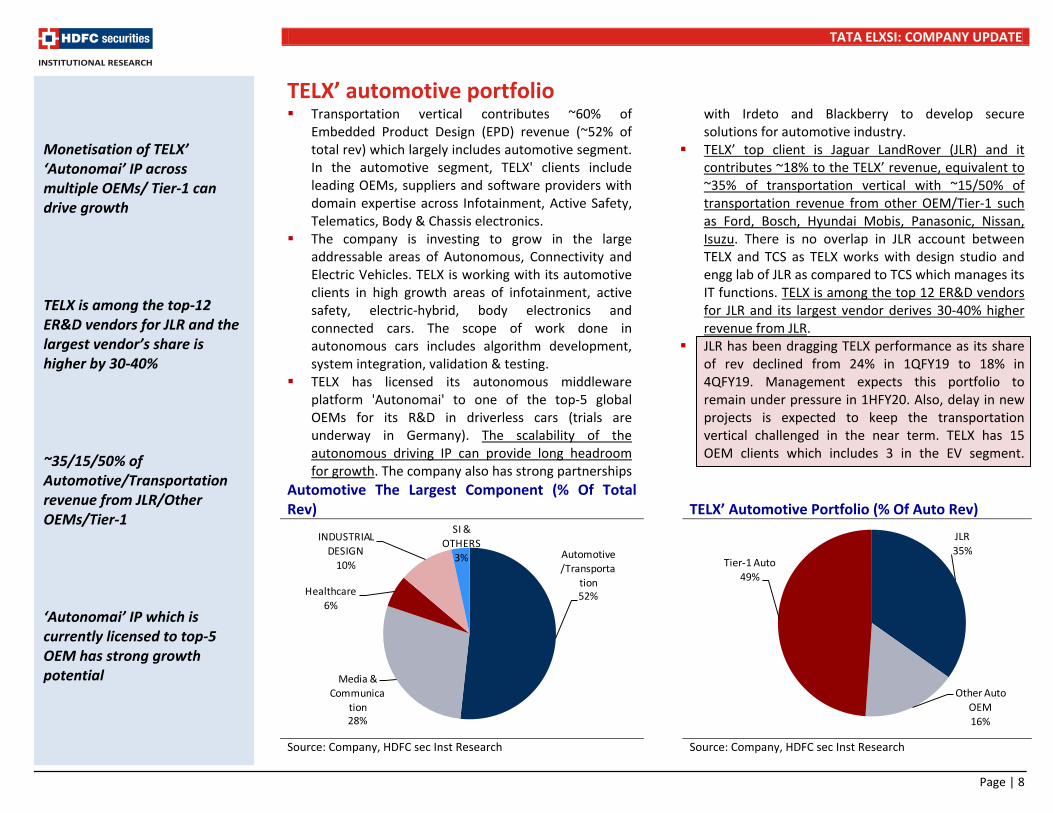
TELX’ automotive portfolio Transportation vertical contributes ~60% of
Embedded Product Design (EPD) revenue (~52% of total rev) which largely includes automotive segment. In the automotive segment, TELX' clients include leading OEMs, suppliers and software providers with domain expertise across Infotainment, Active Safety, Telematics, Body & Chassis electronics.
The company is investing to grow in the large addressable areas of Autonomous, Connectivity and Electric Vehicles. TELX is working with its automotive clients in high growth areas of infotainment, active safety, electric-hybrid, body electronics and connected cars. The scope of work done in autonomous cars includes algorithm development, system integration, validation & testing.
TELX has licensed its autonomous middleware platform 'Autonomai' to one of the top-5 global OEMs for its R&D in driverless cars (trials are underway in Germany). The scalability of the autonomous driving IP can provide long headroom for growth. The company also has strong partnerships
with Irdeto and Blackberry to develop secure solutions for automotive industry.
TELX’ top client is Jaguar LandRover (JLR) and it contributes ~18% to the TELX’ revenue, equivalent to ~35% of transportation vertical with ~15/50% of transportation revenue from other OEM/Tier-1 such as Ford, Bosch, Hyundai Mobis, Panasonic, Nissan, Isuzu. There is no overlap in JLR account between TELX and TCS as TELX works with design studio and engg lab of JLR as compared to TCS which manages its IT functions. TELX is among the top 12 ER&D vendors for JLR and its largest vendor derives 30-40% higher revenue from JLR.
JLR has been dragging TELX performance as its share of rev declined from 24% in 1QFY19 to 18% in 4QFY19. Management expects this portfolio to remain under pressure in 1HFY20. Also, delay in new projects is expected to keep the transportation vertical challenged in the near term. TELX has 15 OEM clients which includes 3 in the EV segment.
Automotive The Largest Component (% Of Total Rev)
TELX’ Automotive Portfolio (% Of Auto Rev)
Source: Company, HDFC sec Inst Research Source: Company, HDFC sec Inst Research
Monetisation of TELX’ ‘Autonomai’ IP across multiple OEMs/ Tier-1 can drive growth TELX is among the top-12 ER&D vendors for JLR and the largest vendor’s share is higher by 30-40% ~35/15/50% of Automotive/Transportation revenue from JLR/Other OEMs/Tier-1 ‘Autonomai’ IP which is currently licensed to top-5 OEM has strong growth potential
JLR35%
Other Auto OEM16%
Tier-1 Auto49%
Automotive/Transporta
tion52%
Media & Communica
tion28%
Healthcare6%
INDUSTRIAL DESIGN
10%
SI & OTHERS
3%
TATA ELXSI: COMPANY UPDATE
Page | 9
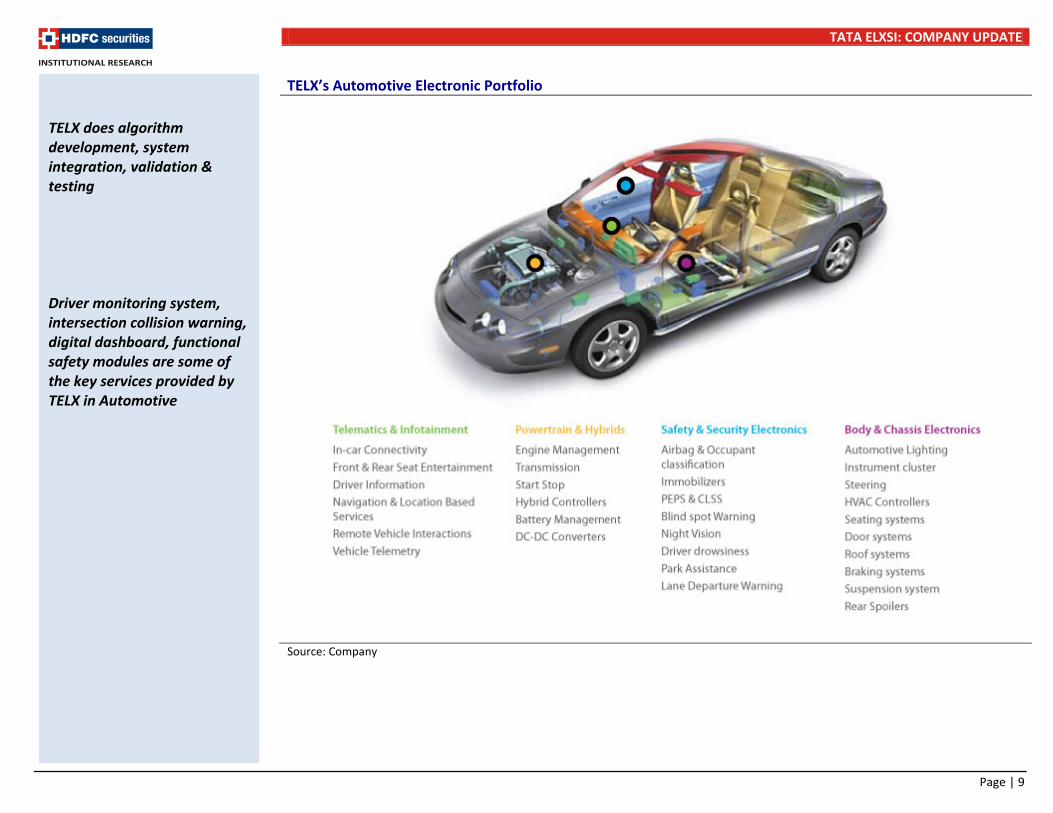
TELX’s Automotive Electronic Portfolio
Source: Company
TELX does algorithm development, system integration, validation & testing Driver monitoring system, intersection collision warning, digital dashboard, functional safety modules are some of the key services provided by TELX in Automotive
TATA ELXSI: COMPANY UPDATE
Page | 10
Broadcast vertical & Industrial Design segment
Broadcast & Communication Tata Elxsi provides product engineering services to
the Broadcast & Media industry with customer base including MSOs, OEMs of connected devices, STB (set-top-boxes) and networking devices. Customers include leading cable & telco STBs such as Arris, Sagemcom, Echostar, Technicolour. TELX’ services support MSOs for catalogue management, payment gateway integration and managing multiple 3rd party applications.
The company also provides Testing and automation services in for MSO clients including Comcast, Sky (TELX expects no impact from Comcast-Sky acquisition) and NOS (Portugal). TELX’ IP ‘Falcon Eye’ supports operators and broadcasters for automation of testing, workflow and monitoring of content across platforms – mobile, OTT, STB. The IP has been licensed to six operators and supports operators for their roll-out of content across devices and is used as a tool to measure quality of UX.
In the media segment, TELX also does development and testing with multiple semiconductor companies such as Broadcom, NEC, Fujitsu, Intel etc and media houses such as Liberty Media. Some projects include Zee5, Zee Entertainment’s OTT which has been powered by TELX. The company has also developed and integrated key software components for Airtel Internet TV. Global partnership on Android with Google and Google cloud partnership for integration of Falcon Eye IP also supporting growth in this segment, with OTT and Opensource being key trends.
We believe that the high digital disruption in broadcast/media & communication vertical augurs well for TELX.
Industrial Design TELX’ Industrial design segment supports the
integrated design & technology services suite for product engineering. The segment contributes 10% to rev across multiple industries and has employee strength of 500. The services include product design (BP Castrol, Orient, Panasonic, Marico, etc), package design, UX design, service design (Kochi Metro, Airport Authority of India projects) and prototyping. The average engagement size per client in this segment is low at ~USD 200k.
Large service providers have acquired design and creative agencies to augment their design engineering and digital capabilities. Some of them include (1) W12 Studio by TCS, (2) Syfte, Cooper, Designit by Wipro, (3) Wongdoody by Infosys, (4) Multiple deals by Accenture including Droga5, Fjord, and (5) Several deals by Cognizant. TELX’ design-engineering portfolio provides a strong edge and a decent cross-sell opportunity.
Growth in the Industrial Design segment has lagged company average with 6% CAGR as compared to 14% CAGR for EPD business over the past 3 years. TELX has strong design expertise complimentary to the EPD business providing differentiation, however we reckon that scalability in Industrial Business remains a challenge.
Broadcast & communication ~33% of EPD rev, 28% of total revenue Industrial Design contributes 10% to the total revenue
TATA ELXSI: COMPANY UPDATE
Page | 11
Growth Frontiers China is an area of opportunity for TELX with 200
brands as several OEMs are looking to expand sales outside China (e.g. MG Motors). China also contributed to >60% of EV sales in CY18, which is the fastest growing segment. TELX has recently licensed its platform (developed in collaboration with leading European OEM) to Great Wall Motors, China’s leading SUV manufacturer.
Within broadcast & media segment, Middle East geography is an opportunity as tech refresh cycle is coming up for state owned broadcast players. Also, Australia is another geo that the company is targeting for growth expansion.
TELX also plans to build adjacencies in Rail & Aero within the Transportation segment, supported by their expertise in Automotive and cross-sell from Industrial Design. Examples include Alstom-Kochi Metro.
Healthcare segment (~7% of EPD rev and ~6% of total rev) is TELX’ fastest growing segment with TELX providing medical devices engineering (infusion system, wireless stethoscope, healthcare technology and Quality & Regulatory compliance support services (e.g. MDRC framework compliance). The scope includes developing image processing algorithm, integration of UI, software & hardware and compliance to medical device regulations. Management expects this segment to increase to 10-15% of rev over the medium term.
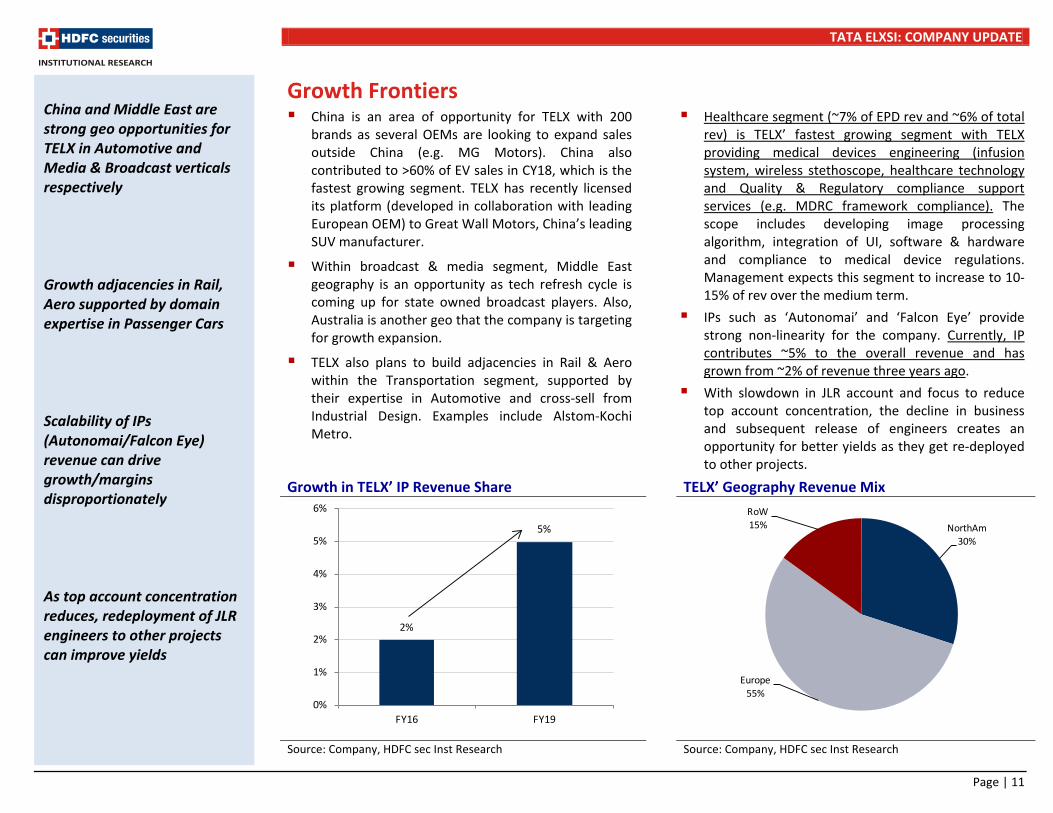
IPs such as ‘Autonomai’ and ‘Falcon Eye’ provide strong non-linearity for the company. Currently, IP contributes ~5% to the overall revenue and has grown from ~2% of revenue three years ago.
With slowdown in JLR account and focus to reduce top account concentration, the decline in business and subsequent release of engineers creates an opportunity for better yields as they get re-deployed to other projects.
Growth in TELX’ IP Revenue Share TELX’ Geography Revenue Mix
Source: Company, HDFC sec Inst Research Source: Company, HDFC sec Inst Research
China and Middle East are strong geo opportunities for TELX in Automotive and Media & Broadcast verticals respectively Growth adjacencies in Rail, Aero supported by domain expertise in Passenger Cars Scalability of IPs (Autonomai/Falcon Eye) revenue can drive growth/margins disproportionately As top account concentration reduces, redeployment of JLR engineers to other projects can improve yields
NorthAm30%
Europe55%
RoW15%
2%
5%
0%
1%
2%
3%
4%
5%
6%
FY16 FY19
TATA ELXSI: COMPANY UPDATE
Page | 12
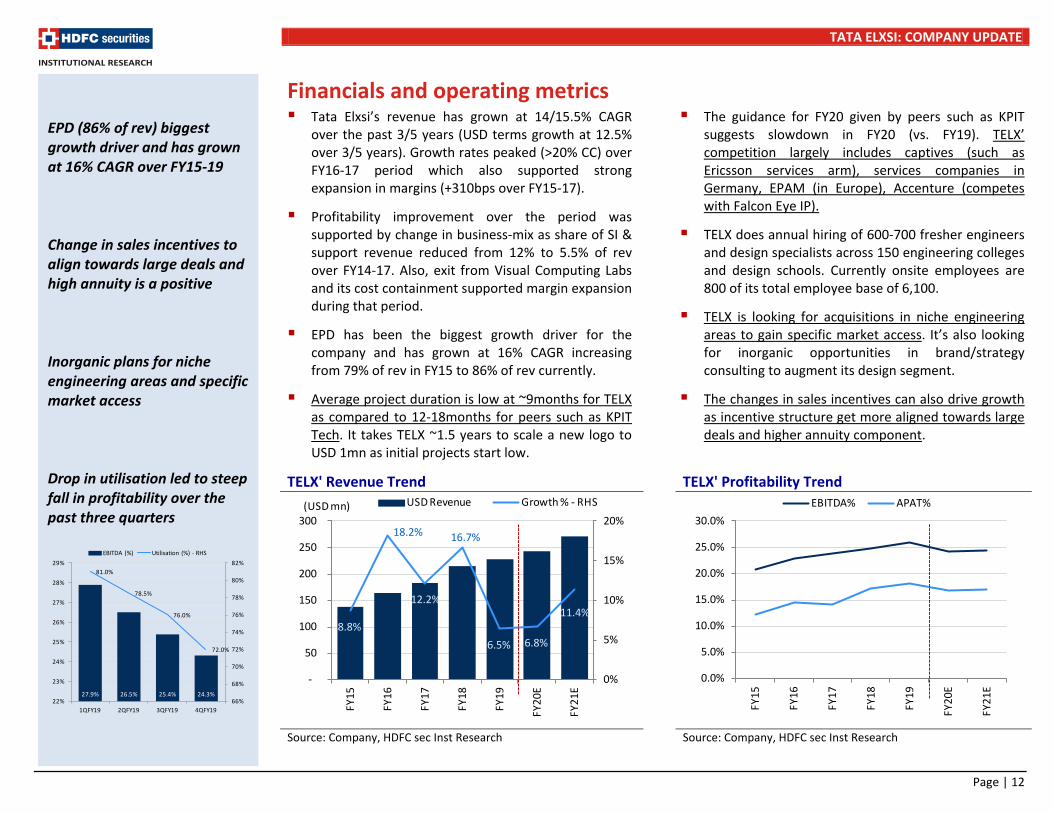
Financials and operating metrics Tata Elxsi’s revenue has grown at 14/15.5% CAGR
over the past 3/5 years (USD terms growth at 12.5% over 3/5 years). Growth rates peaked (>20% CC) over FY16-17 period which also supported strong expansion in margins (+310bps over FY15-17).
Profitability improvement over the period was supported by change in business-mix as share of SI & support revenue reduced from 12% to 5.5% of rev over FY14-17. Also, exit from Visual Computing Labs and its cost containment supported margin expansion during that period.
EPD has been the biggest growth driver for the company and has grown at 16% CAGR increasing from 79% of rev in FY15 to 86% of rev currently.
Average project duration is low at ~9months for TELX as compared to 12-18months for peers such as KPIT Tech. It takes TELX ~1.5 years to scale a new logo to USD 1mn as initial projects start low.
The guidance for FY20 given by peers such as KPIT suggests slowdown in FY20 (vs. FY19). TELX’ competition largely includes captives (such as Ericsson services arm), services companies in Germany, EPAM (in Europe), Accenture (competes with Falcon Eye IP).
TELX does annual hiring of 600-700 fresher engineers and design specialists across 150 engineering colleges and design schools. Currently onsite employees are 800 of its total employee base of 6,100.
TELX is looking for acquisitions in niche engineering areas to gain specific market access. It’s also looking for inorganic opportunities in brand/strategy consulting to augment its design segment.
The changes in sales incentives can also drive growth as incentive structure get more aligned towards large deals and higher annuity component.
TELX' Revenue Trend TELX' Profitability Trend
Source: Company, HDFC sec Inst Research Source: Company, HDFC sec Inst Research
EPD (86% of rev) biggest growth driver and has grown at 16% CAGR over FY15-19 Change in sales incentives to align towards large deals and high annuity is a positive Inorganic plans for niche engineering areas and specific market access Drop in utilisation led to steep fall in profitability over the past three quarters
27.9% 26.5% 25.4% 24.3%
81.0%
78.5%
76.0%
72.0%
66%
68%
70%
72%
74%
76%
78%
80%
82%
22%
23%
24%
25%
26%
27%
28%
29%
1QFY19 2QFY19 3QFY19 4QFY19
EBITDA (%) Utilisation (%) - RHS
0.0%
5.0%
10.0%
15.0%
20.0%
25.0%
30.0%
FY15
FY16
FY17
FY18
FY19
FY20
E
FY21
E
EBITDA% APAT%
8.8%
18.2%
12.2%
16.7%
6.5% 6.8%
11.4%
0%
5%
10%
15%
20%
-
50
100
150
200
250
300
FY15
FY16
FY17
FY18
FY19
FY20
E
FY21
E
(USD mn) USD Revenue Growth % - RHS
TATA ELXSI: COMPANY UPDATE
Page | 13
Highest Offshore Mix (% of Rev) Vs. Peers… Leading To Revenue Productivity At Lower End (Rev/employee)
Source: Company, HDFC sec Inst Research Source: Company, HDFC sec Inst Research T-10 Accounts Concentration (% Of Rev) At Higher End
Top Account Concentration (% Of Rev)
Source: Company, HDFC sec Inst Research Source: Company, HDFC sec Inst Research
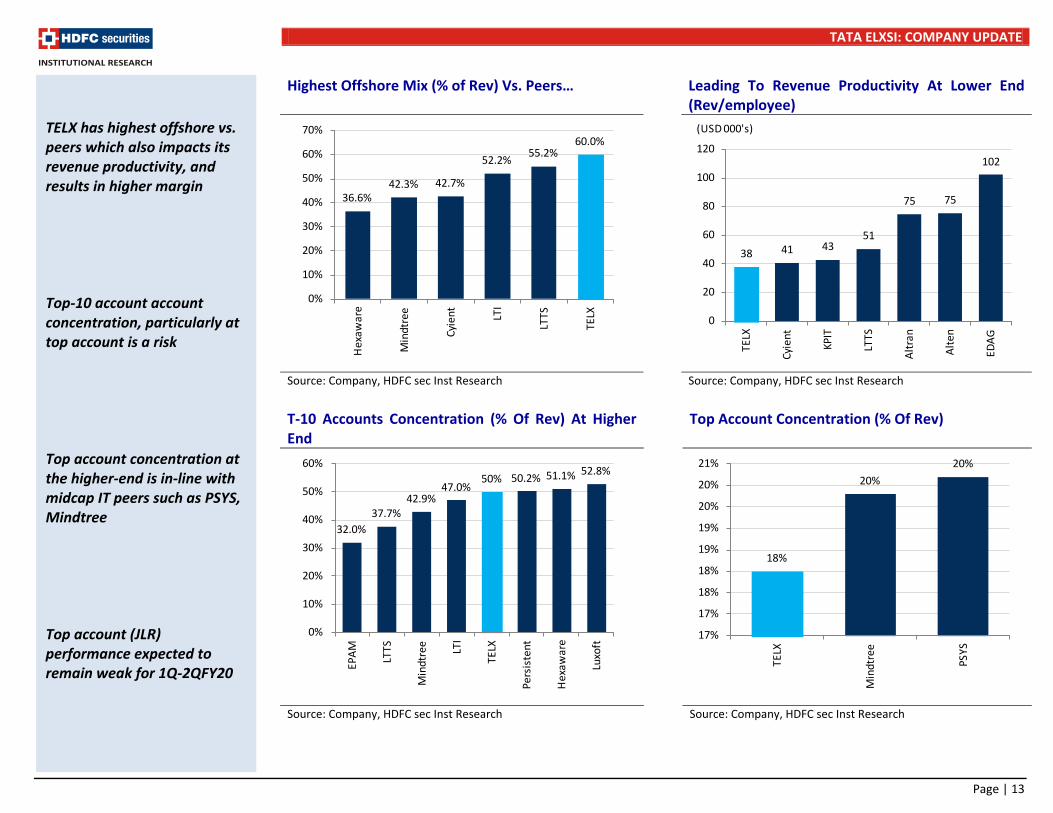
TELX has highest offshore vs. peers which also impacts its revenue productivity, and results in higher margin Top-10 account account concentration, particularly at top account is a risk Top account concentration at the higher-end is in-line with midcap IT peers such as PSYS, Mindtree Top account (JLR) performance expected to remain weak for 1Q-2QFY20
38 41 43 51
75 75
102
0
20
40
60
80
100
120
TELX
Cyie
nt
KPIT
LTTS
Altr
an
Alte
n
EDAG
(USD 000's)
36.6%42.3% 42.7%
52.2% 55.2%60.0%
0%
10%
20%
30%
40%
50%
60%
70%
Hex
awar
e
Min
dtre
e
Cyie
nt LTI
LTTS
TELX
32.0%37.7%
42.9%47.0%
50% 50.2% 51.1% 52.8%
0%
10%
20%
30%
40%
50%
60%
EPAM LT
TS
Min
dtre
e LTI
TELX
Pers
iste
nt
Hex
awar
e
Luxo
ft
18%
20%20%
17%
17%
18%
18%
19%
19%
20%
20%
21%
TELX
Min
dtre
e
PSYS
TATA ELXSI: COMPANY UPDATE
Page | 14
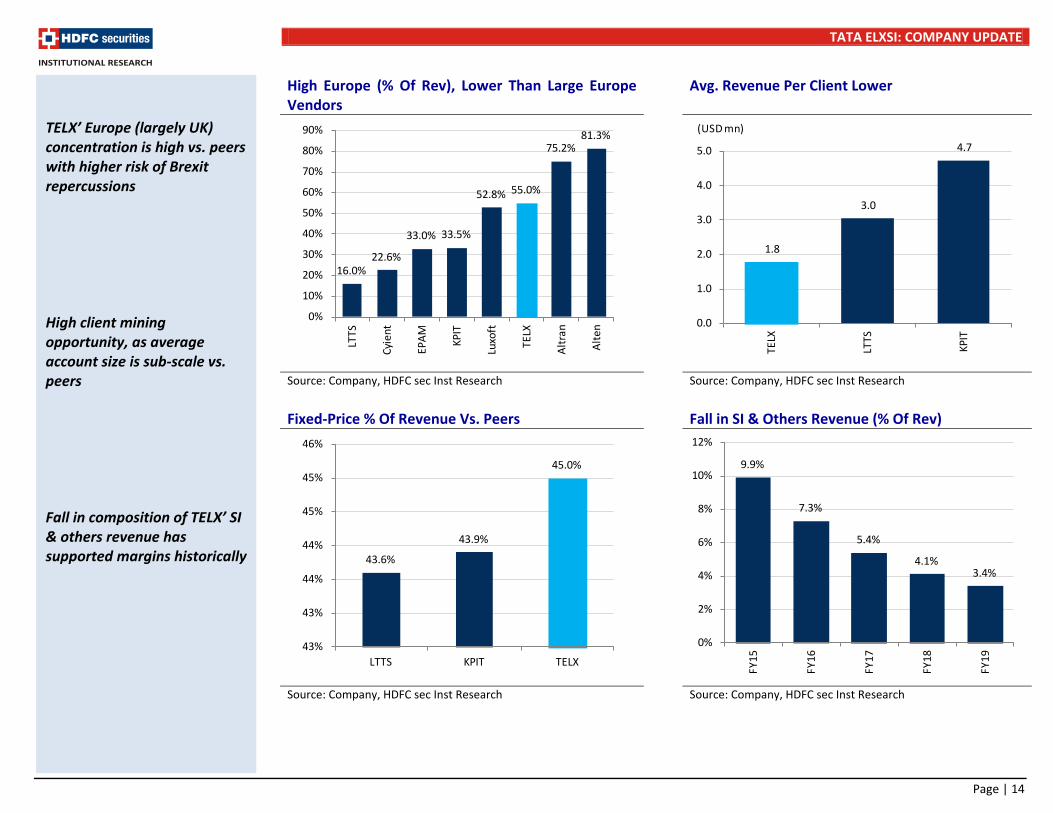
High Europe (% Of Rev), Lower Than Large Europe Vendors
Avg. Revenue Per Client Lower
Source: Company, HDFC sec Inst Research Source: Company, HDFC sec Inst Research Fixed-Price % Of Revenue Vs. Peers Fall in SI & Others Revenue (% Of Rev)
Source: Company, HDFC sec Inst Research Source: Company, HDFC sec Inst Research
TELX’ Europe (largely UK) concentration is high vs. peers with higher risk of Brexit repercussions High client mining opportunity, as average account size is sub-scale vs. peers Fall in composition of TELX’ SI & others revenue has supported margins historically
16.0%22.6%
33.0% 33.5%
52.8% 55.0%
75.2%81.3%
0%
10%
20%
30%
40%
50%
60%
70%
80%
90%
LTTS
Cyie
nt
EPAM KP
IT
Luxo
ft
TELX
Altr
an
Alte
n
1.8
3.0
4.7
0.0
1.0
2.0
3.0
4.0
5.0
TELX
LTTS
KPIT
(USD mn)
43.6%
43.9%
45.0%
43%
43%
44%
44%
45%
45%
46%
LTTS KPIT TELX
9.9%
7.3%
5.4%
4.1%3.4%
0%
2%
4%
6%
8%
10%
12%
FY15
FY16
FY17
FY18
FY19
TATA ELXSI: COMPANY UPDATE
Page | 15
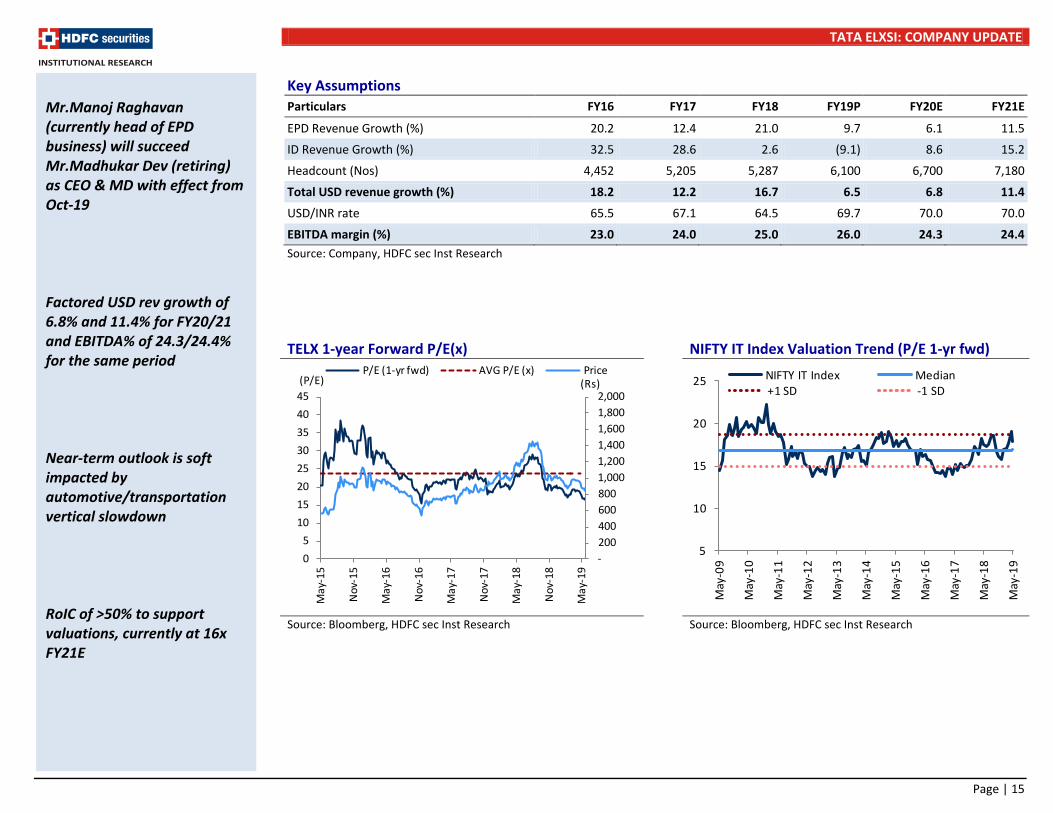
Key Assumptions Particulars FY16 FY17 FY18 FY19P FY20E FY21E
EPD Revenue Growth (%) 20.2 12.4 21.0 9.7 6.1 11.5
ID Revenue Growth (%) 32.5 28.6 2.6 (9.1) 8.6 15.2
Headcount (Nos) 4,452 5,205 5,287 6,100 6,700 7,180
Total USD revenue growth (%) 18.2 12.2 16.7 6.5 6.8 11.4
USD/INR rate 65.5 67.1 64.5 69.7 70.0 70.0
EBITDA margin (%) 23.0 24.0 25.0 26.0 24.3 24.4 Source: Company, HDFC sec Inst Research TELX 1-year Forward P/E(x) NIFTY IT Index Valuation Trend (P/E 1-yr fwd)
Source: Bloomberg, HDFC sec Inst Research Source: Bloomberg, HDFC sec Inst Research
Mr.Manoj Raghavan (currently head of EPD business) will succeed Mr.Madhukar Dev (retiring) as CEO & MD with effect from Oct-19 Factored USD rev growth of 6.8% and 11.4% for FY20/21 and EBITDA% of 24.3/24.4% for the same period Near-term outlook is soft impacted by automotive/transportation vertical slowdown RoIC of >50% to support valuations, currently at 16x FY21E
-200 400 600 800 1,000 1,200 1,400 1,600 1,800 2,000
05
1015202530354045
May
-15
Nov
-15
May
-16
Nov
-16
May
-17
Nov
-17
May
-18
Nov
-18
May
-19
(Rs)(P/E)P/E (1-yr fwd) AVG P/E (x) Price
5
10
15
20
25
May
-09
May
-10
May
-11
May
-12
May
-13
May
-14
May
-15
May
-16
May
-17
May
-18
May
-19
NIFTY IT Index Median+1 SD -1 SD
TATA ELXSI: COMPANY UPDATE
Page | 16
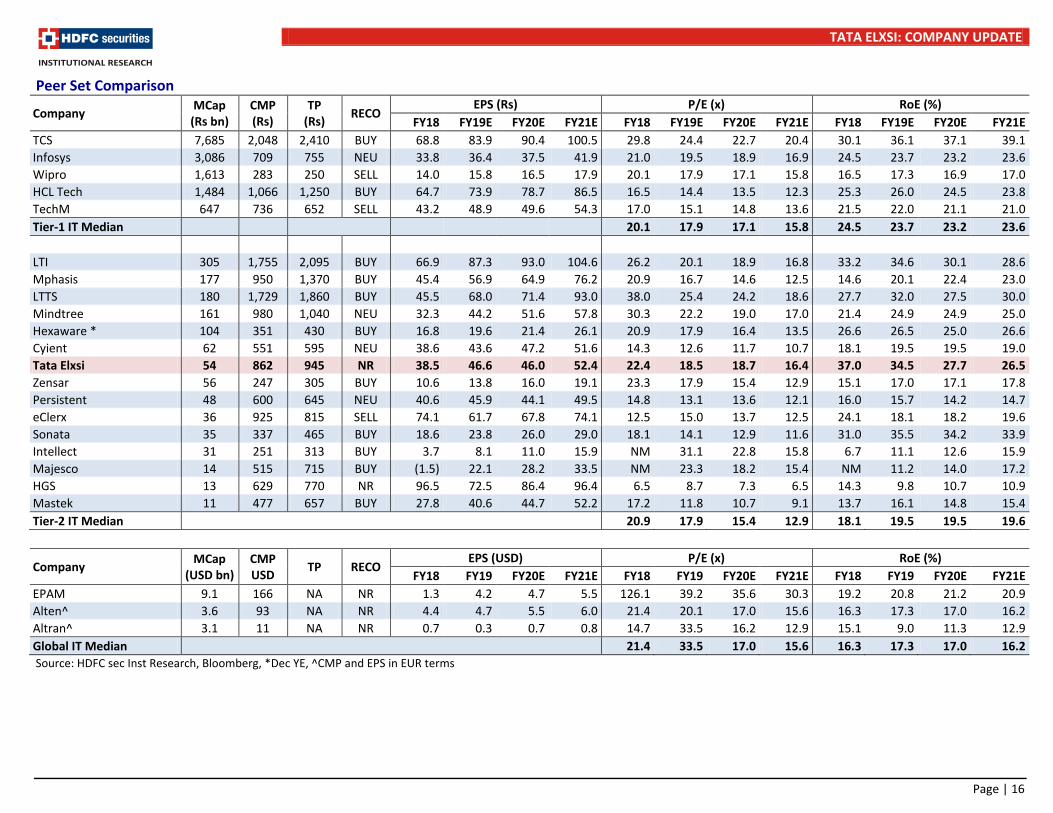
Peer Set Comparison
Company MCap (Rs bn)
CMP (Rs)
TP (Rs) RECO
EPS (Rs) P/E (x) RoE (%) FY18 FY19E FY20E FY21E FY18 FY19E FY20E FY21E FY18 FY19E FY20E FY21E
TCS 7,685 2,048 2,410 BUY 68.8 83.9 90.4 100.5 29.8 24.4 22.7 20.4 30.1 36.1 37.1 39.1 Infosys 3,086 709 755 NEU 33.8 36.4 37.5 41.9 21.0 19.5 18.9 16.9 24.5 23.7 23.2 23.6 Wipro 1,613 283 250 SELL 14.0 15.8 16.5 17.9 20.1 17.9 17.1 15.8 16.5 17.3 16.9 17.0 HCL Tech 1,484 1,066 1,250 BUY 64.7 73.9 78.7 86.5 16.5 14.4 13.5 12.3 25.3 26.0 24.5 23.8 TechM 647 736 652 SELL 43.2 48.9 49.6 54.3 17.0 15.1 14.8 13.6 21.5 22.0 21.1 21.0 Tier-1 IT Median 20.1 17.9 17.1 15.8 24.5 23.7 23.2 23.6
LTI 305 1,755 2,095 BUY 66.9 87.3 93.0 104.6 26.2 20.1 18.9 16.8 33.2 34.6 30.1 28.6 Mphasis 177 950 1,370 BUY 45.4 56.9 64.9 76.2 20.9 16.7 14.6 12.5 14.6 20.1 22.4 23.0 LTTS 180 1,729 1,860 BUY 45.5 68.0 71.4 93.0 38.0 25.4 24.2 18.6 27.7 32.0 27.5 30.0 Mindtree 161 980 1,040 NEU 32.3 44.2 51.6 57.8 30.3 22.2 19.0 17.0 21.4 24.9 24.9 25.0 Hexaware * 104 351 430 BUY 16.8 19.6 21.4 26.1 20.9 17.9 16.4 13.5 26.6 26.5 25.0 26.6 Cyient 62 551 595 NEU 38.6 43.6 47.2 51.6 14.3 12.6 11.7 10.7 18.1 19.5 19.5 19.0 Tata Elxsi 54 862 945 NR 38.5 46.6 46.0 52.4 22.4 18.5 18.7 16.4 37.0 34.5 27.7 26.5 Zensar 56 247 305 BUY 10.6 13.8 16.0 19.1 23.3 17.9 15.4 12.9 15.1 17.0 17.1 17.8 Persistent 48 600 645 NEU 40.6 45.9 44.1 49.5 14.8 13.1 13.6 12.1 16.0 15.7 14.2 14.7 eClerx 36 925 815 SELL 74.1 61.7 67.8 74.1 12.5 15.0 13.7 12.5 24.1 18.1 18.2 19.6 Sonata 35 337 465 BUY 18.6 23.8 26.0 29.0 18.1 14.1 12.9 11.6 31.0 35.5 34.2 33.9 Intellect 31 251 313 BUY 3.7 8.1 11.0 15.9 NM 31.1 22.8 15.8 6.7 11.1 12.6 15.9 Majesco 14 515 715 BUY (1.5) 22.1 28.2 33.5 NM 23.3 18.2 15.4 NM 11.2 14.0 17.2 HGS 13 629 770 NR 96.5 72.5 86.4 96.4 6.5 8.7 7.3 6.5 14.3 9.8 10.7 10.9 Mastek 11 477 657 BUY 27.8 40.6 44.7 52.2 17.2 11.8 10.7 9.1 13.7 16.1 14.8 15.4 Tier-2 IT Median 20.9 17.9 15.4 12.9 18.1 19.5 19.5 19.6
Company MCap (USD bn)
CMP USD TP RECO
EPS (USD) P/E (x) RoE (%) FY18 FY19 FY20E FY21E FY18 FY19 FY20E FY21E FY18 FY19 FY20E FY21E
EPAM 9.1 166 NA NR 1.3 4.2 4.7 5.5 126.1 39.2 35.6 30.3 19.2 20.8 21.2 20.9 Alten^ 3.6 93 NA NR 4.4 4.7 5.5 6.0 21.4 20.1 17.0 15.6 16.3 17.3 17.0 16.2 Altran^ 3.1 11 NA NR 0.7 0.3 0.7 0.8 14.7 33.5 16.2 12.9 15.1 9.0 11.3 12.9 Global IT Median 21.4 33.5 17.0 15.6 16.3 17.3 17.0 16.2
Source: HDFC sec Inst Research, Bloomberg, *Dec YE, ^CMP and EPS in EUR terms
TATA ELXSI: COMPANY UPDATE
Page | 17
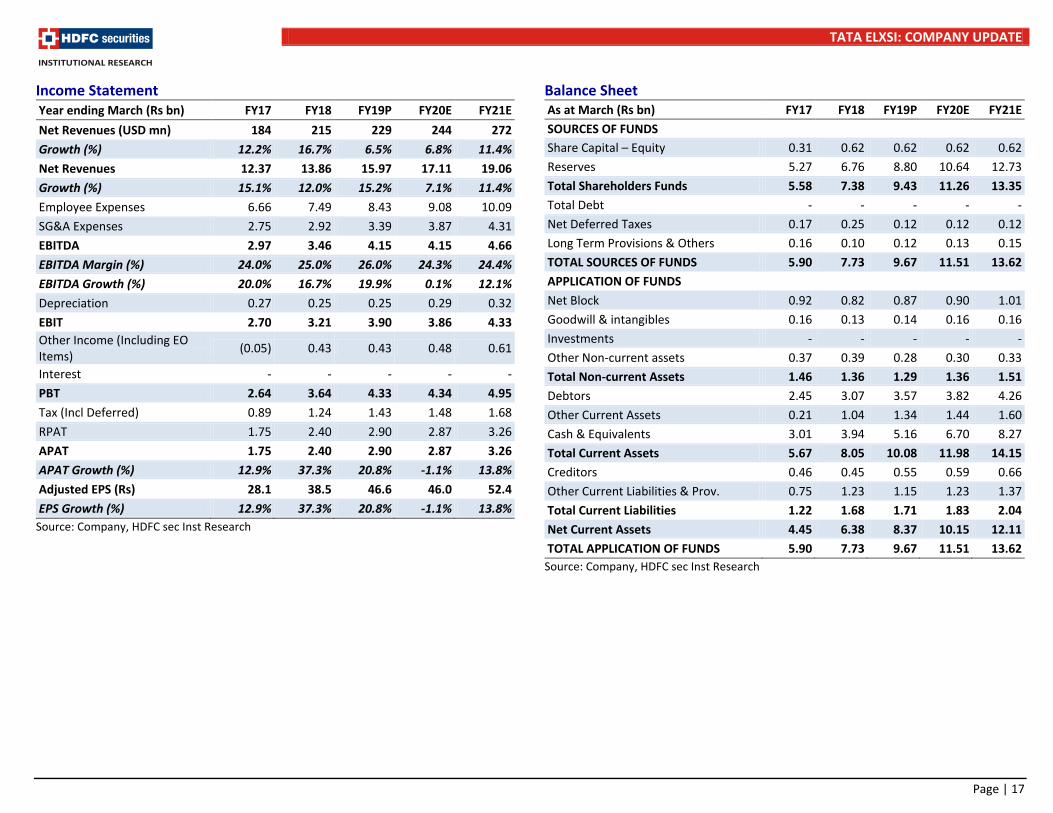
Income Statement Year ending March (Rs bn) FY17 FY18 FY19P FY20E FY21E Net Revenues (USD mn) 184 215 229 244 272 Growth (%) 12.2% 16.7% 6.5% 6.8% 11.4% Net Revenues 12.37 13.86 15.97 17.11 19.06 Growth (%) 15.1% 12.0% 15.2% 7.1% 11.4% Employee Expenses 6.66 7.49 8.43 9.08 10.09 SG&A Expenses 2.75 2.92 3.39 3.87 4.31 EBITDA 2.97 3.46 4.15 4.15 4.66 EBITDA Margin (%) 24.0% 25.0% 26.0% 24.3% 24.4% EBITDA Growth (%) 20.0% 16.7% 19.9% 0.1% 12.1% Depreciation 0.27 0.25 0.25 0.29 0.32 EBIT 2.70 3.21 3.90 3.86 4.33 Other Income (Including EO Items) (0.05) 0.43 0.43 0.48 0.61
Interest - - - - - PBT 2.64 3.64 4.33 4.34 4.95 Tax (Incl Deferred) 0.89 1.24 1.43 1.48 1.68 RPAT 1.75 2.40 2.90 2.87 3.26 APAT 1.75 2.40 2.90 2.87 3.26 APAT Growth (%) 12.9% 37.3% 20.8% -1.1% 13.8% Adjusted EPS (Rs) 28.1 38.5 46.6 46.0 52.4 EPS Growth (%) 12.9% 37.3% 20.8% -1.1% 13.8%
Source: Company, HDFC sec Inst Research
Balance Sheet As at March (Rs bn) FY17 FY18 FY19P FY20E FY21E SOURCES OF FUNDS Share Capital – Equity 0.31 0.62 0.62 0.62 0.62 Reserves 5.27 6.76 8.80 10.64 12.73 Total Shareholders Funds 5.58 7.38 9.43 11.26 13.35 Total Debt - - - - - Net Deferred Taxes 0.17 0.25 0.12 0.12 0.12 Long Term Provisions & Others 0.16 0.10 0.12 0.13 0.15 TOTAL SOURCES OF FUNDS 5.90 7.73 9.67 11.51 13.62 APPLICATION OF FUNDS Net Block 0.92 0.82 0.87 0.90 1.01 Goodwill & intangibles 0.16 0.13 0.14 0.16 0.16 Investments - - - - - Other Non-current assets 0.37 0.39 0.28 0.30 0.33 Total Non-current Assets 1.46 1.36 1.29 1.36 1.51 Debtors 2.45 3.07 3.57 3.82 4.26 Other Current Assets 0.21 1.04 1.34 1.44 1.60 Cash & Equivalents 3.01 3.94 5.16 6.70 8.27 Total Current Assets 5.67 8.05 10.08 11.98 14.15 Creditors 0.46 0.45 0.55 0.59 0.66 Other Current Liabilities & Prov. 0.75 1.23 1.15 1.23 1.37 Total Current Liabilities 1.22 1.68 1.71 1.83 2.04 Net Current Assets 4.45 6.38 8.37 10.15 12.11 TOTAL APPLICATION OF FUNDS 5.90 7.73 9.67 11.51 13.62
Source: Company, HDFC sec Inst Research
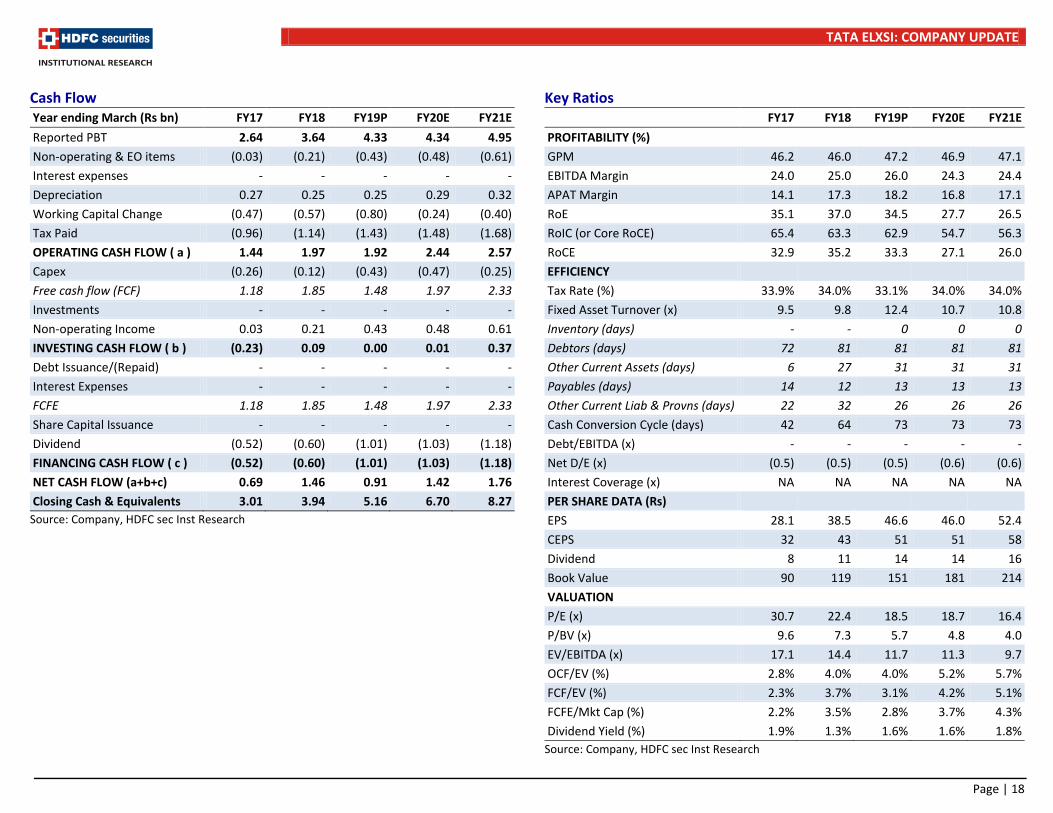
TATA ELXSI: COMPANY UPDATE
Page | 18
Cash Flow Year ending March (Rs bn) FY17 FY18 FY19P FY20E FY21E Reported PBT 2.64 3.64 4.33 4.34 4.95 Non-operating & EO items (0.03) (0.21) (0.43) (0.48) (0.61) Interest expenses - - - - - Depreciation 0.27 0.25 0.25 0.29 0.32 Working Capital Change (0.47) (0.57) (0.80) (0.24) (0.40) Tax Paid (0.96) (1.14) (1.43) (1.48) (1.68) OPERATING CASH FLOW ( a ) 1.44 1.97 1.92 2.44 2.57 Capex (0.26) (0.12) (0.43) (0.47) (0.25) Free cash flow (FCF) 1.18 1.85 1.48 1.97 2.33 Investments - - - - - Non-operating Income 0.03 0.21 0.43 0.48 0.61 INVESTING CASH FLOW ( b ) (0.23) 0.09 0.00 0.01 0.37 Debt Issuance/(Repaid) - - - - - Interest Expenses - - - - - FCFE 1.18 1.85 1.48 1.97 2.33 Share Capital Issuance - - - - - Dividend (0.52) (0.60) (1.01) (1.03) (1.18) FINANCING CASH FLOW ( c ) (0.52) (0.60) (1.01) (1.03) (1.18) NET CASH FLOW (a+b+c) 0.69 1.46 0.91 1.42 1.76 Closing Cash & Equivalents 3.01 3.94 5.16 6.70 8.27
Source: Company, HDFC sec Inst Research
Key Ratios FY17 FY18 FY19P FY20E FY21E PROFITABILITY (%) GPM 46.2 46.0 47.2 46.9 47.1 EBITDA Margin 24.0 25.0 26.0 24.3 24.4 APAT Margin 14.1 17.3 18.2 16.8 17.1 RoE 35.1 37.0 34.5 27.7 26.5 RoIC (or Core RoCE) 65.4 63.3 62.9 54.7 56.3 RoCE 32.9 35.2 33.3 27.1 26.0 EFFICIENCY Tax Rate (%) 33.9% 34.0% 33.1% 34.0% 34.0% Fixed Asset Turnover (x) 9.5 9.8 12.4 10.7 10.8 Inventory (days) - - 0 0 0 Debtors (days) 72 81 81 81 81 Other Current Assets (days) 6 27 31 31 31 Payables (days) 14 12 13 13 13 Other Current Liab & Provns (days) 22 32 26 26 26 Cash Conversion Cycle (days) 42 64 73 73 73 Debt/EBITDA (x) - - - - - Net D/E (x) (0.5) (0.5) (0.5) (0.6) (0.6) Interest Coverage (x) NA NA NA NA NA PER SHARE DATA (Rs) EPS 28.1 38.5 46.6 46.0 52.4 CEPS 32 43 51 51 58 Dividend 8 11 14 14 16 Book Value 90 119 151 181 214 VALUATION P/E (x) 30.7 22.4 18.5 18.7 16.4 P/BV (x) 9.6 7.3 5.7 4.8 4.0 EV/EBITDA (x) 17.1 14.4 11.7 11.3 9.7 OCF/EV (%) 2.8% 4.0% 4.0% 5.2% 5.7% FCF/EV (%) 2.3% 3.7% 3.1% 4.2% 5.1% FCFE/Mkt Cap (%) 2.2% 3.5% 2.8% 3.7% 4.3% Dividend Yield (%) 1.9% 1.3% 1.6% 1.6% 1.8%
Source: Company, HDFC sec Inst Research
TATA ELXSI: COMPANY UPDATE
Page | 19
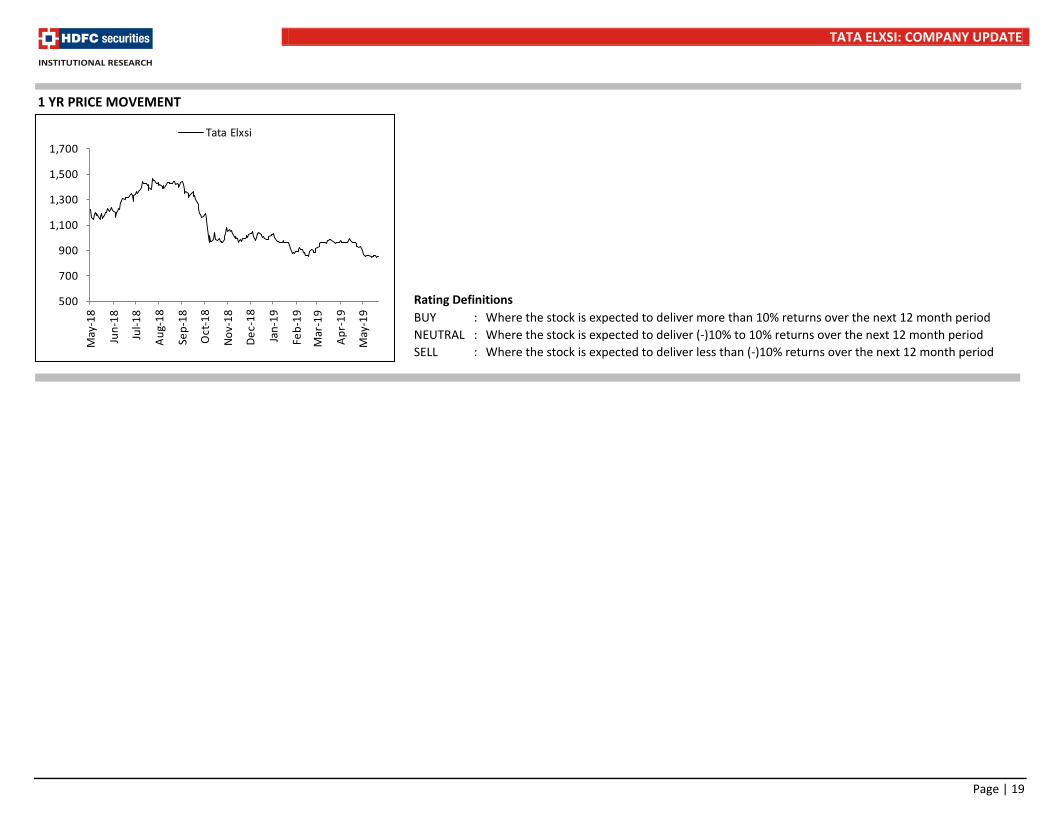
Rating Definitions BUY : Where the stock is expected to deliver more than 10% returns over the next 12 month period NEUTRAL : Where the stock is expected to deliver (-)10% to 10% returns over the next 12 month period SELL : Where the stock is expected to deliver less than (-)10% returns over the next 12 month period
500
700
900
1,100
1,300
1,500
1,700
May
-18
Jun-
18
Jul-1
8
Aug-
18
Sep-
18
Oct
-18
Nov-
18
Dec-
18
Jan-
19
Feb-
19
Mar
-19
Apr-
19
May
-19
Tata Elxsi
1 YR PRICE MOVEMENT
TATA ELXSI: COMPANY UPDATE
Page | 20
Disclosure: We, Apurva Prasad, MBA, Amit Chandra, MBA & Akshay Ramnani, CA, authors and the names subscribed to this report, hereby certify that all of the views expressed in this research report accurately reflect our views about the subject issuer(s) or securities. HSL has no material adverse disciplinary history as on the date of publication of this report. We also certify that no part of our compensation was, is, or will be directly or indirectly related to the specific recommendation(s) or view(s) in this report. Research Analyst or his/her relative or HDFC Securities Ltd. does not have any financial interest in the subject company. Also Research Analyst or his relative or HDFC Securities Ltd. or its Associate may have beneficial ownership of 1% or more in the subject company at the end of the month immediately preceding the date of publication of the Research Report. Further Research Analyst or his relative or HDFC Securities Ltd. or its associate does not have any material conflict of interest. Any holding in stock –No HDFC Securities Limited (HSL) is a SEBI Registered Research Analyst having registration no. INH000002475. Disclaimer: This report has been prepared by HDFC Securities Ltd and is meant for sole use by the recipient and not for circulation. The information and opinions contained herein have been compiled or arrived at, based upon information obtained in good faith from sources believed to be reliable. Such information has not been independently verified and no guaranty, representation of warranty, express or implied, is made as to its accuracy, completeness or correctness. All such information and opinions are subject to change without notice. This document is for information purposes only. Descriptions of any company or companies or their securities mentioned herein are not intended to be complete and this document is not, and should not be construed as an offer or solicitation of an offer, to buy or sell any securities or other financial instruments. This report is not directed to, or intended for display, downloading, printing, reproducing or for distribution to or use by, any person or entity who is a citizen or resident or located in any locality, state, country or other jurisdiction where such distribution, publication, reproduction, availability or use would be contrary to law or regulation or what would subject HSL or its affiliates to any registration or licensing requirement within such jurisdiction. If this report is inadvertently send or has reached any individual in such country, especially, USA, the same may be ignored and brought to the attention of the sender. This document may not be reproduced, distributed or published for any purposes without prior written approval of HSL. Foreign currencies denominated securities, wherever mentioned, are subject to exchange rate fluctuations, which could have an adverse effect on their value or price, or the income derived from them. In addition, investors in securities such as ADRs, the values of which are influenced by foreign currencies effectively assume currency risk. It should not be considered to be taken as an offer to sell or a solicitation to buy any security. HSL may from time to time solicit from, or perform broking, or other services for, any company mentioned in this mail and/or its attachments. HSL and its affiliated company(ies), their directors and employees may; (a) from time to time, have a long or short position in, and buy or sell the securities of the company(ies) mentioned herein or (b) be engaged in any other transaction involving such securities and earn brokerage or other compensation or act as a market maker in the financial instruments of the company(ies) discussed herein or act as an advisor or lender/borrower to such company(ies) or may have any other potential conflict of interests with respect to any recommendation and other related information and opinions. HSL, its directors, analysts or employees do not take any responsibility, financial or otherwise, of the losses or the damages sustained due to the investments made or any action taken on basis of this report, including but not restricted to, fluctuation in the prices of shares and bonds, changes in the currency rates, diminution in the NAVs, reduction in the dividend or income, etc. HSL and other group companies, its directors, associates, employees may have various positions in any of the stocks, securities and financial instruments dealt in the report, or may make sell or purchase or other deals in these securities from time to time or may deal in other securities of the companies / organizations described in this report. HSL or its associates might have managed or co-managed public offering of securities for the subject company or might have been mandated by the subject company for any other assignment in the past twelve months. HSL or its associates might have received any compensation from the companies mentioned in the report during the period preceding twelve months from t date of this report for services in respect of managing or co-managing public offerings, corporate finance, investment banking or merchant banking, brokerage services or other advisory service in a merger or specific transaction in the normal course of business. HSL or its analysts did not receive any compensation or other benefits from the companies mentioned in the report or third party in connection with preparation of the research report. Accordingly, neither HSL nor Research Analysts have any material conflict of interest at the time of publication of this report. Compensation of our Research Analysts is not based on any specific merchant banking, investment banking or brokerage service transactions. HSL may have issued other reports that are inconsistent with and reach different conclusion from the information presented in this report. Research entity has not been engaged in market making activity for the subject company. Research analyst has not served as an officer, director or employee of the subject company. We have not received any compensation/benefits from the subject company or third party in connection with the Research Report. HDFC securities Limited, I Think Techno Campus, Building - B, "Alpha", Office Floor 8, Near Kanjurmarg Station, Opp. Crompton Greaves, Kanjurmarg (East), Mumbai 400 042 Phone: (022) 3075 3400 Fax: (022) 2496 5066 Compliance Officer: Binkle R. Oza Email: [email protected] Phone: (022) 3045 3600 HDFC Securities Limited, SEBI Reg. No.: NSE-INB/F/E 231109431, BSE-INB/F 011109437, AMFI Reg. No. ARN: 13549, PFRDA Reg. No. POP: 04102015, IRDA Corporate Agent License No.: HDF 2806925/HDF C000222657, SEBI Research Analyst Reg. No.: INH000002475, CIN - U67120MH2000PLC152193 Mutual Funds Investments are subject to market risk. Please read the offer and scheme related documents carefully before investing.
TATA ELXSI: COMPANY UPDATE
Page | 21
HDFC securities Institutional Equities Unit No. 1602, 16th Floor, Tower A, Peninsula Business Park, Senapati Bapat Marg, Lower Parel,Mumbai - 400 013 Board : +91-22-6171 7330 www.hdfcsec.com