Embed Size (px)
Citation preview
Task‐specific measurement uncertainty budget of Curvic‐coupling using analytical methods
Bekim V. Gashi1,*, Trevor Toman1, Ranveer S. Matharu1 1Coventry University, Faculty of Engineering & Computing, 3 Gulson Road, Coventry CV1 2JH, UK, Centre for Manufacturing and Materials Engineering
Abstract. A number of Industrial reference components manufactured by grinding to achieve tight dimensional tolerances. In this paper, we present an uncertainty budget of a reference forty-tooth #Curvic measured using an accurate Coordinate Measuring Machine (CMM) in a temperature-controlled laboratory. A number of measurements conducted on Curvicto assess measurement repeatability and reproducibility. Expanded uncertainty budget evaluated from twenty-one Influencing factors, giving8.7 µm (7.1 µm from Type A) and 11 µm (9.6 µm from Type A), respectively, for repeatability and reproducibility test (k >2). Measurement uncertainty due to steady-state thermal effects is 2.2 µm. An adaptable model is presented to evaluate transient thermal effects, a factor often neglected in measurement uncertainty. Thermal time constant uncertainty associated with transient thermal effects is evaluated, u τ 398s, which corresponds to ±15 % of thermal time constant expanded uncertainty, U τ 2570s.
#Curvic® (Curvic is a trademark of The Gleason Works, 1000 University Avenue, Rochester, NY, 14603, USA)
1. Introduction
Innovation, safety and competitiveness are three of the key areas that a systematic and scientific approach to capturing, analysing and using metrology and measurement data will improve manufactured components. In order for this information to be of maximum value, it requires a thorough understanding of the process, the quantified individual inputs, their behaviours with respect to each other, external influencesand the systems outputs.Manufactured components measured for dimensional verification to comply with engineering design drawingsincluding dimensions and appropriate tolerances to relevant standards, ISO 1101:2004 [1]. Measurements are than carried out using appropriate methods and techniques. Measurement results of any kind areonly an estimate of the “true” value. True value is not known, so every measurement should indicate measured estimate, plus, measurement uncertainty for completeness. In other words, a statement of uncertainty is a statement of quality and reliability of output result of a test, experiment or measurement [2]. A good example is the challenges faced in manufacturing, assembling and managing an
* Corresponding author: [email protected]
© The Authors, published by EDP Sciences. This is an open access article distributed under the terms of the Creative Commons Attribution License 4.0 (http://creativecommons.org/licenses/by/4.0/).
19th International Congress of Metrology, 09007 (2019) https://doi.org/10.1051/metrology/201909007
aircraft jet engine. Aircraft engines are complex systems, comprising of many individual components assembled together for operational completeness [3, 4].
When assembling engine components, the intention is to align accurately each component onto place so the engine can operate effectively under high loading, delivering against the above objectives. Numerous specifications must be complied too for various reasons based on; tolerance, fit, function, cost, life cycle performance and decommissioning of engines [3, 4].
Amongst many components in a jet engine, is Curvic (also referred to as Curvic coupling). Curvic is a ring type specialist hardened steel component comprising of a number of teeth on the upper face spline equally spaced around its circumference at constant depth [5]. Curvicis used for connecting engine members to form a single assembled unit. When engine is in operation it transmits power between members [rotors] connected either side--front and back. To ensure Curvic meet stringent dimensional tolerances, a master Curvic is held as a reference against which all other couplings are checked [3, 5].
To ensure the master Curvic can be used as a reference, it must be measuredas accurately as possible and an uncertainty budget produced to be included in the results to ensure traceability [2, 6]. Traceability is defined as "property of a measurement result whereby the result can be related to a reference through a documented unbroken chain of calibrations, eachcontributing to the measurement uncertainty", JCGM 200:2012 [7].Measurement uncertainty estimation defined in the ‘Guide to the Expression of Uncertainty in Measurement (GUM)’, JCGM 100:2008 [8], and the requirements and necessity for task specific measurement uncertainty is derived in ISO 17025:2017 [9].
With increased productivity and global competition for better components and products, manufacturing companies in particular are required to state measurement uncertainty in order to conclude that products are within design specifications [10, 11]. This is particularly important to companies that drive productivity and innovation, and maintain traceability to requirednational and international standards [2, 11, 12].
A comprehensive review paper by Wilhelm et al. outlines the five main categories and estimation of uncertainty in coordinate measurement systems (CMS); hardware, work-piece, software-fitting algorithms, sampling strategies, and extrinsic factors [11, 13-19]. In other words, complete knowledge of the above five categories is rather difficult for any measurement task. Although modern CMS have advanced tremendously in the past few decades, they too are not completely immune to factors influencing their performance characteristics, and as such, the uncertainties associated with the above five categories vary in magnitude from task to task [2, 20].
Curviccan be measured using gear measurement machines. These machines generally use scanning probes rather than touch-probes, which traces the form of the tooth. Scanned data are than used to generate tooth geometry. However, an alternative cost-effective and well-established method is to use CMM. Modern CMM’s are highly accurate and capable to measure complex; small to large components [21-23].
The mathematical modelling from the GUM(JCGM 100:2008)can be used to estimate task specific measurement uncertainty of any measurement scenario provided enough information is available to build the models [8]. The mathematical models can be solved using computer software, such as spreadsheets, or other more sophisticated programming languages. This way the models can be checked for errors and debugged using built-in software tools or user-defined programming codes. With advancement of computer power and software capabilities, it is possible to create effective and dynamic task-specific uncertainty budgets. A popular and tested method is Monte-Carlo simulation. This method is versatile and applicable to measurement uncertainty estimation; examples presented in a number of published works [25 – 30]. Other software-based methods for uncertainty estimation developed, including Virtual Coordinate Measuring Machine (VCMM) developed
2
19th International Congress of Metrology, 09007 (2019) https://doi.org/10.1051/metrology/201909007
at PTB [25] and other cost effective simulation methods suitable for industrial applications, such as PoliTo [31]. Modelling uncertainty through analysis of variance techniques and novel method based on Bayesian regularized artificial neural networks developed and tested [32, 33].
A paper published by Orchard, N.B used two different CMM to measure a single face of forty-toothmaster Curvic. First CMM with U3 specification (4.9 + 5L/1000) µm produced measurement result with a maximum deviation from the mean of 3.5 µm and 4.3 µm, respectively for repeatability and reproducibility tests. Second CMM with U3 specification (0.48 + 5L/1000) µm produced measurement result with a maximum deviation of 2.4 µm and 3.7 µm, respectively for repeatability and reproducibility tests. Measurements show good pattern of error, and overall good correlation range of ±1.1 µm, and a standard deviation of correlation of ±0.6 µm [20]. These results indicate that CMM suitability to measure Curvic down to micron levels accuracies.
In this paper, a forty-tooth Curvic was measured using an accurate CMM located in a temperature-controlled laboratory to half a degree Celsius. Twenty-two repeated measurements conducted to evaluate measurement repeatability and reproducibility, and uncertainty budget evaluated based on twenty-three influencing factors in accordance to GUM [8].
2. Measurement details
2.1. The Curvic
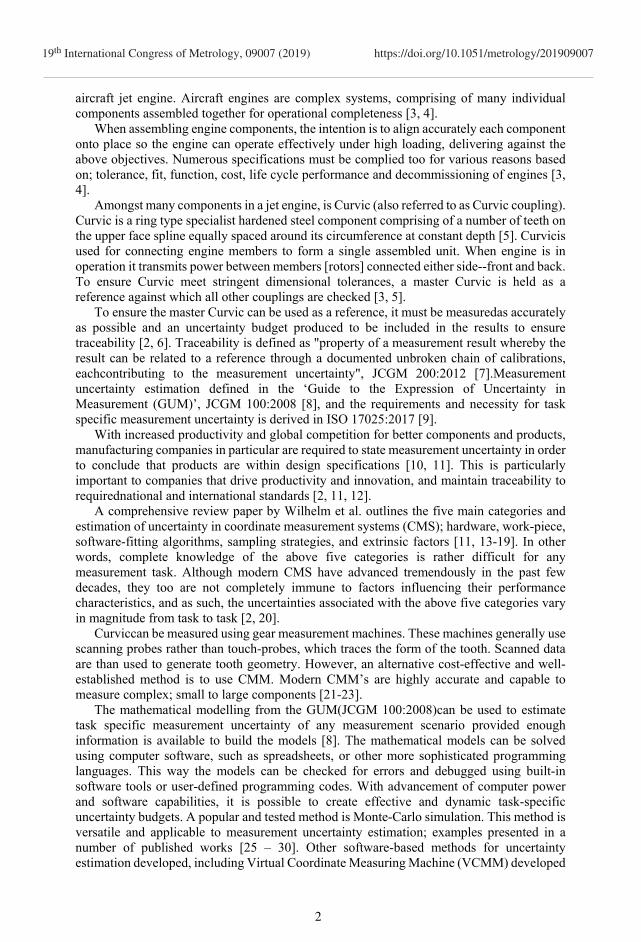
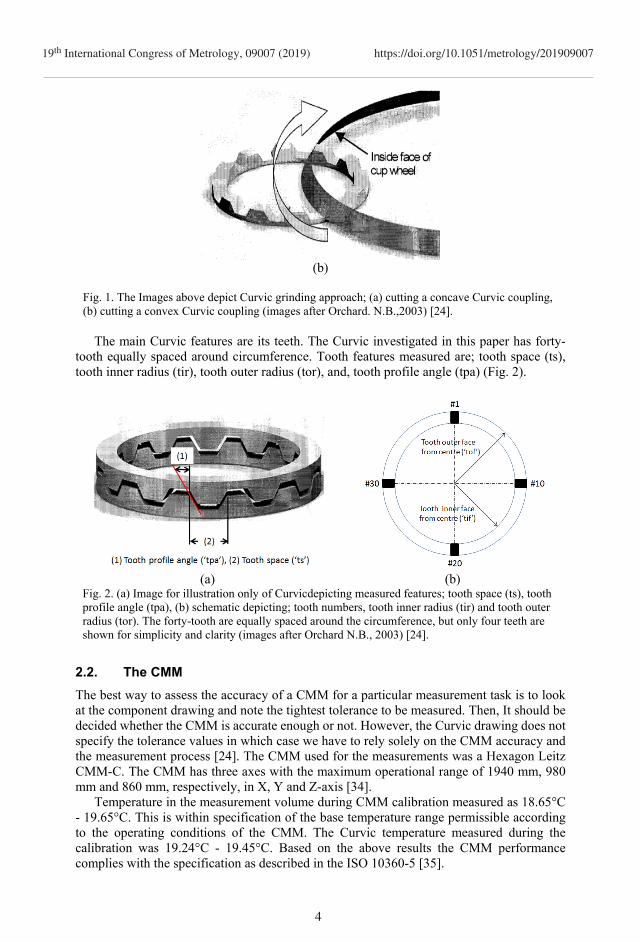
To achieve tight dimensional tolerance, Curvicmachined using a unique cup-shaped grinding wheel. The grinding wheels designed so the grinding face is at an angle relative to Curvic gears so the required gear face angle achieved [5]. The grinding wheel machines two teeth simultaneously. The grinding action of teeth achieved by rotating the Curvic through a specific pitch angle in stages (Fig. 1).
(a)
3
19th International Congress of Metrology, 09007 (2019) https://doi.org/10.1051/metrology/201909007
(b)
Fig. 1. The Images above depict Curvic grinding approach; (a) cutting a concave Curvic coupling, (b) cutting a convex Curvic coupling (images after Orchard. N.B.,2003) [24].
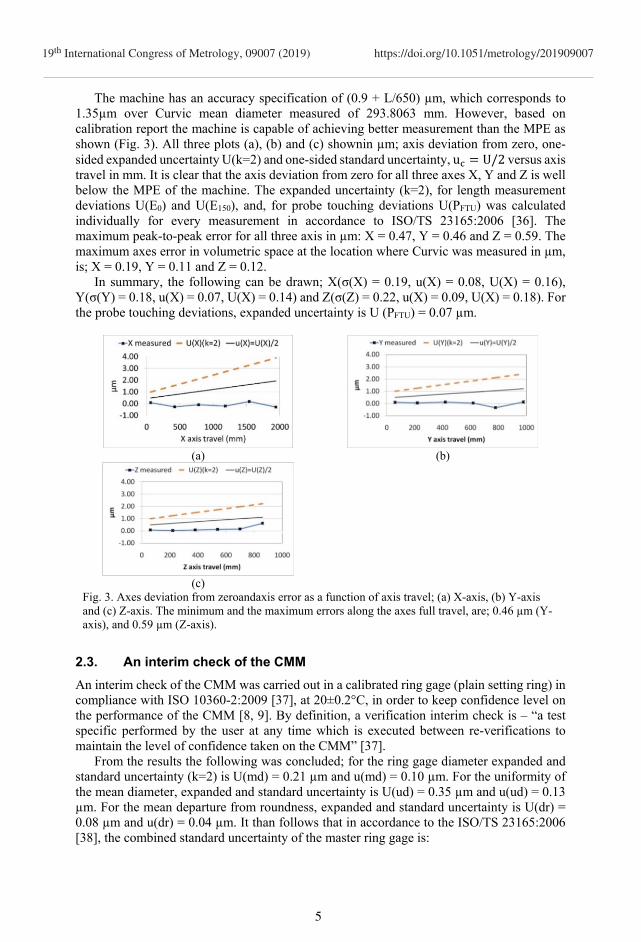
The main Curvic features are its teeth. The Curvic investigated in this paper has forty-
tooth equally spaced around circumference. Tooth features measured are; tooth space (ts), tooth inner radius (tir), tooth outer radius (tor), and, tooth profile angle (tpa) (Fig. 2).
(a) (b) Fig. 2. (a) Image for illustration only of Curvicdepicting measured features; tooth space (ts), tooth profile angle (tpa), (b) schematic depicting; tooth numbers, tooth inner radius (tir) and tooth outer radius (tor). The forty-tooth are equally spaced around the circumference, but only four teeth are shown for simplicity and clarity (images after Orchard N.B., 2003) [24].
2.2. The CMM
The best way to assess the accuracy of a CMM for a particular measurement task is to look at the component drawing and note the tightest tolerance to be measured. Then, It should be decided whether the CMM is accurate enough or not. However, the Curvic drawing does not specify the tolerance values in which case we have to rely solely on the CMM accuracy and the measurement process [24]. The CMM used for the measurements was a Hexagon Leitz CMM-C. The CMM has three axes with the maximum operational range of 1940 mm, 980 mm and 860 mm, respectively, in X, Y and Z-axis [34].
Temperature in the measurement volume during CMM calibration measured as 18.65°C - 19.65°C. This is within specification of the base temperature range permissible according to the operating conditions of the CMM. The Curvic temperature measured during the calibration was 19.24°C - 19.45°C. Based on the above results the CMM performance complies with the specification as described in the ISO 10360-5 [35].
4
19th International Congress of Metrology, 09007 (2019) https://doi.org/10.1051/metrology/201909007
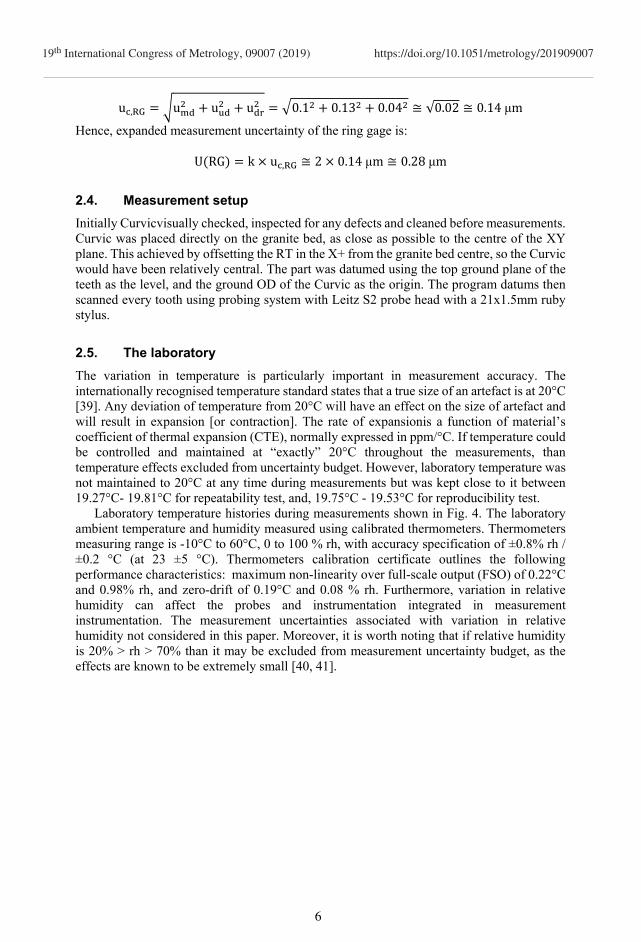
The machine has an accuracy specification of (0.9 + L/650) µm, which corresponds to 1.35µm over Curvic mean diameter measured of 293.8063 mm. However, based on calibration report the machine is capable of achieving better measurement than the MPE as shown (Fig. 3). All three plots (a), (b) and (c) shownin µm; axis deviation from zero, one-sided expanded uncertainty U(k=2) and one-sided standard uncertainty, u U/2 versus axis travel in mm. It is clear that the axis deviation from zero for all three axes X, Y and Z is well below the MPE of the machine. The expanded uncertainty (k=2), for length measurement deviations U(E0) and U(E150), and, for probe touching deviations U(PFTU) was calculated individually for every measurement in accordance to ISO/TS 23165:2006 [36]. The maximum peak-to-peak error for all three axis in µm: X = 0.47, Y = 0.46 and Z = 0.59. The maximum axes error in volumetric space at the location where Curvic was measured in µm, is; X = 0.19, Y = 0.11 and Z = 0.12.
In summary, the following can be drawn; X(σ(X) = 0.19, u(X) = 0.08, U(X) = 0.16), Y(σ(Y) = 0.18, u(X) = 0.07, U(X) = 0.14) and Z(σ(Z) = 0.22, u(X) = 0.09, U(X) = 0.18). For the probe touching deviations, expanded uncertainty is U (PFTU) = 0.07 µm.
(a)
(b)
(c)
Fig. 3. Axes deviation from zeroandaxis error as a function of axis travel; (a) X-axis, (b) Y-axis and (c) Z-axis. The minimum and the maximum errors along the axes full travel, are; 0.46 µm (Y-axis), and 0.59 µm (Z-axis).
2.3. An interim check of the CMM
An interim check of the CMM was carried out in a calibrated ring gage (plain setting ring) in compliance with ISO 10360-2:2009 [37], at 20±0.2°C, in order to keep confidence level on the performance of the CMM [8, 9]. By definition, a verification interim check is – “a test specific performed by the user at any time which is executed between re-verifications to maintain the level of confidence taken on the CMM” [37].
From the results the following was concluded; for the ring gage diameter expanded and standard uncertainty (k=2) is U(md) = 0.21 µm and u(md) = 0.10 µm. For the uniformity of the mean diameter, expanded and standard uncertainty is U(ud) = 0.35 µm and u(ud) = 0.13 µm. For the mean departure from roundness, expanded and standard uncertainty is U(dr) = 0.08 µm and u(dr) = 0.04 µm. It than follows that in accordance to the ISO/TS 23165:2006 [38], the combined standard uncertainty of the master ring gage is:
5
19th International Congress of Metrology, 09007 (2019) https://doi.org/10.1051/metrology/201909007
u , u u u 0.1 0.13 0.04 ≅ √0.02 ≅ 0.14μm
Hence, expanded measurement uncertainty of the ring gage is:
U RG k u , ≅ 2 0.14μm ≅ 0.28μm
2.4. Measurement setup
Initially Curvicvisually checked, inspected for any defects and cleaned before measurements. Curvic was placed directly on the granite bed, as close as possible to the centre of the XY plane. This achieved by offsetting the RT in the X+ from the granite bed centre, so the Curvic would have been relatively central. The part was datumed using the top ground plane of the teeth as the level, and the ground OD of the Curvic as the origin. The program datums then scanned every tooth using probing system with Leitz S2 probe head with a 21x1.5mm ruby stylus.
2.5. The laboratory
The variation in temperature is particularly important in measurement accuracy. The internationally recognised temperature standard states that a true size of an artefact is at 20°C [39]. Any deviation of temperature from 20°C will have an effect on the size of artefact and will result in expansion [or contraction]. The rate of expansionis a function of material’s coefficient of thermal expansion (CTE), normally expressed in ppm/°C. If temperature could be controlled and maintained at “exactly” 20°C throughout the measurements, than temperature effects excluded from uncertainty budget. However, laboratory temperature was not maintained to 20°C at any time during measurements but was kept close to it between 19.27°C- 19.81°C for repeatability test, and, 19.75°C - 19.53°C for reproducibility test.
Laboratory temperature histories during measurements shown in Fig. 4. The laboratory ambient temperature and humidity measured using calibrated thermometers. Thermometers measuring range is -10°C to 60°C, 0 to 100 % rh, with accuracy specification of ±0.8% rh / ±0.2 °C (at 23 ±5 °C). Thermometers calibration certificate outlines the following performance characteristics: maximum non-linearity over full-scale output (FSO) of 0.22°C and 0.98% rh, and zero-drift of 0.19°C and 0.08 % rh. Furthermore, variation in relative humidity can affect the probes and instrumentation integrated in measurement instrumentation. The measurement uncertainties associated with variation in relative humidity not considered in this paper. Moreover, it is worth noting that if relative humidity is 20% > rh > 70% than it may be excluded from measurement uncertainty budget, as the effects are known to be extremely small [40, 41].
6
19th International Congress of Metrology, 09007 (2019) https://doi.org/10.1051/metrology/201909007
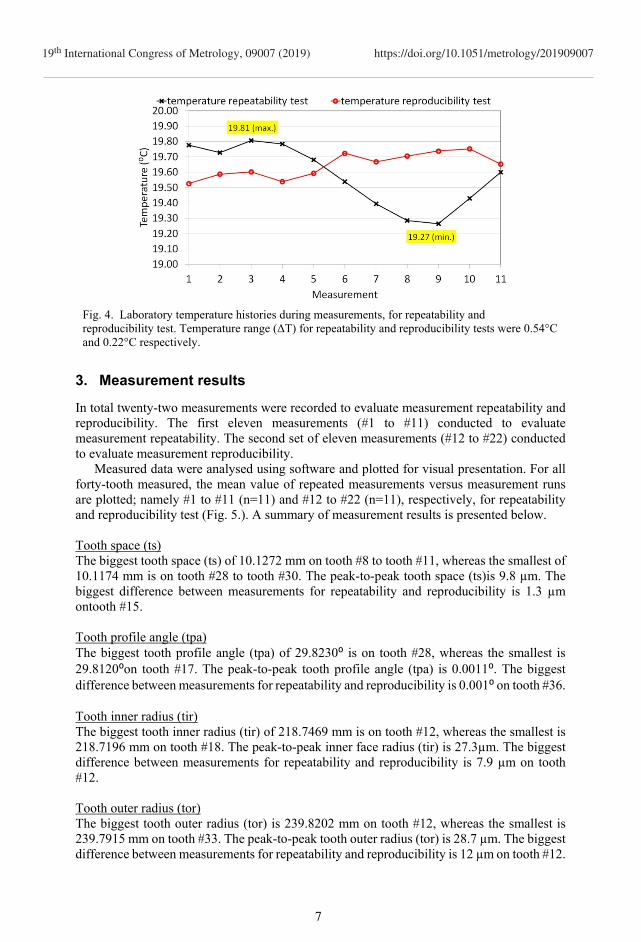
Fig. 4. Laboratory temperature histories during measurements, for repeatability and reproducibility test. Temperature range (ΔT) for repeatability and reproducibility tests were 0.54°C and 0.22°C respectively.
3. Measurement results
In total twenty-two measurements were recorded to evaluate measurement repeatability and reproducibility. The first eleven measurements (#1 to #11) conducted to evaluate measurement repeatability. The second set of eleven measurements (#12 to #22) conducted to evaluate measurement reproducibility.
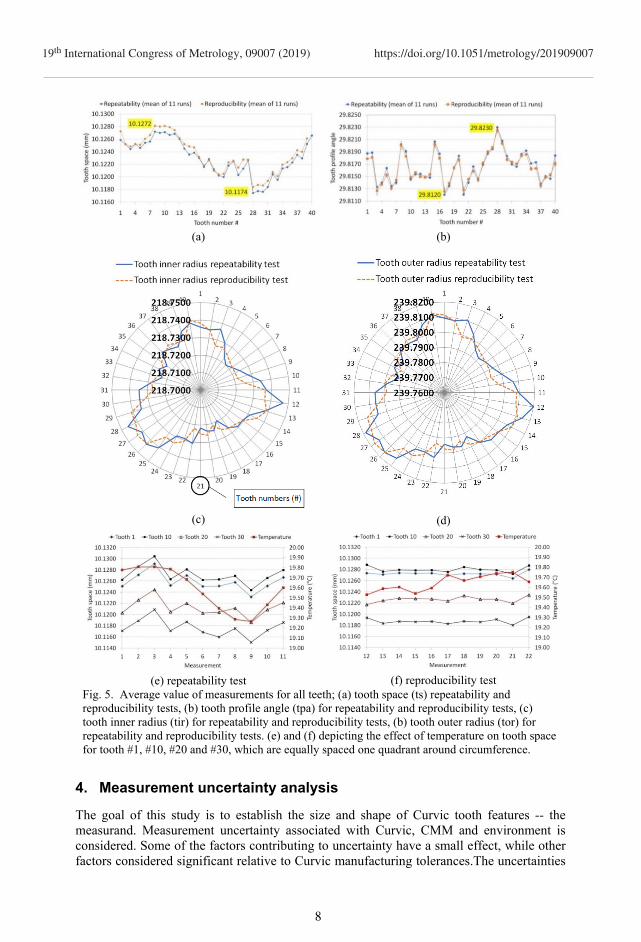
Measured data were analysed using software and plotted for visual presentation. For all forty-tooth measured, the mean value of repeated measurements versus measurement runs are plotted; namely #1 to #11 (n=11) and #12 to #22 (n=11), respectively, for repeatability and reproducibility test (Fig. 5.). A summary of measurement results is presented below.
Tooth space (ts) The biggest tooth space (ts) of 10.1272 mm on tooth #8 to tooth #11, whereas the smallest of 10.1174 mm is on tooth #28 to tooth #30. The peak-to-peak tooth space (ts)is 9.8 µm. The biggest difference between measurements for repeatability and reproducibility is 1.3 µm ontooth #15. Tooth profile angle (tpa) The biggest tooth profile angle (tpa) of 29.8230⁰ is on tooth #28, whereas the smallest is 29.8120⁰on tooth #17. The peak-to-peak tooth profile angle (tpa) is 0.0011⁰. The biggest difference between measurements for repeatability and reproducibility is 0.001⁰ on tooth #36. Tooth inner radius (tir) The biggest tooth inner radius (tir) of 218.7469 mm is on tooth #12, whereas the smallest is 218.7196 mm on tooth #18. The peak-to-peak inner face radius (tir) is 27.3µm. The biggest difference between measurements for repeatability and reproducibility is 7.9 µm on tooth #12. Tooth outer radius (tor) The biggest tooth outer radius (tor) is 239.8202 mm on tooth #12, whereas the smallest is 239.7915 mm on tooth #33. The peak-to-peak tooth outer radius (tor) is 28.7 µm. The biggest difference between measurements for repeatability and reproducibility is 12 µm on tooth #12.
7
19th International Congress of Metrology, 09007 (2019) https://doi.org/10.1051/metrology/201909007
(a) (b)
(c)
(d)
(e) repeatability test (f) reproducibility test Fig. 5. Average value of measurements for all teeth; (a) tooth space (ts) repeatability and reproducibility tests, (b) tooth profile angle (tpa) for repeatability and reproducibility tests, (c) tooth inner radius (tir) for repeatability and reproducibility tests, (b) tooth outer radius (tor) for repeatability and reproducibility tests. (e) and (f) depicting the effect of temperature on tooth space for tooth #1, #10, #20 and #30, which are equally spaced one quadrant around circumference.
4. Measurement uncertainty analysis
The goal of this study is to establish the size and shape of Curvic tooth features -- the measurand. Measurement uncertainty associated with Curvic, CMM and environment is considered. Some of the factors contributing to uncertainty have a small effect, while other factors considered significant relative to Curvic manufacturing tolerances.The uncertainties
8
19th International Congress of Metrology, 09007 (2019) https://doi.org/10.1051/metrology/201909007
associated with measured quantities are known as Type A uncertainties and are evaluated using statistical methods. Type B uncertainties evaluated using other mathematical means. For Type A uncertainties, the mean value of repeated observations is evaluated as follows [8]:
∑ ∑ (1)
The individual observations, q , may differ in value because of random variations in the
influence quantities which is an indication of the repeatability of the measurement. The spread of values of the number of samples rather than the whole population determined by an estimate, s q , of the standard deviation of the repeated observations, n:
∑ (2)
Where; n is the number of repeated observations, qi, is the value of individual observation
and, q is the mean value of n-observations. It than follows than for Type A uncertainty, the standard deviation of the mean can be evaluated as follows:
≡√
≡√
(3)
The standard uncertainty of the mean is the width of the distribution of the mean, which
corresponds to a confidence probability of 68% (± 1s (qi)). The coefficient 1/√(n) is the sensitivity coefficient and is determined by the number of repeated measurement and must be at least one; n 1 and as n → ∞ the sensitivity coefficient 1/√(n) → 0. The combined standard deviation, uc(y), evaluated as follows:
∑ ≡ ∑ (4)
The expanded uncertainty, U, is than obtained by multiplying the standard uncertainty,
uc(y), by a suitable coverage factor, k:
(5) The value of coverage factor, k, is determined by obtaining an estimate of the effective
degrees of freedom, veff, of the combined standard uncertainty, uc(y). The veff is based on the degrees of freedom, vi, of individual standard uncertainties, uc(y). The recommended approach is to use Welch-Satterthwaite equation [8].
∑ (6)
The degrees of freedom, vi, of individual standard uncertainties uc (y) for Type B
evaluation of uncertainties, when veff is calculated from Welch-Satterthwaite equation above takes another form, given by [8]:
∆
(7)
9
19th International Congress of Metrology, 09007 (2019) https://doi.org/10.1051/metrology/201909007
The larger the number of degrees of freedom, vi, the smaller the coverage factor, k, and the smaller the expanded uncertainty U = kuc, which also shows that more information was available to evaluate measurement uncertainty. The relationship between vi, and the coverage factor, k, is non-linear determined by the t-distribution. The coverage factor, k, from t-distribution for p=95%, has the following properties; when vi = 1 t(v) = 12.71, when 1 < vi ≤ 18 4.3 < t(v) < 2.11, when 18 < vi < 53 2.1 < t(v) < 2.01, when 53 < vi < 69 t(v) = 2.0, when 69 < vi < 96 t(v) = 1.99, and so on (extracted from[43]). Tooth space (ts) For repeatability test, the minimum and the maximum values are 10.1174 mm and 10.1272 mm respectively (range 9.8µm). For reproducibility test, the minimum and the maximum values are 10.1184 mm and 10.1281 mm respectively (range 9.7µm). The difference between repeatability and reproducibility test is 0.1 µm.
The standard deviation, s ts ; for repeatability test, the minimum and maximum value, respectively, 0.0013 mm and 0.0021 mm (range 0.8µm). For reproducibility test, the minimum and the maximum value, respectively, 0.0003 mm and 0.0013 mm (range 1µm). The difference between repeatability and reproducibility test is 0.2 µm. Individual uncertainties for each tooth evaluated using Eq.3, and combined standard uncertainties evaluated using Eq.4:
For repeatability test:
u μ u μ ⋯ u μ 0.46 ⋯ 0.47 ≅ 3.0μm
For reproducibility test:
u μ u μ ⋯ u μ 0.11 ⋯ 0.26 ≅ 1.3µm
These are treated as Type A uncertainty and hence the number of degrees of freedom to assign is; ν n 1 10. This is valid when repeated measurements are estimated by arithmetic mean of n-independent observations [8]. Tooth inner radius (tir) For repeatability test, the minimum and the maximum values are 218.7196 mm and 218.7469 mm respectively (range 27.3 µm). For reproducibility test, the minimum and the maximum values are 218.7213 mm and 218.7438 mm respectively (range 22.5 µm). The difference between repeatability and reproducibility test is 4.8 µm.
The standard deviations, s tir ; for repeatability test, the minimum and the maximum values, respectively, 0.0005 mm and 0.0016 mm (range 1.1 µm). For reproducibility test, the minimum and the maximum values, respectively, 0.0006 mm and 0.0041 mm (range 3.5 µm). The difference between repeatability and reproducibility test is 2.4 µm. Individual uncertainties for each tooth evaluated using Eq.3, and combined standard uncertainties evaluated using Eq.4: For repeatability test:
u μ u μ ⋯ u μ 0.26 ⋯ 0.27 ≅ 1.8μm
10
19th International Congress of Metrology, 09007 (2019) https://doi.org/10.1051/metrology/201909007
For reproducibility test:
u μ u μ ⋯ u μ 0.46 ⋯ 0.26 ≅ 3.5μm
The number of degrees of freedom to assign is, ν n 1 10. Tooth outer radius (tor) For repeatability test, the minimum and the maximum values are 239.7915 mm and 239.8202 mm respectively (range 28.7 µm). For reproducibility test, the minimum and the maximum values, respectively, 239.7919 mm and 239.8169 mm (range 25 µm). The difference between repeatability and reproducibility test is 3.7 µm.
The standard deviations, s tor ; for repeatability test the minimum and the maximum values, respectively, 0.0005mm and 0.0019mm (range 1.4µm). For reproducibility test, the minimum and the maximum values, respectively, 0.0007 mm and 0.0044 mm (range 3.7 µm). The difference between repeatability and reproducibility test is 1.4 µm. Individual uncertainties for each tooth evaluated using Eq.3, and combined standard uncertainties evaluated using Eq.4:
For repeatability test:
u μ u μ ⋯ u μ 0.28 ⋯ 0.26 ≅ 2.1μm
For reproducibility test:
u μ u μ ⋯ u μ 0.53 ⋯ 0.23 ≅ 3.9μm
The number of degrees of freedom to assign is, ν n 1 10. Tooth profile angle (tpa) For repeatability test, the minimum and the maximum values are 29.8120° and 29.8230° respectively (range 11 x 10-3 °). For reproducibility test, the minimum and the maximum values are 29.8126° and 29.8225° respectively (range 9.9 x 10⁻³ °). The difference between repeatability and reproducibility test is (9.9 x 10⁻³)°.
The standard deviations, s tpa ; for repeatability test the minimum and the maximum values, respectively, 0.00005° and 0.00080° (range 0.7 x 10⁻³ °). For reproducibility test, the minimum and the maximum values, respectively, 0.00022° and 0.00214° (range 1.9 x 10⁻³ °). The difference between repeatability and reproducibility test is 1.9 x 10⁻³ °. Individual uncertainties for each tooth evaluated using Eq.3, and combined relative standard uncertainties evaluated using Eq.4: For repeatability test:
u tpatpa
u tpatpa
⋯u tpatpa
0.129 1029.8187
⋯0.145 1029.8183
≅ 2.5ppm/°
11
19th International Congress of Metrology, 09007 (2019) https://doi.org/10.1051/metrology/201909007
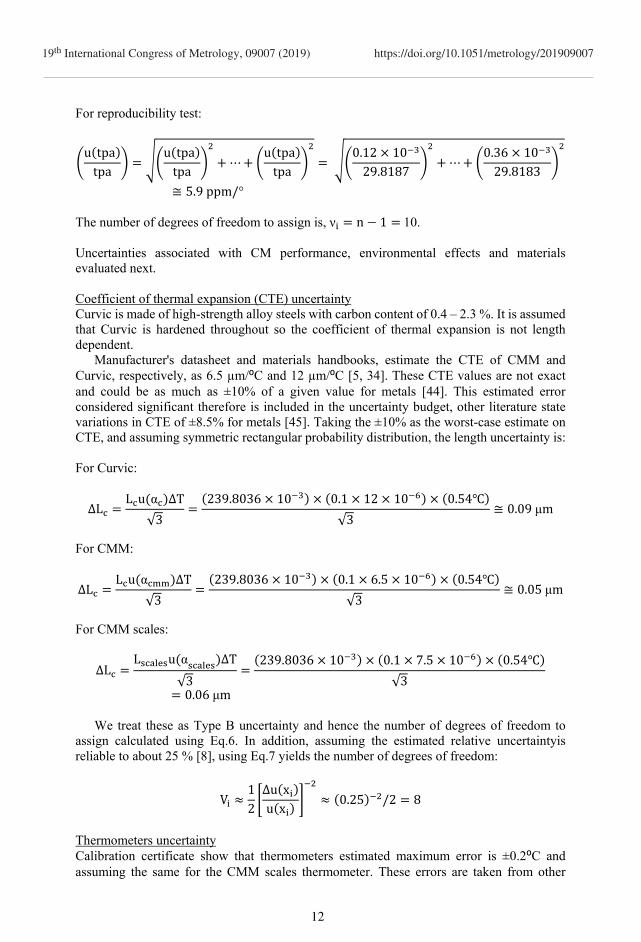
For reproducibility test:
u tpatpa
u tpatpa
⋯u tpatpa
0.12 1029.8187
⋯0.36 1029.8183
≅ 5.9ppm/° The number of degrees of freedom to assign is, ν n 1 10. Uncertainties associated with CM performance, environmental effects and materials evaluated next. Coefficient of thermal expansion (CTE) uncertainty Curvic is made of high-strength alloy steels with carbon content of 0.4 – 2.3 %. It is assumed that Curvic is hardened throughout so the coefficient of thermal expansion is not length dependent.
Manufacturer's datasheet and materials handbooks, estimate the CTE of CMM and Curvic, respectively, as 6.5 µm/⁰C and 12 µm/⁰C [5, 34]. These CTE values are not exact and could be as much as ±10% of a given value for metals [44]. This estimated error considered significant therefore is included in the uncertainty budget, other literature state variations in CTE of ±8.5% for metals [45]. Taking the ±10% as the worst-case estimate on CTE, and assuming symmetric rectangular probability distribution, the length uncertainty is: For Curvic:
∆LL u α ∆T
√3
239.8036 10 0.1 12 10 0.54
√3≅ 0.09μm
For CMM:
∆LL u α ∆T
√3
239.8036 10 0.1 6.5 10 0.54
√3≅ 0.05μm
For CMM scales:
∆LL u α ∆T
√3
239.8036 10 0.1 7.5 10 0.54
√30.06μm
We treat these as Type B uncertainty and hence the number of degrees of freedom to
assign calculated using Eq.6. In addition, assuming the estimated relative uncertaintyis reliable to about 25 % [8], using Eq.7 yields the number of degrees of freedom:
V12∆u xu x
0.25 /2 8
Thermometers uncertainty Calibration certificate show that thermometers estimated maximum error is ±0.2⁰C and assuming the same for the CMM scales thermometer. These errors are taken from other
12
19th International Congress of Metrology, 09007 (2019) https://doi.org/10.1051/metrology/201909007
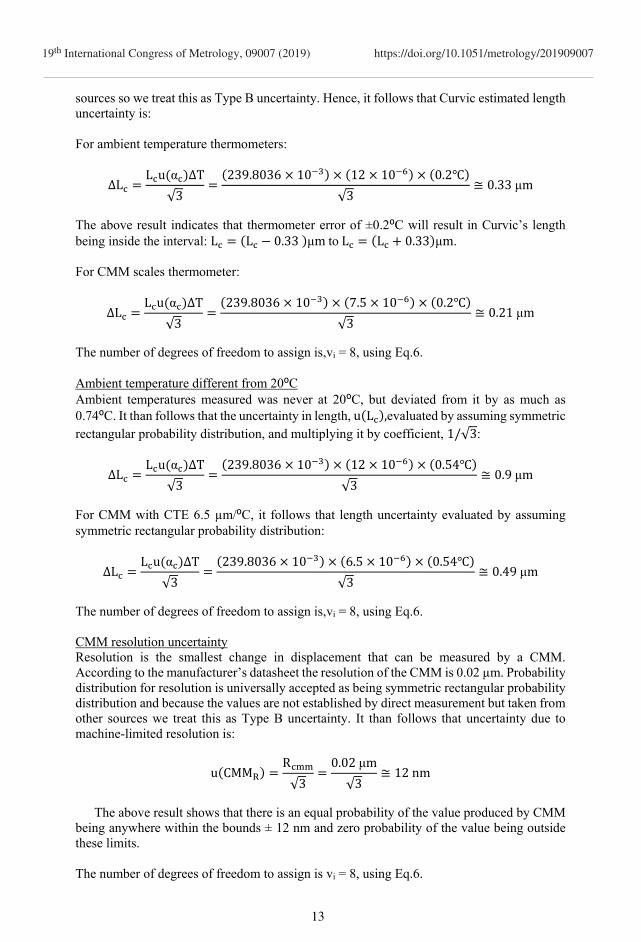
sources so we treat this as Type B uncertainty. Hence, it follows that Curvic estimated length uncertainty is: For ambient temperature thermometers:
∆LL u α ∆T
√3
239.8036 10 12 10 0.2
√3≅ 0.33μm
The above result indicates that thermometer error of ±0.2⁰C will result in Curvic’s length being inside the interval: L L 0.33 μmtoL L 0.33 μm. For CMM scales thermometer:
∆LL u α ∆T
√3
239.8036 10 7.5 10 0.2
√3≅ 0.21μm
The number of degrees of freedom to assign is,vi = 8, using Eq.6. Ambient temperature different from 20⁰C Ambient temperatures measured was never at 20⁰C, but deviated from it by as much as 0.74⁰C. It than follows that the uncertainty in length, u L ,evaluated by assuming symmetric rectangular probability distribution, and multiplying it by coefficient, 1/√3:
∆LL u α ∆T
√3
239.8036 10 12 10 0.54
√3≅ 0.9μm
For CMM with CTE 6.5 µm/⁰C, it follows that length uncertainty evaluated by assuming symmetric rectangular probability distribution:
∆LL u α ∆T
√3
239.8036 10 6.5 10 0.54
√3≅ 0.49μm
The number of degrees of freedom to assign is,vi = 8, using Eq.6. CMM resolution uncertainty Resolution is the smallest change in displacement that can be measured by a CMM. According to the manufacturer’s datasheet the resolution of the CMM is 0.02 µm. Probability distribution for resolution is universally accepted as being symmetric rectangular probability distribution and because the values are not established by direct measurement but taken from other sources we treat this as Type B uncertainty. It than follows that uncertainty due to machine-limited resolution is:
u CMMR
√3
0.02μm
√3≅ 12nm
The above result shows that there is an equal probability of the value produced by CMM
being anywhere within the bounds ± 12 nm and zero probability of the value being outside these limits. The number of degrees of freedom to assign is vi = 8, using Eq.6.
13
19th International Congress of Metrology, 09007 (2019) https://doi.org/10.1051/metrology/201909007
CMM calibration uncertainty The CMM calibration process and methods used are not perfect, they to have uncertainties that is expected to be not as significant to the overall uncertainty budget. Assuming 0.2 µm uncertainty in the calibration of the CMM, and a symmetric rectangular probability distribution and by treating this as a Type B uncertainty, It than follows that CMM calibration uncertainty:
u CMMR
√3
0.2μm
√3≅ 0.12μm
The number of degrees of freedom to assign is vi = 8, using Eq.6. CMM drift since calibration The CMM drift since last calibration calculated from passed historical calibration certificates was not available. Prior knowledge of similar CMM operating under similar environmental conditions and calibration over three-year period showed drift of typically 0.25 µm.
Assuming symmetric rectangular probability distribution and by treating this as a Type B uncertainty, Itthen follows that theCMM drift uncertainty:
u CMMR
√3
0.25μm
√3≅ 0.15μm
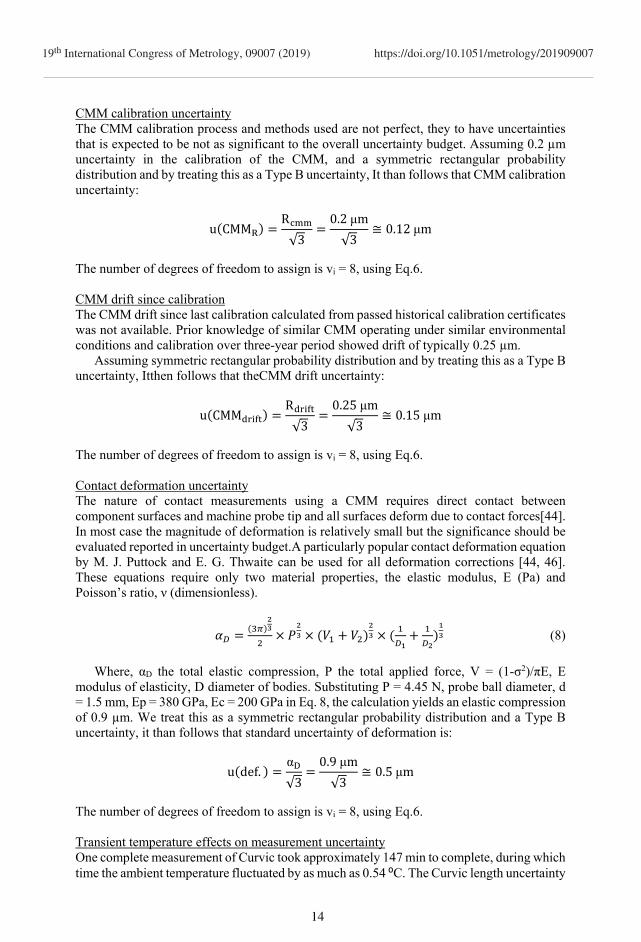
The number of degrees of freedom to assign is vi = 8, using Eq.6. Contact deformation uncertainty The nature of contact measurements using a CMM requires direct contact between component surfaces and machine probe tip and all surfaces deform due to contact forces[44]. In most case the magnitude of deformation is relatively small but the significance should be evaluated reported in uncertainty budget.A particularly popular contact deformation equation by M. J. Puttock and E. G. Thwaite can be used for all deformation corrections [44, 46]. These equations require only two material properties, the elastic modulus, E (Pa) and Poisson’s ratio, ν (dimensionless).
(8)
Where, αD the total elastic compression, P the total applied force, V = (1-σ2)/πE, E
modulus of elasticity, D diameter of bodies. Substituting P = 4.45 N, probe ball diameter, d = 1.5 mm, Ep = 380 GPa, Ec = 200 GPa in Eq. 8, the calculation yields an elastic compression of 0.9 µm. We treat this as a symmetric rectangular probability distribution and a Type B uncertainty, it than follows that standard uncertainty of deformation is:
u def.α
√3
0.9μm
√3≅ 0.5μm
The number of degrees of freedom to assign is vi = 8, using Eq.6. Transient temperature effects on measurement uncertainty One complete measurement of Curvic took approximately 147 min to complete, during which time the ambient temperature fluctuated by as much as 0.54 ⁰C. The Curvic length uncertainty
14
19th International Congress of Metrology, 09007 (2019) https://doi.org/10.1051/metrology/201909007
due to temperature fluctuation of 0.54 ⁰C evaluated; 2.13μm, which assumes the Curvic has reached the steady-state thermal equilibrium. However, in reality this is not the case as Curvic would lack behind to changes in ambient temperatures by a specific amount of time determined by the thermal time constant, τ (s). Thermal time constant is a measure of the time it takes for a material to reach ≈ 63.2 % of the steady-state thermal equilibrium, and after (t=5τ) component reach ≈ 99.4 % of thermal equilibrium. Time constant is a function of mass, m (kg), specific heat capacity, Cp (J/kg⁰C), thermal conductivity, k (W/m⁰C), and component surface area, A (m2), given by the following equation:
(9)
The parameters in Eq. 9, have uncertainty [45], that have to be considered when
calculating the component thermal time constant, τ (sec). Including these uncertainties in Eq. 9, provides a better estimate of the thermal time constant of component undergoing transient thermal effects. Treating this as Type B uncertainty and assuming symmetric rectangular probability distribution of half-width, yields:
m 141.82 0.11 kg , u m.
√≅ 64 gr
C 450 25 , u C√≅ 14
k 48.52 2.5 W/m , u k.
√≅ 1.4 W/m
A 0.51 0.008 m , u A.
√≅ 0.5 cm
The combined standard uncertainty, u τ , is the positive square root of the combined
variance, u τ which is given by [8]:
∑ (10)
Evaluating partial derivatives for each parameter in Eq.9, and substituting these in Eq. 10,
yields:
u τCkA
u mmkA
u CmCk A
u kmCkA
u A
≅ 199s The expanded uncertainty evaluated assuming rectangular probability distribution and a
coverage factor, k = 2:
U τ k u τ 2 199 s ≅ 398s ≅ 6.63min Substituting values for m, Cp, k, A, and U τ in Eq. 9,yields:
τmCkA
≅142 45048.5 0.5
U τ ≅ 2570 398 s
The time constant, τ, for Curvic of mean radius 239.8036 mm is, τ = (2570 ± 398) s. This
is the time it takes Curvic to reach ≈ 63.2 % of the thermal equilibrium. Furthermore, it takes approximately 5τ ≈ (12,850 ± 398) s, or, ≈ 3.569 hrs, to reach ≈ 99.4 % of thermal equilibrium. Calculation show that Curvic cannot respond instantaneously to temperature
15
19th International Congress of Metrology, 09007 (2019) https://doi.org/10.1051/metrology/201909007
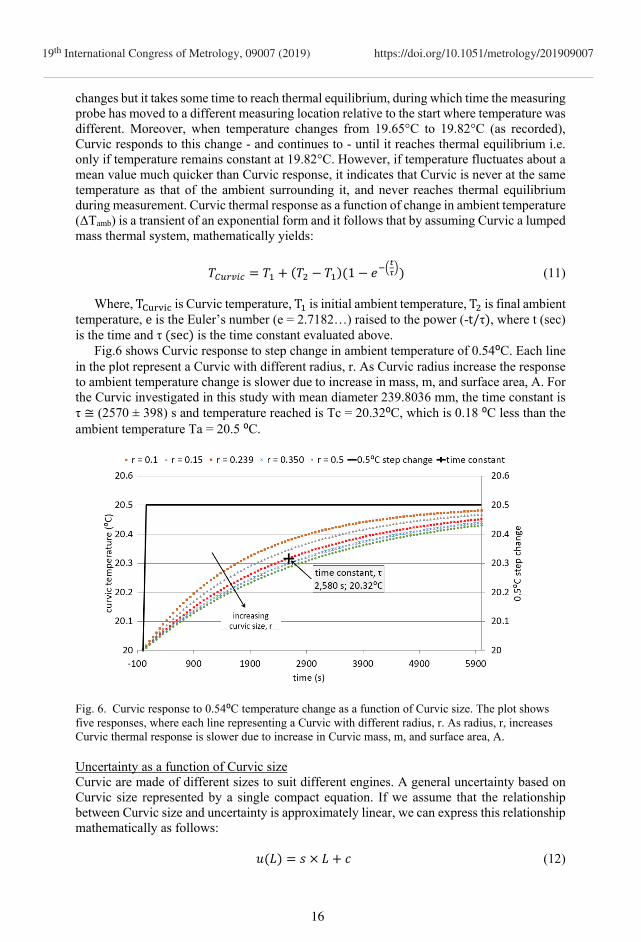
changes but it takes some time to reach thermal equilibrium, during which time the measuring probe has moved to a different measuring location relative to the start where temperature was different. Moreover, when temperature changes from 19.65°C to 19.82°C (as recorded), Curvic responds to this change - and continues to - until it reaches thermal equilibrium i.e. only if temperature remains constant at 19.82°C. However, if temperature fluctuates about a mean value much quicker than Curvic response, it indicates that Curvic is never at the same temperature as that of the ambient surrounding it, and never reaches thermal equilibrium during measurement. Curvic thermal response as a function of change in ambient temperature (ΔTamb) is a transient of an exponential form and it follows that by assuming Curvic a lumped mass thermal system, mathematically yields:
1 (11)
Where, T is Curvic temperature, T is initial ambient temperature, T is final ambient temperature, e is the Euler’s number (e = 2.7182…) raised to the power (-t/τ , where t (sec) is the time and τ sec is the time constant evaluated above.
Fig.6 shows Curvic response to step change in ambient temperature of 0.54⁰C. Each line in the plot represent a Curvic with different radius, r. As Curvic radius increase the response to ambient temperature change is slower due to increase in mass, m, and surface area, A. For the Curvic investigated in this study with mean diameter 239.8036 mm, the time constant is τ ≅ (2570 ± 398) s and temperature reached is Tc = 20.32⁰C, which is 0.18 ⁰C less than the ambient temperature Ta = 20.5 ⁰C.
Fig. 6. Curvic response to 0.54⁰C temperature change as a function of Curvic size. The plot shows five responses, where each line representing a Curvic with different radius, r. As radius, r, increases Curvic thermal response is slower due to increase in Curvic mass, m, and surface area, A. Uncertainty as a function of Curvic size Curvic are made of different sizes to suit different engines. A general uncertainty based on Curvic size represented by a single compact equation. If we assume that the relationship between Curvic size and uncertainty is approximately linear, we can express this relationship mathematically as follows:
(12)
16
19th International Congress of Metrology, 09007 (2019) https://doi.org/10.1051/metrology/201909007
Where, u L is length uncertainty, s is the slope of the line, and, c is the intercept on the uncertainty Y-axis. For a particular Curvic size L C with uncertaintyu C , and another Curvic size L C with uncertainty, u C , the uncertainty related to Curvic size can be established. It than follows that by substituting these in equation Eq.12, yields:
(13)
(14)
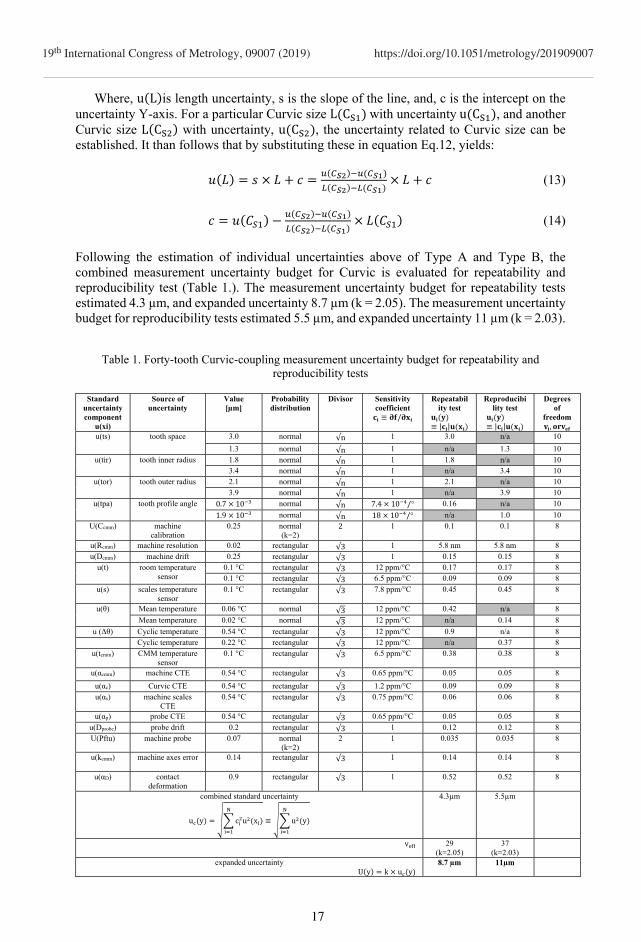
Following the estimation of individual uncertainties above of Type A and Type B, the combined measurement uncertainty budget for Curvic is evaluated for repeatability and reproducibility test (Table 1.). The measurement uncertainty budget for repeatability tests estimated 4.3 µm, and expanded uncertainty 8.7 µm (k = 2.05). The measurement uncertainty budget for reproducibility tests estimated 5.5 µm, and expanded uncertainty 11 µm (k = 2.03).
Table 1. Forty-tooth Curvic-coupling measurement uncertainty budget for repeatability and reproducibility tests
Standard uncertainty component
u(xi)
Source of uncertainty
Value [µm]
Probability distribution
Divisor Sensitivity coefficient ≡ /
Repeatability test
≡ | |
Reproducibility test
≡ | |
Degrees of
freedom ,
u(ts) tooth space 3.0 normal √n 1 3.0 n/a 10
1.3 normal √n 1 n/a 1.3 10 u(tir) tooth inner radius 1.8 normal √n 1 1.8 n/a 10
3.4 normal √n 1 n/a 3.4 10 u(tor) tooth outer radius 2.1 normal √n 1 2.1 n/a 10
3.9 normal √n 1 n/a 3.9 10 u(tpa) tooth profile angle 0.7 10 normal √n 7.4 10 /° 0.16 n/a 10
1.9 10 normal √n 18 10 /° n/a 1.0 10 U(Ccmm) machine
calibration 0.25 normal
(k=2) 2 1 0.1 0.1 8
u(Rcmm) machine resolution 0.02 rectangular √3 1 5.8 nm 5.8 nm 8 u(Dcmm) machine drift 0.25 rectangular √3 1 0.15 0.15 8
u(t) room temperature sensor
0.1 °C rectangular √3 12 ppm/°C 0.17 0.17 8 0.1 °C rectangular √3 6.5 ppm/°C 0.09 0.09 8
u(s) scales temperature sensor
0.1 °C rectangular √3 7.8 ppm/°C 0.45 0.45 8
u(θ) Mean temperature 0.06 °C normal √3 12 ppm/°C 0.42 n/a 8
Mean temperature 0.02 °C normal √3 12 ppm/°C n/a 0.14 8
u (Δθ) Cyclic temperature 0.54 °C rectangular √3 12 ppm/°C 0.9 n/a 8 Cyclic temperature 0.22 °C rectangular √3 12 ppm/°C n/a 0.37 8
u(tcmm) CMM temperature sensor
0.1 °C rectangular √3 6.5 ppm/°C 0.38 0.38 8
u(αcmm) machine CTE 0.54 °C rectangular √3 0.65 ppm/°C 0.05 0.05 8
u(αc) Curvic CTE 0.54 °C rectangular √3 1.2 ppm/°C 0.09 0.09 8 u(αs) machine scales
CTE 0.54 °C rectangular √3 0.75 ppm/°C 0.06 0.06 8
u(αp) probe CTE 0.54 °C rectangular √3 0.65 ppm/°C 0.05 0.05 8 u(Dprobe) probe drift 0.2 rectangular √3 1 0.12 0.12 8 U(Pftu) machine probe 0.07 normal
(k=2) 2 1 0.035 0.035 8
u(kcmm) machine axes error 0.14 rectangular √3 1 0.14 0.14 8
u(αD) contact deformation
0.9 rectangular √3 1 0.52 0.52 8
combined standard uncertainty
u y c u x ≡ u y
4.3µm 5.5µm
v 29 (k=2.05)
37 (k=2.03)
expanded uncertainty U y k u y
8.7 µm 11µm
17
19th International Congress of Metrology, 09007 (2019) https://doi.org/10.1051/metrology/201909007
Curvic length is lc = (lm± 0.0087) mm and lc = (lm± 0.011) mm, respectively, for repeatability and reproducibility test. The number following the symbol ± is the numerical value of (an expanded uncertainty) U = kuc. U determined from (a combined standard uncertainty) uc = 4.3 µm and uc = 5.5 µm, respectively, for repeatability and reproducibility tests. Coverage factor k=2.05 and k=2.03, respectively, for repeatability and reproducibility test based on the t-distribution for v = 30 and v = 24, respectively, for repeatability and reproducibility test, and defines an interval estimated to have a level of confidence of 95 %, ISO GUM [8].
5. Conclusion
Task-specific measurement uncertainty budget created for forty-tooth Curvic. Curvic was measured using an accurate CMM located in a temperature control laboratory to within ±0.54⁰C. In total twenty-two repeated measurement conducted, to evaluate measurement repeatability and reproducibility.
The uncertainty budget comprises of twenty-two influencing factors available contributing towards the uncertainty budget. Six (6) factors identified as Type A uncertainties estimated using statistical methods, and sixteen (16) identified as Type B uncertainties estimated using prior knowledge from other sources and using other mathematical means. From the work conducted in this study the following conclusions are drawn:
Expanded measurement uncertainty for reproducibility test is 11 µm, which is 2.3 µm (~21%) more than for repeatability test of 8.7 µm.
Measurement uncertainty for direct measurements on Curvic tooth features (Type A) are; for reproducibility test 9.6 µm, which is 2.5 µm (~26%) more than for repeatability test of 7.1 µm.
Overall combined measurement uncertainty of 2.2 µm is due to steady-state temperature effects.
Thermal time constant uncertainty evaluated is ±398s (~6.63 min), which corresponds to ± 15% of thermal time constant expanded uncertainty 2570s (~ 42.83 min) of measured component. These times are considered significant for many precision measurement applications. Examples include unique and intricate component features that require many data points, where measurementscan take hours or even days to complete.
Uncertainty due to transient thermal effects is especially significant when measuring relatively large components, when measurements take relatively long time to complete relative to component’s thermal time constant.
6. Acknowledgement
The authors would like to thank the collaborators and sponsors; Rolls-Royce plc, Hexagon and Trescal, without whom this work would not be possible. Moreover, special thanks go to the specialist technical staff and metrologists for organising, setting-up and programming the CMM, collating measured data, in particular Oliver Noakes at Hexagon, and Richard Parker at Trescal.
7. References
1. ISO 1101, Geometrical Product Specifications (GPS) -- Geometrical tolerancing -- Tolerances of form, orientation, location and run-out (2004)
2. T. Toman, B. V. Gashi, Expanding the possibilities through the application of
measurement knowledge, technology, skills and standards; measurement uncertainty
18
19th International Congress of Metrology, 09007 (2019) https://doi.org/10.1051/metrology/201909007
as an enabler for validation and confidence in measurement data and data sharing – Task Specific Uncertainty, EPMC Conference, Coventry (2018)
3. Rolls-Royce plc., The jet engine (4th ed.), Derby: Rolls-Royce (1986)
4. R. Flack, Fundamentals of jet propulsion with applications (Cambridge aerospace
series ; 17), Cambridge University Press, (2011)
5. Gleason, Curvic Coupling Design, 1000 University Ave, Rochester, NY, 14603, USA https://www.geartechnology.com/issues/1186x/Back-to-Basics.pdf
6. H. H. Nørgaard, E. Savio, L. De Chiffre, Traceability and Uncertainty Estimation in
Coordinate Metrology, Ed. pp. 363-368. Proc. of Prime, http://www.forskningsdatabasen.dk/en/catalog/2389446799, (2001)
7. JCGM 200, International vocabulary of metrology – Basic and general concepts and
associated terms (VIM), https://www.bipm.org/utils/common/documents/jcgm/JCGM_200_2012.pdf, (2012)
8. JCGM 100, Evaluation of measurement data — Guide to the expression of uncertainty
in measurement, https://www.bipm.org/utils/common/documents/jcgm/JCGM_100_2008_E.pdf, (2008)
9. ISO/IEC 17025, General requirements for the competence of testing and calibration
laboratories, https://www.iso.org/standard/66912.html, (2017)
10. ISO 14253-1, Geometrical product specifications (GPS) -- Inspection by measurement of workpieces and measuring equipment -- Part 1: Decision rules for verifying conformity or nonconformity with specifications, https://www.iso.org/standard/70137.html, (2017)
11. R. G. Wilhelm, R. J. Hocken, H. Schwenke, Task specific uncertainty in coordinate
measurement, CIRP annals, 50(2), pp.553-563, https://doi.org/10.1016/S0007-8506(07)62995-3, (2001)
12. ISO 9001, Quality management systems — Requirements,
https://www.iso.org/standard/62085.html, (2015)
13. A. Weckenmann, M. Knauer, H. Kunzmann, The influence of measurement strategy on the uncertainty of CMM-measurements, CIRP Annals, 47(1), pp.451-454, https://doi.org/10.1016/S0007-8506(07)62872-8, (1998)
14. C. Porta, F. Wäldele, Testing of three coordinate measuring machine evaluation
algorithms, Office for Official Publications of the European Communities, (1986)
15. N. V. Gestel, P. Bleys, F. Welkenhuyzen, J. P. Kruth, Influence of feature form deviations on CMM measurement uncertainties, Int. J. of Prec. Tech., 2(2-3), pp.192-210, (2011)
19
19th International Congress of Metrology, 09007 (2019) https://doi.org/10.1051/metrology/201909007
16. S. D. Phillips, B. Borchardt, G. Caskey, Measurement uncertainty considerations for coordinate measuring machines, NASA STI/Recon Technical Report N, 93.1993STIN...9331196P, (1993)
17. R. J. Hocken, Sampling issues in coordinate metrology, Manufacturing Review, 6(4),
pp.282-294, (1993) 18. A. Balsamo, G. Colonnetti, M. Franke, E. Trapet, F. Wäldele, L. De Jonge, P.
Vanherck, Results of the CIRP-Euromet inter-comparison of ball plate-based techniques for determining CMM parametric errors. CIRP Annals, 46(1), pp.463-466, https://doi.org/10.1016/S0007-8506(07)60866-X, (1997)
19. H. N. Hansen, L. De Chiffre, An industrial comparison of coordinate measuring
machines in Scandinavia with focus on uncertainty statements, Precision engineering, 23(3), pp.185-195, https://doi.org/10.1016/S0141-6359(99)00009-4, (1999)
20. B. V. Gashi, Thermal and deformation analysis of machine tool joint interfaces (PhD
thesis), Cranfield University, Cranfield, UK, (2008)
21. C. Sanz, C. Giusca, P. Morantz, A. Marin, A. Chérif, J. Schneider, H. M. Durand, P. Shore, N. Steffens, Form measurement of a 0.1 mm diameter wire with a chromatic confocal sensor, with associated uncertainty evaluation, Measurement Science and Technology, 29(7), p.074010, http://iopscience.iop.org/article/10.1088/1361-6501/aac352/meta, (2018)
22. H. Schwenke, F. Härtig, K. Wendt, F. Wäldele, Future challenges in co-ordinate
metrology: addressing metrological problems for very small and very large parts, Proc. of IDW conference, Knoxville (pp. 1-12), (2001)
23. K. Kniel, F. Haertig, K. Rost, GI-07 Automatic determination of the measurement
uncertainty for involute gear measurands (inspection of gears), The Proc. JSME international conference on motion and power transmissions, 2009(0), pp.203-207, https://doi.org/10.1299/jsmeimpt.2009.203, (2009)
24. N. B. Orchard, Inspection of Curvic couplings using a CMM, Trans. on Eng. Sci., Vol.
44, © 2003 WIT Press, www.witpress.com, ISSN 1743-3533, (2003) 25. K. Rost, K. Wendt, F. Härtig, Evaluating a task-specific measurement uncertainty for
gear measuring instruments via Monte Carlo simulation, Prec. Eng., 44, pp.220-230, https://doi.org/10.1016/j.precisioneng.2016.01.001, (2016)
26. M. G. Cox, A. B. Forbes, G. N. Peggs, Simulation techniques for uncertainty
estimation in co-ordinate metrology, NPL Report, UK, (2001) 27. M. G. Cox, B. R. Siebert, The use of a Monte Carlo method for evaluating uncertainty
and expanded uncertainty. Metrologia, 43(4), p.S178, (2006) 28. A. B. Forbes, P. N. Harris, Simulated instruments and uncertainty estimation, NPL –
UK, Centre for Mathematics and Scientific Computing, (2000)
20
19th International Congress of Metrology, 09007 (2019) https://doi.org/10.1051/metrology/201909007
29. J. Sładek, A. Gąska, Evaluation of coordinate measurement uncertainty with use of virtual machine model based on Monte Carlo method, Measurement, 45(6), pp.1564-1575, (2012)
30. S. Aguado, P. Pérez, J.A. Albajez, J. Velázquez, J. Santolaria. Monte Carlo method to
machine tool uncertainty evaluation, Proc. Man., V(13), pp. 585-592, ISSN 2351-9789, https://doi.org/10.1016/j.promfg.2017.09.105, (2017)
31. F. Aggogeri, G. Barbato, E. M. Barini, G. Genta, R. Levi, Measurement uncertainty
assessment of Coordinate Measuring Machines by simulation and planned experimentation, CIRP (JMST), 4(1), pp.51-56, (2011)
32. M. Papananias, S. Fletcher, A. P. Longstaff, A. Mengot, K. Jonas, A. B. Forbes,
Modelling uncertainty associated with comparative coordinate measurement through analysis of variance techniques, 17th International Conference of the EUSPEN, pp. 407-408, https://www.scopus.com/inward/record.uri?eid=2-s2.0-, (2017)
33. M. Papananias, S. Fletcher, A. Longstaff, A. Mengot, A novel method based on
Bayesian regularized artificial neural networks for measurement uncertainty evaluation, 16th International Conference of the EUSPEN, https://www.scopus.com/inward/record.uri?eid=2-s2.0-, (2016)
34. Hexagon manufacturing intelligence, Leitz PMM-C - Ultra-High Precision CMM and
Gear Measuring System, https://www.hexagonmi.com/products/coordinate-measuring-machines/bridge-cmms/leitz-pmmc, (2018)
35. ISO 10360-5, Geometrical product specifications (GPS) -- Acceptance and
reverification tests for coordinate measuring machines (CMM) -- Part 5: CMMs using single and multiple stylus contacting probing systems, (2010)
36. ISO/TS 23165, Geometrical product specifications (GPS) -- Guidelines for the
evaluation of coordinate measuring machine (CMM) test uncertainty, (2006) 37. ISO 10360-2, Geometrical product specifications (GPS) -- Acceptance and re-
verification tests for coordinate measuring machines (CMM) -- Part 2: CMMs used for measuring linear dimensions, (2009)
38. ISO/TS 23165, Geometrical product specifications (GPS) -- Guidelines for the
evaluation of coordinate measuring machine (CMM) test uncertainty, (2006) 39. ISO 1, Geometrical product specifications (GPS) -- Standard reference temperature
for the specification of geometrical and dimensional properties, (2016) 40. UKAS M3003. Ed. 3. The Expression of Uncertainty and Confidence in Measurement,
(2012) 41. International Atomic Energy Agency (IAEA), Measurement Uncertainty: A Practical
Guide for Secondary Standards Dosimetry Laboratory, IAEA-TECDOC-1585, (2018). 42. D. Zwillinger, CRC Standard Mathematical Tables and Formulas (Advances in
Applied Mathematics), 33rd Edition, (2018)
21
19th International Congress of Metrology, 09007 (2019) https://doi.org/10.1051/metrology/201909007
43. T. Doiron, J. Stoup, Uncertainty and dimensional calibrations. J. R. (NIST), 102(6),
p.647, (1997) 44. Granta Design, CES EduPack Software—Material Level 3. [online] Grantadesign.com,
(2019)
45. M. J. Puttock, E. G. Thwaite, Elastic compression of spheres and cylinders at point and line contact; Melbourne, Australia: Commonwealth Scientific and Industrial Research Organization, (1969)
46. N. S. Mian, S. Fletcher, A. P. Longstaff, Reducing the latency between machining and
measurement using FEA to predict thermal transient effects on CMM measurement. Measurement, 135, pp.260-277, https://doi.org/10.1016/j.measurement.2018.11.034, (2019)
22
19th International Congress of Metrology, 09007 (2019) https://doi.org/10.1051/metrology/201909007


![Multi-Task Learning Using Uncertainty to Weigh Losses for Scene … · 2018. 6. 11. · one task can help learn other tasks [7]. Fine-tuning [1, 36] is a basic example of multi-task](https://img.pdfslide.us/doc/110x75/5fd5b2ff354f85264674981b/multi-task-learning-using-uncertainty-to-weigh-losses-for-scene-2018-6-11-one.jpg)