Embed Size (px)
Citation preview

1
Uncertainty, Task Environment, and Organization Design: An Empirical Investigation
Avner Ben-Ner* Fanmin Kong**
Stéphanie Lluis***
December 2011
Abstract
The paper addresses two broad research questions: 1. How do internal uncertainty associated with the task environment and external uncertainty arising from market volatility impact organization design? 2. What are the relationships among various elements of organization design: delegation of decision-making, incentives, monitoring, and internal labor market practices (promotion, training, employment security)? We expand on Prendergast (2002a), who challenged the conventional view of a tradeoff between risk and incentives, and build a single unified framework for answering our two research questions. Using a uniquely rich dataset that contains detailed information about the task environment of core employees and organization design at the individual, group and firms levels in 530 Minnesota firms in the mid 1990s, we first find support for Prendergast's key argument that internal uncertainty (over which employees have control) affects directly the allocation of decision-making and only indirectly incentives (via allocation of decision-making). This confirms similar findings by Foss and Laursen (2005), DeVaro and Kurtulus (2010) and Shi (2011). We also find that internal uncertainty has much impact on organization design through the choice of delegation of decision-making at the employee level, less so at the group level, and very little at the firm level, whereas external (market) uncertainty has little effect on organization design, especially at the individual and group level. Decision-making, monitoring, various internal labor market practices and incentives are strongly related to each other through substitution and complementarity. Keywords: uncertainty, organization design, task complexity Classification Codes: L20
*Industrial Relations Center, Carlson School of Management, University of Minnesota, 321 19th Avenue South, Minneapolis, MN 55455, USA, [email protected] **Guanghua School of Management, Peking University, Beijing 100871, China, [email protected]. ***University of Waterloo, Economics Department, 200 University West, Waterloo, ON N2l 3G1, Canada, [email protected].

2
1. Introduction
Organization design is the combination of complementary and substitutable
practices that a principal selects in order to direct and improve the effort of agents to
pursue organizational objectives. For example, in a restaurant, management has to decide
how much discretion to permit waiters regarding items not on the menu, whether to
require them to pool tips or allow them to keep the tips they earn, how much training to
provide, whether to supply promotion opportunities, and more. In a software firm,
management has to choose how much discretion to allow engineers in the programming
process and whether they will work in teams, how to compensate them, and so on. In a
lawn-mower manufacturing plant, management has to choose between an assembly line
where each worker is assigned a single function and teams that have collective
responsibility to assemble mowers, etc.
The idea of complementarity in organization design practices has long been
accepted (Miller, 1986, Milgrom and Roberts, 1992), and empirical work had generally
confirmed the theoretical arguments, although with varied results depending on the
approach used, the particular practices analyzed and their specific definition. 1
Complementarities materialize in a system of complex interactions among multiple
elements that depend on the organizational context (Ennen and Richter, 2010). The
choice of the specific practices in a restaurant depends on the complexity of the menu, the
degree of flexibility the restaurant wants to provide its clients, the desired level of service,
etc. The choices of the manager in the lawn-mower plant are made in view of the
constraints imposed by the technology of production and how many different types of
mowers the plant produces.
1 A substantial literature emerged analyzing the rapid growth in the use of “innovative” human resources management practices since the 1980s (practices aimed at increasing employee involvement in the firm’s production and decision processes, studied inter alia by Osterman, 1994, 2000; Ichniowski, Shaw and Prennushi, 1997; Cappelli and Neumark, 2001) and the effectiveness of exploiting complementarities among various practices, such as combining incentive compensation with employee involvement and skill development (Huselid, 1995; Delaney and Huselid, 1996; Ichniowski et al., 1996; Ichniowski and Shaw, 2003; Laursen and Foss, 2003; Ben-Ner and Lluis, 2011). Some studies have demonstrated a significant positive link between delegation and incentives (MacLeod and Parent, 1999; Nagar, 2002). Other studies have examined the firm’s choice between monitoring and pay and concluded that firms use efficiency wages as a substitute for monitoring (Neal, 1993; Rebitzer, 1995).

3
In this paper we put forth a theoretical framework for analyzing the key elements
of organization design in diverse settings, focusing on issues associated with the tasks of
core employees such as waiters, software engineers and manufacturing workers. In
particular, the task environment may create asymmetric information between core
employees and their direct supervisors; asymmetric information creates opportunities for
hidden action by employees and uncertainty about outcomes for supervisors. We identify
elements of organization design that ameliorate the problems created by such uncertainty:
delegation of decision-making, incentives, monitoring and internal labor market practices
(employment security, training and promotions).
The nature and consequences of uncertainty (risk) in organizational contexts came
under theoretical scrutiny by Zabojnik (1996), Prendergast (2002a), Baker and Jorgensen
(2003) and Raith (2008). These authors analyzed the effect of uncertainty on the choice
of actions by agents, distinguishing between uncertainty that is beyond agents’ control
and uncertainty that is related to agents’ effort. 2 They showed that the relationship
between uncertainty and incentives is not necessarily one of tradeoff: unlike uncertainty
that is beyond the control of agents, uncertainty related to agents’ effort is positively
related to incentives because managers regard employees’ unobservable actions as
strategically uncertain and seek to influence these actions through incentives. Prendergast
(2002a) identifies the complexity of workers’ task environment as the source of such
uncertainty and predicts that the more complex the task environment the greater will be
the extent of delegation of decision-making and therefore the greater will be the reliance
on incentives.
We use Prendergast’s (2002a) framework as a platform for (1) understanding the
relations among the various elements that comprise organization design and (2) analyzing
the relationship between two measures of uncertainty – the task environment at the shop-
floor level and income variability at the industry level – and organization design. The
choice of organization design for waiters in a restaurant, engineers in a software shop and
production workers in a manufacturing plant depends centrally on the nature of their
tasks. Complex, variable and non-routine tasks require employees’ knowledge of specific
2 There are certain differences in the analytical frameworks of these authors and in their terminologies, some of which will be discussed in the next section. Rantakari (2008) reviews this literature and provides a detailed theoretical analysis of uncertainty and incentives.

4
circumstances and ability to deal with problems as they emerge, and consultation among
co-workers to address particularly complicated situations. In such task environments,
supervisors have less immediate information and knowledge about the work of their
employees and therefore face greater uncertainty about outcomes than in simpler task
environments. This type of uncertainty may be called internal uncertainty because it
originates at the workplace level. The greater is this uncertainty the greater will be the
involvement of core employees in making decisions about how to plan and execute their
tasks and whom to consult. Incentives, monitoring, internal labor markets, and more –
will be designed so as to support the allocation of decision-making.
The work of employees is affected by additional factors. For example, for waiters
the main sources of external uncertainty are the preparation of food in the kitchen and
variations in demand for restaurant dining; for software engineers, it is the demand for
software, and for manufacturing workers it is the supply of parts and the demand for lawn
mowers. The sources of external uncertainty are generally outside the control of these
core employees, so managers need to find ways to deal with their impact.
Thanks to a uniquely rich dataset of a cross-section of 530 firms based and
operating in Minnesota, we are able to explore empirically the importance of these
sources of uncertainty for incentives and for the interplay between incentives, delegation
of decision-making, monitoring and internal labor market practices. Our dataset contains
rich survey information on delegation of decision-making to employees and teams,
individual, group and firm-based performance-pay plans, monitoring and internal labor
market practices (training, promotion from within and employment security provisions).
We also have information on the volatility of income in a firm’s industry as a measure of
external uncertainty, and the complexity, variability and routine of core employees’ tasks
as an internal uncertainty measure.
We carry out our empirical analysis in two stages. First, we replicate existing
empirical tests of Prendergast’s main argument about the role of delegation of decision-
making in the relationship between uncertainty and incentives. Second, we analyze the
joint choice of delegation, monitoring, internal labor market practices and incentives in
the presence of uncertainty. We find that internal uncertainty influences substantially
organization design through the choice of the degree of delegation of decision-making to

5
employees, and through elements that support its desirable application, namely
monitoring, incentives and internal labor market practices. Uncertainty reflected by
market volatility has a more limited effect on organization design. We also find that the
various elements of organization design are significantly associated with each other in
terms of complementarity and substitutability relationships at the three organizational
levels.
The paper makes two principal contributions. First, we provide the first
comprehensive analysis of several elements of organization design simultaneously in a
single unified framework and, thanks to our unique dataset, we adduce empirical
evidence on substitutability and complementarity relationships among delegation of
decision-making, incentives, monitoring and internal labor market practices; we explore
these relationships at the individual, group and firm levels.
Second, this is the first paper to empirically investigate in detail the role of the
task environment in shaping organization design. The role of delegation in the
relationship between risk and incentives has been tested empirically by Foss and Laursen
(2005), Wulf (2007), DeVaro and Kurtulus (2010) and Shi (2011). These studies find
positive correlations between their measures of risk and delegation and between
delegation and incentives confirming the importance of the complementarity between
delegation and incentives when analyzing the risk-incentives trade-off, and emphasizing
the positive link between risk and delegation. However, the measures of uncertainty used
originate outside the firm, whereas the task environment reflects uncertainty that is
internal to the firm and is under the influence of employees. Moreover, our two measures
of uncertainty, one internal linked to the task environment and another external linked to
market volatility, allow us to perform a clean test of the relationship between uncertainty,
incentives and delegation as discussed by Prendergast (2002a) and Raith (2008).
The paper proceeds as follows. Section 2 summarizes the theoretical literature.
Section 3 describes the data and empirical strategy. Section 4 presents the results, and
Section 5 concludes the paper.
2. Conceptual Framework and Hypotheses

6
In this section we develop a brief conceptual framework, building on Prendergast
(2002a) and applying it to the context of core employees’ task environment. We develop
hypotheses regarding the links between uncertainty, incentives and delegation, following
Foss and Laursen, (2005) and DeVaro and Kurtulus (2010), who tested these
relationships using alternative measures of these concepts. We then extend the model by
integrating additional elements of organization design, monitoring and internal labor
market practices, and generate hypotheses regarding the relationship between these
elements and internal uncertainty, as well as among the various elements of organization
design. We emphasize the task environment of core employees as the source of internal
uncertainty as well as the interaction among various elements of organization design.
The need for organization design arises because managers cannot make all
decisions themselves and because they cannot expect that their employees will enact
them flawlessly. Agents have local specific information and knowledge that principals
cannot obtain costlessly. Consequently, managers-principals (1) must delegate some
decision-making and invest in means that help direct the effort of employees-agents
towards organizational objectives, or (2) invest in the reduction of asymmetric
information. The primacy of delegation is articulated from different perspectives by
Marschak and Radner (1972), Hart and Moore (1990), Ben-Ner et al. (1993), and
Prendergast (2002a).3
2.1. The task environment and uncertainty
Jobs are designed for efficiency relative to organizations’ business strategy,
technology, workforce, and labor and product market conditions (Lindbeck and Snower,
2000; Zoghi et al., 2005). The nature of the tasks associated with a job affects employees’
ability to make good decisions, the information they have about the association between
their efforts and results, and the information supervisors have about what employees do
and how hard they work. A characterization of tasks that is particularly relevant to the
3 In standard agency models the need for delegation is assumed, often implicitly, with the emphasis being laid on the need to support delegation with incentives.

7
understanding of organization design and uncertainty considers how simple or complex,
stable or variable, and routine or non-routine tasks are.4
Task complexity. The execution of complex tasks requires more skillful,
thoughtful and experienced decision-making, and is more prone to errors than the
execution of simple tasks. For example, the task of solving a system of nonlinear
equations is more complex than the task of solving for x in 3x=6; the task of extracting a
tumor from a brain cavity is more complex than the task of extracting a splinter from a
finger; the task of serving a customer in a fast-food restaurant is simpler than the task of
serving a demanding customer in an expensive restaurant; and the task of writing a report
about local crime statistics is simpler than the task of analyzing the reasons for changes in
the incidence of local crimes. Task complexity affects the information sets of both
employees and their supervisors. The employee who carries out a complex task is in a
better position than a supervisor to determine the specific demands of a particular
situation, and how various factors (such as the multifaceted efforts of the employee and
of other employees and managers, equipment, and the quality of materials) combine to
determine the outcome of the execution of the task. The employee could, in principle,
transmit his information to the supervisor so that she could make the key decisions for the
employee, but the lack of reliability of transmission of information increases with the
complexity of the tasks, as does the possibility of self-interested manipulation of the
information. Although the employee has better information than the supervisor, he too
suffers from uncertainty regarding the possible outcomes of his complex tasks.
Task variability. Task variability refers to the range of tasks and number of tasks
an employee has to conduct. Tasks may remain unchanged for certain periods of time, as
is the case of an assembly line where a worker installs windows, or may be moderately
variable in the case of a bank teller who works with patrons with different needs, and
even more variable for a general dentist. The greater the variability of a task the more
careful, skilled and experienced an employee must be in order to execute the task
faithfully, and the less effectively can a supervisor observe the quality of the execution of
different dimensions of the task (unless more time is invested in monitoring).
4See Grandori (1991), March and Simon (1993), Autor et al., (2003), Manning (2005) and especially Perrow (1986).

8
Task routine. The incidence of exceptions in the execution of tasks is captured by
the third attribute of tasks, routine. The tasks of an assembly line worker, bank teller and
general dentist are routine (although they differ in the degrees of complexity and
variability), whereas the tasks of a researcher and of a developer of new electronic games
are non-routine. Routine tasks are easier to execute and are easier to observe by a
supervisor than non-routine tasks.
Henceforth we will refer to the difficulty of the task environment as a way to
capture the combined effects of more complex, variable, and non-routine tasks. We have
established that the greater the difficulty of the task environment the greater the
uncertainty it creates for supervisors because of the factors that are beyond their control
but are under the control of employees. A more difficult task environment also contains
elements that are beyond the control of employees, so it entails greater uncertainty for
employees - but less than for their supervisors. We will refer to the difficulty of the task
environment as internal uncertainty. 5 Our measure of internal uncertainty closely
matches Prendergast’s notion of job complexity.6 The difficulty of the task environment
can be viewed as a type of respondable risk, a risk that the agent can respond to by
exerting effort to collect information about the underlying state to make correct decisions
(Shi, 2011). Our measure of internal uncertainty is also comparable to technological
uncertainty about the productivity of the agent’s effort because the agent has private
information (specific knowledge) that is too costly to communicate to the principal (Raith,
2008), to ex-ante uncertainty for which the worker can observe part of its realization prior
to making a decision or exerting effort (Zabojnik, 1996) and to volatility, a type of
uncertainty whose realization changes the agent’s optimal choice of action (Baker and
Jorgenson, 2003).
In contrast, the factors that are beyond the control of both supervisors and workers
cause what we will term external uncertainty; these factors include variations in the
5 Prendergast (2002a) defines risk as uncertainty coming from the variance in the task environment. In his model, output from exerting effort on task i depends on the effort level and on a random variable ρi (yi = ei + ρi). He assumes that while agents know the true values of ρi, the principal only knows the distribution of ρi. Uncertainty is defined as the variance σ2 of the distribution of ρi. 6 Job complexity is defined by Prendergast in the section describing his model’s applications and extensions as an increase in the number of tasks on which the agent has to exert effort.

9
performance of equipment that is not affected by employees’ behavior, the behavior of
other organizational units, and the market.
2.2. Incentives and uncertainty
Research on organization design has a long history in economics, hailing from
diverse traditions and theoretical perspectives (Putterman and Kroszner, 1996). Common
to the various approaches is that uncertainty has a central role in determining
organization design. In agency theory, employees are compensated for their contracted
effort, if that is costlessly observable. However, under conditions of asymmetric
information regarding their effort, employees will be rewarded instead for their
observable performance. Rewarding performance would be equivalent to rewarding input,
unless there is some uncertainty or risk that affects performance and is beyond the control
of employees. This noise in the measurement of employees’ performance reduces the
reliance on pay-for-performance (incentives) in the commonly-assumed case of risk-
averse workers. This is the familiar tradeoff between risk and incentives.
Greater difficulty of the task environment creates greater asymmetric information
between supervisors and employees (it is exactly the same as asymmetric information
between principals and agents). Asymmetric information associated with agents’ local
specific and specialized knowledge calls for delegation of decision-making to the agents,
but to encourage decision-making in the interest of the organization, incentives will be
offered (Prendergast, 2002a). 7 On the other hand, reliance on incentives will be
negatively affected by risk and uncertainty that are beyond the control of risk-averse
workers; this is a central tenet of economic theory. This type of uncertainty is not defined
in Prendergast’s model because agents are risk neutral.8 It can however be compared to
the notion of environmental uncertainty defined in Raith (2008), a noise in the measure of
the agent’s output in a context in which agents are risk neutral but are protected by
7 This is a point that originates with Grossman and Hart’s (1986) theory, and has been emphasized by several authors (e.g., Tyson and Levine, 1990; Ben-Ner and Jones, 1995). 8 It is typically defined as an additive exogenous shock εi ∼ N(0,σ2
ε) in the output equation where σ2ε
represent external uncertainty (Rantakari, 2008).

10
limited liability. Environmental risk does not affect the true productivity of the agent’s
effort but reduces the responsiveness of measured performance to the agent’s effort.9
In sum, the task environment creates uncertainty for management and the desire
to delegate some decision-making to employees and offer incentives. The first hypothesis
derived from the above discussion is:
Hypothesis HA1: Internal uncertainty associated with the task environment is
positively correlated with the use of delegation of decision-making
and with incentives.
Regarding the relationship between internal uncertainty and incentives at various
levels, because it is measured at the level of individual employees (rather than units or the
firm level) its impact should be strongest on individual incentives, as individual core
employees’ outcomes are directly impacted by their task environment. If the nature of the
task environment also affects the way groups produce their outcomes (because of the
need to consult, for example), then greater internal uncertainty will beget also stronger
group incentives. Generally, the impact of the individual core employees’ task
environment on firm outcomes should dissipate in firms with more than a few employees.
External uncertainty will be associated with less use of incentives if employees
are risk averse. Theoretically, external uncertainty is assumed to be a source of
exogenous risk that is uncorrelated with internal uncertainty. In reality, these two sources
of risk might be correlated and it may be difficult to obtain a measure of external
uncertainty that is purely exogenous. Whether incentives ought to be negatively or
positively related to a certain source of uncertainty depends on how important responses
to that risk are (Raith 2008). We return to this point in the data section where we present
our empirical measures of uncertainty.
Incentives, if they are used at all, may be proffered at the individual, group or firm
levels. Individual incentives aim to motivate individuals to engage desirable effort in
situations where the individual has direct control over personal outcomes. Group
9 Raith’s model distinguishes explicitly between uncertainty that affects the agent’s optimal choices and increases the value of his or her specific knowledge, implying greater use of incentives, and uncertainty in the measurement of performance commonly described in standard agency models, which predicts a tradeoff between risk and incentives.

11
incentives aim to link the effort of group members when there is interdependence among
their tasks and are tied to group outcomes. Firm incentives seek to align interests across
individuals and units of a firm and are usually based on financial outcomes, particularly
profit. If, as is the case in our empirical work, external uncertainty is measured at the
industry level (thus not capturing much uncertainty associated with equipment reliability
and the actions of other members and units of the organization), then it should not be
linked to outcomes affected by individual employees and groups, that is, there should be
no correlation between individual and group incentives and external uncertainty.10
We can now formulate hypotheses on the relationship between internal and
external uncertainty and incentives at the individual, group and firm levels.
Hypothesis HA2: The correlation between internal uncertainty and incentives is
positive and is stronger at the individual level than at the group and
firm levels.
Hypothesis HA3: The correlation between external uncertainty and incentives is
negative and is stronger at the firm level than at the individual and
group levels.
The next three hypotheses summarize Prendergast’s core argument about the link
between risk and incentives; these are variants of hypotheses presented by Foss and
Laursen (2005) and DeVaro and Kurtulus (2010) who each used different measures of
uncertainty.11
Hypothesis HB1: Incentives and delegation of decision-making are positively
correlated.
10 An exception will occur in cases when core employees, such as wait staff in restaurants, and certain groups, such as teams of software engineers who generate programs, interact directly with the market. 11 Foss and Laursen (2005) define environmental uncertainty and measure it using three variables: (i) the extent to which firms are innovative, (ii) the perceived increase in the level of competition and (iii) within industry variance in profitability. DeVaro and Kurtulus (2010) define market risk and measure it with a dummy variable equal to 1 if the current state of the market for the main product or service of the establishment is described as turbulent and = 0 otherwise.

12
Hypothesis HB2: The correlation between internal uncertainty and incentives
decreases when delegation of decision-making is taken into
account.
Hypothesis HB3: The correlation between external uncertainty and incentives
decreases when delegation of decision-making is taken into
account.
2.3. Organization design practices and uncertainty
The use of incentives is restricted by their direct cost, the cost of the risk they
impose on employees and the cost of dysfunctional behavior they sometimes cause
(Prendergast, 1999). Consequently, additional practices that substitute for incentives or
complement them to make them more effective are often implemented (Holmstrom and
Milgrom, 1994; Milgrom and Roberts, 1995; Prendergast, 1999). Such practices include
monitoring and internal labor markets (e.g., training, promotion-from-within and
employment security). Ichniowski and Shaw (2003) review the literature on
complementary human resource management practices and find evidence that a broad
range of complementary practices enhances performance more than a more restricted one.
In a similar vein, Ennen and Richter (2010) conclude from their review of the literature
that “complementarities may only become fully effective when embedded in an overall
system involving many elements.” They also point to the paucity of studies that take the
environment into account when examining complementarities among practices.
Our general framework, building on Prendergast’s model, does just that: it
incorporates the role of internal task environment and the external market and includes
monitoring and several internal labor market (ILM) practices, in addition to delegation of
decision-making and incentives. Our first observation is technical: the inclusion of
additional practices (ILM and monitoring) in the equation that explains the prevalence of
incentives in the face of uncertainty will change the measured association between
delegation and incentives. As in a typical omitted variables bias context, the sign of the
bias depends on the sign of the association of the ILM practices and monitoring with
delegation and with incentives, about which we hypothesize later.

13
Hypothesis HC1: The correlation between delegation of decision-making and
incentives changes after the inclusion of ILM practices and
monitoring to the equation that explains incentives.
Monitoring refers to the collection of information about signals of worker effort
that complements or substitutes for incentives.12 Monitoring is less likely to be employed
in uncertain task environments because it is difficult for supervisors to identify what
employees should be doing (Prendergast 2002a, 2002b). Therefore:
Hypothesis HC2: Internal uncertainty is negatively correlated with the use of
monitoring.
Internal labor markets consist of a set of practices oriented to the long run: on-the-
job training, promotion-from-within, employment security, and so on. On-the-job training
encourages firm-specific skill development; promotion-from-within provides returns to
sustained good performance, desirable behaviors, trustworthiness and favorable
disposition; and employment security safeguards employees’ returns against employer
opportunism (Baron and Kreps, 2000; Milgrom and Roberts, 1992). These practices are
most desirable when the task environment creates internal uncertainty that cannot be
satisfactorily addressed in the short run. When the task environment creates long-term
uncertainty, incentive practices tying performance to short-run outcomes (such as
bonuses) would not be as effective as incentives based on long-term objectives such as
promotions and training, which offer permanent pay increase opportunities, and
employment security. Therefore:
Hypothesis HC3: Internal uncertainty is positively associated with ILM (training,
promotion-from-within and employment security).
12 Monitoring comes in many varieties: it may be exercised continuously or at fixed or random intervals, and may be carried out by direct supervisors, coworkers, others with whom a worker has periodic or occasional contact (such as customers and trainers), or equipment (such as keyboard stroke counters and surveillance cameras).

14
ILM practices complement the use of delegation of decision-making. The
complementarity between ILM practices associated with training, promotion from within
and employment security and practices associated with decentralization has been
hypothesized and empirically identified in the literature (MacDuffie, 1995, Ichniowski et
al., 1997, Laursen and Foss, 2003). Training increases the benefits of delegation of
decision-making because it helps employees to be more effective and generate valuable
ideas (Autor, Levy and Murnane, 2003), and employment security and promotions offer
future benefits in return for greater employee effort associated with delegation of
decision-making (Aoki, 1988). Training contributes to the enhancement of employee
skills, and promotion opportunities and employment security help motivate them as the
effectiveness of skilled and motivated employees cannot be fully achieved if the workers
are not involved in what needs to be done and how it should be performed. This leads to
the following hypothesis:
Hypothesis HC4: Delegation of decision-making and ILM practices are positively
correlated.
The relationships between incentives and monitoring and between delegation and
monitoring are ambiguous. The “monitoring intensity” principle states that improving
information gathering can be profitable when incentive intensity is high and therefore
information is more valuable (Milgrom and Roberts, 1992). In contrast, the efficiency-
wage literature emphasizes the tradeoff between incentives and monitoring arising from
their relative (marginal) costs. Prendergast (2002a) contrasts input monitoring with
output-based pay and delegation, suggesting that monitoring and incentives and
delegation might be substitutable practices, especially in unstable environments. Whether
an organization will use monitoring to complement or substitute for incentives and
delegation depends on many details specific to the organization’s task environment and
other circumstances.13
13 For example, Demougin and Fluet (2001) show that the extent of complementarity or substitution between incentives and monitoring depends on the level of informational rents enjoyed by workers and their liability limits (their ability to post bonds and the firm’s ability to levy fines on workers), and characteristics of the monitoring system (the cost of increasing the precision of information and the
15
ILM practices may be used in task environments where monitoring is particularly
difficult or costly and where incentives are very expensive or difficult to administer
because of unobservability of individual output.14 ILM practices such as promotion-from-
within constitute also long-term incentives, so they may partially substitute for short-term
incentives. Thus firms rely on monitoring of inputs and outputs to ensure that workers act
correctly (e.g., Hart and Moore, 2005; Garicano, 2000), and on ILM practices to provide
long-term incentives, accumulate firm-specific knowledge, aid in the collection of
information about worker behavior, and contend with issues of ex post hold-up problems
associated with various incentive contracts (e.g., MacLeod and Carmichael, 2000). This
suggests that ILM practices might substitute for incentives. On the other hand, because
ILM practices may be complementary to delegation of decision-making as hypothesized
in HC4, and delegation of decision-making and incentives are also expected to be
complementary (HB1), transitivity suggests that ILM practices could also be
complementary to incentives. Overall, there is no theoretically unambiguous prediction
regarding the relationship between incentives and monitoring and delegation and between
incentives and ILM practices; we refer to them as empirical questions to investigate in
order to guide future theoretical developments in organization design.
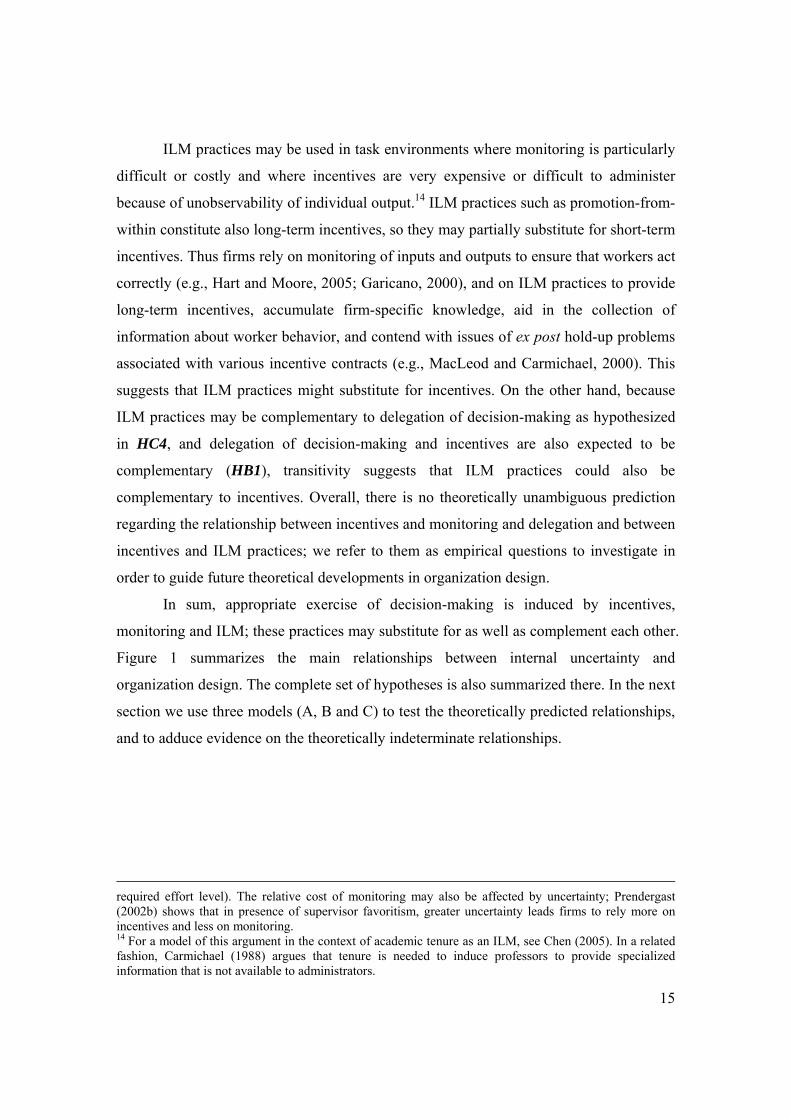
In sum, appropriate exercise of decision-making is induced by incentives,
monitoring and ILM; these practices may substitute for as well as complement each other.
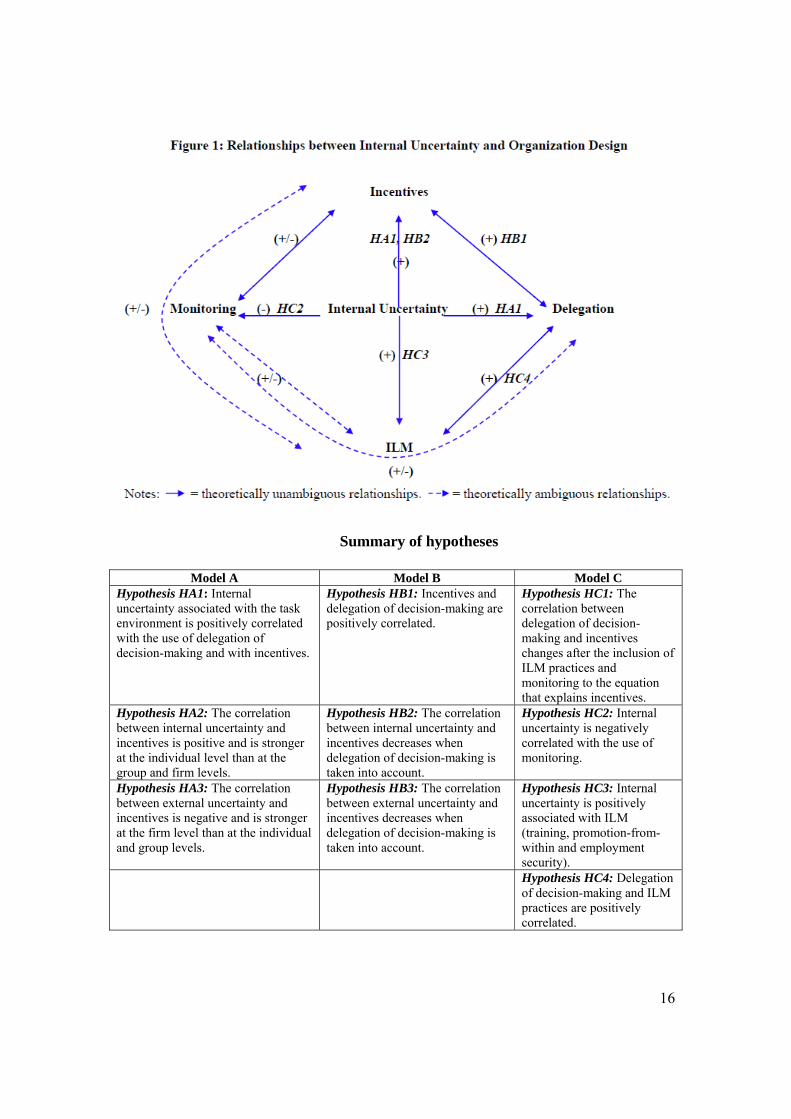
Figure 1 summarizes the main relationships between internal uncertainty and
organization design. The complete set of hypotheses is also summarized there. In the next
section we use three models (A, B and C) to test the theoretically predicted relationships,
and to adduce evidence on the theoretically indeterminate relationships.
required effort level). The relative cost of monitoring may also be affected by uncertainty; Prendergast (2002b) shows that in presence of supervisor favoritism, greater uncertainty leads firms to rely more on incentives and less on monitoring. 14 For a model of this argument in the context of academic tenure as an ILM, see Chen (2005). In a related fashion, Carmichael (1988) argues that tenure is needed to induce professors to provide specialized information that is not available to administrators.
16
Summary of hypotheses
Model A Model B Model C Hypothesis HA1: Internal uncertainty associated with the task environment is positively correlated with the use of delegation of decision-making and with incentives.
Hypothesis HB1: Incentives and delegation of decision-making are positively correlated.
Hypothesis HC1: The correlation between delegation of decision-making and incentives changes after the inclusion of ILM practices and monitoring to the equation that explains incentives.
Hypothesis HA2: The correlation between internal uncertainty and incentives is positive and is stronger at the individual level than at the group and firm levels.
Hypothesis HB2: The correlation between internal uncertainty and incentives decreases when delegation of decision-making is taken into account.
Hypothesis HC2: Internal uncertainty is negatively correlated with the use of monitoring.
Hypothesis HA3: The correlation between external uncertainty and incentives is negative and is stronger at the firm level than at the individual and group levels.
Hypothesis HB3: The correlation between external uncertainty and incentives decreases when delegation of decision-making is taken into account.
Hypothesis HC3: Internal uncertainty is positively associated with ILM (training, promotion-from-within and employment security).
Hypothesis HC4: Delegation of decision-making and ILM practices are positively correlated.

17
3. Data and Method of Analysis
3.1. Description of the Dataset
The sample is drawn from the Minnesota Human Resources Management
Practices Survey. The survey was administered from 1994 to 1996 to 2,021 private for-
profit Minnesota-based firms with at least 20 employees, representing a broad spectrum
of industries. In order to ensure representation of diverse industries, ownership forms, and
firm sizes, a stratified sampling strategy was employed. The first stage included nearly
600 firms: all publicly-traded firms, and firms that were known to have employee stock
ownership plans. The second stage included 1,500 firms: all retail food firms and a
representative sample of 958 firms from all industries excluding agriculture. The overall
response rate was 43% (874 surveys). Respondents were typically the highest human
resources executive in the firm; in smaller firms the respondent was frequently the top
executive in the firm.
The survey questionnaire asked about individual-, group-, and firm-level
incentives, various human resource practices such as training, the degree of employee
participation in decision making, the nature of the tasks carried out by shop-floor
employees, and other aspects of firm organization.15 Many of the questions focused on
shop-floor or core employees, the largest group of non-supervisory, non-managerial
employees who are directly involved in making the product or providing the service, such
as assembly-line workers at an auto manufacturing factory, computer programmers in a
software company, or sales representatives in an insurance company (Osterman, 1994).
Most of the variables employed in our analyses are derived from responses to the survey.
Additional variables were constructed from the COMPUSTAT dataset for
publicly traded firms (industry-level external uncertainty and capital-labor ratio), and
Minnesota Department of Economic Security (number of employees and wage bill in
sample firms), which were merged with the survey data. The working sample, after
deleting firms that did not meet inclusion criteria and firms with missing information,
15 The survey is available at https://netfiles.umn.edu/users/benne001/www/papers/work-surv/work-surv-01.pdf.

18
consists of 640 firms. 16 However, missing observations for control variables further
reduce the size of the working sample to 530 firms.
3.2. Variables
Table A1 in Appendix A provides definitions, sources, and descriptive statistics
of all variables. The uncertainty variables are constructed as follows. Internal uncertainty
is the sum of the degree of complexity, variability and (reverse coding of) routine
attributes of the tasks carried out by shop-floor workers, corresponding to our earlier
theoretical discussion. The items, measured on a 5-point scale, ask directly about the
extent to which core employees’ tasks are complex, variable, and routine. Results based
on task complexity alone as measure of internal uncertainty are very similar to those
based on the broader measure, and are available upon request.
External uncertainty is measured by the standard deviation of the net income in
the firm’s 3-digit SIC industry over the period 1990-1994 (the five years preceding the
survey). This is one of several measures of risk proposed in the literature; most of the
measures are correlated because they tap into various aspects of variability in profitability
over time. 17 It is not a perfect exogenous noise measure affecting core employees’
performance as described in our theoretical framework for two reasons. First, it is
incomplete because it does not reflect uncertainty caused by equipment and actions of
other units in the firm and second, in some firms and industries core employees may be
able to gather information about the external environment and react to it (in most
industries core employees’ actions are not likely to be directly influenced by the
uncertainty in the industry because they are generally shielded from it by several layers in
the organization). Thus external market uncertainty as measured in our study is generally
not a respondable risk for core employees.18
16 Our inclusion criteria are: firms that at the time of the survey were headquartered and employed a majority of employees in Minnesota, operated in industries that carry a main four digit SIC code outside agriculture, were for-profit and employed at least 20 employees. Surveys with missing information on any of the organization design or task environment variables were not used. 17 See, for example, Bromiley and Miller (1990) and Ruefli et al., (1999) for reviews. An empirical measure of external uncertainty that affects specifically the shop floor is unavailable. However, it is likely that noise originating in other organization units that interact with the shop floor is correlated with market noise. 18 The same external uncertainty measure is a respondable risk for executives, who collect information about the market and act upon that information (Shi, 2010).

19
The organization design variables concern incentives, delegation of decision-
making, monitoring, and ILM practices. Wherever possible we distinguish between the
individual, group and firm-level variables. We use dummy variables to identify the
existence of individual incentive plans, group-level incentives (group bonus), and firm-
level incentives (cash and deferred profit sharing plans).
Delegation of decision-making to individual employees is described by two
alternative variables, both measured on a 5-point scale: the degree of control these
employees have over how their jobs are done and the degree of participation by core
employees in employee involvement programs. 19 Delegation of decision-making to
groups is captured through a dummy indicating the use of self-managed teams.
Monitoring is represented by an item that asked about the degree to which core
employees’ work is monitored by supervisors on a 5-point scale. We also use a related
measure based on an item that asked about the degree to which core employees’ work is
guided and directed by supervisors and managers. These items were added in the second
stage of the survey administration; as a result, the sample for the analyses that include
monitoring (Table 2) and guidance (Appendix B) consists of 305 firms rather than 530
(Table 1). Individual-level ILM practices include employment security, promotion from
within and on-the-job training; group-level ILM is represented by team training.
3.3. Empirical Strategy
We estimate a series of incremental models, taking into consideration the discrete
nature of the organization design variables. In Models A and B we estimate the
determination of incentives and delegation of decision-making; in Model C we put forth a
more comprehensive approach to the understanding of the relationships between
uncertainty and organization design as well as among multiple elements of organization
design.
19 The two measures of individual delegation of decision-making are derived from responses to survey questions: “To what extent do these [core] employees: have control over how their work is done” (for the control variable), and “To what extent do these [core] employees: participate in any employee involvement programs” (for the involvement variable). Earlier in the questionnaire examples of employee involvement programs were given: suggestion system, quality of work life, quality circles, total quality management, self-managing work-team, joint labor-management committees, employee representative on the board of directors.

20
In Model A, we analyze the role of internal uncertainty in the choice of delegation
of decision-making and provision of incentives in a fashion similar to Foss and Laursen
(2005) and DeVaro and Kurtulus (2010). A simultaneous equations model is appropriate
in this case because both incentives and delegation are likely to be affected by common
unobservable factors.
Model A
(1) Prob(Incentives) = g(X, IU, EU, e1)
(2) Prob(Delegation) = f(X, Z, IU, EU, e2)
where IU is internal uncertainty, EU is external uncertainty, X reflects firm characteristics
(described and justified later) and (e1, e2) is bivariate normal N(0, Σ).20 For identification
of the model (beyond non-linearities),21 Z includes a variable that affects the choice of
delegation but not of incentives; the variable is an index of employee participation related
to decision-making issues. The information comes from a survey question (on a scale of 1
to 5): “To what extent do employees participate in the following issues?” The responses
are: work rules, working conditions, pay and other compensation, selection of personnel,
training and development, social events, job redesign, safety and health, equipment
maintenance, selection of materials, selection of new equipment, investment policies,
production planning, profit allocation and corporate finance. We chose issues that involve
some degree of decision-making: selection of personnel, job redesign, investment policies,
production planning and profit allocation. We built an intensity index that sums the
scores on each issue. The correlations between the index and individual, group and firm
level incentives are low (0.11, 0.16 and 0.26, respectively). We experimented with the
definition of the index including a larger set of the participation issues as well as using a
different question (“To what extent does management share information with non-
managerial employees in the following areas: investment policies, production planning
20 The variance-covariance matrix Σ is non-diagonal as we assume correlation in the disturbance terms across equations. Σ = 21 Identification of the model can be obtained without exclusion restrictions and consideration of variable Z. However, because the recursive property of Models B and C may require such exclusion restrictions (Maddala, 1983, p 122-123), we systematically defined instruments. We provide more details on this issue when we introduce Model C.
21
and human resources planning”) and report in the robustness checks section that we find
no major differences in the results.
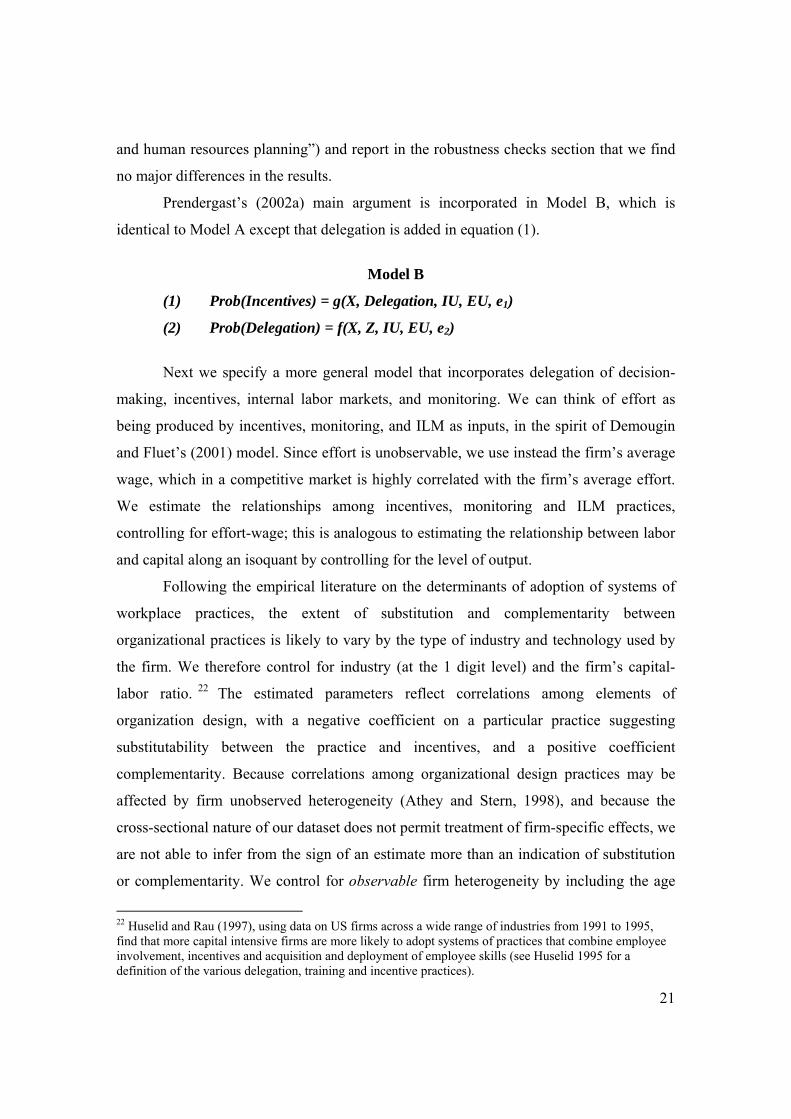
Prendergast’s (2002a) main argument is incorporated in Model B, which is
identical to Model A except that delegation is added in equation (1).
Model B
(1) Prob(Incentives) = g(X, Delegation, IU, EU, e1)
(2) Prob(Delegation) = f(X, Z, IU, EU, e2)
Next we specify a more general model that incorporates delegation of decision-
making, incentives, internal labor markets, and monitoring. We can think of effort as
being produced by incentives, monitoring, and ILM as inputs, in the spirit of Demougin
and Fluet’s (2001) model. Since effort is unobservable, we use instead the firm’s average
wage, which in a competitive market is highly correlated with the firm’s average effort.
We estimate the relationships among incentives, monitoring and ILM practices,
controlling for effort-wage; this is analogous to estimating the relationship between labor
and capital along an isoquant by controlling for the level of output.
Following the empirical literature on the determinants of adoption of systems of
workplace practices, the extent of substitution and complementarity between
organizational practices is likely to vary by the type of industry and technology used by
the firm. We therefore control for industry (at the 1 digit level) and the firm’s capital-
labor ratio. 22 The estimated parameters reflect correlations among elements of
organization design, with a negative coefficient on a particular practice suggesting
substitutability between the practice and incentives, and a positive coefficient
complementarity. Because correlations among organizational design practices may be
affected by firm unobserved heterogeneity (Athey and Stern, 1998), and because the
cross-sectional nature of our dataset does not permit treatment of firm-specific effects, we
are not able to infer from the sign of an estimate more than an indication of substitution
or complementarity. We control for observable firm heterogeneity by including the age
22 Huselid and Rau (1997), using data on US firms across a wide range of industries from 1991 to 1995, find that more capital intensive firms are more likely to adopt systems of practices that combine employee involvement, incentives and acquisition and deployment of employee skills (see Huselid 1995 for a definition of the various delegation, training and incentive practices).

22
and the size of the firm in addition to the firm’s average wage, industry and capital-labor
ratio. Monitoring, training, promotion-from-within and commitment to employment
security are also likely to be increasingly costly as the size of the firm increases.
Furthermore, unions may influence the mix of practices, particularly those that involve
incentives and employee skills development; we therefore control for firm unionization
status. To summarize, X includes industry, industry-level capital-labor ratio, union status,
number of employees (log), firm age (log) and average wage (log).
The model is formally described below.
Model C
(1) Prob(Delegation) = g(X, Z, IU, EU, u4)
(2) Prob(Monitoring) = h(X, Q, IU, Delegation, EU, u3)
(3) Prob(ILM) = j((X, R, IU, Delegation, Monitoring, EU, u2)
(4) Prob(Incentives) = f(X, EU, IU, Delegation, Monitoring, ILM, u1 )
where (u1, u2, u3, u4) is quadrivariate normal N(0, Σ’). 23 We build the model in a
hierarchical fashion, starting with estimation of delegation of decision-making (which we
argued in the previous section is the key organization design choice), followed by
equations determining the choice of monitoring and internal labor markets, and ending
with the estimation of incentives.
To account for unobservable common influences on the choice of organization
design variables as well as for the direct interdependence among these variables (which
implies that dependent variables are on the right hand side in some equations), we use a
recursive multivariate probit model to estimate a system of simultaneous equations.24
Note that each equation contains a common set of variables X which reflects firm
characteristics. Because identification of the parameters in recursive multivariate probit
models has been debated,25 we also consider additional equation-specific variables Z, Q,
23 The matrix of variance-covariance Σ’ is non-diagonal and assumes correlation ρij in the disturbance terms across equations. 24 The recursive bivariate probit model is discussed in Maddala (1983, p122-123). It has been applied, for example, by Eisenberg and Rowe (2009) to analyze the effect of serving in the Vietnam war on smoking. 25 According to Maddala (1983), the parameters cannot be identified if the error terms of the equations are correlated and the right-hand side variables are identical across equations. He shows an example using the

23
and R. These variables are chosen so that they influence the use of delegation, monitoring
and internal labor market practices, respectively, but do not directly affect the decision to
provide incentives. For consistency and comparability across models, Z is defined as in
Models A and B. For Q, we use the number of employees per supervisor and for R we
use a variable on the extent (on a scale of 1 to 5) of employee participation in decisions
regarding personnel training and development.
We use the method of simulated maximum likelihood (SML) provided in the
mvprobit procedure in Stata.26 Although this approach does not permit identification of
causal effects, it helps understand the relationship between uncertainty and organization
design, and among elements of organization design.
The use of probit estimations involves defining the categorical organization
design variables, monitoring and delegation, as binary, high and low. We define high
levels as values of the variables greater than 3. Because collapsing these variables implies
losing some variation in the data, we also estimated the models using three-stage least
squares in order to take advantage of the whole range of values for the monitoring and
delegation variables.
4. Results
Models A and B
The results for Models A and B are presented separately for individual-level
incentives in Tables 1a and 1b (using alternative delegation measures, employee
participation in involvement programs and employees’ control over their jobs), group-
level incentives in Table 1c and firm-level incentives in Tables 1d and 1e (using
alternatively cash profit sharing and deferred profit sharing). Results from simultaneous
estimations of equations (1) and (2) of Model A are presented in the left panel. Results
for Model B, which adds delegation in the determination of incentives, are in the right
panel.
model with only constant terms and no X variables. Wilde (2000) shows that no exclusion restrictions are needed if there is sufficient variation in X variables in the data. 26 This routine estimates off-diagonal correlations for the variance-covariance matrix using the Geweke-Hajivassiliou-Keane (GHK) simulator to evaluate each of the normally distributed integrals in the likelihood function. See Cappellari & Jenkins (2003) for more details on the mvprobit procedure.

24
For Model A, internal uncertainty is associated with a higher likelihood of
delegation of decision-making at all levels of incentives (first column in Tables 1a-1e).
The marginal effects imply that an increase of one standard deviation in internal
uncertainty (2.14) increases the probability that the firm will use individual delegation as
involvement by 0.089 (2.14*0.042), individual delegation as control by 0.124 (2.14*0.06)
and team delegation by 0.083 (2.14*0.039). These effects are statistically highly
significant and their magnitude is reasonable, suggesting that the estimated relationships
are economically meaningful. We conclude that hypothesis HA1 is supported.
Consistent with HA2, the marginal effects reflecting the association between
internal uncertainty and incentives is positive and is stronger for individual incentives
than for group bonus and profit sharing. The association between external uncertainty and
incentives is strongest for profit sharing suggesting that the impact of uncertainty on
incentives depends also on the level at which uncertainty and incentives are measured.
We find support for HA3: external uncertainty is not statistically significantly
associated with incentives at the individual or group level but at the firm level it is
strongly negatively correlated with the use of deferred profit sharing (Table 1e). The
marginal effect estimated suggests that a one standard deviation increase in external
uncertainty reduces the likelihood of using deferred profit sharing by 0.073 (1.79*-0.041).
For Model B, the positive association between internal uncertainty and delegation
is still present and of similar magnitude as in Model A. Consistent with HB1, in all
specifications delegation is strongly positively associated with the use of incentives,
suggesting complementarity between the two practices at the individual, group and firm
levels. The marginal effects suggest that the use of delegation is associated with an
increase in probability of using incentives between 0.27 and 0.51.
Consistent with hypothesis HB2, the relationship between internal uncertainty and
incentives in Model B is weaker than in Model A for all levels of incentives: taking
delegation into account clearly reduces the effect of internal uncertainty on incentives.
These results are consistent with Prendergast (2002a). These predictions were also
empirically confirmed by Foss and Laursen (2005) using a cross-section of Danish firms
in 1996 and DeVaro and Kurtulus (2010) using a sample of British establishments in
1998. The similarity in their findings to ours using U.S. firms during the same period

25
suggests that the predictions on the risk-incentives relationship are robust across
countries for the period of the middle to late 1990s. Interestingly as well, the magnitude
of the association between delegation and incentives (individual performance pay plans)
is similar to the one found in DeVaro and Kurtulus (2010): estimated coefficient of 0.947
in Table 5 compared to our estimate of 0.957 when we used individual incentives and
delegation as involvement and 1.25 when we use delegation as control. This suggests that
whether delegation reflects involvement, control or authority (as stated in the British
dataset used by DeVaro and Kurtulus), the association between delegation and incentives
is robust to different datasets and between the U.S. and England.
Regarding the possibility of endogeneity in the models, we do not find evidence
of a significant correlation between delegation of decision-making in firms’ decisions and
incentives in Model A. The estimated correlation between the residuals of the delegation
and incentives equation (ρ) in Model A is never statistically significant for individual,
group and firm-level incentives. On the other hand, there is evidence of a negative
correlation in the residual errors after delegation has been included in the model (Model
B). This implies that unobservable factors in the error terms are correlated even after
taking into account the complementarity between incentives and delegation. This result
provides additional motivation for investigating the relationship between uncertainty and
a more complete set of organization design practices. In other words, adding other
organization design practices to the decision to use incentives is likely to affect the
association between delegation and incentives found in Model B as it might be suffering
from an omitted variable bias as hypothesized in HC1.
Model C
Results for the three levels of incentives for Model C are presented in Tables 2a-
2b, 2c, and 2d-2e. Individual-level incentives are paired with individual delegation of
decision-making, whereas both group-level and firm-level incentives are paired with
team delegation of decision-making.27 For Model C we use three measures for ILM: on-
the-job training matched with individual incentives and team training for group- and
firm-level incentives; we also use employment security and promotions as additional 27 Theoretically, firm-level incentives should be matched with firm-level delegation of decision-making to employees (Ben-Ner and Jones, 1995), but this is not observed in our data, with the exception of a handful of firms that have employee representation on the board.

26
ILM measures for all three levels of incentives. Additional robustness checks, including
an alternative specification of monitoring and an alternative estimation approach and
model specification, are presented later in this section.
Tables 2a-2e present Model C, with recursive simultaneous equations estimation
of delegation, monitoring, ILM practices and incentives, using multivariate probit. The
results concerning internal uncertainty, delegation and incentives are consistent with the
results found in the simpler Model B: internal uncertainty is statistically significantly
associated with a greater likelihood of using delegation of decision-making and has a
weak to insignificant association with the likelihood of using incentives across all levels.
This result suggests that the main prediction in Prendergast (2002a) holds when
additional organizational design practices are taken into account. Consistent with HC1, in
all incentives equations the positive association between delegation and incentives is
weaker than in Model B suggesting the correlation estimated in the previous literature
suffered from an upward bias. This result is evidence for the importance of monitoring
and ILM practices in firms’ decisions to combine delegation and incentives. We will
further discuss the bias when we describe the empirical correlations between ILM
practices (and monitoring) and delegation and incentives.
Regarding hypothesis HC2, we find a statistically significant negative correlation
between internal uncertainty and monitoring across all levels of incentives. (The results
in Appendix B, which use guidance instead of monitoring, are similar). The estimates are
of similar magnitude to those found on the likelihood of delegation of decision-making,
but of opposite sign, across the different levels. This finding is consistent with the idea
that uncertainty increases the cost of monitoring relative to delegation. We find no
statistically significant relationship between external uncertainty and monitoring.
The use of ILM practices is positively associated with internal uncertainty, but
only in few specifications is the association statistically significant, providing only partial
support for HC3. Whenever the correlation is statistically significant, it concerns the
increased effect of internal uncertainty on the likelihood of using promotion and training
practices. External uncertainty has a weak negative association with the likelihood of
promotions although it is statistically significant at the group and firm levels, suggesting
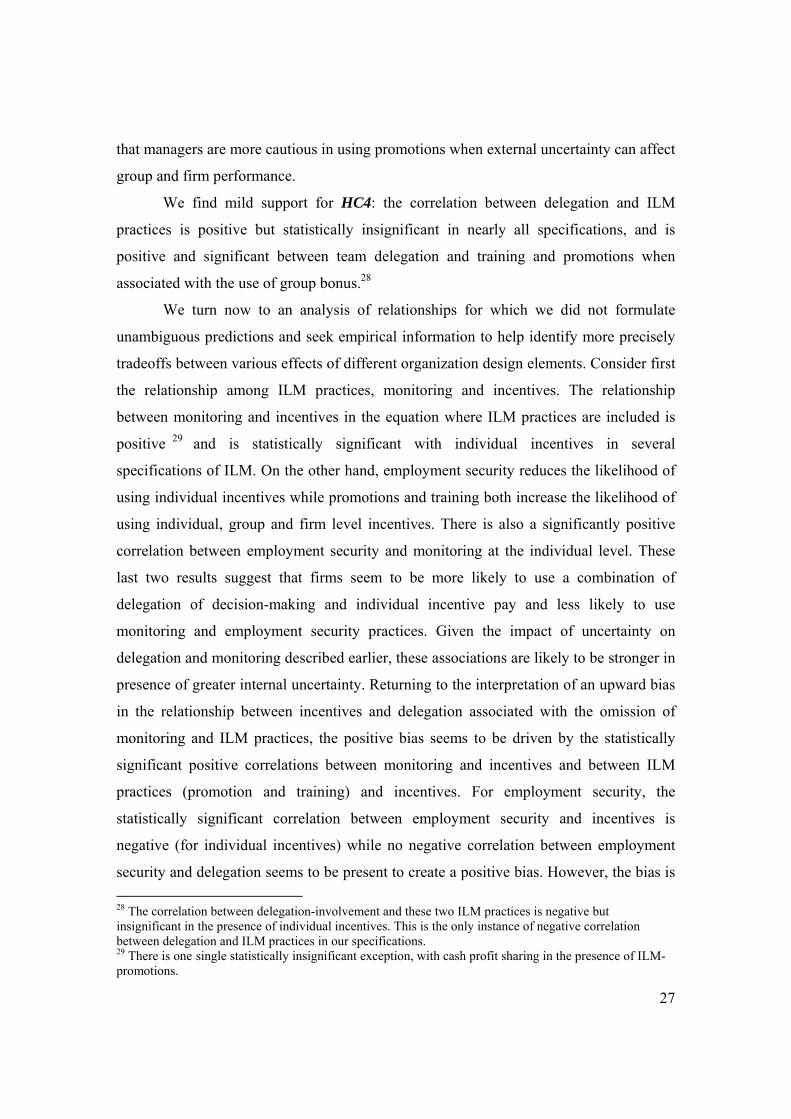
27
that managers are more cautious in using promotions when external uncertainty can affect
group and firm performance.
We find mild support for HC4: the correlation between delegation and ILM
practices is positive but statistically insignificant in nearly all specifications, and is
positive and significant between team delegation and training and promotions when
associated with the use of group bonus.28
We turn now to an analysis of relationships for which we did not formulate
unambiguous predictions and seek empirical information to help identify more precisely
tradeoffs between various effects of different organization design elements. Consider first
the relationship among ILM practices, monitoring and incentives. The relationship
between monitoring and incentives in the equation where ILM practices are included is
positive 29 and is statistically significant with individual incentives in several
specifications of ILM. On the other hand, employment security reduces the likelihood of
using individual incentives while promotions and training both increase the likelihood of
using individual, group and firm level incentives. There is also a significantly positive
correlation between employment security and monitoring at the individual level. These
last two results suggest that firms seem to be more likely to use a combination of
delegation of decision-making and individual incentive pay and less likely to use
monitoring and employment security practices. Given the impact of uncertainty on
delegation and monitoring described earlier, these associations are likely to be stronger in
presence of greater internal uncertainty. Returning to the interpretation of an upward bias
in the relationship between incentives and delegation associated with the omission of
monitoring and ILM practices, the positive bias seems to be driven by the statistically
significant positive correlations between monitoring and incentives and between ILM
practices (promotion and training) and incentives. For employment security, the
statistically significant correlation between employment security and incentives is
negative (for individual incentives) while no negative correlation between employment
security and delegation seems to be present to create a positive bias. However, the bias is 28 The correlation between delegation-involvement and these two ILM practices is negative but insignificant in the presence of individual incentives. This is the only instance of negative correlation between delegation and ILM practices in our specifications. 29 There is one single statistically insignificant exception, with cash profit sharing in the presence of ILM-promotions.

28
also a function of the correlations between employment security and the other variables
included in the incentives equation. In particular, we note the potential offsetting effect of
the strong positive correlation between monitoring and employment security. 30
Regarding the correlations in the residuals of each equation (ρij), the joint test of
significance cannot reject the null of joint equality of the estimated correlations for the
individual and group-based incentive plans when either promotions or training is used.
This result suggests that for individual and group-based incentives, Model C offers a
more complete account of the correlations between the organizational design practices
and their relationship with uncertainty compared to Model B, for which there was
evidence of endogeneity and unobserved factors creating correlations in the residuals.
For estimations with employment security, the estimated residual correlations are
largest with monitoring at all three levels; the correlations are all negative. This suggests
that unobservable factors may influence the joint choice of monitoring and employment
security. We also find that for cash profit sharing plans there are strong negative
correlations with delegation for all three ILM measures. This suggests that the risk-
incentive relationship for profit sharing plans might involve more (or other types of)
decisions than delegation of decision-making, monitoring and ILM practices.
To summarize the results, we find evidence that in our more general setting the
effect of internal and external uncertainty on incentives is weakened when taking into
account not only delegation but also monitoring and ILM practices. Internal uncertainty
consistently reduces the likelihood of using monitoring and in most specifications it
increases the likelihood of using promotions and training. Based on the correlations
between the various practices across the different levels of incentives, the results suggest
complementarity between incentives and delegation and between incentives and
promotions and training, at the individual, group and firm levels. Incentives and
employment security are possible substitutes. Firms are more likely to use a combination
of delegation of decision-making and individual incentive pay and less likely to use
30 Obtaining a precise formula for the bias is difficult. In the single omitted variable case the bias is based on the product of the correlation between previously omitted ILM practices (for example) and delegation, and the correlation between the omitted ILM practice and incentives. In the general case with multiple regressors, the omitted variable is also correlated with the other variables in the incentives equation (for example internal uncertainty and monitoring) creating additional pairwise correlations susceptible to influence the bias.

29
monitoring and employment security practices. Firms also seem to be more likely to use
incentive pay with promotions and training practices and (in the case of training) to
combine it with monitoring.
4.1. Robustness checks
We reestimated the models in Tables 1 and 2 using 2SLS and 3SLS estimations,
exploiting the categorical nature of the delegation and monitoring variables. Because the
two sets of estimates are very similar and the 3SLS are more efficient, we report only the
results from the 3SLS estimations. The results, presented in Appendix C, are qualitatively
similar to the bivariate and multivariate probit estimations presented in Tables 1 and 2.31
We reran the estimations in Tables 1 and 2 with different variables for Z. For
example, we used answers to the question: “To what extent does management share
information with non-managerial employees in the following areas: investment policies,
production planning and human resources planning?” Whether we used an index
representing the sum of the scores on several responses or only a dummy indicating one
of the answers, the main results remained qualitatively similar: the effects of internal and
external uncertainty on incentives drop substantially once delegation, monitoring and
ILM practices are taken into account in the decision to use incentive plans, with the
strongest effect for individual and group incentive plans.
We also reran the estimations in Table 2 replacing the variable related to
monitoring with a variable related to the extent to which workers have their work guided
and directed by supervisors and managers, a practice similar to monitoring. The results,
presented in Appendix B, are very similar to those in Table 2, confirming the robustness
of the results to alternative measures of monitoring.
To test the robustness of the results associated with the reduced sample size when
monitoring is introduced in Model C, we reran the analyses underlying Table 1 using the
reduced sample of Table 2. The results were very similar, suggesting that the two samples,
those who received the survey in the first stage and those who received it in the second
stage with the added monitoring and guidance questions, exhibit the same patterns.
31 The standard errors differ, changing significance levels. Because heteroscedasticity affects linear probability models, we do not place much weight on the difference in statistical significance.

30
Finally, we replicated the analysis for model C, reversing the specifications for
ILM and monitoring and found the results to be very similar.
5. Discussion and Conclusions
Organization design may be viewed as a set of responses to informational issues
aimed at ameliorating agency and technical problems that cause or allow employees to
apply lower and less apt effort than it is in the interest of the firm. The informational
issues faced by employees and their supervisors arise from the nature of the task
environment as well as from the external environment. Firms respond by way of
delegating decision-making from supervisors to better-informed employees and by
motivating employees with incentives, monitoring them, training them, offering
promotions and the inducement of employment security, and more. Expanding on the
organizational economics literature, we developed a framework for (a) the examination of
the relationship between uncertainty (internal and external) and various elements of
organization design, and (b) the analysis of the relationships among elements of
organization design.
From the theoretical framework we developed several hypotheses and availing
ourselves to a uniquely rich dataset of a cross-section of firms in Minnesota, we tested
them empirically. We found that the degree to which the task environment of core
employees is complicated has an important role in explaining organization design at the
shop-floor level. The degree of volatility in the firm’s product market bears only a weak
relationship to organization design at the shop-floor level. The design of the shop floor is
largely insulated from the external risk but is quite responsive to the internal uncertainty
associated with the immediate task environment. Prendergast (2002a) has it right: internal
uncertainty that arises from the unobservable influence that employees have over
outcomes calls for delegation of decision-making to them. In order to induce better effort
from employees, they are offered various incentives – hence a positive relationship
between internal uncertainty and incentives will be observed empirically, but if
delegation of decision-making is included in the estimation, the positive relationship
weakens to the point of statistical insignificance. This is precisely what we found,
validating findings by Foss and Laursen (2005) in Danish and DeVaro and Kurtulus

31
(2010) in British data, attesting to the robustness of the risk-incentives relationship across
different countries and datasets. Our paper also showed that this relationship exists in our
data at the individual, group and firm levels.
In an expanded model of organization design, including monitoring and different
practices associated with internal labor markets, we found that internal uncertainty
continues to be positively associated with delegation of decision-making, and is
negatively associated with monitoring (presumably because the more complicated the
task environment, the more expensive it is to monitor employees). However, individual
and group-level incentives are not linked to internal uncertainty, nor are internal labor
market practices.
External uncertainty as measured by market volatility is only weakly associated
with organization design elements: it has a weak positive relationship with delegation
(presumably in firms where core employees interact directly with the market), and has a
weak negative relationship with deferred profit sharing (probably because management
does not want to impose much risk on employees, the classic risk-incentives tradeoff).
We also examined the substitution and complementarity relationships among the
various elements of organization design relative to uncertainty. The robust and positive
association between delegation of decision-making and incentives is present at all three
organizational levels. Delegation and incentives are also positively associated with the
use of promotions and training. We find no significant correlations between monitoring
and delegation or monitoring and incentives. However, monitoring is positively
correlated with employment security. In view of our conceptual framework, this provides
support for the hypothesis that decision-making plays a central role in organization
design, with other elements playing a support or accommodating role.
From a firm policy standpoint, these results imply that organization design for
core employees takes shape mainly in response to the characteristics of the firm’s
production technology and business strategy. Thus, in choosing and improving workplace
organization, managers do not need to systematically react to the product market but need
to operate on the basis of long-term objectives. Furthermore, our findings, like those of
Ichniowski and Shaw (2003), Ennen and Richter (2010) and others, imply that managers
must regard the act of organization design as a deliberate and careful puzzle-like

32
assemblage of practices that complement and substitute each other rather than the
collection of best practices identified for their individual merits.
In conclusion, we find that the task environment, as the source of internal
uncertainty, influences strongly organization design by affecting the desired allocation of
decision-making; additional practices are employed to support appropriate exercise of
decision-making by employees. Firms choose the specific elements of design in view of
complementarity and substitution relationships among them; unobserved heterogeneity
among firms in our cross-sectional dataset, a limitation of our study, does not permit us to
deduce strict complementarity and substitution from the signs of the estimates on
organization design elements.
Another limitation of our study is that we do not have information about the cost
of employing various elements of organization design, which is certain to affect the
relative reliance on them. Data on the cost of most organizational practices are not
available in administrative datasets and are nearly impossible to obtain through surveys.
Inferences on costs on the basis of the complexity of the task environment are insufficient.
Laboratory and field experiments designed to capture key aspects of these costs such as
those designed by Nagin et al. (2002) and Dickinson and Villeval (2008) represent a
fruitful area of research in organization design.
References
Aoki, M., 1988. Information, incentives, and bargaining in the Japanese economy. Cambridge University Press, New York/Cambridge. Athey, S., Stern, S., 1998. An empirical framework for testing theories about complementarity in organizational design. NBER, Working Paper. Autor, D., Levy, F., Murnane, R., 2003. The skill content of recent technological change: an empirical exploration. Quarterly Journal of Economics 118, 1279-1333. Baker, G., Jorgensen, B., 2003. Volatility, noise, and incentives. Harvard Business School, Working Paper. Baron, J. N., Kreps, D. M., 2000. Strategic human resources: frameworks for general managers. New York: John Wiley & Sons.

33
Ben-Ner, A., Jones, D., 1995. Employee participation, ownership, and productivity: a theoretical framework. Industrial Relations 34, 532-554. Ben-Ner, A., Lluis, S., 2011. Learning: what and how? an empirical study of adjustments in workplace organization structure”, Industrial Relations, 50(1), 76-108. Ben-Ner, A., Montias, J. M., Neuberger, E., 1993. Basic issues in organizations: a comparative perspective. Journal of Comparative Economics 17, 207-242. Bromiley, P., Miller, K. D., 1990. Strategic risk and corporate performance: an analysis of alternative risk measures. Academy of Management Journal 33, 756-779. Cappellari, L., Jenkins, S. P., 2003. Multivariate probit regression using simulated maximum likelihood. Stata Journal 3, 221–235. Cappelli, P., Neumark, D., 2001. Do ‘high performance’ work practices improve establishment-level outcomes? Industrial and Labor Relations Review 54, 737-775. Carmichael, H. L,, 1988. Incentives in academics: Why is there tenure? Journal of Political Economy, 96, 453-472. Chen, Z., 2005. Incentive in academics: asymmetric information and tenure. Fudan University, Working Paper. Delaney, J. T., Huselid, M. A., 1996. The impact of human resource management practices on perceptions of organizational performance. The Academy of Management Journal 39, 949-969. Demougin, D., Fluet, C., 2001. Monitoring versus incentives. European Economic Review 45, 1741-1764. DeVaro, J., Kurtulus, F. A., 2010,. An empirical analysis of risk, incentives, and the delegation of worker authority. Industrial and Labor Relations Review 63, 641-661. Dickinson, D., Villeval, M., 2008. Does monitoring decrease work effort?: the complementarity between agency and crowding-out theories. Games and Economic Behavior 63, 56-76. Eisenberg, D., Rowe, B.,. 2009. The effect of smoking in young adulthood on smoking later in life: evidence based on the Vietnam era draft lottery. Forum for Health Economics and Policy 12(2), Article 4. Ennen, E., Richter, A., 2010. The whole is more than the sum of its parts: or is it? a review of the empirical literature on complementarities in organization. Journal of Management, 36(1), 207-233.

34
Foss, N., Laursen, K., 2005. Performance pay, delegation, and multitasking under uncertainty and innovativeness: an empirical investigation. Journal of Economic Behavior and Organization 58, 246-276. Garicano, L., 2000. Hierarchies and the organization of knowledge in production. Journal of Political Economy 108, 874-904. Grandori, A., 1991. Negotiating efficient organization forms. Journal of Economic Behavior and Organization 16, 319-340. Grossman S, Hart, O., 1986. The cost and benefit of ownership: A theory of lateral and vertical integration. Journal of Political Economy 94, 691-719. Hart, O., Moore, J., 1990. Property rights and the nature of the firm. Journal of Political Economy 98, 1119-1158. Hart, O., Moore, J., 2005. On the design of hierarchies: coordination versus specialization. Journal of Political Economy 113, 675-702. Holmstrom, B., Milgrom, R. 1994. The firm as an incentive system. American Economic Review 84:4, 972-991. Huselid, M., 1995. The impact of human resource management practices on turnover, productivity, and corporate financial performance. The Academy of Management Journal 38, 3, 635-672. Huselid, M.A. and Rau, B.L., 1997. The determinants of high performance work systems: cross-sectional and longitudinal analyses. Working Paper, Academy of Management Annual Meetings, Human Resource Management. Rutgers University. New Brunswick, NJ. Ichniowski, C., Shaw, K., 2003. Beyond incentive pay: insiders’ estimates of the value of complementary human resources practices. Journal of Economic Perspectives 17, 150-180. Ichniowski, C., Shaw, K., Prennushi, G., 1997. The Effects of human resource management practices on productivity: a study of steel finishing lines. American Economic Review 87(3), 291-313. Ichniowski, C., Kochan, T., Levine, D., Olson,C., Strauss, G,, 1996. What Works at Work, Industrial Relations 35(3), 299-333. Lafontaine, F., Slade, M., 2001. Incentive contracting and the franchise design. In: Chatterjee, K., Samuelson, W. (Eds). Game Theory and Business Applications, Boston: Kluwer, 133-188.

35
Laursen, K., Foss, N., 2003. New human resource management practices, complementarities, and the impact on innovation performance. Cambridge Journal of Economics 27, 243–263. Lindbeck, A., Snower, D. J., 2000. Multitask learning and the reorganization of work: from tayloristic to holistic organization. Journal of Labor Economics 18, 353-376. MacLeod, B. W., Carmichael, L., 2000. Worker cooperation and the ratchet effect. Journal of Labor Economics 18, 1-19. MacLeod, B. W., Parent, D., 1999. Job characteristics and the form of compensation. Research in Labor Economics 18, 177-242. Maddala, G. S., 1983. Limited Dependent and Qualitative Variables in Econometrics. New York: Cambridge University Press. Manning, A., 2005. Technological change and demand for low-skill workers. Scottish Journal of Political Economy 51, 581-608. March, J., Simon, H., 1993. Organizations, 2nd ed. Oxford: Blackwell. Marschak, J., Radner, R., 1972. Economic Theory of Teams. New Haven: Yale University Press. Milgrom, P., Roberts, J., 1992. Economics, Organization, & Management. New Jersey: Prentice Hall. Milgrom, P., Roberts, J., 1995. Complementarities and fit: strategy, structure, and organizational change in manufacturing. Journal of Accounting and Economics 19, 179-208. Miller, D., 1986. “Configurations of Strategy and Structure: Towards a Synthesis”, Strategic Management Journal, vol 7, 233-249. Nagar, V., 2002. Delegation and incentive compensation. The Accounting Review, 77, 379–395. Nagin, D., Rebitzer, J., Sanders, S., Taylor, L., 2002. Monitoring, motivation, and management: the determinants of opportunistic behavior in a field experiment. American Economic Review 92, 850-873. Neal, D., 1993. Supervision and wages across industries. The Review of Economics and Statistics 75, 409-417.
Osterman, P., 1994. How common is workplace transformation and who adopts it? Industrial and Labor Relations Review 47, 173-188.

36
Osterman, P., 2000. Work Reorganization in an Era of Restructuring: Trends in Diffusion and Effects on Employee Welfare, Industrial and Labor Relations Review 53(2), 176-196.
Perrow, C., 1986. Complex organizations: a critical essay,3rd ed. New York: Random House. Prendergast, C., 1999. The provision of incentives in firms. Journal of Economic Literature 37, 7-63. Prendergast, C., 2002a. The tenuous trade-off between risk and incentives. Journal of Political Economy 101, 1071-1102. Prendergast, C., 2002b. Uncertainty and incentives. Journal of Labor Economics 2, 115-137. Putterman, L., Kroszner R. S., 1996. The economic nature of the firm: a reader. New York: Cambridge University Press. Raith, M., 2008. Specific knowledge and performance measurement. RAND Journal of Economics 39(4), 1059-1079. Rantakari, H. V., 2008. On the role of uncertainty in the risk-incentives tradeoff. The B.E. Journal of Theoretical Economics 8(1), 1-23. Rebitzer, J. B., 1995. Is there a trade-off between supervision and wages? An empirical test of efficiency wage theory. Journal of Economic Behavior and Organization 28, 107-129. Ruefli, T., James, C., Lacugna, J., 1999. Risk measures in strategic management research: auld lang syne? Strategic Management 20, 167-194. Shi, L., 2011. Respondable risk and incentives for CEOs: The role of information-collection and decision-making. Journal of Corporate Finance 17(1), 189-205. Tyson, L., Levine, D., 1990. Participation, productivity, and the firm’s environment. In: Blinder, A. (Ed.). Paying for Productivity, Washington, D.C.: Brookings Institution, 183-237. Wilde, J., 2000. Identication of multiple probit models with endogenous dummy regressors. Economics Letters, 69, 309-312. Wulf, J. 2007., Authority, risk, and performance incentives: evidence from division manager positions inside firms. Journal of Industrial Economics 55, 169-196. Zabojnik, J., 1996. Pay-performance sensitivity and production uncertainty. Economic Letters 53, 291-296.

37
Zoghi, C., Levenson, A., Gibbs, M., 2005. Why are jobs designed the way they are? IZA, Discussion Paper.

38
Table 1. Models A and B – Bivariate Probit
Table 1a: Individual Delegation (Involvement) and Individual-Level Incentives
Table 1b: Individual Delegation (Control) and Individual-Level Incentives
Table 1c: Team Delegation and Group-Level Incentives (Group Bonus)
Model A Model B Individual
Delegation Individual Incentives Individual
Delegation Individual Incentives
Coeff. M. E. Coeff. M. E. Coeff. M. E. Coeff. M. E. Individual Delegation
0.957***
0.354***
(0.337) (0.124) Internal Uncertainty 0.122*** 0.042*** 0.075** 0.027*** 0.121*** 0.042*** 0.027 0.009 (0.030) (0.010) (0.030) (0.010) (0.030) (0.011) (0.035) (0.012) External Uncertainty -0.051 -0.017 0.008 0.003 -0.054 -0.018 0.026 0.009 (0.040) (0.013) (0.041) (0.014) (0.040) (0.014) (0.042) (0.015) Log(pseudo-likelihood) -605.65 -602.82 ρ
0.164 (0.077)
-0.409* (0.211)
Model A Model B Individual
Delegation Individual Incentives Individual
Delegation Individual Incentives
Coeff. M. E. Coeff. M. E. Coeff. M. E. Coeff. M. E. Individual Delegation 1.259*** 0.444*** (0.271) (0.093) Internal Uncertainty 0.151*** 0.060*** 0.074*** 0.027*** 0.148*** 0.059*** -0.015 -0.006 (0.029) (0.011) (0.030) (0.013) (0.027) (0.011) (0.037) (0.014) External Uncertainty 0.092*** 0.037*** 0.009 0.003 0.085*** 0.033** -0.028 -0.010 (0.037) (0.015) (0.041) (0.014) (0.037) (0.015) (0.038) (0.014) Log(pseudo-likelihood) -646.01 -642.36 ρ
0.055 (0.076)
-0.732** (0.183)
Model A Model B Team
Delegation Group Bonus Team
Delegation Group Bonus
Coeff. M. E. Coeff. M. E. Coeff. M. E. Coeff. M. E. Team Delegation 1.197*** 0.404*** (0.337) (0.126) Internal Uncertainty 0.143*** 0.039*** 0.054* 0.015* 0.153*** 0.043*** -0.007 -0.001 (0.031) (0.009) (0.033) (0.009) (0.034) (0.009) (0.034) (0.010) External Uncertainty -0.031 -0.009 -0.017 -0.004 -0.025 -0.007 -0.009 -0.002 (0.041) (0.012) (0.043) (0.012) (0.041) (0.011) (0.042) (0.012) Log(pseudo-likelihood) -536.66 -533.01 ρ
0.131 (0.085)
-0.611** (0.197)

39
Table 1d: Team Delegation and Firm-Level Incentives (Cash Profit Sharing)
Table 1e: Individual Delegation (Involvement) and Firm-Level Incentives (Deferred
Profit Sharing)
Notes to Table 1 1. All estimations include controls for industry (1-digit SIC), industry-level capital-labor ratio (3-digit SIC),and firm characteristics: union status, log of number of employees, log of age, and log of average wage. 2. The first column (Coeff.) represents the beta coefficients and the second column represents marginal effects evaluated at the mean of the independent variables with robust standard errors in parenthesis. 3. N=530. 4. All estimations of Delegation and Team Delegation include also an index of employee participation on various decision-making issues. See text for details. 5.
Model A Model B Team
Delegation Cash
Profit Sharing Team
Delegation Cash
Profit Sharing Coeff. M. E. Coeff. M. E. Coeff. M. E. Coeff. M. E. Team Delegation 1.450*** 0.512*** (0.198) (0.065) Internal Uncertainty 0.143*** 0.040*** 0.039 0.011 0.143*** 0.041*** -0.030 -0.009 (0.032) (0.008) (0.031) (0.009) (0.032) (0.009) (0.029) (0.009) External Uncertainty -0.031 -0.008 0.025 0.007 -0.047 -0.013 0.036 0.011 (0.042) (0.012) (0.042) (0.012) (0.043) (0.012) (0.040) (0.012) Log(pseudo-likelihood) -521.62 -509.96 ρ
0.025 (0.090)
-0.758*** (0.091)
Model A Model B Individual
Delegation Deferred
Profit Sharing Individual Delegation
Deferred Profit Sharing
Coeff. M. E. Coeff. M. E. Coeff. M. E. Coeff. M. E. Individual Delegation
0.851***
0.266***
(0.311) (0.112) Internal Uncertainty 0.120*** 0.042*** -0.006 -0.001 0.122*** 0.042*** -0.043 -0.012 (0.030) (0.010) (0.032) (0.008) (0.029) (0.010) (0.034) (0.009) External Uncertainty -0.051 -0.017 -0.154*** -0.041*** -0.043 -0.015 -0.129*** -0.036*** (0.040) (0.014) (0.049) (0.012) (0.040) (0.014) (0.049) (0.013) Log(pseudo-likelihood) -538.19 -535.76 ρ12
-0.106 (0.086)
-0.581*** (0.167)

40
ρ = cov(e1, e2). Standard error of ρ is in parenthesis. The result of the test of exogeneity (H0: ρ=0) is shown with the star symbol. It is based on a Wald test. 6. ***=significant at the 1% level, **=significant at the 5% level, *=significant at the 10% level.

41
Table 2. Model C – Multivariate Probit
Table 2a: Individual Delegation (Involvement), Monitoring, Internal Labor Markets (Employment Security, Promotions or On-the-Job Training) and Individual-Level Incentives
Individual
Delegation Monitoring ILM –
Employment Security
Individual Incentives
Internal Uncertainty 0.108*** -0.145*** 0.048 0.051 (0.044) (0.044) (0.044) (0.059) External Uncertainty -0.015 -0.033 0.039 0.037 (0.053) (0.052) (0.053) (0.058) Delegation - Involvement - 0.070 0.831 0.946** (0.374) (0.502) (0.469) Monitoring - - 1.122*** 0.320 (0.274) (0.409) Employment Security - - - -0.931** (0.354) Joint Test of Significance of ρij 18.92 (p-value) (0.004) Log Pseudolikelihood -670.20 Individual
Delegation Monitoring ILM – Promotions Individual
Incentives Internal Uncertainty 0.107** -0.167*** 0.138** 0.073 (0.044) (0.045) (0.067) (0.068) External Uncertainty -0.016 -0.014 -0.091 0.023 (0.054) (0.052) (0.069) (0.062) Delegation - Involvement - 0.446 0.166 0.776 (0.376) (0.550) (0.601) Monitoring - - 0.397 0.560 (1.078) (0.515) Promotions - - - 0.139 (0.724) Joint Test of Significance of ρij 5.33
(0.501) -649.75
(p-value) Log Pseudolikelihood Individual
Delegation Monitoring ILM – On the Job
Training Individual Incentives
Internal Uncertainty 0.105** -0.157** 0.138*** 0.085 (0.044) (0.064) (0.040) (0.062) External Uncertainty -0.015 -0.001 0.037 0.053 (0.052) (0.062) (0.041) (0.045) Delegation - Involvement - 0.221 0.009 0.673* (0.554) (0.415) (0.407) Monitoring - - 1.370 0.785* (0.958) (0.494) OJT - - - 0.664 (0.514) Joint Test of Significance of ρij (p-value) Log Pseudolikelihood
5.60 (0.469) -640.08

42
Table 2b: Individual Delegation (Control), Monitoring, Internal Labor Markets (Employment Security, Promotions or On-the-Job Training)
and Individual-Level Incentives
Individual Delegation
Monitoring ILM – Employment
Security
Individual Incentives
Internal Uncertainty 0.152*** -0.129*** 0.055 0.070 (0.040) (0.045) (0.046) (0.069) External Uncertainty 0.112** -0.022 0.008 0.011 (0.051) (0.050) (0.054) (0.058) Delegation - Control - -0.100 0.509 0.576 (0.291) (0.364) (0.339) Monitoring - - 1.321*** 0.647* (0.213) (0.371) Employment Security - - - -0.745* (0.435) Joint Test of Significance of ρij 19.70 (p-value) (0.003) Log Pseudolikelihood -689.60 Individual
Delegation Monitoring ILM – Promotions Individual
Incentives Internal Uncertainty 0.150*** -0.159*** 0.090 0.087 (0.040) (0.048) (0.102) (0.061) External Uncertainty 0.115** -0.007 -0.109* 0.021 (0.051) (0.056) (0.070) (0.063) Delegation - Control - -0.005 -0.030 0.419 (0.363) (0.686) (0.547) Monitoring - - -0.683 1.084** (1.307) (0.549)

43
Promotions - - - 0.696* (0.429) Joint Test of Significance of ρij 4.78
(0.571) -667.12
(p-value) Log Pseudolikelihood Individual
Delegation Monitoring ILM – On the Job
Training Individual Incentives
Internal Uncertainty 0.151*** -0.155*** 0.091 0.086 (0.040) (0.048) (0.105) (0.072) External Uncertainty 0.112** -0.013 0.041 0.009 (0.052) (0.051) (0.071) (0.063) Delegation - Control - 0.005 -0.244 0.416 (0.342) (0.593) (0.582) Monitoring - - -0.084 0.913 (1.307) (0.695) OJT - - - 1.029*** (0.388) Joint Test of Significance of ρij (p-value) Log Pseudolikelihood
3.86 (0.694) -657.42

44
Table 2c: Team Delegation, Monitoring, Internal Labor Markets (Employment Security, Promotions or Team Training) and Group-Level Incentives (Group Bonus)
Team Delegation
Monitoring ILM – Employment
Security
Group Bonus
Internal Uncertainty 0.151*** -0.144*** 0.019 0.081 (0.051) (0.045) (0.071) (0.073) External Uncertainty 0.085 -0.027 0.027 -0.014 (0.063) (0.057) (0.058) (0.057) Team Delegation - -0.275 1.435 1.304 (0.468) (1.285) (1.180) Monitoring - - 0.929 0.601 (0.892) (0.645) Employment Security - - - 0.039 (0.770) Joint Test of Significance of ρij 14.95 (p-value) (0.021) Log Pseudolikelihood -603.97 Team
Delegation Monitoring ILM – Promotions Group
Bonus Internal Uncertainty 0.134*** -0.159*** 0.078 0.102* (0.051) (0.047) (0.087) (0.057) External Uncertainty 0.090* -0.019 -0.127** 0.022 (0.060) (0.053) (0.062) (0.067) Team Delegation - -0.096 1.359** 0.779 (0.450) (0.597) (0.613) Monitoring - - -0.140 0.645 (0.603) (0.563) Promotions - - - 0.107 (0.925)

45
Joint Test of Significance of ρij 5.46 (0.485) -583.51
(p-value) Log Pseudolikelihood Team
Delegation Monitoring ILM – Team
Training Group Bonus
Internal Uncertainty 0.139*** -0.159*** 0.106* 0.060 (0.050) (0.045) (0.070) (0.059) External Uncertainty 0.089 -0.016 -0.038 0.028 (0.063) (0.052) (0.052) (0.054) Team Delegation - -0.026 1.509** 0.569 (0.459) (0.501) (0.521) Monitoring - - -0.224 0.612 (0.720) (0.676) Team Training - - - 0.864* (0.546) Joint Test of Significance of ρij (p-value) Log Pseudolikelihood
9.75 (0.135) -638.65

46
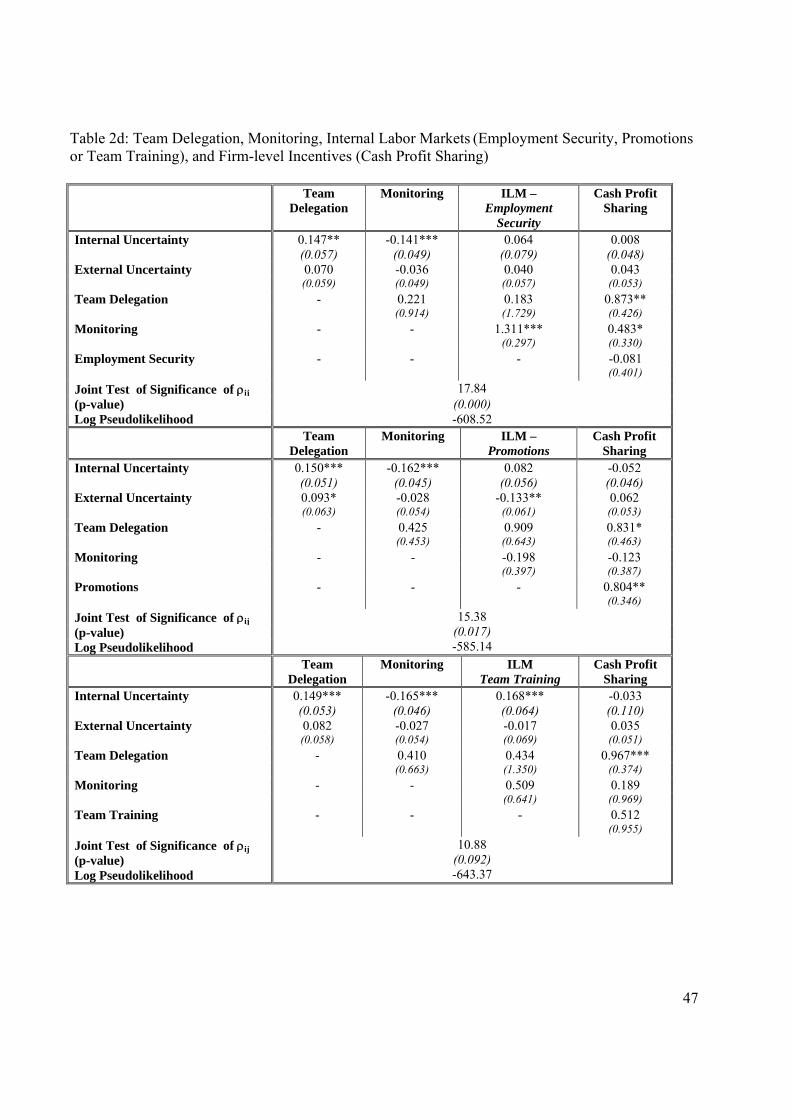
47
Table 2d: Team Delegation, Monitoring, Internal Labor Markets (Employment Security, Promotions or Team Training), and Firm-level Incentives (Cash Profit Sharing)
Team Delegation
Monitoring ILM – Employment
Security
Cash Profit Sharing
Internal Uncertainty 0.147** -0.141*** 0.064 0.008 (0.057) (0.049) (0.079) (0.048) External Uncertainty 0.070 -0.036 0.040 0.043 (0.059) (0.049) (0.057) (0.053) Team Delegation - 0.221 0.183 0.873** (0.914) (1.729) (0.426) Monitoring - - 1.311*** 0.483* (0.297) (0.330) Employment Security - - - -0.081 (0.401) Joint Test of Significance of ρij 17.84 (p-value) (0.000) Log Pseudolikelihood -608.52 Team
Delegation Monitoring ILM –
Promotions Cash Profit
Sharing Internal Uncertainty 0.150*** -0.162*** 0.082 -0.052 (0.051) (0.045) (0.056) (0.046) External Uncertainty 0.093* -0.028 -0.133** 0.062 (0.063) (0.054) (0.061) (0.053) Team Delegation - 0.425 0.909 0.831* (0.453) (0.643) (0.463) Monitoring - - -0.198 -0.123 (0.397) (0.387) Promotions - - - 0.804** (0.346) Joint Test of Significance of ρij 15.38
(0.017) -585.14
(p-value) Log Pseudolikelihood Team
Delegation Monitoring ILM
Team Training Cash Profit
Sharing Internal Uncertainty 0.149*** -0.165*** 0.168*** -0.033 (0.053) (0.046) (0.064) (0.110) External Uncertainty 0.082 -0.027 -0.017 0.035 (0.058) (0.054) (0.069) (0.051) Team Delegation - 0.410 0.434 0.967*** (0.663) (1.350) (0.374) Monitoring - - 0.509 0.189 (0.641) (0.969) Team Training - - - 0.512 (0.955) Joint Test of Significance of ρij (p-value) Log Pseudolikelihood
10.88 (0.092) -643.37

48
Table 2e: Individual Delegation (involvement), Monitoring, Internal Labor Markets (Employment Security, Promotions or Team Training), and Firm-level Incentives (Deferred Profit Sharing)
Individual Delegation
Monitoring ILM – Employment
Security
Deferred Profit
Sharing

49
Notes to Table 2 1. All estimations include controls for industry (1-digit SIC), industry-level capital-labor ratio (3-digit SIC),and firm characteristics: union status, log of number of employees, log of age, and log of average wage. 2. Beta coefficients displayed with robust standard errors in parentheses. 3. N=530 4. All estimations of Delegation and Team Delegation include also an index of employee participation on various issues. See text for details. 5. All estimations of Monitoring include the proportion of employees per supervisor. See the text for details.
Internal Uncertainty 0.109*** -0.145*** 0.044 -0.036 (0.044) (0.045) (0.048) (0.059) External Uncertainty -0.011 -0.026 0.051 -0.164*** (0.053) (0.052) (0.053) (0.067) Individual Delegation - 0.074 0.718 0.604 (0.397) (0.568) (0.488) Monitoring - - 1.154*** -0.041 (0.355) (0.421) Employment Security - - - -0.349 (0.519) Joint Test of Significance of ρij 13.14 (p-value) (0.041) Log Pseudolikelihood -656.68 Individual
Delegation Monitoring ILM –
Promotions Deferred
Profit Sharing
Internal Uncertainty 0.110*** -0.163*** 0.127** -0.072 (0.044) (0.045) (0.062) (0.048) External Uncertainty -0.010 -0.017 -0.104* -0.164*** (0.053) (0.053) (0.065) (0.068) Individual Delegation - 0.390 0.148 0.497 (0.371) (0.581) (0.659) Monitoring - - 0.121 -0.019 (0.642) (0.569) Promotions - - - 0.341 (0.696) Joint Test of Significance of ρij 3.19
(0.783) -635.93
(p-value) Log Pseudolikelihood Individual
Delegation Monitoring ILM – On the Job
Training Deferred
Profit Sharing
Internal Uncertainty 0.109*** -0.164*** 0.103 -0.039 (0.044) (0.044) (0.073) (0.067) External Uncertainty -0.009 -0.017 0.035 -0.170*** (0.053) (0.052) (0.061) (0.069) Individual Delegation - 0.387 0.049 0.539 (0.332) (0.577) (0.608) Monitoring - - 0.441 -0.052 (0.862) (0.508) OJT - - - 0.346 (0.444) Joint Test of Significance of ρij 4.026
(0.673) -629.72

50
6. All estimations of ILM include a dummy indicating the extent to which employees participate in rules related to training and development. See text for details. 7. ***=significant at the 1% level, **=significant at the 5% level, *=significant at the 10% level.

51
APPENDIX A
Table A1: Variable Definitions, Sources and Summary Statistics
Variable Name Variable Definition and Source Mean (Std. Err.)
Organization design variables
Individual Incentives
Existence of an individual incentives plan. 0 = no, 1 = yes; from survey.
0.326
Group level incentives Existence of group bonus plan. 0 = no, 1 = yes; from survey.
0.239
Firm-level incentives Existence of cash or deferred profit sharing plan. 0 = no, 1 = yes; from survey.
0.386
Individual delegation - involvement
The extent to which core employees participate in an employee involvement program; 1-5 scale, 1 = not at all, 5 = extreme; from survey.
3.01 (0.043)
Individual delegation – control
The extent to which core employees have control over how their work is done; 1-5 scale, 1 = not at all, 5 = extreme; from survey.
3.38 (0.039)
Team delegation Existence of self-managing work teams. 0 = no, 1=yes; from survey. 0.232 (0.016)
Monitoring The extent to which core employees’ work is monitored by their supervisors; 1-5 scale, 1 = not at all, 5 = extreme; from survey.
3.42 (0.045)
Guidance The extent to which core employees’ work is guided and directed by supervisors and managers.
3.47 (0.044)
Employment security Existence of employment security practices. 0 = no, 1=yes; from survey.
0.216
On-the-job training Existence of on-the-job training. 0 = no, 1=yes; from survey. 0.815
Team training Existence of training in team building skills. 0 = no, 1=yes; from survey. 0.441
Uncertainty variables
Complexity The extent to which core employees’ work tasks are complex; 1-5 scale, 1 = not at all, 5 = extreme; from survey.
2.93 (0.042)
Variability The extent to which core employees’ work tasks are variable; 1-5 scale, 1 = not at all, 5 = extreme; from survey.
3.22 (0.038)
Routine The extent to which core employee’s work activities are routine; 1-5 scale, 1 = not at all, 5 = extreme; from survey.
3.42 (0.037)
Internal uncertainty The sum of complexity, variability and reversed-routine scales, 3=not at all, 15= extreme; from survey
8.73 (0.084)
External uncertainty Logarithm of standard deviation of net income; based on 5 years of net income in 3-digit SIC industries, 1990-1994; from COMPUSTAT.
4.84 (0.072)
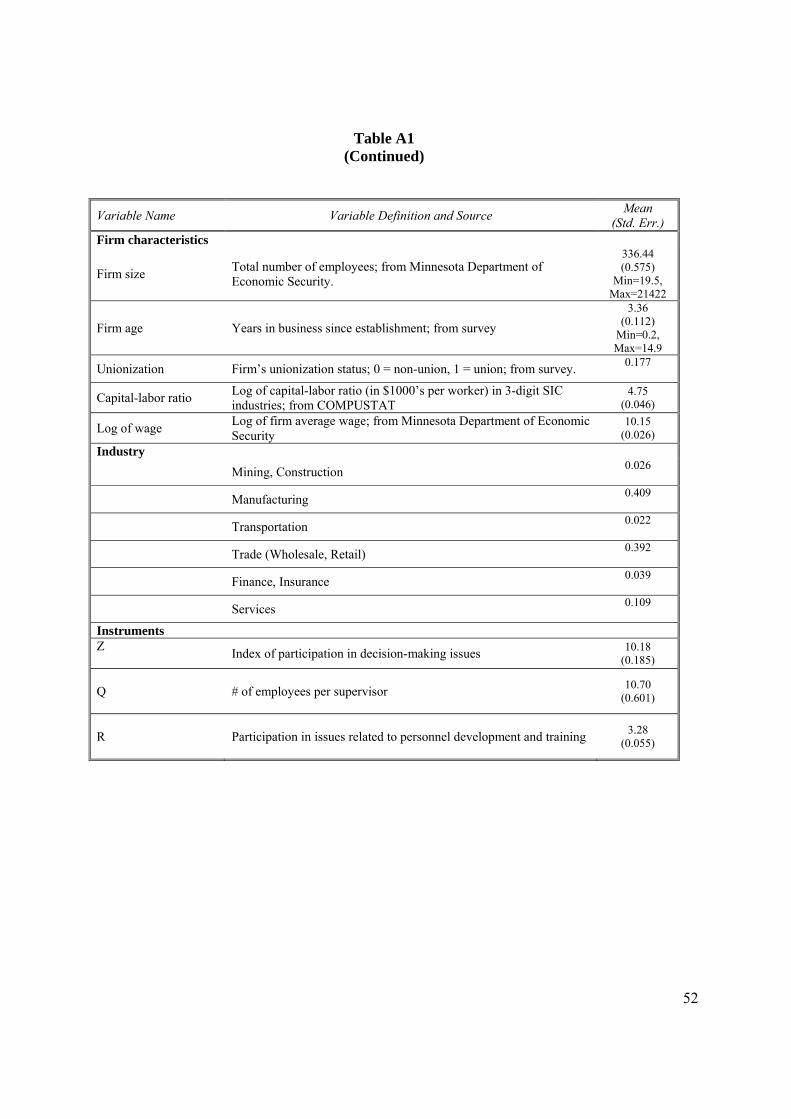
52
Table A1 (Continued)
Variable Name Variable Definition and Source Mean (Std. Err.)
Firm characteristics
Firm size Total number of employees; from Minnesota Department of Economic Security.
336.44 (0.575)
Min=19.5, Max=21422
Firm age Years in business since establishment; from survey 3.36
(0.112) Min=0.2, Max=14.9
Unionization Firm’s unionization status; 0 = non-union, 1 = union; from survey. 0.177
Capital-labor ratio Log of capital-labor ratio (in $1000’s per worker) in 3-digit SIC industries; from COMPUSTAT
4.75 (0.046)
Log of wage Log of firm average wage; from Minnesota Department of Economic Security
10.15 (0.026)
Industry
Mining, Construction 0.026
Manufacturing 0.409
Transportation 0.022
Trade (Wholesale, Retail) 0.392
Finance, Insurance 0.039
Services 0.109
Instruments Z Index of participation in decision-making issues 10.18
(0.185)
Q # of employees per supervisor
10.70 (0.601)
R Participation in issues related to personnel development and training
3.28 (0.055)

53
APPENDIX B: Replication of Table 2 (Model C) with Guidance instead of Monitoring
Table B1a: Individual Delegation (Involvement), Guidance, Internal Labor Markets (Employment Security, Promotions or On-the-Job Training) and Individual-Level Incentives
Individual
Delegation Guidance ILM –
Employment Security
Individual Incentives
Internal Uncertainty 0.114*** -0.060 0.042 0.035 (0.043) (0.049) (0.044) (0.051) External Uncertainty -0.022 -0.136 0.055 0.034 (0.053) (0.043) (0.053) (0.059) Delegation - Involvement - -0.353 1.037*** 0.991** (0.311) (0.415) (0.363) Guidance - - 1.093*** 0.061 (0.244) (0.323) Employment Security - - - -0.932** (0.340) Joint Test of Significance of ρij 18.99 (p-value) (0.004) Log Pseudolikelihood -669.41 Individual
Delegation Guidance ILM – Promotions Individual
Incentives Internal Uncertainty 0.115** -0.176*** 0.063 0.087* (0.043) (0.047) (0.059) (0.055) External Uncertainty -0.011 -0.043 -0.111* 0.053 (0.053) (0.052) (0.062) (0.058) Delegation - Involvement - -0.158 0.209 0.514 (0.320) (0.404) (0.458) Guidance - - -0.878* 0.929** (0.495) (0.420) Promotions - - - 0.934** (0.388) Joint Test of Significance of ρij 5.99
(0.424) -648.67
(p-value) Log Pseudolikelihood Individual
Delegation Guidance ILM – On the Job
Training Individual Incentives
Internal Uncertainty 0.115*** -0.174*** 0.032 0.092 (0.043) (0.048) (0.076) (0.068) External Uncertainty -0.011 -0.048 0.024 0.032 (0.053) (0.055) (0.061) (0.058) Delegation - Involvement - -0.156 0.236 0.525 (0.363) (0.466) (0.565) Guidance - - -0.652 0.829 (0.789) (0.575) OJT - - - 1.142*** (0.347) Joint Test of Significance of ρij (p-value) Log Pseudolikelihood
4.16 (0.654) -639.67
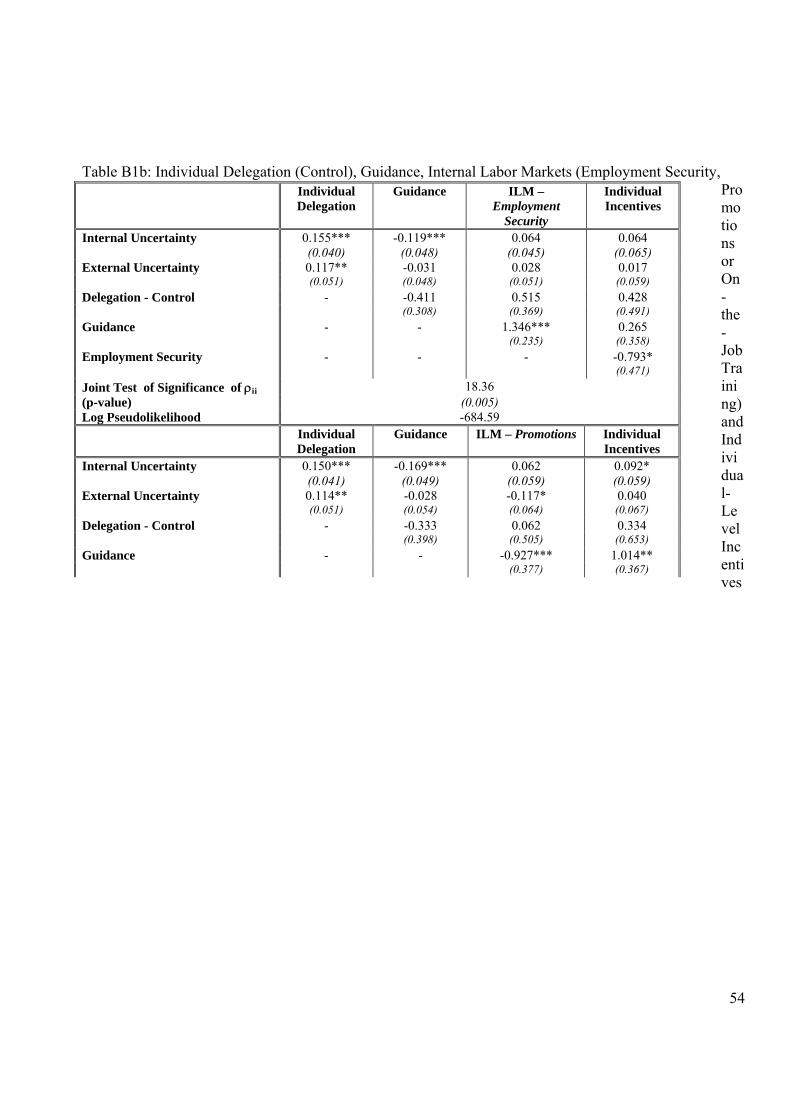
54
Table B1b: Individual Delegation (Control), Guidance, Internal Labor Markets (Employment Security, Promotions or On-the-Job Training)
and Individual-Level Incentives
Individual Delegation
Guidance ILM – Employment
Security
Individual Incentives
Internal Uncertainty 0.155*** -0.119*** 0.064 0.064 (0.040) (0.048) (0.045) (0.065) External Uncertainty 0.117** -0.031 0.028 0.017 (0.051) (0.048) (0.051) (0.059) Delegation - Control - -0.411 0.515 0.428 (0.308) (0.369) (0.491) Guidance - - 1.346*** 0.265 (0.235) (0.358) Employment Security - - - -0.793* (0.471) Joint Test of Significance of ρij 18.36 (p-value) (0.005) Log Pseudolikelihood -684.59 Individual
Delegation Guidance ILM – Promotions Individual
Incentives Internal Uncertainty 0.150*** -0.169*** 0.062 0.092* (0.041) (0.049) (0.059) (0.059) External Uncertainty 0.114** -0.028 -0.117* 0.040 (0.051) (0.054) (0.064) (0.067) Delegation - Control - -0.333 0.062 0.334 (0.398) (0.505) (0.653) Guidance - - -0.927*** 1.014** (0.377) (0.367)

55
Promotions - - - 0.889* (0.522) Joint Test of Significance of ρij 6.96
(0.324) -660.34
(p-value) Log Pseudolikelihood Individual
Delegation Guidance ILM – On the Job
Training Individual Incentives
Internal Uncertainty 0.150*** -0.165*** 0.030 0.094 (0.041) (0.050) (0.074) (0.064) External Uncertainty 0.111** -0.033 0.020 0.018 (0.051) (0.058) (0.072) (0.062) Delegation - Control - -0.386 -0.048 0.407 (0.426) (0.670) (0.569) Guidance - - -0.843* 0.985** (0.516) (0.436) OJT - - - 1.182*** (0.328) Joint Test of Significance of ρij (p-value) Log Pseudolikelihood
4.99 (0.544) -650.57

56
Table B1c: Team Delegation, Guidance, Internal Labor Markets (Employment Security, Promotions or Team Training) and Group-Level Incentives (Group Bonus)
Team Delegation
Guidance ILM – Employment
Security
Group Bonus
Internal Uncertainty 0.152*** -0.141*** 0.025 0.077 (0.051) (0.051) (0.064) (0.074) External Uncertainty 0.076 -0.039 0.035 0.016 (0.057) (0.053) (0.054) (0.061) Team Delegation - -0.628 1.521 1.336 (0.743) (1.068) (0.957) Guidance - - 0.997 0.464 (0.605) (0.566) Employment Security - - - -0.056 (0.670) Joint Test of Significance of ρij 16.14 (p-value) (0.014) Log Pseudolikelihood -602.24 Team
Delegation Guidance ILM – Promotions Group
Bonus Internal Uncertainty 0.133*** -0.187*** 0.035 0.104** (0.051) (0.043) (0.066) (0.050) External Uncertainty 0.094* -0.042 -0.130** 0.037 (0.059) (0.053) (0.058) (0.064) Team Delegation - 0.169 1.311*** 0.817* (0.380) (0.462) (0.439) Guidance - - -0.594 0.755* (0.441) (0.413) Promotions - - - 0.465 (0.669)

57
Joint Test of Significance of ρij 7.08 (0.313) -581.53
(p-value) Log Pseudolikelihood Team
Delegation Guidance ILM – Team
Training Group Bonus
Internal Uncertainty 0.138*** -0.183*** 0.097* 0.068 (0.050) (0.045) (0.060) (0.056) External Uncertainty 0.089* -0.035 -0.038 0.031 (0.060) (0.052) (0.051) (0.054) Team Delegation - -0.023 1.509** 0.593* (0.438) (0.501) (0.397) Guidance - - 0.112 0.636* (0.504) (0.369) Team Training - - - 0.846* (0.447) Joint Test of Significance of ρij (p-value) Log Pseudolikelihood
10.46 (0.106) -637.41

58

59
Table B1d: Team Delegation, Guidance, Internal Labor Markets (Employment Security, Promotions or Team Training), and Firm-level Incentives (Cash Profit Sharing)
Team Delegation
Guidance ILM – Employment
Security
Cash Profit Sharing
Internal Uncertainty 0.168*** -0.145*** 0.026 -0.034 (0.054) (0.074) (0.083) (0.104) External Uncertainty 0.069 -0.041 0.032 0.037 (0.084) (0.053) (0.066) (0.060) Team Delegation - -0.454 1.360 0.808 (0.531) (1.407) (1.828) Guidance - - 0.982 -0.267 (1.022) (2.086) Employment Security - - - -0.036 (1.045) Joint Test of Significance of ρij 17.82 (p-value) (0.007) Log Pseudolikelihood -606.98 Team
Delegation Guidance ILM –
Promotions Cash Profit
Sharing Internal Uncertainty 0.152*** -0.176*** 0.068 -0.076 (0.053) (0.048) (0.060) (0.056) External Uncertainty 0.073 -0.060 -0.133** 0.048 (0.054) (0.056) (0.059) (0.053) Team Delegation - -0.004 1.334** 0.568 (0.604) (0.598) (0.473) Guidance - - -0.078 -0.704 (0.597) (0.848) Promotions - - - 0.578 (0.577) Joint Test of Significance of ρij 18.11
(0.017) -582.18
(p-value) Log Pseudolikelihood Team
Delegation Guidance ILM
Team Training Cash Profit
Sharing Internal Uncertainty 0.151*** -0.177*** 0.142*** -0.084 (0.055) (0.047) (0.059) (0.065) External Uncertainty 0.076 -0.051 -0.031 0.031 (0.060) (0.059) (0.055) (0.059) Team Delegation - -0.088 1.439* 0.324 (0.587) (0.898) (0.663) Guidance - - 0.648 -0.752 (0.457) (0.811) Team Training - - - 0.634 (0.854) Joint Test of Significance of ρij (p-value) Log Pseudolikelihood
10.70 (0.098) -642.29

60
Table B1e: Team Delegation, Guidance, Internal Labor Markets (Employment Security, Promotions or Team Training), and Firm-level Incentives (Deferred Profit Sharing)
Individual Delegation
Guidance ILM – Employment
Security
Deferred Profit
Sharing Internal Uncertainty 0.111*** -0.134*** 0.044 -0.052 (0.044) (0.044) (0.047) (0.050) External Uncertainty -0.022 -0.052 0.067 -0.162*** (0.055) (0.051) (0.051) (0.067) Individual Delegation - -0.458 0.984** 0.750* (0.334) (0.442) (0.402) Guidance - - 1.165*** -0.168 (0.300) (0.374) Employment Security - - - -0.102 (0.504) Joint Test of Significance of ρij 15.63 (p-value) (0.015) Log Pseudolikelihood -653.78 Individual
Delegation Guidance ILM –
Promotions Deferred
Profit Sharing
Internal Uncertainty 0.116*** -0.165*** 0.093* -0.059 (0.043) (0.047) (0.061) (0.053) External Uncertainty -0.008 -0.040 -0.111* -0.163*** (0.054) (0.053) (0.065) (0.066) Individual Delegation - -0.136 0.255 0.587 (0.379) (0.438) (0.572) Guidance - - -0.355 -0.335 (0.478) (0.430) Promotions - - - 0.178 (0.470) Joint Test of Significance of ρij 3.72
(0.783) -633.96
(p-value) Log Pseudolikelihood Individual
Delegation Guidance ILM – On the Job
Training Deferred
Profit Sharing
Internal Uncertainty 0.116*** -0.166*** 0.064 -0.059 (0.043) (0.047) (0.069) (0.054) External Uncertainty -0.008 -0.038 0.028 -0.168*** (0.054) (0.053) (0.063) (0.066) Individual Delegation - -0.125 0.164 0.542 (0.377) (0.461) (0.531) Guidance - - -0.190 -0.341 (0.697) (0.415) OJT - - - 0.332 (0.373) Joint Test of Significance of ρij 3.36
(0.762) -628.00

61
Notes to Table B
1. All estimations include controls for industry (1-digit SIC), industry-level capital-labor ratio (3-digit SIC),and firm characteristics: union status, log of number of employees, log of age, and log of average wage.
2. Beta coefficients displayed with robust standard errors in parentheses. 3. N=530 4. All estimations of Delegation and Team Delegation include also an index of employee participation on various issues. See text for details. 5. All estimations of Monitoring include the proportion of employees per supervisor. See the text for details. 6. All estimations of ILM include a dummy indicating the extent to which employees participate in rules related to training and development. See text for details. 7. ***=significant at the 1% level, **=significant at the 5% level, *=significant at the 10% level.

62
APPENDIX C
Table C1a: Uncertainty, Delegation as Involvement and Individual Incentivesa
3SLS Estimations
Table C1b: Uncertainty, Delegation as Control and Individual Incentivesa
3SLS Estimations
Model A Model B Delegationb Incentives Delegationb Incentives
Delegation - Involvement
0.160***
(0.055) Internal Uncertainty 0.106*** 0.021** 0.105*** -0.000 (0.018) (0.010) (0.018) (0.012) External Uncertainty -0.020 0.020* -0.020 0.025** (0.021) (0.012) (0.021) (0.012) Chi2 129.97 14.76 132.17 22.26 (p-value) (0.000) (0.002) (0.000) (0.006) Notes: a-Also includes controls for industry (1-digit SIC), union, the log of firm size, firm age and firm average wage, and capital-labor ratio. Robust standard errors in parentheses. Beta coefficients displayed. N=530. b-Also includes a participation index that measures employee participation in decision-making on various issues. See text for details. ***=significant at the 1% level, **=significant at the 5% level, *=significant at the 10% level.
Model A Model B Delegationb Incentives Delegationb Incentives
Delegation - Control
0.029
(0.077) Internal Uncertainty 0.124*** 0.021** 0.123*** 0.017 (0.016) (0.010) (0.017) (0.015) External Uncertainty 0.057*** 0.020* 0.057*** 0.019 (0.019) (0.012) (0.019) (0.012) Chi2 114.58 14.55 115.73 14.45 (p-value) (0.000) (0.002) (0.000) (0.006) Notes: a-Also includes controls for industry (1-digit SIC), union, the log of firm size, firm age and firm average wage, and capital-labor ratio. Robust standard errors in parentheses. Beta coefficients displayed. N=530. b-Also includes a participation index that measures employee participation in decision-making on various issues. See text for details. ***=significant at the 1% level, **=significant at the 5% level, *=significant at the 10% level.

63
Table C1c: Uncertainty, Team Delegation and Group/Firm Incentivesa
3SLS Estimations
Model A Model B Team
Delegationb Incentives Team
Delegationb Incentives
Group Bonus
Team Delegation 0.532*** (0.137) Internal Uncertainty 0.036*** 0.016* 0.036*** -0.009 (0.008) (0.009) (0.008) (0.012) External Uncertainty 0.002 -0.000 0.002 -0.000 (0.009) (0.011) (0.009) (0.011) Chi2 83.68 8.05 85.19 22.11 (p-value) (0.000) (0.044) (0.000) (0.000)
Cash Profit Sharing Team Delegation 0.712*** (0.142) Internal Uncertainty 0.036*** 0.013 0.036*** -0.021*** (0.008) (0.009) (0.008) (0.012) External Uncertainty 0.002 0.001 0.002 0.002 (0.009) (0.011) (0.009) (0.012) Chi2 84.85 4.47 92.11 28.41 (p-value) (0.000) (0.215) (0.000) (0.000)
Deferred Profit Sharing
Individual Delegation 0.133*** (0.048) Internal Uncertainty 0.105*** -0.001 0.105*** -0.020*** (0.018) (0.008) (0.012) (0.011) External Uncertainty -0.020 -0.037** -0.020 -0.029*** (0.021) (0.010) (0.021) (0.014) Chi2 137.40 15.43 134.48 21.66 (p-value) (0.000) (0.001) (0.000) (0.000) Notes: a-Also includes controls for industry (1-digit SIC), union, the log of firm size, firm age and firm average wage, and capital-labor ratio. Robust standard errors in parentheses. Beta coefficients displayed. N=530. b-Also includes a participation index that measures employee participation in decision-making on various issues. See text for details. ***=significant at the 1% level, **=significant at the 5% level, *=significant at the 10% level.

64
Table C2a: Uncertainty, Individual Incentives, Monitoring and Internal Labor Marketa 3SLS Estimations
Individual Delegation
Monitoring ILM – Employment
Security
Individual Incentives
Internal Uncertainty 0.112*** -0.103*** -0.017 -0.030 (0.028) (0.029) (0.019) (0.022) External Uncertainty 0.001 0.030 0.018 0.040 (0.029) (0.025) (0.014) (0.019) Delegation - Involvement - -0.028 0.245*** 0.442*** (0.121) (0.098) (0.086) Monitoring - - 0.127 0.054 (0.093) (0.132) Employment Security - - - -1.203*** (0.261) Chi2 52.53 25.91 15.21 38.43 (p-value) (0.000) (0.000) (0.000) (0.000) Individual
Delegation Monitoring ILM – Promotions Individual
Incentives Internal Uncertainty 0.115*** -0.104*** -0.014 -0.004 (0.028) (0.029) (0.019) (0.019) External Uncertainty 0.001 0.031 0.000 0.027 (0.029) (0.025) (0.014) (0.017) Delegation - Involvement - -0.027 0.339*** 0.119 (0.121) (0.106) (0.081) Monitoring - - 0.063 0.064 (0.088) (0.125) Promotions - - - 0.483** (0.235) Chi2 47.45 24.93 28.52 20.41 (p-value) (0.000) (0.000) (0.000) (0.000) Individual
Delegation Monitoring ILM – On the Job
Training Individual Incentives
Internal Uncertainty 0.110*** -0.104*** 0.018 0.009 (0.028) (0.029) (0.022) (0.020) External Uncertainty 0.001 0.030 0.012 0.010 (0.029) (0.025) (0.012) (0.019) Delegation - Involvement - -0.023 0.131 -0.080 (0.121) (0.091) (0.099) Monitoring - - 0.112 0.031 (0.082) (0.125) OJT - - - 1.115*** (0.312) Chi2 55.17 24.83 35.52 23.83 (p-value) (0.000) (0.026) (0.000) (0.000)

65
Table C2b: Uncertainty, Individual Incentives, Monitoring and Internal Labor Marketa 3SLS Estimations
Individual Delegation
Monitoring ILM – Employment
Security
Individual Incentives
Internal Uncertainty 0.137*** -0.164*** -0.074*** 0.042 (0.024) (0.040) (0.026) (0.035) External Uncertainty 0.078*** -0.000 -0.011 0.051 (0.026) (0.039) (0.016) (0.045) Delegation - Control - 0.367** 0.471*** 0.609*** (0.157) (0.149) (0.125) Monitoring - - -0.045 -0.159 (0.098) (0.140) Employment Security - - - -1.161*** (0.284) Chi2 63.56 30.42 23.66 32.84 (p-value) (0.000) (0.026) (0.000) (0.000) Individual
Delegation Monitoring ILM – Promotions Individual
Incentives Internal Uncertainty 0.134*** -0.160*** 0.009 -0.004 (0.024) (0.034) (0.023) (0.024) External Uncertainty 0.078*** -0.002 -0.008 0.025 (0.026) (0.029) (0.013) (0.019) Delegation - Control - 0.343** 0.086 0.064 (0.158) (0.109) (0.095) Monitoring - - 0.018 0.062 (0.090) (0.135) Promotions - - - 0.705*** (0.204) Chi2 68.96 29.56 13.61 20.83 (p-value) (0.000) (0.000) (0.000) (0.000) Individual
Delegation Monitoring ILM – On the Job
Training Individual Incentives
Internal Uncertainty 0.134*** -0.161 0.018 0.027 (0.025) (0.035) (0.022) (0.026) External Uncertainty 0.078*** 0.003 0.012 0.021 (0.026) (0.029) (0.012) (0.019) Delegation - Control - 0.348** 0.024 -0.157 (0.158) (0.100) (0.113) Monitoring - - 0.103 0.088 (0.085) (0.138) OJT - - - 1.193*** (0.261) Chi2 67.98 29.19 28.60 26.77

66
(p-value) (0.000) (0.026) (0.000) (0.000)

67
Table C2c: Uncertainty, Group Bonus, Monitoring and Internal Labor Marketa
3SLS Estimations
Individual Delegation
Monitoring ILM – Employment
Security
Group Bonus
Internal Uncertainty 0.035*** -0.155*** 0.021 0.042 (0.010) (0.031) (0.026) (0.035)

68
External Uncertainty 0.019* 0.007 0.018 0.051 (0.011) (0.028) (0.014) (0.045) Team Delegation - 1.121*** -0.268*** 0.617*** (0.433) (0.232) (0.253) Monitoring - - 0.123 -0.161 (0.097) (0.131) Employment Security - - - 0.890*** (0.210) Chi2 35.49 28.22 9.12 37.53 (p-value) (0.000) (0.000) (0.104) (0.000) Individual
Delegation Monitoring ILM – Promotions Group Bonus
Internal Uncertainty 0.034*** -0.153*** 0.008 0.006 (0.011) (0.031) (0.018) (0.021) External Uncertainty 0.019* 0.008 -0.006 0.013 (0.011) (0.028) (0.012) (0.017) Team Delegation - 1.065*** 0.282 0.225 (0.433) (0.212) (0.248) Monitoring - - -0.011 0.054 (0.089) (0.132) Promotions - - - 0.682*** (0.194) Chi2 39.00 27.47 11.56 30.15 (p-value) (0.000) (0.000) (0.041) (0.000) Individual
Delegation Monitoring ILM – On the Job
Training Group Bonus
Internal Uncertainty 0.034*** -0.152*** -0.010 0.000 (0.011) (0.031) (0.022) (0.021) External Uncertainty 0.019* 0.009 0.006 -0.000 (0.011) (0.028) (0.016) (0.016) Team Delegation - 1.057** 0.812*** 0.123 (0.432) (0.269) (0.288) Monitoring - - -0.236** 0.018 (0.109) (0.128) Team Training - - - 0.499*** (0.204) Chi2 38.64 27.21 35.57 26.19 (p-value) (0.000) (0.026) (0.000) (0.000)

69
Table C2d: Uncertainty, Cash Profit Sharing, Monitoring and Internal Labor Marketa
3SLS Estimations
Team Delegation
Monitoring ILM – Employment
Security
Cash Profit Sharing
Internal Uncertainty 0.034*** -0.154*** 0.021 -0.015 (0.010) (0.031) (0.020) (0.023) External Uncertainty 0.019* 0.007 0.018 -0.009 (0.011) (0.028) (0.014) (0.019) Team Delegation - 1.110** -0.260 0.959 (0.432) (0.234) (0.258) Monitoring - - 0.121 0.173 (0.097) (0.122) Employment Security - - - 0.155 (0.208) Chi2 38.69 28.76 8.61 26.92 (p-value) (0.000) (0.026) (0.000) (0.000) Team
Delegation Monitoring ILM – Promotions Cash Profit
Sharing Internal Uncertainty 0.034*** -0.152*** 0.008 -0.016 (0.010) (0.031) (0.018) (0.023) External Uncertainty 0.019* 0.009 -0.005 -0.013 (0.011) (0.028) (0.012) (0.019) Team Delegation - 1.054*** 0.307 1.086*** (0.431) (0.213) (0.269) Monitoring - - -0.011 0.115 (0.089) (0.127) Promotions - - - -0.287 (0.190) Chi2 43.28 27.64 10.41 30.38 (p-value) (0.000) (0.000) (0.000) (0.000) Team
Delegation Monitoring ILM – On the Job
Training Cash Profit
Sharing Internal Uncertainty 0.034*** -0.153*** -0.010 -0.014 (0.010) (0.031) (0.023) (0.023) External Uncertainty 0.019* 0.008 0.006 -0.006 (0.011) (0.028) (0.016) (0.019) Team Delegation - 1.073** 0.844*** 1.105*** (0.430) (0.270) (0.314) Monitoring - - -0.234** 0.151 (0.109) (0.125) Team Training - - - -0.170 (0.200) Chi2 41.45 27.97 34.23 27.84 (p-value) (0.000) (0.026) (0.000) (0.000)

70
Table C2e: Uncertainty, Cash Profit Sharing, Monitoring and Internal Labor Marketa
3SLS Estimations
Individual Delegation
Monitoring ILM – Employment
Security
Deferred Profit
Sharing Internal Uncertainty 0.109*** -0.104*** -0.012 -0.035* (0.028) (0.029) (0.019) (0.019) External Uncertainty 0.001 0.030 0.016 -0.035** (0.029) (0.025) (0.014) (0.016) Individual Delegation - -0.026** 0.174* 0.265*** (0.121) (0.106) (0.074) Monitoring - - 0.112 0.004 (0.094) (0.113) Employment Security - - - -0.385* (0.241) Chi2 58.54 25.94 14.37 25.33 (p-value) (0.000) (0.026) (0.000) (0.000) Individual
Delegation Monitoring ILM – Promotions Deferred
Profit SharingInternal Uncertainty 0.113*** -0.104*** -0.013 -0.032* (0.028) (0.029) (0.019) (0.018) External Uncertainty 0.001 0.030 0.000 -0.041** (0.029) (0.025) (0.014) (0.016) Individual Delegation - -0.026 0.331*** 0.256*** (0.121) (0.105) (0.077) Monitoring - - 0.060 -0.021 (0.088) (0.116) Promotions - - - -0.205 (0.218) Chi2 51.62 25.06 27.10 26.26 (p-value) (0.000) (0.000) (0.000) (0.000) Individual
Delegation Monitoring ILM – On the Job
Training Deferred
Profit Sharing
Internal Uncertainty 0.109*** -0.104*** 0.006 -0.036* (0.028) (0.029) (0.017) (0.019) External Uncertainty 0.001 0.031 0.015 -0.034** (0.029) (0.025) (0.012) (0.016) Individual Delegation - -0.022 0.128 0.329*** (0.121) (0.091) (0.094) Monitoring - - 0.111 -0.022 (0.082) (0.115) OJT - - - -0.507 (0.291) Chi2 59.57 24.81 34.78 26.37 (p-value) (0.000) (0.026) (0.000) (0.000)


![Multi-Task Learning Using Uncertainty to Weigh Losses for Scene … · 2018. 6. 11. · one task can help learn other tasks [7]. Fine-tuning [1, 36] is a basic example of multi-task](https://img.pdfslide.us/doc/110x75/5fd5b2ff354f85264674981b/multi-task-learning-using-uncertainty-to-weigh-losses-for-scene-2018-6-11-one.jpg)