Embed Size (px)
Citation preview
OPEN
ORIGINAL ARTICLE
Brain responses to biological motion predict treatmentoutcome in young children with autismD Yang1,2, KA Pelphrey1, DG Sukhodolsky2, MJ Crowley2, E Dayan3, NC Dvornek2, A Venkataraman4, J Duncan5,6, L Staib5,6 andP Ventola2
Autism spectrum disorders (ASDs) are common yet complex neurodevelopmental disorders, characterized by social,communication and behavioral deficits. Behavioral interventions have shown favorable results—however, the promise of precisionmedicine in ASD is hampered by a lack of sensitive, objective neurobiological markers (neurobiomarkers) to identify subgroups ofyoung children likely to respond to specific treatments. Such neurobiomarkers are essential because early childhood provides asensitive window of opportunity for intervention, while unsuccessful intervention is costly to children, families and society. In youngchildren with ASD, we show that functional magnetic resonance imaging-based stratification neurobiomarkers accurately predictresponses to an evidence-based behavioral treatment—pivotal response treatment. Neural predictors were identified in thepretreatment levels of activity in response to biological vs scrambled motion in the neural circuits that support social informationprocessing (superior temporal sulcus, fusiform gyrus, amygdala, inferior parietal cortex and superior parietal lobule) and socialmotivation/reward (orbitofrontal cortex, insula, putamen, pallidum and ventral striatum). The predictive value of our findings forindividual children with ASD was supported by a multivariate pattern analysis with cross validation. Predicting who will respond toa particular treatment for ASD, we believe the current findings mark the very first evidence of prediction/stratification biomarkers inyoung children with ASD. The implications of the findings are far reaching and should greatly accelerate progress toward moreprecise and effective treatments for core deficits in ASD.
Translational Psychiatry (2016) 6, e948; doi:10.1038/tp.2016.213; published online 15 November 2016
INTRODUCTIONWithin autism spectrum disorders (ASDs), core social communica-tion symptoms are key targets for the development of pharma-cological and behavioral interventions.1 Recent clinical trials ofbehavioral interventions report favorable results.2–4 Yet, thepromise of targeted, precision medicine5 for core social commu-nication deficits in ASD is hindered by a fundamental problem: thelack of sensitive, objective markers to identify subgroups of youngchildren more or less likely to respond to specific treatments. Byobjectively measuring brain responses, functional neuroimagingtechniques provide a promising solution to this problem. Thesetechniques have revealed key neuroanatomical circuits implicatedin core ASD deficits, including networks of brain regions engagedin social reward/social motivation6 (for example, social orienting,seeking and enjoying social engagements, and maintaining socialcontact), social attention and action observation7,8 (for example,goal-directed eye-gaze following), and social perception9,10
(for example, face recognition, action perception, emotiondecoding). Here, using a well-validated biological motion func-tional magnetic resonance imaging (fMRI) paradigm11 thatrobustly engages the neural circuits supporting social motivationand social information processing, we sought to identify predic-tion/stratification biomarkers that can accurately forecast theresponse to an evidence-based behavioral treatment—pivotalresponse treatment2 (PRT)—in young children with ASD.
We investigated the accuracy of fMRI neurobiomarkers inpredicting treatment response in a sample (N= 20; 7 girls, 13 boys)of young (mean age= 5.90 years, s.d. = 1.07 years), cognitively able(mean IQ= 103.45, s.d. = 17.03) children with ASD. These childrenparticipated in a 16-week trial of PRT, a behavioral treatmentfocused on social communication skill development.2,12 Thetreatment, PRT, is one of a very few evidence-based treatmentsfor children with ASD. It targets pivotal areas, including socialinitiation and social responsivity with the premise that improve-ments in these areas lead to more widespread and generalizedimprovements in multiple domains of development representingcore changes in social motivation.2,12 PRT consisted of 16 weeks oftreatment, 7 h per week including 5 h per week of directintervention with the child and 2 h per week of parent guidance.The primary clinical outcome measure was the total raw scorefrom the Social Responsiveness Scale (SRS),13,14 a parent reportmeasure of social functioning. Treatment effectiveness wasmodeled as the delta change scores (that is, post minus pre) ofthe SRS total raw scores.Social orienting and visual sensitivity to biological motion
are evolutionarily well conserved, reflecting an ontogeneticallyearly-emerging mechanism, fundamental to adaptive socialengagement.10,15–18 We targeted neuroanatomical networksinvolved in social motivation and social information processingvia a well-validated point-light display biological motion
1Autism and Neurodevelopmental Disorders Institute, The George Washington University and Children’s National Health System, Washington, DC, USA; 2Child Study Center, YaleUniversity School of Medicine, New Haven, CT, USA; 3Department of Radiology and Biomedical Research Imaging Center, The University of North Carolina at Chapel Hill, ChapelHill, NC, USA; 4Department of Electrical and Computer Engineering, Johns Hopkins University, Baltimore, MD, USA; 5Department of Radiology and Biomedical Imaging, YaleUniversity School of Medicine, New Haven, CT, USA and 6Department of Biomedical Engineering, Yale University, New Haven, CT, USA. Correspondence: Dr D Yang, Autism andNeurodevelopmental Disorders Institute, The George Washington University and Children's National Health System, 2300 I St NW, Washington, DC 20052, USA, or Dr P Ventola,Child Study Center, Yale University School of Medicine, 230 South Frontage Road, New Haven, CT 06520, USA. E-mail [email protected] or [email protected] 11 April 2016; revised 26 July 2016; accepted 27 September 2016
Citation: Transl Psychiatry (2016) 6, e948; doi:10.1038/tp.2016.213
www.nature.com/tp
paradigm. During a 5 min fMRI scan at 3 Tesla, conducted atbaseline within 1 week before PRT treatment, our studyparticipants viewed neuroimaging stimuli depicting point-lightdisplays of coherent biological (BIO) or scrambled biological(SCRAM) motion, created from motion capture data (that is, videoscreated by placing lights on the major joints of a person andfilming them moving in the dark).11,19
Although relatively impoverished stimuli, point-light displayscontain sufficient information to identify the kind of motion beingproduced (for example, walking, dancing, reaching), as well as theidentity of the agent.20 Unique sensitivity to point-light displays ispresent across species and early in postnatal development. Forinstance, newly hatched chicks recognize biological motion inpoint-light displays,15 and 2-day-old human infants preferentiallyattend to biological motion in point-light displays.16 Importantly,in a group of 2-year-old children with ASD, Klin et al.19
documented a failure to orient preferentially toward point-lightdisplays of canonical biological motion. Elsewhere, disruptedperceptual sensitivity to biological motion has been documentedin older children with ASD.21 Our prior neuroimaging workidentified dysfunction in the biological motion processing systemas reflecting key neural signatures of ASD in affected children andas a neuroendophenotype of genetic risk in unaffected siblings ofchildren with ASD.11 Through our biological motion task, thepresent report leveraged these prior discoveries, targeting theneural systems involved in social motivation and social informa-tion processing.
MATERIALS AND METHODSParticipantsThe study participants included 20 children with a primary diagnosis ofASD (mean age= 5.90 years, s.d. = 1.07; 7 females, 13 males). Cognitiveability was measured using the DAS-II (Differential Ability Scales-SecondEdition).22 All the participants were cognitively able (IQ⩾ 70; range= 70–128). All the participants met DSM-51 diagnostic criteria for ASD asdetermined by expert clinical judgment. This judgment was supported bythe results of gold-standard diagnostic instruments—the ADI-R (AutismDiagnostic Interview-Revised)23 and ADOS (Autism Diagnostic ObservationSchedule)24—administered by research-reliable and licensed clinicalpsychologists. All the participants were free of psychotropic medication.No changes in educational placement or major changes in educationalservices were reported by the parents while their children were in thestudy. Pretreatment clinical behavioral measures included (a) the parent-reported SRS13,14 as a continuous, quantitative measure of ASD coresymptom severity, (b) the clinician-administered CELF (Clinical Evaluationof Language Fundamentals)25,26 as a measure of core language ability(receptive and expressive) and (c) the clinician-administered Vineland-II(Vineland Adaptive Behavior Scales-Second Edition)27 as a measure ofadaptive behaviors. Comprehensive demographics and characterizationinformation are provided in Table 1. The study is registered at ClinicalTrials.gov (ID: NCT01908686).Inclusion criteria for all the participants included being in good medical
health and being cooperative with testing; exclusion criteria for all theparticipants included a history of significant head trauma or serious brainor psychiatric illness, as well as current use of prescription medications thatmay affect cognitive processes under study (see the ClinicalTrials.govregistry for complete inclusion and exclusion criteria). Two children(beyond the 20 participants) were screened and did not qualify for thestudy based on the above criteria. One child had significant, uncontrolledseizures, and the other child exhibited very highly disruptive behaviors sowas unable to complete the screening assessments. Two other participants(beyond the 20 participants) were not included in the analysis because ofmissing valid SRS data. All the participants passed MRI safety screening,including being free of any metal implants and evidence of claustrophobia.Written informed consent was obtained from each participant's parent(s),and assent was obtained from each child. The Human InvestigationsCommittee at the Yale University approved this study.
Primary clinical outcomeTreatment effectiveness is modeled as the delta change scores of the SRS-parent total raw scores, that is, post minus pre, such that negative(positive) delta change scores indicate decrease (increase) in the coreautism symptom severity. Treatment effectiveness was normally distrib-uted, Shapiro–Wilk’s W= 0.96, df= 20, P=0.45, and was uncorrelated withpretreatment SRS-parent total raw scores, r(18) =− 0.35, P=0.13. To controlfor the passage of time, 11 of our participants were randomly assigned to awaitlist control group, and received treatment only after their 16-weekwaitlist period. The levels of ASD symptom severity did not significantlydiffer from the waitlist control baseline (−16 weeks; mean= 91.27, s.d. = 30.42) to the pretreatment baseline (0 weeks; mean= 84.27, s.d. = 24.06), Δ=− 7.00, s.d. of Δ=15.79, t(10) =− 1.47, P=0.17 (two-sided),95% confidence interval of Δ= [− 17.61, 3.61], Cohen’s drm
28 = 0.24.
Treatment approachAfter the pretreatment scan was performed and the baseline clinicalmeasures were taken, the participants received 16 weeks of PRT,2,12 whichis a naturalistic, behaviorally based treatment approach. PRT involvesspecific treatment components (child choice, child attending, clearopportunity, contingent reinforcement, natural reinforcement, reinforce-ment of attempts and interspersed maintenance/acquisition tasks)designed to increase the child’s social motivation. In addition, PRT ishighly naturalistic. In the context of the current study, the sessions wereplay-based, relying on materials such as craft supplies, balls, blocks and‘play-doh’. For each child, the treatment included a total of 7 h oftreatment per week. The sessions were held in the clinic as well as in thechild’s home. Five hours per week were direct intervention with the child,and 2 h per week consisted of parent-training sessions. The treatmenttargeted pivotal areas, including social initiation and responsivity, withthe premise that improvements in these capacities should lead tomore widespread and generalized improvements in multiple areas of
Table 1. Participants demographics and pretreatment characteristics
Variable Mean (s.d.)
Pretreatment age (years) 5.90 (1.07)Gender, male (0= f, 1=m) 0.65 (0.49)General conceptual ability (IQ) 103.45 (17.03)Handedness, right (1= right, 0= ambi., − 1= left) 0.70 (0.66)Pretreatment ADOS calibrated severity score 7.65 (2.11)Pretreatment SRS-parent total raw score 80.65 (22.53)Pretreatment CELF core standard score 90.40 (23.88)
Pretreatment Vineland-II communicationReceptive 39.60 (19.09)Expressive 47.45 (13.01)Written 75.45 (13.35)
Pretreatment Vineland-II daily living skillsPersonal 49.50 (13.13)Domestic 54.05 (22.92)Community 61.80 (18.26)
Pretreatment Vineland-II socializationInterpersonal relationships 40.35 (11.99)Play and leisure time 46.25 (16.93)Coping skills 41.30 (17.87)
Pretreatment scan, head motion(mean absolute, mm)
1.32 (1.34)
Pretreatment scan, head motion(mean relative, mm)
0.44 (0.44)
Abbreviations: ADOS, Autism Diagnostic Observation Schedule; ambi.,ambidextrous; CELF, Clinical Evaluation of Language Fundamentals; f,female; IQ, intelligence quotient; m, male; SRS, Social Responsiveness Scale;Vineland-II, Vineland Adaptive Behavior Scales-Second Edition. Vineland-IIscores were age equivalents in months. Treatment outcome was thechange score of SRS-parent total row score, that is, post minus pre.Number of participants: gender= 7 f/13 m; handedness= 16 right/2 ambi./2 left.
Neural prediction of treatment outcome in autismD Yang et al
2
Translational Psychiatry (2016), 1 – 8
development, representing core changes in social motivation. A moredetailed description of PRT can be found in the original instructionmanual12 and in an updated guide.29 Because the parent-trainingcomponent is inherent in our treatment approach, parents were notblinded to the intervention. Overall, the sample reported here representsthe provision of 2240 h of direct therapeutic intervention (1120 individualfamily visits), 20 one and a half hour scanning sessions, and 60 two-hourclinical evaluations, for a total of 1220 direct interactions (totaling 2390 h)with our 20 participating ASD families.All the clinicians involved in the treatment were extensively trained in
PRT. The faculty from the University of California Santa Barbara, theresearch institution where PRT was developed, trained the lead clinician(PV). The lead clinician sent two separate videotaped sessions (of differentchildren) to the trainer to ensure maintenance of treatment fidelity. Bothvideos met the standard fidelity criteria. To ensure that the bachelors-levelclinicians were correctly implementing PRT during their sessions, they metwith the licensed (lead) clinician for 2 h per week. During these meetings,clinicians discussed the children’s progress, current presentation andspecific activities for the treatment sessions that would be motivating andfoster skill development. In addition, the lead clinician observed sessionslive and via videotape at least once weekly for each participant. Formalfidelity of implementation was assessed for two randomly coded treatmentsessions for each subject. Two randomly selected 5 min segmentsper session were used for this fidelity assessment. The standardfidelity assessment published by the developers of the approach wasused, and per convention, fidelity was defined as demonstrating thetreatment components (child choice, child attending, clear opportunity,contingent reinforcement, natural reinforcement, reinforcement ofattempts and interspersal of maintenance/acquisition tasks) in 80% ofopportunities.12,29,30 The scoring was dichotomous; if the therapistdemonstrated the component, a checkmark was used, and if not, a minuswas used. All the therapists maintained the defined treatment fidelityacross the duration of the study.
Imaging taskWe measured the pretreatment blood oxygen level dependent (BOLD)responses using a well-established biological motion fMRI task,11,31 whichwas well tolerated by the young children with ASD in our study. Weselected this paradigm to engage the brain regions involved in socialperception, action observation, social cognition and social motivation. Wereasoned these networks would be those most likely to relate to thetargets of PRT. This same kind of task has been used with success in adultswith and without ASD, as well as infant siblings of children with ASD, andtoddlers with and without ASD. Thus, it represents a robust neuroimagingparadigm to measure the brain responses during social informationprocessing across the lifespan in ASD. Before the treatment, theparticipants were scanned while viewing coherent and scrambledpoint-light displays of biological motion created from motion capturedata. The coherent biological motion displays featured an adult male actorperforming movements relevant to early childhood experiences, such asplaying pat-a-cake,19 and contain 16 points corresponding to major joints.The scrambled motion animations were created by selecting all the 16points from the biological motion displays and randomly plotting theirtrajectories on a black background. Thus, the coherent and scrambleddisplays contained the same local motion information, but only thecoherent displays contained the configuration of a person.20 During theMRI scan, the stimuli were presented using E-Prime 2.0 software(Psychological Software Tools, Pittsburgh, PA, USA). Six coherent biologicalmotion clips (BIO) and six SCRAM motion clips were presented (seeSupplementary Figure 1) once each in an alternating-block design (timeper block, ~ 24 s). The experiment began with a 20 s fixation period andended with a 16 s fixation period. The total duration was 328 s. The movieswere presented without audio. The participants were asked to watch thevideos and reminded to remain still and alert. Compliance with this requestwas facilitated via a mock scan before the actual scan and ensured by post-scan interview. All the children complied with this request. The imagingtask and stimuli are available from the authors upon request.
Imaging acquisition and processingThe scanning was performed on a Siemens MAGNETOM 3 Tesla Tim Trioscanner at the Yale Magnetic Resonance Research Center. For eachparticipant, a structural MRI image series was acquired with a 32-channelhead coil, a T1-weighted MPRAGE sequence, and the following parameters:
160 sagittal slices; repetition time (TR) = 1900 ms; echo time (TE) = 2.96 ms;flip angle = 9°; slice thickness = 1.00 mm; voxel size = 1 × 1× 1 mm3;matrix = 256× 256; and field of view= 256× 256 mm2. Afterwards, BOLDT2*-weighted functional MRI images were acquired using the followingparameters: 164 volumes; TR = 2000 ms; TE = 25 ms; flip angle = 60°; slicethickness = 4.00 mm; voxel size = 3.44 × 3.44 × 4.00 mm3; matrix = 64 × 64;field of view= 220× 200 mm2; number of slices per volume= 34; andinterleaved acquisition.The T1-weighted MPRAGE structural scan was segmented by SPM12 into
gray matter, white matter and cerebrospinal fluid images. This method ishighly accurate and has reduced bias relative to manual measurement.32
The fMRI data were processed using FSL33 v5.0.8 and the participant-level preprocessing steps followed a standardized processing stream—ICA-AROMA (ICA-based strategy for Automatic Removal of Motion Artifacts).34
This consisted of the following sequence: (a) motion correction usingMCFLIRT; (b) interleaved slice timing correction; (c) BET brain extraction; (d)grand mean intensity normalization for the whole four-dimensional dataset; (e) spatial smoothing with 5 mm full width at half maximum; (f) datade-noising with ICA-AROMA,34 which uses a robust set of theoreticallymotivated temporal and spatial features to remove motion-relatedspurious noise; (g) nuisance regression using time series for white matterand cerebrospinal fluid signal to remove residual, physiological noise; andfinally (h) high-pass temporal filtering (100 s). The first 4 s were discardedto establish T1 equilibrium. Registration of the fMRI data was performedusing both the subject’s structural scan and then the MontrealNeurological Institute (MNI152) standard brain. Preprocessed data werethen pre-whitened using FSL’s FILM to remove time series autocorrelation.To model the BIO and SCRAM conditions, the timing of the
corresponding blocks was convolved with the default gamma function(phase= 0 s, s.d. = 3 s, mean lag = 6 s) with temporal derivatives. Theparticipant-level contrast of interest is BIO4SCRAM, which served as inputsfor the subsequent mass univariate, whole-brain, group-level general linearmodel (GLM) analyses and multivariate pattern analyses. Sex was controlledfor as a covariate of no interest across all group-level analyses. The mainfindings remained largely the same when sex was not controlled for in theanalyses. The data sets during and/or analyzed during the current study areavailable from the corresponding author on reasonable request.
Mass univariate group-level GLM analysesWe conducted mass univariate voxel-wise GLM analyses across the wholebrain to identify clusters where pretreatment BOLD activation in thecontrast of BIO4SCRAM predicted treatment effectiveness. The analyseswere conducted using mixed-effects modeling with FSL’s FLAME (FMRIB'sLocal Analysis of Mixed Effects) 1+2 inference algorithm, with a voxel-levelthreshold of Z42.33, Po0.01 and corrected for multiple comparisons at acluster-level threshold of Po0.05. Information about the surviving clusterswas reported, including number of voxels in the cluster, the anatomicalregions covered by the clusters based on the Automated AnatomicalLabeling v2 (AAL2) atlas,35 the coordinates of the peak voxels within eachof the anatomical regions and the Z-statistics associated with the peakvoxels.
Meta-analytical reverse inferenceTo understand the functional relevance of the surviving clusters, weperformed a quantitative reverse inference using NeuroSynth (http://www.neurosynth.org/). The NeuroSynth data set v0.6 contains activation data forover 11 406 studies and feature information for over 3300 term-basedfeatures. The term-based features were derived from the abstracts ofarticles in the NeuroSynth database. For each feature, the database storesthe whole-brain, reverse inference, meta-analysis map, P(Term | Activation),that is, the likelihood that a feature term is used in a study given thepresence of reported activation.36 Each surviving cluster was decoded withNeuroSynth, which computed the voxel-wise Pearson correlation betweenthe cluster image file and the meta-analytical image file associated witheach of the 3300 feature terms. The top 10 psychological functional terms(for example, multisensory, reward) with the highest positive correlationwere retained and reported, while we omitted non-functional terms, suchas (but not limited to) those describing an anatomical region (for example,inferior temporal), a technique/method/task (for example, multivariatepattern), a population (for example, older adults), a disorder/disability/impairment (for example, cognitive impairment) or being relatively generic(for example, scale, weight, periods, emerged and so on).
Neural prediction of treatment outcome in autismD Yang et al
3
Translational Psychiatry (2016), 1 – 8
Multivariate pattern analysesTo guard against data over-fitting and to gain understanding of howdifferent voxels in the network of the clusters derived from the massunivariate GLM analyses worked together in predicting treatmenteffectiveness, we utilized regression-based multivariate pattern analyses(MVPAs).37 In MVPA, the samples were divided into training and testingdata sets, which constitute a cross validation framework in which thepredictive model is first trained with the training set and then used topredict the regression labels of the sample in the testing set. This type ofcross validation provides approximately unbiased estimates of effects,generalizable to new samples, helping to minimize the likelihood that theresults over-fit the data. Moreover, in contrast to the mass univariate voxel-wise GLM analyses, MVPA draws on the multivariate information acrossmany voxels comprising neural networks, which may capture how thevoxels or regions work together to achieve complex functions. All thesecharacteristics render MVPA well suited for establishing robust predictivebiomarkers. MVPA has been applied to fMRI data to successfully predicttreatment response or long-term outcome in a number of neuropsychiatricor neurocognitive disorders, such as depression,38 dyslexia,39 social anxietydisorder40,41 and panic disorder.42
MVPAs were performed using the Pattern Recognition for NeuroimagingToolbox43 (PRoNTo) v2.0 in Matlab and followed several steps. First, eachparticipant’s pretreatment Z-statistic BIO4SCRAM contrast image (up-sampled to the standard MNI152 space using trilinear interpolation) wasinputted into the MVPA analyses. The surviving cluster(s) derived from theunivariate analysis as a network was used as an analytical mask. Becauseour objective was to predict treatment effectiveness as a continuousvariable, the delta change of ASD symptom severity was entered as theregression target. Second, PRoNTo computed a linear kernel (that is, dotproduct) between the voxel intensities within the mask for each pair of theinput images, thereby generating a 20× 20 similarity matrix, which servedas the input feature set for the subsequent machine learning algorithm.Third, we used kernel ridge regression44 as the multivariate regressionmethod. This is the dual-form formulation of ridge regression and solvesregression problems with high dimensional data in a computationallyefficient way. Cross validation was based on a leave-one-subject-out(LOSO) framework with mean-centered features across training images. Weselected LOSO (which is equal to 20-fold cross validation with our sample)because a larger number of folds may reduce bias of the estimates, even atthe cost of increasing variance of the estimates, and should provide moreaccurate estimates of neural predictability, especially when sample sizesare small. For each fold, one input image was left out and served as thetesting set. The kernel ridge regression machines were trained to associatetreatment effectiveness with the multivariate information in the remainingsample of 19 participants. The trained kernel ridge regression machineswere then used to predict treatment effectiveness in the left-out image.This step was repeated for each of the 20 folds. Across all folds, predictiveaccuracy was calculated as the Pearson’s correlation coefficient (r),coefficient of determination (R2), and normalized mean squared error(nMSE) between predicted and actual treatment effectiveness. Fourth, thesignificance of the prediction accuracy statistics was evaluated using apermutation test, consisting of 50 000 iterations. In each iteration, theregression targets were randomly permuted across all the participantsand the cross-validation procedure was repeated. The P-values of r, R2
and nMSE were then calculated as the proportion of all permutationswhere r, R2 and nMSE were greater than (or less than, in the case of nMSE)or equal to the obtained r, R2 and nMSE, respectively.
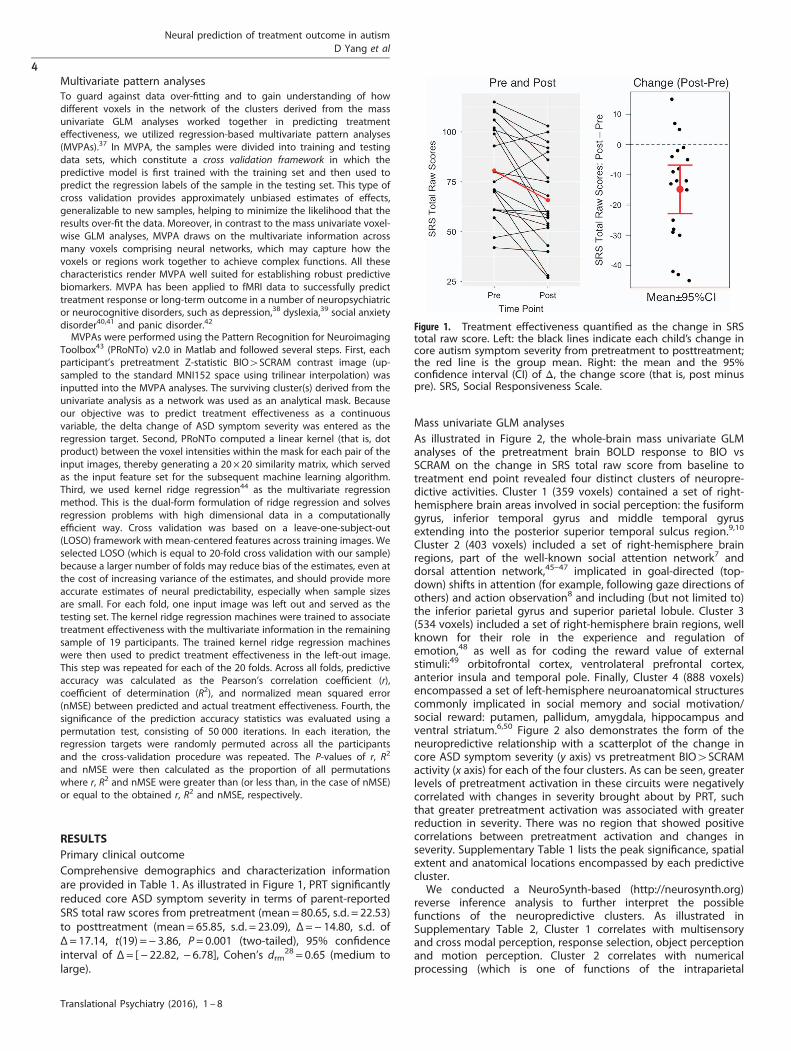
RESULTSPrimary clinical outcomeComprehensive demographics and characterization informationare provided in Table 1. As illustrated in Figure 1, PRT significantlyreduced core ASD symptom severity in terms of parent-reportedSRS total raw scores from pretreatment (mean= 80.65, s.d. = 22.53)to posttreatment (mean= 65.85, s.d. = 23.09), Δ=− 14.80, s.d. ofΔ= 17.14, t(19) =− 3.86, P= 0.001 (two-tailed), 95% confidenceinterval of Δ= [− 22.82, − 6.78], Cohen’s drm
28 = 0.65 (medium tolarge).
Mass univariate GLM analysesAs illustrated in Figure 2, the whole-brain mass univariate GLManalyses of the pretreatment brain BOLD response to BIO vsSCRAM on the change in SRS total raw score from baseline totreatment end point revealed four distinct clusters of neuropre-dictive activities. Cluster 1 (359 voxels) contained a set of right-hemisphere brain areas involved in social perception: the fusiformgyrus, inferior temporal gyrus and middle temporal gyrusextending into the posterior superior temporal sulcus region.9,10
Cluster 2 (403 voxels) included a set of right-hemisphere brainregions, part of the well-known social attention network7 anddorsal attention network,45–47 implicated in goal-directed (top-down) shifts in attention (for example, following gaze directions ofothers) and action observation8 and including (but not limited to)the inferior parietal gyrus and superior parietal lobule. Cluster 3(534 voxels) included a set of right-hemisphere brain regions, wellknown for their role in the experience and regulation ofemotion,48 as well as for coding the reward value of externalstimuli:49 orbitofrontal cortex, ventrolateral prefrontal cortex,anterior insula and temporal pole. Finally, Cluster 4 (888 voxels)encompassed a set of left-hemisphere neuroanatomical structurescommonly implicated in social memory and social motivation/social reward: putamen, pallidum, amygdala, hippocampus andventral striatum.6,50 Figure 2 also demonstrates the form of theneuropredictive relationship with a scatterplot of the change incore ASD symptom severity (y axis) vs pretreatment BIO4SCRAMactivity (x axis) for each of the four clusters. As can be seen, greaterlevels of pretreatment activation in these circuits were negativelycorrelated with changes in severity brought about by PRT, suchthat greater pretreatment activation was associated with greaterreduction in severity. There was no region that showed positivecorrelations between pretreatment activation and changes inseverity. Supplementary Table 1 lists the peak significance, spatialextent and anatomical locations encompassed by each predictivecluster.We conducted a NeuroSynth-based (http://neurosynth.org)
reverse inference analysis to further interpret the possiblefunctions of the neuropredictive clusters. As illustrated inSupplementary Table 2, Cluster 1 correlates with multisensoryand cross modal perception, response selection, object perceptionand motion perception. Cluster 2 correlates with numericalprocessing (which is one of functions of the intraparietal
Figure 1. Treatment effectiveness quantified as the change in SRStotal raw score. Left: the black lines indicate each child’s change incore autism symptom severity from pretreatment to posttreatment;the red line is the group mean. Right: the mean and the 95%confidence interval (CI) of Δ, the change score (that is, post minuspre). SRS, Social Responsiveness Scale.
Neural prediction of treatment outcome in autismD Yang et al
4
Translational Psychiatry (2016), 1 – 8
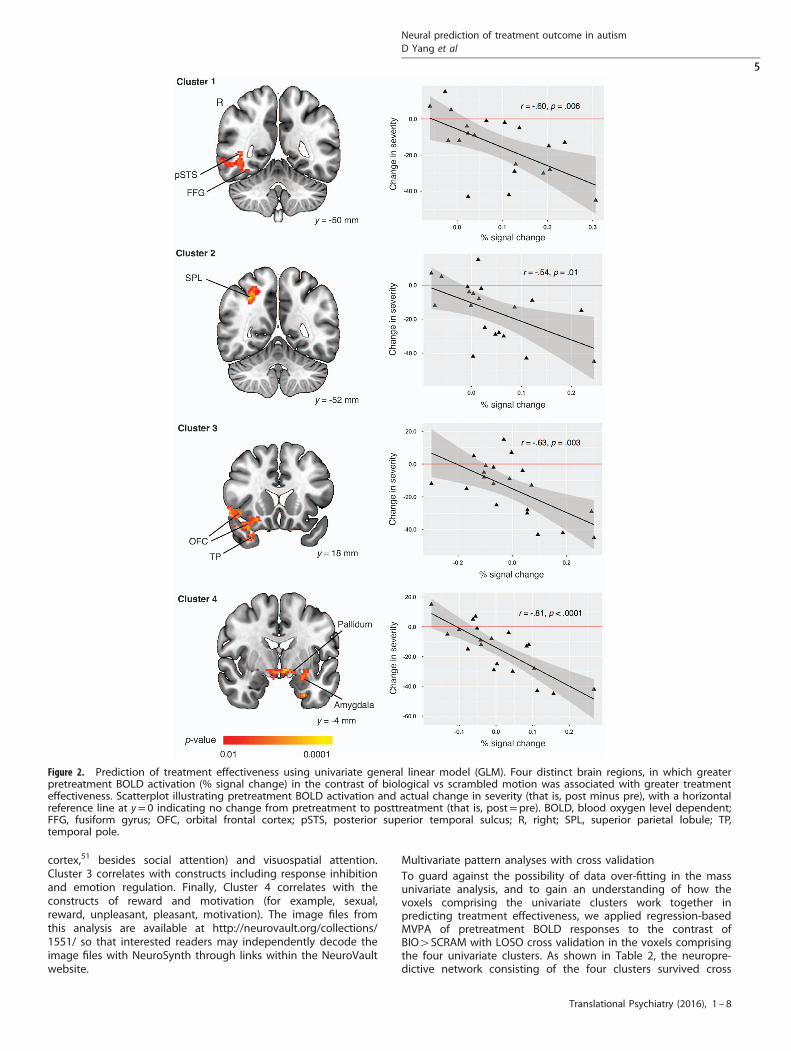
cortex,51 besides social attention) and visuospatial attention.Cluster 3 correlates with constructs including response inhibitionand emotion regulation. Finally, Cluster 4 correlates with theconstructs of reward and motivation (for example, sexual,reward, unpleasant, pleasant, motivation). The image files fromthis analysis are available at http://neurovault.org/collections/1551/ so that interested readers may independently decode theimage files with NeuroSynth through links within the NeuroVaultwebsite.
Multivariate pattern analyses with cross validationTo guard against the possibility of data over-fitting in the massunivariate analysis, and to gain an understanding of how thevoxels comprising the univariate clusters work together inpredicting treatment effectiveness, we applied regression-basedMVPA of pretreatment BOLD responses to the contrast ofBIO4SCRAM with LOSO cross validation in the voxels comprisingthe four univariate clusters. As shown in Table 2, the neuropre-dictive network consisting of the four clusters survived cross
Figure 2. Prediction of treatment effectiveness using univariate general linear model (GLM). Four distinct brain regions, in which greaterpretreatment BOLD activation (% signal change) in the contrast of biological vs scrambled motion was associated with greater treatmenteffectiveness. Scatterplot illustrating pretreatment BOLD activation and actual change in severity (that is, post minus pre), with a horizontalreference line at y= 0 indicating no change from pretreatment to posttreatment (that is, post=pre). BOLD, blood oxygen level dependent;FFG, fusiform gyrus; OFC, orbital frontal cortex; pSTS, posterior superior temporal sulcus; R, right; SPL, superior parietal lobule; TP,temporal pole.
Neural prediction of treatment outcome in autismD Yang et al
5
Translational Psychiatry (2016), 1 – 8
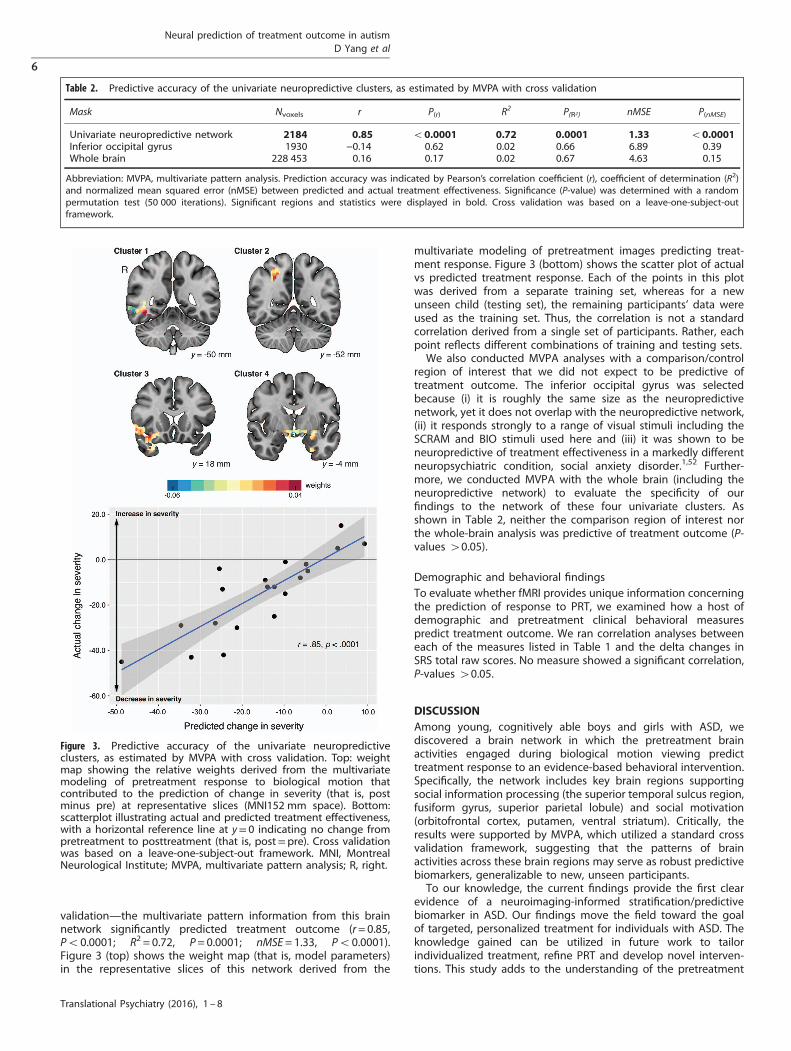
validation—the multivariate pattern information from this brainnetwork significantly predicted treatment outcome (r= 0.85,Po0.0001; R2 = 0.72, P= 0.0001; nMSE= 1.33, Po0.0001).Figure 3 (top) shows the weight map (that is, model parameters)in the representative slices of this network derived from the
multivariate modeling of pretreatment images predicting treat-ment response. Figure 3 (bottom) shows the scatter plot of actualvs predicted treatment response. Each of the points in this plotwas derived from a separate training set, whereas for a newunseen child (testing set), the remaining participants’ data wereused as the training set. Thus, the correlation is not a standardcorrelation derived from a single set of participants. Rather, eachpoint reflects different combinations of training and testing sets.We also conducted MVPA analyses with a comparison/control
region of interest that we did not expect to be predictive oftreatment outcome. The inferior occipital gyrus was selectedbecause (i) it is roughly the same size as the neuropredictivenetwork, yet it does not overlap with the neuropredictive network,(ii) it responds strongly to a range of visual stimuli including theSCRAM and BIO stimuli used here and (iii) it was shown to beneuropredictive of treatment effectiveness in a markedly differentneuropsychiatric condition, social anxiety disorder.1,52 Further-more, we conducted MVPA with the whole brain (including theneuropredictive network) to evaluate the specificity of ourfindings to the network of these four univariate clusters. Asshown in Table 2, neither the comparison region of interest northe whole-brain analysis was predictive of treatment outcome (P-values 40.05).
Demographic and behavioral findingsTo evaluate whether fMRI provides unique information concerningthe prediction of response to PRT, we examined how a host ofdemographic and pretreatment clinical behavioral measurespredict treatment outcome. We ran correlation analyses betweeneach of the measures listed in Table 1 and the delta changes inSRS total raw scores. No measure showed a significant correlation,P-values 40.05.
DISCUSSIONAmong young, cognitively able boys and girls with ASD, wediscovered a brain network in which the pretreatment brainactivities engaged during biological motion viewing predicttreatment response to an evidence-based behavioral intervention.Specifically, the network includes key brain regions supportingsocial information processing (the superior temporal sulcus region,fusiform gyrus, superior parietal lobule) and social motivation(orbitofrontal cortex, putamen, ventral striatum). Critically, theresults were supported by MVPA, which utilized a standard crossvalidation framework, suggesting that the patterns of brainactivities across these brain regions may serve as robust predictivebiomarkers, generalizable to new, unseen participants.To our knowledge, the current findings provide the first clear
evidence of a neuroimaging-informed stratification/predictivebiomarker in ASD. Our findings move the field toward the goalof targeted, personalized treatment for individuals with ASD. Theknowledge gained can be utilized in future work to tailorindividualized treatment, refine PRT and develop novel interven-tions. This study adds to the understanding of the pretreatment
Table 2. Predictive accuracy of the univariate neuropredictive clusters, as estimated by MVPA with cross validation
Mask Nvoxels r P(r) R2 P(R2) nMSE P(nMSE)
Univariate neuropredictive network 2184 0.85 o0.0001 0.72 0.0001 1.33 o0.0001Inferior occipital gyrus 1930 −0.14 0.62 0.02 0.66 6.89 0.39Whole brain 228 453 0.16 0.17 0.02 0.67 4.63 0.15
Abbreviation: MVPA, multivariate pattern analysis. Prediction accuracy was indicated by Pearson’s correlation coefficient (r), coefficient of determination (R2)and normalized mean squared error (nMSE) between predicted and actual treatment effectiveness. Significance (P-value) was determined with a randompermutation test (50 000 iterations). Significant regions and statistics were displayed in bold. Cross validation was based on a leave-one-subject-outframework.
Figure 3. Predictive accuracy of the univariate neuropredictiveclusters, as estimated by MVPA with cross validation. Top: weightmap showing the relative weights derived from the multivariatemodeling of pretreatment response to biological motion thatcontributed to the prediction of change in severity (that is, postminus pre) at representative slices (MNI152 mm space). Bottom:scatterplot illustrating actual and predicted treatment effectiveness,with a horizontal reference line at y= 0 indicating no change frompretreatment to posttreatment (that is, post=pre). Cross validationwas based on a leave-one-subject-out framework. MNI, MontrealNeurological Institute; MVPA, multivariate pattern analysis; R, right.
Neural prediction of treatment outcome in autismD Yang et al
6
Translational Psychiatry (2016), 1 – 8
neural underpinnings of successful behavioral response to PRT. Inthe future, our results may drive the construction of algorithms topredict which, among several treatments, is most likely to benefita given person. In addition, PRT is a multi-component treatment;hence future studies might use dismantling designs to isolatetreatment components and their association with the neuropre-dictive targets identified here. This line of work could inform thedevelopment of treatment strategies that would target specificpatterns of neural strengths and vulnerabilities within a givenpatient—consistent with the priority of creating individuallytailored interventions, customized to the characteristics of a givenperson.The predictive biomarkers identified in this paper can be
interpreted as the pretreatment neurobiological readiness torespond to a specific treatment, PRT. It should be noted that thebrain regions where activity before treatment correlated with SRSscores before treatment (see Supplementary Table 3) did notoverlap with the neuropredictive network described here, whichindicates that the neuropredictive network is specific to change inseverity in young children with ASD. As such, our findings offer thehope that pre- or concurrent-treatments (whether pharmacologi-cal, direct stimulation, neurofeedback, or behaviorally based) thatimprove the functioning of the neuropredictive markers identifiedhere, may increase the effectiveness of evidenced-based beha-vioral treatments for core deficits in children with ASD. On theother hand, our findings are also particularly important for thosechildren who would otherwise be the least likely to benefit fromthese expensive and time-consuming forms of treatment. Forexample, in a randomized, double-blind, cross-over functionalfMRI study,53 we reported that intranasal oxytocin administered tochildren with ASD increases activity during social vs nonsocialjudgments in several of the same brain regions identified aspredictive in the present study (for example, amygdala, orbito-frontal cortex, superior temporal sulcus region and ventralstriatum). These findings, coupled with those in the currentreport, raise the provocative hypothesis that the administration ofintranasal oxytocin, by priming key neural circuits for socialmotivation and social perception, may serve to enhance theeffectiveness of interventions like PRT in the very children whomight be less biologically ready to respond.
LimitationsThere are several limitations that should be considered regardingthis research. First, while our research is the first to identityneuropredictive biomarkers in the field of ASD and we did nothave sufficient information regarding established effect sizes thatwould allow us to pre-determine the required sample size, theoverall sample size (n= 20) is relatively small, although a poweranalysis utilizing G*Power54 indicated that it is sufficientlypowered (β= 0.80) to detect a large size of effect55 (|r|⩾ 0.50,one-sided; in this research, r refers to the correlation betweenpretreatment brain activation level and treatment effectiveness).Future research should use a larger sample to detect small-to-medium sizes of effect. Second, the primary clinical outcome is thedelta change score of the parent-reported SRS total raw score, andgiven that the parent training is inherent in the treatmentapproach, the parents were not (and could not be) blinded to theintervention. As such, there is a need for future research to includemeasures that are more objective and/or filled out by blindedclinician(s), which would provide a more comprehensive picture oftreatment outcome, although the parent-reported SRS total rawscore is one of a very few measures that could provide continuousquantification of symptom severity in ASD in naturalistic settings.Third, our neuropredictive findings were limited to one singletreatment-only group in a pretest–posttest design, and futurework should conduct randomized controlled trials to furtherestablish these findings. Finally, although MVPA with LOSO cross
validation provides supporting evidence that our univariatebiomarkers may generalize to new, unseen samples, the resultsare nonetheless limited to the current data and thus thegeneralizability should be further tested in an independentsample beyond the current data.
CONCLUSIONSEarly childhood provides an important window of opportunity forintervention in ASD. The promise of targeted, individualized,precision treatment for core deficits in ASD depends on sensitive,objective biomarkers that can predict how individual youngchildren with ASD will respond to specific treatment(s). For thefirst time in the field of ASD, we provide evidence that neuralsignatures in brain circuits implicated in social informationprocessing and social motivation/reward can predict treatmenteffectiveness at the individual level in young boys and girls withASD. The results open a new avenue for important future researchand should greatly accelerate progress toward more precise andeffective treatments for core deficits in ASD.
CONFLICT OF INTERESTThe authors declare no conflict of interest.
ACKNOWLEDGMENTSWe thank the children and their families included in this study for their time andparticipation and the research assistants in our lab, making this research possible.This work was supported by Simons Foundation to PV; Allied World to PV; the AutismScience Foundation to PV; Women’s Health Research at Yale to PV; the Deitz Family;Esme Usdan and family; the Harris Professorship to KAP; an Autism Speaks MeixnerPostdoctoral Fellowship in Translational Research (#9284) to DY; a T32 grant to KAPand MJC from the NIMH (MH018268); a K01 award from NIDA (DA034125) to MJC; anR01 to JD, LS and KAP (NS035193); a R01 to KAP (MH100028); and the Yale UniversityBiomedical High Performance Computing Center (NIH grants RR19895 andRR029676-01). We also thank Jessica Schrouff, Carlton Chu and John Ashburner fortheir help with multivariate pattern analyses.
REFERENCES1 APA. Diagnostic and Statistical Manual of Mental Disorders: DSM-5, 5th edn.
American Psychiatric Publishing: Washington, DC, USA, 2013, xliv, 947p.2 Ventola P, Friedman HE, Anderson LC, Wolf JM, Oosting D, Foss-Feig J et al.
Improvements in social and adaptive functioning following short-duration PRTprogram: a clinical replication. J Autism Dev Disord 2014; 44: 2862–2870.
3 Rogers SJ, Estes A, Lord C, Vismara L, Winter J, Fitzpatrick A et al. Effects of a briefEarly Start Denver model (ESDM)-based parent intervention on toddlers at risk forautism spectrum disorders: a randomized controlled trial. J Am Acad Child AdolescPsychiatry 2012; 51: 1052–1065.
4 Kasari C, Rotheram-Fuller E, Locke J, Gulsrud A. Making the connection: rando-mized controlled trial of social skills at school for children with autism spectrumdisorders. J Child Psychol Psychiatry 2012; 53: 431–439.
5 Insel TR. The NIMH Research Domain Criteria (RDoC) Project: precision medicinefor psychiatry. Am J Psychiatry 2014; 171: 395–397.
6 Chevallier C, Kohls G, Troiani V, Brodkin ES, Schultz RT. The social motivationtheory of autism. Trends Cogn Sci 2012; 16: 231–239.
7 Nummenmaa L, Calder AJ. Neural mechanisms of social attention. Trends Cogn Sci2009; 13: 135–143.
8 Molenberghs P, Cunnington R, Mattingley JB. Brain regions with mirror properties:a meta-analysis of 125 human fMRI studies. Neurosci Biobehav Rev 2012; 36:341–349.
9 Allison T, Puce A, McCarthy G. Social perception from visual cues: role of theSTS region. Trends Cogn Sci 2000; 4: 267–278.
10 Yang DY, Rosenblau G, Keifer C, Pelphrey KA. An integrative neural model of socialperception, action observation, and theory of mind. Neurosci Biobehav Rev 2015;51: 263–275.
11 Kaiser MD, Hudac CM, Shultz S, Lee SM, Cheung C, Berken AM et al. Neuralsignatures of autism. Proc Natl Acad Sci USA 2010; 107: 21223–21228.
12 Koegel RL, Schreibman L, Good A, Cerniglia L, Murphy C, Koegel LK. How to teachpivotal behaviors to children with autism: a training manual. Graduate School ofEducation, University of California: San Diego, CA, USA, 1989.
Neural prediction of treatment outcome in autismD Yang et al
7
Translational Psychiatry (2016), 1 – 8
13 Constantino JN. The Social Responsiveness Scale. Western Psychological Services:Los Angeles, CA, USA, 2002.
14 Constantino JN. Social Responsiveness Scale, Second Edition. Western Psycholo-gical Services: Torrance, CA, USA, 2012.
15 Vallortigara G, Regolin L, Marconato F. Visually inexperienced chicks exhibitspontaneous preference for biological motion patterns. PLoS Biol 2005; 3: e208.
16 Simion F, Regolin L, Bulf H. A predisposition for biological motion in thenewborn baby. Proc Natl Acad Sci USA 2008; 105: 809–813.
17 Johnson MH. Biological motion: a perceptual life detector? Curr Biol 2006; 16:R376–R377.
18 Heberlein AS, Adolphs R. Impaired spontaneous anthropomorphizing despiteintact perception and social knowledge. Proc Natl Acad Sci USA 2004; 101:7487–7491.
19 Klin A, Lin DJ, Gorrindo P, Ramsay G, Jones W. Two-year-olds with autism orient tonon-social contingencies rather than biological motion. Nature 2009; 459:257–U142.
20 Johansso G. Visual-perception of biological motion and a model for its analysis.Percept Psychophys 1973; 14: 201–211.
21 Kaiser MD, Delmolino L, Tanaka JW, Shiffrar M. Comparison of visual sensitivity tohuman and object motion in autism spectrum disorder. Autism Res 2010; 3: 191–195.
22 Elliott CD. Differential Ability Scale, Second Edition (DAS-II). The PsychologicalCorporation: San Antonio, TX, USA, 2007.
23 Lord C, Rutter M, Le Couteur A. Autism Diagnostic Interview-Revised: a revisedversion of a diagnostic interview for caregivers of individuals with possible per-vasive developmental disorders. J Autism Dev Disord 1994; 24: 659–685.
24 Lord C, Risi S, Lambrecht L, Cook EH Jr, Leventhal BL, DiLavore PC et al. The autismdiagnostic observation schedule-generic: a standard measure of social andcommunication deficits associated with the spectrum of autism. J Autism DevDisord 2000; 30: 205–223.
25 Semel E, Wiig EH, Secord WA. Clinical Evaluation of Language Fundamentals-Preschool-2 (CELF-Preschool-2). Pearson Clinical Assessment: San Antonio, TX, USA,2004.
26 Semel E, Wiig EH, Secord WA. Clinical Evaluation of Language Fundamentals -Fourth Edition (CELF - 4). Pearson Clinical Assessment: San Antonio, TX, USA, 2003.
27 Sparrow SS, Cicchetti DV, Balla DA. Vineland Adaptive Behavior Scales, SecondEdition (Vineland™-II). American Guidance Service: Circle Pines, MN, USA, 2005.
28 Lakens D. Calculating and reporting effect sizes to facilitate cumulative science: apractical primer for t-tests and ANOVAs. Front Psychol 2013; 4: 863.
29 Koegel RL, Koegel LK. The PRT Pocket Guide. Paul H Brookes: Baltimore, MD, USA,2012.
30 Koegel RL, Koegel LK. Pivotal Response Treatments for Autism: Communication:Social, and Academic Development. Brookes Publishing Company: Baltimore, MD,USA, 2006.
31 Ventola P, Yang DY, Friedman HE, Oosting D, Wolf J, Sukhodolsky DG et al.Heterogeneity of neural mechanisms of response to pivotal response treatment.Brain Imaging Behav 2015; 9: 74–88.
32 Malone IB, Leung KK, Clegg S, Barnes J, Whitwell JL, Ashburner J et al. Accurateautomatic estimation of total intracranial volume: a nuisance variable with lessnuisance. Neuroimage 2015; 104: 366–372.
33 Jenkinson M, Beckmann CF, Behrens TE, Woolrich MW, Smith SM, Fsl.. Neuroimage2012; 62: 782–790.
34 Pruim RH, Mennes M, van Rooij D, Llera A, Buitelaar JK, Beckmann CF. ICA-AROMA:A robust ICA-based strategy for removing motion artifacts from fMRI data. Neuro-image 2015; 112: 267–277.
35 Rolls ET, Joliot M, Tzourio-Mazoyer N. Implementation of a new parcellation of theorbitofrontal cortex in the automated anatomical labeling atlas. Neuroimage 2015;122: 1–5.
36 Yarkoni T, Poldrack RA, Nichols TE, Van Essen DC, Wager TD. Large-scale auto-mated synthesis of human functional neuroimaging data. Nat Methods 2011; 8:665–670.
37 Haxby JV, Connolly AC, Guntupalli JS. Decoding neural representational spacesusing multivariate pattern analysis. Annu Rev Neurosci 2014; 37: 435–456.
38 van Waarde JA, Scholte HS, van Oudheusden LJ, Verwey B, Denys D, van WingenGA. A functional MRI marker may predict the outcome of electroconvulsivetherapy in severe and treatment-resistant depression. Mol Psychiatry 2015; 20:609–614.
39 Hoeft F, McCandliss BD, Black JM, Gantman A, Zakerani N, Hulme C et al. Neuralsystems predicting long-term outcome in dyslexia. Proc Natl Acad Sci USA 2011;108: 361–366.
40 Whitfield-Gabrieli S, Ghosh SS, Nieto-Castanon A, Saygin Z, Doehrmann O, Chai XJet al. Brain connectomics predict response to treatment in social anxiety disorder.Mol Psychiatry 2016; 21: 680–685.
41 Mansson KN, Frick A, Boraxbekk CJ, Marquand AF, Williams SC, Carlbring P et al.Predicting long-term outcome of Internet-delivered cognitive behavior therapyfor social anxiety disorder using fMRI and support vector machine learning. TranslPsychiatry 2015; 5: e530.
42 Hahn T, Kircher T, Straube B, Wittchen HU, Konrad C, Strohle A et al. Predictingtreatment response to cognitive behavioral therapy in panic disorder withagoraphobia by integrating local neural information. JAMA Psychiatry 2015; 72:68–74.
43 Schrouff J, Rosa MJ, Rondina JM, Marquand AF, Chu C, Ashburner J et al. PRoNTo:pattern recognition for neuroimaging toolbox. Neuroinformatics 2013; 11:319–337.
44 Chu C, Ni Y, Tan G, Saunders CJ, Ashburner J. Kernel regression for fMRI patternprediction. Neuroimage 2011; 56: 662–673.
45 Fox MD, Corbetta M, Snyder AZ, Vincent JL, Raichle ME. Spontaneous neuronalactivity distinguishes human dorsal and ventral attention systems. Proc Natl AcadSci USA 2006; 103: 10046–10051.
46 Callejas A, Shulman GL, Corbetta M. Dorsal and ventral attention systems underliesocial and symbolic cueing. J Cogn Neurosci 2014; 26: 63–80.
47 Corbetta M, Shulman GL. Control of goal-directed and stimulus-driven attentionin the brain. Nat Rev Neurosci 2002; 3: 201–215.
48 Bechara A, Damasio H, Damasio AR. Emotion, decision making and theorbitofrontal cortex. Cereb Cortex 2000; 10: 295–307.
49 Rolls ET. The orbitofrontal cortex and reward. Cereb Cortex 2000; 10: 284–294.50 Dichter G, Adolphs R. Reward processing in autism: a thematic series. J Neurodev
Disord 2012; 4: 20.51 Eger E, Sterzer P, Russ MO, Giraud AL, Kleinschmidt A. A supramodal number
representation in human intraparietal cortex. Neuron 2003; 37: 719–725.52 Doehrmann O, Ghosh SS, Polli FE, Reynolds GO, Horn F, Keshavan A et al. Pre-
dicting treatment response in social anxiety disorder from functional magneticresonance imaging. JAMA Psychiatry 2013; 70: 87–97.
53 Gordon I, Vander Wyk BC, Bennett RH, Cordeaux C, Lucas MV, Eilbott JA et al.Oxytocin enhances brain function in children with autism. Proc Natl Acad Sci USA2013; 110: 20953–20958.
54 Faul F, Erdfelder E, Buchner A, Lang AG. Statistical power analyses using G*Power3.1: tests for correlation and regression analyses. Behav Res Methods 2009; 41:1149–1160.
55 Cohen J. A power primer. Psychol Bull 1992; 112: 155–159.
This work is licensed under a Creative Commons Attribution 4.0International License. The images or other third party material in this
article are included in the article’s Creative Commons license, unless indicatedotherwise in the credit line; if the material is not included under the Creative Commonslicense, users will need to obtain permission from the license holder to reproduce thematerial. To view a copy of this license, visit http://creativecommons.org/licenses/by/4.0/
© The Author(s) 2016
Supplementary Information accompanies the paper on the Translational Psychiatry website (http://www.nature.com/tp)
Neural prediction of treatment outcome in autismD Yang et al
8
Translational Psychiatry (2016), 1 – 8