Embed Size (px)
Citation preview
Building the investment
community for innovative energy technology projects
Task 5: Policy recommendations for
increasing innovative energy technology investments
Final report
Ref. Ares(2018)2622563 - 22/05/2018
Contract details
European Commission, Directorate-General for Energy
Service Contract regarding a study on “Building the Investment Community for Innovative Energy
Technology Projects” (Ref N°ENER/C2/2016-500)
Presented by
Consortium led by:
Trinomics B.V.
Westersingel 32A
3014 GS, Rotterdam
the Netherlands
Contact main author(s)
Mr. Onne Hoogland
T: +31 (0)6 1036 0790
Date
8 May 2018
Disclaimer
The information and views set out in this study are those of the author(s) and do not necessarily reflect
the official opinion of the Commission. The Commission does not guarantee the accuracy of the data
included in this study. Neither the Commission nor any person acting on the Commission’s behalf may
be held responsible for the use which may be made of the information contained therein.
TEC1149EU
Rotterdam, 8 May 2018
Client: European Commission, DG Energy
Ref N°ENER/C2/2016-500
Service contract regarding a study on “Building the Investment Community for
innovative energy technology projects”
Onne Hoogland (Trinomics)
Koen Rademaekers (Trinomics)
Torsten Becker (Frankfurt School of Finance & Management)
Andrew Floudiotis (Frankfurt School of Finance & Management)
Annica Cochu (adelphi)
In association with:

TEC1149EU
Building the Investment Community for innovative energy technology projects Deliverable D5: Policy recommendations for increasing innovative energy technology investments
TEC1149EU
TABLE OF CONTENT
Executive Summary .................................................................................... 7
1 Introduction ....................................................................................... 11
1.1 Background and objectives ................................................................... 11
1.2 Reading guide .................................................................................... 12
2 Recap of key issues .............................................................................. 13
2.1 Intrinsic issues – not addressable by public intervention ............................... 13
2.2 Intrinsic issues – can be addressed by public intervention ............................. 13
2.3 Transactional issues ............................................................................ 14
3 The big picture .................................................................................... 17
3.1 Theoretical potential ........................................................................... 17
3.2 Levelised Cost Of Electricity (LCOE) ........................................................ 18
3.3 Venture capital / private equity investment volumes ................................... 19
3.4 EU research funding ............................................................................ 20
4 Practical insights ................................................................................. 23
4.1 Assembling the portfolio of investment opportunities .................................. 23
4.1.1 Participation rate per source ........................................................................... 23
4.1.2 Participation rate per technology ..................................................................... 23
4.1.3 Final portfolio and overall lessons ..................................................................... 24
4.2 Inviting the investors ........................................................................... 25
4.2.1 Level of interest .......................................................................................... 25
4.2.2 Reasons for no interest .................................................................................. 26
4.3 Facilitating the match-making process ..................................................... 27
4.3.1 Level of interest in 1-to-1 meetings ................................................................... 27
4.3.2 Effectiveness of the events ............................................................................. 28
4.3.3 Feedback on the events ................................................................................. 29
5 EU policy framework............................................................................. 31
5.1 Selection of EU instruments .................................................................. 31
5.2 Relevance of EU instruments ................................................................. 31
5.2.1 Scale and type of support ............................................................................... 32
5.2.2 Relevance of EU funding instruments ................................................................. 32
6 Conclusions of the study: final policy recommendations ................................ 35
6.1 Market development ........................................................................... 35
6.1.1 Description of the issue ................................................................................. 35
6.1.2 Recommended next steps ............................................................................... 35
6.2 Mechanism to navigate EU support .......................................................... 37
Building the Investment Community for innovative energy technology projects Deliverable D5: Policy recommendations for increasing innovative energy technology investments
TEC1149EU
6.2.1 Description of the issue ................................................................................. 37
6.2.2 Recommended next steps ............................................................................... 37
6.3 Closing the funding gap ........................................................................ 38
6.3.1 Description of the issue ................................................................................. 38
6.3.2 Recommended next steps ............................................................................... 39
6.4 Targeted match-making ....................................................................... 39
6.4.1 Description of the issue ................................................................................. 39
6.4.2 Recommended next steps ............................................................................... 40
Annex: Summary of relevant EU instruments ................................................... 42
Horizon 2020 .............................................................................................. 42
InnovFin Energy Demonstration Projects ............................................................ 43
InnovFin SME Guarantee Facility ...................................................................... 44
InnoEnergy ................................................................................................. 45
New Entrant Reserve (NER) 300 and the proposed new Innovation Fund .................... 47
The Start-up and Scale-up Initiative .................................................................. 49
European Innovation Council .......................................................................... 50
European Fund for Strategic Investments (EFSI) ................................................... 52
The European Investment Project Portal ............................................................ 53
European Investment Advisory Hub (EIAH) ......................................................... 54
Building the Investment Community for innovative energy technology projects Deliverable D5: Policy recommendations for increasing innovative energy technology investments
7
Executive Summary
Background and objectives
This report, titled ‘Policy recommendations for increasing innovative energy technology investments’,
constitutes deliverable D5 of the project on ‘Building the investment community for innovative energy
technology projects’ (Ref N°ENER/C2/2016-500), carried out for the European Commission, DG Energy.
As outlined in the previous report for this project, titled ‘Improving the investment community to
facilitate increased investments’ (Deliverable D1), EU clean energy innovators face substantial
challenges in attracting private capital. As a result, several EU innovations do not reach the stage of
commercialisation and do not become available in the market. This has a detrimental impact on the
EU’s ability to realise its ambitions to decarbonise the economy, to become a leader in renewables, and
to safeguard security of supply.
The overarching goal of this project is to contribute to ‘increasing the volume of investment in
innovative energy technologies and help achieving the EU's 2030 climate and energy targets’. The whole
project consists of five tasks that either provide direct support to clean energy innovators (e.g. through
match-making and offering a handbook/vademecum) or provide a better understanding of the issues
and potential solutions. This report contributes to the latter objective, and has the following specific
objectives:
1. Identify and report on the lessons learnt throughout this project concerning the key issues that
obstruct private investments in clean energy innovation;
2. Identify gaps and opportunities for improvement in the existing set of support measures at EU
level;
3. Propose concrete recommendations for EU policy makers on how to increase the volume of
private investments for EU clean energy innovation.
Key issues for clean energy innovators
Key issues have been identified through three exercises. First, a range of interviews were conducted
with investors and innovators. Second, a literature review has been conducted to provide an overview
on the trends and dynamics of clean energy innovation based on a selection of high-level indicators.
Third, lessons have been distilled from our work on organising match-making events.
The lessons learnt from the interviews are that policy recommendations should focus on issues such as
regulatory risk, too small investment funds, insufficient demand and the lengthy time horizon for
commercialisation of energy technologies. Furthermore, policy recommendations could contribute to
the development of competences at the innovator and investor or to improve networking between
investors and innovators.
The literature review revealed that solar and wind energy have the highest theoretical energy
generation potential, warranting substantial innovation support. A review of the global average
levelised cost of electricity (LCOE) revealed that significant cost reductions are still required to make
concentrated solar power, offshore wind, solar PV and ocean energy competitive, increasing the
importance of innovation for these sectors. In terms of funding, the venture capital investments in the
Building the Investment Community for innovative energy technology projects Deliverable D5: Policy recommendations for increasing innovative energy technology investments
8
EU are at a very low level, underlining the need for further public support. Finally, EU research budgets
for clean energy are dispersed across a broad range of technologies, highlighting possibilities for an
increased focusing of efforts.
The organisation of the match-making events revealed that only a small share of the innovators was
interested in our match-making services, pointing to either a low share of projects aiming to
commercialise their technology, an oversupply of match-making services, or a general reluctance to
participate in match-making events. Furthermore, only a small share of the European VCs and corporate
investors active in the field were interested in our portfolio of investment opportunities. Several
investors had shifted their focus away from clean energy innovation, due to the below par performance
of investments in the sector, the high capital requirements and long time-to-market. Investors were
least interested in CCS, tidal energy, and wave energy, highlighting the intrinsic challenges that these
technologies face and the substantial public intervention that would be required to bring these
technologies to the market. For smart-grid technologies, there is less of an issue to attract investors
and therefore no need for additional public support. Finally, our small-scale match-making events with
pan-European investors proved to have added value for the participating innovators. The effectiveness
of such events is considered much higher than for large-scale events.
Existing EU support for clean energy innovators
The existing EU instruments for supporting clean energy innovators have been analysed to identify gaps
in the current offering and options for improvement. The assessment revealed that there are numerous
EU instruments in place to support clean energy innovators, which underlines the EU’s efforts to
support clean energy innovation, but also creates complexity for innovators. The scale of support of
instruments that explicitly target clean energy innovation at TRL 7-9 is limited compared to the support
for early stage innovation (H2020) and commercial projects (EFSI). Especially since NER300 funding is no
longer available.
InnovFin EDP and the SME instrument are examples of instruments that fit the requirements of clean
energy innovators relatively well. Efforts to increase and improve the EU support could focus on these
two instruments. Areas for improving the effectiveness of the SME instrument include creating clean
energy-specific budgets and increasing the range of funding. Areas for improving InnovFin EDP could be
to lower the minimum funding threshold and potentially to loosen the bankability requirements.
The high-level scope and requirements for NER300 also fitted well with the needs of clean energy
requirements. If the issues that occurred during its execution can be resolved in its successor, the
Innovation Fund, that fund could also play an important role in supporting clean energy innovation.
Policy recommendations
We developed four policy recommendations, building on the key issues and the existing set of support
measures.
Our first recommendation is to develop a market for a selection of innovative, close-to-market energy
technologies. The current innovation support for such energy technologies includes research,
development and demonstration support, but does not provide incentives for market uptake of the
technologies. This deters private investments as there is no prospect of a profitable sales market and
business case, once the technology has been developed successfully. Combining RD&D funding and

Building the Investment Community for innovative energy technology projects Deliverable D5: Policy recommendations for increasing innovative energy technology investments
9
market incentives for a selection of the most promising technologies would lead to more effective
innovation support.
Our second recommendation is to develop a comprehensive and user-friendly mechanism to support
innovators in navigating the EU support options. Clean energy innovators are often not aware of all the
available support measures. There are several tools and services available for assisting innovators in
this respect, but none point to the full set of support measures. Developing one comprehensive tool
that is communicated properly to the innovators would increase the effectiveness of the current set of
support measures.
Our third recommendation is to modify some of the existing funding instruments to close the funding
gap between EUR 3,5 and EUR 15 million. This range is too high for the SME instrument and too low for
InnovFin Energy Demonstration Projects. Adapting the thresholds of the existing instruments to cover
this range would lead to a better coverage of the requirements of clean energy innovators. Which
instrument could be best adapted to close this funding gap would require an in-depth assessment of the
characteristics of each, including their transaction costs.
Our fourth and final recommendation is to organise periodical, focused match-making events. While
there are numerous match-making events across Europe, few are effective at match-making between
innovators and investors due to the too broad agenda setting. The match-making events organised as
part of this study applied a more focused agenda, with pre-booked innovator/investors meetings as the
key item. This proved to have added value over several of the existing, larger events. Hence, organising
such match-making once or twice per year would be a useful measure to support clean energy
innovators.

Building the Investment Community for innovative energy technology projects Deliverable D5: Policy recommendations for increasing innovative energy technology investments
11
1 Introduction
This report, titled ‘Policy recommendations for increasing innovative energy technology investments’,
constitutes deliverable D5 of the project ‘Building the investment community for innovative energy
technology projects’ (Ref N°ENER/C2/2016-500), carried out for the European Commission, DG Energy.
In this chapter, we outline the background and objectives of the study and provide a reading guide for
this report.
1.1 Background and objectives
As outlined in the previous report for this project, titled ‘Improving the investment community to
facilitate increased investments’, EU clean energy innovators face substantial challenges in attracting
private capital. This has a detrimental impact on the EU’s ability to realise its ambitions to decarbonise
the economy, to become a leader in renewables, and to safeguard security of supply. Hence, the EU has
put a variety of instruments and policies in place to overcome these challenges and enable promising
clean energy innovations to reach the market.
The project ‘Building the investment community for innovative energy technology projects’ is one of
the EU actions to overcome these challenges. Its overarching goal is to contribute to ‘increasing the
volume of investment in innovative energy technologies and help achieving the EU's 2030 climate and
energy targets’. The project consists of the following tasks:
Task 1 provides an understanding of the current European investment community for clean
energy innovations. Definitions and scoping of the investment community are provided, issues
are assessed, and best practices are identified that may help to overcome the issues;
Task 2 aims to identify 40 to 50 innovative and investable clean energy projects. These
projects are bundled into a portfolio that outlines the innovation, financials, company
structure, target markets, regulatory issues, risks and financing options of the project. This
portfolio is used to attract investors to the match-making events that are organised as part of
this study (task 4);
Task 3 is to deliver a guide (or vademecum) for innovators on how to succeed in securing a
sustainable stream of finance throughout the different phases of project development. This
vademecum will be made available to innovators across Europe in order to improve their skills
in raising capital;
Task 4 is to organise a series of match-making events to establish fruitful contacts between
innovators and investors, with the ultimate aim to facilitate investments in the sector. These
events will be supported by a communication strategy, website and other communication tools
to attract the right audience to the events and disseminate the project’s outputs;
Task 5 (this report) collates the findings of all tasks and provides an in-depth assessment of
the existing policy measures. Based on these, recommendations will be drafted for EU policy
makers.
This report constitutes the final output of task 5.
Building the Investment Community for innovative energy technology projects Deliverable D5: Policy recommendations for increasing innovative energy technology investments
12
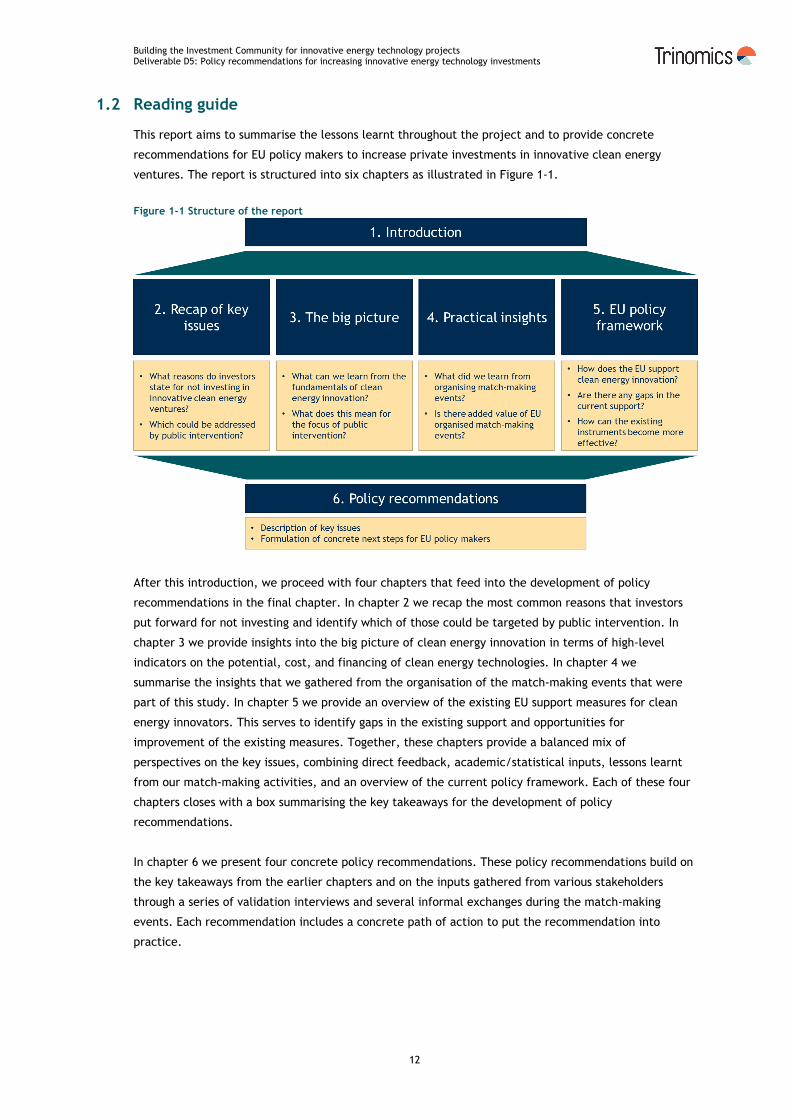
1.2 Reading guide
This report aims to summarise the lessons learnt throughout the project and to provide concrete
recommendations for EU policy makers to increase private investments in innovative clean energy
ventures. The report is structured into six chapters as illustrated in Figure 1-1.
Figure 1-1 Structure of the report
After this introduction, we proceed with four chapters that feed into the development of policy
recommendations in the final chapter. In chapter 2 we recap the most common reasons that investors
put forward for not investing and identify which of those could be targeted by public intervention. In
chapter 3 we provide insights into the big picture of clean energy innovation in terms of high-level
indicators on the potential, cost, and financing of clean energy technologies. In chapter 4 we
summarise the insights that we gathered from the organisation of the match-making events that were
part of this study. In chapter 5 we provide an overview of the existing EU support measures for clean
energy innovators. This serves to identify gaps in the existing support and opportunities for
improvement of the existing measures. Together, these chapters provide a balanced mix of
perspectives on the key issues, combining direct feedback, academic/statistical inputs, lessons learnt
from our match-making activities, and an overview of the current policy framework. Each of these four
chapters closes with a box summarising the key takeaways for the development of policy
recommendations.
In chapter 6 we present four concrete policy recommendations. These policy recommendations build on
the key takeaways from the earlier chapters and on the inputs gathered from various stakeholders
through a series of validation interviews and several informal exchanges during the match-making
events. Each recommendation includes a concrete path of action to put the recommendation into
practice.
Building the Investment Community for innovative energy technology projects Deliverable D5: Policy recommendations for increasing innovative energy technology investments
13
2 Recap of key issues
In the previous report for this study, titled ‘Improving the investment community to facilitate increased
investments’ (Deliverable D1), we identified the main reasons why private sector investors are
reluctant to invest in innovative clean energy ventures. We sub-divided the issues into intrinsic issues
and transactional issues to differentiate between issues that can be addressed by the type of services
(e.g. match-making) that were foreseen as part of this study (transactional issues) and issues that
require broader interventions to overcome (intrinsic issues).
In this report, we take a slightly different perspective as we aim to deliver policy recommendations for
the EU to address the main issues where possible. The key criterion for the issues to be addressed is
that the solutions (i.e. the recommendations) need to be deliverable by public intervention from the
EU, irrespective of whether those are intrinsic or transactional in nature.
In this section, we briefly recap the issues that have been identified in the previous report and identify
which could be addressed at EU level. This way, an initial scoping of the issues to be addressed by our
recommendations is made, which will be further complemented with the findings from the other
analytical chapters in this report (chapter 2 and 3).
2.1 Intrinsic issues – not addressable by public intervention
The first category of issues that we identify consists of issues that are intrinsic in nature and cannot be
addressed by public intervention. The following issues fall under this category:
1. Technological risk of the venture: Will the technology work? And how much effort is required
for this?
2. Commercial risk of the venture: How fast will competitors enter the market? And at what
cost and performance level?
3. Investment volume (capital-intensity): Capital required for developing the technology until
revenues are generated.
The common denominator of these issues is that they can be regarded as ‘facts of life’. Developing and
commercialising a technology is always susceptible to the risk of the technology not working and the
risk of competitors entering the market ahead of you. Furthermore, investment volumes tend to be high
for energy innovations, hardware in particular. While public support may be used to mitigate the
impact of these issues, we conclude that the issue itself remains and is therefore not something that
public intervention can directly address.
2.2 Intrinsic issues – can be addressed by public intervention
The second category consists of intrinsic issues that can be addressed by public intervention and are
often already targeted by policies. The following issues fall under this category:
1. Regulatory risk of the venture: Will subsidies remain in place? Will permits be granted?
2. Inappropriate investor environment: Are investors incentivised to make risky investments?
3. Too small fund size: Typical investment size of EU-based VCs is small compared to their US
peers and compared to the required investment volumes;
Building the Investment Community for innovative energy technology projects Deliverable D5: Policy recommendations for increasing innovative energy technology investments
14
4. Insufficient demand: Demand for innovative energy generating technologies is limited, due to
the higher costs and sometimes limited deployment opportunities;
5. Lack of a track record: Both the innovator and the innovation lack a convincing track record;
6. Time horizon for commercialisation: Time required for developing the technology until
revenues are generated.
For all these issues, some form of public intervention can be envisioned that alleviates the impact.
Examples include:
the anti-retroactivity clause that is proposed as part of the Commission’s winter package and
serves to reduce the regulatory risk;
the fund-of-funds that is put in place to increase the volume of EU VC funds, addressing the
issues of too small fund sizes;
publicly funded demonstration projects and public procurement that could foster demand and
allow innovators to build a track record.
The existing policy measures and any improvements that could be envisioned will be discussed in more
detail in chapter 5 and 6.
2.3 Transactional issues
The final category includes issues that are transactional in nature. These relate to lacking competences
at the innovator or investor and a lack of a network between them. The following issues are included:
1. Innovator lacks financial knowledge: What type of investments to aim for, which investors to
approach and how to prepare for a financing round?
2. Innovator lacks market understanding and supply chain partnerships: Who to sell to and
whom to collaborate with is not sufficiently clear;
3. Immature/underdeveloped business plan: The business plan does not give a clear picture on
key elements such as the target markets, competitive position, costs, supply chain etc;
4. Innovator team lacks soft skills and cohesion: The different competences are not adequately
covered by the team and/or the team does not work together effectively;
5. Investor lacks technical knowledge: The innovation and its potential are not properly
understood by the investor due to a lack of technical knowledge;
6. Lacking innovator-investor network: Challenges on both sides to identify the right
innovators/investors to approach and to get in contact with each other.
As outlined in the previous report, such issues can be targeted by public interventions such as
organising match-making events, coaching services (e.g. by accelerators) and training sessions and
could therefore be targeted by the policy recommendations in this report.

Building the Investment Community for innovative energy technology projects Deliverable D5: Policy recommendations for increasing innovative energy technology investments
15
Key takeaways for the development of policy recommendations
Policy recommendations could be envisioned for the following intrinsic issues: Regulatory risk,
inappropriate investor environment, too small funds, insufficient demand, lack of a track record,
time horizon for commercialisation.
Policy recommendations for transactional issues could focus on the development of competences at
the innovator and investor or could aim to improve networking between investors, innovators and
other relevant stakeholders such as potential clients.
Existing initiatives need to be carefully considered as several issues are already targeted by some
interventions.

Building the Investment Community for innovative energy technology projects Deliverable D5: Policy recommendations for increasing innovative energy technology investments
17
3 The big picture
The challenges for clean energy innovation and their applicability to specific technologies can be better
understood when taking a step back and looking at the bigger picture of innovation in the sector. In this
section, we provide a few perspectives that help to pinpoint for which technologies the challenges are
most prominent and where public intervention should be focused.
3.1 Theoretical potential
An insightful perspective on the attractiveness of investing in clean energy technologies is the maximum
theoretical contribution that a technology may have in terms of supplying energy and/or making the
energy system more efficient/sustainable. In principle, this potential is only bounded by the laws of
physics and therefore does not change over time. In practice, several assumptions are required for
estimating the theoretical potential (e.g. how much of the land surface can be used, what is the
maximum efficiency that could be realised), which may lead to updates on the theoretical potential
over time. Still, the theoretical potential should be largely regarded as the upper limit of the energy
that can be generated from the respective energy source, which should not change significantly over
time.
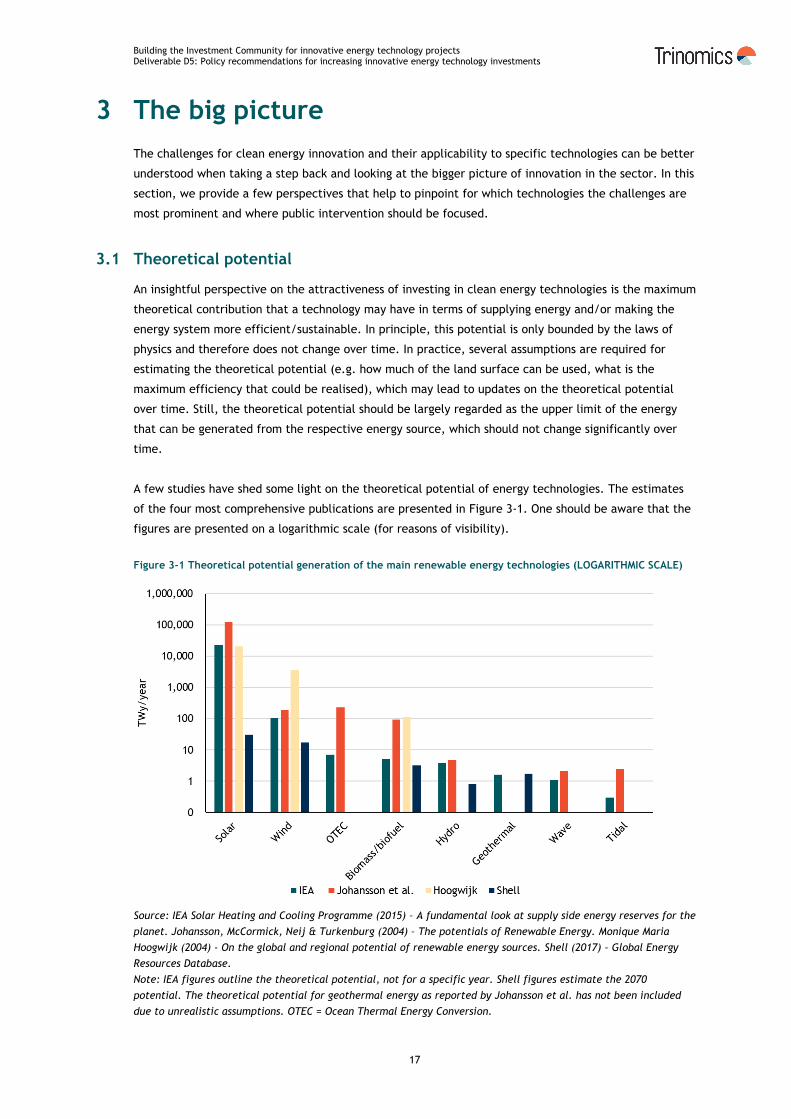
A few studies have shed some light on the theoretical potential of energy technologies. The estimates
of the four most comprehensive publications are presented in Figure 3-1. One should be aware that the
figures are presented on a logarithmic scale (for reasons of visibility).
Figure 3-1 Theoretical potential generation of the main renewable energy technologies (LOGARITHMIC SCALE)
Source: IEA Solar Heating and Cooling Programme (2015) – A fundamental look at supply side energy reserves for the
planet. Johansson, McCormick, Neij & Turkenburg (2004) – The potentials of Renewable Energy. Monique Maria
Hoogwijk (2004) - On the global and regional potential of renewable energy sources. Shell (2017) - Global Energy
Resources Database.
Note: IEA figures outline the theoretical potential, not for a specific year. Shell figures estimate the 2070
potential. The theoretical potential for geothermal energy as reported by Johansson et al. has not been included
due to unrealistic assumptions. OTEC = Ocean Thermal Energy Conversion.
Building the Investment Community for innovative energy technology projects Deliverable D5: Policy recommendations for increasing innovative energy technology investments
18
Notwithstanding the methodological challenges and various assumptions required to calculate the
theoretical potential, some key observations are consistent across all studies. Firstly, solar PV is the
main renewable energy source across all technologies1 with a potential that is up to two orders of
magnitude larger than the technology with the second largest potential (wind energy). Secondly, wind
energy is an order of magnitude larger than the other renewable energy technologies in three out of
four studies. Thirdly, the potential of both solar and wind energy is equal or larger than the total global
energy consumption. In the Shell data the potential of wind energy (17 TWy/y) is approximately equal
to global energy use (18.5 TWY/y)2 and solar is substantially larger (30 TWy/y). In all other studies, the
potential of both technologies is substantially larger than global energy use (for instance the IEA data -
wind: 75-130 TWy/y, solar: 23,000 TWy/y). Hence, from this point of view, solar and wind energy
technology have the biggest potential market size, translating to a higher upside for investors.
3.2 Levelised Cost Of Electricity (LCOE)
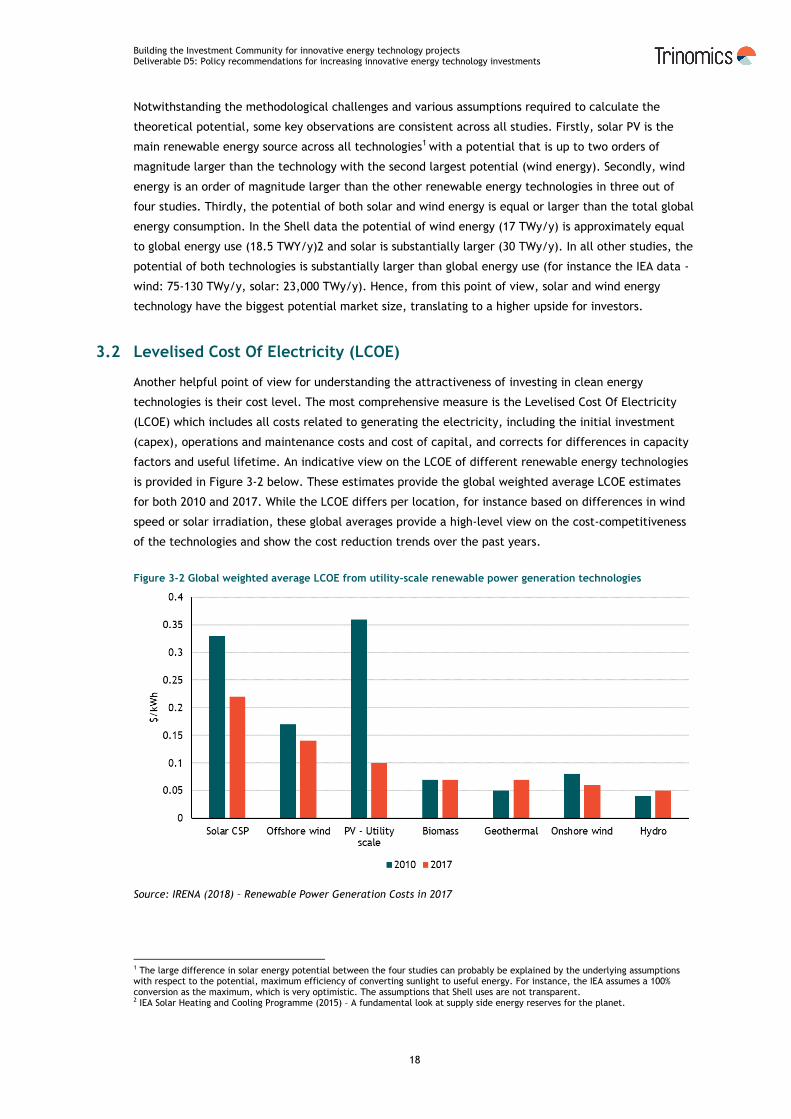
Another helpful point of view for understanding the attractiveness of investing in clean energy
technologies is their cost level. The most comprehensive measure is the Levelised Cost Of Electricity
(LCOE) which includes all costs related to generating the electricity, including the initial investment
(capex), operations and maintenance costs and cost of capital, and corrects for differences in capacity
factors and useful lifetime. An indicative view on the LCOE of different renewable energy technologies
is provided in Figure 3-2 below. These estimates provide the global weighted average LCOE estimates
for both 2010 and 2017. While the LCOE differs per location, for instance based on differences in wind
speed or solar irradiation, these global averages provide a high-level view on the cost-competitiveness
of the technologies and show the cost reduction trends over the past years.
Figure 3-2 Global weighted average LCOE from utility-scale renewable power generation technologies
Source: IRENA (2018) – Renewable Power Generation Costs in 2017
1 The large difference in solar energy potential between the four studies can probably be explained by the underlying assumptions with respect to the potential, maximum efficiency of converting sunlight to useful energy. For instance, the IEA assumes a 100% conversion as the maximum, which is very optimistic. The assumptions that Shell uses are not transparent. 2 IEA Solar Heating and Cooling Programme (2015) – A fundamental look at supply side energy reserves for the planet.
Building the Investment Community for innovative energy technology projects Deliverable D5: Policy recommendations for increasing innovative energy technology investments
19
The LCOE estimates highlight that biomass, geothermal, onshore wind and hydro are at the lowest cost
levels and that cost reductions are largest for PV, CSP, and to a lesser extent offshore and onshore
wind. For ocean energy no reliable cost estimates could be found, probably as a result of the limited
uptake of the technology. The cost estimates that are available indicate a cost range between 0.30 and
0.60 EUR/kWh, which is much higher than for the other renewable energy technologies.3
Overall, we conclude from these figures that innovation has the most traction in the technologies with
the sharpest cost reductions (PV, CSP, wind) and that this probably makes these technologies more
appealing for private investors. Especially for the technologies with the highest LCOEs (ocean energy
and CSP to a lesser extent), the investment case is less appealing as the technologies are farther from
commercially viable cost levels. As a result, additional attention and efforts from policy makers to push
them through their learning curve and make them competitive would be required, if it’s considered
societally desirable/beneficial to do so.
3.3 Venture capital / private equity investment volumes
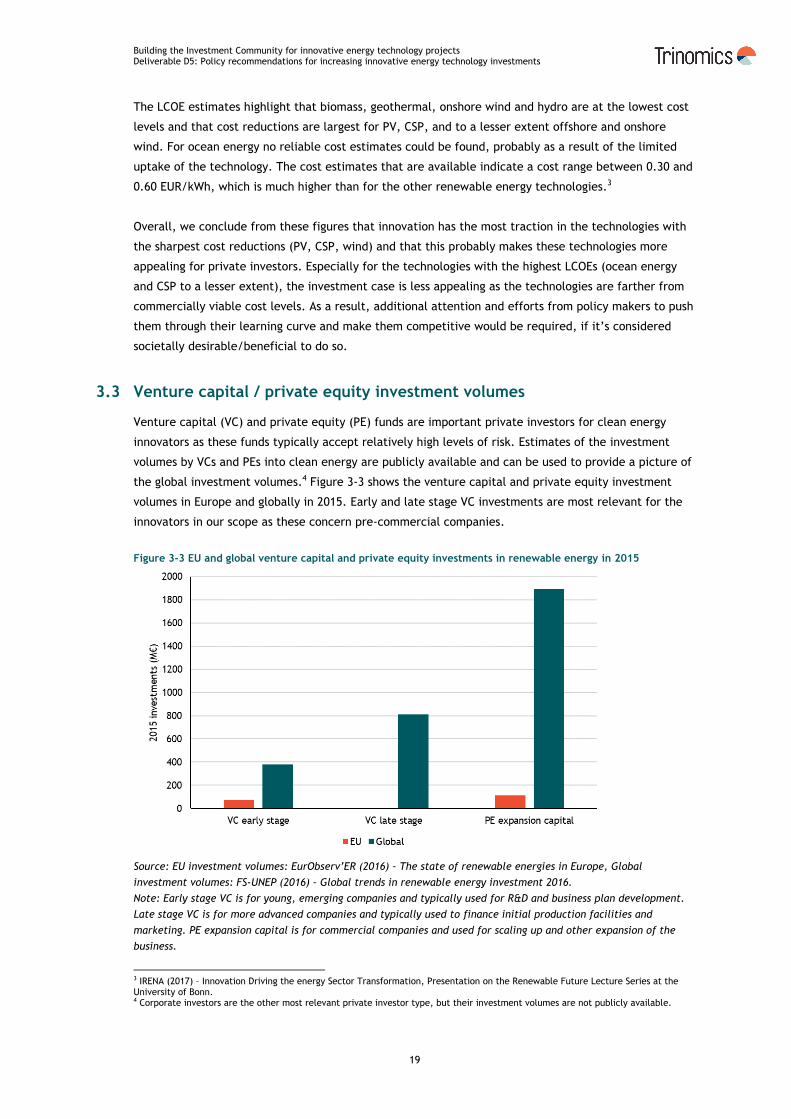
Venture capital (VC) and private equity (PE) funds are important private investors for clean energy
innovators as these funds typically accept relatively high levels of risk. Estimates of the investment
volumes by VCs and PEs into clean energy are publicly available and can be used to provide a picture of
the global investment volumes.4 Figure 3-3 shows the venture capital and private equity investment
volumes in Europe and globally in 2015. Early and late stage VC investments are most relevant for the
innovators in our scope as these concern pre-commercial companies.
Figure 3-3 EU and global venture capital and private equity investments in renewable energy in 2015
Source: EU investment volumes: EurObserv’ER (2016) – The state of renewable energies in Europe, Global
investment volumes: FS-UNEP (2016) – Global trends in renewable energy investment 2016.
Note: Early stage VC is for young, emerging companies and typically used for R&D and business plan development.
Late stage VC is for more advanced companies and typically used to finance initial production facilities and
marketing. PE expansion capital is for commercial companies and used for scaling up and other expansion of the
business.
3 IRENA (2017) – Innovation Driving the energy Sector Transformation, Presentation on the Renewable Future Lecture Series at the University of Bonn. 4 Corporate investors are the other most relevant private investor type, but their investment volumes are not publicly available.
Building the Investment Community for innovative energy technology projects Deliverable D5: Policy recommendations for increasing innovative energy technology investments
20
EU investment volumes were very low in 2015, with volumes of EUR 72M for early stage and EUR 2M for
late stage VC, compared to global volumes of EUR 420M and EUR 900M respectively. This signals a clear
issue in EU private finance for innovative energy ventures, but also shows that public sector support
does not have to be of a very large scale to have a meaningful impact. Support measures that could
realise EUR 100M+ of investments would already have a significant impact on the EU innovation system,
and measures that could mobilise investments in the order of EUR 1 billion for early and/or late stage
venture capital would transform the EU into a leading region. For comparison, the funding previously
available through NER300 totalled EUR 2.1 billion, representing a significant amount of money in this
context.5
3.4 EU research funding
An assessment of EU funding for clean energy research through its framework programmes (Horizon
2020, FP7, FP6) provides insight into the volume of investment into innovation at lower technology
readiness levels. Technologies with a high number of research projects and high levels of research
funding are likely to result in a relatively high number of innovative ventures. Consequently, one could
argue that specific support for areas with high research activity could be justified in order to support
commercialisation of research projects and spin-offs.
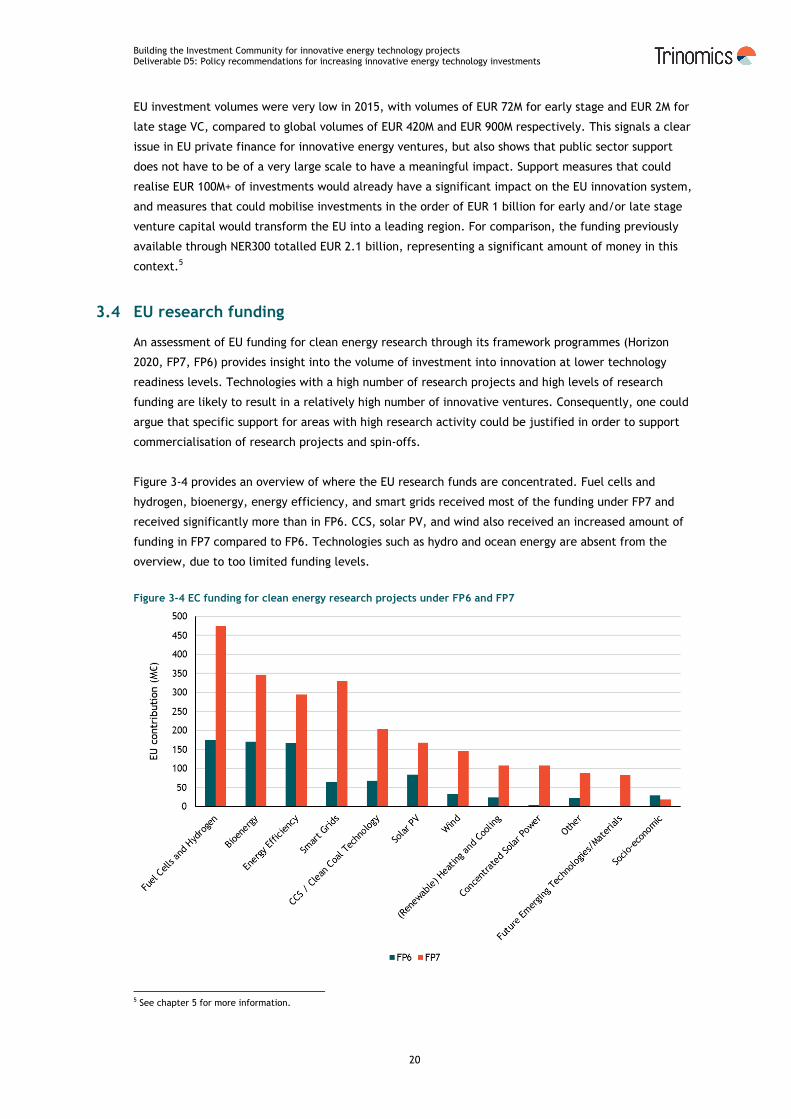
Figure 3-4 provides an overview of where the EU research funds are concentrated. Fuel cells and
hydrogen, bioenergy, energy efficiency, and smart grids received most of the funding under FP7 and
received significantly more than in FP6. CCS, solar PV, and wind also received an increased amount of
funding in FP7 compared to FP6. Technologies such as hydro and ocean energy are absent from the
overview, due to too limited funding levels.
Figure 3-4 EC funding for clean energy research projects under FP6 and FP7
5 See chapter 5 for more information.
Building the Investment Community for innovative energy technology projects Deliverable D5: Policy recommendations for increasing innovative energy technology investments
21
Source: Own elaboration based on data from Technopolis (2014) - Evaluation of the impact of projects funded under
the 6th and 7th EU Framework Programme for RD&D in the area of non-nuclear energy. Funding through the fuel
cells and hydrogen joint undertaking added based on own analysis of CORDIS data.
Key takeaways for the development of policy recommendations
Solar and wind energy have by far the biggest theoretical potential, translating to a large
potential market. From this perspective, policy recommendations to drive innovation should be
focused on those sectors.
Average LCOEs for CSP, offshore wind, solar PV and ocean energy are still above those of other
RES and non-RES technologies. Hence, innovation to drive the costs of those technologies down
is required for increased uptake.
The cost reductions for CSP, PV and offshore wind are promising, whereas the cost reductions
for ocean energy are less clear, partly due to a lack of data.
Venture capital investments in renewable energy in the EU are at a very low level, underlining
the challenges for clean energy innovation in the EU.
EU research budgets support a broad range of technologies, including several ‘energy smart
technologies’ such as fuel cells and hydrogen, energy efficiency and smart grids. For RES
technologies, particularly high budgets are allocated to bioenergy.

Building the Investment Community for innovative energy technology projects Deliverable D5: Policy recommendations for increasing innovative energy technology investments
23
4 Practical insights
As part of this project, we organised match-making events that aimed to facilitate contacts between
investors and innovators in order to discuss potential investments. The preparation and execution for
those events provided valuable lessons on the issues surrounding financing of clean energy innovations.
In this section, we will outline the main lessons derived from assembling the portfolio of investment
opportunities, inviting investors, and match-making between innovators and investors.
4.1 Assembling the portfolio of investment opportunities
A separate task of this project was to assemble a portfolio of innovative energy companies that are
looking for investments (hereafter referred to as the innovators). In this section, we highlight the
lessons that can be drawn from the process of assembling this portfolio and summarise the
characteristics of the final portfolio.6
4.1.1 Participation rate per source
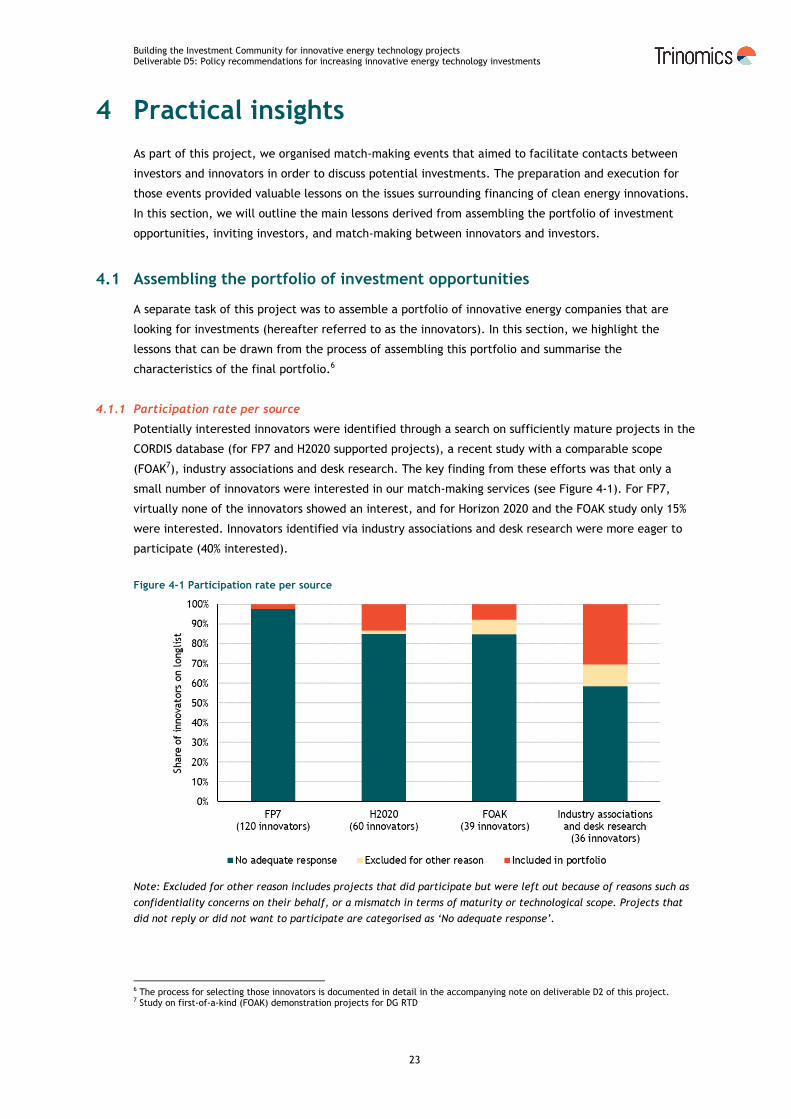
Potentially interested innovators were identified through a search on sufficiently mature projects in the
CORDIS database (for FP7 and H2020 supported projects), a recent study with a comparable scope
(FOAK7), industry associations and desk research. The key finding from these efforts was that only a
small number of innovators were interested in our match-making services (see Figure 4-1). For FP7,
virtually none of the innovators showed an interest, and for Horizon 2020 and the FOAK study only 15%
were interested. Innovators identified via industry associations and desk research were more eager to
participate (40% interested).
Figure 4-1 Participation rate per source
Note: Excluded for other reason includes projects that did participate but were left out because of reasons such as
confidentiality concerns on their behalf, or a mismatch in terms of maturity or technological scope. Projects that
did not reply or did not want to participate are categorised as ‘No adequate response’.
6 The process for selecting those innovators is documented in detail in the accompanying note on deliverable D2 of this project. 7 Study on first-of-a-kind (FOAK) demonstration projects for DG RTD
Building the Investment Community for innovative energy technology projects Deliverable D5: Policy recommendations for increasing innovative energy technology investments
24
4.1.2 Participation rate per technology
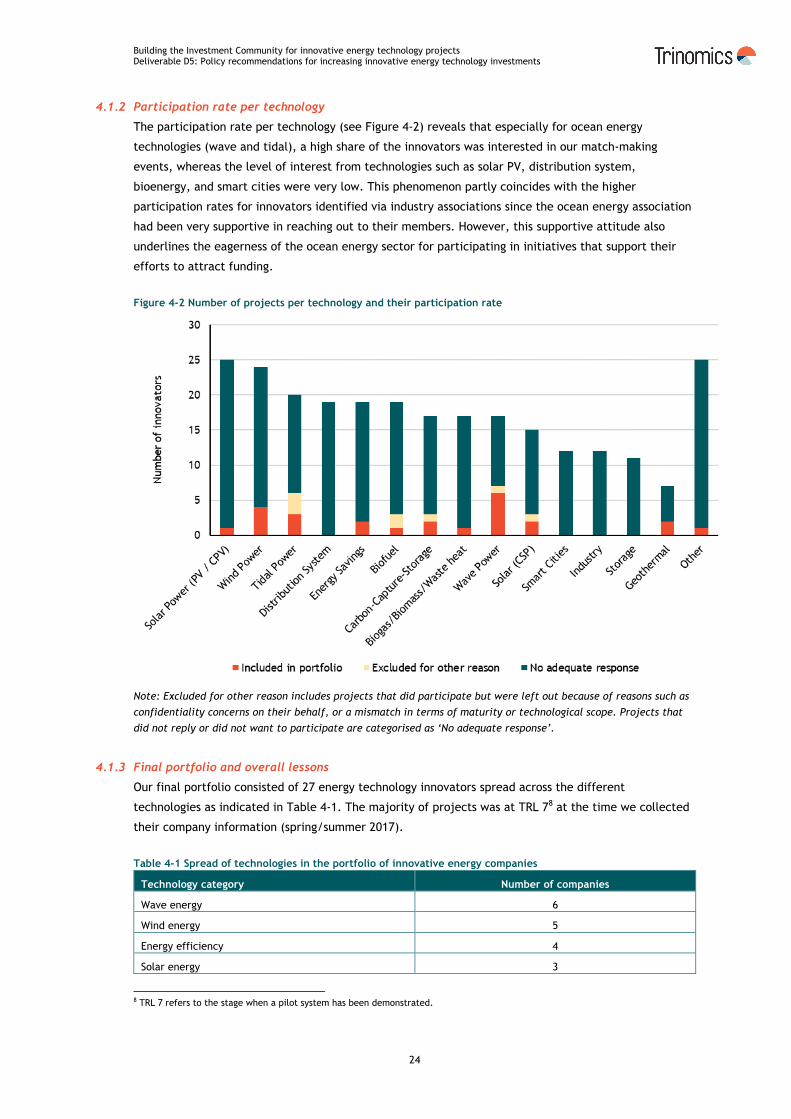
The participation rate per technology (see Figure 4-2) reveals that especially for ocean energy
technologies (wave and tidal), a high share of the innovators was interested in our match-making
events, whereas the level of interest from technologies such as solar PV, distribution system,
bioenergy, and smart cities were very low. This phenomenon partly coincides with the higher
participation rates for innovators identified via industry associations since the ocean energy association
had been very supportive in reaching out to their members. However, this supportive attitude also
underlines the eagerness of the ocean energy sector for participating in initiatives that support their
efforts to attract funding.
Figure 4-2 Number of projects per technology and their participation rate
Note: Excluded for other reason includes projects that did participate but were left out because of reasons such as
confidentiality concerns on their behalf, or a mismatch in terms of maturity or technological scope. Projects that
did not reply or did not want to participate are categorised as ‘No adequate response’.
4.1.3 Final portfolio and overall lessons
Our final portfolio consisted of 27 energy technology innovators spread across the different
technologies as indicated in Table 4-1. The majority of projects was at TRL 78 at the time we collected
their company information (spring/summer 2017).
Table 4-1 Spread of technologies in the portfolio of innovative energy companies
Technology category Number of companies
Wave energy 6
Wind energy 5
Energy efficiency 4
Solar energy 3
8 TRL 7 refers to the stage when a pilot system has been demonstrated.
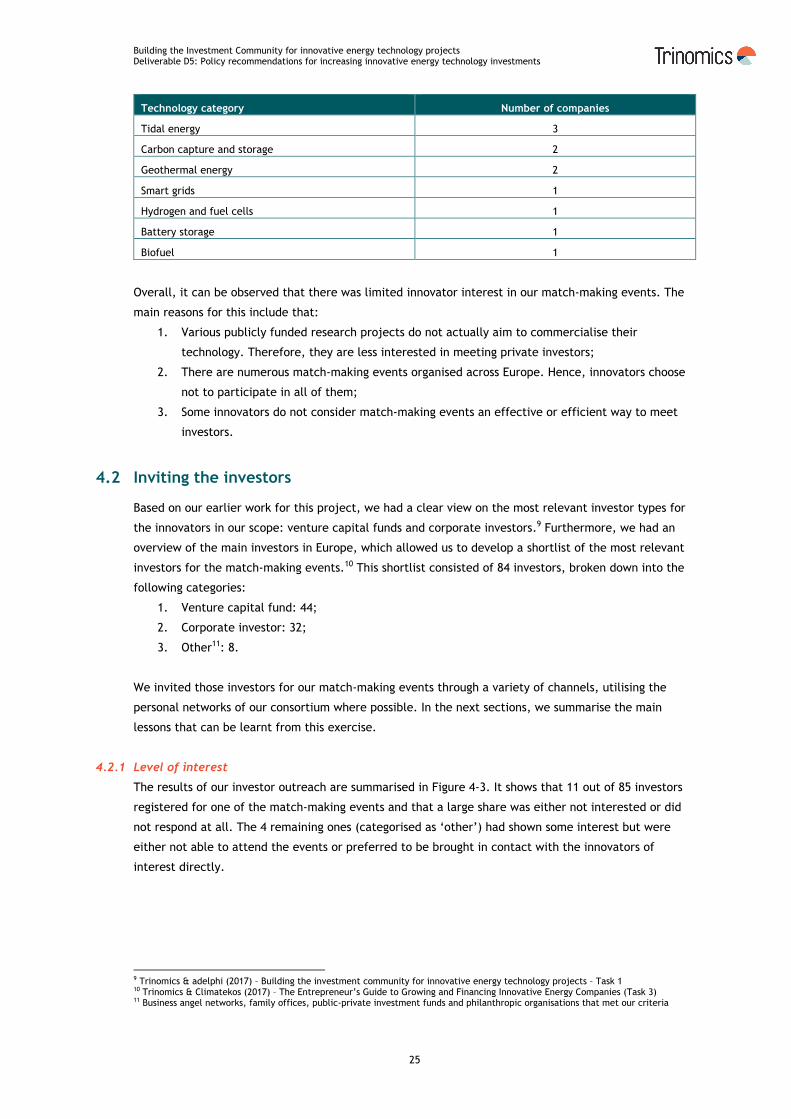
Building the Investment Community for innovative energy technology projects Deliverable D5: Policy recommendations for increasing innovative energy technology investments
25
Technology category Number of companies
Tidal energy 3
Carbon capture and storage 2
Geothermal energy 2
Smart grids 1
Hydrogen and fuel cells 1
Battery storage 1
Biofuel 1
Overall, it can be observed that there was limited innovator interest in our match-making events. The
main reasons for this include that:
1. Various publicly funded research projects do not actually aim to commercialise their
technology. Therefore, they are less interested in meeting private investors;
2. There are numerous match-making events organised across Europe. Hence, innovators choose
not to participate in all of them;
3. Some innovators do not consider match-making events an effective or efficient way to meet
investors.
4.2 Inviting the investors
Based on our earlier work for this project, we had a clear view on the most relevant investor types for
the innovators in our scope: venture capital funds and corporate investors.9 Furthermore, we had an
overview of the main investors in Europe, which allowed us to develop a shortlist of the most relevant
investors for the match-making events.10 This shortlist consisted of 84 investors, broken down into the
following categories:
1. Venture capital fund: 44;
2. Corporate investor: 32;
3. Other11: 8.
We invited those investors for our match-making events through a variety of channels, utilising the
personal networks of our consortium where possible. In the next sections, we summarise the main
lessons that can be learnt from this exercise.
4.2.1 Level of interest
The results of our investor outreach are summarised in Figure 4-3. It shows that 11 out of 85 investors
registered for one of the match-making events and that a large share was either not interested or did
not respond at all. The 4 remaining ones (categorised as ‘other’) had shown some interest but were
either not able to attend the events or preferred to be brought in contact with the innovators of
interest directly.
9 Trinomics & adelphi (2017) – Building the investment community for innovative energy technology projects – Task 1 10 Trinomics & Climatekos (2017) – The Entrepreneur’s Guide to Growing and Financing Innovative Energy Companies (Task 3) 11 Business angel networks, family offices, public-private investment funds and philanthropic organisations that met our criteria
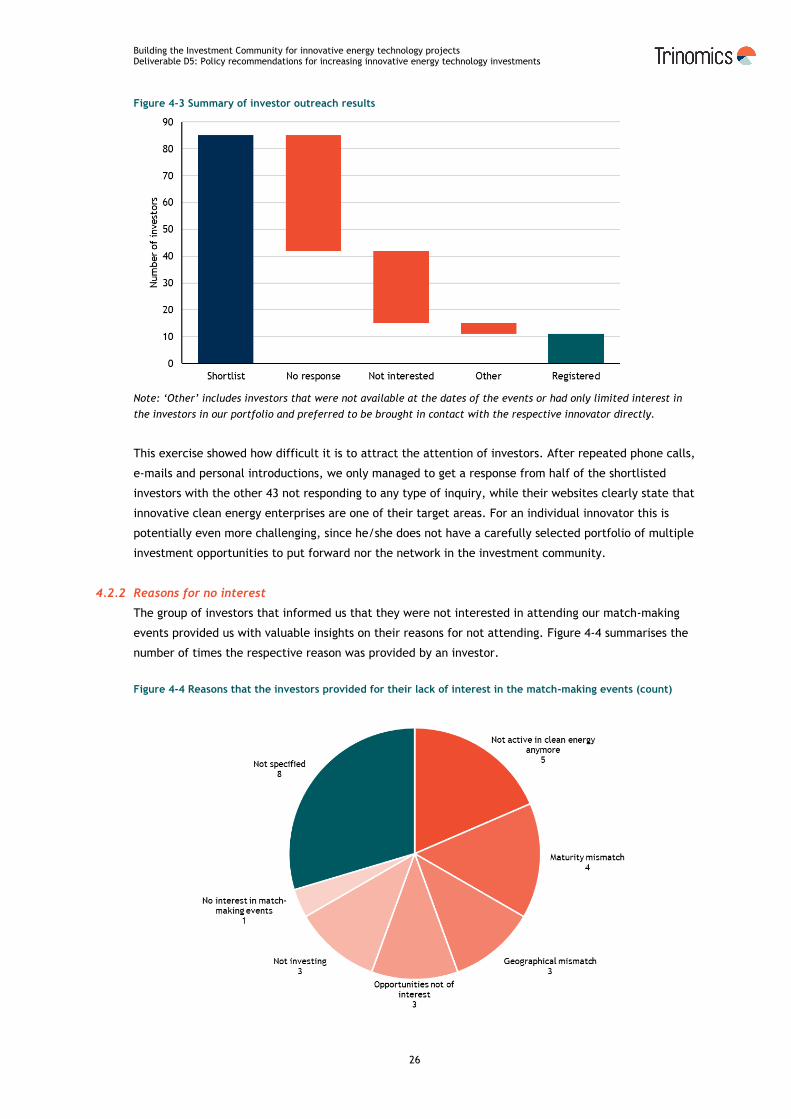
Building the Investment Community for innovative energy technology projects Deliverable D5: Policy recommendations for increasing innovative energy technology investments
26
Figure 4-3 Summary of investor outreach results
Note: ‘Other’ includes investors that were not available at the dates of the events or had only limited interest in
the investors in our portfolio and preferred to be brought in contact with the respective innovator directly.
This exercise showed how difficult it is to attract the attention of investors. After repeated phone calls,
e-mails and personal introductions, we only managed to get a response from half of the shortlisted
investors with the other 43 not responding to any type of inquiry, while their websites clearly state that
innovative clean energy enterprises are one of their target areas. For an individual innovator this is
potentially even more challenging, since he/she does not have a carefully selected portfolio of multiple
investment opportunities to put forward nor the network in the investment community.
4.2.2 Reasons for no interest
The group of investors that informed us that they were not interested in attending our match-making
events provided us with valuable insights on their reasons for not attending. Figure 4-4 summarises the
number of times the respective reason was provided by an investor.
Figure 4-4 Reasons that the investors provided for their lack of interest in the match-making events (count)
Building the Investment Community for innovative energy technology projects Deliverable D5: Policy recommendations for increasing innovative energy technology investments
27
One of the main reasons put forward by investors was that they are no longer active in the clean energy
sector and that they currently focus on sectors such as ‘tech’ and ‘data-driven business models in the
energy space’. This is consistent with our prior finding that clean energy innovation has become less
popular with investors over time, due to the below par historical performance of investments in the
clean energy sector, the high capital requirements, and the long time-to-market.12 Other reasons relate
to mismatches between the innovators in our portfolio and the investment criteria of the investors. The
reported mismatches often relate to the maturity of the innovators (too mature/immature) or
geographical location of the innovators (investor focused on a specific country or region that was not
well represented in our portfolio). Also, the category ‘opportunities not of interest’ included several
mismatches with investment criteria. Some investors did for instance only look into well-established
sectors such as solar PV and wind energy and did not consider opportunities in wave, tidal, geothermal
or CCS. Finally, some investors were not looking for new investment opportunities at the moment and
one investor did not consider attending match-making events at all.
Overall, we conclude that while there is a large variety of reasons reported, a large share comes down
to investors making a conscious decision of not investing in pre-commercial clean energy companies
anymore. Some investors have left the clean energy sector completely, others have decided to focus
only on more mature companies that have a significant revenue stream or focus on the more
established technologies such as solar PV or the less capital-intensive sub-sectors such as software-
based smart grid solutions. For capital-intensive, non-established sectors like wave and tidal this leaves
only a limited number of investors to work with.
4.3 Facilitating the match-making process
We organised two match-making events as part of this project, one in London (November 2017) and one
in Frankfurt (January 2018). The events focused on 1-to-1 innovator/investor meetings and included the
opportunity for the innovator to pitch in front of the investors. In this section, we present the insights
that we gathered from this part of the process.
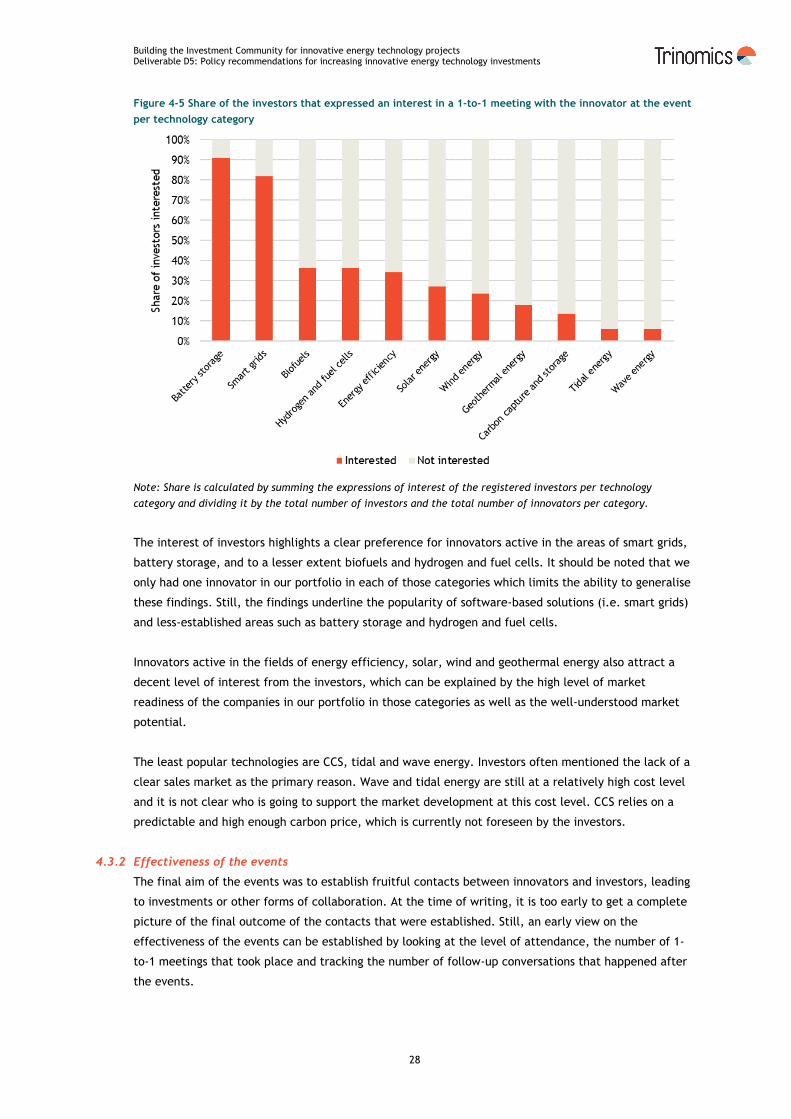
4.3.1 Level of interest in 1-to-1 meetings
The investors could indicate in their registration form which innovators they wanted to meet during a
pre-booked 1-to-1 meeting at the event. Figure 4-5 summarises the interests expressed per technology
category. A 100% score in this figure indicates that all investors wanted to meet all innovators in the
respective category.
12 Trinomics & adelphi (2017) – Building the investment community for innovative energy technology projects – Task 1
Building the Investment Community for innovative energy technology projects Deliverable D5: Policy recommendations for increasing innovative energy technology investments
28
Figure 4-5 Share of the investors that expressed an interest in a 1-to-1 meeting with the innovator at the event
per technology category
Note: Share is calculated by summing the expressions of interest of the registered investors per technology
category and dividing it by the total number of investors and the total number of innovators per category.
The interest of investors highlights a clear preference for innovators active in the areas of smart grids,
battery storage, and to a lesser extent biofuels and hydrogen and fuel cells. It should be noted that we
only had one innovator in our portfolio in each of those categories which limits the ability to generalise
these findings. Still, the findings underline the popularity of software-based solutions (i.e. smart grids)
and less-established areas such as battery storage and hydrogen and fuel cells.
Innovators active in the fields of energy efficiency, solar, wind and geothermal energy also attract a
decent level of interest from the investors, which can be explained by the high level of market
readiness of the companies in our portfolio in those categories as well as the well-understood market
potential.
The least popular technologies are CCS, tidal and wave energy. Investors often mentioned the lack of a
clear sales market as the primary reason. Wave and tidal energy are still at a relatively high cost level
and it is not clear who is going to support the market development at this cost level. CCS relies on a
predictable and high enough carbon price, which is currently not foreseen by the investors.
4.3.2 Effectiveness of the events
The final aim of the events was to establish fruitful contacts between innovators and investors, leading
to investments or other forms of collaboration. At the time of writing, it is too early to get a complete
picture of the final outcome of the contacts that were established. Still, an early view on the
effectiveness of the events can be established by looking at the level of attendance, the number of 1-
to-1 meetings that took place and tracking the number of follow-up conversations that happened after
the events.
Building the Investment Community for innovative energy technology projects Deliverable D5: Policy recommendations for increasing innovative energy technology investments
29
20 out of the 27 innovators in our portfolio participated in one or both events. The others either had
too limited interest from investors or had other priorities at the dates of the events. Between 25 and 30
formal 1-to-1 investors/innovator meetings took place at the events. These meetings were highly
appreciated by the innovators as they could discuss their business in sufficient detail with investors that
were keen to learn more. After the events, at least 12 follow-up discussions between innovators and
investors took place, of which approximately half are still ongoing. Thus far, no investments have been
reported.
4.3.3 Feedback on the events
The feedback collected on the organisation of the events was largely positive with some minor
suggestions for improvement. With respect to the added value of the event, the feedback depended
heavily on the number of 1-to-1 meetings that the innovators had at the event. Innovators who had the
opportunity to meet a few investors in person were highly satisfied whereas innovators that travelled to
the event merely to deliver a pitch were less satisfied. Hence, our set-up which focused on arranging
such 1-to-1 meetings was appropriate, but a higher number of investors would have helped to increase
the added value for the innovators.
Other feedback and observations included that:
Innovators are well connected to the investors in their home countries. Match-making services
should therefore focus on attracting the bigger pan-European investors that are harder to
reach. Engie and Statoil were two prime examples of corporate investors that we managed to
attract and were a big reason for innovators to participate. The same goes for the larger
venture capital funds that we have been in contact with but unfortunately not managed to
persuade to attend (e.g. Aster and Emerald);
Investors are sometimes well aware of the European innovators in their areas of interest. One
of the few investors that was interested in the ocean energy sector had for instance already
identified and assessed most of the ocean energy companies in our portfolio. Some other
investors also indicated that the few opportunities of interest in our portfolio had already been
assessed by them. Hence, it can be challenging to identify new investment opportunities to
present to the investors at such events;
The scale of the events (10-15 innovators, 5-10 investors) was perceived as very effective
compared to larger scale events. The small scale created better opportunities for informal
interaction than large scale events.
Key takeaways for the development of policy recommendations
Only a small share of the identified innovators at TRL 7-9 was interested in our match-making services, pointing to either a low share of projects aiming to commercialise their technology, an oversupply of match-making services, or a general reluctance to participate in match-making events due to disappointing experiences in the past;
Only a small share of the European VCs and corporate investors active in the field, were interested in our portfolio of investment opportunities. Hence, it is challenging and time consuming for innovators to find the few investors that are interested;
Investors are least interested in CCS, tidal energy, and wave energy, highlighting the intrinsic challenges that these technologies face and the substantial public intervention that would be required to bring these technologies to the market;
Especially for smart-grids, there is less of an issue to attract investors. Hence, further public support is not required;
There is added value of small-scale match-making events that involve investors with a pan-European investment scope. The effectiveness of such events is considered much higher than for large-scale events.

Building the Investment Community for innovative energy technology projects Deliverable D5: Policy recommendations for increasing innovative energy technology investments
31
5 EU policy framework
The EU supports clean energy innovators through a range of instruments and initiatives. When
developing policy recommendations, it is important to have a clear view on what these instruments and
initiatives aim to achieve, what support they offer, and what their scope is. This way, policy
recommendations can build on existing efforts and duplication of efforts can be avoided.
In this chapter we summarise the most relevant EU instruments and initiatives.
5.1 Selection of EU instruments
A preselection of the most relevant EU instruments for the scope of this study has been made based on
the following criteria:
1. Maturity: Does the instrument/initiative target the technology readiness levels that are
relevant for this project? (TRL 7-9);
2. Sector: Does the instrument target clean energy?
3. Scale: How large is the budget? Instruments/initiatives that have a very large budget are
included also if they only partly overlap with the scope of this project. Instruments with
smaller budgets are only included if they have a good match in terms of maturity and sector.
The following instruments and initiatives have been identified and are discussed in detail in the Annex:
1. Horizon 2020;
2. InnovFin Energy Demonstration Projects;
3. InnovFin SME Guarantee Facility;
4. InnoEnergy;
5. New Entrant Reserve (NER) 300 and the proposed new Innovation Fund;
6. The Start-up and Scale-up Initiative;
7. European Innovation Council, including the SME instrument, Fast Track to Innovation, Future
and Emerging Technologies Open and the EIC Horizon Prizes;
8. European Fund for Strategic Investments (EFSI);
9. European Investment Project Portal (EIPP);
10. European Investment Advisory Hub (EIAH).
The Annex contains a description of the objectives, organisational structure, financing, target group
and criteria/requirements, and progress so far for each instrument/initiative. In the remainder of this
chapter we summarise the key feature of the instruments/initiatives, reflect on the relevance of each
instrument/initiative and derive key takeaways for the development of policy recommendations.
5.2 Relevance of EU instruments
In this section, we summarise the key features of each instrument in order to outline differences in
their relevance for the clean energy innovators within the scope of this study (TRL 7-9)13.
13 Broadly defined as companies with a working prototype but prior to commercialisation.
Building the Investment Community for innovative energy technology projects Deliverable D5: Policy recommendations for increasing innovative energy technology investments
32
5.2.1 Scale and type of support
The responsible entity, scale of support and type of support of the discussed EU instruments are
summarised in Table 5-1. It shows that the instruments are managed by a range of entities, including
various DGs of the European Commission, the EIB, EIF, and EIT. The overall scale of the instrument - in
terms of budget – is the largest for Horizon 2020 and EFSI, with the most significant clean energy-
specific budgets identified at Horizon 2020 as well as, previously, through the NER300. The other
instruments also include clean energy projects in their scope, but with either unspecified or much
smaller budgets available. The type of support offered through the instruments can be categorised into
funding, match-making, advisory services, or a mix of these. A total of 9 instruments offer support in
the form of direct project funding with another two instruments offering indirect funding, through
financial intermediaries or venture capital funds. Both match-making and advisory services are offered
through four different initiatives, including InnoEnergy, the start-up and scale-up initiative, and the
European Investment Advisory Hub.
Table 5-1 Overview of EU instruments
Instrument Responsible
entity
Scale of support Type of support
Overall Clean energy Funding Match-making
Advisory
H202014 EC 80bn 6bn15 Yes No No
InnovFin EDP EIB 300m 300m Yes No No
InnovFin SME Guarantee EIF unknown N/A Indirect No No
InnoEnergy EIT unknown unknown Yes Yes Yes
NER 300 (expired) EIB 2.1bn 2.1bn Yes No No
Start-up & scale-up Initiat. EC unknown N/A Indirect Yes Yes
EIC SME Instrument EC 1.6bn16 unknown Yes No Yes
EIC Fast Track to Innov. EC 300M17 unknown Yes No No
EIC FET Open EC 700M18 unknown Yes No No
EIC Horizon Prizes EC 15M19 15M Yes No No
EFSI EIB 21bn20 unknown Yes No No
EIPP EC N/A N/A No Yes No
EIAH EIB N/A N/A No Yes Yes
Source: own elaboration
Notes on scale of support: Turquoise cells indicate high levels of funding. Yellow cells indicate lower levels of
funding. N/A refers to cases where there is either no clean energy specific budget or because there is no funding
provided through the instrument at all.
Notes on type of support: Turquoise cells highlight instruments that offer the respective type of support. Yellow
cells indicate instruments that offer the respective type of support only indirectly, through intermediaries.
5.2.2 Relevance of EU funding instruments
If we take a closer look at the scope and requirements of the instruments that offer direct funding, it
becomes clear that not all instruments are equally relevant for the innovators in scope of this project
(see Table 5-2). First of all, the SME instrument, fast track to innovation, FET open, and EFSI are not
clean energy-specific, leading to competition from other sectors that may have less intrinsic issues to
14 The authors acknowledge that an overlap exists for H2020 funds. Some ‘standalone’ instruments that benefit from H2020 funds, such as the InnovFin programmes, are described on their own since they also receive other funding sources. Hence it should be noted that some double counting may have occurred with reference to the total EUR 80bn H2020 budget, and the budgets of other instruments described. The possible extent of this is estimated to be limited, however. 15 This is the amount programmed from 2014-2020 for secure, clean & efficient energy, but a more detailed breakdown is not known. More budget may also be available for clean energy related projects under other areas of H2020. 16 Funding is for the period 2018-2020 17 Ibid 18 Ibid 19 This is for 2018-2020 and is broken down into EUR 10M for Innovative batteries for e-vehicles, and EUR 5M for Artificial Photosynthesis 20 This is a EUR 21bn guarantee facility, not direct funding. It aims to unlock EUR500bn in investments by 2020.
Building the Investment Community for innovative energy technology projects Deliverable D5: Policy recommendations for increasing innovative energy technology investments
33
attract capital and may therefore find it easier to qualify for the funding. Secondly, not all instruments
provide funding in the range that is typically required for clean energy innovators at TRL 7-9. These
innovators typically require amounts of funding between EUR 3M and EUR 80M.21 The amounts of
funding provided by InnoEnergy, the SME instrument, Fast Track to Innovation, and FET Open are all on
the low end of this spectrum, making them less useful for innovators that require larger amounts.
Third, the maturity of the companies targeted by the instruments is not always in line with the
requirements of the innovators. The innovation actions under Horizon 2020 and the Horizon Prizes are
typically for earlier stage projects and also part of the FET Open and InnoEnergy support is for
innovators at lower levels of maturity than TRL 7-9.
The requirements for qualifying for the funding also make some instruments less suitable for clean
energy innovators. A key issue with clean energy innovation is the long time to market and the
difficulties to reach financial viability under the current market circumstances (e.g. with the current
CO2 prices and feed-in-tariffs). Instruments such as InnovFin EDP, NER300 and EFSI all require
bankability after using their funds, which is not realistic for part of the clean energy innovators.
Furthermore, some instruments only allow consortia consisting of entities from multiple countries
and/or sectors. Such requirements may not always be met by the innovator, leading either to not
applying for the instrument or to the formation of a consortium solely for getting access to the funding.
Horizon 2020 Innovation Actions, Fast Track to Innovation, and InnoEnergy apply such requirements,
which makes their funding less accessible for part of the clean energy innovators.
Table 5-2 Scope and requirements of EU funding instruments
Instrument
Scope Requirements
Clean energy- specific
Funding range Maturity Financial viability /
time-to-market Consortium
H2020 Yes Not specified TRL <8 No 3+ entities, 3+ MSs
InnovFin EDP Yes 7.5M – 75M TRL 7-8 Bankable after
support No
InnoEnergy Yes 100K – 5M TRL 5-9 Market entry <5
years 2+ countries,
research + industry
NER 300 (expired) Yes 7M – 300M22 TRL 7-9 Bankable after
support No
EIC SME Instrument No 500K – 2,5M TRL 7-9 No No
EIC Fast Track to Innov. No <3M TRL 7-9 Market entry <3
years 3-5 entities, 3+
countries
EIC FET Open No <3M TRL <5-9 No No
EIC Horizon Prizes Yes 5-10M TRL <7 No No
EFSI No 7,5-25M Commercial Bankable after
support No
Source: own elaboration.
Notes on colour scheme: Turquoise cells indicate a good match with the innovators requirements, yellow cells a
medium match and red cells a difficult match.
21 Note that the funding levels required by the innovators at the match-making events were generally at the low end of this range, and sometimes below the lower boundary (EUR 3M) 22 Range of funding for projects awarded. See http://europa.eu/rapid/press-release_MEMO-12-999_en.htm and http://europa.eu/rapid/press-release_MEMO-14-465_en.htm.
Building the Investment Community for innovative energy technology projects Deliverable D5: Policy recommendations for increasing innovative energy technology investments
34
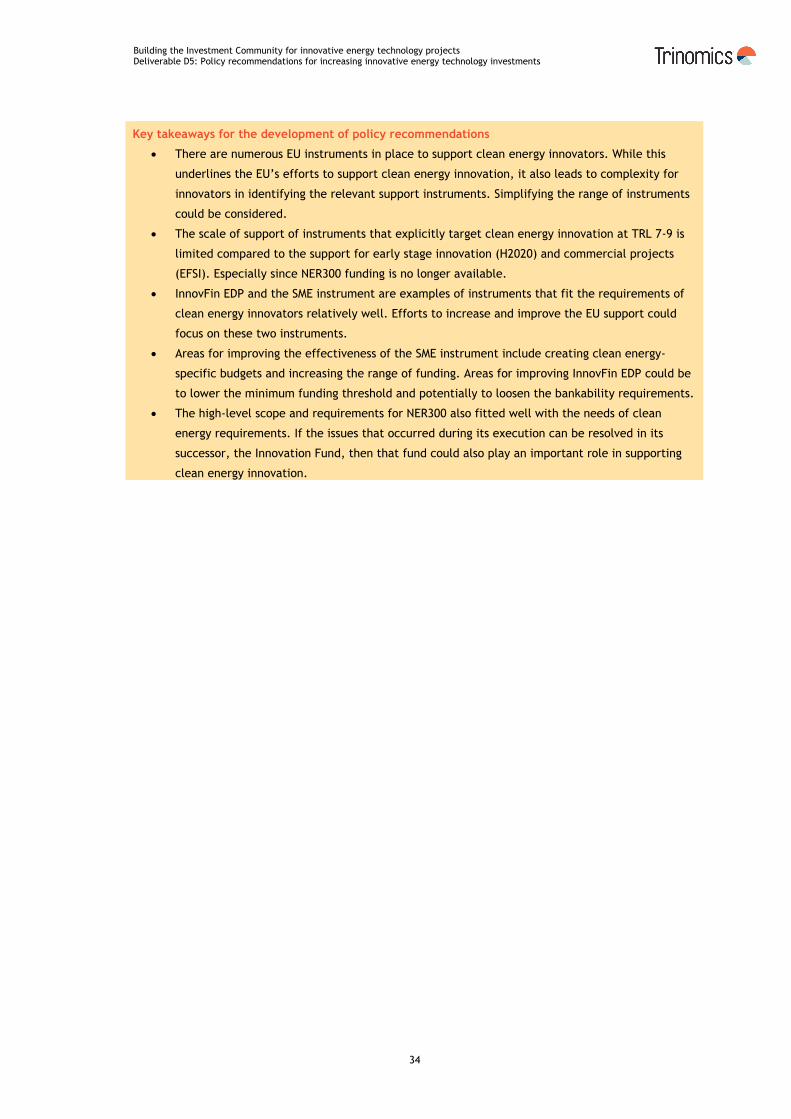
Key takeaways for the development of policy recommendations
There are numerous EU instruments in place to support clean energy innovators. While this
underlines the EU’s efforts to support clean energy innovation, it also leads to complexity for
innovators in identifying the relevant support instruments. Simplifying the range of instruments
could be considered.
The scale of support of instruments that explicitly target clean energy innovation at TRL 7-9 is
limited compared to the support for early stage innovation (H2020) and commercial projects
(EFSI). Especially since NER300 funding is no longer available.
InnovFin EDP and the SME instrument are examples of instruments that fit the requirements of
clean energy innovators relatively well. Efforts to increase and improve the EU support could
focus on these two instruments.
Areas for improving the effectiveness of the SME instrument include creating clean energy-
specific budgets and increasing the range of funding. Areas for improving InnovFin EDP could be
to lower the minimum funding threshold and potentially to loosen the bankability requirements.
The high-level scope and requirements for NER300 also fitted well with the needs of clean
energy requirements. If the issues that occurred during its execution can be resolved in its
successor, the Innovation Fund, then that fund could also play an important role in supporting
clean energy innovation.
Building the Investment Community for innovative energy technology projects Deliverable D5: Policy recommendations for increasing innovative energy technology investments
35
6 Conclusions of the study: final policy recommendations
This chapter describes four policy recommendations that we consider a promising course of action for
enabling higher levels of private investment in innovative clean energy ventures in the EU. These
recommendations build on the key takeaways of the previous chapters, without aiming for an
exhaustive set of recommendations that target all the identified issues. Instead, we have developed
recommendations that address the most pressing issues in a conceivable way and have finetuned these
recommendations in discussions with a selection of innovators and investors. Furthermore, we have
tried to build on existing EU policies and instruments where possible to avoid adding to the complexity
of navigating the broad range of support measures.
6.1 Market development
6.1.1 Description of the issue
One of the key issues for innovative, close-to-market energy technologies is the lack of a clear sales
market and revenue stream once the technology is successfully demonstrated. In the past, technologies
such as solar PV and wind energy were supported by generous support schemes (e.g. feed-in-tariffs)
which created the prospect of a profitable sales market once the technology would be commercialised.
At present, such demand-side support is still available but at much lower price levels, consistent with
the lower costs for PV and wind energy, but by far not high enough to support the market uptake of less
mature technologies such as ocean energy and airborne wind energy. And without a profitable sales
market the private sector is reluctant to invest, the technology is not deployed at scale, and the
technological developments associated with learning by doing and economies of scale are not captured.
As a result, public support for Research, Development, and Demonstration (RD&D) is the only remaining
driver for the technology’s development, leading to slower technology improvement, continued
challenges for innovators to stay in business, and ultimately lots of innovation that does not reach the
market.
Creating a profitable sales market is costly, however, and not every technology may be worth the cost.
For some technologies, the theoretical energy generation/savings potential may for instance not be
large enough (see section 3.1), while for others, Europe may not have a strong innovation ecosystem
that would support building a domestic industry, leading to a risk of subsidising mainly non-EU industry.
Furthermore, social and environmental issues may limit the attractiveness of certain technologies.
Choosing which technologies to support will therefore require a thorough assessment of the merits of
each technology, looking at a range of factors.
Overall, we conclude that RD&D support without demand-side support leads to significant, and often
insurmountable, issues to attract private capital and bring novel technologies to the market. Focusing
RD&D support on a select number of technologies and coupling it with sufficient demand support would
lead to more effective spending of RD&D budgets, more private investments and a more successful EU
innovation ecosystem overall.
6.1.2 Recommended next steps
We recommend the following steps are taken to address this issue.
Building the Investment Community for innovative energy technology projects Deliverable D5: Policy recommendations for increasing innovative energy technology investments
36
1. Assess the merits of the innovative, close-to-market energy technologies
The first step is to assess the merits of the clean energy technologies that are pioneered across Europe
but are at a cost level that is not competitive. This would include several technologies which aim to
exploit largely untapped energy resources such as ocean tides, waves, salinity gradients, thermal
gradients, high-altitude wind, sunlight at sea, etc. Furthermore, novel technologies for established
sectors such as wind and PV and potentially some energy efficiency technologies could be added.
For each energy technology, the following should be assessed:
1. Potential: The amount of energy that could be captured if the technology would be deployed
at scale and developed to perform at high efficiency (both at EU and global level);
2. Development: The current state of the technology and the development over time, indicating
how far the technology is from commercial viability and how fast the learning process has
been;
3. Knowledge: The concentration of knowledge across the world, identifying which regions are
leading in the field. Potential indicators include the amount of research funding, patents,
publications and start-ups;
4. Competitiveness: The possibility to develop a European industry that can compete globally.
Relevant features would include whether the technology would be a mass-produced product,
how knowledge-intensive manufacturing and deployment would be and if the technology would
benefit from existing EU industry strongholds.
Once these aspects have been assessed, a balanced view of the most attractive technologies for the EU
to push forward has been developed, potentially already highlighting where demand-side measures
would be appropriate.
2. Select technologies and establish partnerships with Member States
As demand-side measures are generally the mandate of Member States, the involvement of Member
State governments is crucial. Hence, we propose to select technologies in conjunction with Member
States (this might start from the SET Plan).23 The assessment in step 1 will be the main input to this
decision-making process.
3. Establish support measures
Once a selection of technologies to be supported has been made, the final step is to configure the most
appropriate set of support measures. This should be a mix of measures at EU and Member State level
and could include:
Research grants (EU/MS);
Inducement prizes (EU/MS);
Demonstration project funding (EU/MS);
Feed-in-tariffs (MS);
Scale-up financing (EU/MS);
Site selection, permitting and grid connection support24 (MS);
Dissemination of the technical and economic performance of the installed capacities25 (EU/MS)
23 The existing Member State cooperation on SET plan priorities could provide a starting point for identifying interested Member States and aligning with existing efforts to support innovation. See EC (2016) – Transforming the European Energy System through Innovation – Integrated SET Plan Progress in 2016. 24 The support for Dutch offshore wind farms would be a best practice on how to support innovation through assistance with site selection, permitting and grid connection.
Building the Investment Community for innovative energy technology projects Deliverable D5: Policy recommendations for increasing innovative energy technology investments
37
It should be stressed that most of these support measures should be technology-specific (e.g. a feed-in-
tariff for wave energy).
6.2 Mechanism to navigate EU support
6.2.1 Description of the issue
As outlined in chapter 5, the EU supports clean energy innovators through various instruments.
However, EU innovators are generally not aware of a large part of the available instruments and find it
challenging to get an overview of the instruments they would be eligible for, thereby limiting the
effectiveness of the instruments.26 Taking into account that there are also a range of support
instruments at Member State level, the task of identifying the appropriate support measures to apply
for becomes very time consuming for innovators, at the expense of time used to develop their
company.
A compounding factor is the complexity of applying successfully for the funding instruments. Some
innovators judge the application procedures too complex in itself, requiring consultancy support to
apply. Others consider the application procedures simple enough but stressed that they still needed a
consultant to help them apply successfully, as the consultant’s experience in drafting a successful
application proved to be crucial. Overall, this leads to wasted time and effort from the innovator and
leakage of funds to consultants.
Finally, the success rates of the different instruments are not very clear. Innovators need to weigh the
time and money spent for applying versus the potential funds raised but are not able to do this without
knowing what share of applications are successful. For some instruments, numbers on success rates are
available if you know where to find them, but this is often not easy.
6.2.2 Recommended next steps
We recommend the following steps are taken to address this issue.
1. Determine responsible entity
The first step is to select the best placed entity for taking the responsibility to assist innovators in
navigating the funding options. Various entities already provide such support to innovators. Examples
include:
the European Investment Advisory Hub, which has an online tool to find relevant support and
provides tailored support for individual project promoters;27
the European Innovation Council, which also provides a tool to navigate different funding
options;28
C-Energy 2020, a Horizon 2020 Coordination and Support Action, which provides an overview
of the current EU funding opportunities;29
25 The early support for wind energy in Denmark required publishing technical performance and revenue data, which helped identifying the best wind turbines and created investor confidence in the technology. 26 The interviewees for this report were familiar with less than half of the instruments described in this report. Furthermore, various innovators participating at our match-making events were not familiar with InnovFin EDP and only encountered the option following a presentation from the EIB at these events. 27 See http://eiah.eib.org/find-support/index 28 See https://ec.europa.eu/research/eic/index.cfm?pg=funding 29 http://www.c-energy2020.eu/
Building the Investment Community for innovative energy technology projects Deliverable D5: Policy recommendations for increasing innovative energy technology investments
38
The Access to finance tool available on the Europa website, which provides an overview of
the EU supported loans and venture capital funds available at MS level;30
The interactive tool on EU funding programmes offered by EASME.31
While each of these entities already fulfils this role partly, none link to the full range of support
measures in place and most are not focused on the energy sector specifically. Deciding which entity
should be responsible for guiding clean energy innovators would therefore be a necessary first step.
Furthermore, linkages with providers of different support measures would need to be established to
assure that updates in the instruments are communicated and processed into the tools and that the
knowledge of the support staff remains up to date.
2. Develop/improve navigation mechanism
The second step is to further develop the mechanism for navigating through the different support
measures. As mentioned earlier, several of the existing navigation tools do not link to all existing
support. Hence, the tool selected as the primary tool for clean energy innovators should be further
developed to incorporate all available support, ideally also at Member State level. Furthermore, there
may be opportunities to optimise the mix of channels to deliver the support (e.g. personal contact,
website, online tool).
3. Create awareness of navigation mechanism
The final step is to assure that the clean energy innovators are aware of the navigation mechanism. As
mentioned earlier, a large share of the innovators is not aware of the existing support measures.
Hence, a strong communication effort would be required to create awareness of the updated navigation
mechanism for this recommendation to be successful.
6.3 Closing the funding gap
6.3.1 Description of the issue
The most useful funding options for clean energy innovators at TRL 7 to 9 are those that do not require
the formation of a multi-national consortium and are able to provide amounts of funding from at least
EUR 1M up to EUR 100M. This way, the innovator is not required to set up partnerships beyond what is
required for developing its business and can attract an amount of money that is sufficient for the
demonstration of the technology in a real-life environment and at a sufficient scale. The funding
options that best meet these criteria are the:
SME instrument (part of the EIC): Indicative funding range of EUR 500K-2,5M, which could
cover up to 70% of the project costs;
InnovFin EDP: Funding from EUR 7,5M, up to 50% of the project costs.
Translated into overall project costs, the SME instrument applies to projects with a cost up to EUR3,5M,
whereas InnovFin EDP applies to projects of EUR 15M or more. Hence, a gap in the funding exists for
projects between EUR 3,5M and EUR 15M, which adds to the challenges for clean energy innovators with
funding requirements in this range.
30 https://europa.eu/youreurope/business/funding-grants/access-to-finance/ 31 https://ec.europa.eu/easme/en/easme-data-hubs
Building the Investment Community for innovative energy technology projects Deliverable D5: Policy recommendations for increasing innovative energy technology investments
39
6.3.2 Recommended next steps
We recommend the following steps are taken to address this issue.
1. Assess options for closing funding gap
The first step to implement this recommendation is to assess the pros and cons of different options to
close the funding gap. These options could differ in terms of:
The responsible entity: EIB, Commission, other
Type of funding: grant, debt, equity
Scope: clean energy only or broader
Taking into account the wide range of existing instruments, we would recommend to first assess the
possibilities to adapt the existing ones such as InnovFin EDP, the SME instrument or the Innovation Fund
that is under development. Relevant assessment criteria would include:
1. Budget: is sufficient budget available for the instrument to have a meaningful impact?
2. Transaction costs: how high are the transaction costs for the instrument? Are these
proportional to the amounts of money to be disbursed?
3. Flexibility: how flexible is the instrument’s configuration? Is it feasible to update the
requirements in the short term?
4. Capability: does the responsible entity possess the required capabilities to evaluate proposals
from clean energy innovators?
Based on the outcome of this assessment, it needs to be determined whether existing instruments can
be adapted to match the needs of (energy) innovators at TRLs 7-9 or whether additional funding options
need to be set up.
2. Select and implement preferred option
Once the different options have been assessed, the final step is to implement the required changes to
the instrument. The required steps for this will depend on the option chosen and have therefore not
been detailed.
6.4 Targeted match-making
6.4.1 Description of the issue
EU clean energy innovators are generally well connected to local investors but find it challenging to get
in contact with the larger pan-European venture capital funds and corporate investors. Even though
there is a large number of match-making events across Europe, few are effective in matching these
pan-European investors with innovators. This is often due to the agenda of these events, which
generally include keynote speakers, discussion panels and information fairs, while excluding the more
effective pre-booked bilateral meetings between investors and innovators.32 The match-making events
organised as part of this project have proven to have added value by focusing on bilateral meetings and
putting most of the effort into organising these. Hence, we recommend organising such focused match-
making events periodically, especially for clean energy innovators with sufficiently attractive market
32 For a more elaborate discussion in best practices for organising effective match-making events, see the task 1 report of this study titled ‘Improving the investment community to facilitate increased investments’.
Building the Investment Community for innovative energy technology projects Deliverable D5: Policy recommendations for increasing innovative energy technology investments
40
prospects, either in the more established technologies such as solar PV or in markets that are targeted
by the support measures proposed in our ‘Market development’ recommendation (see section 6.1).
While there was insufficient interest in a third match-making event as part of this project, because the
interested innovators had already participated in the prior events, we think that it makes sense to
organise a next event later this year. By the end of 2018, we would expect that several new innovators
are ready to meet investors and that some of the existing innovators would be interested in a next
opportunity to meet the investors.
6.4.2 Recommended next steps
We recommend the following steps are taken to address this issue.
1. Determine responsible entity
The first step is to determine the most appropriate entity for organising the match-making events. An
entity such as InnoEnergy could be suitable, as they have experience in organising these events.
However, we could also think about other entities/private companies dealing with specific match
making events.
2. Develop portfolio of innovators
The second step is to develop and periodically update a portfolio of EU clean energy innovators that are
looking for private sector investments. The starting point could be the lists of clean energy innovators
that applied (not necessarily successfully) for funding through the most relevant instruments, such as
the SME instrument and InnovFin EDP. This way, a first longlist of potentially interested innovators can
be established efficiently. These innovators would be approached to gauge their interest in
participating in the match-making process. Interested innovators then complete a template and are
included in the portfolio.
Additionally, the option to be included in the portfolio could be advertised more broadly. This way,
innovators that did not apply for one of the instruments can also apply and be included in the portfolio,
leading to a larger portfolio which is more interesting for investors.
3. Maintain network of interested investors
The third step is to develop a network of interested investors. This can build on the investor network
established through this project and could be extended building on additional investor contacts of the
Commission.
4. Organise match-making events
The final step is to organise periodic match-making events. Based on our current understanding, a
frequency of once or twice per year would be appropriate. Based on the level of interest and the rate
at which new innovators emerge, the frequency of these events could be altered.
These match-making events should incorporate the best practices identified and applied in this project:
1. Assess the level of interest of investors in the innovators in the portfolio prior to the event.
Only innovators for which some investors have shown an interest would be advised to
participate in the event.

Building the Investment Community for innovative energy technology projects Deliverable D5: Policy recommendations for increasing innovative energy technology investments
41
2. Focus the events on bilateral meetings between innovators and investors. These meetings can
be pre-booked based on the interests to meet specific innovators expressed by the investors.
Bilateral meetings have significantly more added value than pitching or information fairs.
Furthermore, the events could have a specific technological scope if there is a sufficient volume of
innovators for a specific technology.
Building the Investment Community for innovative energy technology projects Deliverable D5: Policy recommendations for increasing innovative energy technology investments
42
Annex: Summary of relevant EU instruments
Horizon 2020
Objectives
Horizon 2020 (H2020) was established in 2013 as the successor to the European Union’s previous
research and innovation funding programme, the 7th Framework Programme (FP7), and runs from 2014
to 2020. It focuses on three priorities:
1. Strengthening the EU's world-class excellence in science;
2. Fostering industrial leadership to support business, including micro, small and medium-sized
enterprises (SMEs) and innovation;
3. Tackling societal challenges, in order to respond directly to the challenges identified in the
Europe 2020 strategy33 by supporting activities covering the entire spectrum from research to
market.
The programme supports all stages in the research and innovation chain, including non-technological
and social innovation, and activities that are closer to the market34. Although the majority of its
funding is grant based, the debt and equity windows under H2020 are an important mechanism within
its Access to Risk Finance objective to drive and leverage further private investment into the RD&I
space for low carbon energy technologies. The debt and equity facilities established within H2020
specifically aim to assist companies to overcome the valley of death.
Organisational structure
H2020 is divided into 3 three pillars and 2 specific objectives that correspond to its main priorities
listed above. The budget is the responsibility of nine different directorates-general (DGs) of the EC. The
budget is implemented by 22 different bodies:
Five Commission DGs;
Four executive agencies;
Four public‐public partnerships;
Seven public‐private partnerships;
European Institute of Innovation and Technology;
European Investment Bank.
Financing
H2020’s total budget is almost EUR 80 billion for the period 2014-2020. Within its third priority, tackling
societal challenges, total funding of almost EUR 6 billion has been made available from 2014 – 2020 for
secure, clean & efficient energy alone35. The Work Programme 2018-2020 includes EUR 2.7 billion for
programmable actions addressing the four interconnected priorities flagged in the Communication
Accelerating Clean Energy Innovation (decarbonising the EU's building stock by 2050, strengthening EU
leadership in renewables, developing affordable and integrated energy storage solutions, and electro-
mobility and a more integrated urban transport system). Within this part of the work programme, it will
33 European Commission (2017). Accessed at: https://ec.europa.eu/info/business-economy-euro/economic-and-fiscal-policy-coordination/eu-economic-governance-monitoring-prevention-correction/european-semester/framework/europe-2020-strategy_en 34 European Union (2013). REGULATION (EU) No 1291/2013 OF THE EUROPEAN PARLIAMENT AND OF THE COUNCIL of 11 December 2013 establishing Horizon 2020 - the Framework Programme for Research and Innovation (2014-2020) and repealing Decision No 1982/2006/EC 35 Examples of project calls for proposals and their requirements for 2016/2017 can be viewed here: http://ec.europa.eu/research/participants/data/ref/h2020/wp/2016_2017/main/h2020-wp1617-energy_en.pdf
Building the Investment Community for innovative energy technology projects Deliverable D5: Policy recommendations for increasing innovative energy technology investments
43
bring together the SME Instrument, inducement prizes, FET-Open, and Fast Track to Innovation
instruments. These are run within the European Innovation Council Pilot and are detailed in the
relevant section below. In addition to these, H2020 funds are also used to support the InnovFin EDP and
InnovFin SME Guarantee Facility instruments, which are detailed in their own sub-section below.
Target group and criteria/requirements
H2020 targets a wide range of beneficiaries that fall within its various targets, ranging from researchers
to SMEs. A summary of the focus areas can be found in the footnote reference below.36 The criteria for
the remaining years of the programme have also been revised to increase the success rate of applicants
and reduce their actual or perceived time wastage in preparing applications that will likely fail. Such
revisions include amongst others, further targeted use of two-stage calls where appropriate as well as
clearer and better structured expected impact statements in the work programme.37
Progress
Initial call rounds revealed some challenges, in large part because of the size and complicated structure
of H2020. Specifically, potential participants found it difficult to identify the opportunities for funding
and the relevant sources of funds. The enlargement of the scope of the programme, coupled with the
proliferation of funding routes and the multiplication of potential beneficiaries, resulted in greater
fragmentation and greater competition for fewer resources amongst applicants.38 The overall success
rate of eligible full proposals under the first 100 calls was about 14% by the EC’s own accounts.39
The programme has however been streamlined in recent years, as a result of lessons learned from
H2020’s first work package. Evaluations of the work package indicated that its initiatives were better at
supporting existing technologies and companies, than start-ups that are innovating in new markets or at
the intersection between digital and physical technologies. Furthermore, support was seen as too
complex, inflexible and slow for these types of companies’ needs. Resulting changes for the 2018-2020
package therefore include:
Adopting a fully ‘bottom-up’ approach so that innovative projects that cut across
sectors/technologies become eligible for support;
Making it easier for start-ups to access financial and technical support;
Targeting market-creating, breakthrough innovations with scale-up potential.
InnovFin Energy Demonstration Projects
Objectives
InnovFin Energy Demonstration Projects was launched in 2015. It provides support to innovative
demonstration projects developing technologies at TRL 7-8 in the field of energy system
transformation, including but not limited to renewable energy technologies, smart energy systems,
energy storage, carbon capture and storage, or carbon capture and use, helping them to bridge the gap
from demonstration to commercialisation.40 The scope has been revised and now covers the four
36 http://ec.europa.eu/programmes/horizon2020/sites/horizon2020/files/stratprog_overarching_version_for_publication.pdf 37 European Commission (2017). Horizon 2020 work programme 2018-2020 - Strategic Programme Overarching Document. Accessed at: http://ec.europa.eu/programmes/horizon2020/sites/horizon2020/files/stratprog_overarching_version_for_publication.pdf 38 European Parliamentary Research Service (2015). Accessed at: http://www.europarl.europa.eu/RegData/etudes/IDAN/2015/571312/EPRS_IDA%282015%29571312_EN.pdf 39 European Commission (2015). Accessed at: https://ec.europa.eu/programmes/horizon2020/sites/horizon2020/files/horizon_2020_first_results.pdf 40 http://www.eib.org/products/blending/innovfin/products/energy-demo-projects.htm
Building the Investment Community for innovative energy technology projects Deliverable D5: Policy recommendations for increasing innovative energy technology investments
44
priorities set out in the Communication Accelerating Clean Energy Innovation mentioned above under
the H2020 section, and innovative manufacturing processes related to these.41
Organisational structure
The programme is deployed directly by the European Investment Bank (EIB) to beneficiaries.
Financing
The programme’s budget has doubled from EUR 150 million to EUR 300 million using H2020 funds and it
is now also able to channel a part of undisbursed revenues from the NER300's (described below) first
call, which will represent about EUR 456 million in additional funding. It provides loans, loan
guarantees or equity-type financing typically between EUR 7.5 million and EUR 75 million.42
Target group and criteria/requirements
Projects funded under the initiative should demonstrate the commercial viability of pre-commercial
technologies or services, or enhance the competitiveness of manufacturing processes. The specific
technologies should be innovative in relation to others in the market, and this innovation may relate to
a specific technology, processes, products or services. The innovative aspect may consist of the
innovative combination or innovative application of existing technologies.
In terms of technology readiness, the technologies are required to be at pre-commercial level or early
commercialisation stages, and the project/investment itself should be sufficiently mature for
demonstration at the proposed commercial scale with reasonable prospects of successful
demonstration. The project’s financial prospects are judged by its ability to generate sufficient
revenues to have the potential to become bankable; this requirement relates to all aspects of the
project that are relevant for future project performance and loan repayment. EIB financing is limited to
50% of the total eligible costs of the project, which include all the costs necessary for the successful
demonstration of the technology, service, manufacturing or business process. Finally, promoters,
sponsors and/or operators must be willing to substantially co-fund the project, and the project should
have the potential to be replicated elsewhere with convincing market opportunities and prospects for
future cost reductions. Manufacturing plants and services do not however necessarily need to comply
with this last requirement.43
Progress
The first project loan in 2016 was EUR 10 million for AW-Energy, a wave energy technology company,
and its WaveRoller project. In January 2018, Oxford PV was awarded EUR 15 million to commercialise
its perovskite solar PV technology.44 In February 2018, the Board of Directors approved Northvolt AB
project, which is a demonstration project for a large-scale Li-ion battery manufacturing plant for
applications in the automotive, ESS (Energy Stationary Storage) and industrial segments.45 To our
knowledge, these were the only projects financed at the time of writing.
41 European Commission (2017). Progress in Accelerating Clean Energy Innovation. 42 EIB (2018). Accessed at: http://www.eib.org/products/blending/innovfin/products/energy-demo-projects.htm 43 Ibid 44 Pratt, D. 2018. “European Investment Bank awards €15 million to commercialise Oxford PV’s perovskite technology.” PV-Tech. Accessed at: https://www.pv-tech.org/news/european-investment-bank-awards-15-million-to-commercialise-oxford-pvs-pero 45 EIB (2018). Accessed at: http://www.eib.org/projects/pipelines/pipeline/20170637
Building the Investment Community for innovative energy technology projects Deliverable D5: Policy recommendations for increasing innovative energy technology investments
45
InnovFin SME Guarantee Facility
Objectives
The InnovFin SME Guarantee is a guarantee or counter-guarantee on debt financing issued by the
European Investment Fund (EIF) to financial intermediaries in order to improve access to finance for
innovative Small and Medium-sized Enterprises (SMEs) and Small Mid-caps (enterprises with up to 499
employees). This creates more favourable financing terms for such companies. The instrument builds on
the success of the pilot Risk-Sharing Instrument (RSI) developed under FP7 and is part of the “InnovFin -
EU Finance for Innovators” programme; a joint initiative between the EIB and EC under Horizon 2020.
The EIF encourages financial intermediaries to extend new debt financing to innovative enterprises on
more attractive terms as a result of the reduced credit risk and lower capital consumption achieved
through the guarantee.46 It is not clear what proportion of this is targeted towards the clean energy
sector specifically.
Organisation / Organisational structure
The EIF acts as the agent providing guarantees or counter-guarantees to selected financial
intermediaries, who in turn provide finance to SMEs and Small Mid-Caps.
Financing/sources of funding
The funds for the guarantee are derived from the EC and EIB. The guarantee covers up to 50% of the
loss on each new eligible loan, bond or lease that is originated - typically during a two-year period. The
guarantee amount is up to EUR 200 million per intermediary and up to EUR 500 million for an
intermediary group. With a 50% guarantee rate, this means a maximum portfolio volume of up to EUR
400 million of financing per intermediary, and up to EUR 1 billion for an intermediary group.47
Target group and criteria/requirements
The target group includes financial intermediaries operating in the EU-28 Member States as well as the
Horizon 2020 Associated Countries. Target end beneficiaries are SMEs that: 1) are investing in the
production or development of innovative products, processes and/or services that present a risk of
technological or industrial failure; 2) are “fast growing enterprises”;48 3) have significant innovation
potential or are R&I-intensive enterprises as defined by the EIF list of detailed criteria.
Progress
By September 2017, EUR 5,6bn had been provided in guarantees (counter-guarantees included), which
had raised an expected EUR 11,4bn for SMEs and small Mid-Caps,49 but it is not clear how much (if any)
of this was specifically for clean energy investments.
InnoEnergy
The European Institute of Innovation and Technology (EIT) InnoEnergy was designated as a Knowledge
and Innovation Community (KIC) in 2009 and tasked with sustainable energy as its priority area. Its
mission is to build a sustainable long-lasting operational framework amongst the three actors of the
46 EIF (2014). Accessed at: http://www.eif.org/news_centre/publications/eif_flyer_innovfin_sme_guarantee_en.pdf 47 Ibid 48 Fast growing defined as workforce or turnover increase by at least 20% p.a. over the last 3 years 49 EIF (2019). Accessed at: http://www.eif.org/what_we_do/guarantees/single_eu_debt_instrument/innovfin-guarantee-facility/report-quarterly-innovfin-smeg-implementation-status.pdf
Building the Investment Community for innovative energy technology projects Deliverable D5: Policy recommendations for increasing innovative energy technology investments
46
knowledge triangle in the energy sector: industry, research and higher education, and ensure that this
integration of the three is more efficient and has a higher impact on innovation than the three standing
alone. The technologies that it supports are: energy storage, energy efficiency, energy from chemical
fuels, renewable energies, smart and efficient buildings and cities, clean coal and gas and finally
sustainable nuclear and renewable convergence.
Organisation / Organisational structure
EIT InnoEnergy is one of the Knowledge and Innovation Communities under the purview of the European
Institute of Innovation and Technology (EIT). The EIT itself is an independent EU body whose purpose is
to enhance Europe’s ability to innovate by nurturing entrepreneurial talent and support new ideas. EIT
InnoEnergy is a public-private partnership with 29 shareholders, including universities and academic,
research centres, and a variety of industries like utilities and industrial and technology multinationals.
By offering a level playing field to actors from academia, small companies, and corporates, EIT
InnoEnergy has created an energy innovation eco-system which includes players from all the energy
value chain.
Financing/sources of funding
From 2010 up to and including 2017, EIT InnoEnergy received EUR 374M from the EIT. However, it has to
be kept in mind that the regulation creating EIT states that the KICs shall “ensure sustainable and long-
term self-supporting financing including a substantial and increasing contribution from the private
sector, industry and services”. That means that EIT InnoEnergy has to become financially independent
from one single source of revenue (but this does not necessarily mean a complete end of EIT funding).
To this end, EIT InnoEnergy draws upon contributions from its member constituency, which valorises the
eco-system created over the last 8 years. Other revenue streams for financial sustainability include
kick-backs from co-investments in the development of new products/services (revenues forecasted by
the commercializing partners total EUR 9bn in 7 years) as well as the support services provided to
entrepreneurs and start-ups (the portfolio of currently more than 110 start-ups in which EIT InnoEnergy
has an equity stake is today valued at EUR 125m). The kick-back can take different forms like equity or
revenue sharing. The products/services that InnoEnergy invests in are not sold by InnoEnergy, but by a
so-called commercializing partner. InnoEnergy concludes an ROI50 agreement with the commercializing
partner, which guarantees them a financial return, usually based on revenue sharing. The revenues
forecasted is the total sum of the revenues forecasted by the commercializing partners (not
InnoEnergy) from the sale of all the products/services where InnoEnergy co-invested within the next 7
years. In its education business line, EIT InnoEnergy has also recently moved away from offering
subsidized master programmes to a value-pricing model. All profits made through EIT InnoEnergy have
to be re-invested; no dividends are paid out to shareholders.
Target group and criteria/requirements
EIT InnoEnergy provides offers to entrepreneurs, early-stage ventures, start-ups, (high growth) SMEs, as
well as major corporates. The offer is never a purely financial one, but a smart investment, facilitating
to achieve the purpose for which money is needed (it is not a means in itself). EIT InnoEnergy provides
access to a pool of complementary skills and resources and connects businesses to markets and
commercial opportunities across Europe.
50 ROI: Return on Investment
Building the Investment Community for innovative energy technology projects Deliverable D5: Policy recommendations for increasing innovative energy technology investments
47
A major line of investment is in Innovation Projects, where European consortia are supported to bring
products/services to the market within less than five years. Proof of concept (pilot or type test
validation) should have already been carried out, corresponding to a Technology Readiness Level
greater or equal to five (TRL >= 5). To ensure market uptake, the company commercialising the product
or service must be involved in the project from the beginning51. A key benefit for consortia is the time-
to-grant.
In its HighWay program, EIT InnoEnergy provides support to entrepreneurs and early-stage ventures
along the lines of finance, team, market, and technology52. To date, EIT InnoEnergy has supported close
to 200 ventures through its HighWay service offer. In its BoostWay offer, this is complemented with two
additional dimensions, manufacturing/design-to-cost and international sales growth in EU and US.
Progress
InnoEnergy is a catalyst for crowding in. With respect to leveraging investments, the following progress
can be stated for EIT InnoEnergy:
Through its Innovation Projects, EIT InnoEnergy has invested EUR170,5m – a co-investment into
the total project volume of EUR1,4bn53.
EIT InnoEnergy has built a community of twelve large European Cleantech funds which
together manage over EUR 2 billion in equity.
Start-ups supported by InnoEnergy have raised more than EUR 90m external investment and –
more importantly – realized EUR42m in revenues. This includes Skeleton Technologies of
Estonia, which unlocked an initial investment of EUR 4m to develop the world’s most advanced
supercapacitors – a high power energy storage technology54. The company has since used this
start to scale up its ventures.
New Entrant Reserve (NER) 300 and the proposed new Innovation Fund
Objectives
The NER 300 was established in 2010 and was conceived as a catalyst for the demonstration of
environmentally safe carbon capture and storage (CCS) and innovative renewable energy (RES)
technologies on a commercial scale within the European Union. The programme’s name was derived
from its funding structure, since it is funded from the sale of 300 million emission allowances from the
NER set up for the third phase of the EU emissions trading system (EU ETS). The last call for proposals
was in 2014, but it is mentioned here as a key instrument that was used and that could inform the
establishment of the new Innovation Fund.
Organisation / Organisational structure
The EIB acted as the implementing entity responsible for project selection, the monetisation of
allowances and the management of revenues. DG CLIMA of the EC was responsible for implementing the
EU ETS which provided the funds for the programme.
51 EIT InnoEnergy (2017). Application criteria. Accessed at: https://investmentround.innoenergy.com/aplicationcriteria.html 52 KIC InnoEnergy (2018). Accessed at: http://www.innoenergy.com/bcs/innoenergy-highway/our-offer/ 53 EIT (2017). EIT InnoEnergy. Accessed at: https://investmentround.innoenergy.com/home.html 54 Investorsmag (2017). Accessed at: https://www.innovatorsmag.com/innoenergy-link-spurs-skeleton-growth/
Building the Investment Community for innovative energy technology projects Deliverable D5: Policy recommendations for increasing innovative energy technology investments
48
Financing/sources of funding
The funds from the sale of the 300 million emission allowances were to be distributed to projects
selected through two rounds of calls for proposals, covering 200 and 100 million allowances
respectively. The allowances were transferred to the EIB. A financial award allocated to winning
projects was a maximum amount dependent on the assumed avoided CO2 emissions from each project.
Final disbursement was based on operational performance of projects and awards were dependent on
the verified avoidance of CO2 emissions.
Under the first call for proposals the EC made funding awards for a total value of EUR 1.1 billion to 23
renewable energy projects. Under the second award decision in July 2014, the EC awarded a total of
EUR 1 billion in funding to 19 renewable energy projects and one carbon capture and storage project.55
It should be noted however that awards did not necessarily mean that projects would be realised. Out
of the 42 projects awarded to date, only 3 were realised. A final decision on other pending approvals
will be reached in June 2018.56
Target group and criteria/requirements
The programme supported a wide range of CCS technologies (pre-combustion, post-combustion,
oxyfuel, and industrial applications), and RES technologies (bioenergy, concentrated solar power,
photovoltaics, geothermal, wind, ocean, hydropower, and smart grids). NER 300 also sought to leverage
a considerable amount of private investment and/or national co-funding across the EU, boost the
deployment of innovative low-carbon technologies and stimulate the creation of jobs in those
technologies within the EU.57
Eligible beneficiaries for NER 300 funds were technology sponsors, engineering companies, and energy
utilities. Industrials/manufacturers will be eligible for the future Innovation Fund as well. The projects
funded were intended to be at a TRL of 7 or 8. Other specific eligibility rules are that the projects
applying for funds must:
1. Break new technological ground, i.e. by demonstrating a novel solution to a technological
challenge at a relevant scale;
2. Be on the cusp of “commercial” deployment and free of any financial obstacles, i.e. once the
NER 300 project has ended there should be no requirement for further public subsidy (beyond
any market incentives/subsidies such as feed-in tariffs);
3. Either produce energy or facilitate its integration into the grid (such as “smart grid”
applications);
4. Provide proof of “additionality” of funding needs (i.e. projects must provide evidence in their
applications that they could not have been realised without the availability of public funding);
5. Provide a degree of knowledge sharing to help disseminate the findings of the project.58
55 European Commission (2018). Accessed at: https://ec.europa.eu/clima/policies/lowcarbon/ner300_en 56 Ahman, M.; Skjærseth, J.B.; Eikeland, P.O. (2018). Demonstrating climate mitigation technologies: An early assessment of the NER 300 programme. Energy Policy 117, pp 100-107. 57 European Commission (2010). 2010/670/EU: Commission Decision of 3 November 2010 laying down criteria and measures for the financing of commercial demonstration projects that aim at the environmentally safe capture and geological storage of CO 2 as well as demonstration projects of innovative renewable energy technologies under the scheme for greenhouse gas emission allowance trading within the Community established by Directive 2003/87/EC of the European Parliament and of the Council (notified under document C(2010) 7499) 58 European Commission (2016). Innovative Financial Instruments for First-of-a-Kind, commercial-scale demonstration projects in the field of Energy.
Building the Investment Community for innovative energy technology projects Deliverable D5: Policy recommendations for increasing innovative energy technology investments
49
Progress
According to its intended objectives, the NER 300 did not fully deliver on these. No CCS projects have
been funded, but rather the programme ultimately funded a variety of smaller-scale and technically
less mature innovative renewable technologies.59 The NER 300 calls did not reach the intended results
for two key reasons; namely that the eligibility criteria were seen as too strict for many applicants and
the value of the fund depended on the price of carbon credits – which did not perform as expected.60
The EC has proposed reinvesting unspent funds from the first NER 300 call through existing EU financial
instruments. The instruments expected to be used for this exercise are InnovFin Energy Demonstration
Projects (EDP) and Connecting Europe Facility (CEF) Debt. The former can finance projects including
but not limited to innovative renewable energy, CCS, smart energy systems and storage; the latter the
use of renewables in the transport sector. Both are managed by the European Investment Bank.
The Start-up and Scale-up Initiative
Objectives
The Initiative was launched in 2016 and brings together a range of existing and new actions to create a
more coherent framework to allow start-ups to grow and do business across Europe. It focuses on three
key areas in particular:
1. Improved access to finance;61
2. Second chance for entrepreneurs whose businesses failed in the past;62
3. Simpler tax filings.63 64
The Initiative also puts emphasis on helping to navigate regulatory requirements, improving innovation
support through reforms to H2020, and fostering ecosystems where start-ups can connect with potential
partners such as investors, business partners, universities, and research centres.
Organisation / Organisational structure
The initiative is headed by the EC. The financial support component is implemented by the EIF, and
other support mechanisms for start-ups on the other two focus areas are implemented by other EU
programmes such as the Enterprise Europe Network, which provides advisory services to companies.65
Financing/sources of funding
Associated support programmes are financed by the EC, but it is not evident how much of this is
directly for the initiative. Direct financing through the initiative for the first objective listed above is
provided by the EC and EIB through the Pan-European Venture Capital Fund of Funds. The EU provides
cornerstone investments up to a maximum budget of EUR 300 million and the fund manager(s) must
raise at least three times as much from private sources, triggering a minimum of €1.6bn in venture
capital funding. It is managed by one or more professional and experienced fund managers ensuring a
59 Ahman, M.; Skjærseth, J.B.; Eikeland, P.O. (2018). Demonstrating climate mitigation technologies: An early assessment of the NER 300 programme. Energy Policy 117, pp 100-107. 60 Teffer, P. (2017). “After spending €587 million, EU has zero CO2 storage plants”. EU Observer. Accessed at: https://euobserver.com/investigations/139257 61 More information on improved access to finance available here: http://ec.europa.eu/DocsRoom/documents/20221 62 More information on second chance for entrepreneurs available here: http://ec.europa.eu/information_society/newsroom/image/document/2016-48/eu_factsheet_40047.pdf 63 European Commission (2016). Accessed at: http://europa.eu/rapid/press-release_IP-16-3882_en.htm 64 European Commission (2016). COM(2016) 733 final. Europe's next leaders: the Start-up and Scale-up Initiative 65 EC (2016). Accessed at: http://eur-lex.europa.eu/legal-content/EN/TXT/?uri=COM:2016:733:FIN
Building the Investment Community for innovative energy technology projects Deliverable D5: Policy recommendations for increasing innovative energy technology investments
50
real market approach. Resources for this come from the Horizon 2020 InnovFin Equity facility, EFSI
Equity Instrument, COSME Equity Facility for Growth, and EIF’s own resources.
Target group and criteria/requirements
The initiative does not place any special focus on clean energy technologies or TRL, but the broad
scope and support to start-up companies makes it an additional potential policy instrument to support
clean energy technology companies.
Progress
The initiative is still fairly new. As such, no clear results have been published on its progress to date.
European Innovation Council
Objectives
The European Innovation Council (EIC) pilot was introduced in the H2020 2018-2020 Work Programme. It
aims to support top-class innovators, start-ups, small companies and researchers’ ideas that are
radically different from existing products, services or business models. They further have to have a high
risk profile, and the potential to scale up internationally.66
Organisation / Organisational structure:
The EIC is supported by the EC under the H2020 programme.
Financing, target groups, and criteria
The EIC has a budget of EUR 2.7 billion dedicated to support radically new breakthrough products,
services, processes, or business models with high potential for growth in any topic, including low-
carbon energy. It is not clear exactly what proportion of this is dedicated to clean energy specifically.
Support is provided across four instruments:
1. The SME instrument: This instrument has EUR 1.6 billion in funding over the period 2018-2020 to
support ground-breaking innovative ideas for products, services, or processes. It is available to
SMEs only, and offers phased, progressive, and complementary support to the development of out-
of-the-box ideas.67 There are no predefined topics for the SME instrument call, but it does provide
the following types of support:
Business innovation grants for feasibility assessment purposes (optional phase I): EUR
50,000 (lump sum) per project (70% of total cost of the project);
Business innovation grants for innovation development & demonstration purposes (possible
phase II): an amount in the indicative range of EUR 500,000 and 2,5 million (70% of total
cost of the project as a general rule);
Free-of-charge business coaching (optional) in order to support and enhance the firm’s
innovation capacity and help align the project to strategic business needs;
Access to a wide range of other business acceleration services and facilitated access to
risk finance, to facilitate the commercial exploitation of the innovation.68
66 European Commission (2017). Accessed at: https://ec.europa.eu/programmes/horizon2020/en/h2020-section/european-innovation-council-eic-pilot 67 More information about eligibility criteria found here: https://ec.europa.eu/easme/sites/easme-site/files/horizon_2020_work_programme_eic_pilot_2018-2020.pdf 68 European Commission (2017). Accessed at: http://ec.europa.eu/programmes/horizon2020/en/h2020-section/sme-instrument
Building the Investment Community for innovative energy technology projects Deliverable D5: Policy recommendations for increasing innovative energy technology investments
51
2. Fast Track to Innovation (FTI): This instrument has a total budget of EUR 300 million. It provides
funding for bottom-up proposals for close-to-market innovation activities in any area of technology
or application. This thematic openness – combined with the possibility for all kinds of innovation
actors to work together and deliver innovation onto the market and/or into society – is set to
nurture trans-disciplinary and cross-sectoral cooperation. The FTI's aim is to reduce time from idea
to market; stimulate the participation of first-time applicants to EU research and innovation
funding; and increase private sector investment in research and innovation. Participation
requirements are:
Proposals for funding must be submitted by consortia comprising between three and five
legal entities established in at least three different EU Member States or countries
associated to H2020. Actions are to be ‘business-driven’ because they are intended to give
breakthrough innovation ideas the last push before shaking up the market. Substantial
industry involvement in FTI actions is mandatory to ensure quick market take-up (‘quick’
meaning within a three-year period after the start of the FTI-action). This industry
involvement implies:
i. either the allocation of at least 60% of the budget to industry participants in the
consortium, or;
ii. the presence of a minimum number of two industry participants in a consortium
of three or four partners, or of three industry participants in a consortium of five
partners.
3. Future and Emerging Technologies (FET) Open: FET Open has a total budget of around EUR 700
million for 2018-2020. This supports the early-stages of the science and technology research and
innovation around new ideas towards radically new future technologies. It also funds coordination
and support actions for such high-risk forward-looking research to prosper in Europe, and FET
Innovation Launchpad Actions aiming at turning results from FET-funded projects into genuine
societal or economic innovations. While no strict criteria in terms of TRL or other criteria are
defined, the following are used as reference for successful applications,69
Long-term vision;
Breakthrough scientific and technological target;
Novelty;
Foundational;
High-risk;
Interdisciplinarity.
4. EIC Horizon Prizes: In line with the EIC goal of developing and supporting breakthrough innovations,
a set of flagship inducement prizes (EIC Horizon Prizes) have been included in the Horizon Work
Programme 2018-2020, among which two address clean energy innovation:
Innovative Batteries for eVehicles (EUR 10 million): The challenge is to develop a battery
for e-vehicles that enables the same or better performance than current gasoline or
diesel-powered vehicles with internal combustion engines, based on abundant and
sustainable materials available in Europe;
69 European Commission (2016). What it takes to succeed in FET-Open. Accessed at: https://ec.europa.eu/digital-single-market/en/blog/what-it-takes-succeed-fet-open
Building the Investment Community for innovative energy technology projects Deliverable D5: Policy recommendations for increasing innovative energy technology investments
52
Fuel from the Sun: Artificial Photosynthesis (EUR 5 million): The challenge is to build a
working bench-scale prototype artificial photosynthesis device that is able to produce a
synthetic liquid fuel.
Progress
One of the early success stories to emerge from support by the SME Instrument is Heliovis, an Austrian
firm that received a EUR 1,8m grant through the SME Instrument in November 2015. The company’s
"HELIOtube" technology (an inflatable solar thermal collector) has received numerous awards and has
generated keen interest in Europe and abroad.70
Key changes as a result of previous lessons learned during Horizon 2020 implementation to 2017 are
that the pilot will bring together the four different support schemes detailed above into a single place
and make them easier to understand and access for innovators. In particular for SMEs, the Horizon 2020
SME Instrument will now be fully “bottom up” for the first time, so that innovative proposals can be
submitted in any area of the technology or business sector. The EC will also have face to face
interviews as part of the independent expert evaluation of proposals, giving a more holistic evaluation
of proposals and the innovators submitting them.71
European Fund for Strategic Investments (EFSI)
Objectives
The EIB Group, comprised of the EIB and EIF, jointly launched the EFSI initiative to close the current
investment gap in the EU. It is one of the three pillars of the Investment Plan for Europe aiming to
stimulate investments in strategic projects around the EU to ensure that money reaches the real
economy. In addition to providing finance, EFSI also provides technical assistance through its Advisory
Hub and offers a free matching platform for innovators and investors through its Project Portal. Both
are discussed in separate sections following this section.
Organisation / Organisational structure
EFSI is implemented by the EIB Group, and projects supported by it are subject to usual EIB procedures.
Financing/sources of funding
EFSI is a EUR 16 billion guarantee from the EU budget, complemented by an additional EUR 5 billion of
the EIB’s own capital. This total of EUR 21 billion aims to unlock additional investment of at least EUR
315bn by 2018, and EUR 500bn by 20207273.
Target group and criteria/requirements
Entities from the following categories can apply for funding74:
Public and private sector entities;
Banks, national promotional banks, and other financial institutions;
70 European Commission (2017). Accessed at: https://ec.europa.eu/easme/en/news/sme-instrument-funded-heliovis-builds-worlds-largest-plastic-films-solar-collector 71 European Commission (2017). Accessed at: https://ec.europa.eu/programmes/horizon2020/sites/horizon2020/files/eic_pilot_factsheet_2018-2020_0.pdf 72 European Commission (2017). Accessed at: http://europa.eu/rapid/press-release_IP-17-5169_en.htm 73 EIB. (2018). Accessed at: http://www.eib.org/efsi/what-is-efsi/index.htm 74 For more information on each of the categories please see: http://www.eib.org/efsi/how-does-a-project-get-efsi-financing/index.htm
Building the Investment Community for innovative energy technology projects Deliverable D5: Policy recommendations for increasing innovative energy technology investments
53
Funds and any other form of collective investment vehicles;
Investment platforms.
Funding is provided for economically viable projects, especially for projects with a higher risk profile
than usually taken on by the EIB. Projects within the following categories are funded:
Strategic infrastructure including digital, transport and energy;
Education, research, development and innovation;
Renewable energy and resource efficiency;
Support for small and mid-sized businesses.
In addition to undergoing the standard EIB due diligence processes for applicants, projects need to
make sure that they are:
Economically and technically sound;
In at least one of the EFSI eligible sectors as defined in Article 9 of the EFSI Regulation;
Contributing to EU objectives, including sustainable growth and employment;
Mature enough to be bankable;
Priced in a manner commensurate with the risk taken.75
Companies applying for funds under the EIB’s Growth Finance initiative may also be supported by EFSI.
In such cases, they should meet the following criteria:
Have less than 3 000 full-time employees at the time of application;
Should have raised already one or more rounds of financing with financial or strategic
investors;
Should be able to demonstrate sound corporate governance, viable business plans, and
sustainable capital structures.76
Within the energy sector focus, the following requirements are of particular interest for the purposes of
this study:
Expansion of the use or supply of renewable energy;
Energy efficiency and energy savings (with a focus on reducing demand through demand-side
management and the refurbishment of buildings);
Development and modernisation of energy infrastructure (in particular interconnections, smart
grids at distribution level, energy storage, and synchronisation of networks).77
Progress
The EFSI has already helped create 300,000 jobs. As of 2017, EUR 51.3bn in financing had been
approved, of which EUR 37.6bn had also been signed, resulting in EUR 256.9bn in investments. Of the
approved operations, 20% of the investment volumes went to energy; 22% went to RDI, but it is not
clear whether or how much of this went to RDI for clean energy technologies in particular78. Following
its apparent success, it has been extended to 2020. Based on lessons learned since the fund’s inception,
its investment decisions have been adjusted to be more transparent, and more technical support is
75 EIB (2017). Accessed at: http://www.eib.org/efsi/efsi-projects/index.htm?c=&se=3 76 EIB. (2018). Accessed at:http://www.eib.org/products/sheets/growth-finance-features.htm 77 European Commission (2015). Regulation (EU) 2015/1017 of the European Parliament and of the Council of 25 June 2015 on the European Fund for Strategic Investments, the European Investment Advisory Hub and the European Investment Project Portal and amending Regulations (EU) No 1291/2013 and (EU) No 1316/2013 — the European Fund for Strategic Investments) 78 EIB. (2017). Accessed at: http://www.eib.org/attachments/thematic/efsi_in_2017_en.pdf?f=search&media=search
Building the Investment Community for innovative energy technology projects Deliverable D5: Policy recommendations for increasing innovative energy technology investments
54
provided at the local level. At least 40% of EFSI infrastructure and innovation projects will now also aim
to contribute to climate action in line with the Paris Agreement. Finally, the extended EFSI will
increase the proportion of the guarantee for SMEs from 26% to 40%.79
The European Investment Project Portal
Objectives
The European Investment Project Portal (EIPP) is a free web portal launched in 2016 that is meant to
enable EU-based project promoters – public or private – to reach potential investors worldwide.
Organisation / Organisational structure
EIPP is hosted by the European Commission. It is “part of the Investment Plan for Europe initiative to
mobilise investment, promote economic growth and create more jobs across the EU”.80 The Portal
recently teamed up with SOURCE, a global online platform for infrastructure projects preparation,
developed and funded by Multilateral Development Banks (MDBs), to expand their reach to both project
promoters and financiers. The two platforms will also cooperate on technical issues and joint outreach
campaigns and workshops.
Financing/sources of funding
The EIPP is supported by the EC budget. It does not provide direct financing to companies or projects.
Target group and criteria/requirements
Six industry sectors are supported by the platform of which the Energy Union sector is one. The scope
therein includes renewable energy production, conventional energy production, energy efficiency,
electricity infrastructure, gas infrastructure, fuel extraction and refining, and energy R&D. In order to
be eligible for publication on the portal, projects should meet the following criteria:
Have a total cost of at least EUR 1 million;
Be in one of the pre-determined high economic value-added sectors;
Be expected to start within three years of submission (or shall have started already);
Be promoted by a public or private legal entity established in an EU Member State;
Be compatible with all applicable EU and national laws.81
No clear guidance is provided in terms of projects’ required TRL.
Progress
Currently almost 200 projects are already published on it, covering over 25 high-economic-potential
sectors. Of these, 59 currently correspond to the Energy Union. It is unclear at this stage how many
matches have been made however.
European Investment Advisory Hub (EIAH)
Objectives
The European Investment Advisory Hub (EIAH) is one of the components of the Investment Plan for
Europe (the so-called “Juncker Plan”), besides the EFSI and the EIPP (described in the sections above).
79 European Commission (2017). Accessed at: http://europa.eu/rapid/press-release_IP-17-5169_en.htm 80 EC. (2017). Accessed at: https://ec.europa.eu/eipp/myeipp/public/files/EIPP_Factsheet.pdf 81 European Commission (2017). EIPP in a nutshell. Accessed at: https://ec.europa.eu/eipp/desktop/en/index.html
Building the Investment Community for innovative energy technology projects Deliverable D5: Policy recommendations for increasing innovative energy technology investments
55
It acts as a platform for project promoters and investors who are looking to obtain funding or invest in
innovative technologies. The EIAH provides the following services in addition to others already on offer
within the Investment Plan for Europe:
1. Provides a single point of entry for technical assistance for authorities and project promoters;
2. Assists project promoters, where appropriate, in developing their projects so that they fulfil
the eligibility criteria set out in Article 6 of the regulation that established the Hub;82
3. Leverages local knowledge to facilitate EFSI support across the Union;
4. Provides a platform for peer-to-peer exchange and sharing of know-how regarding project
development;
5. Provides advice on the establishment of investment platforms.
Under the newly launched EFSI 2.0, its role will be further enhanced, focussing on actively contributing
to the sectoral and geographical diversification of the EFSI. It will also support the European Investment
Bank and national promotional banks or institutions in originating and developing operations, in
particular in less-developed and transition regions and help to structure demand for EFSI support,
where necessary. The EIAH will pay particular attention to supporting the preparation of projects
involving two or more Member States and to projects that contribute to achieving the objectives of
COP21. It will also contribute to the establishment of investment platforms and provide advice on the
combination of other sources of EU funding with the EFSI to a greater extent.
Organisation / Organisational structure
The EIAH is a partnership between the EIB Group and the EC. Both institutions contribute financially to
the initiative, while the EIB Group is responsible for its management.
Financing/sources of funding
The EU budget contributes up to a maximum of EUR 20m annually towards covering the costs of EIAH
operations until 31 December 2020. It is unclear what percentage of this is dedicated to clean energy
related project support. In addition to this budget, the EIB Group also charges fees for the provision of
certain services to private companies to finance these. Fees charged to SMEs however are capped at
one third of the cost of the technical assistance provided to them. EIAH services provided to public
project promoters in addition to those already available under Union programmes are free of charge.83
Target group and criteria/requirements
The EIAH receives requests from a large variety of entities, including public authorities (Member State
or regional level), public and private companies and individual project promoters. The projects may
request technical or financial advisory support for investments in sectors that contribute to the public
good such as energy, transport, digital economy, circular economy, water and waste management, and
urban and regional development. Innovation is a cross-cutting ‘sector’ that can apply across a number
of traditional public investment sectors, notably energy and transport, as well as being a relevant
sector in its own right. Often projects that have an innovation focus are seeking financial advisory
services to enhance their access to finance rather than technical assistance when they approach EIAH
for assistance.
82 See http://eur-lex.europa.eu/legal-content/EN/TXT/?uri=uriserv:OJ.L_.2015.169.01.0001.01.ENG for more details on this 83 European Commission (2015). REGULATION (EU) 2015/1017 OF THE EUROPEAN PARLIAMENT AND OF THE COUNCIL of 25 June 2015 on the European Fund for Strategic Investments, the European Investment Advisory Hub and the European Investment Project Portal and amending Regulations (EU) No 1291/2013 and (EU) No 1316/2013 — the European Fund for Strategic Investments. Accessed at: http://eur-lex.europa.eu/legal-content/EN/TXT/?uri=uriserv:OJ.L_.2015.169.01.0001.01.ENG
Building the Investment Community for innovative energy technology projects Deliverable D5: Policy recommendations for increasing innovative energy technology investments
56
Application criteria are judged on a per-request basis by the Hub, but some key requirements have
been gleaned from research and interviews. Implementation of the project or business proposal in
question should fulfil EU priorities in order to receive financial advisory support through EIAH. In
addition to this, they should meet certain threshold levels of investment needs (e.g. projects should
generally have a project volume of at least EUR 15 million), and the project or proposal should be
mature with a relatively strong balance sheet and have indications of commercial interest or investor
interest if the capital markets of the relevant Member State are sufficiently mature.
Progress
To date the EIAH has received over 700 requests for support/services, with almost 600 being project-
related. About 20% of these are related to the energy sector, but no statistics exist on the proportion
related specifically to the clean energy sector.
Regardless of whether EIAH is ultimately able to offer advisory services directly, each request receives
serious attention to identifying its project advisory needs and assisting the project promoter to advance
the preparation of the project or develop a business plan. In many cases, EIAH acts as an internal
champion for a project proposal, introducing it to relevant areas of the EIB (both lending and technical
experts) to find the right package of advisory services to accelerate project preparation and enhance
access to finance. Notably this entails access to EU financial support such as through EFSI, or InnovFin
products such as the First of a Kind EDP.


Trinomics B.V.
Westersingel 32A
3014 GS Rotterdam
the Netherlands
T +31 (0) 10 3414 592
www.trinomics.eu
KvK n°: 56028016
VAT n°: NL8519.48.662.B01