Embed Size (px)
Citation preview

Clarity Report Designer
3
10. Click OK.
11. Press CTRL + S and save the report under the name MyCrosstab.CLR.
Note: Setting up the period short names in the format Year/Month is helpful for sorting and grouping by period. Example: November 2007 = 2007/11 April 2006 = 2006/04 March 1995 = 1995/03
12. If you go to the Preview tab now, a blank page is displayed because no values have been assigned to the Crosstab.
Task 3: Design the Crosstab
1. Return to the design workspace details tab, right-click over the Crosstab, and select Configure again.
2. Drag the Sales Value field over the new value cell. When the indicators appear, drop the field into the diagram. The diagram should look like this:
Note: The number 1000 represents the format of the calculated value. The Grand Total indicates that the last row of the Crosstab will show the total sale amount for all periods.
3. Select the Period Label element and use the highlight colour palette to set the colour to green. Notice that the element turns fuchsia instead of green. This is because the cell is selected. Deselect it by clicking another element and it should turn green.
4. Select Grand Total and set the colour to blue.
5. Select Sum of Sale Value and set the colour to red.
6. Select the 1000 under Sum of Sale Amount and set the colour to purple.
7. Select the 1000 to the right of the grand total and set the colour to grey.
8. Close the Crosstab Designer.
9. Preview.
The colours allow you to see where each element prints. The values in purple represent the sale amount per month. The value in grey is the grand total for the year. The numbers in green represent the months. The blue and red sections show where the headings or captions print. Now let’s add some more values. Right now we have the sum of sales. Next we’ll add the average and number of sales per period (count) to the Crosstab.

MYOB EXO Clarity
4
Extending the Crosstab Design
Task 1: Add Values to the Crosstab
1. Access the Crosstab Designer.
2. Select all coloured sections using CTRL and click, and set the colour to none.
3. Drag the Sale Value field over the new value cell and release it.
4. Select the second Sum of Sale Value (after the new value cell).
5. Locate the drop-down list box on the toolbar. Select Average from the drop-down list.
6. Once again, drag the Sale Value field over to the new value cell and release it.
7. Select the second Sum of Sale Amount (the one below the average).
8. Select Count from the drop-down list. The diagram should look like this:
9. Click OK.
10. Preview. The Crosstab includes new values.
Advance to the last page. The grand totals are on this page. The report tells us the sum, average, and count for the sale amount per month, but the numbers are expressed to a large number of decimal places.
Clarity Report Designer
5
Task 2: Set the Format of the Values
1. Go back to the Crosstab Designer.
2. Using CTRL-click select the 1000 under Sum of Sale Amounts and Average sale amounts. There should be six of them.
3. Right-click on the last field selected and select Display Format. Select the option below.
Task 3: Calculate Totals by Account Group
1. Drag the name cell back over to the field list and release.
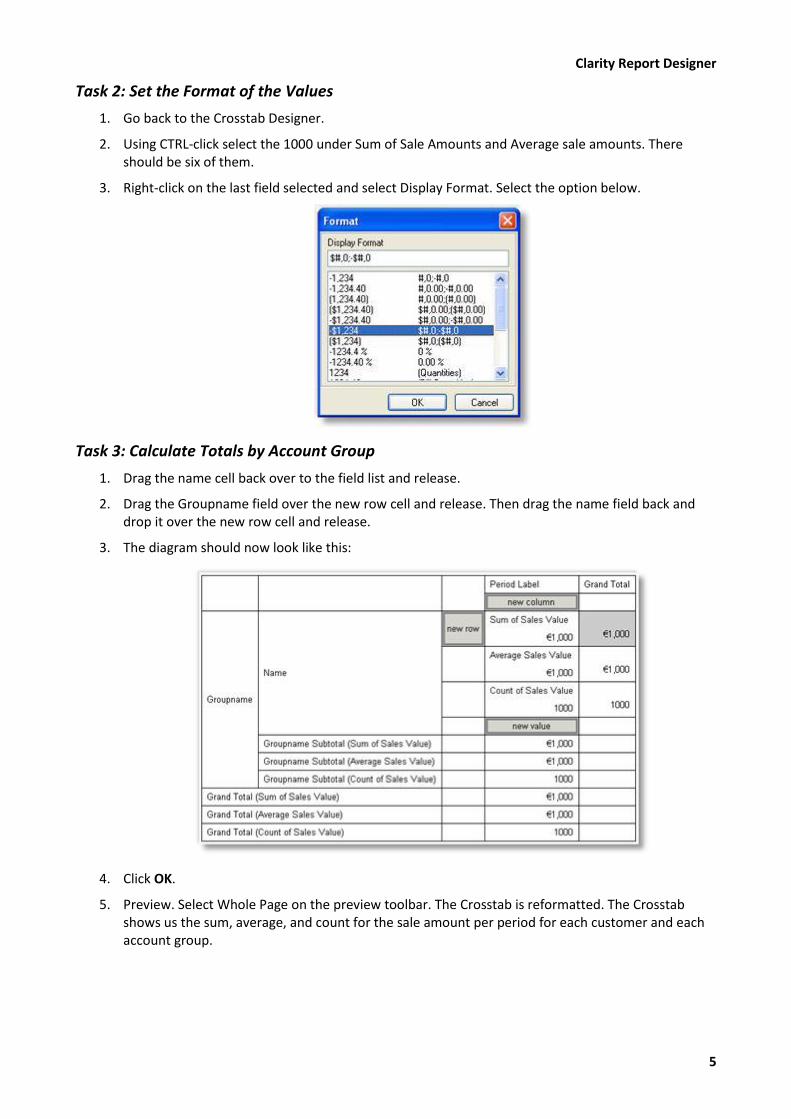
2. Drag the Groupname field over the new row cell and release. Then drag the name field back and drop it over the new row cell and release.
3. The diagram should now look like this:
4. Click OK.
5. Preview. Select Whole Page on the preview toolbar. The Crosstab is reformatted. The Crosstab shows us the sum, average, and count for the sale amount per period for each customer and each account group.

MYOB EXO Clarity
6
Task 4: Change the Crosstab view
1. Go back to the Crosstab designer.
2. Drag the Name cell over the new Column cell (look for the subtle little black triangles)
3. Now drag the period label cell to the new row cell.
4. Click OK and go to the Preview tab preview.
Notice how the representation of the data has changed considerably with such a simple change. Herein lies the real power of the Crosstab representation.
Depending upon the number of distinct periods encountered in the data, the preview may well not be able to display a complete view of the entire Crosstab on an A4 page. After we lay out the header band, we can always print out on several sheets and assemble a complete view of the Crosstab with a pair of scissors and adhesive tape. By altering the size of the fonts used it is usually possible to fit many more columns on the page. You might like to try this.
Task 5: Lay Out the Header Band
1. Return to the design workspace and place a label in the upper left corner of the header band.
2. Set the Caption to Sales by Customer by Account Group.
3. Set the Font to 18 bold and Navy blue.
4. Place a System Variable component in the lower right corner of the footer band.
5. Set it to PrintDateTime and select font size 12.
6. Place another System Variable in the lower right corner of the header band.
7. Set it to PageSetDesc.
8. Align the tops of the system variables.
9. Select CTRL + S to save the report.
10. Preview. Notice that the page number prints on each page.
Printing Large Crosstab Layouts on Multiple Sheets
Task 1: Control Pagination - Down then Across
1. Return to the design workspace and right-click on the Crosstab.
2. Select Pagination. Notice that the pagination defaults to Down then Across. This setting refers to the order in which the pages print. Pagination controls the order in which the pages print when the Crosstab cannot fit on a single page.
Task 2: Use Repeated Captions
1. Right-click on the Crosstab component.
2. Expand the Style menu option. Notice that the default setting is Standard. This means that the captions do not repeat. Both of the Crosstabs we put together are set to Standard because we did not want to see the captions on every page. However, if we print the Crosstab as a document, we may want the captions to repeat for ease of reading.
3. Save your changes and close the Report Designer.

Clarity Report Designer
7
If you would like to see a further example of where a Crosstab might be used, take a look at the GL account summary accessible by pressing the printer button on the main page of a general ledger account. This report is called GLaccSummaryCrosstab.CLR and looks like this:
An obvious further division of this could be by sub account. See below:

MYOB EXO Clarity
8
Advanced Clarity Notes
Label Printing
Select File > New and chose Label Template, then select a label type.
Printing Multiple Labels per Document Line
To print multiple labels per line:
1. Set the bandsperrecord property of the detail object to the quantity of labels required per line.
2. Keep track of the number of times the detail is printed so that the value may be assigned to the print count property of the detail in a later event. This may be done by using a variable to keeping a running balance of the number of times the detail is printed.
Detail.BandsPerRecord := Master[‘Ord Quant’];
Variable1.Value := Variable1.Value + 1;
3. Assign the value of Variable1 to the print count property of the detail:
Detail.PrintCount := Variable1.Value;
Note: See SOLine.CLF in the Clarity Masters for an example of this function.
Printing “Box X of Y”
In addition to producing multiple labels per document line you may wish to display “Box X of Y” on each label.
1. Declare a global variable called labelcount:
2. Increment the value of the global variable (to be displayed as box X) until it equals the bandsperrecord property (to be displayed as Y value) then set it back to 0 for the next set to begin:

Clarity Report Designer
9
Mail Merge
You can use mail merge when you want to create a set of documents that are essentially the same but where each document contains unique elements. For example, in a letter that announces a new product, your company logo and the text about the product will appear in each letter, and the address and greeting line will be different in each letter. The basic content is the same in all the letters, messages, or faxes, but each contains information that is specific to the individual recipient, such as name, address, or some other piece of personal data.
Creating each letter individually would take hours. That’s where mail merge comes in. Using mail merge, all you have to do is create one Clarity file that contains the information that is the same in each version. Then you just add database fields for the information that is unique to each version.
The Mail Merge in Clarity is an option that appears when you right-click over a Rich Text component, which is a component that allows you to print formatted text. It allows you write text and import database field values into the Rich Text component.
Sample template letters ‘DRContactMailMerge.CLM’ and ‘CRContactMailMerge.CLM’ exist in the Clarity masters. The body content of this sample letter also explains how to use this feature.
Place a Rich Text component on the report and set it to the required size. Right click on the Rich Text and enable the Mail Merge option. Right-click again and select Edit to open the Rich Text Editor where you can type in any text and add database fields.
The enhanced rich text editor presents the users with an option to access and insert database fields (as selected in the data tab), any global variables used in the report (plGlobalVars) and the runtime parameters (plParams).
To insert a field in between the text, set the cursor to the right place, select the appropriate field from the list and click the Add field button. The user can also set the display format of the field selected which comes in quite handy for numeric/currency and datatime values.
MYOB EXO Clarity
10
Views
A View is a virtual table. It is what we would usually think of as a Query in a program such as Microsoft Access. The table does not actually exist in the database, so does not take up any space other than for the code describing it. When it includes calculations, it is a lot faster than doing the calculations actually in the report.
Views can also provide a limited means of security, because they can provide users access to a subset of available data while hiding other related and sensitive data.
It is imperative that naming conventions be adhered to so that they don’t get “lost” in the maze of tables. The MYOB EXO Business standard is to prefix them with “A_”. This way they will all appear at the top of the list of tables and can be easily identified.
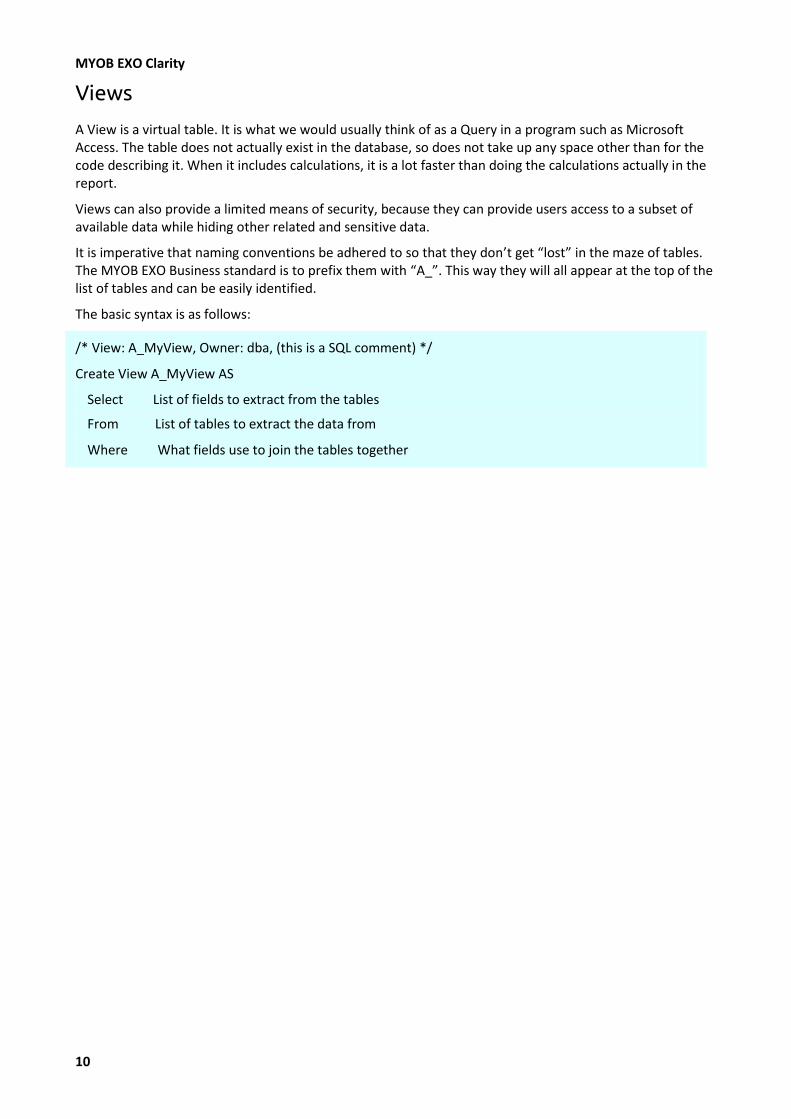
The basic syntax is as follows:
/* View: A_MyView, Owner: dba, (this is a SQL comment) */
Create View A_MyView AS
Select List of fields to extract from the tables
From List of tables to extract the data from
Where What fields use to join the tables together

1
Parameters
Parameters Available at Runtime
Param type SourceSQL
(Order Field)
TableAlias KeyField DisplayFields AutoSearch SearchOperator Default SQL
ComboBox SQL Query Pipeline Name
Field Name Field Name(s) Y Equal, NotEqual… KeyField Value / SQL
ListBox SQL Query Pipeline Name
Field Name Field Name Y Equal, NotEqual… KeyField Value / SQL
CheckBox None None None None N None True/ False
CheckBox None Pipeline Name
FieldName None Y Equal, NotEqual… Y,N (must use comma)
TextBox None Pipeline Name
Field Name None Y Equal, NotEqual… Text
Date None Pipeline Name
Field Name None Y Equal, NotEqual… DateTime / SQL
OrderBy Order Field Pipeline Name
None None Y None ASC / DESC (Default - ASC) or a Field List which allows the

MYOB EXO Clarity
2
Order Field to show
DebtorSearch None Pipeline Name
Field Name None Y Equal, NotEqual… None
CreditorSearch None Pipeline Name
Field Name None Y Equal, NotEqual… None
StockSearch None Pipeline Name
Field Name None Y Equal, NotEqual… None
GLAccSearch None Pipeline Name
Field Name None Y Equal, NotEqual… None
GLAccGroupSearch None Pipeline Name
Field Name None Y Equal, NotEqual… None
DateRange None Pipeline Name
None None Y Equal, NotEqual… None
AnalysisCodeSearch None Pipeline Name
_HasAnyAnalysisCodes_ None N InList, NotInList None
Command Line Launch Parameter Definitions
Parameter Description Value Default Value
Note Example
Alias Name
The 1st parameter (External Call only) ACCDATA
User Name
The 2nd parameter (External Call only) sysdba
Password The 3rd parameter (External Call only) masterkey
Report Name
Clarity report file name
The 4th parameter (External and Internal Call) PurchOrd.clr

Clarity Report Designer
3
/D or /d Report Direct to destination
Printer, File, Viewer, Email, Grid
/d=Viewer File & Email options require /F and /M params. Printer option requires a valid /P or /I parameter.
If not specified, the Viewer dialogue will pop up ignoring any inheritance (/I) direction value set. It is good practice to always have this in any Clarity command line call.
(External and Internal Call)
File
/F or /f Output Filename A valid file name The file extension must be the same as the Output file format parameter would expect. Eg *.DOC or *.PDF
(External and Internal Call)
C:\TEST.PDF
/M or /m Output file Mode TextFile, LotusFile, QuattroFile, XLSReport, XLSData, GraphicFile, HTMLLayerFile, HTMLFile, PDFFile, RTFFile, ReportTextFile
/m=RTFFile TextFile – TXT ReportTextFile – TXT LotusFile - WK1 QuattroFile - WQ1 XLSReport, XLSData – XLS GraphicFile – JPG, BMP, TIF HTMLLayerFile – HTM HTMLFile – HTM PDFFile – PDF RTFFile – RTF
(External and Internal Call)
PDFFile

MYOB EXO Clarity
4
/P or /p Printer name with the network drive portion in UNC format
‘Default’ or Printer UNC
/p=Default ‘Default’ is the windows default printer;
Always used with /D=Printer.
Never used with /I=nn.
If the path is incorrectly entered Clarity will print to the default printer.
The name to use is not the name of the printer as it is called on the server sharing the printer. It needs to be name as it is known on your machine i.e. the printer name as displayed in the Control Panel / Printers and Faxes.
The print server can be an IP address.
(External and Internal Call)
/P=“\\PrinterServerName\HP LaserJet 8000 Series PCL 5e”
/C or /c the number of Copies to print
1 or more /c=1 Only used in association with Printer output. Copy counter and total copies are available for use on your document as pipeline Global variables.
(External and Internal Call)
1
/A or /a Ask for any Parameter values using the parameter dialogue screen.
Y or y, N or n Add /A=N if you wish skip the confirmation of any parameters that exist for the report you are running. Otherwise the report will run on defaults or specified values (/S)
(External and Internal Call)
n
/L or /l Show Logo N or n Don’t show the splash screen on opening when using /A parameter (External Call only)
n
Clarity Report Designer
5
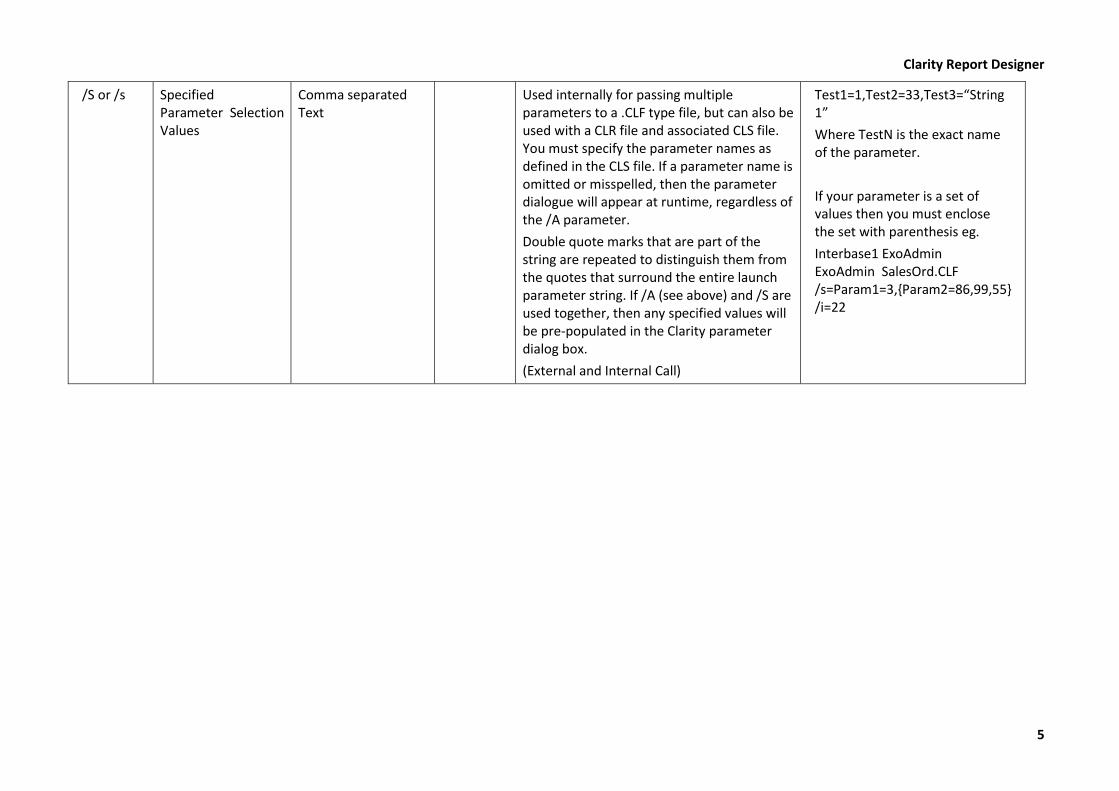
/S or /s Specified Parameter Selection Values
Comma separated Text
Used internally for passing multiple parameters to a .CLF type file, but can also be used with a CLR file and associated CLS file. You must specify the parameter names as defined in the CLS file. If a parameter name is omitted or misspelled, then the parameter dialogue will appear at runtime, regardless of the /A parameter.
Double quote marks that are part of the string are repeated to distinguish them from the quotes that surround the entire launch parameter string. If /A (see above) and /S are used together, then any specified values will be pre-populated in the Clarity parameter dialog box.
(External and Internal Call)
Test1=1,Test2=33,Test3=“String 1”
Where TestN is the exact name of the parameter.
If your parameter is a set of values then you must enclose the set with parenthesis eg.
Interbase1 ExoAdmin ExoAdmin SalesOrd.CLF /s=Param1=3,{Param2=86,99,55} /i=22

MYOB EXO Clarity
6
/I or /i Inherit profile settings of a similar CLF file. Pass it a Report ID value based upon a predefined list of constants in the MYOB Exo Business code. Can be used instead of specifying each individually if a similar report exists within MYOB Exo Business that has profile controlled settings.
Valid Integer Value 0 Principally for EXO programmer use.
Current ReportIDs are 0=riNone, 1=riBackord, 2=riBRemittance, 3=riBStatement, 4=riCRAccount, 5=riCRInvoice, 6=riDocket, 7=riDRAccount, 8=riInvoice, 9=riJobInvoice, 10=riJobPreview, 11=riJobQuote, 12=riJobSheet,13=riManifest, 14=riPackslip, 15=riPOLine, 16=riPOQuote, 17=riPosReciept, 18=riPurchOrd,19=riPurchrec, 20=riQuote,21=riRemittance, 22=riSalesOrd,23=riSOLine, 24=riStatement,25=riStockItem, 26=riStockReceipt,27=riWorksOrd, 28=riIGReceipt,29=riShipment, 30=riIGCosting,31=riInvLabel, 32=riGLAccSummary, 33=riCountSheets, 34=riStkVariance,35=riBomBatch, 36=riBillomat,37=riViewInv, 38=riChequeRepF, 39= riDDRepF, 40=riAMPurchases,41=riAMSales, 42=riAMBookValue, 43=riAMTaxValue, 44=riAMBookDepreciation, 45=riAMTaxDepreciation, 46=riAMServiceSchedule, 47=riAMListingByGroup, 48=riAMRevaluations, 49=riAmTransactionByAsset, 50=riPricePolicy, 51=riDRPaymentBatch, 52=riDrPmtReceipt, 53=riSupplyHist, 54=riBankBatchList 55=riPickingList, 56=riPickingRequisition,57=riStockRequest, 58=riSalesOrderLabel,59=riJobMisc, \
/I=22 would use the set of 4 computer profile settings defined for the Salesord.CLF, such as printer name, output file format. Email actions etc.

Clarity Report Designer
7
60=riExotrackJob, 61=riExotrackJobList, 62=riExotrackJobDetail, 63=riSubsSummary, 64=riSubsDetail, 65=riSubsBillRunRep, 66=riSubsStockGroupSummary, 67=riFinPPManCheqWr, 68=riFinPPChqPayment, 69=riFinPPChequeRep, 70=riFinPPManChequeRep, 71= riFinPPDoNotPay, 72=riFinPPChqRunRep, 73=riFinPPEftRmit, 74=riFinPPCheqWr, 75=riFinPPSeqChqRep, 76=riFinPPDCRep, 77=riFinBRAPExceptionRep, 78=riFinBRUnRecRep, 79=riFinBRCloseBalRep, 80=riFinBRGLUnRecRep, 81=riFinBRDishonDDRep, 82=riFinBRRecAutoMatchRep, 83=riFinDDBatchRep, 84=riFinDDRemitance, 85=riShiftEnh, 86=riShiftSales,87=riShiftAudit, 88=riSTSale, 89=riSTReceipt, 90=riSTTfer, 91=riSTAdjustIn, 92=riSTAdjustOUT, 93=riSTCostAdjust, 94=riIGLabel, 95=riShift, 96=riStockTrans, 97=riPOSBankBatch, 98=riBatchSalesOrderProcessing, 99=riGLBatch, 100=riSTKPricePolicy, 101=riACCPricePolicy, 102=riGLBatchTrans, 103=riBatchInvoice, 104=riCrPmtReceipt, 105=riPickSlip, 106=riConfSlip, 107=riStockValInactive (External and Internal Call)
MYOB EXO Clarity
8
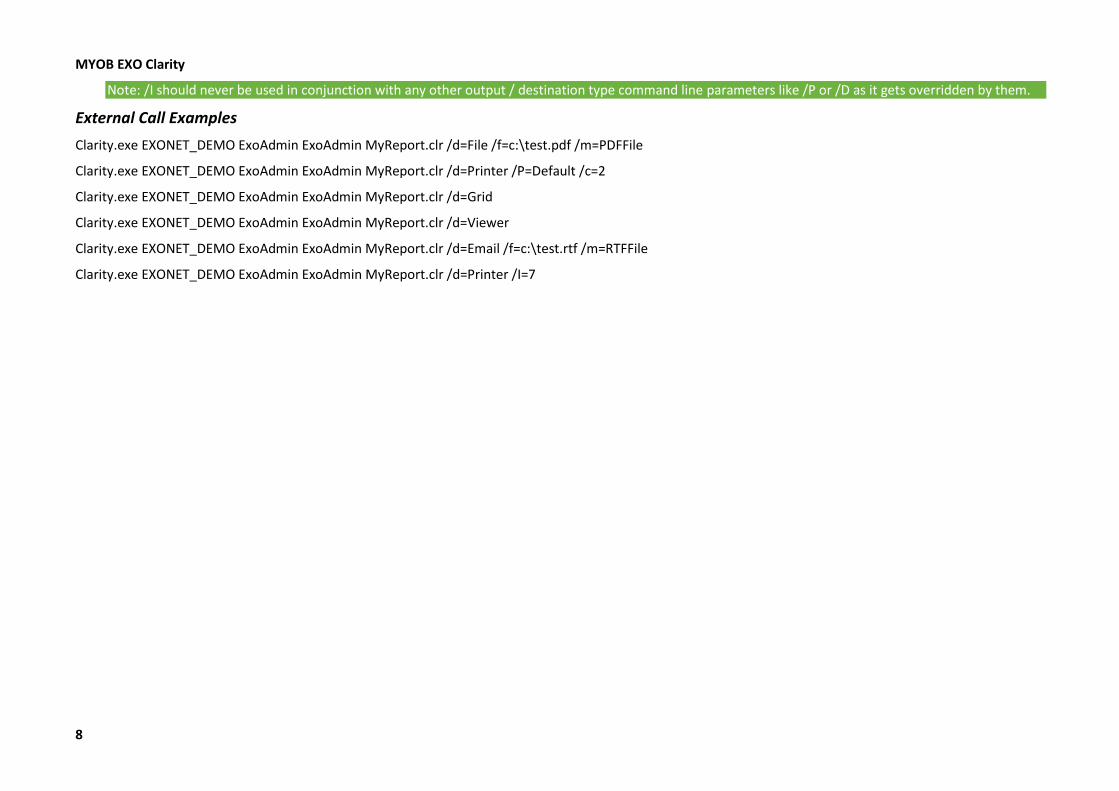
Note: /I should never be used in conjunction with any other output / destination type command line parameters like /P or /D as it gets overridden by them.
External Call Examples
Clarity.exe EXONET_DEMO ExoAdmin ExoAdmin MyReport.clr /d=File /f=c:\test.pdf /m=PDFFile
Clarity.exe EXONET_DEMO ExoAdmin ExoAdmin MyReport.clr /d=Printer /P=Default /c=2
Clarity.exe EXONET_DEMO ExoAdmin ExoAdmin MyReport.clr /d=Grid
Clarity.exe EXONET_DEMO ExoAdmin ExoAdmin MyReport.clr /d=Viewer
Clarity.exe EXONET_DEMO ExoAdmin ExoAdmin MyReport.clr /d=Email /f=c:\test.rtf /m=RTFFile
Clarity.exe EXONET_DEMO ExoAdmin ExoAdmin MyReport.clr /d=Printer /I=7
1
Menu Option Launch Parameter Definitions
The following method can be applied when setting up menu options or launching from ‘exe’ buttons within MYOB EXO Business itself as opposed to using the Clarity.exe externally. There is no requirement to pass database login parameters such as Alias name, user name and password as MYOB EXO Business has already made a valid connection to the database. If no parameters are passed (other than the filename) then the report will appear in the viewer.
Example:
MYReport.clr /d=File /f=c:\test.pdf /m=PDFFile
This would find the report MYREPORT.clr in the directory specified in the current computer profile and send the output to a PDF file called test.pdf in the root directory of drive c:.
MREPORT.CLR /D=PRINTER /I=22 /S=MYPARAM=100 /A=N
This would find the report MYREPORT.clr in the directory specified in the current computer profile and prime a parameter called MYPARAM in the cls file with the value 100. Then it would launch the document as per the settings inherited from those stored in the computer profile relating to the SalesOrd.CLF file which is reported 22.
Clarity.Exe Connectionname UserID Password MYREPORT.CLR /S=MYPARAM=100 /A=Y /D=PRINTER /P= “\\PrintServer\Share name”
This would run from a command line batch file in an unattended mode without requiring input from the user but using the parameter preset value 100. Removing the /A parameter would cause the dialogue box to pop up requiring user interaction.
Note: The first parameter after the login details must be Clarity report name. The /L (logo) parameter is not required.
Worked Examples
The following is a simple example of a report with one parameter being executed using 3 different methods.
1. Call this report using Clarity.exe as an external command line.
2. Call this report from an Exe Button inside MYOB EXO Business.
3. Call this report from a menu item inside MYOB EXO Business.
MYOB EXO Clarity
2
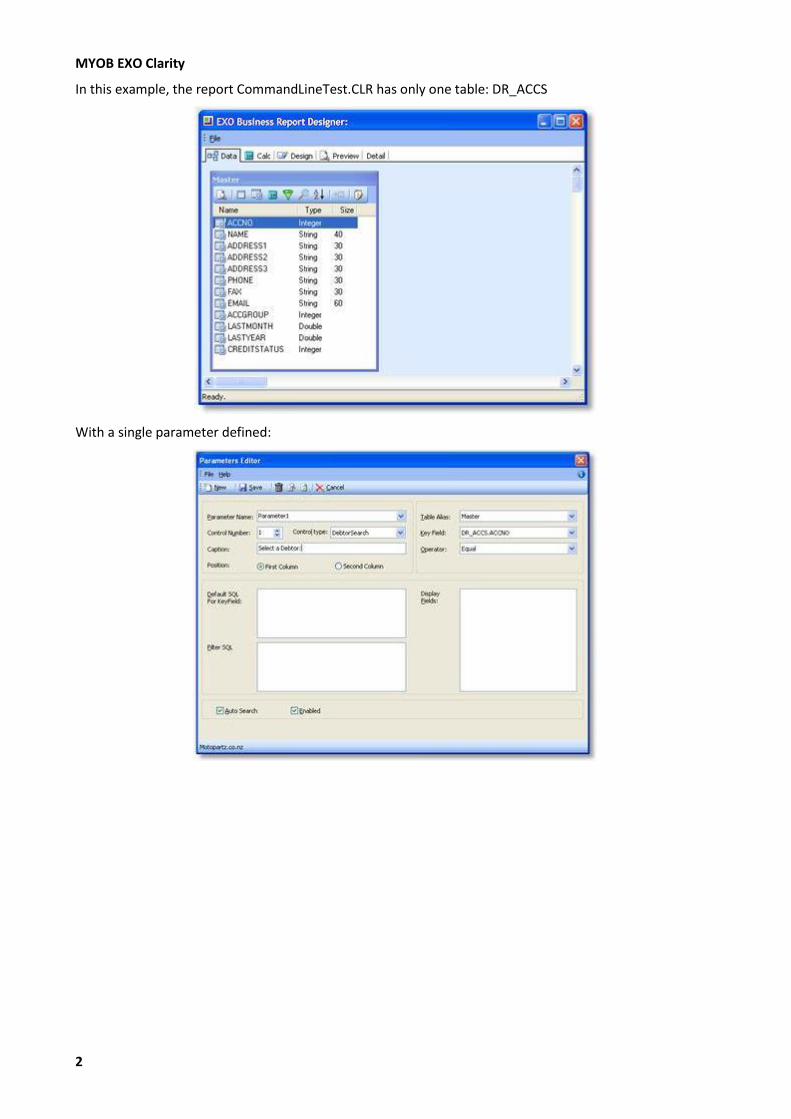
In this example, the report CommandLineTest.CLR has only one table: DR_ACCS
With a single parameter defined:
Clarity Report Designer
3
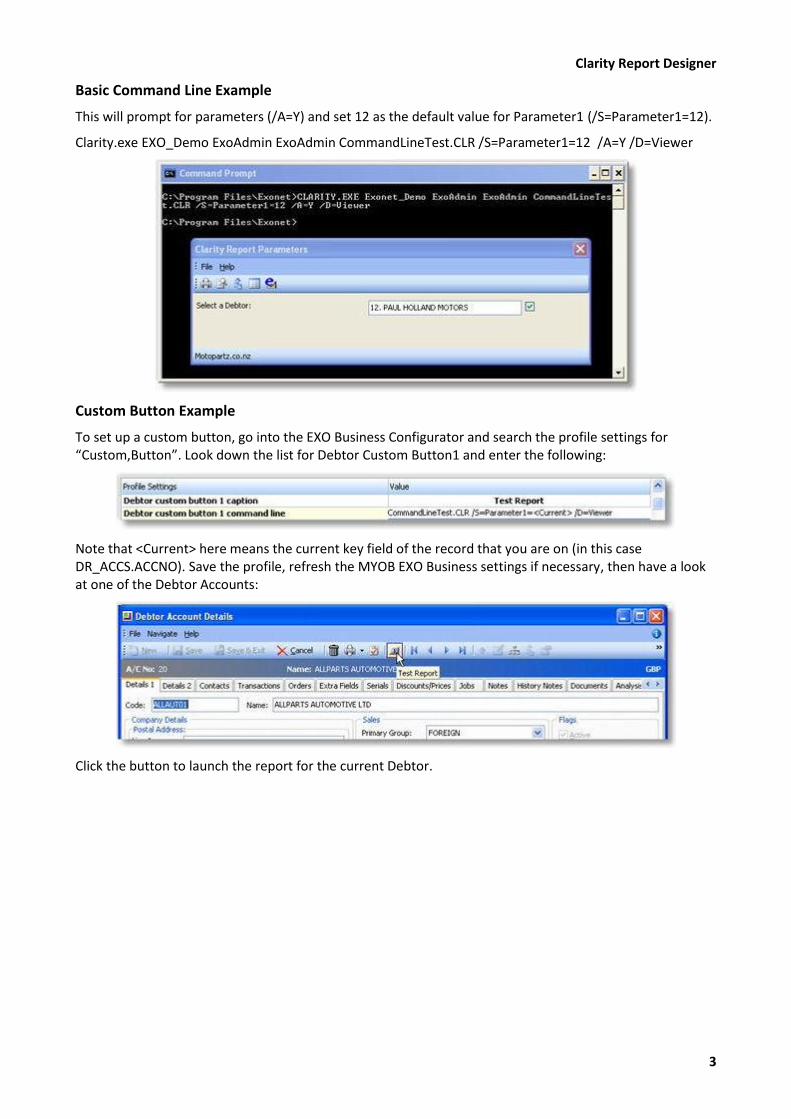
Basic Command Line Example
This will prompt for parameters (/A=Y) and set 12 as the default value for Parameter1 (/S=Parameter1=12).
Clarity.exe EXO_Demo ExoAdmin ExoAdmin CommandLineTest.CLR /S=Parameter1=12 /A=Y /D=Viewer
Custom Button Example
To set up a custom button, go into the EXO Business Configurator and search the profile settings for “Custom,Button”. Look down the list for Debtor Custom Button1 and enter the following:
Note that <Current> here means the current key field of the record that you are on (in this case DR_ACCS.ACCNO). Save the profile, refresh the MYOB EXO Business settings if necessary, then have a look at one of the Debtor Accounts:
Click the button to launch the report for the current Debtor.

MYOB EXO Clarity
4
MYOB EXO Business Menu Example
To set up an MYOB EXO Business menu item to launch a Clarity report, go to the menu designer by opening the EXO Business Configurator and going to Staff > Menus > Dropdown Menu. Open the menu set that you want to edit, then drag the Run Clarity Report item from the right pane onto your menu structure. The following window appears:
Change the Caption to a suitable caption for the report, add the Parameters, and add a shortcut if desired. Parameters should be in the form:
<report name> <parameters>
Do not add “Clarity.exe” to the start.
Tech-Tips, FAQ & Troubleshooting
How do I force the Summary section to cover the whole of the last page of the report?
1. Enlarge the summary section to be the size of your page.
2. Set the header and footer to not visible if the page count has been reached.
3. When the summary prints – set the page limit property to the current page.

Clarity Report Designer
5
How do I set an image to print only on duplicate copies?
1. Declare a boolean global variable to hold the printed value.
2. Set the Printed variable to false at the start of the report.
3. Set the set the image to non-visible if Printed is True, otherwise show the image and set Printed to True.
How do I skip a group when a condition is met / start each group on a new page?
1. On the Groups window (Ctrl-G), set groups to start on new page.

MYOB EXO Clarity
6
2. On a group break check to see if the condition is met and if so cancel new page and set the group header, footer and detail to not visible.
How do I use Total Variables?
Total variables are used to obtain sums of variable-type component values (variables must be of a numeric data type).
1. Drop total variable onto form where total is required.
2. Right click > Grand total, then select the variable name that is to be totalled.
3. Right click > Calculations, and ensure value is reset to 0 at the correct time, or your totals will be wrong.
Why are my parameters not being passed though?
Check that the CLS file is in the default CLARITY directory (Custom or Masters, depending on which report you’re trying to run). Check that you don’t have spaces in your parameters
e.g. /S = MYPARAM = 12 will not work; remove the spaces: /S=MYPARAM=12
Why do I get the message ‘Can’t find Report Clarity.EXE’
You can get this message when trying to run a Clarity report from a button or from a menu option if you have entered “Clarity.EXE” in the Command Line or Parameters field when setting it up. These fields (in the case of menu items and custom buttons) should consist of the report name and parameters only.

Clarity Report Designer
7
Why do reports with the /I parameter still go to the default printer?
Check that you are using a valid UNC pathname as illustrated in the example below. If an invalid printer definition is given, Clarity will always resort to the default printer. See the example below for using /I=7:
These UNC names are derived from the list of available printers on my network as viewed by Windows explorer.
You may also need to specify Direct to (/D) when using the /I=parameter on a command line to tell Clarity to skip the printer/file dialogue that Clarity calls by default.
How do I set the number of copies to print at design-time?
On the Clarity Design tab: Tools menu >- Settings – Doc Copies property can be used to control this.
MYOB EXO Clarity
8
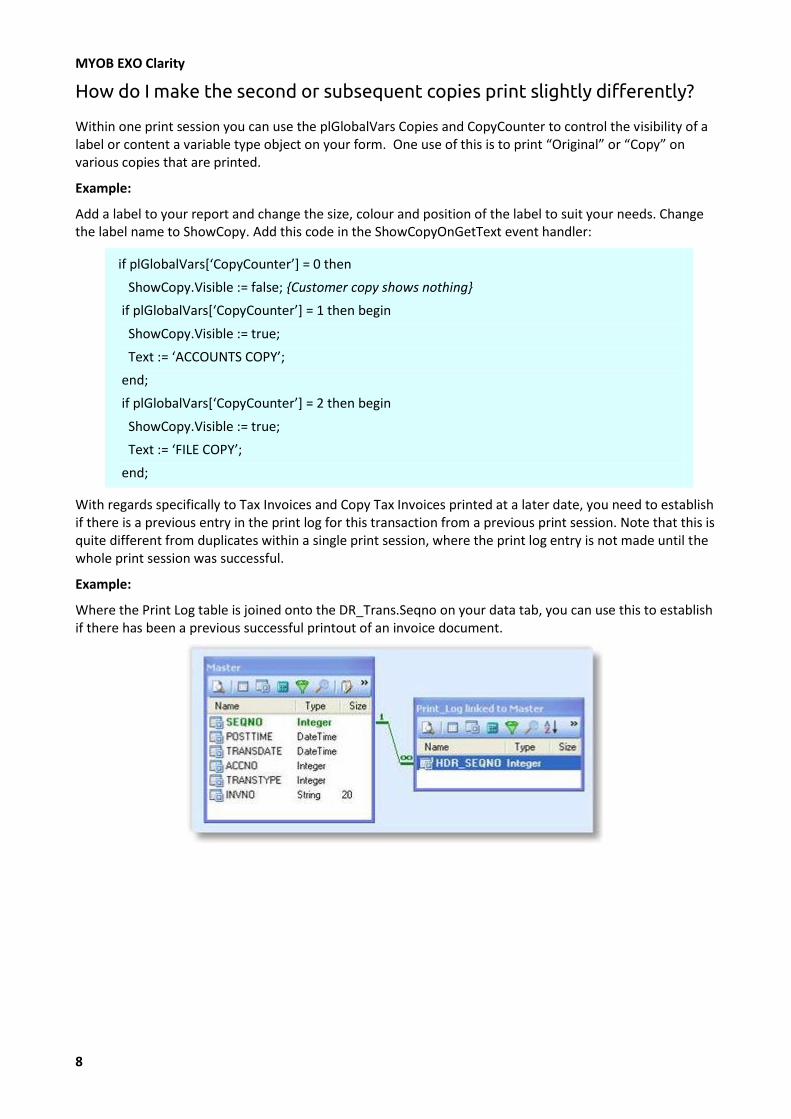
How do I make the second or subsequent copies print slightly differently?
Within one print session you can use the plGlobalVars Copies and CopyCounter to control the visibility of a label or content a variable type object on your form. One use of this is to print “Original” or “Copy” on various copies that are printed.
Example:
Add a label to your report and change the size, colour and position of the label to suit your needs. Change the label name to ShowCopy. Add this code in the ShowCopyOnGetText event handler:
if plGlobalVars[‘CopyCounter’] = 0 then
ShowCopy.Visible := false; {Customer copy shows nothing}
if plGlobalVars[‘CopyCounter’] = 1 then begin
ShowCopy.Visible := true;
Text := ‘ACCOUNTS COPY’;
end;
if plGlobalVars[‘CopyCounter’] = 2 then begin
ShowCopy.Visible := true;
Text := ‘FILE COPY’;
end;
With regards specifically to Tax Invoices and Copy Tax Invoices printed at a later date, you need to establish if there is a previous entry in the print log for this transaction from a previous print session. Note that this is quite different from duplicates within a single print session, where the print log entry is not made until the whole print session was successful.
Example:
Where the Print Log table is joined onto the DR_Trans.Seqno on your data tab, you can use this to establish if there has been a previous successful printout of an invoice document.

Clarity Report Designer
9
Then using the value returned you can incorporate this into a variable that provides the text for the title of your invoice document.
How do I print a second copy to a different printer?
There is a Custom Memo function called CUSTOM_SETTINGS designed for this scenario. Custom Memo functions provide for specific exceptional functionality by use of keyword named Memo or label object. You can place these memo objects anywhere on a report or sub-report, but you must specify the name of a MEMO or LABEL object to be the Keyword for the required function.
If you place a memo field on your form Memo field named CUSTOM_SETTINGS then you can force the document to inherit the profile set of another CLF that for the initial print of the form or any subsequent copies. The most common use for this might be to redirect a subsequent copy of a document to a different printer device or file.
Example: Packing slip prints in office with second copy to warehouse printer.
1. Add a new memo field to the report, and call it CUSTOM_SETTINGS.
2. Edit this field so that it contains the Inherited parameters for each copy that will determine where that copy is to go:
The ‘/I=‘ refers to CopyN inheriting the profile values of the FormID.
This also illustrates the point that even a single copy form can in fact be manually redirected to print on a different printer from its associated profile settings.

MYOB EXO Clarity
10
Used in conjunction with Invoice Form files settings or InvFileno functionality this can allow for different printers for each type of invoice.
This technique is intended for specific custom functions that MYOB EXO Business wish to introduce to solve very specific business problems, rather than an all encompassing and adaptable function for generic use. It is incorrect to assume that a Custom Memo Function supports the entire Clarity command line control set.
Please note - The current functionality is only designed to work where the document is being printed, it is not intended to work with any other output devices such as Viewer or File.
How can I direct a report to a different printer tray trays on a networked?
Answer: The Main difficulty with printing to different trays of a printer in lies with the convention of naming of Printers in Windows 2000 & XP, and the inability to be able to attach the same shared network printer twice on the client PC.
When you add a Shared printer in Windows it is added with the name of ‘Printer Share Name’ on ‘Computer it is shared on’ for example ‘HP8000 on Server2’.
This means that when you try to add the printer again so you can use another tray, it won’t let you because the printer already exists.
To get around this you need to add the printer alias and share it again on the computer that it is shared on.
When you have added the printer to the printer list on the print server, change the printing preferences so that the Paper Source uses the tray required. This will be different between the makes of printers, but clients connecting to this shared alias will inherit this change.
You can then add the new printer alias on the client PC’s. Once the printers is set up you will now have to set your invoice to print 2 copies to the different trays.

Clarity Report Designer
11
The first step is to set the print options in ExoConfg:
Then Change the Invoice Form to print 2 copies to different locations by selecting Settings from the Tools menu of Clarity when you have the Invoice.clf open.
Once this is all done when you now print an invoice normally, 2 copies will be printed to the 2 locations that were set up.

MYOB EXO Clarity
12
What does the error ‘Invalid SQL statement, Ambiguous column’ mean?
The query is not able to recognise which table the field belongs to, because you have only specified the field name, and there are two or more fields with the same name in the tables that you have selected. In this case you must explicitly specify the table name:
sum(dr_trans.subtotal / dr_trans.exchrate)
How do I set extra date fields to default to today’s date?
Go to ExoConfig Profiles and type “date” to search date related profiles. In ‘Company profile’ you will see an option called ‘Default Date for DateTime type Extra fields’. Type value ‘Todays’ against that field. See screenshot below.
Save this then refresh the settings in MYOB EXO Business to see the change.
How do I create a barcode on a clarity form as a concatenation of two fields?
Add an ‘Expression’ field in the query designer on the Data tab under the source data pipeline. Enter the following expression, or change it to match your particular needs:
stock_items.stockcode + ‘ ‘ + stock_items.description
You may need to add some other control characters to the string, depending on the barcode type. Check your barcode documentation.
This expression joins the stockcode and description fields together from the stock_items table. Change the name of this expression to something meaningful (such as “ConcBarcodeField”). Load this concatenated field into the barcode.
How do I make the Footer appear only on the last page of the report?
Type the following code in the “BeforePrint” Event of the footer band
Footer.Visible := Report.SecondPass and
(Report.Page = Report.PageCount);

Clarity Report Designer
13
How do I force the Group Footer to appear at the end of each page?
Right-click on your Group Footer bar and choose position. Set the PrintPosition property for the GroupFooter so that it aligns itself to the bottom of the page. The more you increase the value the further down the page the groupfooter band moves.
But remember that each group will show on a separate page. The default nature of the group footer is to appear at the end of each group. If the “Group Footer” is positioned at the bottom of the page, then each group will end at the bottom of a page. Therefore each group will occupy at least 1 full page.
How can I use $COMPUTERID and $USERID in Clarity?
You can add a parameter in clarity where you include $COMPUTERID in the default SQL. Type in the following statement in the Default SQL box:
SELECT BRANCHNO WHERE BRANCHNO = $COMPUTERID
This will set the branchno to the default branchno stored for your computer and will run the report for that particular branch.
Click Save in the parameters editor and go back and preview the report.
Save the report. Next time when you login and preview, you will find the Branchno defaults to the ID of the computer.
How do I use the New Page option?
The New Page option allows you to force the summary onto a new page. Right-click on your summary band and select New Page.
How do I get a record count in the header rather than in the footer?
Place the DBCalc component in the header or group header band. Right click the DBCalc component that you are using and choose LookAhead Option. This will pre-calculate the lines before displaying the value. This could delay the preview of some complex or large reports while it calculates.

MYOB EXO Clarity
14
How do I count the number of records in each group at the end of the group?
Place a Dbcalc in your group footer. Right click on the DBcalc, click calculations – and choose ‘count’. Select the field/column for which you want to do the count, from the Edit toolbar. By placing this in the group footer band will show the count of each group in the report. You can do the same to perform a sum and average calculations. Reset Group specifies when the calc is reset to zero.
Why can’t I sort by a field in a child data pipeline?
This is one limitation of using data pipelines joined in master-child relationships. If it is a simple form, you may be able to combine the two pipelines into one and then go to the sort tab of the query designer and sort it by the field you wanted. Another method is to set up a SQL view that is sorted in the desired order then using that in a new pipeline.
How do I set the number of detail lines per page?
Right click on the Detail band and select Position. Under Print Count, type the number of records you want to be displayed per page in your report.
How do I draw column lines in the detail band?
1. Adjust the width of the detail band as required. Choose the line tool in the standard components palette. Choose right, left, top or bottom from the options combo box, depending on how you want the lines drawn.
2. Draw the line from start to the end of the detail band (top and bottom shaded areas of detail band), or right-click and select “Parent Height”

Clarity Report Designer
15
To show an end line in each page of the report, draw a horizontal line at the very top of the footer.
How do I set a watermark image or text in the background?
1. Ensure the Page Style band is visible by selecting it from the Report menu.
2. Place the ‘image’ component on the Page Style band. Load the picture by right clicking and choosing ‘Picture’.
3. Right click on the image and choose ‘Send to Back’ which will set the image as a background for the whole report.
4. Right click on the other components and ensure Transparent is selected – this removes any foreground colour on the fields, allowing the background to be seen.
5. Right click and select ‘Stretch’ and ‘Maintain Aspect Ratio’, then set the required size. The picture will extend and spread along the whole page uniformly as the height increases. See the example below.
It is suggested that you lighten the image that you use for your background using an image editing program, otherwise it may make the lines hard to read.

MYOB EXO Clarity
16
How can I strip blank spaces from a database field on a clarity report?
Type the following piece of code in the OnGetText event handler of the DBtext component :
var
newtext : string;
x1 : integer;
begin
newtext:=‘‘;
for x1:=1 to length(text) do
begin
newtext:= newtext + trim(copy(text,x1,1));
end;
text := newtext;
end;
How do I set the number of copies to print from a database field?
Try the following code:
Procedure ReportBeforePrint
Begin
Report.PrinterSetup.Copies:= <value>;
End;
{The line above could be any one of these:
Report.PrinterSetup.Copies := 3;
Report.PrinterSetup.Copies := Dr_accs[‘invfileno’];
Report.PrinterSetup.Copies := plparams[‘CopiesValue’];
}
The only 2 conditions in which the above piece of code would fail are:
1. If there is a profile that controls the number of copies of a specific form.
2. If the form is not previewed and is called through a custom button that directly sends the report to the printer.
How do you set a total variable to blank when zero?
In the calcs tab > Totalvariable1> OnCalc event type in the following code:
if Value = 0 then TotalVariable1.Visible := false;
Clarity Report Designer
17
How do I cancel a report if a runtime parameter is not specified?
Type the following in the report’s BeforeOpenDataPipelines event handler:
If (plparams.fieldobjects[‘PeriodValue’].isnull) then
Begin
ShowMessage(‘Please select a period’);
Report.Cancel;
End;
How do I display an RTF file?
Add a rich text control to your report and use the following piece of coding to check for the existence of the file and then display it.
if fileexists(‘c:\RichTextFile.rtf’) = true then
RichText1.LoadFromFile(‘c:\ RichTextFile.rtf’);
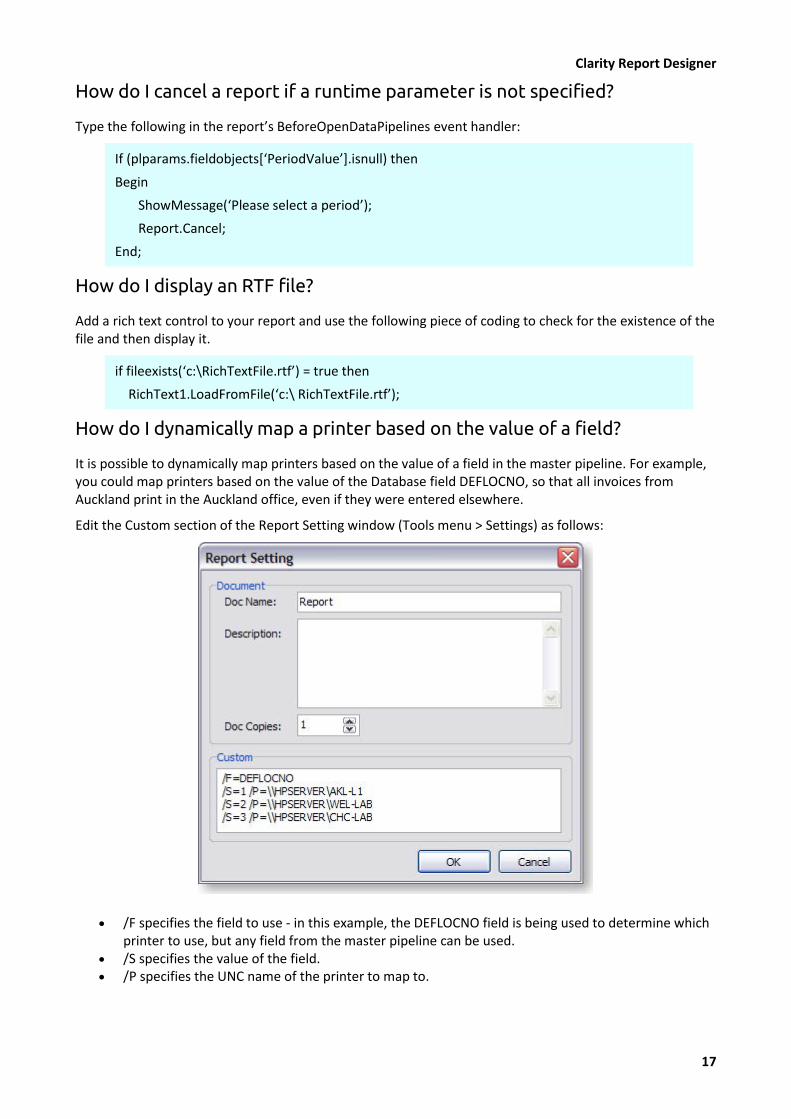
How do I dynamically map a printer based on the value of a field?
It is possible to dynamically map printers based on the value of a field in the master pipeline. For example, you could map printers based on the value of the Database field DEFLOCNO, so that all invoices from Auckland print in the Auckland office, even if they were entered elsewhere.
Edit the Custom section of the Report Setting window (Tools menu > Settings) as follows:
/F specifies the field to use - in this example, the DEFLOCNO field is being used to determine which printer to use, but any field from the master pipeline can be used.
/S specifies the value of the field. /P specifies the UNC name of the printer to map to.
MYOB EXO Clarity
18
Language Reference
The code toolbox in the Calc tab of the clarity designer provides the user with a list of various functions that can be used to manipulate and format the data before being displayed in the report. The following is a list of elements contained in the toolbox:
String Functions
1. Capitalize - Capitalizes the first character following a space for every word in a string.
Declaration: Function Capitalize(const S: String) : String;
2. CompareText - Compares two strings by ordinal value with case sensitivity.
Declaration: Function CompareText (const S1, S2: String): Integer;
3. Copy - Returns a substring of a string or a segment of a dynamic array
Declaration: Function Copy(S:String; Index, Count: Integer) : String;
4. Delete - Removes a substring from a string.
Declaration: procedure Delete (var S: String; Index, Count: Integer);
5. Insert - Inserts a substring into a string beginning at a specified point.
Declaration: procedure Insert (Soure: String; var S: String; Index: Integer);
6. Length - Returns the number of characters in a string.
Declaration: function Length(S: String): Integer;
7. LowerCase - Converts an ASCII string to lowercase.
Declaration: function LowerCase (const S: String): String;
8. NumberStr - Converts a number to an English string (e.g. for cheques).
Declaration: function NumberStr (const aNumber: Integer): String;
9. PadLeft - “Pads” a string with characters up to a fixed length.
Declaration: function PadLeft (const S: string; tolength: Integer; withchar: Char): string;
10. PadRight - “Pads” a string with characters up to a fixed length.
Declaration: function PadRight(const S: string; tolength: Integer; withchar: Char): string;
11. Pos - Returns the index value of the first character in a specified substring that occurs in a given string.
Declaration: function Pos (Substr: String; S: String): Integer;
12. Trim - Returns a copy of the string S with leading spaces and control characters removed.
Declaration: function Trim(const S: String) : String;
13. TrimLeft - Returns a copy of the string S with leading spaces and control characters removed.
Declaration: function TrimLeft (const S: String) : String;
14. TrimRight - Returns a copy of the string S with trailing spaces and control characters removed.
Declaration: function TrimRight (const S: String) : String;
15. Uppercase - Returns a copy of the string in uppercase.
Declaration: function Uppercase(const S: String): String;
Clarity Report Designer
19
Conversion Functions
1. Chr - Returns the character with the ordinal value (ASCII value) of the byte-type expression X.
Declaration: function Chr (X: Byte) : Char;
2. CurrToStr - Formats a currency value as string.
Declaration: function CurrToStr (Value: Currency): String;
3. DateTimeToStr - Converts a Datetime value to string.
Declaration: function DateTimeToStr (aDateTime: DateTime) : String;
4. DateToStr - Converts a Date value to string.
Declaration: function DateToStr (aDate: Date): String;
5. FloatToStr - Converts a floating point value to string.
Declaration: FloatToStr (Value: Extended): String;
6. IntToStr - Converts and integer to a string.
Declaration: function IntToStr(Value: Integer): String;
7. RGB - Returns a red, green, blue (RGB) color based on the arguments supplied. The intensity for each argument is in the range 0 through 255. If all three intensities are zero, the result is black. If all three intensities are 255, the result is white,
Declaration: function RGB(bRed, bGreen, bBlue: Integer) : Integer;
8. StrToCurr - Converts a string to a currency value.
Declaration: function StrToCurr (const S: String): Currency;
9. StrToDate - Converts a string to a date value.
Declaration: function StrToDate (const S : String) : Date;
10. StrToDateTime - Converts a string to Datetime value.
Declaration: function StrToDateTime (const S : String) : DateTime;
11. StrToFloat - Converts a given string to a floating point value.
Declaration: StrToFloat (const S : String) : Extended;
12. StrToInt - Converts a string that represents an integer (decimal or hex notation) to a number.
Declaration: function StrToInt (const S : String) : Integer;
13. StrToIntDef - Converts a string that represents an integer (decimal or hex notation) to a number. If S does not represent a valid number, StrToIntDef returns the number passed in Default.
Declaration: function StrToIntDef (const S : String; Default: Integer) : Integer;
14. StrToTime - Converts a string to time value.
Declaration: function StrToTime (const S : String) : Time;
15. TimeToStr - Returns a string that represents a DateTime value.
Declaration: TimeToStr(aTime: Time) : String;
MYOB EXO Clarity
20
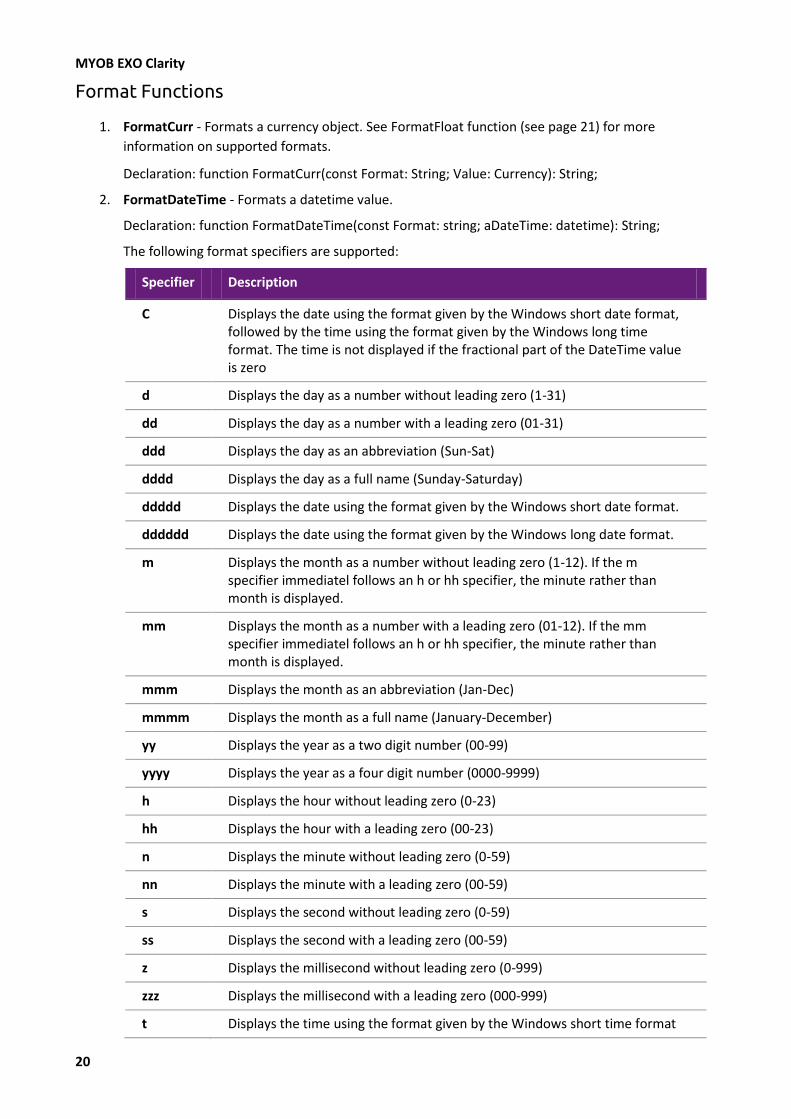
Format Functions
1. FormatCurr - Formats a currency object. See FormatFloat function (see page 21) for more
information on supported formats.
Declaration: function FormatCurr(const Format: String; Value: Currency): String;
2. FormatDateTime - Formats a datetime value.
Declaration: function FormatDateTime(const Format: string; aDateTime: datetime): String;
The following format specifiers are supported:
Specifier Description
C Displays the date using the format given by the Windows short date format, followed by the time using the format given by the Windows long time format. The time is not displayed if the fractional part of the DateTime value is zero
d Displays the day as a number without leading zero (1-31)
dd Displays the day as a number with a leading zero (01-31)
ddd Displays the day as an abbreviation (Sun-Sat)
dddd Displays the day as a full name (Sunday-Saturday)
ddddd Displays the date using the format given by the Windows short date format.
dddddd Displays the date using the format given by the Windows long date format.
m Displays the month as a number without leading zero (1-12). If the m specifier immediatel follows an h or hh specifier, the minute rather than month is displayed.
mm Displays the month as a number with a leading zero (01-12). If the mm specifier immediatel follows an h or hh specifier, the minute rather than month is displayed.
mmm Displays the month as an abbreviation (Jan-Dec)
mmmm Displays the month as a full name (January-December)
yy Displays the year as a two digit number (00-99)
yyyy Displays the year as a four digit number (0000-9999)
h Displays the hour without leading zero (0-23)
hh Displays the hour with a leading zero (00-23)
n Displays the minute without leading zero (0-59)
nn Displays the minute with a leading zero (00-59)
s Displays the second without leading zero (0-59)
ss Displays the second with a leading zero (00-59)
z Displays the millisecond without leading zero (0-999)
zzz Displays the millisecond with a leading zero (000-999)
t Displays the time using the format given by the Windows short time format

Clarity Report Designer
21
tt Displays the time using the format given by the Windows long time format
am/pm Uses the 12 hour clock for preceding h or hh specifier, and displays ‘am’ for any hours before noon and ‘pm’ for any hour after noon. The am/pm specifier can use lower, upper, or mixed case and the result is displayed accordingly.
a/p Uses the 12 hour clock for preceding h or hh specifier, and displays ‘a’ for any hours before noon and ‘p’ for any hour after noon. The a/p specifier can use lower, upper, or mixed case and the result is displayed accordingly.
ampm Uses the 12 hour clock for preceding h or hh specifier, and displays the windows AM symbol for any hour before noon and contents of Windows PM Symbol for any hour after noon.
/ Displays the date separator character given by the Windows date separator.
: Displays the time separator character given by the Windows time separator.
Example:
The following example assigns ‘The meeting is on Wednesday, February 15, 1995 at 10:30 AM’ to the string variable S.
S:= FormatDateTime(‘“The meeting is on “ dddd, mmmm d , yyyy, “ at “ hh:mmAM/PM’, strToDateTime(‘2/15/95 10:30am’));
3. FormatFloat- Formats a floating point value.
Declaration: function FormatFloat (const Format: String; Value: Extended): String;
The following format specifiers are supported:
Specifier Description
0 Digit placeholder. If the value being formatted has a digit in the position where the ‘0’ appears in the format string, then that digit is copied to the output string. Otherwise, a ‘0’ is stored in that position in the output string.
# Digit placeholder. If the value being formatted has a digit in the position where the ‘#’ appears in the format string, then that digit is copied to the output string. Otherwise, nothing is stored in that position in the output string.
. Decimal point. The first ‘.’ Character in the format string determines the location of the decimal separator in the formatted value; any additional ‘.’ Characters are ignored. The actual character used as a decimal separator in the output string is determined by the Windows decimal separator specified in the Number format of the International section in the Windows control panel.
,
Thousand separator. If the format string contains one or more ‘,’ characters, the output will that thousand separators inserted betweeneach group of three degits to the left of the decimal point. The placement and number of ‘,’ characters in the format string does not affect the output, except to indicate that thousand separators are wanted. The actual character used as thousand separator in the output is determined by the Windows thousand separator specified in the Number format of the International section in the Windows control panel.
MYOB EXO Clarity
22
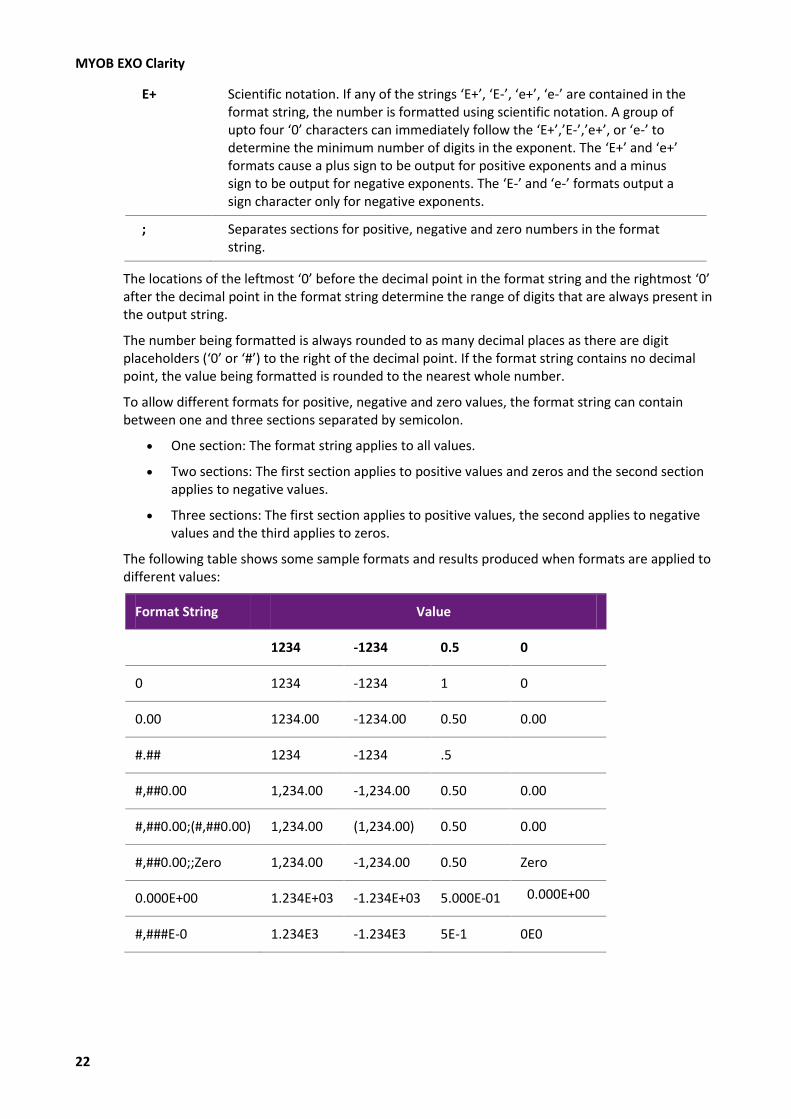
E+ Scientific notation. If any of the strings ‘E+’, ‘E-’, ‘e+’, ‘e-’ are contained in the format string, the number is formatted using scientific notation. A group of upto four ‘0’ characters can immediately follow the ‘E+’,’E-’,’e+’, or ‘e-’ to determine the minimum number of digits in the exponent. The ‘E+’ and ‘e+’ formats cause a plus sign to be output for positive exponents and a minus sign to be output for negative exponents. The ‘E-’ and ‘e-’ formats output a sign character only for negative exponents.
; Separates sections for positive, negative and zero numbers in the format string.
The locations of the leftmost ‘0’ before the decimal point in the format string and the rightmost ‘0’ after the decimal point in the format string determine the range of digits that are always present in the output string.
The number being formatted is always rounded to as many decimal places as there are digit placeholders (‘0’ or ‘#’) to the right of the decimal point. If the format string contains no decimal point, the value being formatted is rounded to the nearest whole number.
To allow different formats for positive, negative and zero values, the format string can contain between one and three sections separated by semicolon.
One section: The format string applies to all values.
Two sections: The first section applies to positive values and zeros and the second section applies to negative values.
Three sections: The first section applies to positive values, the second applies to negative values and the third applies to zeros.
The following table shows some sample formats and results produced when formats are applied to different values:
Format String Value
1234 -1234 0.5 0
0 1234 -1234 1 0
0.00 1234.00 -1234.00 0.50 0.00
#.## 1234 -1234 .5
#,##0.00 1,234.00 -1,234.00 0.50 0.00
#,##0.00;(#,##0.00) 1,234.00 (1,234.00) 0.50 0.00
#,##0.00;;Zero 1,234.00 -1,234.00 0.50 Zero
0.000E+00 1.234E+03 -1.234E+03 5.000E-01 0.000E+00
#,###E-0 1.234E3 -1.234E3 5E-1 0E0

Clarity Report Designer
23
Datetime Functions
1. CurrentDate - Returns the current date.
Declaration: function CurrentDate: Date;
2. CurrentDateTime - Returns the current date and time.
Declaration: function CurrentDateTime: DateTime;
3. CurrentTime - Returns the current time.
Declaration: fnction CurrentTime: DateTime;
4. DayOfWeek - Returns the day of week of the specified date as an integer between 1 and 7, where Sunday is the first day of the week and Saturday is the seventh.
Declaration: function DayOfWeek (aDate: DateTime) : Integer;
5. DecodeDate - Breaks the value specified as the Date parameter into year, month and day values. If the given time value is less than or equal to zero, the year, month and day return parameters are all set to zero.
Declaration: procedure DecodeDate(aDate: DateTime; var Year, Month, Day: Integer);
6. DecodeTime - Breaks a DateTime value into hours, minutes, seconds and milliseconds.
Declaration: procedure DecodeTime( aTime: DateTime; var Hour, Min, Sec, Msec: Integer);
7. EncodeDate - Returns a datetime value from the values specified as the Year, month and day parameters. The year must be between 1 and 9999. Valid month values are 1 throught 12. Valid day values are 1 through 28,29,30 or 31, depending on month value. For example, the possible day values for month 2(February) are 1 through 28 or 1 through 29, depending on whether or not the year is a leap year.
Declaration: function EncodeDate( Year, Month, Day: Integer): DateTime;
8. EncodeTime - Encodes the given hour, minute, second and millisecond into a DateTime value. Valid hour values are 0 through 23. Valid Min and Sec values are 0 through 59. Valid MSec values are 0 through 999.
Utility Functions
1. MessageBeep - Plays a waveform sound.
Declaration: procedure MessageBeep
2. ShowMessage - Displays a message box with an OK button. The Msg parameter is the message
string that appears in the message box.
Declaration: procedure ShowMessage (const Msg: string);
24
Clarity Dashboard Reporting Tools
Dashboard Introduction
MYOB EXO Business Dashboards
MYOB EXO Business Dashboards provide users (and particularly management) a quick, up-to-date view of:
Business performance
Items that need attention
Marketing and up-sell opportunities
Product performance and much more
The range of different dashboard views (also known as “dashboard reports”, “dashboard gadgets”, or just “Dashboards”) with which you can populate your Dashboard is only set to improve over time, giving users in any area of the company the ability to monitor performance indicators related to their department or the business as a whole.
Dashboard views can be set up on a user-by-user basis, keeping confidential information out of the wrong hands. Reports can be customised using the Clarity report writing tool to meet all your Dashboard requirements.
Who Would Use the Dashboard?
Anyone could benefit from using a carefully-designed set of Dashboard views, but not all views are useful for everyone. Consider some of the views that may be useful in a business environment (you may come up with a completely different list):
Senior Management: May like to see overall business performance, trends, customer satisfaction levels, and breakdown of each of these by branch. Overall financial status (incomings vs. outgoings) is also very important.
Branch Manager: Perhaps the branch manager needs to track performance of each member of staff using different metrics depending on what their role is, check on stock performance, monitor performance of sale items and be aware of overdue and problem accounts. Also may wish to view lists of loyal customers to offer them special discounts.
Accounts Payable: Needs to know which Creditor invoices are coming up for payment, and be notified if any are overdue. Needs quick access to this information so accounts can be paid promptly
Accounts Receivable: Similar requirements to Accounts Payable, but for Debtor accounts and invoices.
Marketing: What are the top-selling products? Who is buying them, and who is not? Why? Marketing needs a list of product performance, particularly over sale periods to assess how successful campaigns are.
Sales: Management wants to reward sales staff for high performance, so sales staff need to be able to see their performance matched against targets. It would also be useful to know which products are selling best, and who is buying.
Manufacturing: How is manufacturing performing? Are targets being met? What percentage of scrap has there been over the last week? Do some staff members need to lift their game?
All the above information can (potentially) be shown in Dashboard views.
Clarity Dashboard Reporting Tools
25
What is a Dashboard?
Dashboards are about conveying (often aggregated) information in a format that makes the data useful. It’s mostly about showing current information rather than historical, although historical information can be used for comparison. It allows you to see multiple aspects of your business and compare data at a glance, by showing you a number of “views” - each view should have something useful to report.
It’s not about a flashy view of data, it’s about making facts and figures clearly accessible. It’s about whittling down the masses of data available in your system and extracting trends and statistics that actually enable you to take action, save time and ultimately be more productive. In your Dashboard design, be careful to avoid reports that are difficult to interpret, present too much unnecessary detail, or duplicate existing reports without providing any added benefit.
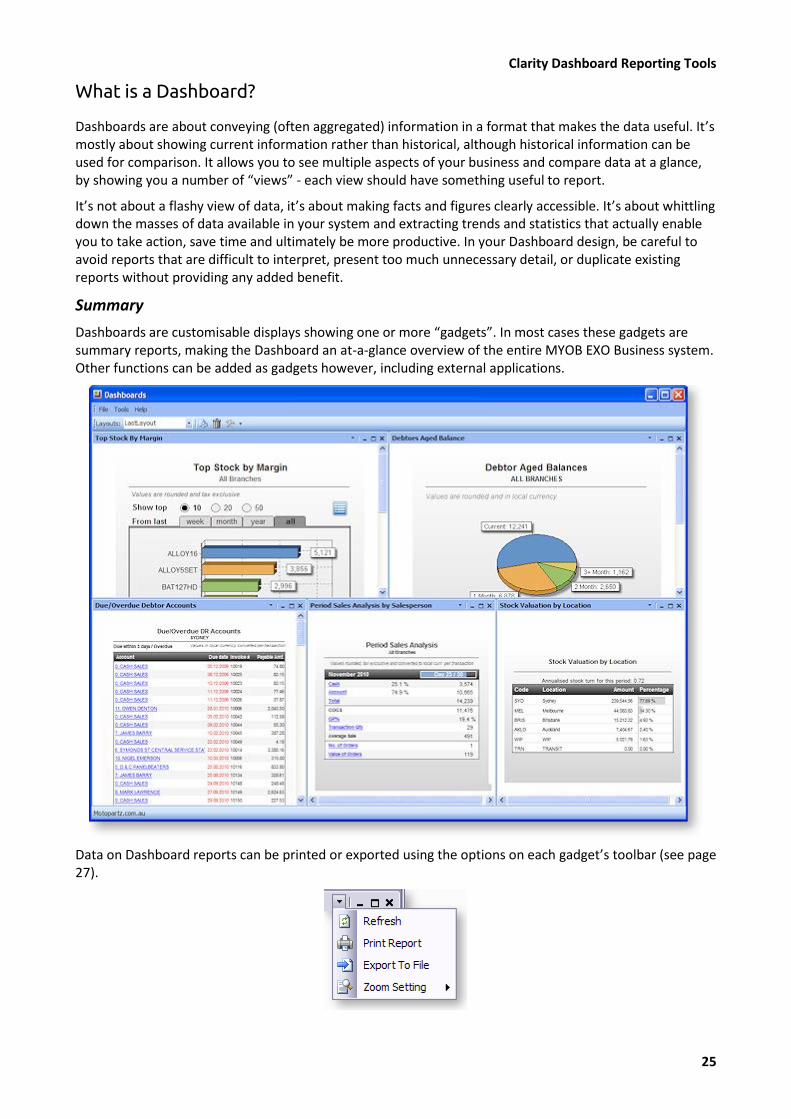
Summary
Dashboards are customisable displays showing one or more “gadgets”. In most cases these gadgets are summary reports, making the Dashboard an at-a-glance overview of the entire MYOB EXO Business system. Other functions can be added as gadgets however, including external applications.
Data on Dashboard reports can be printed or exported using the options on each gadget’s toolbar (see page 27).

MYOB EXO Clarity
26
Is it “Business Intelligence”?
There are many tools available on the market for analysing data, collectively known as Business Intelligence (BI) tools.
The Dashboard is not strictly a BI tool, but there are many BI tools available from 3rd parties that could be configured to work with MYOB EXO Business (basically anything that is MS SQL Server compatible). These allow you to slice and dice your data, report on it, drill up and down as much as you like, and you can pretty much track or compare anything in your database with relative ease.
Unfortunately, these tools usually require a huge amount of skilled setup, invariably at great cost, and with the amount of flexibility there can be information overload unless it is continually handled properly.
The Dashboard tool is not nearly as powerful as one of these tools (nor does it claim to be), but the benefits are that it is built into the MYOB EXO Business product, supported and updated by MYOB, and it uses the already-familiar Clarity Designer for implementing changes.
Note: MYOB EXO Business Dashboard views are not currently based on an OLAP (On-line Analytical Processing) backend, and are effectively just regular Clarity reports designed for showing aggregated data in a multi-port view. Because of this, if your Dashboard report queries are not designed properly they may take a long time to calculate, slowing down the system each time they refresh – particularly if you show multiple copies at once.
Clarity Charts (TeeCharts)
Clarity now comes with an extremely powerful charting component on which many of the standard Dashboard views are based. Using the charts wisely can clarify and enhance your reports, and allow you to present data on Dashboards as quick visual indicators.
Charts are not limited to Dashboard use, but can be used anywhere on any Clarity report.
Clarity Dashboard Reporting Tools
27
Dashboard Basics
General Features
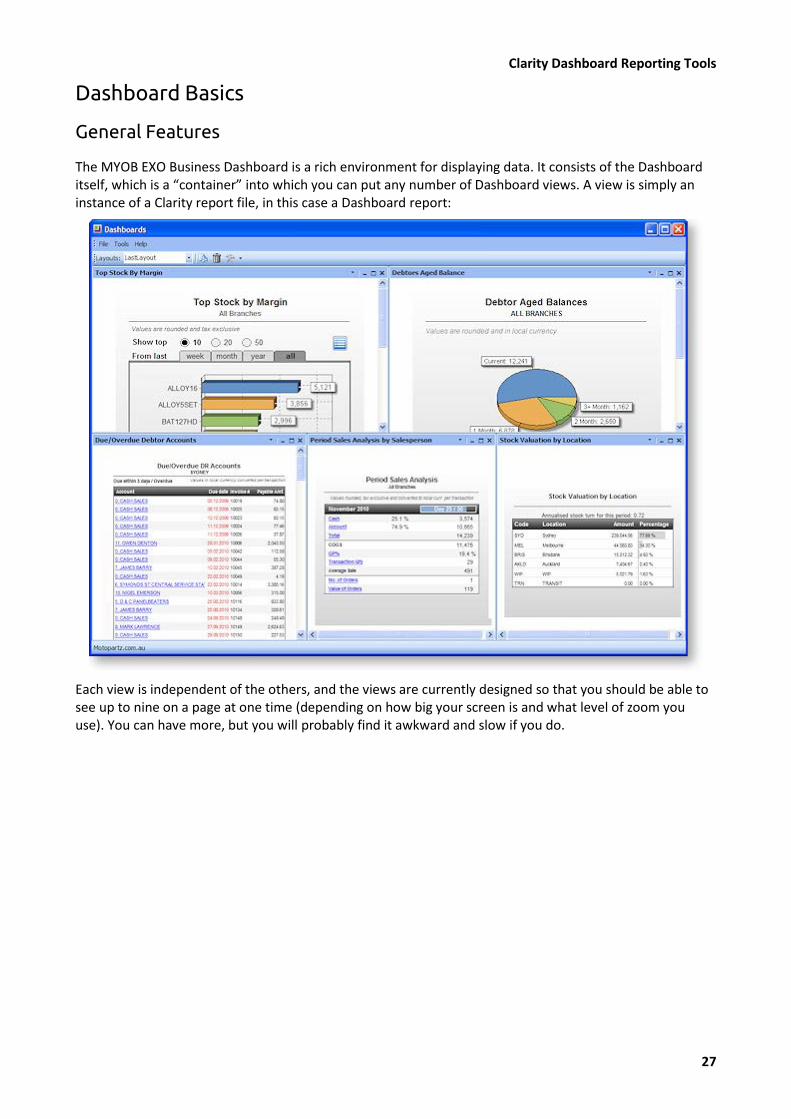
The MYOB EXO Business Dashboard is a rich environment for displaying data. It consists of the Dashboard itself, which is a “container” into which you can put any number of Dashboard views. A view is simply an instance of a Clarity report file, in this case a Dashboard report:
Each view is independent of the others, and the views are currently designed so that you should be able to see up to nine on a page at one time (depending on how big your screen is and what level of zoom you use). You can have more, but you will probably find it awkward and slow if you do.

MYOB EXO Clarity
28
Dashboard Controls
The Dashboard views each have their own controls for refresh, printing, export and zoom, and each one can be refreshed individually if required. Individual views are resizeable. The adjacent views, if any, will resize accordingly depending on where it is docked. Views can be made to zoom to 100%, fit to the assigned view width, or fit to the total available space (width and height).
Layouts
Dashboard layouts can be saved, and you can have as many different layouts as you like. For each layout that you save, the size, position and properties that you currently have selected for the Dashboard will be stored. Dashboard layouts can then be easily selected from the dropdown list.

Clarity Dashboard Reporting Tools
29
Parameters
Tools > Setup Dashboards > Double Click Dashboard Name >
Each Dashboard has a set of parameters associated with it, in the same format as regular Clarity command line parameters. These can be modified by opening the parameter dialog box:
Permissions
Tools > Setup Dashboards > Double Click Dashboard Name > Access Permissions dropdown
A Dashboard report can be either public or private. A user profile determines whether you have access to private, public or no Dashboards at all. By default, Dashboard views are set to be “Public”.
Permissions can be set for each view that you create and add to the set. These can be set to either Public or Private:
The permissions on a view affect who can see the report based on the user’s “Dashboard access level” profile setting. The allowed settings are:
0 – Full access. The user can create, view, modify and delete any Dashboard views regardless of the Dashboard’s public or private setting.
1 – Limited. Can view public Dashboard and/or create/modify/delete private Dashboards that the user has created. The user has no access to private Dashboards created by other users.
2 – Read Only. Can only view public Dashboards. The user cannot create their own Dashboard and has no access at all to private Dashboards created by other users.
3 – Restricted. This user has no access to any Dashboards and the Dashboard screen. The user will receive an error message when they try to access the Dashboard from the menu. Similarly, they will not be able to dock the Dashboard screen in the Business Flow menu.

MYOB EXO Clarity
30
Using the Dashboard
Dashboard Setup
Tools > Setup Dashboards > New Item
The dashboard setup screen is accessible from the Dashboard screen or via a menu option that can be added to the MYOB EXO Business menu using the Menu Designer.
To add a new Dashboard view, click the New button. Provide the name of the view and the report settings (see further down for Report Settings). Refresh frequency can be set to every 5, 10, 30 minutes or every hour. If you have an intensive Dashboard report, it is recommended that the report is refreshed every hour or not at all, or you may find it affects other users of the system. The default is none, the report will not refresh. The access permission defaults to Public (see the section on Dashboard visibility and access). The default zoom setting is 100 Percent.

Clarity Dashboard Reporting Tools
31
Personal Dashboard List
This is a drop-down list showing all the Dashboard views that you have access to. You only have to choose those views that you want to display in your layout. If your access rights change, your list of available views will reflect this. If a view is already docked in the layout for some reason and your access to that view is revoked, it will not be loaded and will be removed from the Personal Dashboard list. You can customise the list of views by clicking Personal Dashboard List...
The list of available views may not necessarily be the same as your personal list. Depending on the setup of the organization, there may be significant number of Dashboards available to all users. The Personal Dashboard List allows you to selectively choose the views that are of interest to you. The selected views are the only ones that will be available in the drop-down list.
MYOB EXO Clarity
32
Dashboard Report Setting
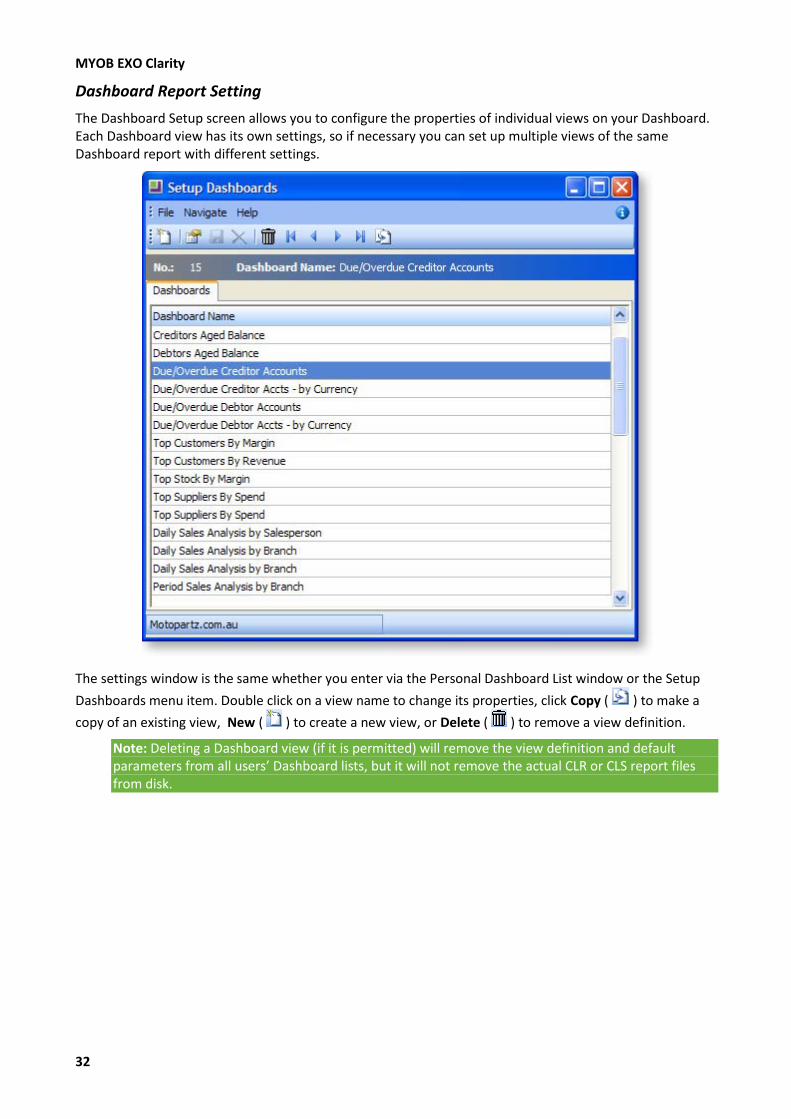
The Dashboard Setup screen allows you to configure the properties of individual views on your Dashboard. Each Dashboard view has its own settings, so if necessary you can set up multiple views of the same Dashboard report with different settings.
The settings window is the same whether you enter via the Personal Dashboard List window or the Setup
Dashboards menu item. Double click on a view name to change its properties, click Copy ( ) to make a
copy of an existing view, New ( ) to create a new view, or Delete ( ) to remove a view definition.
Note: Deleting a Dashboard view (if it is permitted) will remove the view definition and default parameters from all users’ Dashboard lists, but it will not remove the actual CLR or CLS report files from disk.
Clarity Dashboard Reporting Tools
33
Multiple Layouts
You can set up as many different layouts as you like, perhaps for different tasks at different times of the day, or for multiple users who may log in under the same user account, but want to see different Dashboard layouts. When you save a new Dashboard layout (see page 28), each of the current Dashboard views are saved along with their current position, size and location, so that next time you open the Dashboard with that layout it will appear just as you saved it, but with the most recent data.
To save a layout, simply click on the Save Layout button on the toolbar:
Docking and Resizing
Note: Manoeuvring and docking Dashboard views into the Dashboard workspace in a configuration that you’d like can sometimes be tricky if you don’t understand what’s going on. Please read this topic carefully.
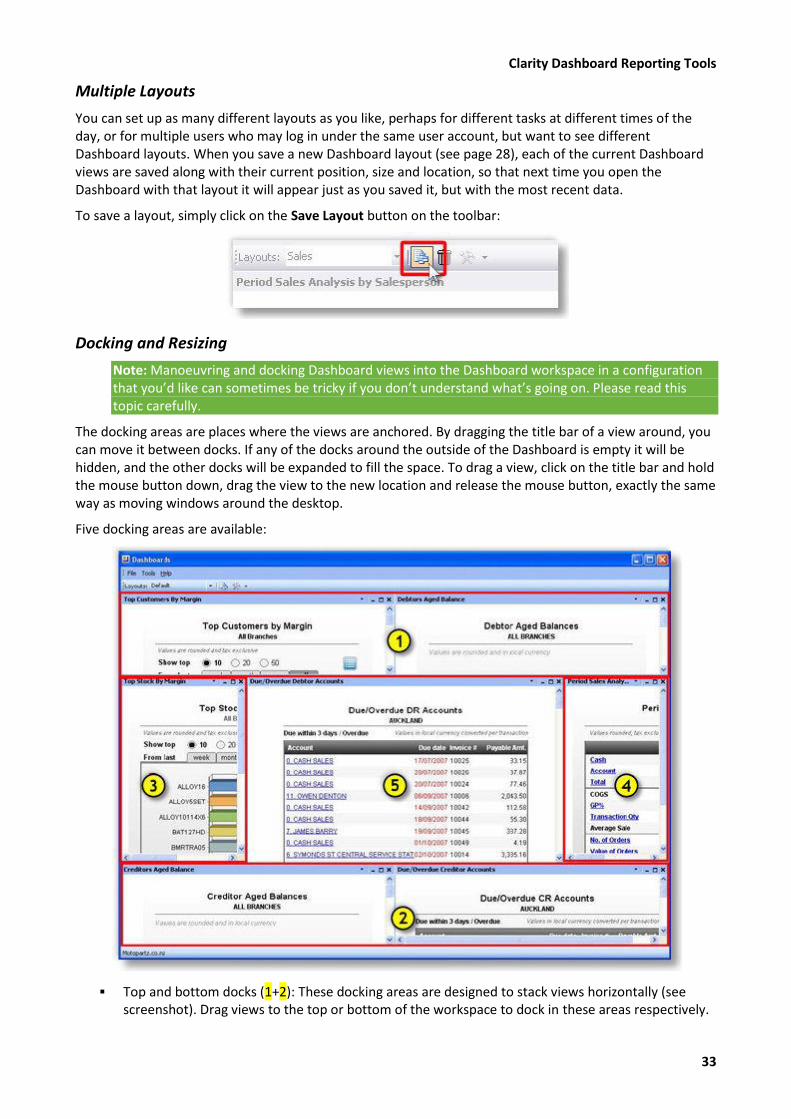
The docking areas are places where the views are anchored. By dragging the title bar of a view around, you can move it between docks. If any of the docks around the outside of the Dashboard is empty it will be hidden, and the other docks will be expanded to fill the space. To drag a view, click on the title bar and hold the mouse button down, drag the view to the new location and release the mouse button, exactly the same way as moving windows around the desktop.
Five docking areas are available:
Top and bottom docks (1+2): These docking areas are designed to stack views horizontally (see screenshot). Drag views to the top or bottom of the workspace to dock in these areas respectively.