Embed Size (px)
Citation preview

TARKIO FUND (TARKX)
CLARK FORK TRUST
ANNUAL REPORT
MAY 31, 2018

TARKIO FUND LETTER TO SHAREHOLDERS
MAY 31, 2018 (UNAUDITED)
1
Management’s Discussion of Fund Performance
The fiscal year ended May 31, 2018 for the Tarkio Fund (the “Fund”) was marked by 7 months of steady positive performance in the stock market followed by 5 months of choppy performance. The total return for the S&P 500® Index (the “Index”) from June 1, 2017 to January 31, 2018 was 17.63%, while its total return for the full-year ended May 31, 2018 was 13.51%. The Tarkio Fund gained 17.30% and 10.21%, respectively, for those same periods.
We, as the Fund’s investment advisor, believe short-term fluctuations are
random in nature. For that reason, we believe long-term performance is a better measure of the effectiveness of our investment process. As such, we are particularly proud of being recognized by Money Magazine as the nation’s #1 performing midcap fund for the five-year period ending December 31, 2017. For a more thorough understanding of our investment process, including a description of our investment criteria and how we apply these criteria to our particular companies, we encourage you to read our past shareholder letters, available at www.tarkiofund.com/shareholder-info, as well as the Fund’s prospectus, which can be obtained for by calling 866-738-3629 or downloaded at www.tarkiofund.com. We note our past shareholder letters are typically included with our quarterly account statements for shareholders that invest directly with the fund.
We believe 2009 marked the bottom of a bear market period that began in
2000. We also believe that there are strong correlations between the low point in the stock market in 1974 and the low point in 2009. The 1974 bear market bottom spawned a stock market tailwind that produced a 13.7% compounded return for the Index during the ensuing twenty-five years, as company valuations caught up with, and surpassed, the intrinsic valuations of the businesses they represented. We have believed since March of 2009 that we are in the early to middle stages of a similar tailwind, and we believe the past year is not inconsistent with this thesis.
Our belief is that companies that empower, engage and energize their employees will outperform their peers in the marketplace, and in turn, their stocks can outperform the passive stock market indexes over long periods of time. We believe that this concept has rewarded Fund shareholders over time.
The investment strategy of the Fund is to identify attractive stocks based on
management criteria that we believe have the potential to foster an organizational culture that can, over time, give the company a competitive advantage. As the Fund’s advisor, our qualitative review of a company is substantially focused on culture, where we attempt to identify the following management principles: integrity, passion and purpose, long-term focus, teamwork, employee empowerment, and disciplined capital allocation.
On May 31, 2018, the Fund was 99.81% invested in common stocks, allocated among 34 companies. Portfolio turnover for the year ended May 31, 2018 was 27.67%.
Holdings constituting greater than 5% of the Tarkio Fund portfolio as of May
31, 2018 were as follows: Century Link (9.96%), Cognex (9.43%), YRC Worldwide

TARKIO FUND LETTER TO SHAREHOLDERS (CONTINUED)
MAY 31, 2018 (UNAUDITED)
2
(7.82%), Rogers (7.62%), and Total System Services (6.02%). Position sizes will change frequently based on target investment levels, redemption needs of the Fund’s shareholders, fluctuations in market price, and our view of investment opportunity. When cash moves into the Fund our goal is to put the money to work in our best ideas, which may result in a change in the position sizes of our portfolio companies.
We attempt to think in terms of multi-year periods when making investment
decisions for the Fund. As Ben Graham said, “in the short run, the market is a voting machine but in the long run, it is a weighing machine.” That said, we will highlight several companies that affected Fund performance this year:
Cognex (a developer of machine vision software and hardware) started the
fiscal year at $42.45 per share, adjusted for splits, and got as high as $72.99 and as low as $39.90 before ending the year at $44.61. While this looks like pretty flat performance from year to year, the stock helped drive the Fund’s positive performance during the first half of the fiscal year, while more recently we were able to add to what we believe is one of the Fund’s best positions at what we believe was an attractive valuation.
It was a similar story for Rogers (a developer of materials, including printed
circuit board materials for cellular and other high frequency signals). Rogers’ stock started the year at $108.94 and ended relatively flat at $113.96. But in between, the stock price went as high as $184 and then as low as $105. Again, we were able to add to the Fund’s position at what we believe was a reasonable valuation.
Given the size of the positions of Rogers and Cognex, the Fund’s strong
performance during the 2016 and 2017 calendar years was substantially aided by the performance of these two companies. The Fund first established positions in both these companies near its inception in 2011, and the lowest price at which the Fund purchased Cognex was $7.69 per share, and the lowest price for Rogers was $37.47 per share. We believe that both companies continue to possess unique characteristics that should give them an equally bright future indefinitely going forward. After such a strong multi-year run for both companies, the stock prices for Cognex and Rogers took a breather in the second half of last fiscal year, declining at times in the second half of the fiscal year by as much as 45% and 43%, respectively. These short term fluctuations significantly contributed to the Fund underperforming the Index for the fiscal year.
The performance of Finisar (maker of optical components for fiber optics and
electronics that comprised 3.52% of the Fund’s portfolio as of May 31, 2018) also contributed to the Fund’s underperformance of the Index. Finisar started the fiscal year at $24.66 and ended the fiscal year at $16.21, a decrease of 34%.
The price of CenturyLink (a global communications and IT services company
that originally entered the Fund’s portfolio when it acquired the Fund’s longtime holding Level 3 Communications) went down almost 30% from the beginning of the year to the end of the year, but the Fund actually increased its unrealized gain on the company during that period because we were able to buy a significant amount at prices we believed

TARKIO FUND LETTER TO SHAREHOLDERS (CONTINUED)
MAY 31, 2018 (UNAUDITED)
3
were attractive. Importantly, many of CenturyLink’s key management team are former Level 3 people.
The Container Store (a retail company that sells organizational solutions and
comprised 4.04% of the Fund’s portfolio by May 31, 2018) was one of the Fund’s worst performing stocks during the first half of the fiscal year (again, allowing us to add significantly to the Fund’s position), but its performance over the past two quarters resulted in a 29% gain for the full fiscal year, helping buoy Fund performance.
Another strong performer in the Fund was Total System Services (an electronic
payment processor), which went up from $59.49 to $85.19 during the fiscal year ended May 31, 2018, which represents an increase of 43%.
We focus on evaluating individual companies and do not try to categorize our
positions by industry or sector. We do not actively seek to rebalance the Fund’s portfolio, and the portfolio’s percentage ownership in any one sector may change, often substantially, as a result of changes in the price of securities in the portfolio as well as ongoing trading activity. We believe these fluctuations are the primary reason for sector adjustments, rather than any conscious effort to overweight certain segments of the economy.
An important component that will drive the performance of the Fund over time
is the expense incurred by its shareholders. The average expense ratio for the Fund during the year was 1.0%.
We appreciate your continued trust in us and thank you for your investment in
the Tarkio Fund!
Russell T. Piazza

TARKIO FUND PERFORMANCE ILLUSTRATION
MAY 31, 2018 (UNAUDITED)
4
AVERAGE ANNUAL RETURNS FOR PERIOD JUNE 28, 2011* THROUGH MAY 31, 2018
1 Year 3 Years 5 Years Since
Inception Ending Value
Tarkio Fund 10.21% 11.63% 14.47% 11.87% $ 21,735 S&P 500 Index ® 14.37% 10.96% 12.97% 13.59% $ 24,160
Cumulative Performance Comparison of $10,000 Investment Since Inception *
$7,000
$9,000
$11,000
$13,000
$15,000
$17,000
$19,000
$21,000
$23,000
$25,000
$27,000
Jun-
11
Nov-
11
May-
12
Nov-
12
May-
13
Nov-
13
May-
14
Nov-
14
May
-15
Nov-
15
May-
16
Nov-
16
May
-17
Nov-
17
May-
18
Tarkio Fund S&P 500 Index ®
* Date of commencement of investment operations is June 28, 2011. This chart assumes an initial investment of $10,000 made on the closing of June 28, 2011 (commencement of investment operations). Total return is based on the net change in net asset value (NAV) and assumes reinvestment of all dividends and other distributions. Investment return and principal value will fluctuate so that your shares, when redeemed, may be worth more or less than their original cost. The performance also reflects reinvestment of all dividend and capital gain distributions. The returns shown do not reflect taxes that a shareholder would pay on fund distributions or on the redemption of fund shares. The Standard & Poor’s 500 Index ® (“S&P 500”) is a market value-weighted index, representing the aggregate market value of the common equity of 500 stocks primarily traded on the New York Stock Exchange. The S&P 500 is a widely recognized, unmanaged index of common stock prices. The figures for the S&P 500 reflect all dividends reinvested but do not reflect any deductions for fees, expenses or taxes. The performance information shown represents past performance and should not be interpreted as indicative of the Fund's future performance.

TARKIO FUND PORTFOLIO ILLUSTRATION
MAY 31, 2018 (UNAUDITED)
5
The following chart gives a visual breakdown of the Fund by the sectors the underlying securities represent as a percentage of the portfolio of investments.
Basic Materials
2.26%
Communication Services
9.96%
Consumer Cyclical
6.08%
Consumer Defensive
4.83%
Exchange Traded Fund
0.16%
Financial Services
11.23%
Industrials
25.46%
Money Market Fund
0.06%
Real Estate
4.04%
Technology
35.92%
Sectors are categorized using Morningstar® classifications.

TARKIO FUND SCHEDULE OF INVESTMENTS
MAY 31, 2018
6
Shares Value
COMMON STOCK - 99.81%
Arrangement of Transportation of Freight & Cargo - 2.19% 30,250 Expeditors International of Washington, Inc. $ 2,253,020
Communications Equipment - 3.20% 56,000 Lumenthum Holdings, Inc. * 3,290,000
Construction Machinery & Equipment - 2.26% 94,700 Manitowoc Co., Inc. * 2,319,203 Drawing & Insulation of Nonferrous Wire - 1.29% 48,875 Corning, Inc. 1,327,934 Fire, Marine & Casualty Insurance - 3.53% 4,275 Berkshire Hathaway, Inc. Class B * 818,791 4,675 Fairfax Financial Holdings, Ltd. (Canada) 2,617,345 175 Markel Corp. * 191,989
3,628,125 Food & Kindred Products - 0.31% 9,325 Campbell Soup Co. 313,693 Industrial Instruments for Measurement, Display & Control - 14.09% 212,025 Cognex Corp. 9,691,663 48,125 Danaher Corp. 4,777,850
14,469,513 Industrial Trucks, Tractors, Trailers & Stackers - 4.70% 121,900 Terex Corp. 4,824,802 Land Subdividers & Developers (No cemeteries) - 4.04% 233,000 The St. Joe Co. * 4,147,400
Miscellaneous Electrical Machinery, Equipment & Supplies - 0.11% 107,900 Evans & Sutherland Computer Corp. * 112,216 Motor Vehicle Parts & Accessories - 0.04% 1,750 Gentex Corp. 42,053 National Commercial Banks - 0.99% 9,500 JPMorgan Chase & Co. 1,016,595 Office Furniture - 3.38% 106,125 Herman Miller, Inc. 3,475,594
* Non-income producing securities during the period. The accompanying notes are an integral part of these financial statements.

TARKIO FUND SCHEDULE OF INVESTMENTS (CONTINUED)
MAY 31, 2018
7
Shares Value Plastic Materials, Synth Resins & Nonvulcan Elastomers - 7.62% 68,675 Rogers Corp. * $ 7,826,203 Printed Circuit Boards - 1.61% 88,350 Kimball Electronics, Inc. * 1,652,145 Pumps & Pumping Equipment - 0.47% 15,600 Colfax Corp. * 477,048
Retail-Catalog & Mail-Order Houses - 0.02% 15 Amazon.com, Inc. * 24,444 Retail-Eating Places - 0.78% 1,850 Chipotle Mexican Grill, Inc. * 795,833 Retail-Home Furniture, Furnishings & Equipment Stores - 4.04% 541,900 The Container Store Group, Inc. * 4,150,954
Retail-Variety Stores - 4.53% 23,450 Costco Wholesale Corp. 4,648,728 Security Brokers, Dealers & Flotation Companies - 0.69% 11,125 SEI Investments Co. 709,553 Semiconductors & Related Devices - 6.01% 223,100 Finisar Corp. * 3,616,451 298,450 Oclaro, Inc. * 2,554,732
6,171,183 Services-Business Services, NEC - 6.02% 72,600 Total System Services, Inc. 6,184,794 Services-Computer Integrated Systems Design - 2.90% 49,850 Cerner Corp. * 2,975,048 Services-Prepackaged Software - 3.08% 75,975 National Instruments Corp. 3,162,080
Steel Works, Blast Furnaces & Rolling Mills (Coke Ovens) - 2.26% 36,125 Nucor Corp. 2,318,864 Telephone & Telegraph Apparatus - 0.67% 30,050 Ciena Corp. * 692,652
* Non-income producing securities during the period. The accompanying notes are an integral part of these financial statements.

TARKIO FUND SCHEDULE OF INVESTMENTS (CONTINUED)
MAY 31, 2018
8
Shares Value Telephone Communications (No Radiotelephone) - 9.96% 561,584 CenturyLink, Inc. $ 10,232,060 Textile Mill Products - 1.20% 54,150 Interface, Inc. 1,229,205 Trucking (No Local) - 7.82% 748,925 YRC Worldwide, Inc. * 8,028,476
TOTAL FOR COMMON STOCK (Cost $77,446,422) - 99.81% 102,499,418
EXCHANGE TRADED FUND - 0.16% 4,475 ProShares UltraShort 20+ Year Treasury 163,024
TOTAL FOR EXCHANGE TRADED FUND (Cost $155,915) - 0.16% 163,024
SHORT-TERM INVESTMENTS - 0.06%
61,084 Federated Government Obligations Fund - Institutional Class 1.61% ** (Cost $61,084) 61,084
TOTAL INVESTMENTS (Cost $77,663,421) - 100.03% 102,723,526
LIABILITIES IN EXCESS OF OTHER ASSETS - (0.03)% (33,542)
NET ASSETS - 100.00% $102,689,984
* Non-income producing securities during the period. ** The rate shown represents the 7-day yield at May 31, 2018. The accompanying notes are an integral part of these financial statements.

TARKIO FUND STATEMENT OF ASSETS AND LIABILITIES
MAY 31, 2018
9
Assets: Investments in Securities, at Value (Cost $77,663,421) $102,723,526 Cash 1,000 Receivables: Dividends and Interest 68,640
Total Assets 102,793,166
Liabilities: Payables: Shareholder Redemptions 15,507 Accrued Adviser Fees 65,756 Accrued Service Fees 21,919
Total Liabilities 103,182
Net Assets $102,689,984
Net Assets Consist of: Paid In Capital $ 75,593,844 Accumulated Net Realized Gain on Investments 2,036,035 Net Unrealized Appreciation in Value of Investments 25,060,105
Net Assets, for 5,004,149 Shares Outstanding (unlimited shares authorized) $102,689,984
Net asset value, offering price, and redemption price per share $ 20.52
The accompanying notes are an integral part of these financial statements.

TARKIO FUND STATEMENT OF OPERATIONS For the year ended MAY 31, 2018
10
Investment Income: Dividends (Net of foreign withholding tax of $6,825) $ 1,254,758 Interest 3,563
Total Investment Income 1,258,321
Expenses: Advisory Fees (Note 4) 716,373 Service Fees (Note 4) 238,791
Total Expenses 955,164
Net Investment Income 303,157
Realized and Unrealized Gain (Loss) on Investments: Net Realized Gain on Investments 3,542,680 Net Change in Unrealized Appreciation on Investments 3,600,744
Net Realized and Unrealized Gain on Investments 7,143,424
Net Increase in Net Assets Resulting from Operations $ 7,446,581
The accompanying notes are an integral part of these financial statements.

TARKIO FUND STATEMENTS OF CHANGES IN NET ASSETS
11
Year Ended Year Ended 5/31/2018 5/31/2017 Increase in Net Assets From Operations: Net Investment Income (Loss) $ 303,157 $ (18,850) Net Realized Gain on Investments 3,542,680 194,890 Net Change in Unrealized Appreciation on Investments 3,600,744 14,300,586
Net Increase in Net Assets Resulting from Operations 7,446,581 14,476,626
Distributions to Shareholders: Net Investment Income (162,535) (17,059) Realized Gains (1,550,988) (234,392)
Total Dividends and Distributions Paid to Shareholders (1,713,523) (251,451)
Capital Share Transactions (Note 5): Proceeds from Sale of Shares 30,500,538 23,977,752 Net Asset Value of Shares Issued on Reinvestment of Dividends 1,713,523 251,451 Cost of Shares Redeemed (8,203,249) (873,724)
Net Increase in Net Assets from Shareholder Activity 24,010,812 23,355,479
Net Assets: Net Increase in Net Assets 29,743,870 37,580,654 Beginning of Year 72,946,114 35,365,460
End of Year (Including Accumulated Undistributed $ 102,689,984 $ 72,946,114
Net Investment Income of $0 and $0, respectively)
The accompanying notes are an integral part of these financial statements.

TARKIO FUND FINANCIAL HIGHLIGHTS Selected data for a share outstanding throughout the period:
12
Years Ended
5/31/2018 5/31/2017 5/31/2016 5/31/2015 5/31/2014 Net Asset Value, at Beginning of Year $ 18.93 $ 14.40 $ 15.12 $ 13.67 $ 10.99
Income From Investment Operations: Net Investment Income (Loss) * 0.07 (0.01) - (a) - (a) - (a) Net Gain (Loss) on Investments Securities (Realized and Unrealized) 1.89 4.62 (0.67) 1.77 2.74
Total from Investment Operations 1.96 4.61 (0.67) 1.77 2.74
Distributions: Net Investment Income (0.04) (0.01) - - (a) - Realized Gains (0.33) (0.07) (0.05) (0.32) (0.06)
Total from Distributions (0.37) (0.08) (0.05) (0.32) (0.06)
Net Asset Value, at End of Year $ 20.52 $ 18.93 $ 14.40 $ 15.12 $ 13.67
Total Return ** 10.21% 32.07% (4.41)% 13.04% 24.98% Ratios/Supplemental Data: Net Assets at End of Year (Thousands) $102,690 $72,946 $ 35,365 $29,392 $ 21,768 Before Waivers Ratio of Expenses to Average Net Assets 1.00% 1.00% 1.00% 1.00% 1.03% Ratio of Net Investment Income (Loss) to Average Net Assets 0.32% (0.04)% (0.02)% (0.02)% (0.03)% After Waivers Ratio of Expenses to Average Net Assets 1.00% 1.00% 1.00% 1.00% 1.00% Ratio of Net Investment Income (Loss) to Average Net Assets 0.32% (0.04)% (0.02)% (0.02)% 0.00%(a) Portfolio Turnover 27.67% 9.71% 12.19% 12.03% 19.29%
(a) Amount calculated is less than 0.005. * Per share net investment income (loss) has been determined on the basis of average shares method. ** Total Return represents the rate that the investor would have earned or lost on an investment in the Fund assuming reinvestment of all Fund distributions. The accompanying notes are an integral part of these financial statements.

TARKIO FUND NOTES TO FINANCIAL STATEMENTS
MAY 31, 2018
13
1. ORGANIZATION The Clark Fork Trust (the “Trust”) is registered as an open-end management investment company under the Investment Company Act of 1940 (the “Act”) and was organized as a statutory trust under the laws of Delaware by the filing of a Certificate of Trust on October 28, 2010. The Trust is authorized to issue one or more series of beneficial interests and issue classes of any series or divide shares of any series into two or more separate classes. The Trust currently consists of one series of units of beneficial interest (“shares”) called the Tarkio Fund (the “Fund”). The Fund is a non-diversified fund. The investment adviser to the Fund is Front Street Capital Management, Inc. (the “Adviser”). The Fund’s investment objective is long term growth of capital. 2. SIGNIFICANT ACCOUNTING POLICIES The following is a summary of significant accounting policies followed by the Fund in the preparation of its financial statements. These policies are in conformity with accounting principles generally accepted in the United States of America (“GAAP”). The Fund is considered an investment company under GAAP and follows the accounting and reporting guidance applicable to investment companies in the Financial Accounting Standards Board Accounting Standards Codification Topic 946-Financial Services-
Investment Companies. SECURITY VALUATIONS: All investments in securities are recorded at their estimated fair value, as described in Note 3. FEDERAL INCOME TAXES: The Fund’s policy is to comply with the requirements of Subchapter M of the Internal Revenue Code that are applicable to regulated investment companies and to distribute all of its taxable income to their shareholders. Therefore, no federal income tax provision is required. It is the Fund’s policy to distribute annually, prior to the end of the calendar year, dividends sufficient to satisfy excise tax requirements of the Internal Revenue Code. This Internal Revenue Code requirement may cause an excess of distributions over the book year-end accumulated income. In addition, it is the Fund’s policy to distribute annually, after the end of the fiscal year, any remaining net investment income and net realized capital gains. The Fund recognizes the tax benefits of certain tax positions only where the position is “more likely than not” to be sustained assuming examination by tax authorities. Management has analyzed the Fund’s tax positions, and has concluded that no liability for unrecognized tax benefits should be recorded as of or during the year ended May 31, 2018. The Fund identifies its major tax jurisdiction as U.S. Federal Tax; however the Fund is not aware of any tax positions for which it is reasonably possible that the total amounts of unrecognized tax benefits will change materially in the next twelve months.

TARKIO FUND NOTES TO FINANCIAL STATEMENTS (CONTINUED)
MAY 31, 2018
14
The Fund recognizes interest and penalties, if any, related to unrecognized tax benefits as income tax expense in the Statement of Operations when incurred. During the year ended May 31, 2018, the Fund did not incur any interest or penalties. USE OF ESTIMATES: The preparation of financial statements in conformity with GAAP requires management to make estimates and assumptions that affect the reported amounts of assets and liabilities and disclosure of contingent assets and liabilities at the date of the financial statements. Actual results could differ from those estimates. DISTRIBUTIONS TO SHAREHOLDERS: Distributions to shareholders, which are determined in accordance with income tax regulations, are recorded on the ex-dividend date. The treatment for financial reporting purposes of distributions made to shareholders during the year from net investment income or net realized capital gains may differ from their ultimate treatment for federal income tax purposes. These differences are caused primarily by differences in the timing of the recognition of certain components of income, expense, or realized capital gain for federal income tax purposes. Any such reclassifications will have no effect on net assets, results of operations or net asset value per share of the Fund. OTHER: The Fund records security transactions on the trade date. Dividend income is recognized on the ex-dividend date. Interest income is recognized on an accrual basis. The Fund uses the specific identification method in computing gain or loss on sale of investment securities.
3. SECURITIES VALUATIONS The Fund utilizes various methods to measure the fair value of its investments on a recurring basis. GAAP establishes a hierarchy that prioritizes inputs to valuation methods. The three levels of inputs are: Level 1 - Unadjusted quoted prices in active markets for identical assets or liabilities that the Fund has the ability to access. Level 2 - Observable inputs other than quoted prices included in Level 1 that are observable for the asset or liability, either directly or indirectly. These inputs may include quoted prices for the identical instrument on an inactive market, prices for similar instruments, interest rates, prepayment speeds, credit risk, yield curves, default rates and similar data. Level 3 - Unobservable inputs for the asset or liability, to the extent relevant observable inputs are not available, representing the Fund’s own assumptions about the assumptions a market participant would use in valuing the asset or liability, and would be based on the best information available. The availability of observable inputs can vary from security to security and is affected by a wide variety of factors, including, for example, the type of security, whether the security is new and not yet established in the marketplace, the liquidity of markets, and

TARKIO FUND NOTES TO FINANCIAL STATEMENTS (CONTINUED)
MAY 31, 2018
15
other characteristics particular to the security. To the extent that valuation is based on models or inputs that are less observable or unobservable in the market, the determination of fair value requires more judgment. Accordingly, the degree of judgment exercised in determining fair value is greatest for instruments categorized in Level 3. The inputs used to measure fair value may fall into different levels of the fair value hierarchy. In such cases, for disclosure purposes, the level in the fair value hierarchy within which the fair value measurement falls in its entirety, is determined based on the lowest level input that is significant to the fair value measurement in its entirety. FAIR VALUE MEASUREMENTS: A description of the valuation techniques applied to the Fund’s major categories of assets and liabilities measured at fair value on a recurring basis follows. Equity securities (common stock) - Equity securities are valued by using market quotations furnished by a pricing service when the Adviser believes such prices accurately reflect the fair value of such securities. Securities that are traded on any stock exchange are valued by the pricing service at the last quoted sale price. Lacking a last sale price, an exchange traded security is valued by the pricing service at its last bid price. To the extent these securities are actively traded and valuation adjustments are not applied, they are classified in Level 1 of the fair value hierarchy. Securities traded in the NASDAQ over-the-counter market are valued by the pricing service at the NASDAQ Official Closing Price. When market quotations are not readily available, when the Adviser determines that the market quotation or the price provided by the pricing service does not accurately reflect the current fair value or when restricted or illiquid securities are being valued, such securities are valued at a fair value as determined by the Adviser in good faith, in accordance with guidelines adopted by and subject to review of the Board of Trustees “Board”. Manually priced securities held by the Fund (if any) are reviewed by the Board on a quarterly basis, and are categorized as Level 2 or 3, depending on the inputs used. Money market mutual funds are generally priced at the ending NAV provided by the service agent of the funds. These securities will be categorized as Level 1 securities. The following table summarizes the inputs used to value the Fund’s assets measured at fair value as of May 31, 2018:
Valuation Inputs of Assets * Level 1 Level 2 Level 3 Total Common Stock $ 102,499,418 $ - $ - $ 102,499,418 Exchange Traded Fund 163,024 - - 163,024 Short-Term Investments 61,084 - - 61,084 Total $ 102,723,526 $ - $ - $ 102,723,526
* See the Schedule of Investments for categories by industry.

TARKIO FUND NOTES TO FINANCIAL STATEMENTS (CONTINUED)
MAY 31, 2018
16
The Fund did not hold any Level 3 assets or derivative instruments at any time during the year ended May 31, 2018. It is the Fund’s policy to recognize transfers into and out of all Levels at the end of the reporting period. The following transfers were recorded:
Transfers into Level 1 * $ 112,216 Transfers out of Level 1 - Net Transfers into Level 1 $ 112,216 Transfers into Level 2 - Transfers out of Level 2 $ (112,216) Net Transfers out of Level 2 $ (112,216)
* Transfers into Level 1 and out of Level 2 resulted when pricing was based on quoted market prices.
4. RELATED PARTY TRANSACTIONS INVESTMENT ADVISER: Front Street Capital Management, Inc. serves as investment adviser to the Fund. Subject to the authority of the Board, the Adviser is responsible for management of the Fund's investment portfolio. The Adviser is responsible for selecting the Fund's investments according to the Fund's investment objective, policies and restrictions. As compensation for its management services, the Fund is obligated to pay the Adviser a fee computed and accrued daily and paid monthly in arrears at an annual rate of 0.75% of the average daily net assets of the Fund during the term of the Investment Advisory Agreement (“Agreement”). Under the Agreement, the Adviser, at its own expense and without reimbursement from the Trust, furnishes office space and all necessary office facilities, equipment and executive personnel necessary for managing the assets of the Fund. The Adviser pays the operating expenses of the Fund excluding fees payable under the Agreement and the Services Agreement, brokerage fees and commissions, taxes, interest expense, the costs of acquired fund fees and expenses, and extraordinary expenses. For the year ended May 31, 2018, the Adviser earned $716,373 in Advisory fees. At May 31, 2018, the Fund owed the Adviser $65,756. The Fund entered into a Services Agreement with the Adviser. Under the Services Agreement, the Adviser receives an additional fee of 0.25% of the average daily net assets of the Fund and is obligated to provide executive and administrative services, assist in the preparation of the Trust’s tax returns and various reports to shareholders, and provide non-investment related statistical and research data. For the year ended May 31, 2018, the Fund incurred $238,791 in service fees. At May 31, 2018 the Fund owed $21,919 in service fees to the Adviser. Officers and a Trustee of the Trust are also Officers of the Adviser.

TARKIO FUND NOTES TO FINANCIAL STATEMENTS (CONTINUED)
MAY 31, 2018
17
5. CAPITAL SHARE TRANSACTIONS At May 31, 2018, paid in capital amounted to $75,593,844 of the Fund. Transactions in capital stock were as follows: Year ended
May 31, 2018 Year ended
May 31, 2017 Shares Amount Shares Amount Shares sold 1,466,181 $ 30,500,538 1,434,336 $ 23,977,752 Shares issued in reinvestment of dividends
77,817
1,713,523
14,434
251,451
Shares redeemed (392,428) (8,203,249) (52,864) (873,724) Net increase 1,151,570 $ 24,010,812 1,395,906 $ 23,355,479 6. INVESTMENT TRANSACTIONS For the year ended May 31, 2018, purchases and sales of investment securities, other than short-term investments, were as follows: Purchases Investment Securities $ 49,062,592 Sales Investment Securities $ 26,102,345 7. TAX INFORMATION As of May 31, 2018, the net unrealized appreciation of investments for tax purposes was as follows:
Gross Appreciation $ 27,213,179 Gross (Depreciation) (2,182,953) Net Appreciation on Investments $ 25,030,226
At May 31, 2018, the aggregate cost of securities for federal income tax purposes was $77,693,300. As of the fiscal year ended May 31, 2018, the components of distributable earnings/(accumulated losses) on a tax basis are as follows: Undistributed Capital Gains $ 2,065,914 Unrealized Appreciation 25,030,226 $27,096,140 The difference between book basis and tax basis unrealized appreciation is attributable to the tax deferral of losses on wash sales of $29,879.

TARKIO FUND NOTES TO FINANCIAL STATEMENTS (CONTINUED)
MAY 31, 2018
18
Permanent book and tax differences relating to shareholder distributions may result in reclassifications to Fund distributions and may affect the per-share allocation between net investment income and realized and unrealized gain/loss. The Fund made the following reclassifications on the Statement of Assets and Liabilities:
Undistributed Capital Gains
Undistributed Ordinary Income
$140,622 ($140,622) 8. DISTRIBUTIONS TO SHAREHOLDERS The tax character of distributions paid during the years ended May 31, 2018 and 2017 were as follows:
2018 2017 Ordinary Income $ 640,038 $ 17,058 Long-term Capital Gain $ 1,073,215 $ 234,393
Income and long-term capital gain distributions are determined in accordance with Federal income tax regulations, which may differ from accounting principles generally accepted in the United States of America. 9. CONTROL OWNERSHIP The beneficial ownership, either directly or indirectly, of more than 25% of the voting securities of a fund creates a presumption of control of the fund, under Section 2 (a) (9) of the Act. As of May 31, 2018, TD Ameritrade, Inc. held in an omnibus account for the benefit of others approximately 76% of the voting securities of the Fund. The Fund does not know that any of the beneficial shareholders underlying the omnibus account hold greater than 25% of the voting securities of the Fund.
10. SUBSEQUENT EVENTS The Fund is required to recognize in the financial statements the effects of all subsequent events that provide additional evidence about conditions that existed at the date of the Statement of Assets and Liabilities. For non-recognized subsequent events that must be disclosed to keep the financial statements from being misleading, the Fund is required to disclose the nature of the event as well as an estimate of its financial effect, or a statement that such an estimate cannot be made. Management has evaluated the impact of all subsequent events on the Fund through the issuance date of these financial statements and has noted no such events requiring accounting or disclosure.

REPORT OF INDEPENDENT REGISTERED PUBLIC ACCOUNTING FIRM
19
To the Shareholders of Tarkio Fund and Board of Trustees of Clark Fork Trust Opinion on the Financial Statements We have audited the accompanying statement of assets and liabilities, including the schedule of investments, of Tarkio Fund (the “Fund”), a series of Clark Fork Trust, as of May 31, 2018, and the related statement of operations for the year then ended, the statements of changes in net assets for each of the two years in the period then ended, including the related notes, and the financial highlights for each of the five years in the period then ended (collectively referred to as “the financial statements”). In our opinion, the financial statements present fairly, in all material respects, the financial position of the Fund as of May 31, 2018, the results of its operations for the year then ended, the changes in its net assets for each of the two years in the period then ended, and the financial highlights for each of the five years in the period then ended, in conformity with accounting principles generally accepted in the United States of America. Basis for Opinion These financial statements are the responsibility of the Fund’s management. Our responsibility is to express an opinion on the Fund’s financial statements based on our audits. We are a public accounting firm registered with the Public Company Accounting Oversight Board (United States) (“PCAOB”) and are required to be independent with respect to the Fund in accordance with the U.S. federal securities laws and the applicable rules and regulations of the Securities and Exchange Commission and the PCAOB. We conducted our audits in accordance with the standards of the PCAOB. Those standards require that we plan and perform the audit to obtain reasonable assurance about whether the financial statements are free of material misstatement, whether due to error or fraud. Our audits included performing procedures to assess the risks of material misstatement of the financial statements, whether due to error or fraud, and performing procedures that respond to those risks. Such procedures included examining, on a test basis, evidence regarding the amounts and disclosures in the financial statements and confirmation of securities owned as of May 31, 2018, by correspondence with the custodian. Our audits also included evaluating the accounting principles used and significant estimates made by management, as well as evaluating the overall presentation of the financial statements. We believe that our audits provide a reasonable basis for our opinion. We have served as the Fund’s auditor since 2011.
COHEN & COMPANY, LTD. Cleveland, Ohio July 25, 2018

TARKIO FUND EXPENSE ILLUSTRATION
MAY 31, 2018 (UNAUDITED)
20
Expense Example
As a shareholder of the Tarkio Fund, you incur costs such as ongoing costs which consist of management fees and service fees. This Example is intended to help you understand your ongoing costs (in dollars) of investing in the Funds and to compare these costs with the ongoing costs of investing in other mutual funds. The Example is based on an investment of $1,000 invested at the beginning of the period and held for the entire period, December 1, 2017 through May 31, 2018.
Actual Expenses
The first line of the table below provides information about actual account values and actual expenses. You may use the information in this line, together with the amount you invested, to estimate the expenses that you paid over the period. Simply divide your account value by $1,000 (for example, an $8,600 account value divided by $1,000 = 8.6), then multiply the result by the number in the first line under the heading entitled "Expenses Paid During Period" to estimate the expenses you paid on your account during this period.
Hypothetical Example for Comparison Purposes
The second line of the table below provides information about hypothetical account values and hypothetical expenses based on the Fund’s actual expense ratio and an assumed rate of return of 5% per year before expenses, which is not the Fund’s actual return. The hypothetical account values and expenses may not be used to estimate the actual ending account balance or expenses you paid for the period. You may use this information to compare the ongoing costs of investing in this Fund and other funds. To do so, compare this 5% hypothetical example with the 5% hypothetical examples that appear in the shareholder reports of the other funds. Please note that the expenses shown in the table are meant to highlight your ongoing costs only and do not reflect any transactional costs, such as sales charges (loads), redemption fees, or exchange fees. Therefore, the second line of the table is useful in comparing ongoing costs only, and will not help you determine the relative total costs of owning different funds. In addition, if these transactional costs were included, your costs would have been higher.
Beginning
Account Value Ending
Account Value Expenses Paid
During the Period*
December 1, 2017 May 31, 2018 December 1, 2017 to
May 31, 2018 Actual $1,000.00 $956.53 $4.88 Hypothetical (5% Annual Return before expenses) $1,000.00 $1,019.95 $5.04 * Expenses are equal to the Fund's annualized expense ratio of 1.00%, multiplied by the average account value over the period, multiplied by 182/365 (to reflect the one-half year period).

TARKIO FUND TRUSTEES & OFFICERS
MAY 31, 2018 (UNAUDITED)
21
Interested Trustees and Officers
Name, Address(1) and Age
Position(s) with the
Trust
Length of Term of Office
and Time Served
Principal Occupation(s) during Past 5 Years
Number of Portfolios in
Fund Complex
Overseen by Trustee
Other Directorships
Held by Trustee
Russell T. Piazza (2)
(63)
Chairman of the Board of Trustees
and President
Indefinite Term; Since 2011
Registered Representative, Crowell Weedon & Co. (stock brokerage and financial advisory services company), 1977 to 1979. President & Portfolio Manager, Vice President of Investments, Piper Jaffray & Co. (stock brokerage and investment advisory firm), 1979 to 2006. Portfolio Manager, Front Street Capital Management, Inc., 2006 to Present.
1 None
Virginia Belker (52)
Chief Compliance
Officer
Indefinite Term; Since 2011
Branch Administrative Manager, Piper Jaffray & Co. (stock brokerage and investment advisory firm), 2006. Branch Administrative Manager, UBS Financial Services, 2006. Chief Compliance Officer, Front Street Capital Management, Inc. 2006 to Present.
N/A N/A
Michele Blood (53)
Treasurer
Indefinite Term; Since 2015
Senior Registered Investment Assistant at Piper Jaffray & Co. (stock brokerage and investment advisory firm), from 1987 until 2006 (merged with UBS Financial Services in 2006). Co-founder and Vice President of Front Street Capital Management, Inc. 2006 to present. Michele received her certificate of Accounting and Technology from the University of Montana, College of Technology.
N/A N/A
John H. Lively (49)
Secretary
Indefinite Term; Since 2010
Attorney, Practus, LLP (law firm), May 1, 2018 to present; Attorney, The Law Offices of John H. Lively & Associates, Inc. (law firm), March 2010 to April 30, 2018.
N/A N/A
(1) The address of each trustee and officer is c/o Clark Fork Trust, 218 East Front Street, Suite 205, Missoula, Montana 59802. (2) Trustee who is considered an "interested person" as defined in Section 2(a)(19) of the Investment Company Act of 1940 by virtue of his affiliation with the Advisor.
TARKIO FUND TRUSTEES & OFFICERS (CONTINUED)
MAY 31, 2018 (UNAUDITED)
22
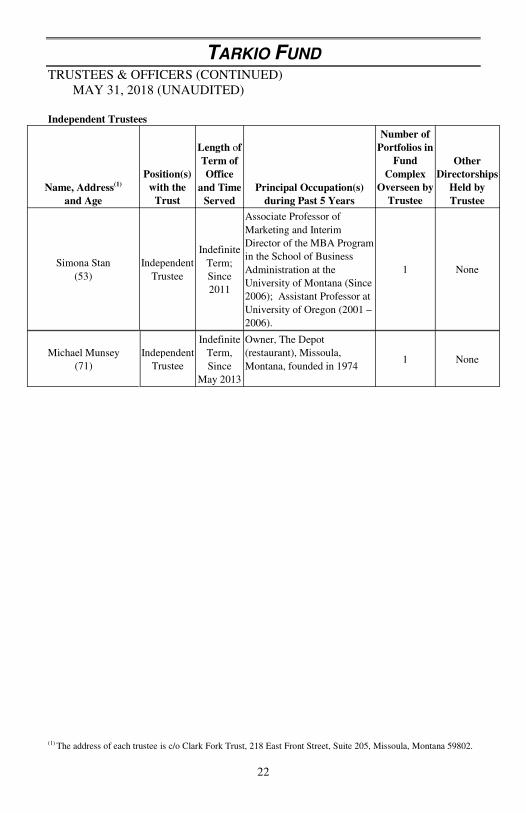
Independent Trustees
Name, Address(1)
and Age
Position(s)
with the
Trust
Length of
Term of
Office
and Time
Served
Principal Occupation(s)
during Past 5 Years
Number of
Portfolios in
Fund
Complex
Overseen by
Trustee
Other
Directorships
Held by
Trustee
Simona Stan
(53)
Independent
Trustee
Indefinite
Term;
Since
2011
Associate Professor of
Marketing and Interim
Director of the MBA Program
in the School of Business
Administration at the
University of Montana (Since
2006); Assistant Professor at
University of Oregon (2001 –
2006).
1 None
Michael Munsey
(71)
Independent
Trustee
Indefinite
Term,
Since
May 2013
Owner, The Depot
(restaurant), Missoula,
Montana, founded in 1974 1 None
(1) The address of each trustee is c/o Clark Fork Trust, 218 East Front Street, Suite 205, Missoula, Montana 59802.
TARKIO FUND ADDITIONAL INFORMATION
MAY 31, 2018 (UNAUDITED)
23
Proxy Voting - A description of the policies and procedures that the Fund uses to determine how to vote proxies relating to portfolio securities and information regarding how the Fund voted proxies during the most recent 12 month period ended June 30, are available without charge upon request by (1) calling the Fund at (800) 231-2901 and (2) from Fund documents filed with the Securities and Exchange Commission ("SEC") on the SEC's website at www.sec.gov. Portfolio Holdings - The Fund files a complete schedule of investments with the SEC for the first and third quarter of each fiscal year on Form N-Q. The Fund’s first and third fiscal quarters end on February 28 and August 31. The Form N-Q filing must be made within 60 days of the end of the quarter. The Fund’s Forms N-Q are available on the SEC’s website at http://sec.gov, or they may be reviewed and copied at the SEC’s Public Reference Room in Washington, DC (call 1-800-732-0330 for information on the operation of the Public Reference Room). You may also obtain copies by calling the Fund at 1-800-231-2901. Additional Information - The Fund's Statement of Additional Information ("SAI") includes additional information about the trustees and is available, without charge, upon request. You may call toll-free (800) 231-2901 to request a copy of the SAI or to make shareholder inquiries.
Annual Investment Advisory Agreement Renewal
At a meeting held on April 18, 2018, the Board of Trustees (the “Board”) considered the renewal of the Investment Advisory Agreement (the “Agreement”) between the Trust and Front Street Capital Management, Inc. (the “Adviser”) on behalf of the Tarkio Fund (the “Fund”). In approving the Agreement, the Board of Trustees considered and evaluated the following factors: (i) the investment performance of the Fund and the Adviser; (ii) the nature, extent and quality of the services provided by the Adviser to the Fund; (iii) the cost of the services to be provided and the profits to be realized by the Adviser from the relationship with the Fund; (iv) the extent to which economies of scale will be realized as the Fund grows; (v) whether the fee levels reflect these economies of scale to the benefit of shareholders; and (vi) the Adviser’s practices regarding possible conflicts of interest. In assessing these factors and reaching its decisions, the Board took into consideration information furnished for the Board’s review and consideration throughout the year at regular Board meetings, as well as information specifically prepared and/or presented in connection with the annual renewal process, including information presented at the Meeting. The Board requested and was provided with information and reports relevant to the annual renewal of the Agreement, including: (i) reports regarding the services and support provided to the Fund and its shareholders by the Adviser; (ii) assessments of the investment performance of the Fund by personnel of the Adviser; (iii) commentary on the reasons for the performance; (iv) presentations addressing the Adviser’s investment philosophy, investment strategy, personnel and operations; (v) compliance and audit reports concerning the Fund; (vi) disclosure information contained in the registration statement of the Trust and the Form ADV of the Adviser; (vii) information on relevant

TARKIO FUND ADDITIONAL INFORMATION (CONTINUED)
MAY 31, 2018 (UNAUDITED)
24
developments in the mutual fund industry and how the Fund and/or the Adviser are responding to them; and (viii) a memorandum from Counsel, that summarized the fiduciary duties and responsibilities of the Board in reviewing and approving the Agreement, including the material factors set forth above and the types of information included in each factor that should be considered by the Board in order to make an informed decision. The Board also requested and received various informational materials including, without limitation: (i) documents containing information about the Adviser, including financial information, a description of personnel and the services provided to the Fund, information on investment advice, performance, summaries of Fund expenses, compliance program, current legal matters, and other general information; (ii) comparative expense and performance information for other mutual funds with strategies similar to the Fund; (iii) the anticipated effect of size on the Fund’s performance and expenses; and (iv) benefits to be realized by the Adviser from its relationship with the Fund. The Board did not identify any particular information that was most relevant to its consideration to approve the Agreement and each Trustee may have afforded different weight to the various factors. 1. Nature, Extent and Quality of the Services Provided by the Adviser In considering the nature, extent, and quality of the services provided by the Adviser, the Trustees reviewed the responsibilities of the Adviser under the Agreement. The Trustees reviewed the services being provided by the Adviser to the Fund including, without limitation: the quality of its investment advisory services (including research and recommendations with respect to portfolio securities); its process for formulating investment recommendations and assuring compliance with the Fund’s investment objective, strategies, and limitations, as well as for ensuring compliance with regulatory requirements; its coordination of services for the Fund among the service providers and the Independent Trustees; its efforts to promote the Fund and grow its assets; and its provision of a Chief Compliance Officer to the Fund. The Trustees noted the Adviser’s continuity of, and commitment to retain, qualified personnel and its commitment to maintain and enhance its resources and systems; the commitment of the Adviser’s personnel to finding alternatives and options that allow the Fund to maintain its goals; and the Adviser’s continued cooperation with the Independent Trustees and Counsel for the Fund. The Trustees evaluated the Adviser’s personnel, including the education and experience of its personnel. After reviewing the foregoing information and further information in the materials provided by the Adviser (including the Adviser’s Form ADV), the Board concluded that, in light of all the facts and circumstances, the nature, extent, and quality of the services provided by the Adviser were satisfactory and adequate for the Fund. 2. Investment Performance of the Fund and the Adviser In considering the investment performance of the Fund and the Adviser, the Trustees compared the short and longer-term performance of the Fund with the performance of funds with similar objectives managed by other investment advisers, as well as with aggregated peer group data. As to the performance of the Fund, the Trustees received information regarding the performance of the Fund compared to a group of funds of

TARKIO FUND ADDITIONAL INFORMATION (CONTINUED)
MAY 31, 2018 (UNAUDITED)
25
similar style and objective selected by the Adviser (the “Peer Group”), as well as funds categorized by Morningstar as peers (the “Category”). It was noted that the Fund’s Adviser considers the Fund’s holdings to fit better in an all-cap category. Performance data comparison with the Peer Group was for the 12-month period ended December 31, 2017. For this period the Fund outperformed the Peer Group. Performance data comparison with the Category was for the one-month, 1, 3, and 5-year periods. For the one-month and 1-year periods, the Fund underperformed the Category average. For the 3 and 5-year periods, the Fund outperformed the Category average. It was noted that for the 1-year period ended December 31, 2017, the Fund outperformed its benchmark index. The Trustees noted that the Adviser manages separate accounts with the same investment objective as the Fund and that the majority of these accounts performed similarly with the Fund’s performance for the calendar year 2017. It was noted that performance differences between the separate accounts and the Fund are attributed to differences in cash flows of the Fund verses those of the separate accounts. After reviewing and discussing the investment performance of the Fund further, the Adviser’s experience managing the Fund, the Adviser’s historical investment performance, and other relevant factors, the Board concluded, in light of all the facts and circumstances, that the investment performance of the Fund and the Adviser was satisfactory. 3. Costs of the Services to be provided and profits to be realized by the Adviser In considering the costs of the services to be provided and profits to be realized by the Adviser from the relationship with the Fund, the Trustees considered: (1) the Adviser’s financial condition and the level of commitment to the Fund and the Adviser by the principals of the Adviser; (2) the asset level of the Fund; (3) the overall expenses of the Fund; and (4) the nature and frequency of advisory fee payments. The Trustees noted that the Adviser was profitable for its most recent fiscal year in regard to its services to the Fund. The Trustees reviewed information provided by the Adviser regarding its profits associated with managing the Fund. The Trustees also considered potential benefits for the Adviser in managing the Fund. The Trustees then compared the fees and expenses of the Fund (including the management fee) to its Peer Group and Category. The Trustees noted that the Adviser pays certain of the Fund’s operating expenses out of its management fee and administrative services fee, which in total equals 1.00% per annum. The Trustees noted that the Fund’s expense ratio was similar to others in its Peer Group but not the lowest or highest. As compared to the Category, the Trustees noted that the Fund’s expense ratio of 1.00% per annum was 20 basis points less than the median fund in the Category. The Trustees further noted that as compared to the Peer Group and Category, the Fund had significantly fewer assets than the average fund in these comparative groups. Based on the foregoing, the Board concluded that the fees to be paid to the Adviser and the profits to be realized by the Adviser, in light of all the facts and circumstances, were fair and reasonable in relation to the nature and quality of the services provided by the Adviser. 4. Economies of Scale The Trustees next considered the impact of economies of scale on the Fund’s size and whether advisory fee levels reflect those economies of scale for the benefit of the Fund’s

TARKIO FUND ADDITIONAL INFORMATION (CONTINUED)
MAY 31, 2018 (UNAUDITED)
26
investors. The Trustees considered that while the advisory fee remained the same at all asset levels, the Fund’s shareholders had experienced benefits from the fact that the Adviser was obligated to pay certain of the Fund’s operating expenses which had the effect of limiting the overall fees paid by the Fund. The Trustees also considered the Adviser’s decision to voluntarily reduce its management fee over the years. In light of its ongoing consideration of the Fund’s asset levels, expectations for growth in the Fund, and fee levels, the Board determined that the Fund’s fee arrangements, in light of all the facts and circumstances, were fair and reasonable in relation to the nature and quality of the services provided by the Adviser. 5. Possible conflicts of interest and benefits to the Adviser. In considering the Adviser’s practices regarding conflicts of interest, the Trustees evaluated the potential for conflicts of interest and considered such matters as the experience and ability of the advisory personnel assigned to the Fund; the basis of decisions to buy or sell securities for the Fund and/or the Adviser’s other accounts; and the substance and administration of the Adviser’s code of ethics. The Trustees also considered disclosure in the registration statement of the Trust relating to the Adviser’s potential conflicts of interest. The Trustees also considered the Adviser’s practices regarding brokerage and portfolio transactions, including particularly the Adviser’s practice for seeking best execution for the Fund’s portfolio transactions and potential benefits that may be viewed as soft dollars that could result from its trading. The Trustees considered the process by which evaluations are made of the overall reasonableness of commissions paid. The Trustees did not identify any other potential benefits (other than the management fee and administrative services fee) that would inure to the Adviser. The Trustees noted that the Adviser has an affiliated investment adviser and noted additional compliance program enhancements that were added to address any potential conflicts of interest. Based on the foregoing, the Board determined that the standards and practices of the Adviser relating to the identification and mitigation of potential conflicts of interest and the benefits to be realized by the Adviser in managing the Fund were satisfactory.
INVESTMENT ADVISER Front Street Capital Management, Inc. 218 East Front Street, Suite 205 Missoula, MT 59802 INDEPENDENT REGISTERED PUBLIC ACCOUNTING FIRM Cohen & Company, Ltd. 1350 Euclid Ave., Suite 800 Cleveland, OH 44115 LEGAL COUNSEL Practus, LLP 11300 Tomahawk Creek Pkwy., Suite 310 Leawood, KS 66211 CUSTODIAN Huntington National Bank 41 South Street Columbus, OH 43125 TRANSFER AGENT AND FUND ACCOUNTANT Mutual Shareholder Services, LLC 8000 Town Centre Drive, Suite 400 Broadview Heights, OH 44147 DISTRIBUTOR Arbor Court Capital, LLC 8000 Town Centre Drive, Suite 400 Broadview Heights, OH 44147 This report is intended only for the information of shareholders or those who have received the Fund’s prospectus which contains information about the Fund’s management fee and expenses. Please read the prospectus carefully before investing.


![CBT Print Version[1]](https://img.pdfslide.us/doc/110x75/552482fa4a7959fa488b477c/cbt-print-version1.jpg)