Embed Size (px)
Citation preview
Targeting the Biophysical Properties of the MyelomaInitiating Cell Niches: A Pharmaceutical SynergismAnalysis Using Multi-Scale Agent-Based ModelingJing Su1, Le Zhang2,3*, Wen Zhang4, Dong Song Choi5, Jianguo Wen5, Beini Jiang6, Chung-Che Chang7*,
Xiaobo Zhou1*
1 Department of Radiology, The Wake Forest School of Medicine, Winston-Salem, North Carolina, United States of America, 2 College of Computer and Information
Science, Southwest University, Chongqing, People’s Republic of China, 3 School of Medicine and Dentistry, University of Rochester Medical Center, Rochester, New York,
United States of America, 4 Jan and Dan Duncan Neurological Research Institute, Baylor College of Medicine, Houston, Texas, United States of America, 5 Department of
Pathology, The Methodist Hospital Research Institute, Weil Cornell Medical College, Houston, Texas, United States of America, 6 Department of Mathematical Sciences,
Michigan Technological University, Houghton, Michigan, United States of America, 7 Department of Pathology, Florida Hospital, University of Central Florida, Orlando,
Florida, United States of America
Abstract
Multiple myeloma, the second most common hematological cancer, is currently incurable due to refractory disease relapseand development of multiple drug resistance. We and others recently established the biophysical model that myelomainitiating (stem) cells (MICs) trigger the stiffening of their niches via SDF-1/CXCR4 paracrine; The stiffened niches thenpromote the colonogenesis of MICs and protect them from drug treatment. In this work we examined in silico thepharmaceutical potential of targeting MIC niche stiffness to facilitate cytotoxic chemotherapies. We first established a multi-scale agent-based model using the Markov Chain Monte Carlo approach to recapitulate the niche stiffness centric, pro-oncogenetic positive feedback loop between MICs and myeloma-associated bone marrow stromal cells (MBMSCs), andinvestigated the effects of such intercellular chemo-physical communications on myeloma development. Then we usedAMD3100 (to interrupt the interactions between MICs and their stroma) and Bortezomib (a recently developed noveltherapeutic agent) as representative drugs to examine if the biophysical properties of myeloma niches are drugable. Resultsshowed that our model recaptured the key experimental observation that the MBMSCs were more sensitive to SDF-1secreted by MICs, and provided stiffer niches for these initiating cells and promoted their proliferation and drug resistance.Drug synergism analysis suggested that AMD3100 treatment undermined the capability of MICs to modulate the bonemarrow microenvironment, and thus re-sensitized myeloma to Bortezomib treatments. This work is also the first attempt tovirtually visualize in 3D the dynamics of the bone marrow stiffness during myeloma development. In summary, weestablished a multi-scale model to facilitate the translation of the niche-stiffness centric myeloma model as well asexperimental observations to possible clinical applications. We concluded that targeting the biophysical properties of stemcell niches is of high clinical potential since it may re-sensitize tumor initiating cells to chemotherapies and reduce risks ofcancer relapse.
Citation: Su J, Zhang L, Zhang W, Choi DS, Wen J, et al. (2014) Targeting the Biophysical Properties of the Myeloma Initiating Cell Niches: A PharmaceuticalSynergism Analysis Using Multi-Scale Agent-Based Modeling. PLoS ONE 9(1): e85059. doi:10.1371/journal.pone.0085059
Editor: Persio Dello Sbarba, Universita degli Studi di Firenze, Italy
Received July 8, 2013; Accepted November 21, 2013; Published January 27, 2014
Copyright: � 2014 Su et al. This is an open-access article distributed under the terms of the Creative Commons Attribution License, which permits unrestricteduse, distribution, and reproduction in any medium, provided the original author and source are credited.
Funding: The authors thank the funding resource: NIH/NLM 5R01LM010185-04. One of the authors, Dr. Le Zhang, is currently supported by the Natural ScienceFoundation of China under Grant No. 61372138. The funders had no role in study design, data collection and analysis, decision to publish, or preparation of themanuscript.
Competing Interests: The authors have declared that no competing interests exist.
* Email: [email protected] (LZ); [email protected] (CC); [email protected] (XZ)
Introduction
Multiple myeloma (MM) and other tumors have a small
population of tumor initiating (stem) cells that retain key stem cell
properties including self-renewal and tumorigenesis [1–13].
Recent reports [3,4] showed that a small population of CD138-
negative B cells with ‘‘side population’’ characteristics present in
myeloma. These cells have clonogenic potential in vitro and, when
engrafted into immunodeficienct/nonobese diabetes (SCID/
NOD) mice, can initiate de novo myeloma lesions of bulk of
CD138+ cells in both primary and secondary transplant assays.
Additionally, these myeloma initiating cells (MICs) have shown
higher resistance to chemotherapeutic agents and thus are more
likely to survive despite therapies [1–10]. These findings have led
to the hypothesis that MICs survive chemo- and radio- therapies,
regenerate the bulk of tumors, and thus cause the disease relapse.
This idea is consistent with the clinical observation that disease
relapse in multiple myeloma patients is common even if patients
are treated with new therapeutic agents that can initially result in
complete clinical responses [14–16]. Understanding and control-
ling MIC drug resistance is critical to the development of new
therapies for the cure of myeloma.
Our group pioneered the research of the roles of biophysical
properties in blood cancers and established the mechanism of the
MIC-stroma positive feedback loop [17,18]. Previous studies on
the interactions between BMSCs and myeloma cells, especially
PLOS ONE | www.plosone.org 1 January 2014 | Volume 9 | Issue 1 | e85059
MICs, have predominantly focused on biochemical communica-
tions such as the stimuli of growth factors, cytokines and
chemotactic via paracrine signaling [19]. However, recent studies
in solid tumors have indicated that a critical stage of the malignant
transformation journey of cancer cells involves marked alterations
in the biomechanical phenotype of the cell and its surrounding
microenvironment [20,21]. Indeed, it has been suggested that
targeting the microenvironments (the ‘‘niches’’) of the tumor stem
cell could result in a reduction of the tumor burden [22–24]. Bone
marrow stromal cells (BMSCs), one of the major cellular
components in the MIC niches, are in close contact with MICs,
and the biomechanical properties of BMSCs, besides chemical
communications, also influence the local microenvironment of
MICs and hence MIC fates. We have recently demonstrated that
Myeloma-associated BMSCs (MBMSCs) from patients are much
‘‘stiffer’’ (higher Young’s modulus level) and more contractile than
Normal BMSCs (NBMSCs). Hydrogels are widely used to mimic
the in vivo cellular microenvironments [25,26], so we have utilized
hydrogels of various stiffness levels to investigate the impact of such
biophysical property on MIC-driven myeloma development. We
have shown that stiffer hydrogels support colony formation and
adherence of MICs better than softer hydrogels, suggesting that
myeloma BMSCs provide myeloma cell-friendly microenviron-
ments for MICs via exerting biomechanical forces [17,18]. We
also have demonstrated that MICs over-secrete SDF1 than mature
myeloma cells and that treatment of CXCR4 inhibitor,
AMD3100, leads to decreased adherence of MICs to MBMSCs,
undermined colony formation potential of MICs, and better invitro and in vivo drug efficacy of Bortezomib(BZM). These
discoveries were also consistent with other reports [27].
With the perspective that the biophysical properties of MIC
niches in bone marrow may be a promising drug candidate, there
is an urgent need to develop mathematical models and tools to
estimate drug effects on MICs within the context of their niches
during when screening and evaluating drug candidates. Currently
pharmaco-industries use the killing efficiency of the bulk tumor as
the major in vitro drug screening criterion. Such practices
overlook the importance of MICs cell microenvironments
contributing to the common failure of translating promising drug
candidates discovered in screening into clinical usage. However,
mathematical models that involve the cancer initiating (stem) cells
and their niches are still rare, except for few examples [28–30]
including our recent work [31].
Modeling the dynamics of the MIC-derived myeloma lineage is
crucial for associating the abnormality at cellular level with the
features of the myeloma pathogenesis and pathophysiology at
tissue level. We recently developed a myeloma lineage model [31]
to systematically analyze the myeloma lineage development and
experimentally monitor the major sub-populations in the lineage.
Briefly, cells involved in the myeloma lineage were classified as
myeloma initiating cells (MICs), myeloma progenitor cells (PCs),
and matured myeloma cells (MMs). These three sub-populations
were experimentally distinguishable by dual-staining for the
expression of plasma cell surface markers CD138 and for side
population (SP) using Hoechst staining, each showed unique
features related with lineage sub-populations. MICs, recognized by
SP staining and negative CD138 staining (SP/CD1382), showed
unlimited renewal capability, potential to initiate and fully re-
establish the whole myeloma lineage, and enhanced drug
resistance. PCs, defined as the non-SP and negative CD138
expression (non-SP/CD1382) population, were only able to
passage for limited rounds before beginning to express CD138 and
losing the key PC character. The CD138+ sub-population, which
was of 90% to 95% of the total myeloma population, was classified
as the MMs and exhibit very limited proliferation capability. In
this work we used similar definitions except further distinguishing
terminal MMs (TMMs) that could no longer proliferate from those
that still could divide (MMs).
To comprehensively illustrate the interaction between the
myeloma initiating cells and their niches and to develop effective
drug treatment, the following key questions need special atten-
tions: (1) How do BMSCs, MICs, myeloma progenitor cells (PC),
matured myeloma cells (MMs) and terminal MMs (TMMs)
communicate in MIC niches? (2) How do the biomechanical
phenotypes of BMSC, in terms of cell stiffness and contractibility,
modulate MIC’s growth and fates? (3) How do MIC growth and
differentiation drive the development of myeloma? (4) How do the
molecular level intracellular features of MICs and their stromal
counterpart, BMSCs, contribute to the tissue level 3D cancer
growth via the intercellular cell-to-cell interactions? And (5) How
does the interaction between tumor cells and their niches change
the drug treatment effect?
To address these questions, in this study we developed a 3D
multi-scale agent-based model (ABM) using Markov Chain Monte
Carlo approaches [32] to study the role of tumor–stroma
interactions in multiple myeloma tumor progress. The system
was classified into three levels: the intracellular, the intercellular,
and the tissue level. Their relations were conceptually defined as
‘‘interfaces’’ among these levels. The agent-based model integrates
events of multiple spatial and temporal scales. (1) Spatial scales:
Intracellular signaling pathways were encapsulated into each cell
type to determine the BMSC intercellular biomechanical pheno-
type (cell stiffness) or tumor cell behaviors (migration or
proliferation). Cancer cells competed for the best location in 3D
extracellular matrix to migrate or proliferate regarding to the
change of BMSC cell’s stiffness and sensitivity of chemoattractant
(SDF1). In turn, chemoattractant cues at the tissue level triggered
intracellular signaling pathways inside cells via the agent interfaces
(receptors), and the resultant feedbacks were the changes of either
cells’ properties (change of cell stiffness or sensitivity to outside
stimuli) or behaviors (secretion of chemoattractant, proliferation,
differentiation, apoptosis, or migration). (2) Temporal scales: The
model covered minute-to-hour-level signaling dynamics; day-level
cell division, apoptosis, and local migration; week-level drug
responses; and month-level tumor growth.
The spatial characteristics of the 3D myeloma cell distributions
was described by the local cell metrics [33] we previously
developed and the corresponding parameters estimated using the
3D cell co-culture system levitated by magnetic field and nano-
shuttles [34].
Results
Model developmentWe established an agent-based multi-scale model to simulate the
development of myeloma in various bone marrow microenviron-
ments in three-dimensional space, and validated the model with
experimental data. The central hypotheses are: 1) MICs drive the
development of multiple myeloma; and 2) the SDF1-centric bio-
physical and chemical positive feedback loop boosts MIC growth
and colonogenesis, and protects MICs from drug treatments. As
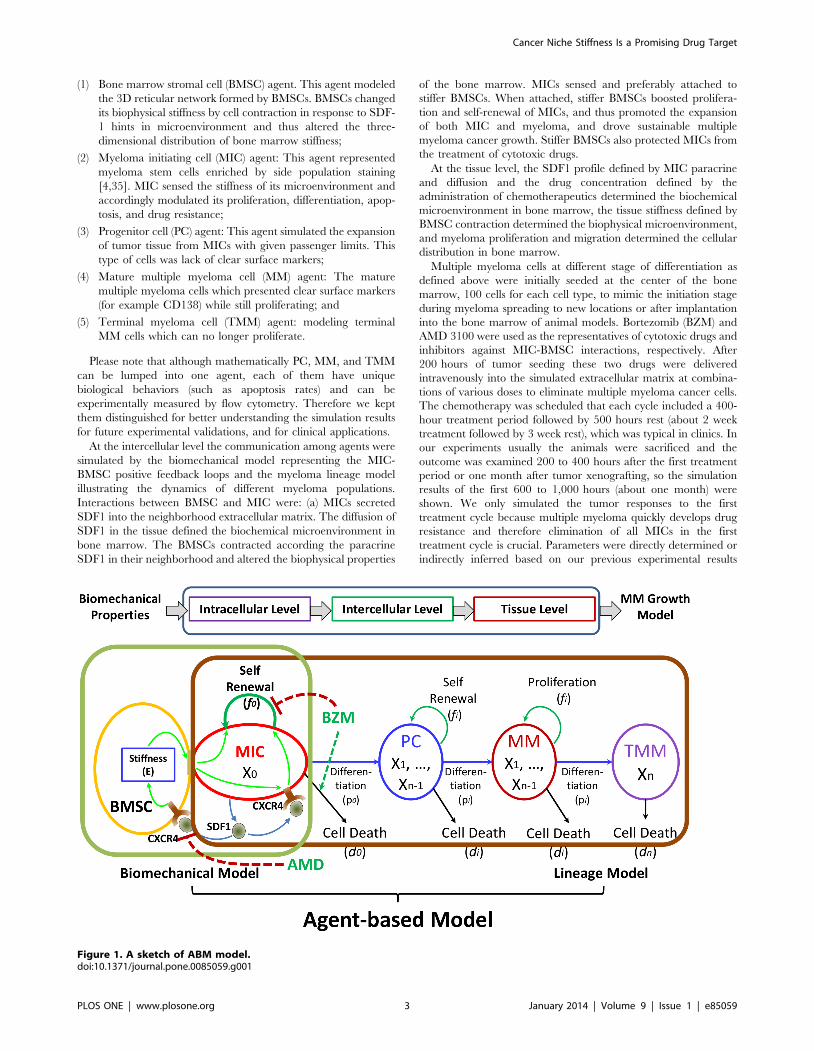
shown in Figure 1, myeloma development was simulated at
intracellular, intercellular, and tissue levels. In this model we
included five types of cells which were represented by five types of
agents of encapsulated intracellular signaling events and interfaces
through which these agents communicated with their microenvi-
ronments:
Cancer Niche Stiffness Is a Promising Drug Target
PLOS ONE | www.plosone.org 2 January 2014 | Volume 9 | Issue 1 | e85059
(1) Bone marrow stromal cell (BMSC) agent. This agent modeled
the 3D reticular network formed by BMSCs. BMSCs changed
its biophysical stiffness by cell contraction in response to SDF-
1 hints in microenvironment and thus altered the three-
dimensional distribution of bone marrow stiffness;
(2) Myeloma initiating cell (MIC) agent: This agent represented
myeloma stem cells enriched by side population staining
[4,35]. MIC sensed the stiffness of its microenvironment and
accordingly modulated its proliferation, differentiation, apop-
tosis, and drug resistance;
(3) Progenitor cell (PC) agent: This agent simulated the expansion
of tumor tissue from MICs with given passenger limits. This
type of cells was lack of clear surface markers;
(4) Mature multiple myeloma cell (MM) agent: The mature
multiple myeloma cells which presented clear surface markers
(for example CD138) while still proliferating; and
(5) Terminal myeloma cell (TMM) agent: modeling terminal
MM cells which can no longer proliferate.
Please note that although mathematically PC, MM, and TMM
can be lumped into one agent, each of them have unique
biological behaviors (such as apoptosis rates) and can be
experimentally measured by flow cytometry. Therefore we kept
them distinguished for better understanding the simulation results
for future experimental validations, and for clinical applications.
At the intercellular level the communication among agents were
simulated by the biomechanical model representing the MIC-
BMSC positive feedback loops and the myeloma lineage model
illustrating the dynamics of different myeloma populations.
Interactions between BMSC and MIC were: (a) MICs secreted
SDF1 into the neighborhood extracellular matrix. The diffusion of
SDF1 in the tissue defined the biochemical microenvironment in
bone marrow. The BMSCs contracted according the paracrine
SDF1 in their neighborhood and altered the biophysical properties
of the bone marrow. MICs sensed and preferably attached to
stiffer BMSCs. When attached, stiffer BMSCs boosted prolifera-
tion and self-renewal of MICs, and thus promoted the expansion
of both MIC and myeloma, and drove sustainable multiple
myeloma cancer growth. Stiffer BMSCs also protected MICs from
the treatment of cytotoxic drugs.
At the tissue level, the SDF1 profile defined by MIC paracrine
and diffusion and the drug concentration defined by the
administration of chemotherapeutics determined the biochemical
microenvironment in bone marrow, the tissue stiffness defined by
BMSC contraction determined the biophysical microenvironment,
and myeloma proliferation and migration determined the cellular
distribution in bone marrow.
Multiple myeloma cells at different stage of differentiation as
defined above were initially seeded at the center of the bone
marrow, 100 cells for each cell type, to mimic the initiation stage
during myeloma spreading to new locations or after implantation
into the bone marrow of animal models. Bortezomib (BZM) and
AMD 3100 were used as the representatives of cytotoxic drugs and
inhibitors against MIC-BMSC interactions, respectively. After
200 hours of tumor seeding these two drugs were delivered
intravenously into the simulated extracellular matrix at combina-
tions of various doses to eliminate multiple myeloma cancer cells.
The chemotherapy was scheduled that each cycle included a 400-
hour treatment period followed by 500 hours rest (about 2 week
treatment followed by 3 week rest), which was typical in clinics. In
our experiments usually the animals were sacrificed and the
outcome was examined 200 to 400 hours after the first treatment
period or one month after tumor xenografting, so the simulation
results of the first 600 to 1,000 hours (about one month) were
shown. We only simulated the tumor responses to the first
treatment cycle because multiple myeloma quickly develops drug
resistance and therefore elimination of all MICs in the first
treatment cycle is crucial. Parameters were directly determined or
indirectly inferred based on our previous experimental results
Figure 1. A sketch of ABM model.doi:10.1371/journal.pone.0085059.g001
Cancer Niche Stiffness Is a Promising Drug Target
PLOS ONE | www.plosone.org 3 January 2014 | Volume 9 | Issue 1 | e85059
[17,18,36], or set according to the best of our knowledge of
multiple myeloma, and were summarized in Table S1 and Table
S2 in Supporting Information.
To reduce the computational cost the diffusion of the two drugs
in bone marrow was assumed to be instantly. This assumption is
valid since the myeloma-enriched regions in bone marrow are well
vascularized and the diffusion of small molecule drugs is
significantly faster comparing with either typical cell behaviors
such as migration, proliferation, and apoptosis, or comparing with
the diffusion of SDF-1.
Twelve dose levels (including level 0) for each drug and their full
combinations were examined under both myeloma-associated
BMSC (MBMSC) and normal BMSC (NBMSC) microenviron-
ments, each condition simulated for 20 times. Time resolution
(time step) was 2 hours. Totally 288 conditions was explored by
5,760 simulations using parallel computation on a DellTM
PowerEdgeTM 850 server of 48 CPU cores.
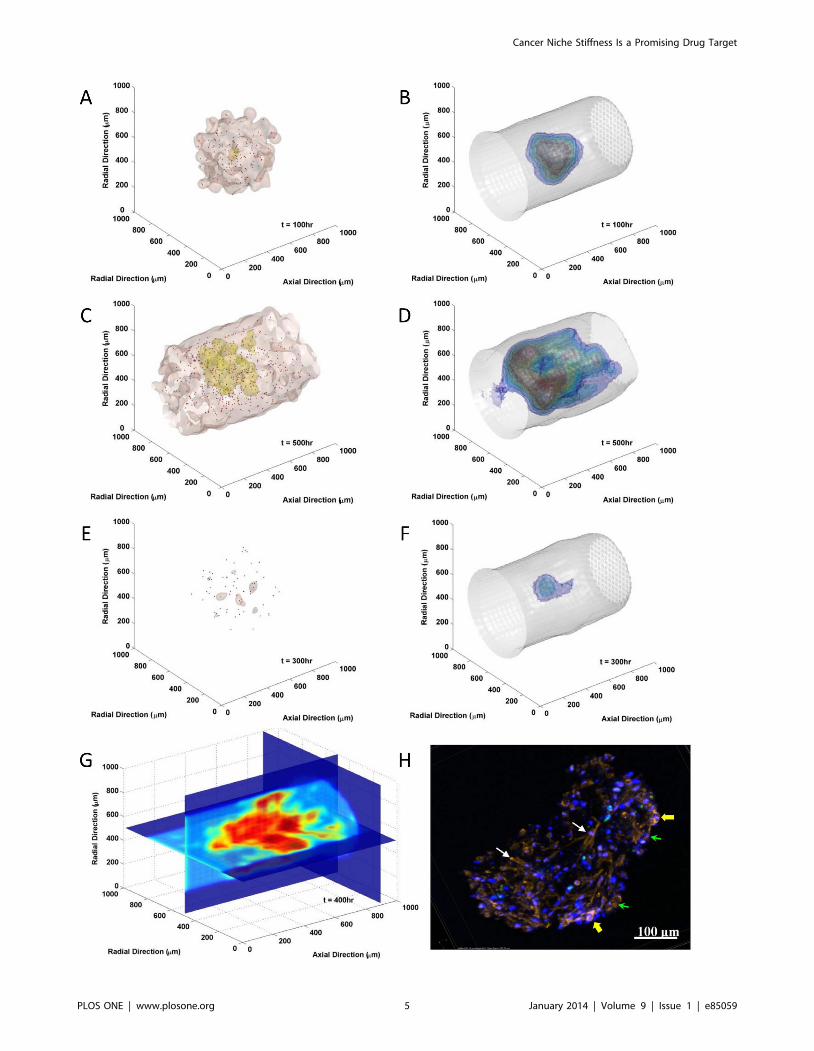
Examples of model simulation results of MIC-driven myeloma
growth in bone marrow were visualized and compared with invitro 3D levitated culture image in Figure 2. The tumor growth
at different stage (100 hr vs. 500 hr post-initiating) as well as the
associated variations of biophysical properties in bone marrow and
activities of MICs were shown in Figure 2 A through D. As
contrast, tumor and stiffness distributions under BZM treatment
(dose of the 10th relative level) between 200 and 300 hr were
demonstrated in Figure 2 E and F. Quiescent MICs were
highlighted in blue and proliferating MICs in red. The details of
biophysical stiffness in bone marrow were visualized by the
sections in Figure 2 G. Stiffness was labeled in color, from blue to
red with respect to the increase of stiffness. Since in vivo 3D
imaging of BMSC contraction is yet unavailable, we co-cultured
myeloma with BMSCs in vitro using the 3D levitation system to
mimic the bone marrow microenvironment, and 4-day co-cultured
tumor tissue was stained and 3D imaged by confocal microscopy
(details see Methods section) and shown in Figure 2 H. BMSCs
(white arrows) and myeloma cells (green arrows) were recognized
by cell shapes according to F-actin staining (red) as well as nuclei
staining (blue). The primed MBMSCs (yellow arrows) were
recognized by the formation of stress fibers. The size of the
experimentally cultured tumor at day 4 was about 2666492 mm,
which was very close to the diameter of the infiltration frontier
(about 460 mm) of the simulated results at time point 100 hr
(Figure 2 A).
Details of the model can be found in the Methods section.
Typical movies as Movie S1, S2, and S3 can be found in
Supporting Information, and the corresponding simulation
conditions in the caption of Figure 2.
Model validationThe simulation results of the agent-based model of myeloma
growth under different biophysical microenvironments were
compared with experimental results [18,36] to validate the model.
The simulated MIC populations as well as the total tumor sizes
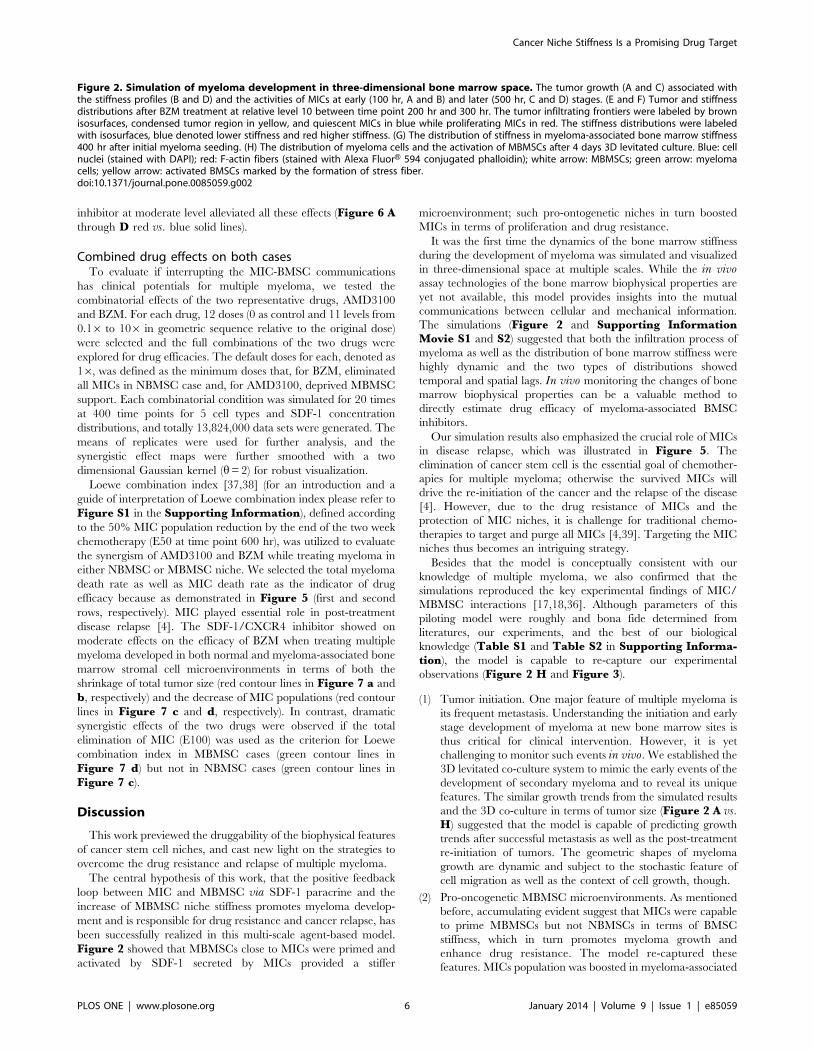
under the NMBSC and MBMSC (Blue vs. red lines in Figure 3 Aand B) after 4 weeks growth were consistent with experimental
results [18] (Blue vs. red bars in Figure 3 A and B). Tumor also
showed consistent BZM dose responses after 48 hr treatment in
simulation and in experiments (blue vs. red lines, Figure 3 C).
Data shown in Figure 3 were the mean values of the 20
simulations for every 20 hours (every 10 time steps).
Effects of MBMSCs in disease developmentWe first tuned the model to recapture experimental observa-
tions and explored the roles of myeloma-associated MBMSCs in
disease development using the NBMSCs as controls. The
simulation results of tumor growth and the comparison with
experimental data were summarized in Figure 4 and Figure 3.
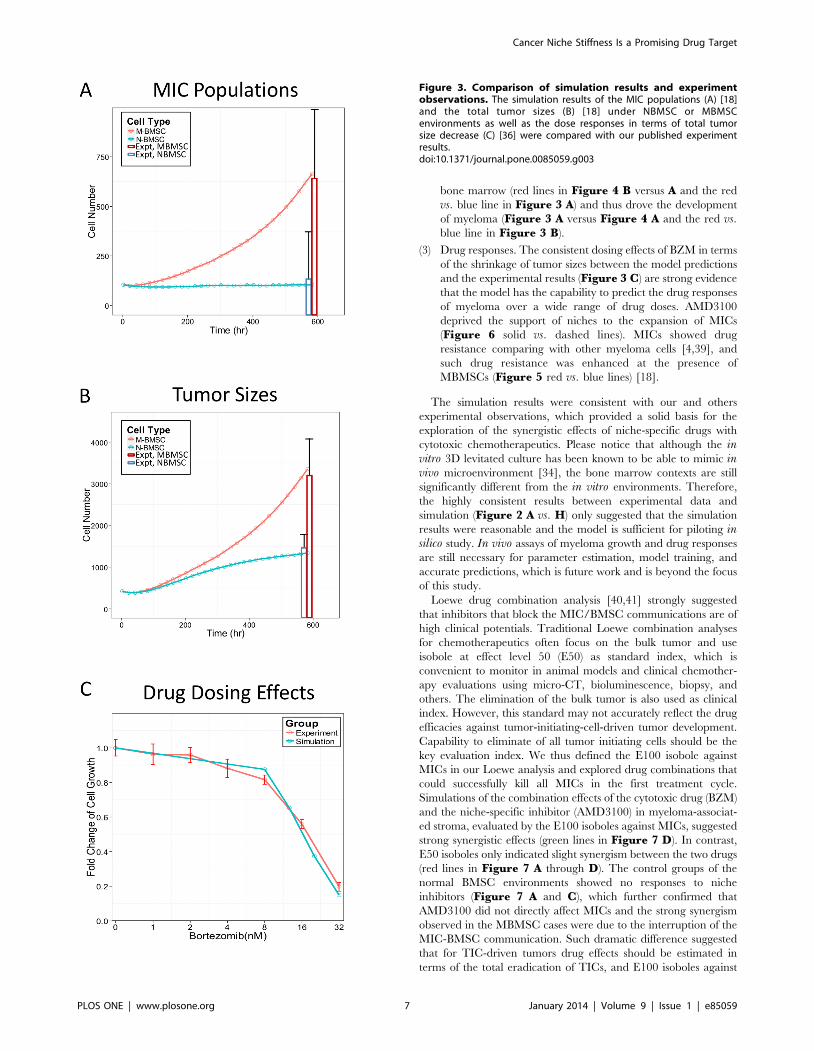
The cell number of each tumor cell type during the first 600 hours
(25 days) were shown for the NBMSC (Figure 4 A) or the
MBMSC (Figure 4 B) case, and the MIC populations (Figure 3A) as well as the total tumor sizes (Figure 3 B) were compared
with our previously published experimental results. Tumor grew
about 2.6 folds faster under MBMSC context, while the MIC
population was 6.8 folds larger. Simulation results were consistent
with experiments. The myeloma population in MBMSC was
dominated by ‘‘younger’’ tumor cells such as progenitors
comparing with the normal counterpart, which was dominated
by terminal myeloma cells. Data shown in Figure 4 were also the
mean values of the 20 simulations for every 20 hours (every 10
time steps).
Effects of MBMSCs on chemotherapy outcomes usingBZM
To explore the drug resistance to chemotherapies and the risk of
tumor relapse in MBMSC and NBMSC microenvironments, we
simulated the first BZM treatment cycle at 11 dose levels covering
two magnitudes. BZM was delivered 200 hours after tumor
initiation and the treatments lasted for 400 hours. The dynamic of
total tumor cells as well as MICs during the first 1000 hours were
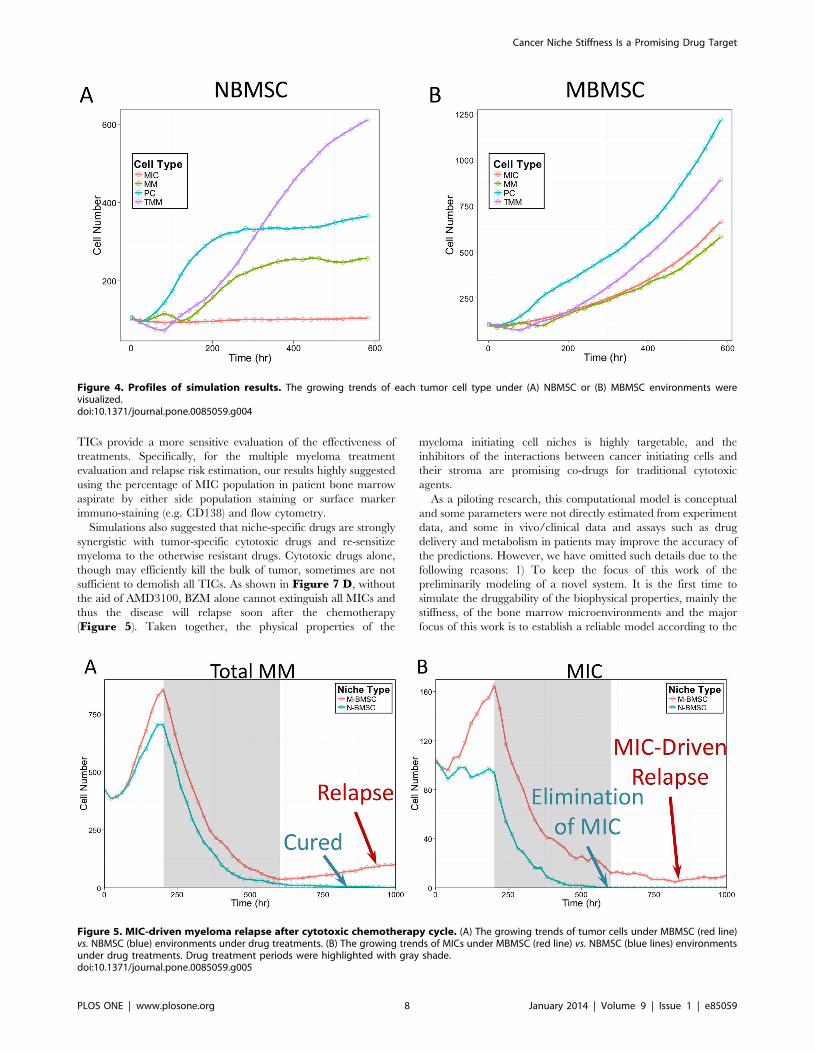
shown in Figure 5. After drug delivery, the tumor populations
quickly dropped for both MBMSC and NBMSC (red and blue
lines in Figure 5 a, respectively) cases. The drug efficacy, in terms
of the elimination of myeloma population, was similar in both
cases, and during the first treatment cycle the tumor cell number
decreased to a very low level that were clinically not detectable.
However, drug efficacy on MICs, a small portion of the tumor
population, was significantly different. Medium dose of BZM
treatment (the sixth level among all eleven) completely killed all the
MICs in NBMSC-dominated bone marrow (Figure 5 b blue
line), whereas a few MIC cells survived the chemotherapy in the
MBMSC case (Figure 5 b red line) due to the drug resistance
boosted by myeloma-associated stroma. The MIC-free tumor
population kept degenerating till the cure of the disease, while in
contrast the survived MICs re-initiate the myeloma and caused
MIC-driven tumor relapse (Figure 5 a blue vs. red lines, time 600
to 1000 hr).
Two typical simulations were shown in Figure 5, and the rest
were discussed in the following sections.
Inhibition of MIC-BMSC communications by AMD 3100treatment
We then examined if the inhibition of MIC-BMSC communi-
cations could deprive MICs from the protection of their stroma
and re-sensitize the tumor in the MBMSC context to chemother-
apy. AMD 3100, a competitive inhibitor of SDF-1, was delivered
at 11 levels crossing two magnitudes, either alone or with BZM, to
myeloma growing with either myeloma-associated or normal
BMSC stroma. The effects of medium AMD dose were visualized
by two simulations in Figure 6 and the rest summarized in
Figure 7. AMD-treated and AMD-free cases were denoted in
solid and dashed lines, and the myeloma-associated and normal
BMSC niches in red and blue colors, respectively. Consistent with
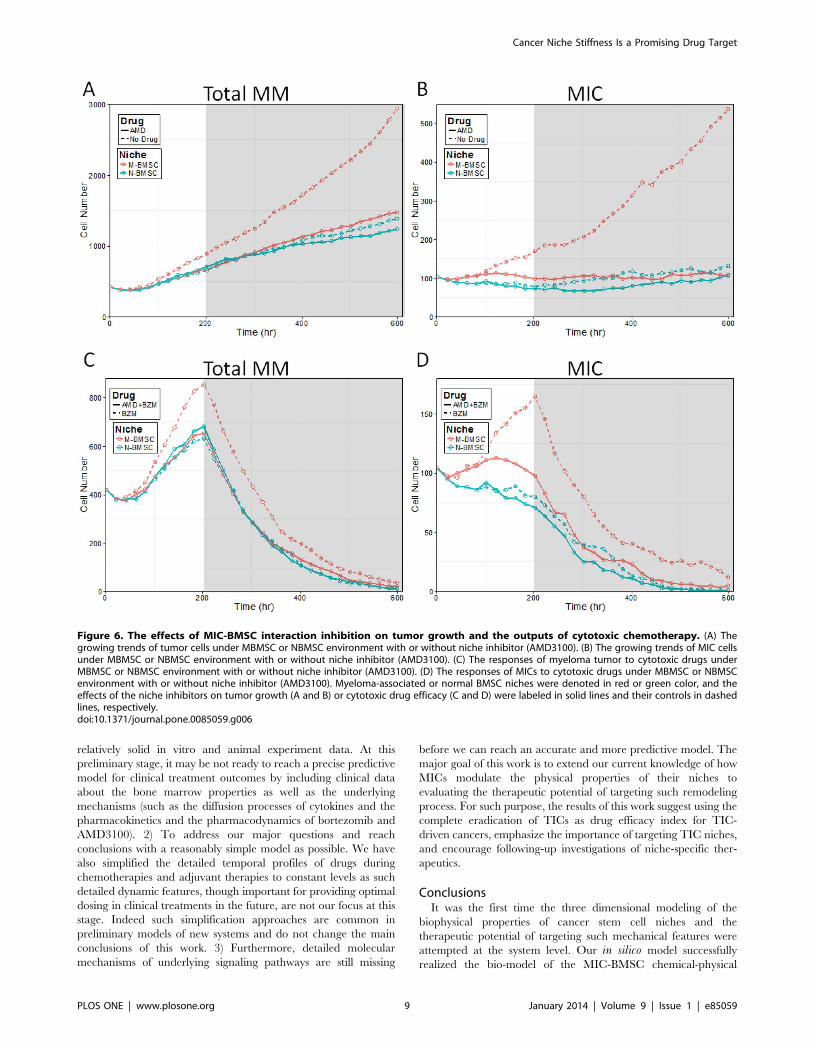
Figure 3 (A) and (B) and Figure 5 (A) and (B), MBMSC niches
promoted tumor growth (Figure 6 a red vs. blue dashed lines),
MIC self-renewal (Figure 6 b red vs. blue dashed lines), and drug
resistance (Figure 6 c red vs. blue dashed lines) driven by MICs
(Figure 6 d red vs. blue dashed lines). Introduction of niche
Cancer Niche Stiffness Is a Promising Drug Target
PLOS ONE | www.plosone.org 4 January 2014 | Volume 9 | Issue 1 | e85059
Cancer Niche Stiffness Is a Promising Drug Target
PLOS ONE | www.plosone.org 5 January 2014 | Volume 9 | Issue 1 | e85059
inhibitor at moderate level alleviated all these effects (Figure 6 Athrough D red vs. blue solid lines).
Combined drug effects on both casesTo evaluate if interrupting the MIC-BMSC communications
has clinical potentials for multiple myeloma, we tested the
combinatorial effects of the two representative drugs, AMD3100
and BZM. For each drug, 12 doses (0 as control and 11 levels from
0.16 to 106 in geometric sequence relative to the original dose)
were selected and the full combinations of the two drugs were
explored for drug efficacies. The default doses for each, denoted as
16, was defined as the minimum doses that, for BZM, eliminated
all MICs in NBMSC case and, for AMD3100, deprived MBMSC
support. Each combinatorial condition was simulated for 20 times
at 400 time points for 5 cell types and SDF-1 concentration
distributions, and totally 13,824,000 data sets were generated. The
means of replicates were used for further analysis, and the
synergistic effect maps were further smoothed with a two
dimensional Gaussian kernel (h= 2) for robust visualization.
Loewe combination index [37,38] (for an introduction and a
guide of interpretation of Loewe combination index please refer to
Figure S1 in the Supporting Information), defined according
to the 50% MIC population reduction by the end of the two week
chemotherapy (E50 at time point 600 hr), was utilized to evaluate
the synergism of AMD3100 and BZM while treating myeloma in
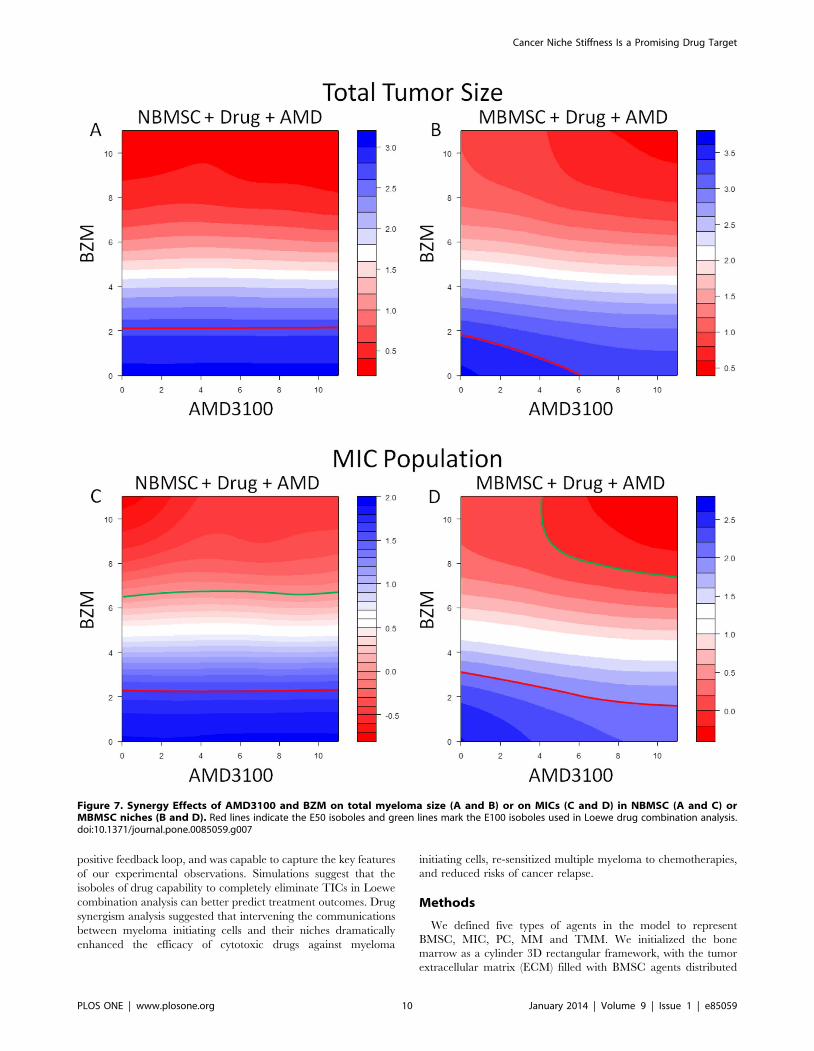
either NBMSC or MBMSC niche. We selected the total myeloma
death rate as well as MIC death rate as the indicator of drug
efficacy because as demonstrated in Figure 5 (first and second
rows, respectively). MIC played essential role in post-treatment
disease relapse [4]. The SDF-1/CXCR4 inhibitor showed on
moderate effects on the efficacy of BZM when treating multiple
myeloma developed in both normal and myeloma-associated bone
marrow stromal cell microenvironments in terms of both the
shrinkage of total tumor size (red contour lines in Figure 7 a and
b, respectively) and the decrease of MIC populations (red contour
lines in Figure 7 c and d, respectively). In contrast, dramatic
synergistic effects of the two drugs were observed if the total
elimination of MIC (E100) was used as the criterion for Loewe
combination index in MBMSC cases (green contour lines in
Figure 7 d) but not in NBMSC cases (green contour lines in
Figure 7 c).
Discussion
This work previewed the druggability of the biophysical features
of cancer stem cell niches, and cast new light on the strategies to
overcome the drug resistance and relapse of multiple myeloma.
The central hypothesis of this work, that the positive feedback
loop between MIC and MBMSC via SDF-1 paracrine and the
increase of MBMSC niche stiffness promotes myeloma develop-
ment and is responsible for drug resistance and cancer relapse, has
been successfully realized in this multi-scale agent-based model.
Figure 2 showed that MBMSCs close to MICs were primed and
activated by SDF-1 secreted by MICs provided a stiffer
microenvironment; such pro-ontogenetic niches in turn boosted
MICs in terms of proliferation and drug resistance.
It was the first time the dynamics of the bone marrow stiffness
during the development of myeloma was simulated and visualized
in three-dimensional space at multiple scales. While the in vivoassay technologies of the bone marrow biophysical properties are
yet not available, this model provides insights into the mutual
communications between cellular and mechanical information.
The simulations (Figure 2 and Supporting InformationMovie S1 and S2) suggested that both the infiltration process of
myeloma as well as the distribution of bone marrow stiffness were
highly dynamic and the two types of distributions showed
temporal and spatial lags. In vivo monitoring the changes of bone
marrow biophysical properties can be a valuable method to
directly estimate drug efficacy of myeloma-associated BMSC
inhibitors.
Our simulation results also emphasized the crucial role of MICs
in disease relapse, which was illustrated in Figure 5. The
elimination of cancer stem cell is the essential goal of chemother-
apies for multiple myeloma; otherwise the survived MICs will
drive the re-initiation of the cancer and the relapse of the disease
[4]. However, due to the drug resistance of MICs and the
protection of MIC niches, it is challenge for traditional chemo-
therapies to target and purge all MICs [4,39]. Targeting the MIC
niches thus becomes an intriguing strategy.
Besides that the model is conceptually consistent with our
knowledge of multiple myeloma, we also confirmed that the
simulations reproduced the key experimental findings of MIC/
MBMSC interactions [17,18,36]. Although parameters of this
piloting model were roughly and bona fide determined from
literatures, our experiments, and the best of our biological
knowledge (Table S1 and Table S2 in Supporting Informa-tion), the model is capable to re-capture our experimental
observations (Figure 2 H and Figure 3).
(1) Tumor initiation. One major feature of multiple myeloma is
its frequent metastasis. Understanding the initiation and early
stage development of myeloma at new bone marrow sites is
thus critical for clinical intervention. However, it is yet
challenging to monitor such events in vivo. We established the
3D levitated co-culture system to mimic the early events of the
development of secondary myeloma and to reveal its unique
features. The similar growth trends from the simulated results
and the 3D co-culture in terms of tumor size (Figure 2 A vs.H) suggested that the model is capable of predicting growth
trends after successful metastasis as well as the post-treatment
re-initiation of tumors. The geometric shapes of myeloma
growth are dynamic and subject to the stochastic feature of
cell migration as well as the context of cell growth, though.
(2) Pro-oncogenetic MBMSC microenvironments. As mentioned
before, accumulating evident suggest that MICs were capable
to prime MBMSCs but not NBMSCs in terms of BMSC
stiffness, which in turn promotes myeloma growth and
enhance drug resistance. The model re-captured these
features. MICs population was boosted in myeloma-associated
Figure 2. Simulation of myeloma development in three-dimensional bone marrow space. The tumor growth (A and C) associated withthe stiffness profiles (B and D) and the activities of MICs at early (100 hr, A and B) and later (500 hr, C and D) stages. (E and F) Tumor and stiffnessdistributions after BZM treatment at relative level 10 between time point 200 hr and 300 hr. The tumor infiltrating frontiers were labeled by brownisosurfaces, condensed tumor region in yellow, and quiescent MICs in blue while proliferating MICs in red. The stiffness distributions were labeledwith isosurfaces, blue denoted lower stiffness and red higher stiffness. (G) The distribution of stiffness in myeloma-associated bone marrow stiffness400 hr after initial myeloma seeding. (H) The distribution of myeloma cells and the activation of MBMSCs after 4 days 3D levitated culture. Blue: cellnuclei (stained with DAPI); red: F-actin fibers (stained with Alexa FluorH 594 conjugated phalloidin); white arrow: MBMSCs; green arrow: myelomacells; yellow arrow: activated BMSCs marked by the formation of stress fiber.doi:10.1371/journal.pone.0085059.g002
Cancer Niche Stiffness Is a Promising Drug Target
PLOS ONE | www.plosone.org 6 January 2014 | Volume 9 | Issue 1 | e85059
bone marrow (red lines in Figure 4 B versus A and the red
vs. blue line in Figure 3 A) and thus drove the development
of myeloma (Figure 3 A versus Figure 4 A and the red vs.blue line in Figure 3 B).
(3) Drug responses. The consistent dosing effects of BZM in terms
of the shrinkage of tumor sizes between the model predictions
and the experimental results (Figure 3 C) are strong evidence
that the model has the capability to predict the drug responses
of myeloma over a wide range of drug doses. AMD3100
deprived the support of niches to the expansion of MICs
(Figure 6 solid vs. dashed lines). MICs showed drug
resistance comparing with other myeloma cells [4,39], and
such drug resistance was enhanced at the presence of
MBMSCs (Figure 5 red vs. blue lines) [18].
The simulation results were consistent with our and others
experimental observations, which provided a solid basis for the
exploration of the synergistic effects of niche-specific drugs with
cytotoxic chemotherapeutics. Please notice that although the invitro 3D levitated culture has been known to be able to mimic invivo microenvironment [34], the bone marrow contexts are still
significantly different from the in vitro environments. Therefore,
the highly consistent results between experimental data and
simulation (Figure 2 A vs. H) only suggested that the simulation
results were reasonable and the model is sufficient for piloting insilico study. In vivo assays of myeloma growth and drug responses
are still necessary for parameter estimation, model training, and
accurate predictions, which is future work and is beyond the focus
of this study.
Loewe drug combination analysis [40,41] strongly suggested
that inhibitors that block the MIC/BMSC communications are of
high clinical potentials. Traditional Loewe combination analyses
for chemotherapeutics often focus on the bulk tumor and use
isobole at effect level 50 (E50) as standard index, which is
convenient to monitor in animal models and clinical chemother-
apy evaluations using micro-CT, bioluminescence, biopsy, and
others. The elimination of the bulk tumor is also used as clinical
index. However, this standard may not accurately reflect the drug
efficacies against tumor-initiating-cell-driven tumor development.
Capability to eliminate of all tumor initiating cells should be the
key evaluation index. We thus defined the E100 isobole against
MICs in our Loewe analysis and explored drug combinations that
could successfully kill all MICs in the first treatment cycle.
Simulations of the combination effects of the cytotoxic drug (BZM)
and the niche-specific inhibitor (AMD3100) in myeloma-associat-
ed stroma, evaluated by the E100 isoboles against MICs, suggested
strong synergistic effects (green lines in Figure 7 D). In contrast,
E50 isoboles only indicated slight synergism between the two drugs
(red lines in Figure 7 A through D). The control groups of the
normal BMSC environments showed no responses to niche
inhibitors (Figure 7 A and C), which further confirmed that
AMD3100 did not directly affect MICs and the strong synergism
observed in the MBMSC cases were due to the interruption of the
MIC-BMSC communication. Such dramatic difference suggested
that for TIC-driven tumors drug effects should be estimated in
terms of the total eradication of TICs, and E100 isoboles against
Figure 3. Comparison of simulation results and experimentobservations. The simulation results of the MIC populations (A) [18]and the total tumor sizes (B) [18] under NBMSC or MBMSCenvironments as well as the dose responses in terms of total tumorsize decrease (C) [36] were compared with our published experimentresults.doi:10.1371/journal.pone.0085059.g003
Cancer Niche Stiffness Is a Promising Drug Target
PLOS ONE | www.plosone.org 7 January 2014 | Volume 9 | Issue 1 | e85059
TICs provide a more sensitive evaluation of the effectiveness of
treatments. Specifically, for the multiple myeloma treatment
evaluation and relapse risk estimation, our results highly suggested
using the percentage of MIC population in patient bone marrow
aspirate by either side population staining or surface marker
immuno-staining (e.g. CD138) and flow cytometry.
Simulations also suggested that niche-specific drugs are strongly
synergistic with tumor-specific cytotoxic drugs and re-sensitize
myeloma to the otherwise resistant drugs. Cytotoxic drugs alone,
though may efficiently kill the bulk of tumor, sometimes are not
sufficient to demolish all TICs. As shown in Figure 7 D, without
the aid of AMD3100, BZM alone cannot extinguish all MICs and
thus the disease will relapse soon after the chemotherapy
(Figure 5). Taken together, the physical properties of the
myeloma initiating cell niches is highly targetable, and the
inhibitors of the interactions between cancer initiating cells and
their stroma are promising co-drugs for traditional cytotoxic
agents.
As a piloting research, this computational model is conceptual
and some parameters were not directly estimated from experiment
data, and some in vivo/clinical data and assays such as drug
delivery and metabolism in patients may improve the accuracy of
the predictions. However, we have omitted such details due to the
following reasons: 1) To keep the focus of this work of the
preliminarily modeling of a novel system. It is the first time to
simulate the druggability of the biophysical properties, mainly the
stiffness, of the bone marrow microenvironments and the major
focus of this work is to establish a reliable model according to the
Figure 4. Profiles of simulation results. The growing trends of each tumor cell type under (A) NBMSC or (B) MBMSC environments werevisualized.doi:10.1371/journal.pone.0085059.g004
Figure 5. MIC-driven myeloma relapse after cytotoxic chemotherapy cycle. (A) The growing trends of tumor cells under MBMSC (red line)vs. NBMSC (blue) environments under drug treatments. (B) The growing trends of MICs under MBMSC (red line) vs. NBMSC (blue lines) environmentsunder drug treatments. Drug treatment periods were highlighted with gray shade.doi:10.1371/journal.pone.0085059.g005
Cancer Niche Stiffness Is a Promising Drug Target
PLOS ONE | www.plosone.org 8 January 2014 | Volume 9 | Issue 1 | e85059
relatively solid in vitro and animal experiment data. At this
preliminary stage, it may be not ready to reach a precise predictive
model for clinical treatment outcomes by including clinical data
about the bone marrow properties as well as the underlying
mechanisms (such as the diffusion processes of cytokines and the
pharmacokinetics and the pharmacodynamics of bortezomib and
AMD3100). 2) To address our major questions and reach
conclusions with a reasonably simple model as possible. We have
also simplified the detailed temporal profiles of drugs during
chemotherapies and adjuvant therapies to constant levels as such
detailed dynamic features, though important for providing optimal
dosing in clinical treatments in the future, are not our focus at this
stage. Indeed such simplification approaches are common in
preliminary models of new systems and do not change the main
conclusions of this work. 3) Furthermore, detailed molecular
mechanisms of underlying signaling pathways are still missing
before we can reach an accurate and more predictive model. The
major goal of this work is to extend our current knowledge of how
MICs modulate the physical properties of their niches to
evaluating the therapeutic potential of targeting such remodeling
process. For such purpose, the results of this work suggest using the
complete eradication of TICs as drug efficacy index for TIC-
driven cancers, emphasize the importance of targeting TIC niches,
and encourage following-up investigations of niche-specific ther-
apeutics.
ConclusionsIt was the first time the three dimensional modeling of the
biophysical properties of cancer stem cell niches and the
therapeutic potential of targeting such mechanical features were
attempted at the system level. Our in silico model successfully
realized the bio-model of the MIC-BMSC chemical-physical
Figure 6. The effects of MIC-BMSC interaction inhibition on tumor growth and the outputs of cytotoxic chemotherapy. (A) Thegrowing trends of tumor cells under MBMSC or NBMSC environment with or without niche inhibitor (AMD3100). (B) The growing trends of MIC cellsunder MBMSC or NBMSC environment with or without niche inhibitor (AMD3100). (C) The responses of myeloma tumor to cytotoxic drugs underMBMSC or NBMSC environment with or without niche inhibitor (AMD3100). (D) The responses of MICs to cytotoxic drugs under MBMSC or NBMSCenvironment with or without niche inhibitor (AMD3100). Myeloma-associated or normal BMSC niches were denoted in red or green color, and theeffects of the niche inhibitors on tumor growth (A and B) or cytotoxic drug efficacy (C and D) were labeled in solid lines and their controls in dashedlines, respectively.doi:10.1371/journal.pone.0085059.g006
Cancer Niche Stiffness Is a Promising Drug Target
PLOS ONE | www.plosone.org 9 January 2014 | Volume 9 | Issue 1 | e85059
positive feedback loop, and was capable to capture the key features
of our experimental observations. Simulations suggest that the
isoboles of drug capability to completely eliminate TICs in Loewe
combination analysis can better predict treatment outcomes. Drug
synergism analysis suggested that intervening the communications
between myeloma initiating cells and their niches dramatically
enhanced the efficacy of cytotoxic drugs against myeloma
initiating cells, re-sensitized multiple myeloma to chemotherapies,
and reduced risks of cancer relapse.
Methods
We defined five types of agents in the model to represent
BMSC, MIC, PC, MM and TMM. We initialized the bone
marrow as a cylinder 3D rectangular framework, with the tumor
extracellular matrix (ECM) filled with BMSC agents distributed
Figure 7. Synergy Effects of AMD3100 and BZM on total myeloma size (A and B) or on MICs (C and D) in NBMSC (A and C) orMBMSC niches (B and D). Red lines indicate the E50 isoboles and green lines mark the E100 isoboles used in Loewe drug combination analysis.doi:10.1371/journal.pone.0085059.g007
Cancer Niche Stiffness Is a Promising Drug Target
PLOS ONE | www.plosone.org 10 January 2014 | Volume 9 | Issue 1 | e85059
evenly across the 3D ECM and the mixed MIC, PC, MM and
TMM agents at the center of the bone marrow as a sphere. Such
initiating cell ratios were according to the myeloma initiating cell
hypothesis as well as our previous publications that the MICs can
restore the whole myeloma population, including the composition
ratios of myeloma cell types. This multi-scale modeling consisted
of three scales: intracellular, intercellular and tissue scales, which
were illustrated in Figure 1, Figure 8, and described in details in
the following sections. The model was generally presented as
pseudo-code and listed in Figure S6. Detailed flowcharts of each
myeloma agents were illustrated in Figure S2 (for MIC agent),
Figure S3 (for PC agent), Figure S4 (for MM agent), and
Figure S5 (for TMM agent) in the Supporting Information.
Parameters were determined according to our previous work as
well as literature [17,18,36]. Mathematical and computational
details are elaborated in Support Material.
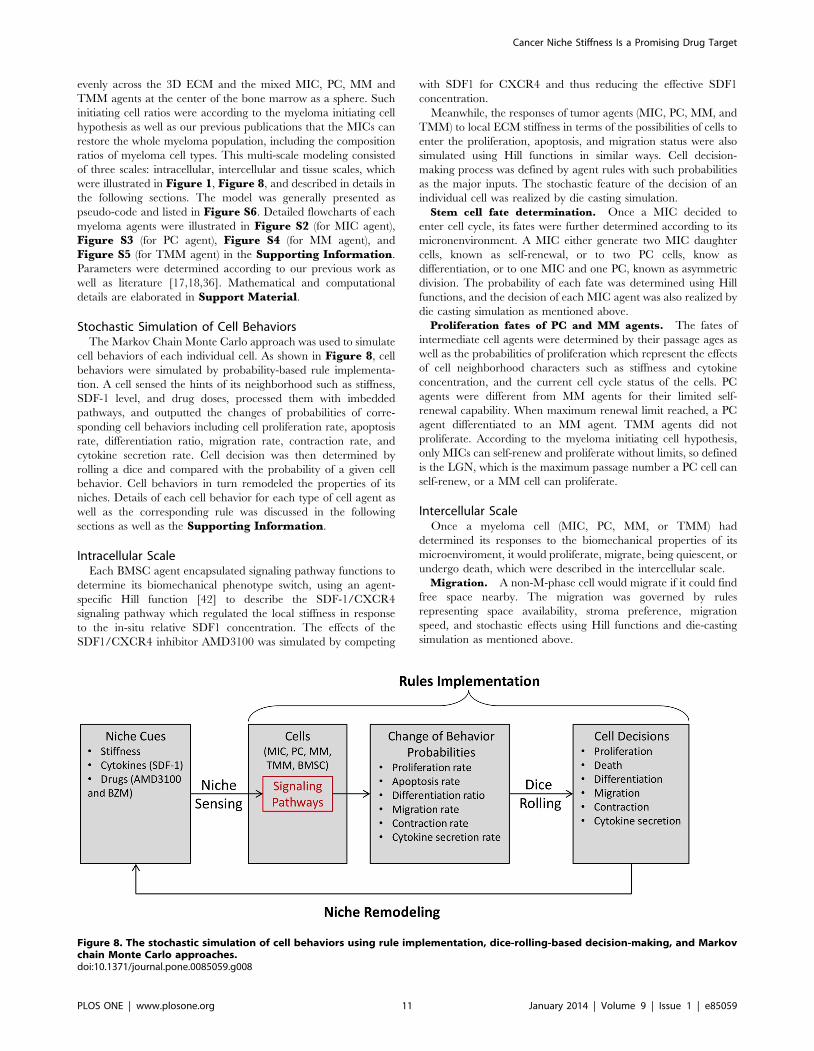
Stochastic Simulation of Cell BehaviorsThe Markov Chain Monte Carlo approach was used to simulate
cell behaviors of each individual cell. As shown in Figure 8, cell
behaviors were simulated by probability-based rule implementa-
tion. A cell sensed the hints of its neighborhood such as stiffness,
SDF-1 level, and drug doses, processed them with imbedded
pathways, and outputted the changes of probabilities of corre-
sponding cell behaviors including cell proliferation rate, apoptosis
rate, differentiation ratio, migration rate, contraction rate, and
cytokine secretion rate. Cell decision was then determined by
rolling a dice and compared with the probability of a given cell
behavior. Cell behaviors in turn remodeled the properties of its
niches. Details of each cell behavior for each type of cell agent as
well as the corresponding rule was discussed in the following
sections as well as the Supporting Information.
Intracellular ScaleEach BMSC agent encapsulated signaling pathway functions to
determine its biomechanical phenotype switch, using an agent-
specific Hill function [42] to describe the SDF-1/CXCR4
signaling pathway which regulated the local stiffness in response
to the in-situ relative SDF1 concentration. The effects of the
SDF1/CXCR4 inhibitor AMD3100 was simulated by competing
with SDF1 for CXCR4 and thus reducing the effective SDF1
concentration.
Meanwhile, the responses of tumor agents (MIC, PC, MM, and
TMM) to local ECM stiffness in terms of the possibilities of cells to
enter the proliferation, apoptosis, and migration status were also
simulated using Hill functions in similar ways. Cell decision-
making process was defined by agent rules with such probabilities
as the major inputs. The stochastic feature of the decision of an
individual cell was realized by die casting simulation.
Stem cell fate determination. Once a MIC decided to
enter cell cycle, its fates were further determined according to its
micronenvironment. A MIC either generate two MIC daughter
cells, known as self-renewal, or to two PC cells, know as
differentiation, or to one MIC and one PC, known as asymmetric
division. The probability of each fate was determined using Hill
functions, and the decision of each MIC agent was also realized by
die casting simulation as mentioned above.
Proliferation fates of PC and MM agents. The fates of
intermediate cell agents were determined by their passage ages as
well as the probabilities of proliferation which represent the effects
of cell neighborhood characters such as stiffness and cytokine
concentration, and the current cell cycle status of the cells. PC
agents were different from MM agents for their limited self-
renewal capability. When maximum renewal limit reached, a PC
agent differentiated to an MM agent. TMM agents did not
proliferate. According to the myeloma initiating cell hypothesis,
only MICs can self-renew and proliferate without limits, so defined
is the LGN, which is the maximum passage number a PC cell can
self-renew, or a MM cell can proliferate.
Intercellular ScaleOnce a myeloma cell (MIC, PC, MM, or TMM) had
determined its responses to the biomechanical properties of its
microenviroment, it would proliferate, migrate, being quiescent, or
undergo death, which were described in the intercellular scale.
Migration. A non-M-phase cell would migrate if it could find
free space nearby. The migration was governed by rules
representing space availability, stroma preference, migration
speed, and stochastic effects using Hill functions and die-casting
simulation as mentioned above.
Figure 8. The stochastic simulation of cell behaviors using rule implementation, dice-rolling-based decision-making, and Markovchain Monte Carlo approaches.doi:10.1371/journal.pone.0085059.g008
Cancer Niche Stiffness Is a Promising Drug Target
PLOS ONE | www.plosone.org 11 January 2014 | Volume 9 | Issue 1 | e85059
Division of MIC, PC and MM agents. If M-phase cell
found at least one free location within searching distance, it would
divide, following the same migration rules but with a much smaller
migration distance (i.e., slower migration speed) so the de novo
daughter cells were always next to the parental cells. If no space
was available, cells would remain in M-phase and try in next
round.
Apoptosis. The decision-making of cell apoptosis was simu-
lated using a pre-defined threshold for the apoptosis rate reflecting
cell microenvironment, especially the local drug (BZM and AMD)
concentrations and stiffness. The whole apoptosis process took
about 20 hours. RPMI 8226 myeloma cell apoptosis rates under
drug treatments were determined according to our previous study
[36].
Tissue scalesIn the tissue scale of this ABM, the secretion of SDF1 from MIC
agents and the diffusion of SDF1 in the 3D ECM defined the
dynamic 3D distribution of SDF1 concentration [43–45]. SDF1
was uniformly initialized at the start with Dirichlet boundary.
In summary, intracellular signaling pathways were encapsulated
into each cell to determine either the BMSC intercellular
biomechanical phenotype (cell stiffness) or tumor cells’ (MIC, PC
and MM) behaviors (migration, differentiation, proliferation, or
apoptosis). Cancer cells competed for the best location in 3D
extracellular matrix to migrate or proliferate regarding to the
change of BMSC cell’s stiffness and cell density. In turn, chemo-
attractant cues (SDF1) at the tissue level triggered BMSC cell’s
intracellular signaling pathways by receptors. And the resultant
feedbacks were the changes of either cancer cells’ properties
(change of BMSC cells’ stiffness) or behaviors of cancer cells
(secretion of cytokines, proliferation, differentiation, apoptosis, or
migration). Thus, the 3D dynamics of bone marrow stiffness and
tumor growth were simulated at multiple temporal and spatial
scales.
Materials and Methods
Myeloma cell modelWe chose RPMI 8226, one of the most widely used human
myeloma cell lines, as the myeloma cell model because it had been
shown representative of key myeloma pathogenesis features of
interest in this work. In vivo and in vitro evidence from our
[17,18,36] and other research groups [3,4,46] suggested the
clinical translational values [46] of the MICs from RPMI 8226,
which re-capture major clinical myeloma stem cell characters such
as drug resistance and initiating myeloma in bone marrow by
generating the whole myeloma population, both of which are
boosted by the positive feedback loops with their associated stroma
cells via the SDF-1/stiffness chemo-physical interactions. Specif-
ically, RPMI 8226 has been shown to be representative among
other frequently used human myeloma cell lines in terms of
Bortezomib treatment responses [47,48].
Cell isolation and cultureMyeloma-associated and normal stroma cells were isolated and
expanded from myeloma patients similarly as previously described
[18], depending if they were diagnosed of bone marrow involved
myeloma or not. Briefly, after lysis of red blood cells (RBC Lysis
Solution, QIAGEN), patient bone marrow aspirate was cultured in
MesenPRO RSTM medium (Invitrogen) in 5% CO2 humidified
atmosphere at 37uC for one week and unattached cells discarded.
Attached MBMSC was expended under same culture conditions.
Usage of these samples has been approved by the Institutional
Review Board of The Methodist Hospital Research Institute
(TMHRI). RPMI8226 multiple myeloma cell line was purchased
from ATCC and cultured in RPMI 1640 medium (Mediatech)
supplemented with 8% fetal bovine serum (Invitrogen) 100 units/
ml penicillinand 100 mg/ml streptomycin (Life Technologies) at
37uC in 5% CO2. This study was granted for Consent waiver by
IRB.
Levitated 3D co-cultureBoth MBMSC and RPMI8226 were treated with Nanoshut-
tleTM-PL (n3D Biosciences) overnight per manufacturer’s instruc-
tion, MBMSC detached by slight trypsin treatment, mixed at 1:20
to 1:200 ratios (MBMSC:RPMI8226), transferred to CostarH 6
well Ultra Low Attachment plate (Corning) to reach about 400
cells per well, and immediately levitated using the 6-well Bio-
AssemblerTM Magnetic Drive (n3D Biosciences) and cultured in
RPMI 1640 medium (Mediatech) as described before.
Staining and imagingAt day 4 the assembled MIC/MBMSC co-cultured tissue was
collected, rinsed in PBS, fixed with 3.7% paraformaldehyde
(Fisher) for 10 min, blocked with 1% bovine serum albumin
(Fisher), and stained with Alexa FluorH 594 phalloidin (Invitrogen)
using 1:40 dilution for 30 min, followed by counter staining using
300 nM DAPI (Invitrogen) for 5 min, rinsed with DI water, and
mounted with ProLongH Gold Antifade Reagent (Invitrogen) for
imaging. The process was under the protection of the Magnetic
Drive to avoid lost of cells. The Nikon A1 Confocal Imaging
System was used to image samples for DAPI and Alexa FluorH 594
signals with optical slicing distance of 8 mM and the 3D images
were reconstructed using NIS-Elements Microscope Imaging
Software (Nikon).
Supporting Information
Figure S1 The Loewe drug combination analysis.
(TIF)
Figure S2 The flowchart of the MIC agent.
(TIF)
Figure S3 The flowchart of the PC agent.
(TIF)
(TIF)
Figure S5 The flowchart of the TMM agent.
(TIF)
Figure S6 The pseudocode of the multi-scale agent-based model.
(TIFF)
Movie S1 Simulation of myeloma growth in three-dimensional bone marrow space. Simulation conditions
and details see Figure 2.
(MP4)
Movie S2 Simulation of stiffness profiles associatedwith myeloma growth in three-dimensional bone mar-row space. Simulation conditions and details see Figure 2.
(MP4)
Movie S3 Spatial stiffness profile in three dimensionalbone marrow space 400 hr after initiation. Simulation
conditions and details see Figure 2.
Cancer Niche Stiffness Is a Promising Drug Target
PLOS ONE | www.plosone.org 12 January 2014 | Volume 9 | Issue 1 | e85059
(ZIP)
Figure S4 The flowchart of the MM agent.
Acknowledgments
The authors also acknowledge the Texas Advanced Computing Center
(TACC) at The University of Texas at Austin for providing HPC resources
that have contributed to the research results reported within this paper.
URL: http://www.tacc.utexas.edu.
Author Contributions
Conceived and designed the experiments: JS LZ CC XZ. Performed the
experiments: JS WZ DC JW BJ. Analyzed the data: JS. Contributed
reagents/materials/analysis tools: DC JW. Wrote the paper: JS LZ CC
XZ.
References
1. Chang CC, Schur BC, Kampalath B, Lindholm P, Becker CG, et al. (2001) A
novel multiparametric approach for analysis of cytoplasmic immunoglobulin
light chains by flow cytometry. Mod Pathol 14: 1015–1021.
2. Joe Conway C-CC (2008) Determining the phenotype of clonotypic B-
lymphocytes in multiple myeloma by flow cytometry. Arch Pathol Lab Med inpess.
3. Matsui W, Huff CA, Wang Q, Malehorn MT, Barber J, et al. (2004)
Characterization of clonogenic multiple myeloma cells. Blood 103: 2332–2336.
4. Matsui W, Wang Q, Barber JP, Brennan S, Smith BD, et al. (2008) Clonogenic
multiple myeloma progenitors, stem cell properties, and drug resistance. CancerRes 68: 190–197.
5. Kukreja A, Hutchinson A, Dhodapkar K, Mazumder A, Vesole D, et al. (2006)Enhancement of clonogenicity of human multiple myeloma by dendritic cells.
J Exp Med 203: 1859–1865.
6. Pilarski LM, Seeberger K, Coupland RW, Eshpeter A, Keats JJ, et al. (2002)
Leukemic B cells clonally identical to myeloma plasma cells are myelomagenic inNOD/SCID mice. Exp Hematol 30: 221–228.
7. Caers J, Van Valckenborgh E, Menu E, Van Camp B, Vanderkerken K (2008)Unraveling the biology of multiple myeloma disease: cancer stem cells, acquired
intracellular changes and interactions with the surrounding micro-environment.
Bull Cancer 95: 301–313.
8. Peacock CD, Wang Q, Gesell GS, Corcoran-Schwartz IM, Jones E, et al. (2007)Hedgehog signaling maintains a tumor stem cell compartment in multiple
myeloma. Proc Natl Acad Sci U S A 104: 4048–4053.
9. Ghosh N, Matsui W (2008) Cancer stem cells in multiple myeloma. Cancer Lett.
10. Huff CA, Matsui W (2008) Multiple myeloma cancer stem cells. J Clin Oncol 26:2895–2900.
11. Wicha MS, Liu S, Dontu G (2006) Cancer stem cells: an old idea–a paradigmshift. Cancer Res 66: 1883–1890; discussion 1895–1886.
12. Lapidot T, Sirard C, Vormoor J, Murdoch B, Hoang T, et al. (1994) A cell
initiating human acute myeloid leukaemia after transplantation into SCID mice.
Nature 367: 645–648.
13. Dean M, Fojo T, Bates S (2005) Tumour stem cells and drug resistance. Nat Rev
Cancer 5: 275–284.
14. Blade J, Rosinol L (2009) Changing paradigms in the treatment of multiplemyeloma. Haematologica 94: 163–166.
15. Podar K, Tai YT, Hideshima T, Vallet S, Richardson PG, et al. (2009)Emerging therapies for multiple myeloma. Expert Opin Emerg Drugs 14: 99–
127.
16. Bensinger WI (2009) Role of autologous and allogeneic stem cell transplantation
in myeloma. Leukemia 23: 442–448.
17. Feng Y, Ofek G, Choi DS, Wen J, Hu J, et al. (2010) Unique biomechanical
interactions between myeloma cells and bone marrow stroma cells. Prog BiophysMol Biol 103: 148–156.
18. Feng Y, Wen J, Mike P, Choi DS, Eshoa C, et al. (2010) Bone marrow stromalcells from myeloma patients support the growth of myeloma stem cells. Stem
Cells Dev 19: 1289–1296.
19. Rosen JM, Jordan CT (2009) The increasing complexity of the cancer stem cell
paradigm. Science 324: 1670–1673.
20. Kumar S, Weaver VM (2009) Mechanics, malignancy, and metastasis: the force
journey of a tumor cell. Cancer Metastasis Rev 28: 113–127.
21. Nefedova Y, Landowski TH, Dalton WS (2003) Bone marrow stromal-derivedsoluble factors and direct cell contact contribute to de novo drug resistance of
myeloma cells by distinct mechanisms. Leukemia 17: 1175–1182.
22. Joyce JA (2005) Therapeutic targeting of the tumor microenvironment. Cancer
Cell 7: 513–520.
23. Calabrese C, Poppleton H, Kocak M, Hogg TL, Fuller C, et al. (2007) A
perivascular niche for brain tumor stem cells. Cancer Cell 11: 69–82.
24. Anderson KC (2007) Targeted therapy of multiple myeloma based upon tumor-
microenvironmental interactions. Exp Hematol 35: 155–162.
25. Lozoya OA, Wauthier E, Turner RA, Barbier C, Prestwich GD, et al. (2011)
Regulation of hepatic stem/progenitor phenotype by microenvironment stiffnessin hydrogel models of the human liver stem cell niche. Biomaterials 32: 7389–
7402.
26. Serban MA, Scott A, Prestwich GD (2001) Use of Hyaluronan-DerivedHydrogels for Three-Dimensional Cell Culture and Tumor Xenografts. Current
Protocols in Cell Biology: John Wiley & Sons, Inc.27. Azab AK, Runnels JM, Pitsillides C, Moreau A-S, Azab F, et al. (2009) CXCR4
inhibitor AMD3100 disrupts the interaction of multiple myeloma cells with the
bone marrow microenvironment and enhances their sensitivity to therapy. Blood113: 4341–4351.
28. Ganguly R, Puri IK (2006) Mathematical model for the cancer stem cellhypothesis. Cell Prolif 39: 3–14.
29. Boman BM, Wicha MS, Fields JZ, Runquist OA (2007) Symmetric division ofcancer stem cells–a key mechanism in tumor growth that should be targeted in
future therapeutic approaches. Clin Pharmacol Ther 81: 893–898.
30. Michor F, Hughes TP, Iwasa Y, Branford S, Shah NP, et al. (2005) Dynamics ofchronic myeloid leukaemia. Nature 435: 1267–1270.
31. Zhu X, Zhou XB, Lewis MT, Xia L, and Wong STC (2010) Cancer stem cell,niche and EGFR decide tumor development and treatment response: A bio-
computational Simulation Study. journal of theoretical biology: in press.
32. Slepchenko BM, Schaff JC, Carson JH, Loew LM (2002) Computational cellbiology: spatiotemporal simulation of cellular events. Annual review of
biophysics and biomolecular structure 31: 423–441.33. Su J, Zapata P, Chen C-C, Meredith JC (2009) Local cell metrics: a novel
method for analysis of cell-cell interactions. BMC Bioinformatics 10: 350.34. Souza GR, Molina JR, Raphael RM, Ozawa MG, Stark DJ, et al. (2010) Three-
dimensional tissue culture based on magnetic cell levitation. Nat Nanotechnol 5:
291–296.35. Hirschmann-Jax C, Foster AE, Wulf GG, Nuchtern JG, Jax TW, et al. (2004) A
distinct ‘‘side population’’ of cells with high drug efflux capacity in human tumorcells. Proc Natl Acad Sci U S A 101: 14228–14233.
36. Wen J, Feng Y, Huang W, Chen H, Liao B, et al. (2010) Enhanced antimyeloma
cytotoxicity by the combination of arsenic trioxide and bortezomib is furtherpotentiated by p38 MAPK inhibition. Leuk Res 34: 85–92.
37. Keith CT, Borisy AA, Stockwell BR (2005) Multicomponent therapeutics fornetworked systems. Nat Rev Drug Discov 4: 71–78.
38. Zhao L, Wientjes MG, Au JL (2004) Evaluation of combination chemotherapy:integration of nonlinear regression, curve shift, isobologram, and combination
index analyses. Clin Cancer Res 10: 7994–8004.
39. Wen J, Cheng HY, Feng Y, Rice L, Liu S, et al. (2008) P38 MAPK inhibitionenhancing ATO-induced cytotoxicity against multiple myeloma cells.
Br J Haematol 140: 169–180.40. Loewe S, Muischnek H (1926) Effect of combinations: mathematical basis of
problem. Arch Exp Pathol Pharmakol 114: 313–326.
41. Tallarida RJ (2006) An overview of drug combination analysis withisobolograms. Journal of Pharmacology and Experimental Therapeutics 319:
1–7.42. Alon U (2006) An introduction to system biology: Disign principles of biological
circuits. Boca Raton, FL: Taylor and Francis group.
43. Segovia-Juarez JL, Ganguli S, Kirschner D (2004) Identifying controlmechanisms of granuloma formation during M. tuberculosis infection using an
agent-based model. J Theor Biol 231: 357–376.44. Alarcon T, Byrne HM, Maini PK (2004) A mathematical model of the effects of
hypoxia on the cell-cycle of normal and cancer cells. J Theor Biol 229: 395–411.45. Zhang L, Athale CA, Deisboeck TS (2007) Development of a three-dimensional
multiscale agent-based tumor model: simulating gene-protein interaction
profiles, cell phenotypes and multicellular patterns in brain cancer. J TheorBiol 244: 96–107.
46. Jakubikova J, Adamia S, Kost-Alimova M, Klippel S, Cervi D, et al. (2011)Lenalidomide targets clonogenic side population in multiple myeloma:
pathophysiologic and clinical implications. Blood 117: 4409–4419.
47. Shabaneh TB, Downey SL, Goddard AL, Screen M, Lucas MM, et al. (2013)Molecular Basis of Differential Sensitivity of Myeloma Cells to Clinically
Relevant Bolus Treatment with Bortezomib. PLoS ONE 8: e56132.48. Nara M, Teshima K, Watanabe A, Ito M, Iwamoto K, et al. (2013) Bortezomib
Reduces the Tumorigenicity of Multiple Myeloma via Downregulation ofUpregulated Targets in Clonogenic Side Population Cells. PLoS ONE 8:
e56954.
Cancer Niche Stiffness Is a Promising Drug Target
PLOS ONE | www.plosone.org 13 January 2014 | Volume 9 | Issue 1 | e85059