Embed Size (px)
Citation preview

2009/ED/EFA/MRT/PI/38
Background paper prepared for the Education for All Global Monitoring Report 2009
Overcoming Inequality: why governance matters
Targeting Education Funding to the Poor: Universal Primary Education, Education
Decentralization and Local Level Outcomes in Ghana
Athena Maikish
New York University
Alec Gershberg The New School
2008
This paper was commissioned by the Education for All Global Monitoring Report as background information to assist in drafting the 2009 report. It has not been edited by the team. The views and opinions expressed in this paper are those of the author(s) and should not be attributed to the EFA Global Monitoring Report or to UNESCO. The papers can be cited with the following reference: “Paper commissioned for the EFA Global Monitoring Report 2009, Overcoming Inequality: why governance matters” For further information, please contact [email protected]

Targeting Education Funding to the Poor: Universal Primary Education, Education Decentralization and
Local Level Outcomes in Ghana
Athena Maikish New York University
Alec Gershberg The New School
1. Introduction to Ghana’s Capitation Grant Scheme ................................................................. 2
2. Recent Education Policy and Strategy in Ghana .................................................................... 4
3. Review of School Fee Abolition and Universal Primary Education in African Countries .. 11
4. Data and Methods ................................................................................................................. 12
5. Recent Trends in Education Access to Basic Schooling ...................................................... 14
5.1. Trends in Gross and Net Enrollment Ratios by Sex Across the Country ...................... 14
5.2. Trends in Gross and Net Enrollment Ratios by District Deprivation Level .................. 16
5.3. Trends in Gross and Net Enrollment Ratios by District Deprivation Level and Sex ..... 19
5.4. Trends in Gross and Net Enrollment Ratios by Region ................................................. 22
6. Discussion on Recent Trends in Education Access and Moving Forward ........................... 26
7. Appendix I ............................................................................................................................ 33
8. Appendix II ........................................................................................................................... 35
9. Appendix III .......................................................................................................................... 37
10. Works Cited .......................................................................................................................... 39
1
1. Introduction to Ghana’s Capitation Grant Scheme Most countries in sub-Saharan Africa (SSA) have been slow to realize gains in universal
primary education enrollment rates. In the 1980s and early 90s, the SSA region saw a decline in
the primary school gross enrollment rate while all other regions saw an increase (UNESCO,
1998). In response, many governments in Africa initiated programs to encourage enrollment in
primary education among its population. Many of these programs aimed to increase
participation in primary education by abolishing school fees. Moreover, simultaneously, many
governments promoted a strategy of education decentralization shifting responsibility of
education decision making into the hands of local educational authorities.
Through what is termed the Capitation Grant Scheme, Ghana embarked on a national
initiative for the provision of universal primary education in 2004. This initiative sought to
bolster its constitution, in which free, compulsory and universal primary education is mandated,
and to support its educational policy (FCUBE), which was established as an outgrowth of this
constitutional mandate. Despite an existing policy of fee-free tuition in basic schools1 post-1996
as outlined by FCUBE, many districts continued to charge students levies to attend school as a
means of raising funds to cover school-related expenses. The Capitation Grant Scheme was
introduced in 2004-2005 to support financially and administratively the FCUBE policy of free,
universal primary education. It removed the financial barrier to enrolling in schools while, at the
same time, compensated schools for any loss of revenue incurred by eliminating student levies.
The Capitalization Grant Scheme sought to encourage effective implementation of
decentralization by empowering schools to plan and carry out school quality improvement
activities using accountability guidelines and forms.
1 “Basic” school in Ghana refers to primary and junior secondary school (grades 1 through 9). It does not include senior secondary school.
2
This paper focuses on understanding the impact of the Scheme in aiding Ghana’s effort to
realize equitable and universal access to basic education by providing a descriptive portrait of
primary school enrollment patterns from 2002 to the present. We find that, based on initial data,
the Scheme is associated with initial gains in enrollment and that different populations and
different regions realize different enrollment gains. Accordingly, we argue that more attention
must be paid to how the Grant is being implemented within a decentralized education
management structure such that each region and population effectively reaps increased education
outcomes.
To perform this analysis, we consult and analyze recent Ghanaian education policy and
strategy documents as well the Ministry’s Education Sector Reports and in-house program
impact studies, the Consortium for Educational Access, Transitions and Equity’s (CREATE)
Country Analytic Report on Ghana (Access to Basic Education in Ghana: The Evidence and the
Issues), as well as data collected by Ghana’s Education Management and Information System
(EMIS), an established structure to monitor and evaluate quality delivery of education in Ghana
and data from preliminary interviews with government and development officials during the
Summer of 2007. In the next section, we review recent Ghanaian education policy and strategy.
In Section 3, we summarize the theory behind on school fee abolition and universal primary
education initiatives as it applies to the case of Ghana. Section 4 outlines the research questions,
data and methodology, which centers on district level enrollment data collected by a wing of
Ghana’s education service. It is unique to have data at this level of detail for a country in SSA.
A presentation of the results follows in Section 5, which includes results on the effectiveness of
the program in targeting disadvantaged populations. Lastly, in Section 6 we discuss conclusions
3

and directions for further research, which suggest that providing per-pupil funding directly to
schools seems to be associated with gains in enrollment for disadvantaged populations.
2. Recent Education Policy and Strategy in Ghana This section provides an overview of recent education policy and strategy in Ghana as it relates
to increasing access to education and reforming the educational management structures in the
country. Table 1 on page 7 provides a summary of general country and education related
decentralization policy.
The 1992 Constitution of Ghana lays the groundwork for Ghana’s national administrative
strategy, which stipulates that “Ghana shall have a system of local government and
administration which shall, as far as practicable, be decentralized2” (Chapter 20, Article 240).
The Constitution calls for political devolution3 as well as administrative and technical
deconcentration4 of service delivery institutions. The Local Government Act of 1993 (Act 462)
as well as several other subsequent policy acts serve to support the prescriptions set forth in the
Constitution. The policy of decentralization in Ghana aims to establish a decentralized
administration through the transfer of power from the central government to the sub-national
institutions such as the District Assemblies in order “to enhance the capacity of the public sector
to plan, manage and monitor social, spatial and economic development” (NDAP, 2003, p. 2).
The policy specifically seeks to “Promote popular participation in the decision-making process;
Promote good governance at the local level; and, Enhance efficiency and effectiveness of the
entire government machinery” (NDAP, 2003, p. 2). To do so, the policy seeks to devolve central 2 Decentralization is the assignment of fiscal, political and administrative responsibilities to lower levels of government. See Appendix I for more detailed discussion of decentralization. 3 More extensive form of decentralization in which central governments transfer responsibility for decision making and administration of public functions to semi-autonomous organizations accountable but not controlled by the central government. 4 Weakest form of decentralization and encompasses the redistribution of decision-making authority and financial and management responsibilities for providing public services and infrastructure among different levels within the central government.
4

administrative authority and divest implementation responsibility to the district level (138
districts as of 2007). The District Assemblies receive 5% of revenue from the Central
Government Common Fund5, which they may spend in accordance with their priorities. A
portion of the 5% of this revenue is suppose to be distributed by the District Assemblies to
district schools for up school building, renovation and furniture related issues.
The constitution and policy acts that followed the constitution set the stage for the
national provision of basic education. The constitution of the Fourth Republic of Ghana Article
39(2) mandates “the provision of free, compulsory and universal basic education.” The Free
Compulsory Universal Basic Education (FCUBE) policy in Ghana, introduced in 1992 and
launched in 1996, serves to support this mandate and frames basic education policy in Ghana.
The Draft 2006 Education Bill defines the decentralization of education in Ghana as “a well-
planned refocusing of the Ministry and Education Service away from the executive management
of a country-wide network of schools, staff, supplies and finances; and now towards the setting
and enforcement of educational standards, the development of books and any other educational
materials, and the promotion of quality teaching training” (p. 4). In May 2003, the Ministry of
Education published the Education Strategic Plan (ESP) 2003-2015. Informed by such
documents as the Education for All Goals, the Millennium Development Goals, the Ghana
Poverty Reduction Strategy (GPRS) and the President’s Committee on the Review of Education,
the ESP was designed to provide “relevant education to all Ghanaians at all levels to enable them
to acquire skills that will assist them to develop their potential, to be productive, to facilitate
poverty reduction and to promote socio-economic growth and national development” (MoE,
2003). The strategic framework of the ESP is based around four focus areas and ten policy
5 The Constitution states, “Parliament shall annually make provision for the allocation of not less than five percent of the total [central government] revenues to the District Assemblies for development (Article 2).
5

goals. The four areas of focus include: equitable access to education; educational management;
quality of education; and science, technology and technical and vocational education and
training. This paper focuses on understanding Ghana’s progress in realizing the first focus area –
equitable access to education – and discusses its connection to decentralized educational
management in the country.
The 1996 FCUBE policy sought to expand access to good quality basic education,
promote efficient teaching and learning, improve teacher moral and motivation through incentive
programs, ensure adequate and timely supply of teaching and learning to schools and improve
teacher community relations. Specifically, FCUBE aimed to achieve universal primary
education by 2005. The Ministry of Education reports that about 30% of Ghanaian children of
school going age were still not in school when FCUBE was launched in 1996 (SFAI 2007 Ghana
Country Paper). Despite an existing policy of fee-free tuition in basic schools post-1996 as
outlined by the FCUBE policy, many districts continued to charge students levies to attend
school as a means of raising funds, for example, for school repairs, and cultural and sporting
activities. The Government of Ghana asserted that these levies had the effect of deterring many
families, particularly the poorest, from sending their children to school (Ghana Education
Service, 2005). In addition, weaknesses such as poor supervision at the system and school level
undermined FCUBE’s impact (World Bank, 1999). Accordingly, the Ministry reported that
“continuing to expand access to basic education and increasing physical inputs into the system
are not effective unless the quality of activities at the school level improves significantly’ (MOE,
1999 as cited in Akyeampong et al., 2007). With universal basic education rates not on target in
the years following the implementation of FCUBE, the Ministry focused policy efforts on
6

education decentralization and introduced capitation grants6 in order to increase access to
education.
Table 1: Summary of General and Education Decentralization Policy
Government Act/Policy Purpose General Policy 1992 Constitution of Ghana Decentralizes system of local government and administration Local Government Act of 1993 (Act 462)
Transfers power from the central government to the sub-national institutions such as the District Assemblies. Devolves central administrative authority and divests implementation responsibility to the district level.
Education Policy 1951 Accelerated Development Plan for Education (ADPE)
Laid the foundation for decentralized educational management in Ghana giving local councils responsibility for the provision and maintenance of educational facilities, while leaving the central government responsible for teachers’ salaries.
The Education Act of 1961 Reaffirmed control and management of education at the local level to local councils; however, poor managerial capacity and a weak financial resource base of the local councils undermined the decentralization process.
1992 Constitution of Ghana Mandates provision of free, compulsory and universal basic education.
Free Compulsory Universal Basic Education (Intro. in 1992, launched in 1996)
Supports constitutional mandate and frames basic education policy in Ghana.
Education Strategic Plan (ESP) 2003-2015
Provides strategic framework for education stipulating that the Ministry of Education will provide: facilities to ensure that all citizens are functionally literate and self-reliant; basic education for all; opportunities for open education for all; education and training for skill development with emphasis on science, technology and creativity; and, higher education for the development of middle and top-level manpower requirements. In providing these services, the Ministry states its commitment to be guided by the following values: quality education; efficient management of resources; accountability and transparency; and, equity.
Draft 2006 Education Bill Defines the decentralization of education in Ghana as “a well-planned refocusing of the Ministry and Education Service away from the executive management of a country-wide network of schools, staff, supplies and finances; and now towards the setting and enforcement of educational standards, the development of books and any other educational materials, and the promotion of quality teaching training.”
Capitation Grant Scheme (Implemented as pilot program in 2004-2005 and country-wide in 2005-2006)
Supports the FCUBE policy of free, universal primary education as well as Ghana’s decentralization policy by allocating a per-pupil amount of funding to all basic public schools and mandating the completion of accountability guidelines and forms.
6 Capitation grants are per pupil allotments of funding disbursed directly to schools.
7

The planned strategy of education management responsibility in Ghana is targeted
towards the district level. The form of decentralization that has been implemented is
deconcentration since local district councils are generally administrative implementing bodies for
policies and have no autonomous sources of revenue. Ten regional and 138 district education
offices represent the Ministry in the local areas and are responsible for implementing policy that
is set by the central Ministry of Education. Each district has a director who reports to regional
offices and is responsible for school management, supervision, budgeting and data collection and
analysis for each district office. In the decentralization of the school system, the allocation of
resources has been passed to the local districts and circuits7, and more specifically to the
principals that manage these schools. As a result, the decentralization of the education system
hinges on the success of district offices and local school leaders in Ghana.
The Capitation Grant Scheme serves to support the FCUBE policy of free, universal
primary education as well as Ghana’s decentralization policy. The Capitation Grant Scheme,
which was developed and is administered by Ghana’s Ministry of Education and Sports and its
implementation wing, the Ghana Education Service, was launched as a pilot program in 2004-
2005 and launched country-wide in 2005-2006. To do so, the Capitation Grant Scheme allocates
GH¢38 per student per year to all basic public schools (kindergarten through junior secondary
school) at the cost of GH¢2,850,000 for the initial pilot year of 2004-2005 (MoE, 2006)9. In the
initial 2004-2005 pilot year, an estimated amount of GH¢11,100,000 was requested from the
7 Circuits are smaller subsets of schools in the districts. Circuits vary in size and number relative to the particular district. 8 Monetary figures reported at the time in the old Ghanaian Cedi have been updated to reflect their current value in the new Ghanaian Cedi. ¢10000 are equivalent to GH¢1. GH¢1 is about equal to $1. 9 Note that while the simple construction of the per capita grant neither explicitly targets the poor nor compensates small schools for fixed costs, per student (and other population based) grants are likely to be redistributive in the context of most public finance systems where the poorest regions contribute the least to the public fisc. In addition, since the grant was specifically designed to offset fees, and has presumably had some impact on enrollment in this regard, the grant itself is likely progressive and redistributive in nature. In future, more explicitly compensatory components could be build in.
8

government to fund the initial implementation of the scheme financed in part through the release
of GH¢9,500,000 from Heavily Indebted Poor Countries (HIPC) Fund (GH¢4,750,000) and
Social Impact Mitigation Levy (GH¢4,750,000) (MoE, 2007). The unit cost per student for
primary and junior secondary school10 in 2006 in Ghana was GH¢94.41 and GH¢ 158.4111,
respectively. While the total Capitation Grant budget is seemingly large, it does not fully cover
the actual costs of educating a student. Akyeampong et al. (2007), found that “An analysis of
recent trends in funding shows that the government of Ghana funding of Education (total
resource envelop) has declined, whilst donor funding has remained generally below 10 percent”
concluding that “Without a significant injection of funds to basic education sustainable gains in
access where expansion and quality improvement take place concurrently to ensure ‘meaningful
access’ are unlikely to be achieved” (p. 15). We agree with this analysis but argue that because
education expansion and quality improvement efforts are being implemented on a local level due
to the decentralization policy gains in access will come from understanding how successful (and
failing) districts implement expansion efforts to realize gains (and losses).
The Capitation Grant program aims to increase student enrollment in basic schools by
removing the financial barrier to enrolling in schools while also compensating schools for any
loss of revenue schools face by eliminating such student levies. The administrative measures
designated by the Capitation Grant Scheme seek to encourage an effective implementation of
fiscal and administrative decentralization by empowering schools to effectively use financial
resources to plan and carry out school quality improvement activities through accountability
10 The unit cost includes recurrent cost which salaries, service and administration cost. Salaries are administered through the central government and, thus, schools do not individually see this expense. Accordingly, it is challenging to compare the unit cost per student to the Capitation Grant allotment as the Grant allotment does not cover salary expenses. 11 2004 figures: GH¢69.81 (primary) and GH¢104.42 (JSS); 2005 figures: GH¢64.42 (primary) and GH¢97.31 (JSS).
9

guidelines and forms. The funds provided by the Capitation Grant to schools are supposed to be
channeled towards the provision of teaching and learning materials, school management
(includes travel and transportation, stationery and sanitation), community and school
relationship, support to needy pupils, school based in-service training, minor repairs and the
payment of sports and culture levies (GES, 2005). A map of the program theory of the
Capitation Grant Scheme is presented in Figure 13 at the end of this document. The Capitation
Grant Scheme requires two main inputs from the central Ministry of Ministry to carry out its
goals: per pupil funding allowances and accountability guidelines and forms. Funds are provided
to the 138 districts offices based on school population numbers. School leaders are required to
report student enrollment figures and submit a “School Performance Improvement Plan (SPIP),”
which outlines how the funds will be allocated, to its district education office. Each district
office is expected to compile the enrollment figures, report the figures to the central Ministry of
Education, and then the central Ministry disburses funding to districts based on the student
enrollment figures. Upon approval, the district offices are then responsible for depositing the
funds in the school’s bank account and the school leaders are responsible for spending and
tracking the funds appropriately. At the end of each term schools are required to submit an
“Expenditure Returns Report” showing how funding was utilized. The process is repeatedly for
the fall, winter, and spring school terms.
The “Guidelines for the Distribution and Utilization of Capitation Grants” (GES, 2005)
also help to define the role of the key local players in the delivery of education service. The
District Director of Education and Assistant Director of Supervision are charged with providing
overall oversight and support towards the implementation of the SPIP, approving the SPIPs for
each school in the district, ensuring compliance with all requirements and ensuring that bank
10

accounts are opened and the flow of funds to each school occurs on timely basis. The District
Accountant maintains proper books of accounts and other records of all transactions, accounts
for all funds received and transferred to the schools, and provides financial and other information
required by management to control the effective implementation of the capitation grants. The
Circuit Supervisor provides the day-to-day supervision on the implementation of the SPIPs.
Last, the Head teachers (school leaders) ensure the effective utilization of the capitation grants,
implement the activities as provided in the SPIPs and ensure the proper accountability of all
funds received and utilized in the schools. School Management Committees are also expected to
help the school leaders in completing these tasks.
3. Review of School Fee Abolition and Universal Primary Education in African Countries When piecing together the theory and past research on user fees in the education
marketplace several themes emerge that are relevant to the Ghanaian example. First, it is unclear
what effect the elimination of school fees in Ghana will have on enrollment. It may increase
enrollment by offsetting the cost of attending school but it may also have no affect on enrollment
because the opportunity cost of the forgone income may be too high when measured against the
gain (or lack thereof) students feel they would obtain by attending school. That is, increasing
completion rates and gender parity cannot be achieved only by reducing the costs of schooling.
Countries such as Ghana must address cultural barriers and offset the opportunity costs involved
in schooling children. Even when user payments are eliminated, parents face other costs of
education their children making it far from free.
Second, abolishing user payments may increase the demand for schooling in Ghana but
the education system may be unable cope with the large influx of students. As shown in Malawi
which eliminated user fees nationally, school enrollment increased by over 60% but the quality
11

of education declined as measured by an increase in the number of untrained teachers, class sizes
and limited facilities, as well as an increase in the number of years of schooling required to
achieve basic literacy (Kadzamira and Rose, 2003). Higher gross enrollment rates may not
necessarily lead to true improvements in educational attainment. Addressing issues of quality
seems paramount to the efforts as well. In addition, potential gains in enrollment could be lost if
the grant program is unsuccessfully distributed and implemented.
Third, user fees and the abolition of user fees may impact different segments of the
population in Ghana differently. In addition, the decentralization of education may differentially
impact different populations differently. The decentralization of secondary schools in Argentina
had, on average, a positive and significant impact on student performance; however, the effect
was negative for schools located in poor areas of provinces with weak technical capabilities
(Galiani et al, 2005).
4. Data and Methods The quantitative data we use was collected by Ghana’s Education Management and
Information System (EMIS), an established structure to monitor and evaluate quality delivery of
education in Ghana. The variable enrollment, represents the enrollment of a student in a school,
is collected at the school level, and is aggregated at the district level and then again at the
regional and country levels. The data are secondary source data collected by school leaders in
individual schools and reported to district education officials. District officials aggregate the
data and report it to the centralized Ghana Education Management Information System unit,
which organizes the data. Limits to the measure’s reliability and accuracy stem from
inconsistencies in data collection efforts across districts and sub-par data collection strategies
within schools and districts, respectively; however, these issues are mitigated in this analysis by
12

the assumption that trends in data reporting inconsistencies both between districts and within
districts remain similar from year to year.
We analyze trends from 2002-200712 in primary school13 and junior secondary school14
gross enrollment ratio (GER) 15 and net enrollment ratio (NER)16 across the country by sex, by
region17 and by district deprivation level18. We are only able to analyze trends in enrollment
around the time of the initiation of the Capitation Grant Scheme by exploring enrollment in the
years directly before and directly after the implementation of the Capitation Grant Scheme. We
are not yet able to infer a causal relationship between the Capitation Grant Scheme and
accompanying increases in enrollment in primary schools19. Nevertheless, we feel that our
results are instructive and reliable as they highlight clear patterns over the years as well as
changes that occurred at the onset of the Capitation Grant.20
We also reference data collected from initial interviews with government and
development officials during the Summer of 2007. Data was collected from informal interviews 12 Data at the district level for 2004-2005 is unavailable because of the redistricting effort (multiple requests for the data are pending). Regional data is available, however. Accordingly, the data points for all indicators that require district level aggregation are assumed to follow a linear path from 2004-2005 to 2006-2007. 13 Primary school in Ghana represents grades 1 through 6. Primary school going age includes children aged 6 to 11. 14 Junior secondary school in Ghana represents grades 7 through 9. Junior secondary school going age includes children aged 12 to 14. 15 GER is the total enrollment in a specific level of education, regardless of age, expressed as a percentage of the eligible official school-age population corresponding to the same level of education in a given school-year. 16 NER is the enrollment of the official age group for a given level of education expressed as a percentage of the corresponding population. 17 Ghana is divided into 10 regions including: Ashanti, Brong Ahafo, Central, Eastern, Greater Accra, Northern, Upper East, Upper West, Volta and Western. 18 Districts are classified by the Ministry of Education as “deprived” based on such factors as the percentage of qualified primary teachers, pupil-teacher ratio at the primary level, gross enrollment rate and the percentage of girls enrolled would not be adequately addressed in the districts. Until 2004-2005 there were 40 deprived districts and 70 non-deprived districts. When the country was redistricted in 2005-2006, 53 districts were labeled as deprived while 98 remained non-deprived. 19 We are unable to run such an analysis because Ghana underwent a national redistricting effort during the same time period as the country-wide launch of the Capitation Grant Scheme in 2005-2006. Prior to 2005-2006, the country was divided into 120 districts. In 2005-2006 the Government of Ghana redistricted the country by dividing some districts into two resulting in 138 units from 2005-2006 onward. While we have enrollment data at the new district level, we have yet to secure the 2005-2006 population data needed to calculate GER and NER. Once such data is acquired we hope to undertake a more robust statistical analysis at the district level analysis. 20 We are currently in the process of conducting a more robust Repeated Measures ANOVA statistical analysis with the data.
13

with following government officials: the Director-General of the Ghana Education Service, the
Financial Controller of the Ghana Education Service, the Lead Coordinator of EMIS, the
Director of Planning, Budgeting, Monitoring and Evaluation Division at the Ministry of
Education as well as several Accra Metro district level education officers. Informal interviews
were also conducted with the following key development community officials: a Senior
Education Economist and an Education Officer of the World Bank in Accra and the Chief of
Education at UNICEF Ghana.
5. Recent Trends in Education Access to Basic Schooling In this section, we provide an overview of the trends and patterns of enrollments in basic
education in Ghana. We seek to understand the differential impact, if any, that the Capitation
Grant had on the enrollment of boys versus girls, between the ten regions of Ghana, and between
deprived versus non-deprived districts. We seek to understand if the Capitation Grant Scheme is
associated with influencing the educational opportunities of underrepresented children in Ghana.
5.1. Trends in Gross and Net Enrollment Ratios by Sex Across the Country As seen in Figure 1, the primary school gross and net enrollment ratio has been steadily
rising across the country. There was a noticeable increase in the net enrollment rate for both
boys and girls starting in 2004-2005, the year that the Capitation Grant Scheme was introduced,
with growth increasing more sharply for girls in 2004-2005. This suggests that the Capitation
Grant had an initial effect to encourage participation in education among girls but that such an
effect may have worn off soon after. The margin of difference in GER between boys and girls
decreased from 6.1% in 2003-2004 to 4.1% in 2006-2007 suggesting a fair impact of the Grant
on narrowing the gap between girls and boys. The wider gap between boys and girls for GER in
comparison to NER prompts more follow-up investigation to understand why such may be the
14

case. A similar pattern of growth is seen in the junior secondary school gross and net enrollment
ratios although actual participation in JSS is at a markedly lower percentage.
A child’s age is a significant player in participation in basic education in Ghana
(Akyeampong et al., 2007). In Ghana, the official age for starting grade 1 (primary 1) is six
years old. In all grades, overage children represent the largest proportion of children
(Akyeampong et al., 2007). Akyeampong et al. (2007) assert that this age issue is an important
factor in explaining why consistently high enrolments in the early grades are not maintained
throughout all the grade levels as they assert that overage enrolments risk irregular attendance
and drop out.
Figure 1: Primary School GER and NER by Sex
15

Figure 2: JSS GER and NER by Sex
5.2. Trends in Gross and Net Enrollment Ratios by District Deprivation Level Districts are classified by the Ministry of Education as “deprived” based on such factors
as the percentage of qualified primary teachers, pupil-teacher ratio at the primary level, gross
enrollment rate and the percentage of girls enrolled21. Since deprived districts are indexed as
such due in part to their low education enrollments it is not surprising that deprived districts
exhibit lower gross and net enrollment ratios than non-deprived districts to begin with.
Accordingly, we focus our analysis on the gap between deprived and non-deprived across the
years.
21 Until 2004-2005 there were 40 deprived districts and 70 non-deprived districts. When the country was redistricted in 2005-2006, 53 districts were labeled as deprived while 98 remained non-deprived.
16

As mentioned, the Capitation Grant Scheme was initiated in the deprived districts in
2004-2005 and launched country-wide to the remainder of districts in 2005-2006. The basic
school GER in the deprived districts exhibited a steeper growth rate after 2004-2005 bringing the
gross enrollment rates in deprived and non-deprived districts basic schools from roughly an 8%
margin to within less than 3% by 2006-2007. This is not the case, however, for net enrollment
rates. Once the Capitation Grant Scheme was initiated in the non-deprived districts in 2005-
2006, growth in the non-deprived districts outstripped growth in the deprived districts furthering
widening the gap between the two. At the junior secondary school level, the difference between
deprived and non-deprived is greater but the gap between the two also narrows after the initiation
of the Grant. Growth in enrollment seemed to spike initially in the gross enrollment ratio in
deprived districts with the initiation of the Grant narrowing the gap in gross enrollment rates
from 35% to 20% in 2006-2006. On the whole, the Grant seems to be associated with increased
educational opportunities for deprived, or under-enrolled children, in Ghana albeit only when
measured by gross enrollment. This suggests that the Grant may successfully be encouraging
parents to send their children to school but that many children outside of the official primary
school age range are enrolling in primary school, which could be placing large strains on the
system.
17

Figure 3: Primary GER and NER by District Deprivation Level
Figure 4: JSS GER and NER by District Deprivation Level
18

5.3. Trends in Gross and Net Enrollment Ratios by District Deprivation Level and Sex When breaking down the GER and NER by district deprivation level and sex, patterns
emerge from the data. Growth after the initiation of the Capitation Grant seemed to have the
most effect on the GER of deprived males as well as a larger effect on deprived females than
non-deprived females at the basic school level. A gap in GER for deprived versus non-deprived
males decreased from 11% in 2003-2004 to roughly 2% in 2006-2007. A similar narrowing was
seen between deprived and non-deprived females moving from 13% to 3%. At the JSS level,
growth spiked similarly for boys and girls in deprived districts in 2004-2005 and then leveled off
at a similar growth rate in the years following. The gap narrowed slightly in the gross enrollment
rates between deprived and non-deprived for both male and female.
Based on UNICEF data, Akyeampong et al. (2007) also report that the mean urban net
junior secondary enrolment rate in 2006 among girls was higher than that of boys by about 4
percentage points. By disaggregating these findings into welfare quintiles they find that among
children from the lowest welfare quintile the junior secondary enrolment rate among girls is
lower than that of boys; however, among children in the fourth and fifth welfare quintiles the
reverse is the case. Accordingly, they conclude that children from households in the lower
welfare quintile are likely to enter primary school at an older age and are also more likely to drop
out of school compared to children from households in higher wealth quintiles (Akyeampong et
al., 2007). Children from the wealthiest households were twice as likely to be in school as
children from the poorest households and three times more likely at the JSS level in 2003.
Through future analysis, we wish to discover if the Capitation Grant had an impact across
welfare quintiles similar to the one suggested by the narrowing of the gap between deprived and
non-deprived.
19

Figure 5: Primary GER by District Depravation Level and Sex
Figure 6: Primary NER by District Deprivation Level and Sex
20

Figure 7: JSS GER by District Deprivation Level and Sex
Figure 8: JSS NER by District Deprivation Level and Sex
21

Table 2: 2003 Net Enrollment Rates by Welfare Quintiles
Source: Akyeampong et al. (2007)
5.4. Trends in Gross and Net Enrollment Ratios by Region Figure 9 shows a map illustrating the different geographical positions of the regions in
Ghana. Table 3 presents an overview of core welfare indictors showing, by region, the
proportion of the population with access to safe drinking water, the adult literacy rate and the
unemployment rate. As can be seen, the Greater Accra region represents the most literate and
developed region (as evidenced by access to a safe water source) but also the region with the
most unemployment. This is not surprising as the capital of the country is located in this region
and sees a lot of migrant labor. The three northern regions (Northern, Upper West and Upper
East) represent the least literate and least developed regions in the country.
Figure 2: Regional map of Ghana
22
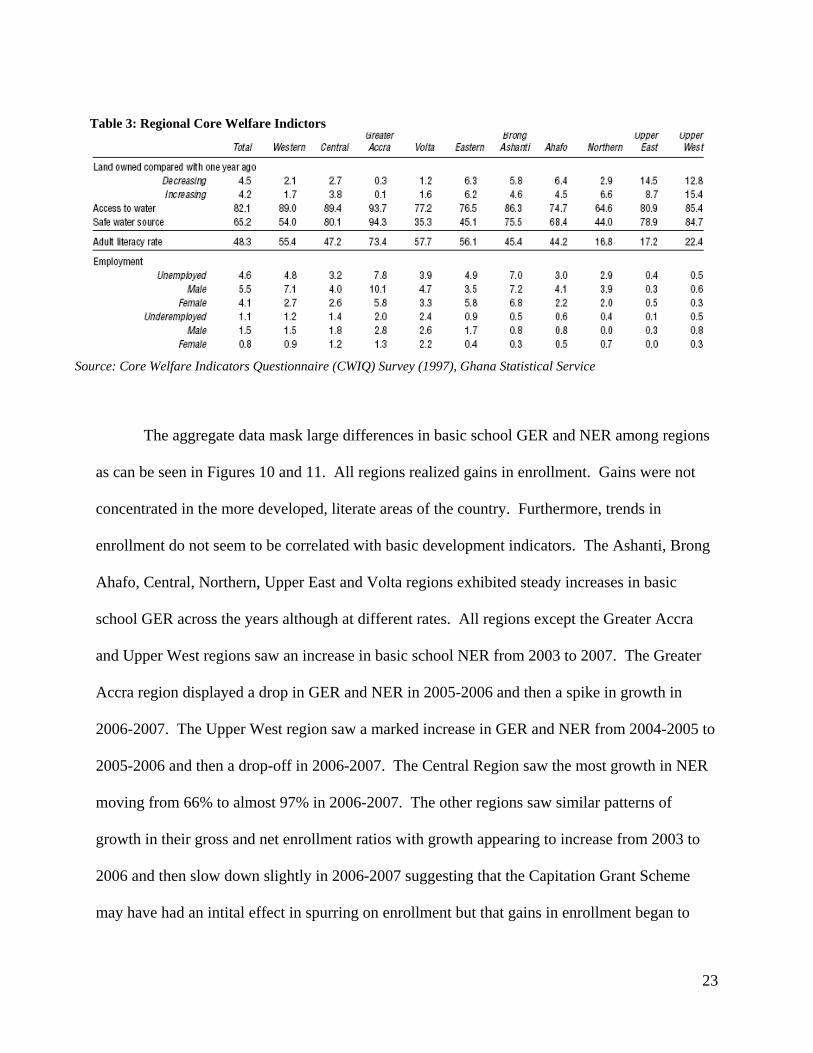
Table 3: Regional Core Welfare Indictors
Source: Core Welfare Indicators Questionnaire (CWIQ) Survey (1997), Ghana Statistical Service
The aggregate data mask large differences in basic school GER and NER among regions
as can be seen in Figures 10 and 11. All regions realized gains in enrollment. Gains were not
concentrated in the more developed, literate areas of the country. Furthermore, trends in
enrollment do not seem to be correlated with basic development indicators. The Ashanti, Brong
Ahafo, Central, Northern, Upper East and Volta regions exhibited steady increases in basic
school GER across the years although at different rates. All regions except the Greater Accra
and Upper West regions saw an increase in basic school NER from 2003 to 2007. The Greater
Accra region displayed a drop in GER and NER in 2005-2006 and then a spike in growth in
2006-2007. The Upper West region saw a marked increase in GER and NER from 2004-2005 to
2005-2006 and then a drop-off in 2006-2007. The Central Region saw the most growth in NER
moving from 66% to almost 97% in 2006-2007. The other regions saw similar patterns of
growth in their gross and net enrollment ratios with growth appearing to increase from 2003 to
2006 and then slow down slightly in 2006-2007 suggesting that the Capitation Grant Scheme
may have had an intital effect in spurring on enrollment but that gains in enrollment began to
23
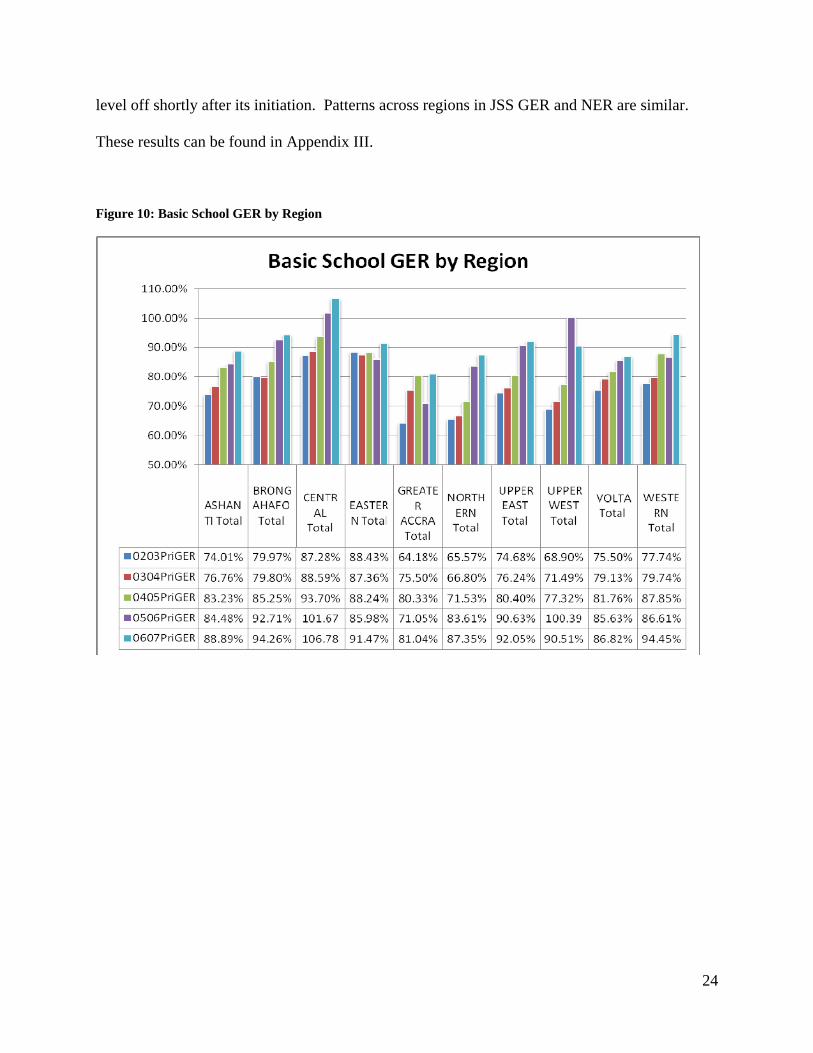
level off shortly after its initiation. Patterns across regions in JSS GER and NER are similar.
These results can be found in Appendix III.
Figure 10: Basic School GER by Region
24

Figure 3: Basic School NER by Region
Figure 4: Enrollment by Grade 2002-2007
*
*Note: Capitation Grant was instituted as a pilot program to deprived districts in 2003-2004 and country-wide in 2005-2006.
25

As shown in Figure 12, the pattern of enrollment by grade (primary 1 through junior secondary
3) has remained consistent across the years from 2002 through 2007. Positive gains seem to
have been made in the early years of schooling yet this gains do not seem to continue through
JSS3 suggesting that the Capitation Grant has yet to improve access to education on a sustainable
basis. Having disaggregated population data would be helpful in analyzing GER by grade across
years to ascertain whether as children progress through schooling if their numbers stay constant.
Akyeampong et al. (2007) found a near constant decline in GER by grade irrespective of
year from 1998 to 2003. They concluded, therefore, that as children progressed through
schooling their numbers decrease almost at a constant rate pointing to inefficiencies in the
education system resulting from repetition and dropout.
Using cohort tracking analysis Akyeampong et al. (2007) were also able to understand
Ghana’s efficiency in moving children successfully through the school system and noted that the
Ashanti and Greater Accra regions (the two most populated urban regions in the country) showed
markedly different patterns then the rest of the country. In addition, grade 4 appears to be a
critical point in the early primary education cycle after which another significant wave of drop
out occurs (Akyeampong et al, 2007).
6. Discussion on Recent Trends in Education Access and Moving Forward From the analysis of enrollment trends presented, Ghana has experienced gains in gross
and net enrollment ratios in basic and junior secondary schools from 2002 to the present. While
it is not possible to infer a causal relationship between the Capitation Grant Scheme and
accompanying increasing in enrollment in primary schools at this time, the evidence that we do
have seems to suggest that the Scheme encouraged an influx of students initially. Anecdotal
evidence from informal interviews of officials at the Ministry of Education and Ghana Education
26

Service suggests similar results. Rates of enrollment after the initiation of the Grant continued to
grow subsequently but at lesser rate. The Grant seems to be associated with an increase in
enrollment of boys in schools as compared to girls and in spurring on enrollment in deprived
versus non-deprived districts. This could be due to the sheer fact that more children were out of
school in deprived schools to start with or could be due to the Scheme having an actual
incendiary effect in encouraging parents to send their children to school. While outside factors
that historically overlapped with the initiation of the Grant could pose a challenge to validity and
possibly led to the observed effect, these challenges are unlikely when looking at the data at such
an aggregated level.
A March 2006 “Impact Assessment of the Capitation Grant” carried out by officials at the
MoE on a sample of nine districts revealed that preliminary figures received from the districts
recorded an increase in the GER in the public basic schools. The Assessment also suggests that
students that had formerly dropped out of school returned as a result of the introduction of the
capitation grant, and that School Management Committees and Parent Teacher Associations
were supportive in urging parents to take advantage of the capitation grant to send their children
to school. On the other hand, the Assessment found that many classrooms were overcrowded
and that dilapidated conditions in some schools prevented an effective implementation of the
capitation grant policy and discouraged some parents from sending their children to school. The
assessment noted that schools faced issues in accessing the grant, which resulted in a delay of
planned activities. Bank charges also eroded the actual per student amount of grant that schools
received. Furthermore, the Assessment suggests that school leaders did not include teachers in
the SPIP process and that many school leaders were unqualified making it difficult for them to
understand the principles involved in the preparation and implementation of the SPIP.
27

Moreover, the Assessment suggested that the Ghana Education Service is weak in its ability to
monitor and ensure an effective use of the capitation grant as there are is no monitoring and
evaluation team at the central Ministry to ensure that the structures put in place at the district and
school level are working effectively.
Interviews with district education officials at the Accra Metro District Office replicated
the general assessment results revealing that the timeline and execution of the program activities
involved with the disbursement of the Capitation Grant are unpredictable. During 2006-2007,
for example, there was no clear timeline for the disbursement of funds and the third tranche of
funds (which should have coincided with the Spring semester) had yet to be released to districts
from the central Ministry as of the end of the following August of 2007. The district office was
not given any explanation for this delay. This finding was also confirmed by one of the top
officials at the Ministry; however, a reason for the delay was not given.
As mentioned in Section II, the funds provided by the Capitation Grant to schools should
be channeled towards the provision of teaching and learning materials, school management
(includes travel and transportation, stationery and sanitation), community and school
relationship, support to needy pupils, school based in-service training, minor repairs and the
payment of sports and culture levies. The District Assembly should be distributing funds to
schools for up school building, renovation and furniture related issues. Officials in the Accra
Metro District Office, however, reported that the Accra Metro District Assembly has failed to
provide this funding, which leaves schools in this area without the proper funds to pay for
infrastructure and building expenses. As a result, the Capitation Grant funds are being used for
school building, renovation and furniture related issues, which prevents them from going towards
critical teaching and learning areas.
28

In their 2007 analysis of access to education in Ghana, Akyeampong et al. (2007) assert
that while Ghana has made progress in providing basic education for all children, even after 15
years of reforms, gross enrollment rates have risen by only about 5 percentage points, and show
little sign of reaching 100 percent. They assert that the issue in Ghana is not about getting more
children officially enrolled, but rather is about reducing the leakage through drop out especially
in the early grades as the nature of enrollment patterns from grade to grade has remained
virtually unchanged even though enrollment in primary 1 has risen steadily. It is critical, they
argue, to improve school quality and tackle the efficiency problem in order to ensure high
enrolments continue through the grades. Moreover, neither the Capitation Grant nor education
policy does much to assure that all students who complete JSS can go onto senior secondary
school (SSS) as it provides no funding or free access clause to SSS. An analysis of participation
by household income and rural/urban locality indicates that children from poor households and
those in rural localities are less likely to continue their education to the secondary level
(Akyeampong et al., 2007).
In summary, there are two critical findings from our analysis:
• Providing per-pupil funding directly to schools seems to be associated with
increases in enrollment in Ghana. The Capitation Grant Scheme seems to be
associated with gains in enrollment in underrepresented groups in Ghana such
as those who live in deprived areas.
• Some regions (and accordingly some districts in these regions) are more
successful than others at realizing increased enrollment. Accordingly,
students living in one area of the country versus another are affected
differently by the resources made available by the Capitation Grant Scheme.
29
While the per-pupil allotment of funding may be too small to remove what appear to be
large financial barriers in many cases, differences in enrollment trends among different
population groups and regions prompt us to believe that the Grant is being utilized differently in
practice. The question of why some regions (and districts) as well as certain segments of the
population appear to realize gains in enrollment after the initiation of the Capitation Grant
Scheme remains unanswered. Our hunch is that certain districts implement certain
administrative structures and processes that are associated with better outcomes. As a top
official in the Ghana Education Service stated “We need to build capacity of district offices.
Participation in delivery and decision-making will make them [district offices and school
leaders] more responsible. Decentralization will affect them more and make them more
responsible and more concerned to do things.” The data suggests that differences in practice
exist across regions; however, we lack evidence on the nature of these differences.
The guiding assumption of education decentralization that putting responsibility in the
hands of local educational authorities will improve the quality of education by improving
decision making and allocating resources needs to explored. A central issue in the debate about
the merit of a decentralized school system is the extent to which local school and district leaders
are able to use their increased influence to promote more effective school management; however,
little research has investigated the implementation of decentralization at the local level (see De
Grauwe et al., 2005 for more). Field research that delves into local level education
decentralization implementation structures and strategies is critical if education decentralization
is to reap its potential benefits and impact the quantity and quality of education offered on a wide
scale. Accordingly, for a future study, we hope to investigate the impact of the Capitation Grant
Scheme on student enrollment and achievement across the country and delve into the process of
30

31
the implementation of education decentralization at the district and school level through case
studies on two regions of Ghana focusing four schools from three distinct districts. As Grindle
(2004) argues, “it matters how reforms are introduced, designed, approved, and implemented”
(p. 189). This future study will serve to study the latter – how decentralization reform is
implemented in Ghana such that some localities effectively implement decentralization structures
and processes while other localities fail in their implementation efforts.

32
Underlying Assumptions
Increasing the percentage of citizens who receive a basic education is necessary for economic development.
Eliminating user fees for basic education increases
student enrollment in basic education.
Initial Conditions
Some children do not enroll in basic school.
Required Inputs
Funding
Accountability guidelines and forms
Program Activities
Ministry publicizes program to public and trains school
and district officials on program components.
Parents enroll students in school.
Schools report enrollment figures.
Schools draft “School Performance Improvement
Plans” and submit to district offices.
Central government
disburses funding to districts based on school enrollment
figures.
Districts disburse money to schools.
Schools allocate and spend money to educate students.
Schools complete “Expenditure Returns Report” to account for
spending.
Figure 5: Capitation Grant Program Model
Program Assumptions
By providing basic schools with funding, schools will
not charge parents user fees.
Parents will enroll child in school if there is no user
charge for doing so.
Increased enrollment in schools will lead to increased educational attainment rates.
Outcomes
Increased student enrollment rates.
Constant or increased performance scores on
national exams.
Quality allocation and spending data.
Outputs
Student enrollment in schools.
Student performance scores on national exams.
School allocation and spending data.
Impact
Increased educational attainment rate in population.
Effective fiscal decentralization.
More educated citizenry.
Economic development.
7. Appendix I Decentralization Theory
Decentralization is the assignment of fiscal, political and administrative responsibilities
to lower levels of government. Decentralization is promoted by economists as mechanism to
facilitate the efficient production and provision of services through a market response to the
preferences of the individual. Political scientists focus on the benefits of transferring power to
local-level governments to encourage an effective, democratic and relevant delivery of local
goods and services. Public administrators seek to modify the hierarchical and functional
distribution of tasks, responsibilities, and power to sub-national units to improve the cost-
effectiveness of the delivery of goods and services. Decentralization can take many forms and
has several dimensions. Rondinelli (1989) explains that decentralization may be defined in terms
of the form (e.g. fiscal, political, administrative), the degree of power transferred (i.e.
deconcentration, delegation, devolution, deregulation/privatization) and the level (e.g. national to
sub-national, region to district).
The most common theoretical rationale for decentralization is routed in the principles of
fiscal federalism theory, which suggest that benefits lie in attaining allocative efficiency in the
face of different local preferences for local public goods (Musgrave, 1983; Oates, 1972).
Originally conceptualized in the context of industrialized nations, fiscal federalism suggests that
the central government should have responsibility for macroeconomic stabilization and income
redistribution functions while sub-national governments should play an important role in
allocation functions (Musgrave, 1959; Oates, 1972; Oates, 1999). Another strong theoretical
argument advanced in favor of fiscal federalism is that the preferences and needs of local citizens
are best known to the local governments that represent these citizens rather than the central
government. The reason given is that the proximity to local citizens increases available
33

information while the distance decreases both the information available to make good decisions
as well as their political accountability of decisions. Accordingly, in line with the
decentralization theorem, it is believed that maximizing overall social welfare requires varying
local outputs according to local preferences.
Education decentralization is defined as a complex process that changes the way in which
a school system approaches making policy, generating revenues, spending funds, training
teachers, designing curricula and managing local schools (World Bank, 2006). Education
decentralization is usually seen in the context of fiscal and administrative decentralization. The
decentralization of education has been promoted as one of the most important schemes to expand
education access, improve education quality and enhance efficiency in service provision and
financing around the globe (Cuellar-Marchelli, 2003). The belief that putting responsibility in
the hands of local educational authorities will improve the quality of education by improving
decision making and allocating resources more efficiently is the guiding idea informing the
decentralization of education (Carnoy 1995; Oates 1972; Wallis and Oates 1998; World Bank
1994 and 2004). In sub-Saharan Africa, in particular, over 25 countries have embarked on a
program of transferring authority and responsibility to the local level (Naidoo, 2002). Education
decentralization, in particular, offers an effective mechanism to investigate the transfer,
implementation and outcome of this local level responsibility.
34

8. Appendix II Education Demand and Supply Theory
There are several demand-side reasons that underlie low educational enrollment and
attainment rates and hinder the success of achieving universal basic education including high
opportunity costs, low returns to social and geographic immobility and uncompromising social
norms. First, low demand for education leads to low school enrollment. User payments will
prove ineffective in increasing enrollment when demand side influences such as high opportunity
costs, low returns to social and geographic immobility and uncompromising social norms are
present. This is particularly relevant to the poor who may be unable to pay for education when
fees are compulsory because of small incomes or inadequate credit markets. When user charges
are voluntary parents may not only be unable to pay them but may also be unwilling to face the
opportunity cost of schooling their children. Even when schools are free, parents may not want
to lose the forgone income from the child’s labor. Demand might also be low because parents
perceive future returns from education to be low for their children. Social norms may also
adversely affect the demand for education of children. For example, investment in girls’
education may be low when social norms dictate that girls marry young and marriage markets do
not put a premium on educated girls. At the same time, free access to publicly financed education
may not offer parents enough incentive to send their children to school if it does not offer a
future advantage in the labor market. Under the Progresa incentive-based welfare program in
Mexico, for example, poor families received income transfers from the central government,
conditional on the regular school attendance of their children. While average schooling duration
increased, the demand for schooling was fairly inelastic demonstrating such demand-side
constraints (Schultz, 2001).
35

Low school enrollment and educational attainment can also result from supply-side
influences when governments are unable or unwilling to provide funds for education.
Government revenue available for schooling may be constrained by a weak economy. Revenue
that is made available may be ineffectively distributed resulting in schools receiving inadequate
resources. For spending to be effective, the government must have efficient expenditure
management capacities, political will, and good governance. In Chad, schooling has been
financed by user payments collected through community organization efforts demonstrating the
value that poor parents can place on education. Thus, while net primary enrollment rates are low
they would be even lower if parent associations had not taken responsibility for paying teachers
and in some situations completely managing schools. Because financial and human constraints
in Chad make user payments the only means of funding for schools, eliminating them would
deprive a large segment of the school-age population the opportunity to go to school (Hillman
and Jenkner, 2004).
36

9. Appendix III JSS GER and NER by Region
Trends in enrollment in JSS are more similar among regions than in basic school22. The
Central region started with one of the highest JSS GER and NER in 2002 and saw steady growth
in its GER over the years and remarkable growth in its NER after 2004-2005 suggesting that this
region has been able to effectively translate the Grant into increased educational opportunities
for its children. On the other hand, the Eastern region started at roughly the same enrollment
rates yet its GER remained stagnant and its NER decreased and then saw a large jump in 2005-
2006. Further research is needed to understand why these two regions experienced such
different trends in enrollment following the iniation of the Grant. As shown in Table 3, the core
welfare indicators of the two regions are fairly comparable. The key finding to note among these
figures is the markedly different rates of growth among the regions. More follow-up research is
needed to understand why some regions are suceeding more rapidly at increasing education
opportunities while others are failing to do so.
22 These charts are included in Appendix III.
37

Figure 6: JSS GER by Region
Figure 15: JSS NER by Region
38

10. Works Cited Adamolekun, L. (1991). Promoting African decentralization. Public Administration &
Development (1986-1998), 11(3), 285. Akyeampong, K., Djangmah, J., Oduro, A., Seidu, A., & Hunt, F. (2007). Access to Basic
Education in Ghana: The Evidence and the Issues. Falmer, Brighton: Centre for International Education, Sussex School of Education, University of Sussex.
Alicia, F., Andrew, H., & Donald, B. (1999). School enrolment patterns in rural Ghana: A
comparative study of the impact of location, gender, age and health on children's access to basic schooling. Comparative Education, 35(3), 331.
Bahl, R. W., & Linn, J. F. (1992). Urban public finance in developing countries. Oxford ; New
York: Published for the World Bank [by] Oxford University Press. Bardhan, P. (2002). Decentralization of Governance and Development. Journal of Economic
Perspectives, 16(4), 185-205. Bennell, P. (1996). Rates of Return to Education: Does the Conventional Pattern Prevail in sub-
Saharan Africa? World Development, 24, 183-199. Bray, M. (1999). Control of Education: Issues and Tensions in Centralization and
Decentralization. In R. F. Arnove & C. A. Torres (Eds.), Comparative education : the dialectic of the global and the local (pp. vi, 434 p.). Lanham: Rowman & Littlefield Publishers.
Canagarajah, R. S., & Ye, X. (2001). Public Health and Education Spending in Ghana in 1992-
98: Issues of Equity and Efficiency: SSRN. Carnoy, M., & Rhoten, D. (2002). What does globalization mean for educational change? A
comparative approach. Comparative Education Review, 46(1), 1. Chapman, D., Barcikowski, E., Sowah, M., Gyamera, E., & Woode, G. (2002). Do communities
know best?: Testing a premise of educational decentralization: community members' perceptions of their local schools in Ghana. International Journal of Educational Development, 22(2), 181-189.
Chapman, D., Barcikowski, E., Sowah, M., Gyamera, E., & Woode, G. (2002). Do communities
know best?: Testing a premise of educational decentralization: community members' perceptions of their local schools in Ghana. International Journal of Educational Development, 22(2), 181-189.
Cheema, G. S., Rondinelli, D. A., & United Nations Centre for Regional Development. (1983).
Decentralization and development : policy implementation in developing countries. Beverly Hills: Sage.
39

Cohen, J. M., & Peterson, S. B. (1999). Administrative decentralization : strategies for developing countries. [West Hartford, Conn.]: Kumarian Press.
Colclough, C. (1982). The impact of primary schooling on economic development: a review of
the evidence. World Development, 10(3), 167-185. Cuellar-Marchelli, H. (2003). Decentralization and privatization of education in El Salvador:
Assessing the experience. International Journal of Educational Development, 23(2), 145-166.
Davies, L., Harber, C., & Dzimadzi, C. (2003). Educational Decentralisation in Malawi: a study
of process. Compare: A journal of comparative education, 33(2), 139 - 154. De Grauwe, A., Lugaz, C., Baldé, D., Diakhaté, C., Dougnon, D., Moustapha, M., & Odushina,
D. . (2005). Does decentralization lead to school improvement? Findings and lessons from research in West-Africa. Journal of Education for International Development, 1(1).
Di Gropello, E. (2006). A comparative analysis of school-based management in Central
America: World Bank. Easterly, W. R. (2001). The elusive quest for growth : economists' adventures and misadventures
in the tropics. Cambridge, Mass.: MIT Press. Ebel, R. D. (2000). Democracy, Decentralization and Development, Worldwide Perspective
[Electronic Version]. World Bank Institute, Intergovernmental Fiscal Relations and Local Financial Management Program from http://www1.worldbank.org/wbiep/decentralization/Module2/Topic02_Printer.htm.
Fiske, E. B. (1996). Decentralization of Education: Politics and Consensus. Directions in
Development (pp. 49): The International Bank for Reconstruction and Development/The World Bank, 1818 H Street, N.W., Washington, DC 20433.
Folson, R. B. (1995). The Contribution of Formal Education to Economic Development and
Economic Underdevelopment: Ghana As Paradigm New York: Peter Lang Publishing. Foster, P. J. (1965). Education and social change in Ghana. [Chicago]: University of Chicago
Press. Galiani, S., Gertler, P. and Schargrodsky, E. . (2005). School Decentralization: Helping the
Good Get Better, but Leaving the Poor Behind. Buenos Aires: Universidad de San Andres.
Gershberg, A., & Winkler, D. (2004). Education decentralization in Africa: A review of recent
policy and practice. In B. Levy & S. J. Kpundeh (Eds.), Building state capacity in Africa new approaches, emerging lessons (pp. xiii, 377 p.). Washington, DC: World Bank.
40

Gershberg, A. I., & Meade, B. (2005). Parental contributions, school-level finances and decentralization: an analysis of Nicaraguan autonomous school budgets. Comparative Education, 41, 291-308.
Gershberg, A. I., & Winkler, D. R. (2004). Education Decentralization in Africa: A Review of
Recent Policy and Practice. In B. Levy & S. Kpundeh (Eds.), Building State Capacity in Africa: New Approaches, Emerging Lessons. Washington, DC: The World Bank.
Gertler, P., & Glewwe, P. (1992). The willingness to pay for education for daughters in contrast
to sons: Evidence from rural peru. . The World Bank Economic Review, 6(1), 171-188. Ghana Education Service. (2005). Guidelines for the Distribution and Utilisation of Capitation
Grants to Basic Schools. Retrieved. from. Ghana Education Service. (2006). 10-year work plan for Education in Ghana. Retrieved. from. Ghana Education Service. (2007). Ghana Country Paper for the School Fee Abolition Initiative.
Paper presented at the School Fee Abolition Workshop. Ghana Ministry of Education and Sports. (1996). Free Compulsory and Universal Basic
Education Policy. Retrieved. from http://www.edughana.net/fcube.htm. Ghana Ministry of Education and Sports. (2003). the Education Strategic Plan (ESP) 2003-2015.
Retrieved. from http://www.edughana.net/fcube.htm. Ghana Ministry of Education and Sports. (2007). Preliminary Education Sector Performance
Report (PESPR). Retrieved. from http://www.edughana.net/fcube.htm. Ghana Statistical Service. (1997). Core Welfare Indicators Questionnaire (CWIQ) Survey.
Retrieved. from. Glewwe, P., Kremer, M., & Welch, E. H. a. F. (2006). Chapter 16 Schools, Teachers, and
Education Outcomes in Developing Countries. In Handbook of the Economics of Education (Vol. Volume 2, pp. 945-1017): Elsevier.
Government of Ghana. (1992). The Fourth Republican Constitution of Ghana. Retrieved. from
http://www.parliament.gh/const_constitution.php. Government of Ghana. (2003). National Decentralization Action Plan (NDAP). Retrieved. from. Grindle, M. S. (2004). Despite the odds : the contentious politics of education reform. Princeton,
N.J.: Princeton University Press. Hanushek, E. A., & Woessmann, L. (2007). The Role of School Improvement in Economic
Development. Cambridge, Massachusetts.
41

Hillman, A. a. E. J. (2004). User Payments for Basic Education in Low-Income Countries. In S. Gupta, B. J. Clements, G. Inchauste & International Monetary Fund. (Eds.), Helping countries develop : the role of fiscal policy (pp. xi, 528 p.). Washington, D.C.: International Monetary Fund.
Jimenez, E., & Sawada, Y. (1999). Do Community-Managed Schools Work? An Evaluation of
El Salvador's EDUCO Program. World Bank Econ Rev, 13(3), 415-441. Kadzamira, E., & Rose, P. (2003). Can free primary education meet the needs of the poor?:
evidence from Malawi. International Journal of Educational Development, 23(5), 501-516.
KariKari-Arabio, M. (2006). Interim Briefing on the Impact Assessment of the Capitation Grant
and Pilo Programmatic Scheme. Ministry of Education and Sports. King, E., & Ozler, B. (2005). What’s Decentralization got to do with Learning? School
Autonomy and Student Performance: Kyoto University. Levin, B. (1997). The lessons of international education reform. Journal of Education Policy,
12(4), 253 - 266. Lewin, K. (1993). Education and development. The issues and the evidence. . London. Litvack, J., Ahmed, J., & Bird, R. (1998). Rethinking Decentralization in Developing Countries.
Washington, DC. McGee, R. (2000). Meeting the International Poverty Targets in Uganda: Halving Poverty and
Achieving Universal Primary Education. Development Policy Review, 18(1), 85-106. Mfum-Mensah, O. (2004). Empowerment or Impairment? Involving Traditional Communities in
School Management. International Review of Education/Internationale Zeitschrift für Erziehungswissenschaft/Revue internationale l'éducation, 50(2), 141-155.
Mingat, A., & Winter, C. (2002). “Education for All by 2015 [Electronic Version]. Finance &
Development, 39, 32-35 from http://www.imf.org/external/pubs/ft/fandd/2002/03/mingat.htm.
Morrisson, C. (2002). Education and Health Expenditure and Poverty Reduction in East Africa:
Madagascar and Tanzania, OECD Development Centre Studies Paris: OECD. Musgrave, R. A., & Peacock, A. T. (1958). Classics in the theory of public finance. London New
York ;: Macmillan. Naidoo, J. P. (2002). Education Decentralization in Sub-Saharan Africa--Espoused Theories and
Theories in Use (pp. 37).
42

Oates, W. E. (1972). Fiscal federalism. New York: Harcourt Brace Jovanovich. Oates, W. E. (1999). An Essay on Fiscal Federalism. Journal of Economic Literature, 37(3),
1120-1149. Osei, G. M. (2007). Decentralisation and the Exploration of the Impact of Local Content
Curriculum Reforms in Ghana. International Journal of Educational Development, 27(2), 151-165.
Osei, G. M. (2007). Decentralisation and the Exploration of the Impact of Local Content
Curriculum Reforms in Ghana. International Journal of Educational Development, 27(2), 151-165.
Prud'homme, R. (1995). The Dangers of Decentralization. World Bank Res Obs, 10(2), 201-220. Psacharopoulos, G. (1994). Returns to investment in education: A global update. World
Development, 22(9), 1325-1343. Rivarola, M., & Fuller, B. (1999). Nicaragua's Experiment to Decentralize Schools: Contrasting
Views of Parents, Teachers, and Directors. Comparative Education Review, 43(4), 489-521.
Rondinelli, D. (1989). Decentralizing Public Services in Developing Countries. Journal of
Social, Political, and Economic Studies, 14, 77-98. Rondinelli, D. A. (1980). Government Decentralization in Comparative Perspective: Theory and
Practice in Developing Countries. International Review of Administrative Sciences, 47(2), 133-145.
Sawyerr, H. (1997). Country-Led Aid Coordination in Ghana.” Association for the Development
of Education in Africa. Paris: Association for the Development of Education in Africa. Schultz, T. P. (2001). School Subsidies for the Poor: Evaluating the Mexican Progresa Poverty
Program: SSRN. Smith, B. C. (1985). Decentralization : the territorial dimension of the state. London ; Boston:
G. Allen & Unwin. Smoke, P. (2001). Fiscal Decentralization in Developing Countries: A Review of Current
Concepts and Practice. Geneva. Teal, F. (2001). Education, incomes, poverty and inequality in Ghana in the 1990s. UNESCO. (1998). World Education Report, 1998. Paris. UNICEF, & World Bank. (2006). Building on What We Know and Defining Sustained Support.
43

Paper presented at the School Fee Abolition Initiative (SFAI) Workshop, Nairobi, Kenya. UNICEF, & World Bank. (2007). Lessons Learned from Abolishing School Fees in Ethiopia,
Ghana, Kenya, Malawi and Mozambique. New York. United Nations General Assembly. Universal Declaration of Human Rights., from
http://www.un.org/Overview/rights.html Wallis, J. J., & Oates, W. E. (1988). Decentralization in the Public Sector: An Empirical Study of
State and Local Government. In H. S. Rosen & National Bureau of Economic Research (Eds.), Fiscal federalism : quantitative studies (pp. ix, 262 p.). Chicago: University of Chicago Press.
White, H., & Masset, E. (2005). Books, Buildings and Learning Outcomes: an impact evaluation
of World Bank assistance to basic education in Ghana. Winkler, D. (1989). Decentralization in Education: an economic perspective: The World Bank. Winkler, D. (2004). Strengthening Accountability in Public Education. Education Quality
Improvement Management Programme (EQUIP2), : Academy for Educational Development (AED).
World Bank. (1995). Priorities and strategies for education : a World Bank review. Washington,
D.C.: World Bank. World Bank. (1999). Ghana Primary School Development Project: Basic Education Sector
Improvement Project: Thematic and Global Evaluation Operations Evaluation Department.
World Bank. (2003). World Development Report 2004: Making Services Work for Poor People. World Bank. (2004). Free Primary Education and Poverty Reduction: The Case of Kenya,
Lesotho, Malawi and Uganda. . from http://www.ungei.org/SFAIdocs/resources/4EFAstudyfinal.pdf
World Bank. (2006). Education - school-based management - key issues., from
http://web.worldbank.org/WBSITE/EXTERNAL/TOPICS/EXTEDUCATION/0,,contentMDK:20264769~menuPK:613701~pagePK:148956~piPK:216618~theSitePK:282386,00.html
World Bank. (2006). World Development Indicators. from
http://devdata.worldbank.org/wdi2006/contents/Tables2.htm World Education Form. (2000). The Dakar framework for action, education for all: Meeting our
collective commitments., 2008, from http://www.unesco.org/education/wef/en-conf/dakframeng.shtm
44

45
Ye, X., & Canagarajah, R. S. (2002). Efficiency of public expenditure distribution and beyond: A report on Ghana’s 2000 public expenditure tracking survey in the sectors of primary health and education: World Bank.
Ye, X., & Canagarajah, R. S. (2002). Ghana: Tracking public resource flows in schools and
clinics World Bank.