Embed Size (px)
Citation preview
in Asia
Secondary Teacher Policy Research
Kenneth Gannicott
UNESCO Bangkok
Asia and Pacific Regional Bureau for Education
United Nations Educational, Scientific and
Cultural Organization
Teacher Numbers, Teacher Quality:
Lessons from Secondary Education in Asia
Gannicott , Kenneth
Secondary Teacher Policy Research in Asia: Teacher Numbers, Teacher Quality: Lessons from Secondary Education in Asia. Bangkok: UNESCO Bangkok, 2009.74 pp.
1. Secondary education. 2. Educational policy. 3. Teacher qualifications. 4. Asia.
ISBN 978-92-9223-299-3 (Print version) ISBN 978-92-9223-300-6 (Electronic version)
Co-ordinator: Miki NozawaCopy-editing: Daniel CalderbankDesign / Layout: Warren Field and Sirisak Chaiyasook
© UNESCO 2009
Published byUNESCO BangkokAsia and Pacific Regional Bureau for EducationMom Luang Pin Malakul Centenary Building920 Sukhumvit Road, Prakanong, KlongtoeyBangkok 10110, Thailand
Printed in Thailand
The views and opinions expressed in this publication are those of the authors and do not necessarily represent the views of UNESCO. The designations employed and the presentation of material throughout the publication do not imply the expression of any opinion whatsoever on the part of UNESCO concerning the legal status of any country, territory, city or area or of its authorities, or concerning its frontiers or boundaries.
EPR/09/OP/044-500
Foreword
With the gradual attainment of universal primary education, governments are shifting their attention to secondary education. Responding to the increasing demand for secondary education presents serious challenges and major opportunities in the quest for Education For All (EFA), and countries are striving to find policy responses to address these emerging issues.
It is clear that teachers play a fundamental role in addressing challenges faced by secondary education. Ensuring the presence of competent secondary teachers in urban and rural areas is a major concern in both quantitative and qualitative terms. Existing studies on teacher-related issues and analyses of teacher policy in developing countries tend to focus on primary education, probably due to the special emphasis given to primary education in the EFA process. In order to fill the gaps and respond to the increasing demand for quality secondary education, the Education Policy and Reform (EPR) unit of the UNESCO Asia and Pacific Regional Bureau for Education (UNESCO Bangkok) coordinated a regional research study on secondary teacher policy and management in 2007 and 2008.
This series includes a regional synthesis paper on comparative assessment of issues and policies affecting secondary teachers in East and South-East Asia, and five case studies: Lao People’s Democratic Republic, Malaysia, People’s Republic of China, Republic of Korea, and Thailand. Three major areas related to secondary teachers are discussed in the case studies: quantitative analysis of demand and supply of secondary teachers, quality of secondary teachers, and compensation. Each study is presented as a summary of the original study, and gives an overview of the status and issues of the country’s secondary education system. Researchers and officials from several universities and education ministries collaborated in the preparation of the study. UNESCO Bangkok would like to sincerely thank all those individuals and institutions who provided their expertise and professional experience to this research.
The findings presented in the series are intended to help governments gain insight into policy for secondary teachers across a diverse range of countries, and draw lessons for possible policy responses to challenges and problems in the expansion of secondary education.
Gwang-Jo Kim Director
UNESCO Bangkok
Acknowledgements
As part of a series of studies on secondary teacher policy and management initiated and coordinated by the Education Policy and Reform (EPR) unit at UNESCO Bangkok, this regional synthesis was prepared by Kenneth Gannicott.
The team of editors and reviewers included Miki Nozawa, Ibtisam Abu-Duhou, Alice Yang, Yoko Kono, and Hyangmi Kim from UNESCO Bangkok’s EPR unit.
The project received a generous financial contribution from the Government of Japan under Japanese Funds-in-Trust for the Education for All Programme.
Contents
List of Tables and Figures . . . . . . . . . . . . . . . . . . . . . . . . . . . . . . . i List of Abbreviations. . . . . . . . . . . . . . . . . . . . . . . . . . . . . . . . . . ii Executive Summary . . . . . . . . . . . . . . . . . . . . . . . . . . . . . . . . . . iii
Section 1: Introduction
1.1 Background to the Study. . . . . . . . . . . . . . . . . . . . . . . . . . . 1 1.2 Secondary Education: From Neglected Child to Lively Adult . . . . . . . . . . 2 1.3 Secondary Teachers and Their Role . . . . . . . . . . . . . . . . . . . . . . 4 1.4 The Asian Context . . . . . . . . . . . . . . . . . . . . . . . . . . . . . . 6 1.5 Approach and Structure of the Study . . . . . . . . . . . . . . . . . . . . . 7
Section 2: The Five Case Studies
2.1 People’s Republic of China . . . . . . . . . . . . . . . . . . . . . . . . . 10 2.2 Lao PDR . . . . . . . . . . . . . . . . . . . . . . . . . . . . . . . . . 12 2.3 Malaysia . . . . . . . . . . . . . . . . . . . . . . . . . . . . . . . . . 14 2.4 Republic of Korea . . . . . . . . . . . . . . . . . . . . . . . . . . . . . 15 2.5 Thailand . . . . . . . . . . . . . . . . . . . . . . . . . . . . . . . . . 17
Section 3: Secondary Education in Asia
3.1 Development of Secondary Education in Asia . . . . . . . . . . . . . . . . 19 3.2 Secondary Education Today . . . . . . . . . . . . . . . . . . . . . . . . 25 3.3 Cognitive Outcomes in Secondary Education . . . . . . . . . . . . . . . . 28
Section 4: Secondary Teachers around the Region: A Quantitative Perspective
4.1 Students, Teachers and Class Size . . . . . . . . . . . . . . . . . . . . . . 31 4.2 Policy Choices: Expanded Coverage or Smaller Classes? . . . . . . . . . . . 34 4.3 Class Size and Academic Performance . . . . . . . . . . . . . . . . . . . 37 4.4 Is There a Shortage of Secondary Teachers? . . . . . . . . . . . . . . . . . 39
Contents
Section 5: Secondary Teachers around the Region: Qualifications and Quality
5.1 Concerns about Teacher Quality in Asia . . . . . . . . . . . . . . . . . . . 43 5.2 Teacher Quality: Does It Matter? . . . . . . . . . . . . . . . . . . . . . . 44 5.3 International Evidence on Teacher Quality. . . . . . . . . . . . . . . . . . 45 5.4 How Do We Produce Good Quality Teachers? . . . . . . . . . . . . . . . . 46 5.5 Teacher Quality in Asian Countries . . . . . . . . . . . . . . . . . . . . . 49 5.6 Much Upgrading, but is Teacher Quality Rising? . . . . . . . . . . . . . . . 52
Section 6: Can We Improve Quality by Paying Teachers More?
6.1 Measuring Teacher Salaries. . . . . . . . . . . . . . . . . . . . . . . . . 56 6.2 The Pattern of Teacher Salaries in Asian Countries . . . . . . . . . . . . . . 59 6.3 Salary Variations within the Region: What Differences are Important? . . . . . 63
Section 7: Key Issues and Lessons Learned
7.1 A Benign Outlook for Teacher Numbers . . . . . . . . . . . . . . . . . . . 65 7.2 Benign Overall Outlook, but there are Genuine Shortages . . . . . . . . . . 67 7.3 Student-Teacher Ratios and Class Size . . . . . . . . . . . . . . . . . . . . 68 7.4 Policy Trade-Offs and Teacher Quality. . . . . . . . . . . . . . . . . . . . 69 7.5 How Do We Improve Teacher Quality? . . . . . . . . . . . . . . . . . . . 69
References . . . . . . . . . . . . . . . . . . . . . . . . . . . . . . . . . . . 71
Teac
her N
umbe
rs, T
each
er Q
ualit
y:
Less
ons
from
Sec
onda
ry E
duca
tion
in A
sia
i
List of Tables and Figures
Table 1: Schooling Attainment (1960) . . . . . . . . . . . . . . . . . . . . . . . . 19 Table 2: Secondary Structure and Finance . . . . . . . . . . . . . . . . . . . . . 26 Table 3: Secondary Attainment and Enrolments in East and South-East Asia. . . . . . 27 Table 4: Achievement of Secondary Students, TIMSS (1995-2003) . . . . . . . . . . . 29 Table 5: Achievement of Secondary Students, PISA (2000-2006) . . . . . . . . . . . 30 Table 6: Students and Teachers in Secondary Education . . . . . . . . . . . . . . . 32Table 7: Class Size in Secondary Education, Latest Available Year . . . . . . . . . . . 34 Table 8: Secondary Teachers by Qualification, Lao PDR (2005/06) . . . . . . . . . . . 50 Table 9: Secondary School Teachers by Qualification, Korea (2005) . . . . . . . . . . 50 Table 10: Secondary School Teachers by Qualification, Singapore (2006) . . . . . . . . 51 Table 11: Secondary School Teachers by Qualification, Malaysia (2006) . . . . . . . . . 51 Table 12: Secondary Teachers’ Salaries in Equivalent USD Converted Using PPPs . . . . 60 Table 13: Secondary Teachers’ Salaries in Relative Terms (Salaries in US Dollars Converted Using PPPs, as a Percentage of GDP per Capita) . . . . . . . . . . 60
Figure 1: Gross Enrolment Rates (1970) . . . . . . . . . . . . . . . . . . . . . . . . 22 Figure 2: Gross Enrolment Rates (1980). . . . . . . . . . . . . . . . . . . . . . . . 22 Figure 3: Gross Enrolment Rates (1990). . . . . . . . . . . . . . . . . . . . . . . . 23 Figure 4: Gross Enrolment Rates after 2000. . . . . . . . . . . . . . . . . . . . . . 23 Figure 5: Average Years of School Attainment (Population Aged 15+) . . . . . . . . . 24 Figure 6: Proportion of Population Aged 15+ with Secondary Education . . . . . . . . 25 Figure 7: Change in GER and STR (1970-2006) . . . . . . . . . . . . . . . . . . . . 35 Figure 8: Variation in STR by Secondary GER . . . . . . . . . . . . . . . . . . . . . 37 Figure 9: Screening Applicants . . . . . . . . . . . . . . . . . . . . . . . . . . . 53 Figure 10: Lower Secondary Teachers’ Salaries in Equivalent USD Converted Using PPPs . 61 Figure 11: Lower Secondary Teachers’ Salaries in Relative Terms . . . . . . . . . . . . 62 Figure 12: Starting Salaries as a Percentage of GDP per Capita . . . . . . . . . . . . . 64
Box 1: Academic versus Vocational Secondary Schooling. . . . . . . . . . . . . . . 3 Box 2: Concerns about Secondary Teachers . . . . . . . . . . . . . . . . . . . . . 5Box 3: Singapore: Selection of Teachers . . . . . . . . . . . . . . . . . . . . . . 53
Teac
her N
umbe
rs, T
each
er Q
ualit
y:
Less
ons
from
Sec
onda
ry E
duca
tion
in A
sia
ii
List of Abbreviations
CEU Continuing Education Unit EFA Education for All GCE General Certificate of Education GDP Gross Domestic Product GER Gross Enrolment Ratio GNP Gross National Product GPI Gender Parity Index HPAE High-performing Asian Economy IEA International Association for the Evaluation of Educational Achievement IT Information Technology JSS Junior Secondary School KSAT Korean Scholastic Aptitude Test Lao PDR Lao People’s Democratic Republic MDG Millennium Development Goals NIE Newly-Industrializing Economies OBEC Office of the Basic Education Commission OECD Organization for Economic Co-operation and Development PISA Programme for International Student Assessment PPP Purchasing Power Parity SAR Special Administrative Region SOE State-owned Enterprise SSS Senior Secondary School STAR Student Teacher Achievement Ratio STR Student-teacher Ratio TIMSS Trends in International Mathematics and Science Study TTC Teacher Training College TVET Technical and Vocational Education and Training UIS UNESCO Institute for Statistics UN United Nations UNESCO United Nations Educational, Scientific and Cultural Organization WB World Bank WHO World Health Organization
Exec
utiv
e Su
mm
ary
iii
Executive Summary
The central aim of the study is to provide some cross-cutting evidence on issues and policies affecting secondary teachers in East and South-East Asia. This region encompasses a wide diversity of countries, from high-income Japan and Korea to some of the world’s poorest, such as Lao People’s Democratic Republic (Lao PDR) and Cambodia. A feature of this diverse Asian experience is that most countries share concerns about their teachers, especially secondary teachers, now that the achievement of full or near-full primary enrolment has shifted the main focus of policy attention to secondary schooling.
The overall approach of the paper is based on three inter-linked policy concerns about teachers. The first relates to teacher numbers. The second concern is whether the quality of the teaching workforce meets an adequate standard. The third concern is the level of teachers’ pay. These three issues are directly linked through a simple but important relationship. There is a policy choice – a trade off – between these three aspects of teacher policy. At any given budget and enrolment level, more teachers mean smaller classes, but they also mean a lower average teacher salary than would otherwise be the case. Fewer teachers but higher pay might well produce an improvement in teacher quality through attracting better qualified entrants.
There is a wide range of combinations of enrolment growth and student-teacher ratios (STRs) across the region but it is striking that in the face of rapid secondary enrolment growth in most countries, only Philippines and Thailand increased their student-teacher ratio during the period since 1970. All other countries found a way to finance substantial enrolment growth as well as the hiring of sufficient extra teachers to drive down the student-teacher ratio to only 70 percent of its 1970 value on regional average. A growing supply of teachers and a reduction in their relative cost has made it possible simultaneously to expand enrolments and to hire more teachers. More students are enrolled and more teachers employed, even to the extent of reducing the STR for the increased enrolments, but the long-term decline in teachers’ pay relative to per capita gross domestic product (GDP) has mitigated the overall impact on public expenditure.
Given the cross-country consistency of declining teacher ratios, it is reasonable to infer that most countries made at least an implicit policy choice to trade-off faster enrolment increase for the gains in student learning that they presumed would follow from lower student-teacher ratios. The problem is that there is no evidence to support the idea that student learning benefits from smaller classes, at least for class sizes between about 15 and 40 pupils. Throughout much of its secondary expansion Korea maintained high student-teacher ratios by today’s standards. These high secondary teacher ratios have proved no barrier to outstanding performance in the Trends in International Mathematics and Science Study (TIMSS) and Programme for International Student Assessment (PISA) tests of student achievement.
Teac
her N
umbe
rs, T
each
er Q
ualit
y:
Less
ons
from
Sec
onda
ry E
duca
tion
in A
sia
iv
It is hardly possible to read government policy documents or the research literature without becoming aware of concerns about secondary teacher quality in many Asian countries. Forty or 50 years ago, in the post-colonial era, teachers constituted a small and highly selective group which found ready employment. Becoming a teacher was the natural outcome of high educational achievement. Rapid economic growth has brought with it alternative and productive private sector job opportunities that did not exist 30 to 40 years ago. Today, for many students teaching is the career of last resort because they cannot get into a more desirable faculty. The rapid growth in teacher numbers, and the hiring of more teachers because the school system requires more teachers to achieve smaller classes, has meant that school systems have often become less selective about who could become a teacher.
Governments have responded to this perceived quality decline by active programmes of longer pre-service education, graduate degrees or upgraded certification. However, just like reductions in the STR, there is very little evidence that such upgrading has in itself had a positive effect on teacher quality as measured through student outcomes.
Recent work comparing high- and low-performing school systems suggests that improved student outcomes will occur by raising the quality of people who enter the teaching profession. The crucial policy is to reverse the tendency to produce a large number of trainee secondary teachers, a process which drives down the status and attractiveness of secondary teaching, reduces its appeal for high performers, and encourages schools and teacher faculties to be less selective about who can become a teacher. Greater selectivity raises the standing of teaching as a career and helps attract applicants from the top cohort graduating from secondary school, or from high-quality people making a mid-career move into teaching.
The top-performing Asian economies such as Singapore, Korea, Hong Kong Special Administrative Region (SAR), Japan, and Taiwan of China have implemented such a policy. They all have relatively large classes, so they employ fewer teachers than other systems. With fewer teachers, they can spend more money on each teacher without any significant increase in overall secondary expenditure. By paying good starting salaries, they attract good teachers into the profession. Because they need fewer teachers they can be more selective about whom they select to train and appoint as teachers. It is a virtuous circle which has resulted in a very high quality of student outcomes.
Intr
oduc
tion
1
IntroductionSection 1
1.1 Background to the Study With the achievement of universal primary schooling in many parts of Asia, the focus of policy attention has shifted in recent years to the expansion of secondary education. The development of secondary schooling raises a new set of policy challenges for governments. The World Bank (WB) (2005, p. 14) has aptly referred to the “policy peculiarities” of secondary education in being terminal and preparatory, compulsory and post-compulsory, uniform and diverse. Among the many policy challenges the management of the teaching force plays a crucial role. Secondary education demands of teachers a higher level of knowledge and pedagogical skills specific to teaching a particular subject. Ensuring a sufficient number of well-qualified teachers to cover an often wide range of core and elective subjects in both urban and rural areas can be a major policy concern.
Teacher-related issues for secondary education in Asia have not yet received detailed analysis. Many of the existing studies focus on primary teachers. Moreover, teacher training is often taken as the key variable, whereas recruitment, deployment and compensation are all known to be important in shaping entry, performance and retention in the system.
The recent Organization for Economic Co-operation and Development (OECD) study on teachers yielded perhaps the most comprehensive international analysis of teacher policy (OECD, 2005). It is limited, however, to OECD member countries, which means that among Asian countries only Japan and the Republic of Korea are represented. A recent WB (2005) report on secondary education policy offers an extensive assessment of policy issues, including teacher training, but does not specifically focus on the Asian context.
Against this background, United Nations Educational, Scientific, and Cultural Organization (UNESCO) Bangkok launched a regional secondary education research programme in 2006. The objective was to carry out a comparative assessment of issues and policies affecting secondary teachers in East and South-East Asia. The project sponsored case studies of secondary teachers in five countries: People’s Republic of China, Lao PDR, Malaysia, Republic of Korea, and Thailand. These studies will be published separately, and they provide in-depth evidence and insights into policy for secondary teachers across a diverse range of countries.
Teac
her N
umbe
rs, T
each
er Q
ualit
y:
Less
ons
from
Sec
onda
ry E
duca
tion
in A
sia
2
The countries were diverse, but the Case Studies employed a broadly common framework and methodology. This facilitated the second component of the research programme, an integrated, comparative analysis which is the subject of the present study. In addition to drawing upon the Case Studies, this comparative study makes use of data for additional countries and territories from sources such as UNESCO’s Global Education Digest and the results of international achievement tests.
The purpose of the comparative analysis is not merely to summarize the Case Studies but to draw out, from the perspective of the region as a whole, broader lessons for policy.
1.2 Secondary Education: From Neglected Child to Lively AdultFor much of the last 25 years secondary education was a relatively neglected aspect of international education policy. In the high-income developed countries, with their main period of secondary expansion behind them, most policy interest focused on the tertiary sector. In many low- and middle-income countries the international movement to achieve Education for All (EFA) persuaded governments and donors to direct substantial resources to the initial stages of schooling. Concern with rectifying high-level skill shortages ensured that tertiary education also received a prominent share of public funding.
In the developing world, secondary education has been described as “the weakest link… that…slipped through the cracks” to become the forgotten sector in the education realm (WB, 2005, p. 2) or, with a change of metaphor, “the neglected child in the development of public education systems” (di Gropello, 2006, p. xx). The WB (2005) has acknowledged that until recently, its lending strategy for the education sector gave less attention to secondary schooling than to primary and tertiary education. Secondary education was considered a priority only in middle-income countries, provided that they had already achieved universal access to primary education.
On the other hand, secondary education has in recent years become a focus for increasing policy debate in both developed and developing countries (WB, 2005; Verspoor, 2008). The reason for this emerging focus lies predominantly in the worldwide demand for secondary education. In developing countries, efforts to achieve EFA as part of the Millennium Development Goals (MDG) have had a direct impact on secondary education. Because EFA policies place lower secondary education within the realm of basic and compulsory education, secondary education has become an integral part of EFA efforts.
Many countries, especially in Africa and South Asia, are still some way from achieving the EFA or MDG goals. Nonetheless, as more countries have approached universal primary schooling, rising family aspirations have resulted in sharply increased demand for secondary education. While the secondary school-age population in the East and South-East Asia region is expected to decline between 2005 and 2015, in many developing countries, aspirations for secondary schooling are combining with high rates of increase in the school-age population. For example, projections for Sub-Saharan Africa suggest an increase of 22 percent in the lower and upper secondary age groups. The Arab States and South and West Asia regions show lower, but still marked percentage increases in the secondary population (UIS, 2006b).
Intr
oduc
tion
3
In the developed (OECD) countries, there has been some reassessment of the role of secondary education in economic and social development. Globalization, the increased importance of knowledge as a driving force in economic development, and the consequent skill-biased nature of technological changes in the workplace are putting additional pressure on national governments to revamp their secondary education systems to produce graduates well prepared for work. Economies increasingly need a more sophisticated labour force equipped with competencies, knowledge, and workplace skills that cannot be developed only in primary school or in low-quality secondary school programmes.
Historically, the issue has been seen in terms of the balance between vocational and general education at the secondary level, but a distinction couched in terms of academic versus vocational is increasingly recognised as simplistic. The challenge of determining the knowledge and skills to be taught in secondary school if countries, firms and individuals are to be competitive cuts across the traditional general-vocational divide (see Box 1). Holsinger and Cowell (2000) trace the evolution of secondary curricula in Europe and the United States, showing how the “positioning” of the curriculum along the academic-vocational continuum has changed over time, reflecting a different student population and often resulting in a more diversified or comprehensive curriculum.
Box 1: Academic versus Vocational Secondary Schooling
During the late colonial period in Africa, much money was invested in secondary vocational agricultural schools. It seemed an obvious way to teach practical skills in predominantly rural economies. Following a classic research article based on evidence from Ghana, it became clear that the policy was misconceived (Foster, 1965). What Foster termed the “vocational school fallacy” was failing to produce secondary graduates willing to work on the farm. The vocational agricultural schools were more expensive than general secondary education and students disdained them, being willing to enrol only if they could not get into secondary general education.
At an early stage of their industrial development, Japan, Korea, Taiwan of China, and Singapore all had a high proportion of secondary enrolments in vocational schools. It might be thought that this proportion would increase over time, both in response to the needs of industrial development and as a way of providing more suitable schooling for increased enrolments by less academically inclined students. In fact, the exact opposite happened. As GDP rose in those economies, and secondary enrolments increased, the number of students enrolled in technical and vocational courses fell as a proportion of total secondary enrolments. Rather than producing large numbers of expensive secondary graduates with very specific skills, the “Asian tigers” instead produced school-leavers with a high-quality general education. This provided an excellent basis for employment-based job-specific training.
Berryman (2000) notes that, under central planning, a major orientation of secondary education was the production of very specific vocational and technical skills to meet the norm-based labour standards of state-owned enterprises (SOEs). Among Asian economies
Teac
her N
umbe
rs, T
each
er Q
ualit
y:
Less
ons
from
Sec
onda
ry E
duca
tion
in A
sia
4
both Viet Nam and Lao PDR faced major adjustments to secondary vocational schooling during their transition to a more market-oriented economy. It is noticeable that China retains an explicit policy to expand specialized secondary vocational education. The Study on China notes that there is explicit policy to speed up the development of vocational secondary education and achieve an equal proportion between admissions to general senior secondary and vocational senior secondary each year. The Study also notes with nice understatement that parents and students have often not favoured vocational schooling, and they remain “indifferent to investment in vocational secondary school” (Chung, Lo, Lei and Cao, 2008, p. 15)
1.3 Secondary Teachers and Their Role While the renewed policy interest in secondary education is clearly multi-faceted – involving issues of curriculum, access, equity, financial requirements, and assessment methods – a major concern in both developed and developing countries is the role, the quantity and often the quality of secondary teachers. The recent OECD study of teachers (OECD, 2005) enumerated a list of concerns:
nConcerns about the attractiveness of teaching as a career:
Around half of OECD countries reported serious concerns about maintaining an adequate supply of good quality teachers, especially in high-demand subject areas, in the light of declining relative teacher salaries in most countries.
nConcerns about developing teachers’ knowledge and skills:
There are major concerns about the limited connections between teacher education, teachers’ professional development, and school needs, with almost all countries reporting concerns about “qualitative” shortfalls and whether enough teachers have the knowledge and skills to meet school needs.
nConcerns about recruiting, selecting and employing teachers:
While a few countries have a large oversupply of qualified teachers, there are concerns in most countries about the inequitable distribution of teachers among schools, and whether students in disadvantaged areas have the quality teachers that they need.
nConcerns about retaining effective teachers in schools:
Some countries experience high rates of teacher attrition, especially among new teachers; teachers have expressed concerns about the effects of heavy workloads on job satisfaction and teaching effectiveness; there are only limited means in most countries to recognise and reward teachers’ work; and processes for responding to ineffective teaching are often cumbersome and slow.
Box 1: Academic versus Vocational Secondary Schooling (cont.)
Intr
oduc
tion
5
The OECD evidence refers specifically to developed countries, but the findings are consistent with concerns from around the world. There is no doubt that (to borrow the OECD terminology) “teachers matter”. Teaching is the largest single employer of graduate labour in many countries; demands on schools and teachers are complex; and there are genuine concerns about the training and role of teachers in secondary systems. Box 2, drawn from a study of teachers in a variety of countries, including Viet Nam and Cambodia, summarises these widespread concerns.
Box 2: Concerns about Secondary Teachers
“Qualified secondary school teachers are becoming a precious commodity in many developed and developing countries. They tend to be the hardest segment for the teaching profession to attract, the most expensive to educate and the most difficult to retain in schools. The numbers of unqualified teachers tend to be much higher for secondary than for primary education in almost every developing country. And the attrition rates of secondary education teachers are the highest in the teaching profession, especially for male teachers and for those in high-demand areas, such as mathematics, science and technology. Furthermore, the professional identity of secondary teachers is not constructed around teaching but rather around their discipline of specialization. In a context of mass secondary education, increasingly more teachers who thought of themselves as pre-tertiary teachers at the start of their careers are faced now with the hard fact that they are rather post-primary teachers. Contrary to what it was during the times when secondary education had elite status, student motivation can no longer be taken for granted. This fact entirely changes the conditions of daily teaching for secondary school teachers. Instead of being trained to develop new competencies required to deal with today’s students, secondary teachers see their professional identity questioned, and experience a loss of control over their own professional practice” (Moreno, 2005, p. iv).
It needs to be acknowledged frankly that in addition to the careful policy analysis now available, there is also a high volume of rhetoric about secondary teachers. In a literature review of teaching in today’s societies, Marcelo (2005) identifies many writings claiming that teachers are:
A key mediating agency for society...to build learning communities, create the knowledge society, and develop the capacities for innovation, flexibility and commitment to change that are essential to economic prosperity [and] at the same time mitigate and counteract many of the immense problems that knowledge societies create, such as excessive consumerism, loss of community, and widening gaps between rich and poor. (p. 5)
Such statements reveal much about the writers, but do not suggest close familiarity with the reality of day-to-day teaching in secondary schools, whether in Asia, Africa or OECD countries. Meeting such expectations is asking far too much from any occupational group, not least from teachers who are so often drawn from below-the-median in academic ability and for whom teacher training is the qualification of last resort when they cannot gain entry into more desirable tertiary courses. And it is difficult to discern the practical policy choices that governments could make to train such teachers, even if the underlying assumptions were accepted.
Teac
her N
umbe
rs, T
each
er Q
ualit
y:
Less
ons
from
Sec
onda
ry E
duca
tion
in A
sia
6
1.4 The Asian Context 1
Many of the widespread concerns about secondary schools and their teachers spill over to the Asian region. East and South-East Asia encompass a wide diversity of countries, from high-income Japan and the Republic of Korea to some of the world’s poorest, such as Lao PDR and Cambodia. Unsurprisingly, this diversity is reflected in the region’s education characteristics, but the dominating feature of the region as a whole is its educational progress. In 1960, the average level of educational attainment in the East Asia region was 3.0 years. By 1980, it had reached 4.9 years. By 2000, the regional attainment of 6.4 years had far outstripped the average for the Middle East and North Africa, South Asia and Sub-Saharan Africa; it had overtaken the average for Latin America; and it was comparable to some middle-income countries of Europe such as Spain and Portugal.
The transformation during the 1970s and 1980s of the “tiger” or newly-industrialising economies (NIEs, sometimes extended to “high-performing Asian economies” or HPAEs) of Singapore, Korea, Taiwan of China, and Hong Kong SAR, together with Indonesia, Malaysia and Thailand is well-known. Indeed, the story of their human capital development—public spending oriented towards full primary coverage, a balanced and sequential expansion of secondary schooling, high levels of educational achievement and a sizeable role for private funding at the higher levels of the system – is a success story that has become almost folkloric in the telling.2
Today, that story is used as a model for other regions, with both Latin America and Sub-Saharan Africa reproached for not achieving the balanced secondary development associated with East Asian economic success. The legend can be updated with the inclusion of China and still more recently with Viet Nam, but also needs to be balanced by the example of countries such as Philippines, Indonesia and Thailand. These latter countries have combined fast-growing but less balanced education systems with worrisome outcomes in international achievement tests.
1 Both courtesy and clarity require acknowledgement of a country’s chosen name, but where there is no likelihood of ambiguity repeated use of formal names rather than familiar everyday names can be cumbersome to the point of pedantry. In this study, Korea always means the Republic of Korea. There is also the problem that much of this study takes a historical perspective of human capital developments in Asia during the 1970s and 1980s, and some names have changed since then. Hong Kong was a colonial territory during the years of the “miracle” and not yet a SAR of China. In this study, it is referred to by its formal post-1997 title of Hong Kong SAR. With regard to Taiwan, it is referred to as Taiwan of China, in conformity with the relevant UN and UNESCO resolutions concerning this region/territory.
2 In what has become a vast literature, the main source for the so-called “miracle” economies remains the original work by the WB (1993). De Ferranti, Perry, Gill, Guasch, Maloney, Sanchez-Paramo, and Schady (2003) explore how Latin America’s lack of a policy for balanced secondary educational development contributed to its being overtaken both educationally and technologically by East Asia. Verspoor (2008) draws upon East Asian experience to highlight the severe challenges facing secondary education in Sub-Saharan Africa.
Intr
oduc
tion
7
A feature of this diverse Asian experience is that most countries share concerns about their teachers, especially secondary teachers now that the achievement of full or near-full primary enrolment means that secondary schooling is a main focus of policy attention. It may not be surprising that in Thailand the government has made a priority of improved quality of teaching in secondary science and mathematics, at least partly in response to the relatively poor performance of Thai students in international tests. It is predictable, too, that shortages of qualified secondary teachers are severe in the rural, remote and mountainous districts of Cambodia, Laos and Viet Nam, so that it tends to be not just the poor, but often minority ethnic groups which feel the main impact of teacher shortages. In China, the issues of specialized subject shortage and inadequate teacher supply for poor or remote regions come together. In the more developed coastal and industrial areas, the supply of secondary teachers is generally satisfactory. But teachers of mathematics, English, physics and computers are in short supply in rural and remote areas.
What is more surprising is the apparent dissatisfaction with teachers even in some of the region’s most successful countries. Korea was the world’s 15th largest economy in 2008 and has long enrolled the entire age group in secondary school. It has done so with outstanding cognitive outcomes and labour force success. It therefore comes as a shock to learn that parents are concerned about ineffective teachers and have shown strong support for a proposed system of teacher evaluation. In Malaysia, a series of incidents in secondary schools during 2007 provoked much media comment, questioning whether the older style of teacher attitudes and behaviour towards their students was still appropriate at a time of rapid economic and social change.
1.5 Approach and Structure of the StudyWhile it is easy to cite anecdotes about teacher shortage or parental concern about teachers, there is at present a general lack of systematic appraisals of secondary teachers in Asia. The lack of such evidence makes it difficult to judge what has worked (or not worked) and to draw lessons from international experience about possible policy responses to the challenges and problems.
The overall approach of this paper is based on three principal and inter-linked policy concerns about teachers. The first relates to teacher numbers. While some countries (Korea being an example) have an over-supply of people wanting to train as teachers, the more common problem is that of perceived shortage. Average class size may be thought to be too high for effective teaching, or more usually there are shortages of teachers in specialized subjects or in geographic areas serving poor, ethnic minority or remote communities. The second concern is simply stated but raises complex conceptual as well as practical measurement issues. That concern is whether the quality of the teaching workforce meets an adequate standard. The third concern is the level of teachers’ pay. This is typically measured by average teacher salaries, but where data permit can also include starting salaries, salary progression over a career lifetime, and a range of supplementary payments, either financial or in-kind. Such supplementary payments are now rare in OECD countries but remain an important component of the overall salary package in developing Asian countries, such as Lao PDR.
Teac
her N
umbe
rs, T
each
er Q
ualit
y:
Less
ons
from
Sec
onda
ry E
duca
tion
in A
sia
8
These three issues of teacher quantity, teacher quality and teachers’ pay are directly linked through a simple but important relationship. At any given level of public expenditure on secondary education (and ignoring spending on pedagogical materials to simplify the argument), governments can choose to expand enrolments or to hire more teachers. In other words, at a given budget level, there is a policy choice – a trade off – between either a wider coverage of secondary schooling, or a reduction in the student-teacher ratio. There is also a second policy choice to be made. At any budget and enrolment level, a larger number of teachers (i.e. a reduction in STR) means that the average teacher salary is lower than would otherwise be the case. There is now a trade off between class size and teachers’ pay. If fewer teachers were hired, such that the STR increased, each teacher could be paid more for the same overall budget outlay. There would be larger classes and/or increased class contact time for teachers, but – the third aspect of the relationship – the higher pay might well produce an improvement in teacher quality through attracting better qualified entrants or reducing the attrition of experienced and effective teachers.
Policymaking does not take place in this stylized fashion. For example, expanding secondary enrolments at a time of perceived teacher shortage may involve a reduced student-teacher ratio as a matter of explicit policy towards smaller classes, but may also involve a complex combination of increased class contact time (more classes) for teachers, lowered entry qualifications, assigning teachers to teach in subject areas for which they are not fully qualified (generally termed “out of field” teaching) and a pay rise that puts more money in the teacher’s pocket but which may or may not maintain previous relativities with other occupations.
Despite the real-world complexities, not to mention the difficulty of disentangling those complex policies after the event, the simple model of linkages between teacher quantity, quality and pay and the trade-off between them can be a useful framework of analysis in an internationally comparative study. Subject to the availability of evidence,3 this approach provides a basis for comparing teacher policy across the region, exploring the extent to which different countries have emphasized one or other or some combination of these critical components of teacher policy as their secondary systems have developed. That is the approach followed in this paper.
3 Internationally comparative data have improved greatly in recent years, but comparisons are still complicated by problems of regional definition, with categories often including a range of countries that have little in common besides being geographic neighbours. It should be acknowledged frankly that using multiple data sources, as in this study, results in patchy coverage, with some countries included in one set of tables or figures and other countries included elsewhere. Throughout the study, regional data are always adjusted to exclude results for Australia, New Zealand and the Pacific Island countries, thereby maintaining focus on the countries/territories of East and South-East Asia.
Intr
oduc
tion
9
The paper consists of seven sections. This introductory section is followed by a brief synopsis of the five Case Studies. Section 3 reviews the development of secondary education in East Asia, bringing out the different patterns and progress of secondary enrolments. The core of the paper is then found in the following three sections, exploring in turn the three main policy issues described above. Section 4 provides a quantitative perspective, reviewing teacher numbers and class size in relation to enrolment growth. Section 5 looks at the difficult issue of teacher quality, focusing on teacher qualifications. Few areas are more problematic than the pay of teachers and, where limited data permits, Section 6 reviews this topic, again in relation to overall secondary development. With the core evidence in place, the study concludes with a summary of the challenges and lessons learned from the analysis.
Teac
her N
umbe
rs, T
each
er Q
ualit
y:
Less
ons
from
Sec
onda
ry E
duca
tion
in A
sia
10
The Five Case StudiesSection 2
This section describes in summary form the central themes of the Case Studies. For a more in-depth analysis, the reader should consult the Study on China (Chung, Lo, Lei and Cao, 2008); on Lao PDR (Gannicott and Tibi, 2008); on Republic of Korea (Kim, Kim and Han, 2008); on Malaysia (Mokshein, Ahmad, Vongalis-Macrow, 2008); and on Thailand (Atagi, 2008).
Obvious differences in economic scale or population size suggest that these countries would share few similarities of secondary education and secondary teachers, but it is noticeable that all but Korea share concerns about an apparent shortage of secondary teachers. Only in Korea does the government face the alternative problem of needing to reduce the supply of trained secondary teachers.
2.1 People’s Republic of ChinaThe dominant feature of secondary education and secondary teaching in China is not so much the standard cliché about the scale of the system, although the numbers involved do demand a different order of understanding from systems in much smaller countries. There were 59.37 million students in the general stream of junior secondary school (JSS) in 2006, with 3.46 million teachers. There were 25.3 million students in general senior secondary school (SSS), with 1.4 million teachers. A further 18.1 million students were enrolled in technical-vocation senior schools, with 307,000 teachers.
Nor is the rate of expansion the main characteristic, impressive though that has been during the recent years of China’s economic transformation. There were, for example, 7.2 million senior secondary enrolments in 1991 compared with the 2006 total of 25.3 million, an annual rate of growth of 8.7 percent. For demographic reasons the number of children in the primary and junior secondary age groups is easing. Now the focus of enrolment expansion is on senior secondary partly because of demographic “bulge” and increased retention rates at the end of junior secondary. China has effectively achieved universal basic education (nine years), with a gross enrolment ratio (GER) of 97 percent in junior secondary in 2006. This is a very substantial achievement.
The story of secondary schooling and teaching that is told in the Study on China goes beyond the clichés of large numbers and spectacular growth to describe the dualistic development and the financial disparities in secondary education. A major theme is the large disparity between
11
The
Five
Cas
e St
udie
s
urban and rural areas in terms of access to secondary education that emerged after the financial reforms of the mid-1980s. Participation continued to increase in urban areas, but in rural areas the promotion rate actually decreased from 22.3 percent to 18.6 percent during the 1990s.
This disparity is the outcome of three principle factors. First, China’s extraordinary economic growth has not been evenly distributed but has been a feature of the eastern and southern parts of the country. Second, the financing of basic education in China has undergone fundamental changes. In 1985, responsibility for financing basic education was transferred from the central government to local governments. In the absence of mechanisms for fiscal equalization, differences in financial capacity between the increasingly prosperous east and the central and western provinces became prominent. Increased educational inequality between the regions became marked during the 1990s. Third, China’s modernization and loosening of the hukou (household registration) system has led to increased internal migration to the big cities of the east. Teachers in rural areas have been part of this migration.
Factors such as the combination of poorer financial resources and the loss of trained teachers have led to a substantial regional disadvantage in secondary provision and secondary teaching. Rural teachers who move to the cities are generally younger and better trained. In the cities, the proportion of qualified teachers in SSS is 91 percent; in the countryside, it is 71 percent. Schools in rural areas have to hire daike (substitute teachers), who are temporary teachers with lower salaries and qualifications less advanced than normal. As teacher’s salaries and pension costs occupy a large proportion of total educational investment, many schools in rural areas prefer to employ daike teachers in order to reduce educational costs.
Much is now being done to remedy these disparities. The Outline of the 11th Five-Year Plan for the Development of National Education which covers the period 2005-2010 allocated additional investment from central funds to build and repair rural schools, to improve rural teacher training and professional development, and to improve payment guarantees for teachers’ salaries in rural areas.
Another key theme of the Study is the close link between secondary education and economic development and the role of secondary schooling in producing skills to sustain and promote industrial growth. The study on Accelerating the Development of Vocational Secondary Education of MOE (2005) recommended the government take effective measures to speed up the development of vocational secondary education. The goal is to adjust the scale of secondary vocational education and general SSS education to approximately the same level.
The Study expresses some scepticism about this policy, pointing out that in a large international literature there is no consistent and convincing evidence in support of the presumed productivity advantage of vocational education over general academic education. The apparent lack of enthusiasm by Chinese parents and students (see Box 1 of the previous section) is also fully consistent with international findings. Whatever the merits of the policy of vocational expansion, the provision of adequate vocational teachers is a serious concern. The government is well aware of this constraint, and there is a goal to train 150,000 secondary vocational school teachers by 2010 and to support secondary vocational schools by inviting specialized technicians from relevant industries to be part-time teachers.
Teac
her N
umbe
rs, T
each
er Q
ualit
y:
Less
ons
from
Sec
onda
ry E
duca
tion
in A
sia
12
Such measures may pay off, but the student-teacher ratio remains at a hefty 28:1 in senior vocational schools, a rate which does not seem consistent with the applied, practical and hands-on instruction required of good technical instruction. It will be interesting to see whether in the longer term China follows the example of other industrial Asian countries and allows secondary vocational enrolments to become a minor share of secondary schooling as the economy further develops.
2.2 Lao PDRSince 2001, Lao PDR has made a steady recovery from the economic turmoil of the late-1990s. Lao PDR now finds itself in the policy dilemma observed in other developing countries of Asia and Africa. Driven by rising aspirations and private demand from the majority who have already completed primary schooling, the education system is under pressure for secondary and post-secondary expansion before universal primary enrolment has been completed.
Teaching and learning in Lao PDR’s secondary schools takes place under very difficult conditions. The rapid growth of secondary enrolments has not been accompanied by a parallel expansion of the number of secondary schools or classrooms. More students are being squeezed into each class. The average class size is currently 50, compared to the weighted average of 37 for lower and upper secondary ten years ago. The average size of Grade 11 (the all-important final year with its national examination) is of the order of 70 students. Textbooks and teachers’ guides remain in very short supply. The secondary curriculum was last revised in 1994. Nor can effective teaching and learning take place in a secondary school without a science laboratory, furniture, equipment or a library. All these things are in desperately short supply in secondary schools outside the major towns.
Disparities between rural/urban and poor/non-poor districts can be dramatic. The poor and poorest districts fare much worse than the non-poor both in their access to secondary schooling and in the condition of their schools. Both males and females in rural locations display enrolment rates far lower than their urban compatriots, and minority rural females are particularly disadvantaged, with nugatory lower secondary enrolment rates.
An alleged shortage of secondary teachers has been prominent in the policy and donor agenda of recent years, but from the purely quantitative point of view, there is no persuasive evidence of an overall national shortage. The current student-teacher ratio of 27:1 is appropriate for a class size of 46 to 47 students. With a current average class size of the order of 50 students, there are clearly fewer secondary teachers than necessary. But the shortfall is not large. Even a target reduction in class size from 50 to 45 would require only 3.5 percent more teachers than the existing secondary total, an increase which falls well within the annual attrition rate.
None of this is to deny that individual schools may face special problems of teacher shortages not captured in the national average. There is a substantial provincial variation in both the teacher ratios and class size, and there is much anecdotal comment that secondary schools are experiencing severe shortages in particular specialized subjects, with teachers of mathematics and natural science being most commonly mentioned. Yet a further caveat is the incidence of teacher absenteeism, with the likelihood that they teach for less than their reported number
13
The
Five
Cas
e St
udie
s
of instructional hours. This may be because they need time for outside employment to compensate for their low salaries (perhaps by teaching in a second school or by needing time to grow their own rice and vegetables), or because they simply reduce their effort.
If the overall quantitative story of secondary teacher numbers in Lao PDR is relatively benign, then the situation with their qualifications and training is the opposite. The vast majority of secondary teachers have a teacher training qualification and are therefore qualified in that sense, but many of them have low levels of formal schooling. Teacher qualifications in Lao PDR are measured by two criteria: the number of years of formal schooling, and the number of years of teacher education. The formal requirement for teaching in secondary school is currently a minimum of 11 years of formal school and three years of teacher education (that is, 11+3). Almost half of all secondary teachers do not meet this formal minimum qualification. More than one-third of teachers in the school year 2005/06 had an 8+3 qualification or less, meaning that they had no more basic schooling than the level of the students they were teaching. Some provinces are particularly disadvantaged, with two-thirds or more of their secondary teachers not meeting the formal minimum requirement.
While there is considerable uncertainty about projections of teacher numbers, the major implication is that over the years until 2015 there will be on average a substantial and persisting surplus in the annual supply of teachers who have the formal qualification (11+3) for teaching at the secondary school level. In short, the pool of potential secondary teachers is quite large. The problem is not one of insufficient students enrolling in 11+3 programmes: the problem is one of encouraging sufficient numbers of yearly teacher graduates to actually enter the profession.
There has for many years been a realisation that teachers’ salaries in Lao PDR were very low. By 2001/02, teacher salaries in the country had fallen so low that primary teachers were earning only 61 percent of GDP per head and secondary teachers were just falling short of earning average GDP per head. More recent data suggested that teachers at all levels have still not recovered their relative position of ten years ago, but lower secondary salaries are now around 120 percent of GDP per head and upper secondary salaries are around 130 percent.
The government is committed to improving the quality of its teachers, including secondary teachers, through longer periods of pre-service training. The intention is to move steadily from the existing range of 11+1 programmes to a more consistent standard of 11+3, via an 11+2 programme which is currently being piloted. The existing 5+4 and 8+3 programmes will continue to play a specialized role, especially in remote (and typically ethnic areas) where current levels of formal education are low. The critical question is whether the existing teacher colleges can respond effectively to the increasing demands that will be placed upon them.
Foremost among these concerns is the unit cost of a student in teacher education. Costs in the teacher colleges must be interpreted very cautiously, but evidence suggests that teacher education in Lao PDR is very expensive. The opportunity cost of the teacher colleges is high, with each teacher student costing the equivalent of 7.5 primary students. Lao PDR undertook a major rationalization of teacher colleges in the late 1990s, but it is apparent that the cost structure of teacher education needs further attention. Its unit costs exceed those of any other sub-sector of education.
Teac
her N
umbe
rs, T
each
er Q
ualit
y:
Less
ons
from
Sec
onda
ry E
duca
tion
in A
sia
14
It is not difficult to find the reasons for this high unit cost. The multiplicity of courses, programmes, qualifications and curricula, the very low workload of around 12 to 18 hours per week for Teacher Training College (TTC) staff and an almost complete absence of specialization or economies of scale all play a role. The underlying economics of the country’s TTCs have so far been disguised under the active programmes of constant teacher upgrade, but it is becoming increasingly apparent that imposing longer and longer periods of teacher education on an inefficient and costly structure is nowhere near an effective use of resources. Given the objectives of secondary expansion, and the requirements for better-qualified teachers, it is timely to reconsider whether the existing and anticipated teachers’ programmes are appropriate for the task.
2.3 MalaysiaEducation in Malaysia has undergone rapid changes in the last 50 years. From a diverse and fragmented system of education based on local community needs, it has evolved into an integrated national system of education. This system is intended to support not only a multi-ethnic and multi-lingual society but also the target of transforming the country into a developed nation by 2020 (“Vision 2020”). Secondary education occupies a prominent place in repositioning Malaysia as a knowledge-based economy alongside the developed countries.
The Case Study notes that the system has made tremendous progress in providing access to quality secondary education, citing the inclusive language policies, the narrowing of the rural/urban gap in educational access and achievement and the variety of policy reforms to improve access, participation and equity. Teachers are highly qualified (Malaysia is close to an all-graduate teaching workforce), and the profession continues to attract younger, female graduates. There have been improvements in curriculum, with a wider variety of programmes now offered, reductions in average class size, better teacher compensation and a more attractive teacher career path. Teacher compensation in Malaysia remains lower than other comparable professions, but the “Super Teacher” and “Super Principal” schemes address the need for greater incentives and compensation by providing an alternative fast track promotion for excellent teachers and principals.
A number of challenges remain:
nA large cadre of university graduates is seen as an important ingredient in supporting the shift to a knowledge-intensive economy. While participation in secondary education has increased, the transition rate into university from secondary schools remains an ongoing issue. As development of a world class higher education system is a desired outcome, there is some concern that more incentives and places need to be created for secondary students to enter university programmes.
nHowever welcome the improved gender equity in the secondary teaching workforce, the counterpart of the feminization of teaching is the gradual decline in the number of older, experienced male teachers.
nThe supply of teachers continues to be problematic in rural and remote regions. Malaysia is hardly unique in facing this problem, and there is an ongoing struggle to attract high quality teachers willing to teach in rural regions for extensive periods.
15
The
Five
Cas
e St
udie
s
The most controversial policy of recent years has been the switch to English language instruction in secondary Maths and Sciences. This is a policy which goes beyond merely a change in the language of instruction: it goes to the heart of the twin objectives of offering inclusive language programmes in a multi-ethnic society, while also ensuring that secondary education supports the transformation of the country into a knowledge-based advanced economy. Malaysia offers opportunities for parents to have their primary-aged children schooled in the vernacular language of their choice, but in government schools secondary education takes place predominantly in the national language (Bahasa Malaysia) with English taught as a foreign language.
There has been concern that this has resulted in a lower standard of English mastery for today’s students compared to the older generation schooled in pre-independence days entirely in English. Conscious of the fact that English is the internationally common language of science and technology, the Ministry of Education stipulated in 2004 that the medium for instruction in secondary Maths and Science would be English. The main issues have been not with the policy, but with the manner of implementation.
Teachers were not sufficiently prepared to teach in English and resources were not adequate to deal with what was quite clearly a radical change for many teachers. It could be argued that the difficulty facing many teachers confirmed the belief of policy-makers that standards of English were not adequate in these critical subjects, but despite much effort to improve teachers’ proficiency and support the implementation of this policy, some teachers are still not ready to teach in English. More resources and language education need to be allocated to science and mathematics teachers, especially those in rural and remote areas who may not have access to language classes and intensive language training.
2.4 Republic of KoreaEducation has played a pivotal role in Korea’s economic development. At the end of the Korean War (1950-53), with a devastated economic structure and the Korean peninsula divided into two separate countries, education seemed to offer one of the few avenues for achieving a better life. Today, the Republic of Korea is one of the best-schooled countries in the world, in both quantitative and qualitative terms. Its sequential model of development, paying careful attention to expansion at each level before encouraging enrolments at the next level, has become a model for developing countries. The high proportion of private secondary schools, which had its origins in the financial scarcity of the post-war years, has also been praised as a sensible way of sharing costs and allowing governments to concentrate public expenditure at the lower levels of the school system.
Virtually everyone in the respective age group attends secondary school. In 2007, GER in junior secondary (middle school in Korean terminology) was 96 percent and 99.7 percent of middle school graduates progressed to upper secondary (high school). Even more strikingly, in 2007, 82 percent of high school graduates advanced to some form of higher education.
This quantitative progress has been accompanied by outstanding levels of cognitive achievement. The Case Study notes that Korea was ranked respectively third, second, fourth,
Teac
her N
umbe
rs, T
each
er Q
ualit
y:
Less
ons
from
Sec
onda
ry E
duca
tion
in A
sia
16
and first, in mathematics, reading, science and problem solving in the PISA international tests of 2003. Overall, the performance of Korean students was outstanding among OECD member countries. In addition, differences between the upper five percent and the lower five percent of Korean students were smaller than the OECD average. The average score of the bottom five percent of Korean students was located at about the lower middle level of the overall OECD average. In other words, Korea does not have a long “tail” of poorly performing students, and even the low achieving students were not so different from the international standard.
Results such as this require an explanation. The first, and counter-intuitive, finding is that these results have been obtained with class sizes that are very high by OECD standards. Although class size has been reduced on average in recent years, it is still substantial. In 2005, the number of students per class was 35.5 in middle school, 33.9 in general high schools, and 20.0 in vocational high schools. A second line of argument is that, unlike the situation in some OECD countries, the quality of Korea’s teachers is very high. Teachers are recruited into teacher training from the top 5th to 10th percentile in a given age cohort in terms of scores in the Korean Scholastic Aptitude Test (KSAT).
The Case Study canvasses the possibility that decision makers in Korea have at least implicitly considered the trade-off between improving the quality of teachers at the expense of larger class size or reducing the STR. Their conclusion that it is better to have one excellent teacher in a larger class rather than two or three lower quality teachers is consistent with the Korean experience.
There is no meaningful shortage of secondary teachers, and indeed Korea is “spoilt for choice” to the point where there is an over-supply of teachers. In 2006, only 15.3 percent of those who graduated with teaching certificates from programmes of secondary teaching institutes were employed by public and private schools. The over-supply of secondary teachers has in fact become an issue that requires attention. In the 1970s and 1980s, a rapid increase in the teacher population was necessary to facilitate the expansion of the schooling system and to make up for the high turnover rate at that time. Those factors are no longer relevant, and in addition there is now the demographic problem of a much lower birth rate. On average fewer than 20 percent of all the graduates of various teacher education institutions are employed. The Case Study notes that difficult policies need to be developed to tackle the excessive production of secondary teaching certificate holders, through restructuring of teacher education institutions and perhaps closing the lower quality colleges.
While much of the recent history of Korea’s secondary teaching amounts to a success story, increasing numbers of students and parents are dissatisfied with teachers and schools. Sample surveys suggest that Korean parents are likely to believe that their students’ high scholastic achievements are a result of their interest in their children’s education and their high investment in private tutoring, rather than the result of effective teaching by school teachers. Private tutoring in Korea is among the most extensive in the world. Educational success is still seen as the key in Korea, just as it was in the post-war years when the educational foundations were being built. But Korea is no longer the impoverished country it was 50 years ago. Teachers are still held in great respect, but parents are asking for a change in teaching practices and attitudes at school, to meet the diversified and changing expectations of today’s parents.
17
The
Five
Cas
e St
udie
s
2.5 ThailandIn Thailand, there is an increasing awareness that secondary education plays a critical role in improving Thailand’s competitiveness. In spite of this realization, the Country Study finds that there is a large gap between the educational opportunities afforded to urban Thais and the rural poor and disadvantaged. Test results of Thai secondary students have fallen in recent years in comparison to international standards. In key subjects of mathematics, science, and English, Thai students do not meet international standards as shown by their performance in the PISA and TIMSS tests.
Exacerbating the disparities of regional access is the fact that Thailand faces a teacher shortage of approximately 44,000 teachers at the secondary level. The shortage is not due to a lack of qualified teacher candidates. Thailand has a sufficient supply of potential teachers. Rather, the reasons include a policy which encouraged thousands of qualified teachers to opt for early retirement packages, the Thai government’s recent downsizing policy which limited new hiring, limitations in the personnel management system, and an absence of mechanisms to project demand and to coordinate between schools, the education authorities and the pre-service education institutions.
A serious concern is the teacher shortage in critical subjects such as maths, science, Information Technology (IT) and English. There are insufficient teachers in rural and small schools, a lack of administrative staff, and a mismatch between supply and demand. Consequently, out-of-field and contract teaching are common. Education authorities are pursuing a number of measures including increases in administrative staff, merging small schools, transferring management to local authorities, and encouraging private school expansion. Personnel management regulations should also be re-considered in order to deploy quality teachers to disadvantaged areas and to fill the need for teaching in critical subjects.
While Thailand strives to address equity in access, improving the quality of education is the top goal of education reform. In spite of strong efforts, problems still remain, particularly due to out-of-field teaching and a lack of learner-centred teaching capabilities. Other concerns include the declining status of teachers and the fact that the brightest students shun teaching as a career. Exam scores for faculty of education entrants are significantly lower than those in other fields of study. Nonetheless, teaching remains a respected profession. In recent years, there has been some improvement in their academic background and measures to attract the best and brightest need to be strengthened.
Thailand is making great efforts to improve the quality of teachers including establishing a teacher licensing system, extending pre-service teacher training, developing in-service teachers, improving teacher compensation and providing student scholarships to attract top teacher prospects. These efforts should be supported and strengthened. For example, the teacher licensing system can be developed to recognize teacher specializations (maths, science, IT, English, etc.) and specify teaching levels (primary, secondary). In-service training would benefit from the establishment of a more structured programme such as requiring continuing education units (CEUs).
Teac
her N
umbe
rs, T
each
er Q
ualit
y:
Less
ons
from
Sec
onda
ry E
duca
tion
in A
sia
18
In addition to the training and work environment, monetary incentives should be considered. Teachers’ salaries are not equivalent to other professionals, although recent changes in salary structure are a step in the right direction. Teachers’ debt is a serious problem, which can decrease the morale of teachers. Furthermore, the widespread debt among teachers may make the profession less attractive. A comprehensive plan for addressing the debt problem, including financial literacy training, is badly needed.
More teachers will be needed over the next 15 years if Thailand is to meet its MDG of making secondary education universal and to replace those teachers who retire, including more than 60 percent of today’s teachers. When adding the current shortage, a total of an estimated 121,545 teachers will need to be hired. However, Thailand spends less on secondary education than primary education and a smaller percentage on the poor at secondary level than at primary level. In order to meet the needs of universal secondary enrolment, significant increases in budget allocation are needed.
A number of agencies are involved in providing secondary education, but there is no agency responsible for meeting the needs of secondary schools in a comprehensive and efficient manner. While there is much hope and promise for the decentralization of education management, it will take time and will not meet the needs of disadvantaged Thais in the short or medium term. Policy, management, and resource and budget allocation all need strengthening if the quality of secondary education is to increase and the rural disparities in access and performance reduced.
With this summary of the Case Studies in place, the next section looks in more detail at the development of secondary education across the East Asian and South-East Asian region.
19
Secondary Education in Asia Section 3
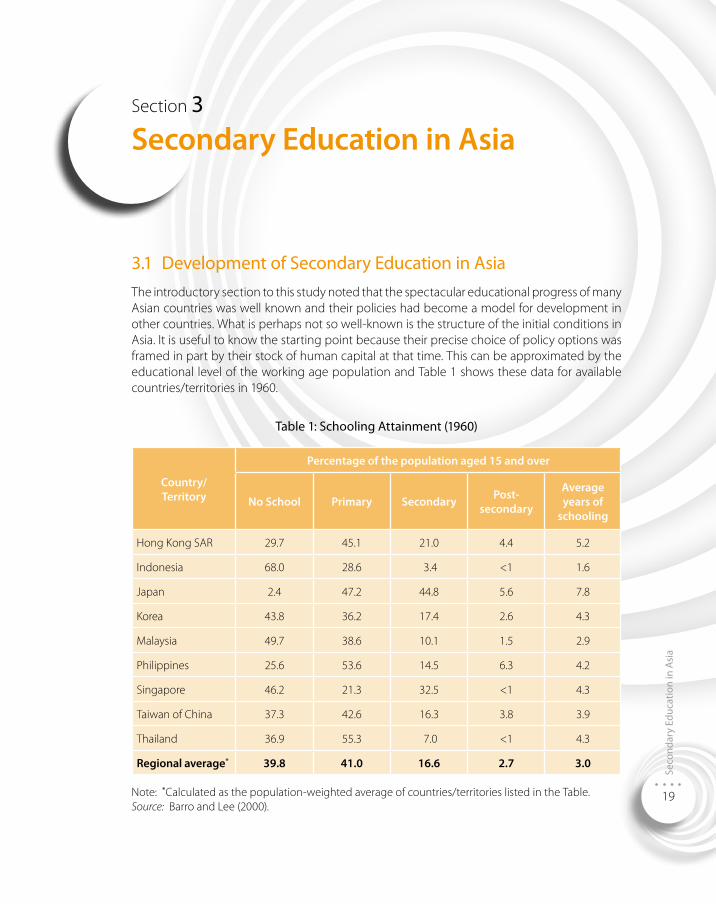
3.1 Development of Secondary Education in Asia The introductory section to this study noted that the spectacular educational progress of many Asian countries was well known and their policies had become a model for development in other countries. What is perhaps not so well-known is the structure of the initial conditions in Asia. It is useful to know the starting point because their precise choice of policy options was framed in part by their stock of human capital at that time. This can be approximated by the educational level of the working age population and Table 1 shows these data for available countries/territories in 1960.
Table 1: Schooling Attainment (1960)
Country/Territory
Percentage of the population aged 15 and over
No School Primary Secondary Post-secondary
Average years of
schooling
Hong Kong SAR 29.7 45.1 21.0 4.4 5.2
Indonesia 68.0 28.6 3.4 <1 1.6
Japan 2.4 47.2 44.8 5.6 7.8
Korea 43.8 36.2 17.4 2.6 4.3
Malaysia 49.7 38.6 10.1 1.5 2.9
Philippines 25.6 53.6 14.5 6.3 4.2
Singapore 46.2 21.3 32.5 <1 4.3
Taiwan of China 37.3 42.6 16.3 3.8 3.9
Thailand 36.9 55.3 7.0 <1 4.3
Regional average * 39.8 41.0 16.6 2.7 3.0
Note: *Calculated as the population-weighted average of countries/territories listed in the Table. Source: Barro and Lee (2000).
Seco
ndar
y Ed
ucat
ion
in A
sia
Teac
her N
umbe
rs, T
each
er Q
ualit
y:
Less
ons
from
Sec
onda
ry E
duca
tion
in A
sia
20
Japan already had a high stock of educated people by 1960, with nearly 45 percent of its adult population having completed secondary school. At the other end of the scale, more than two-thirds of adults in Indonesia had never been to school. What is striking is that in between these extreme observations there was very little variation between countries in their overall attainment. Japanese colonialism in Korea and Taiwan of China left a legacy of expanded access to primary school in the 50 years before 1945, but there is no strong evidence from Table 1 that this effect was stronger in those places than elsewhere.4
In terms of the stock of primary-educated adults, Malaysia and Philippines were no less endowed than Korea or Taiwan of China, and Thailand had arguably done better than all four. Singapore is noteworthy for the asymmetric nature of its human capital stock in 1960. Its overall attainment of 4.3 years was typical of the main group of countries/territories in Table 1, but this was because nearly one-third of Singapore’s adults, more than any other country but Japan, had attained secondary schooling despite the fact that nearly half its adult population had had no schooling at all.
The overall impression from Table 1 is that in 1960 many of the countries/territories of East Asia were more alike than dissimilar in their overall educational attainment. This was to change drastically in the years ahead. These developments can be seen in a series of figures which turn from the stock indicator of adult educational attainment measured in Table 1 to the flow indicator of enrolment rates.5 Figure 1-4 shows enrolments rates for each level of the school system for those countries/territories with data for every ten years since 1970. In each figure, the line connecting the median GER for each school level is shown as ‘Median’. 6
Two things are prominent about this series of graphs. The first is that by 1970 the newly-industrialized economies of Hong Kong SAR, Taiwan of China, Singapore and Korea were putting substantial efforts into high primary enrolments. By contrast, China, Indonesia, Malaysia and Thailand were all below the median in their primary enrolment rates, a situation which did not change until 1990.
4 Primary access was expanded in Korea and Taiwan of China during the half-century of Japanese rule, but the political upheaval and military trauma of the late 1940s and early 1950s makes it difficult to disentangle the continuing influence of their colonial history on the adult stock as measured in 1960. Migration also complicates the picture.
5 The data for all entries but Taiwan of China were compiled from the WB’s EdStats. Taiwan of China is not separately identified in these statistics. All data from Taiwan of China for the years before 2000 are from Wu (1993). Data for years after 2000 are compiled from the Education Authorities, Taiwan of China, Educational Statistical Indicators, various years.
6 There are obvious limitations in using gross ratios to compare countries/territories over time, since a decline is more likely to signal an improvement in efficiency (with fewer over-and under-age enrolments) than a reduction in coverage. These limitations are well-known and provided the differing interpretations are kept in mind gross ratios are a standard and acceptable tool of analysis.
Seco
ndar
y Ed
ucat
ion
in A
sia
21
The second feature is that the format of the figures offers an at-a-glance guide to the develop-ment of secondary education in the region. In 1970, most of the countries/territories, but especially those below the median curve, had under-developed secondary systems: the lines linking the enrolment points for each country/territory are nearly all concave, with the concavity most pronounced for, again, China, Indonesia, Malaysia and Thailand.7 In other words, the NIEs were not only putting substantial effort into high primary enrolments: they were also maintaining a better balance of expansion in other levels of the school system.
The near-straight line for Taiwan of China in Figure 1 suggests an almost exactly balanced system. Japan was the outlier at this time. With universal primary enrolment (at the correct age) long achieved, there was by definition no further scope to increase primary enrolment rates. Full secondary enrolment was the next target. Secondary enrolment already exceeded 85 percent in 1970, so the result of that transition to a high-enrolment secondary system is that the curve for Japan pivots out from the full-enrolment primary point, resulting in the prominently convex curve seen in the Figure.
By 1980 (Figure 2), the convex curve for some countries/territories, and the resulting “diamond” shape of the graph overall, is becoming clearer. There are still countries (Indonesia, Thailand, Viet Nam and Malaysia) characterised by the concave curve of insufficient secondary development, but now Hong Kong SAR and Singapore have the straight-line characteristics of a balanced system. Taiwan of China and Korea joined Japan in moving to the convex shape that signifies full primary enrolment and transition to very high secondary enrolments.
By 1990 (Figure 3), the transition towards a stylised diamond pattern is clearly evident. Now the median line for the region is perfectly straight. Thailand, Viet Nam, Indonesia and China were still below that regional median in their secondary development, but all the “tiger” economies had high secondary enrolments. Taiwan of China and Korea were not far behind Japan in the shift to mass secondary enrolment.
7 In principle, a severe concavity could arise because those countries had primary enrolments that were too high relative to other sectors. In practice, their low primary enrolments suggest that the kink arises because tertiary enrolments were too high relative to other sectors. The secondary sector was not large enough to balance even the modest primary enrolments and the tertiary sector was over-expanded relative to the small secondary sector.
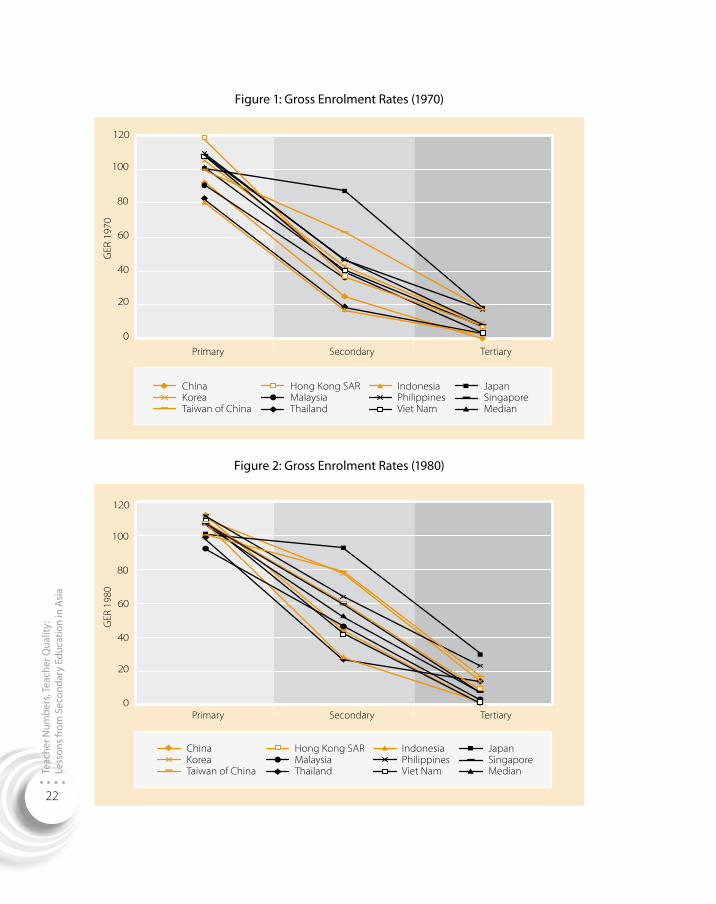
Teac
her N
umbe
rs, T
each
er Q
ualit
y:
Less
ons
from
Sec
onda
ry E
duca
tion
in A
sia
22
Figure 1: Gross Enrolment Rates (1970)
JapanSingaporeMedian
IndonesiaPhilippinesViet Nam
Hong Kong SARMalaysiaThailand
ChinaKoreaTaiwan of China
120
100
80
60
40
20
0Primary Secondary Tertiary
GER
197
0
Figure 2: Gross Enrolment Rates (1980)
JapanSingaporeMedian
IndonesiaPhilippinesViet Nam
Hong Kong SARMalaysiaThailand
ChinaKoreaTaiwan of China
120
100
80
60
40
20
0Primary Secondary Tertiary
GER
198
0
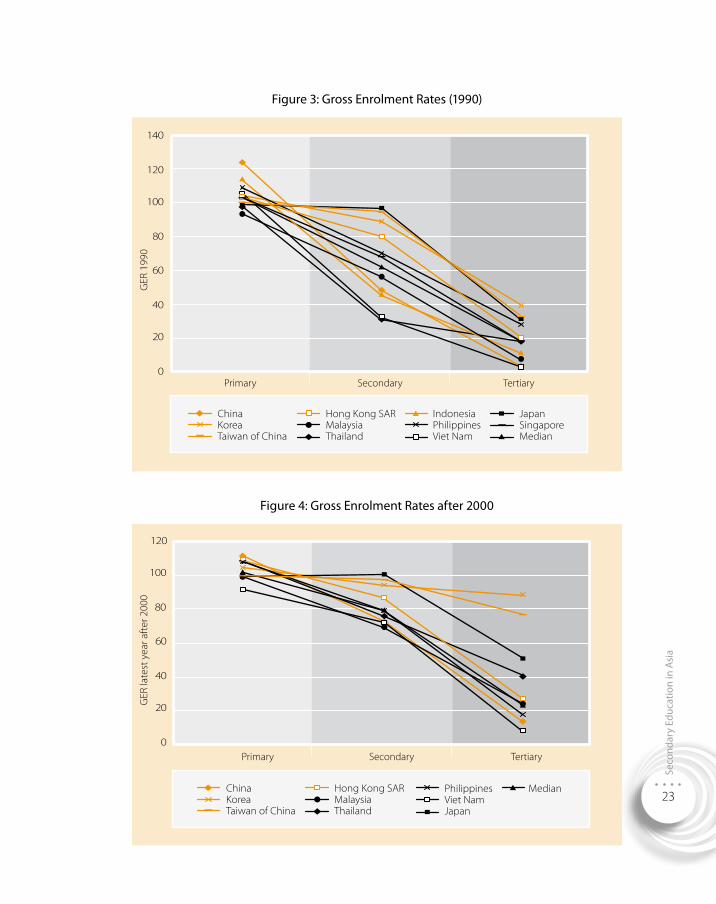
Seco
ndar
y Ed
ucat
ion
in A
sia
23
Figure 3: Gross Enrolment Rates (1990)
Primary Secondary Tertiary
120
140
100
80
60
40
20
0
GER
199
0
JapanSingaporeMedian
IndonesiaPhilippinesViet Nam
Hong Kong SARMalaysiaThailand
ChinaKoreaTaiwan of China
Figure 4: Gross Enrolment Rates after 2000
PhilippinesViet NamJapan
MedianHong Kong SARMalaysiaThailand
ChinaKoreaTaiwan of China
Primary Secondary Tertiary
GER
late
st y
ear a
fter
200
0
120
100
80
60
40
20
0
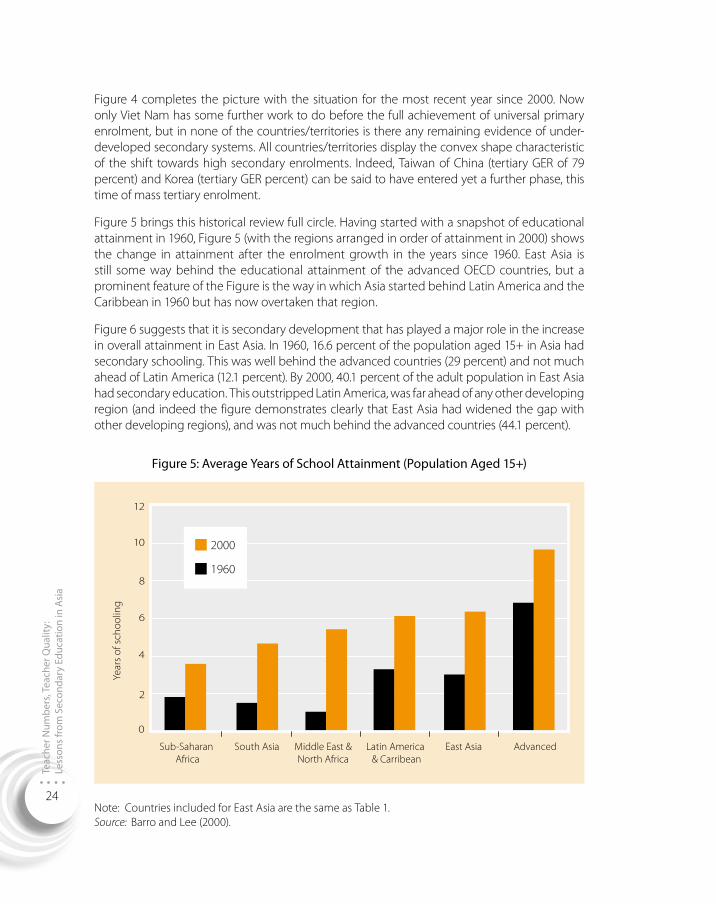
Teac
her N
umbe
rs, T
each
er Q
ualit
y:
Less
ons
from
Sec
onda
ry E
duca
tion
in A
sia
24
Figure 4 completes the picture with the situation for the most recent year since 2000. Now only Viet Nam has some further work to do before the full achievement of universal primary enrolment, but in none of the countries/territories is there any remaining evidence of under-developed secondary systems. All countries/territories display the convex shape characteristic of the shift towards high secondary enrolments. Indeed, Taiwan of China (tertiary GER of 79 percent) and Korea (tertiary GER percent) can be said to have entered yet a further phase, this time of mass tertiary enrolment.
Figure 5 brings this historical review full circle. Having started with a snapshot of educational attainment in 1960, Figure 5 (with the regions arranged in order of attainment in 2000) shows the change in attainment after the enrolment growth in the years since 1960. East Asia is still some way behind the educational attainment of the advanced OECD countries, but a prominent feature of the Figure is the way in which Asia started behind Latin America and the Caribbean in 1960 but has now overtaken that region.
Figure 6 suggests that it is secondary development that has played a major role in the increase in overall attainment in East Asia. In 1960, 16.6 percent of the population aged 15+ in Asia had secondary schooling. This was well behind the advanced countries (29 percent) and not much ahead of Latin America (12.1 percent). By 2000, 40.1 percent of the adult population in East Asia had secondary education. This outstripped Latin America, was far ahead of any other developing region (and indeed the figure demonstrates clearly that East Asia had widened the gap with other developing regions), and was not much behind the advanced countries (44.1 percent).
Figure 5: Average Years of School Attainment (Population Aged 15+)
2000
19608
6
4
2
12
10
0
Sub-Saharan Africa
South Asia Middle East &North Africa
Latin America & Carribean
East Asia Advanced
Year
s of
sch
oolin
g
Note: Countries included for East Asia are the same as Table 1. Source: Barro and Lee (2000).
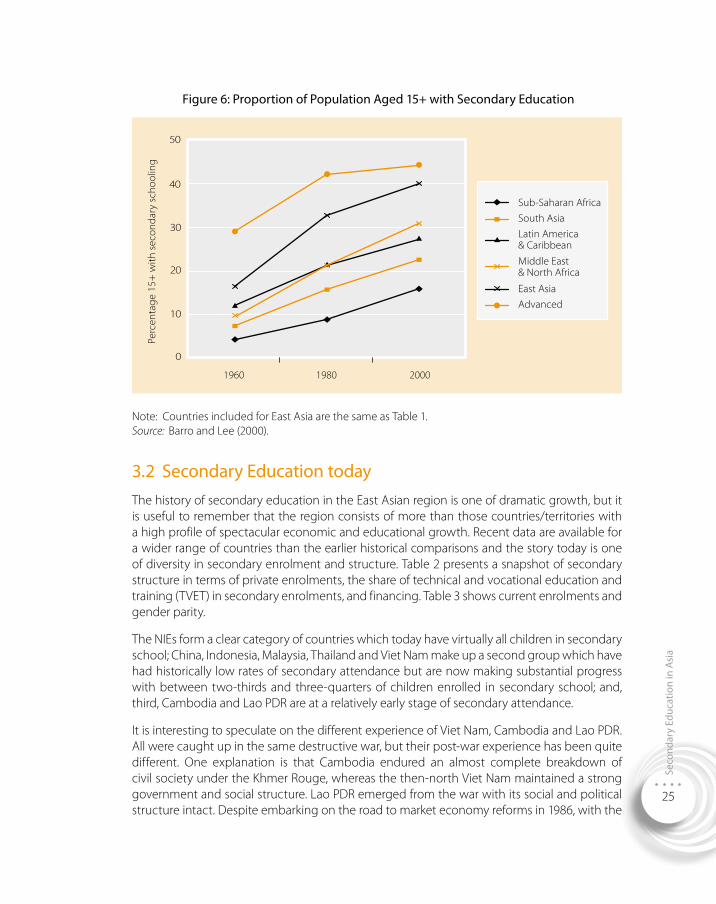
Seco
ndar
y Ed
ucat
ion
in A
sia
25
Figure 6: Proportion of Population Aged 15+ with Secondary Education
Sub-Saharan AfricaSouth AsiaLatin America& Caribbean
Middle East & North Africa
East AsiaAdvanced
1960 1980 2000
40
50
30
20
10
0
Perc
enta
ge 1
5+ w
ith s
econ
dary
sch
oolin
g
Note: Countries included for East Asia are the same as Table 1. Source: Barro and Lee (2000).
3.2 Secondary Education todayThe history of secondary education in the East Asian region is one of dramatic growth, but it is useful to remember that the region consists of more than those countries/territories with a high profile of spectacular economic and educational growth. Recent data are available for a wider range of countries than the earlier historical comparisons and the story today is one of diversity in secondary enrolment and structure. Table 2 presents a snapshot of secondary structure in terms of private enrolments, the share of technical and vocational education and training (TVET) in secondary enrolments, and financing. Table 3 shows current enrolments and gender parity.
The NIEs form a clear category of countries which today have virtually all children in secondary school; China, Indonesia, Malaysia, Thailand and Viet Nam make up a second group which have had historically low rates of secondary attendance but are now making substantial progress with between two-thirds and three-quarters of children enrolled in secondary school; and, third, Cambodia and Lao PDR are at a relatively early stage of secondary attendance.
It is interesting to speculate on the different experience of Viet Nam, Cambodia and Lao PDR. All were caught up in the same destructive war, but their post-war experience has been quite different. One explanation is that Cambodia endured an almost complete breakdown of civil society under the Khmer Rouge, whereas the then-north Viet Nam maintained a strong government and social structure. Lao PDR emerged from the war with its social and political structure intact. Despite embarking on the road to market economy reforms in 1986, with the
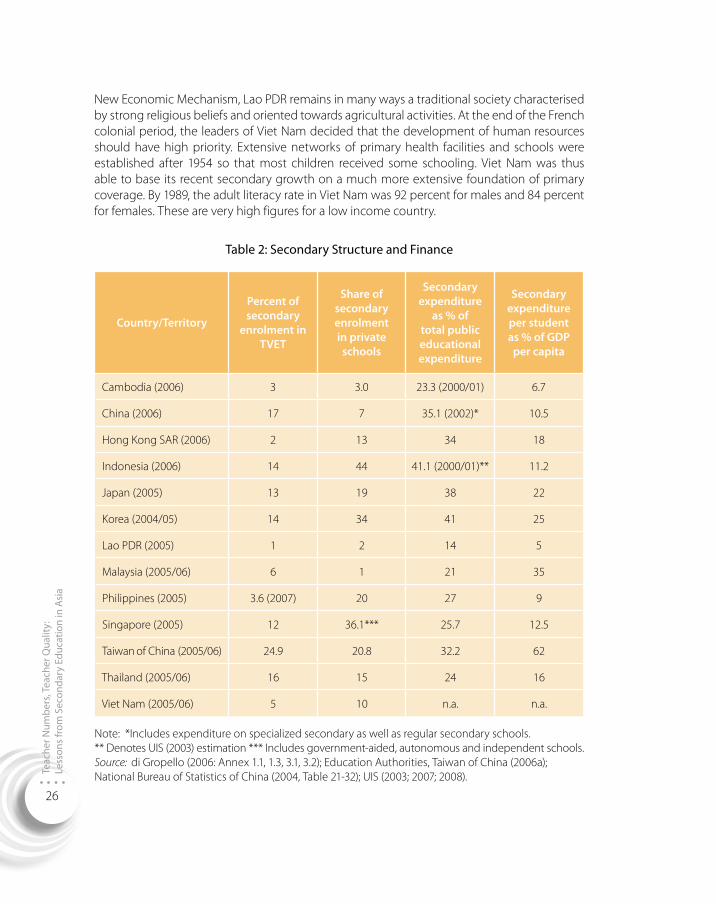
Teac
her N
umbe
rs, T
each
er Q
ualit
y:
Less
ons
from
Sec
onda
ry E
duca
tion
in A
sia
26
New Economic Mechan ism, Lao PDR remains in many ways a traditional society characterised by strong religious beliefs and oriented towards agricultural activities. At the end of the French colonial period, the leaders of Viet Nam decided that the development of human resources should have high priority. Extensive networks of primary health facilities and schools were established after 1954 so that most children received some schooling. Viet Nam was thus able to base its recent secondary growth on a much more extensive foundation of primary coverage. By 1989, the adult literacy rate in Viet Nam was 92 percent for males and 84 percent for females. These are very high figures for a low income country.
Table 2: Secondary Structure and Finance
Country/Territory
Percent of secondary
enrolment in TVET
Share of secondary enrolment in private
schools
Secondary expenditure
as % of total public educational expenditure
Secondary expenditure per student as % of GDP
per capita
Cambodia (2006) 3 3.0 23.3 (2000/01) 6.7
China (2006) 17 7 35.1 (2002)* 10.5
Hong Kong SAR (2006) 2 13 34 18
Indonesia (2006) 14 44 41.1 (2000/01)** 11.2
Japan (2005) 13 19 38 22
Korea (2004/05) 14 34 41 25
Lao PDR (2005) 1 2 14 5
Malaysia (2005/06) 6 1 21 35
Philippines (2005) 3.6 (2007) 20 27 9
Singapore (2005) 12 36.1*** 25.7 12.5
Taiwan of China (2005/06) 24.9 20.8 32.2 62
Thailand (2005/06) 16 15 24 16
Viet Nam (2005/06) 5 10 n.a. n.a.
Note: *Includes expenditure on specialized secondary as well as regular secondary schools. ** Denotes UIS (2003) estimation *** Includes government-aided, autonomous and independent schools. Source: di Gropello (2006: Annex 1.1, 1.3, 3.1, 3.2); Education Authorities, Taiwan of China (2006a); National Bureau of Statistics of China (2004, Table 21-32); UIS (2003; 2007; 2008).
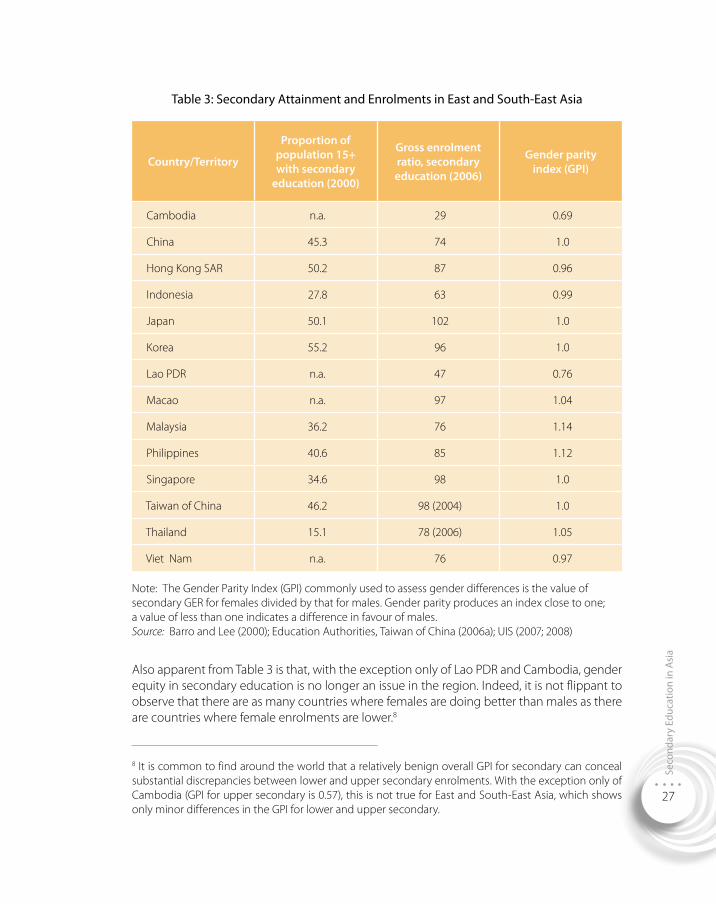
Seco
ndar
y Ed
ucat
ion
in A
sia
27
Table 3: Secondary Attainment and Enrolments in East and South-East Asia
Country/Territory
Proportion of population 15+ with secondary
education (2000)
Gross enrolment ratio, secondary education (2006)
Gender parity index (GPI)
Cambodia n.a. 29 0.69
China 45.3 74 1.0
Hong Kong SAR 50.2 87 0.96
Indonesia 27.8 63 0.99
Japan 50.1 102 1.0
Korea 55.2 96 1.0
Lao PDR n.a. 47 0.76
Macao n.a. 97 1.04
Malaysia 36.2 76 1.14
Philippines 40.6 85 1.12
Singapore 34.6 98 1.0
Taiwan of China 46.2 98 (2004) 1.0
Thailand 15.1 78 (2006) 1.05
Viet Nam n.a. 76 0.97
Note: The Gender Parity Index (GPI) commonly used to assess gender differences is the value of secondary GER for females divided by that for males. Gender parity produces an index close to one; a value of less than one indicates a difference in favour of males. Source: Barro and Lee (2000); Education Authorities, Taiwan of China (2006a); UIS (2007; 2008)
Also apparent from Table 3 is that, with the exception only of Lao PDR and Cambodia, gender equity in secondary education is no longer an issue in the region. Indeed, it is not flippant to observe that there are as many countries where females are doing better than males as there are countries where female enrolments are lower.8
8 It is common to find around the world that a relatively benign overall GPI for secondary can conceal substantial discrepancies between lower and upper secondary enrolments. With the exception only of Cambodia (GPI for upper secondary is 0.57), this is not true for East and South-East Asia, which shows only minor differences in the GPI for lower and upper secondary.
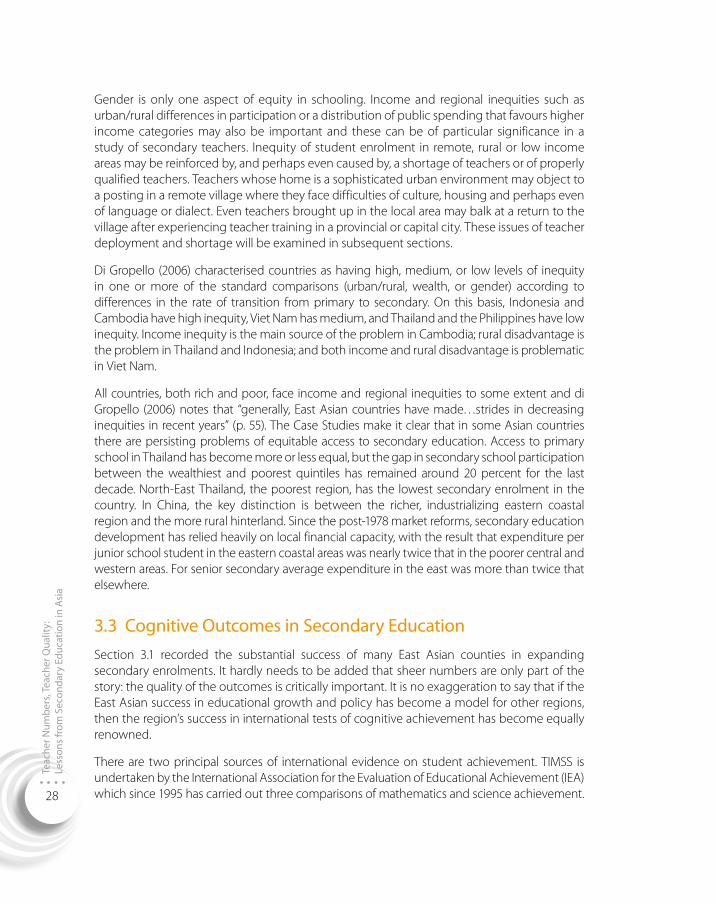
Teac
her N
umbe
rs, T
each
er Q
ualit
y:
Less
ons
from
Sec
onda
ry E
duca
tion
in A
sia
28
Gender is only one aspect of equity in schooling. Income and regional inequities such as urban/rural differences in participation or a distribution of public spending that favours higher income categories may also be important and these can be of particular significance in a study of secondary teachers. Inequity of student enrolment in remote, rural or low income areas may be reinforced by, and perhaps even caused by, a shortage of teachers or of properly qualified teachers. Teachers whose home is a sophisticated urban environment may object to a posting in a remote village where they face difficulties of culture, housing and perhaps even of language or dialect. Even teachers brought up in the local area may balk at a return to the village after experiencing teacher training in a provincial or capital city. These issues of teacher deployment and shortage will be examined in subsequent sections.
Di Gropello (2006) characterised countries as having high, medium, or low levels of inequity in one or more of the standard comparisons (urban/rural, wealth, or gender) according to differences in the rate of transition from primary to secondary. On this basis, Indonesia and Cambodia have high inequity, Viet Nam has medium, and Thailand and the Philippines have low inequity. Income inequity is the main source of the problem in Cambodia; rural disadvantage is the problem in Thailand and Indonesia; and both income and rural disadvantage is problematic in Viet Nam.
All countries, both rich and poor, face income and regional inequities to some extent and di Gropello (2006) notes that “generally, East Asian countries have made…strides in decreasing inequities in recent years” (p. 55). The Case Studies make it clear that in some Asian countries there are persisting problems of equitable access to secondary education. Access to primary school in Thailand has become more or less equal, but the gap in secondary school participation between the wealthiest and poorest quintiles has remained around 20 percent for the last decade. North-East Thailand, the poorest region, has the lowest secondary enrolment in the country. In China, the key distinction is between the richer, industrializing eastern coastal region and the more rural hinterland. Since the post-1978 market reforms, secondary education development has relied heavily on local financial capacity, with the result that expenditure per junior school student in the eastern coastal areas was nearly twice that in the poorer central and western areas. For senior secondary average expenditure in the east was more than twice that elsewhere.
3.3 Cognitive Outcomes in Secondary Education Section 3.1 recorded the substantial success of many East Asian counties in expanding secondary enrolments. It hardly needs to be added that sheer numbers are only part of the story: the quality of the outcomes is critically important. It is no exaggeration to say that if the East Asian success in educational growth and policy has become a model for other regions, then the region’s success in international tests of cognitive achievement has become equally renowned.
There are two principal sources of international evidence on student achievement. TIMSS is undertaken by the International Association for the Evaluation of Educational Achievement (IEA) which since 1995 has carried out three comparisons of mathematics and science achievement.
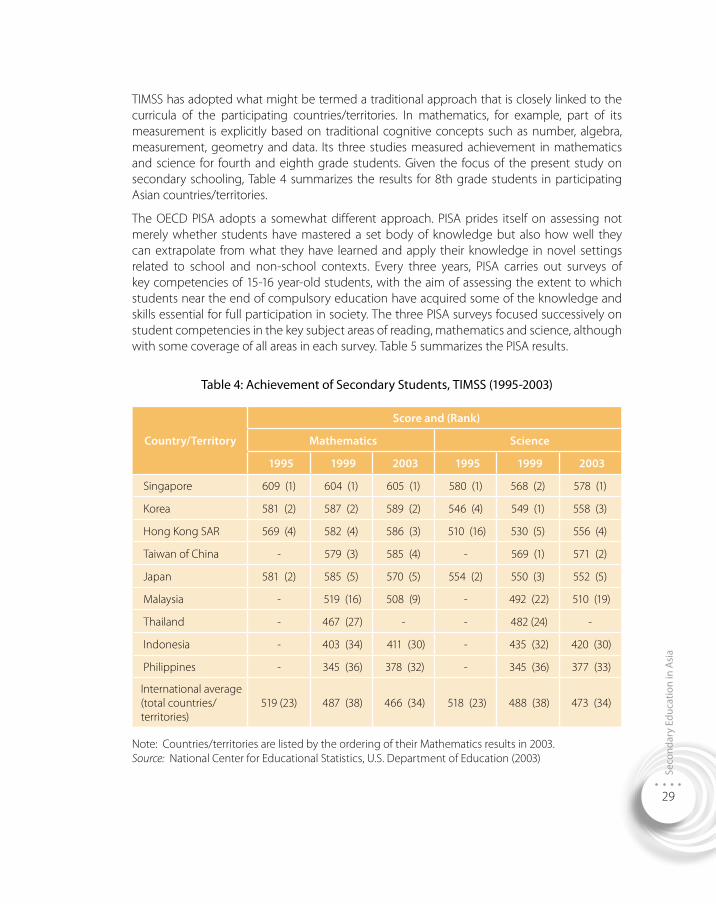
Seco
ndar
y Ed
ucat
ion
in A
sia
29
TIMSS has adopted what might be termed a traditional approach that is closely linked to the curricula of the participating countries/territories. In mathematics, for example, part of its measurement is explicitly based on traditional cognitive concepts such as number, algebra, measurement, geometry and data. Its three studies measured achievement in mathematics and science for fourth and eighth grade students. Given the focus of the present study on secondary schooling, Table 4 summarizes the results for 8th grade students in participating Asian countries/territories.
The OECD PISA adopts a somewhat different approach. PISA prides itself on assessing not merely whether students have mastered a set body of knowledge but also how well they can extrapolate from what they have learned and apply their knowledge in novel settings related to school and non-school contexts. Every three years, PISA carries out surveys of key competencies of 15-16 year-old students, with the aim of assessing the extent to which students near the end of compulsory education have acquired some of the knowledge and skills essential for full participation in society. The three PISA surveys focused successively on student competencies in the key subject areas of reading, mathematics and science, although with some coverage of all areas in each survey. Table 5 summarizes the PISA results.
Table 4: Achievement of Secondary Students, TIMSS (1995-2003)
Country/Territory
Score and (Rank)
Mathematics Science
1995 1999 2003 1995 1999 2003
Singapore 609 (1) 604 (1) 605 (1) 580 (1) 568 (2) 578 (1)
Korea 581 (2) 587 (2) 589 (2) 546 (4) 549 (1) 558 (3)
Hong Kong SAR 569 (4) 582 (4) 586 (3) 510 (16) 530 (5) 556 (4)
Taiwan of China - 579 (3) 585 (4) - 569 (1) 571 (2)
Japan 581 (2) 585 (5) 570 (5) 554 (2) 550 (3) 552 (5)
Malaysia - 519 (16) 508 (9) - 492 (22) 510 (19)
Thailand - 467 (27) - - 482 (24) -
Indonesia - 403 (34) 411 (30) - 435 (32) 420 (30)
Philippines - 345 (36) 378 (32) - 345 (36) 377 (33)
International average (total countries/territories)
519 (23) 487 (38) 466 (34) 518 (23) 488 (38) 473 (34)
Note: Countries/territories are listed by the ordering of their Mathematics results in 2003. Source: National Center for Educational Statistics, U.S. Department of Education (2003)
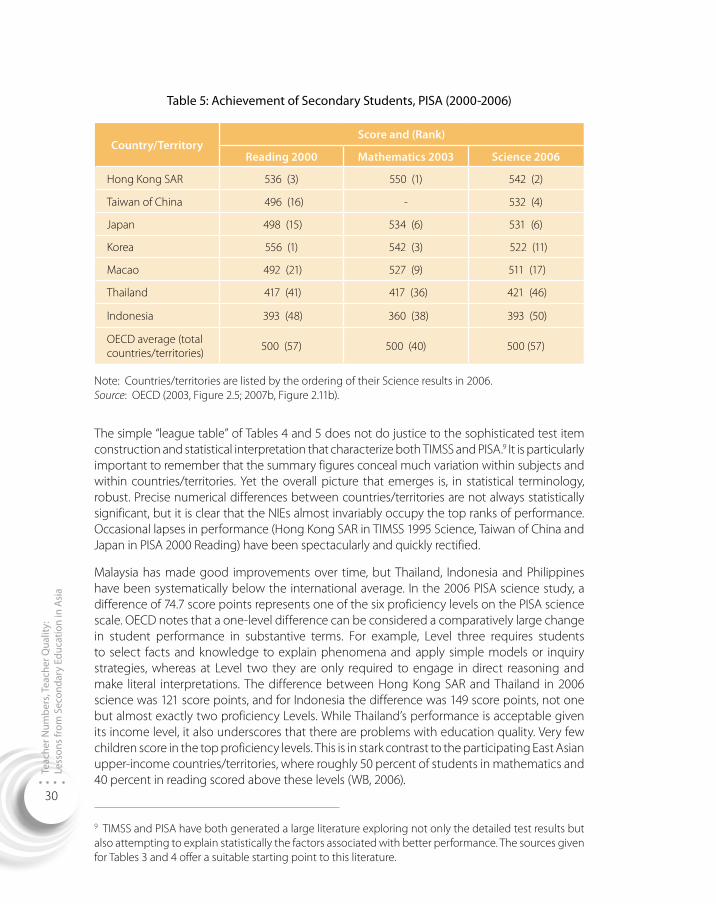
Teac
her N
umbe
rs, T
each
er Q
ualit
y:
Less
ons
from
Sec
onda
ry E
duca
tion
in A
sia
30
Table 5: Achievement of Secondary Students, PISA (2000-2006)
Country/TerritoryScore and (Rank)
Reading 2000 Mathematics 2003 Science 2006
Hong Kong SAR 536 (3) 550 (1) 542 (2)
Taiwan of China 496 (16) - 532 (4)
Japan 498 (15) 534 (6) 531 (6)
Korea 556 (1) 542 (3) 522 (11)
Macao 492 (21) 527 (9) 511 (17)
Thailand 417 (41) 417 (36) 421 (46)
Indonesia 393 (48) 360 (38) 393 (50)
OECD average (total countries/territories)
500 (57) 500 (40) 500 (57)
Note: Countries/territories are listed by the ordering of their Science results in 2006. Source: OECD (2003, Figure 2.5; 2007b, Figure 2.11b).
The simple “league table” of Tables 4 and 5 does not do justice to the sophisticated test item construction and statistical interpretation that characterize both TIMSS and PISA.9 It is particularly important to remember that the summary figures conceal much variation within subjects and within countries/territories. Yet the overall picture that emerges is, in statistical terminology, robust. Precise numerical differences between countries/territories are not always statistically significant, but it is clear that the NIEs almost invariably occupy the top ranks of performance. Occasional lapses in performance (Hong Kong SAR in TIMSS 1995 Science, Taiwan of China and Japan in PISA 2000 Reading) have been spectacularly and quickly rectified.
Malaysia has made good improvements over time, but Thailand, Indonesia and Philippines have been systematically below the international average. In the 2006 PISA science study, a difference of 74.7 score points represents one of the six proficiency levels on the PISA science scale. OECD notes that a one-level difference can be considered a comparatively large change in student performance in substantive terms. For example, Level three requires students to select facts and knowledge to explain phenomena and apply simple models or inquiry strategies, whereas at Level two they are only required to engage in direct reasoning and make literal interpretations. The difference between Hong Kong SAR and Thailand in 2006 science was 121 score points, and for Indonesia the difference was 149 score points, not one but almost exactly two proficiency Levels. While Thailand’s performance is acceptable given its income level, it also underscores that there are problems with education quality. Very few children score in the top proficiency levels. This is in stark contrast to the participating East Asian upper-income countries/territories, where roughly 50 percent of students in mathematics and 40 percent in reading scored above these levels (WB, 2006).
9 TIMSS and PISA have both generated a large literature exploring not only the detailed test results but also attempting to explain statistically the factors associated with better performance. The sources given for Tables 3 and 4 offer a suitable starting point to this literature.
Seco
ndar
y Te
ache
rs a
roun
d th
e Re
gion
: A
Qua
ntita
tive
Pers
pect
ive
31
Secondary Teachers around the Region: A Quantitative Perspective
Section 4
The paper so far has focused on the broader context of secondary development and the growth of secondary enrolments in a regional perspective. This section is the first of three which focus upon the position and role of secondary teachers, again in that regional perspective. The present section is devoted to an analysis of the quantitative aspects of the secondary teacher workforce.
The section starts, as foreshadowed in Section 1, by reviewing the overall picture of teacher numbers. In particular, those numbers are examined in the context of the regional enrolment growth described earlier. This will allow some interpretation of the decisions made in different countries about the trade off between enrolment growth and class size. The evidence from the region is that all countries have followed a policy of reducing class size despite the lack of any systematic evidence of the learning benefits. The section concludes by exploring the issues of teacher numbers and teacher shortage in light of the general reduction in class size.
4.1 Students, Teachers and Class Size This part of the work brings together the enrolment data presented earlier and the matching data on teacher numbers. Table 6 makes extensive use of the STR as the measure of teacher input, but it should be kept in mind that the student-teacher ratio is a simple arithmetic relationship between the number of teachers employed and a given population of students. Although highly correlated with class size, the teacher ratio is not the same thing, and in practice the relationship between the two indicators can be complex. The number of hours that a student attends class each day, the length of a teacher’s working day, the number of classes or students for whom a teacher is responsible, the division of a teacher’s time between instruction and non-instructional activities, the practice of team teaching, and whether a school runs multiple shifts with the same teachers working in different shifts can all affect the relationship between the STR and average class size.
The fundamental arithmetic relationship is that for any given teacher ratio, class size will depend on the teachers’ class contact time relative to students’ instructional hours. Even in primary school, where the general practice is that one teacher teaches all subjects for a given class or grade, teachers do not spend all their time in face-to-face teaching: classes need preparation and assignments have to be marked. A STR of, say, 25:1 will result in a class size of 50 if teachers spend on average only 50 percent of school time in class contact (25/0.5 = 50). In secondary schools, the more usual pattern is one of specialized subject teaching, and this can increase the
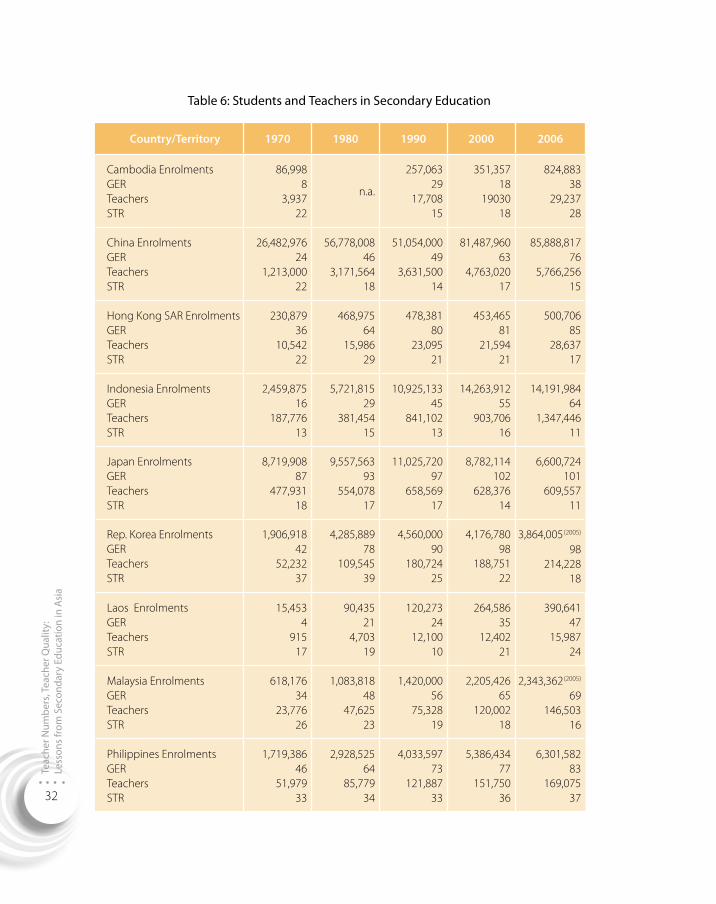
Teac
her N
umbe
rs, T
each
er Q
ualit
y:
Less
ons
from
Sec
onda
ry E
duca
tion
in A
sia
32
Table 6: Students and Teachers in Secondary Education
Country/Territory 1970 1980 1990 2000 2006
Cambodia EnrolmentsGERTeachersSTR
86,9988
3,93722
n.a.
257,06329
17,70815
351,35718
1903018
824,88338
29,23728
China EnrolmentsGERTeachersSTR
26,482,97624
1,213,00022
56,778,00846
3,171,56418
51,054,00049
3,631,50014
81,487,96063
4,763,02017
85,888,81776
5,766,25615
Hong Kong SAR Enrolments GERTeachersSTR
230,87936
10,54222
468,97564
15,98629
478,38180
23,09521
453,46581
21,59421
500,70685
28,63717
Indonesia EnrolmentsGERTeachersSTR
2,459,87516
187,77613
5,721,81529
381,45415
10,925,13345
841,10213
14,263,91255
903,70616
14,191,98464
1,347,44611
Japan EnrolmentsGERTeachersSTR
8,719,90887
477,93118
9,557,56393
554,07817
11,025,72097
658,56917
8,782,114102
628,37614
6,600,724101
609,55711
Rep. Korea EnrolmentsGERTeachersSTR
1,906,91842
52,23237
4,285,88978
109,54539
4,560,00090
180,72425
4,176,78098
188,75122
3,864,005 (2005)
98214,228
18
Laos EnrolmentsGERTeachersSTR
15,4534
91517
90,43521
4,70319
120,27324
12,10010
264,58635
12,40221
390,64147
15,98724
Malaysia EnrolmentsGERTeachersSTR
618,17634
23,77626
1,083,81848
47,62523
1,420,00056
75,32819
2,205,42665
120,00218
2,343,362 (2005)
69146,503
16
Philippines EnrolmentsGERTeachersSTR
1,719,38646
51,97933
2,928,52564
85,77934
4,033,59773
121,88733
5,386,43477
151,75036
6,301,58283
169,07537
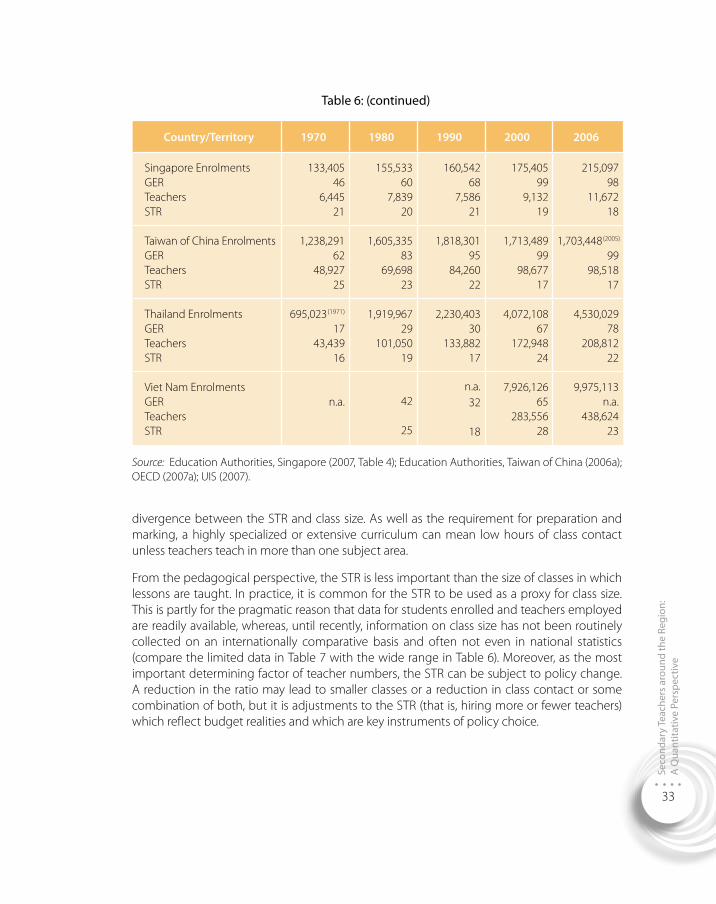
Seco
ndar
y Te
ache
rs a
roun
d th
e Re
gion
: A
Qua
ntita
tive
Pers
pect
ive
33
Country/Territory 1970 1980 1990 2000 2006
Singapore EnrolmentsGERTeachersSTR
133,40546
6,44521
155,53360
7,83920
160,54268
7,58621
175,40599
9,13219
215,09798
11,67218
Taiwan of China EnrolmentsGERTeachersSTR
1,238,29162
48,92725
1,605,33583
69,69823
1,818,30195
84,26022
1,713,48999
98,67717
1,703,448 (2005)
9998,518
17
Thailand EnrolmentsGERTeachersSTR
695,023 (1971)
1743,439
16
1,919,96729
101,05019
2,230,40330
133,88217
4,072,10867
172,94824
4,530,02978
208,81222
Viet Nam EnrolmentsGERTeachersSTR
n.a. 42
25
n.a.32
18
7,926,12665
283,55628
9,975,113n.a.
438,62423
Source: Education Authorities, Singapore (2007, Table 4); Education Authorities, Taiwan of China (2006a); OECD (2007a); UIS (2007).
divergence between the STR and class size. As well as the requirement for preparation and marking, a highly specialized or extensive curriculum can mean low hours of class contact unless teachers teach in more than one subject area.
From the pedagogical perspective, the STR is less important than the size of classes in which lessons are taught. In practice, it is common for the STR to be used as a proxy for class size. This is partly for the pragmatic reason that data for students enrolled and teachers employed are readily available, whereas, until recently, information on class size has not been routinely collected on an internationally comparative basis and often not even in national statistics (compare the limited data in Table 7 with the wide range in Table 6). Moreover, as the most important determining factor of teacher numbers, the STR can be subject to policy change. A reduction in the ratio may lead to smaller classes or a reduction in class contact or some combination of both, but it is adjustments to the STR (that is, hiring more or fewer teachers) which reflect budget realities and which are key instruments of policy choice.
Table 6: (continued)
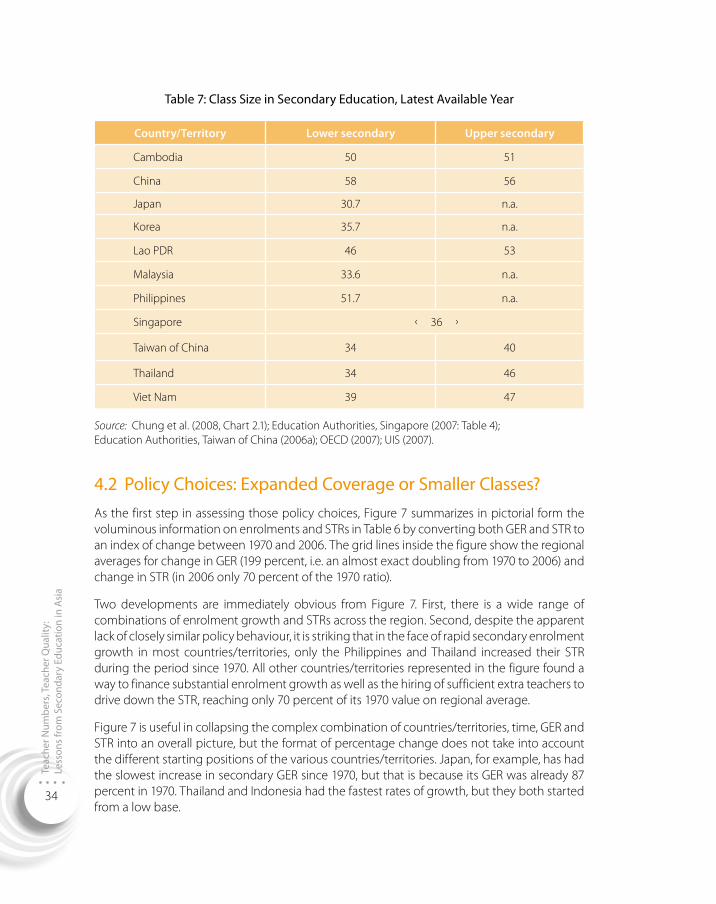
Teac
her N
umbe
rs, T
each
er Q
ualit
y:
Less
ons
from
Sec
onda
ry E
duca
tion
in A
sia
34
Table 7: Class Size in Secondary Education, Latest Available Year
Country/Territory Lower secondary Upper secondary
Cambodia 50 51
China 58 56
Japan 30.7 n.a.
Korea 35.7 n.a.
Lao PDR 46 53
Malaysia 33.6 n.a.
Philippines 51.7 n.a.
Singapore ‹ 36 ›
Taiwan of China 34 40
Thailand 34 46
Viet Nam 39 47
Source: Chung et al. (2008, Chart 2.1); Education Authorities, Singapore (2007: Table 4); Education Authorities, Taiwan of China (2006a); OECD (2007); UIS (2007).
4.2 Policy Choices: Expanded Coverage or Smaller Classes?As the first step in assessing those policy choices, Figure 7 summarizes in pictorial form the voluminous information on enrolments and STRs in Table 6 by converting both GER and STR to an index of change between 1970 and 2006. The grid lines inside the figure show the regional averages for change in GER (199 percent, i.e. an almost exact doubling from 1970 to 2006) and change in STR (in 2006 only 70 percent of the 1970 ratio).
Two developments are immediately obvious from Figure 7. First, there is a wide range of combinations of enrolment growth and STRs across the region. Second, despite the apparent lack of closely similar policy behaviour, it is striking that in the face of rapid secondary enrolment growth in most countries/territories, only the Philippines and Thailand increased their STR during the period since 1970. All other countries/territories represented in the figure found a way to finance substantial enrolment growth as well as the hiring of sufficient extra teachers to drive down the STR, reaching only 70 percent of its 1970 value on regional average.
Figure 7 is useful in collapsing the complex combination of countries/territories, time, GER and STR into an overall picture, but the format of percentage change does not take into account the different starting positions of the various countries/territories. Japan, for example, has had the slowest increase in secondary GER since 1970, but that is because its GER was already 87 percent in 1970. Thailand and Indonesia had the fastest rates of growth, but they both started from a low base.
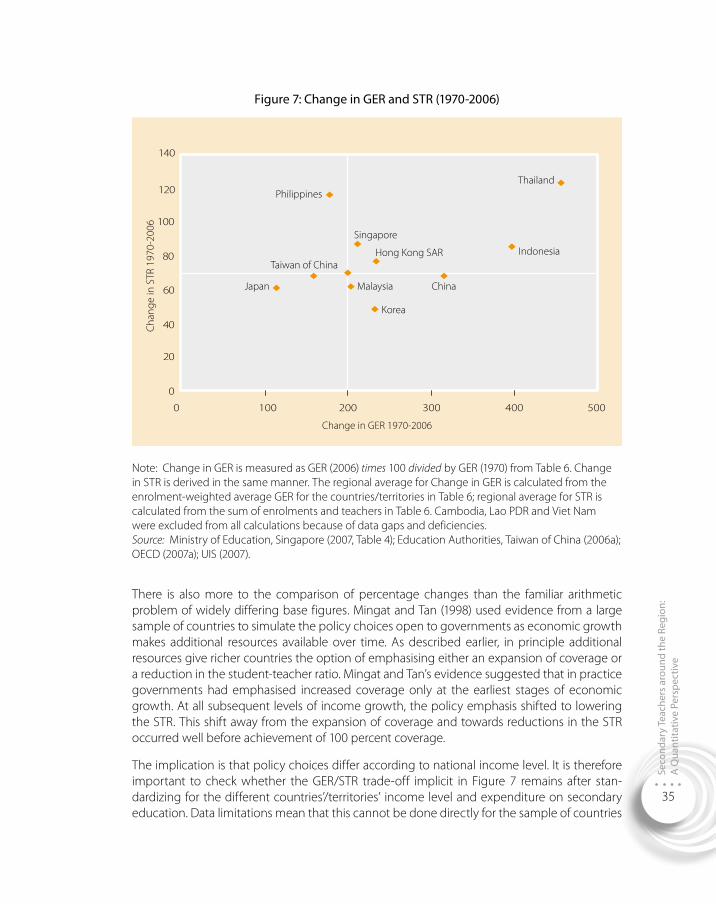
Seco
ndar
y Te
ache
rs a
roun
d th
e Re
gion
: A
Qua
ntita
tive
Pers
pect
ive
35
Figure 7: Change in GER and STR (1970-2006)
Japan
Taiwan of China
Philippines
Singapore
Hong Kong SAR
Thailand
Indonesia
ChinaMalaysia
Korea
120
140
100
80
60
40
20
0
1000 200 300
Change in GER 1970-2006
400 500
Chan
ge in
STR
197
0-20
06
Note: Change in GER is measured as GER (2006) times 100 divided by GER (1970) from Table 6. Change in STR is derived in the same manner. The regional average for Change in GER is calculated from the enrolment-weighted average GER for the countries/territories in Table 6; regional average for STR is calculated from the sum of enrolments and teachers in Table 6. Cambodia, Lao PDR and Viet Nam were excluded from all calculations because of data gaps and deficiencies. Source: Ministry of Education, Singapore (2007, Table 4); Education Authorities, Taiwan of China (2006a); OECD (2007a); UIS (2007).
There is also more to the comparison of percentage changes than the familiar arithmetic problem of widely differing base figures. Mingat and Tan (1998) used evidence from a large sample of countries to simulate the policy choices open to governments as economic growth makes additional resources available over time. As described earlier, in principle additional resources give richer countries the option of emphasising either an expansion of coverage or a reduction in the student-teacher ratio. Mingat and Tan’s evidence suggested that in practice governments had emphasised increased coverage only at the earliest stages of economic growth. At all subsequent levels of income growth, the policy emphasis shifted to lowering the STR. This shift away from the expansion of coverage and towards reductions in the STR occurred well before achievement of 100 percent coverage.
The implication is that policy choices differ according to national income level. It is therefore important to check whether the GER/STR trade-off implicit in Figure 7 remains after stan-dardizing for the different countries’/territories’ income level and expenditure on secondary education. Data limitations mean that this cannot be done directly for the sample of countries
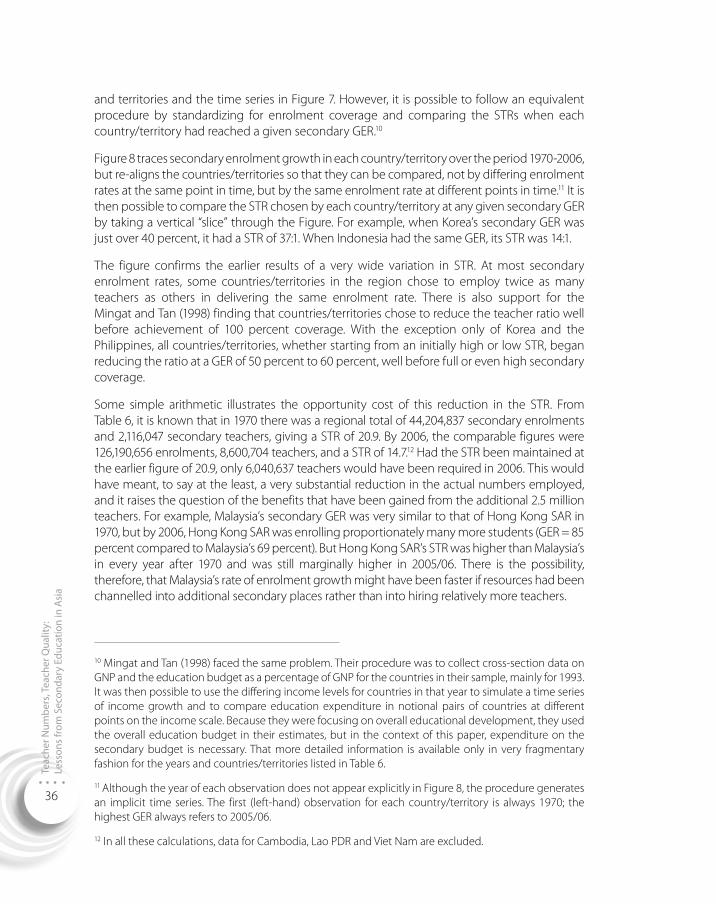
Teac
her N
umbe
rs, T
each
er Q
ualit
y:
Less
ons
from
Sec
onda
ry E
duca
tion
in A
sia
36
and territories and the time series in Figure 7. However, it is possible to follow an equivalent procedure by standardizing for enrolment coverage and comparing the STRs when each country/territory had reached a given secondary GER.10
Figure 8 traces secondary enrolment growth in each country/territory over the period 1970-2006, but re-aligns the countries/territories so that they can be compared, not by differing enrolment rates at the same point in time, but by the same enrolment rate at different points in time.11 It is then possible to compare the STR chosen by each country/territory at any given secondary GER by taking a vertical “slice” through the Figure. For example, when Korea’s secondary GER was just over 40 percent, it had a STR of 37:1. When Indonesia had the same GER, its STR was 14:1.
The figure confirms the earlier results of a very wide variation in STR. At most secondary enrolment rates, some countries/territories in the region chose to employ twice as many teachers as others in delivering the same enrolment rate. There is also support for the Mingat and Tan (1998) finding that countries/territories chose to reduce the teacher ratio well before achievement of 100 percent coverage. With the exception only of Korea and the Philippines, all countries/territories, whether starting from an initially high or low STR, began reducing the ratio at a GER of 50 percent to 60 percent, well before full or even high secondary coverage.
Some simple arithmetic illustrates the opportunity cost of this reduction in the STR. From Table 6, it is known that in 1970 there was a regional total of 44,204,837 secondary enrolments and 2,116,047 secondary teachers, giving a STR of 20.9. By 2006, the comparable figures were 126,190,656 enrolments, 8,600,704 teachers, and a STR of 14.7.12 Had the STR been maintained at the earlier figure of 20.9, only 6,040,637 teachers would have been required in 2006. This would have meant, to say at the least, a very substantial reduction in the actual numbers employed, and it raises the question of the benefits that have been gained from the additional 2.5 million teachers. For example, Malaysia’s secondary GER was very similar to that of Hong Kong SAR in 1970, but by 2006, Hong Kong SAR was enrolling proportionately many more students (GER = 85 percent compared to Malaysia’s 69 percent). But Hong Kong SAR’s STR was higher than Malaysia’s in every year after 1970 and was still marginally higher in 2005/06. There is the possibility, therefore, that Malaysia’s rate of enrolment growth might have been faster if resources had been channelled into additional secondary places rather than into hiring relatively more teachers.
10 Mingat and Tan (1998) faced the same problem. Their procedure was to collect cross-section data on GNP and the education budget as a percentage of GNP for the countries in their sample, mainly for 1993. It was then possible to use the differing income levels for countries in that year to simulate a time series of income growth and to compare education expenditure in notional pairs of countries at different points on the income scale. Because they were focusing on overall educational development, they used the overall education budget in their estimates, but in the context of this paper, expenditure on the secondary budget is necessary. That more detailed information is available only in very fragmentary fashion for the years and countries/territories listed in Table 6.
11 Although the year of each observation does not appear explicitly in Figure 8, the procedure generates an implicit time series. The first (left-hand) observation for each country/territory is always 1970; the highest GER always refers to 2005/06.
12 In all these calculations, data for Cambodia, Lao PDR and Viet Nam are excluded.
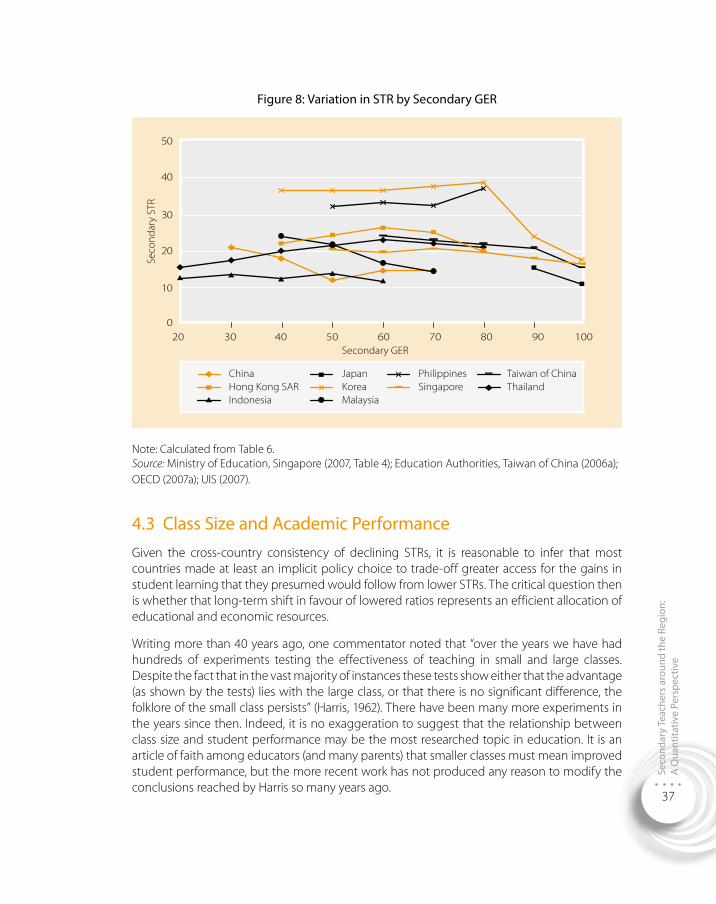
Seco
ndar
y Te
ache
rs a
roun
d th
e Re
gion
: A
Qua
ntita
tive
Pers
pect
ive
37
Figure 8: Variation in STR by Secondary GER
50
40
30
20
10
0
Seco
ndar
y ST
R
Secondary GER20 30 40 50 60 70 80 90 100
ChinaHong Kong SARIndonesia
JapanKoreaMalaysia
PhilippinesSingapore
Taiwan of ChinaThailand
Note: Calculated from Table 6. Source: Ministry of Education, Singapore (2007, Table 4); Education Authorities, Taiwan of China (2006a); OECD (2007a); UIS (2007).
4.3 Class Size and Academic PerformanceGiven the cross-country consistency of declining STRs, it is reasonable to infer that most countries made at least an implicit policy choice to trade-off greater access for the gains in student learning that they presumed would follow from lower STRs. The critical question then is whether that long-term shift in favour of lowered ratios represents an efficient allocation of educational and economic resources.
Writing more than 40 years ago, one commentator noted that “over the years we have had hundreds of experiments testing the effectiveness of teaching in small and large classes. Despite the fact that in the vast majority of instances these tests show either that the advantage (as shown by the tests) lies with the large class, or that there is no significant difference, the folklore of the small class persists” (Harris, 1962). There have been many more experiments in the years since then. Indeed, it is no exaggeration to suggest that the relationship between class size and student performance may be the most researched topic in education. It is an article of faith among educators (and many parents) that smaller classes must mean improved student performance, but the more recent work has not produced any reason to modify the conclusions reached by Harris so many years ago.
Teac
her N
umbe
rs, T
each
er Q
ualit
y:
Less
ons
from
Sec
onda
ry E
duca
tion
in A
sia
38
In a survey of factors affecting school quality, OECD (1989) concluded that little difference in achievement could be identified for class sizes between 15 and 40 pupils. Fifteen years later, OECD (2005) found no reason from the more recent evidence to modify its earlier judgement: “student learning is likely to benefit more from policies that focus on improving teacher quality by increasing average teacher salaries, rather than by using extra spending to reduce student-teacher ratios, at least within the range of student-teacher ratios typical of most OECD countries” (p. 65).13
While much of the evidence on class size comes from richer countries, evidence from developing countries supports the argument that learning can be improved, not weakened, by using fewer teachers where classes are small and reallocating the money saved to other items such as textbooks and libraries (Psacharopoulos and Woodhall, 1985; WB, 1995). In a compilation of the evidence for developing countries, Fuller (1987) found that only five out of 21 studies supported the idea that smaller class size improves student performance. Nabeshima (2003) used TIMSS achievement scores in a sample of Asian countries/territories identical to that in Figure 8 (plus the United States) to isolate the impact of various factors affecting student achievement. The major influences on student performance were characteristics associated with students themselves (innate abilities and home resources) and no consistent relationship between the performance of students and school resources in general and class size in particular could be identified with statistical reliability. Mingat and Tan (1998) also found statistically non-significant effects of class size on TIMSS results and concluded “that the cross-country data used in the present study support the claim that lowering the pupil-teacher ratios has few payoffs (if any) in student learning in the typical context of developing countries” (p. 38).14
13 A useful survey of the mostly American evidence can be found in Mishel and Rothstein (2002). The book largely takes the form of a “debate” between Hanushek, who has tallied many hundreds of research studies, and Krueger, who argues that the Hanushek method of “vote counting” does not give an appropriate weight to those studies which found a positive effect of smaller class size. In turn, Hanushek argues that reweighting the studies gives disproportionate emphasis to low-quality estimates. Prominent in their debate is Project STAR (Student Teacher Achievement Ratio), the best-known example of finding significantly enhanced achievement for children in smaller classes. STAR is endlessly cited in the research literature and there is no doubting the statistical validity of the STAR results. The problem is that the results have not been replicated in other settings. Reliance on a single and oft-quoted example weakens, rather than strengthens, any wider and more general argument about the benefits of smaller classes.
14 Mingat and Tan (1998) take a wider human capital perspective on class size, speculating that a strategy of wider coverage over lowering of the STR does not necessarily harm student learning in the long run. Reducing the STR implies slower progress in expanding educational coverage, meaning that tomorrow’s adults will be less well-educated. Given that adults’ educational attainment is a strong predictor of children’s school performance, the long run result is that slower progress in expanding coverage is likely to diminish student learning among tomorrow’s children. Educated parents provide more effective support for a child’s education, and in more literate societies children are exposed to many learning opportunities in daily living that reinforce what is taught in the classroom. Thus, as long as coverage is not yet universal, a more efficient strategy for educational development is to emphasize continued expansion of coverage rather than a rapid reduction in the STR.
Seco
ndar
y Te
ache
rs a
roun
d th
e Re
gion
: A
Qua
ntita
tive
Pers
pect
ive
39
Dominating Figure 8 is the case of Korea. Care has to be taken when inferring region-wide lessons from a single example, but Korea is the “elephant in the room”, the example that is simply too big to ignore. Korea maintained high STRs (37-38 students per teacher) throughout much of its secondary expansion; it maintained those high rates up to a secondary coverage (GER = 80 percent) much higher than any other country/territory in the region; and even after the very sharp decline in the 1990s, the STR is still higher (at around 18:1) than most other countries/territories in the regional sample. These high secondary STRs have proved no barrier to outstanding performance in the TIMSS and PISA tests of student achievement.15 These excellent results in large classes have also been achieved with a very small “tail” of low-performing students.
It is not suggested that Korea’s large classes have in themselves had any direct causal effect on its performance in international tests, nor that a simple bivariate comparison between class size and cognitive performance can disentangle the multiple student, school, home and social determinants of high academic outcomes. What is clear is that for much of Korea’s educational development since 1953 (primary as well as secondary) Korean students have been among the world’s top performers in international performance tests and this performance has come from classes that have been very large by the standards of both OECD member countries and Korea’s regional neighbours.
4.4 Is There a Shortage of Secondary Teachers?It can be readily acknowledged that in any country there will be particular circumstances that fully justify teaching this or that specific group of students in small classes. Nothing in the previous section denies that teaching smaller classes can often be more congenial for teachers and students, especially if large classes are synonymous with unpleasantly overcrowded classrooms that result more from a shortage of physical facilities than from any shortage of teachers. Nor can it be assumed that countries have necessarily made poor choices by favouring lower teacher ratios, since there may be structural features such as population distribution or multi-ethnic or multi-language issues that require an intensive usage of teachers. Nor, thirdly, does the lack of systematic evidence in favour of low teacher ratios deny that ratios may be unacceptably high in disadvantaged regions or between urban and rural areas within a given country. Secondary class sizes of up to 100 students in some districts of Laos speak for themselves; there is no doubting the shortage of teachers in specialized subjects such as English and IT in China’s central and western areas, or in Thailand’s poorer provinces; and the wide variety of subjects offered in Malaysia’s secondary curriculum has created shortages in specific subject teaching.
15 As emphasised by the Korean Case Study, it is also worth noting, when faced with the frequent allegation that Korea’s test results during the 1990s were evidence of nothing more than the drill-and-practice, rote memorisation and lower-level thinking only to be expected of large class instruction, that Korea was ranked first among all participating countries in the problem-solving tests of PISA 2003. A useful primer on Korean educational development – explaining its success in terms of balanced, sequential development, strong attention to equity of inputs and quality across public schools and between private and public schools, a substantial increase in government spending, and significant private participation – can be found in the WB (2005).
Teac
her N
umbe
rs, T
each
er Q
ualit
y:
Less
ons
from
Sec
onda
ry E
duca
tion
in A
sia
40
The Study on China notes that a critical policy factor which must be considered in assessing the adequacy of teacher numbers is the STR stipulated by the state. These stipulations on the authorized size of teacher numbers differ according to city, county and countryside. Variation of this sort does not suggest that pedagogical considerations about class size were a major factor in establishing the authorized STRs. Rather, the teacher ratio has been an administrative device, in central planning jargon, a norm that matched secondary enrolments with the output of the teachers’ colleges.
In the pre-1978 pre-reform era, this worked tolerably well. Teacher training was a “closed” system, with intake and enrolments determined by centrally planned targets. Revenues were allocated centrally and were highly redistributive, requiring richer provinces to remit large portions of revenues to the central government to finance transfers to poorer provinces. The hukou (household registration) system severely limited migration from rural to urban areas, so teacher mobility was low. In such circumstances, the student-teacher norm functioned quite well, matching available teachers with the finance to hire them, and doing so with reasonable equity between provinces.
During the reform period, the steady emergence of market forces eroded the former revenue-raising system, with secondary education coming to depend heavily on local financial capacity. With the breakdown of the household registration system, secondary teachers have, like so many millions of other rural dwellers, sought a better life in the industrial cities of eastern China. As noted above, there is no doubt that this has resulted in a shortage of teachers in specialized subjects in central and western areas of China. The problem is that it is very difficult to assess the significance of claims of an overall shortage in these areas.
Within China, the shortage is estimated by comparing the actual STR with the officially stipulated rate. The official STR for senior secondary school in the county category is 15.1, but the actual rate in 2004 was 18.65. With the baseline official ratio established on mainly administrative criteria, and the official ratio and the outcome both below the Asian regional average of 20:1, it is not clear that the numerical discrepancy amounts to a shortage of any pedagogical significance. However, the Study on China points out that average class size across the country now exceeds 55 students in both junior and senior secondary schools. These are large classes by any standard, but on the basis of teacher ratios, China appears to have sufficient secondary teachers, at least on a national average.
As the Study on China notes, the key to unravelling this substantial discrepancy, and the likely cause for oversize classrooms, is that China carried out a programme of school mergers and closures during the 1990s. In order to reduce educational expenditure in the wake of the financial reforms, many regions merged JSS and SSS. Two schools were squeezed into one, without any increase in the number of classrooms. This is not a problem that can be fixed by producing more teachers: it requires more classrooms so that the existing teachers can be used more effectively.
In Thailand, the progress made in access to secondary education over the last half century is impressive, but Thailand has not achieved its MDGs of universal lower secondary education by 2006 and seems unlikely to reach its target of universal upper secondary education by 2015. In 2006, the lower secondary enrolment rate was 87 percent and the upper secondary rate had reached 59 percent. There are concerns that the expansion of secondary enrolment has levelled out.
Seco
ndar
y Te
ache
rs a
roun
d th
e Re
gion
: A
Qua
ntita
tive
Pers
pect
ive
41
The estimates of secondary teacher shortage in Thailand are stunning in their magnitude. With some 208,000 secondary teachers in 2006, the shortage was estimated at more than 25,000, or well over 10 percent of those employed. The Thailand Case Study makes a persuasive argument that despite the generally favourable supply of teacher trainees, there are particular conditions leading to a shortage: the number of small schools, wide regional variations, an early retirement scheme that might be kindly described as too successful, and budgetary limits on recruiting new teachers are all factors in the alleged shortfall of teacher numbers. With these specific problems acknowledged, it remains the case that the overall shortage is based on the administrative criterion of a secondary STR of 20:1. With the actual national average hovering around 21-22 students per teacher, there is ample scope for some increase in the ratio.
The summary outcome is that in the face of tight budgetary limits Thailand confronts in classic fashion the trade-off between increased secondary coverage and lowering the teacher ratio. The Thai government provides school lunch, textbooks, uniforms and stationary to those in need, and nearly half of primary students receive such support. The proportion falls to only 20 percent at the lower secondary level and to 10 percent for upper secondary. It hardly needs to be added that some easing of the teacher ratio would release scarce funds that would promote better secondary coverage through increased support to those currently not enrolled.
The problem for policy is that even with such specific shortages acknowledged, the measured extent of those shortages is likely to be exacerbated by reducing the STR. It is also much more difficult to endorse the notion of a more widespread or generalized shortage of secondary teachers when that alleged shortage is predicated upon low STRs for which there is no consistent evidence in the international literature of any systematic payoff. In these circumstances, there is clearly a need not so much for a general reduction in STR, but for policies that specifically address the distribution of teachers in order to even up wide disparities between urban and rural areas or rich and poor provinces. Such policies include the development of funding formulae that take into account the socio-economic circumstance of schools in different areas, and the development of policies and incentives to attract sufficient teachers to remote or poor regions.16
During the 1970s and 1980s, Korea maintained high teacher ratios at both primary and secondary levels. Teacher ratios subsequently started to fall, and there is now a continuing programme of reduction in class size, with the Educational Condition Improvement Project (2002-2005) ushering in a 15-year timetable of class reduction until 2020. The principal motivation behind this policy is that of improving teachers’ working conditions, as there will also be a reduction in the instructional hours required of teachers and a shifting of non-teaching duties
16 The Case Study on Lao PDR makes it clear that even quite substantial financial incentives are not always sufficient to attract teachers to remote regions. The longer-term solution appears to lie in a highly localised approach to the problem – through training, recruiting and employing young people directly in their own districts – rather than trying to persuade those from distant regions or urban areas to move to culturally or socially unfamiliar regions. It is perhaps worth a reminder that problems of teacher shortage in remote regions are not confined to developing countries. Australia, for example, has faced persistent problems in attracting and retaining teachers in remote and rural areas. Most Australian states have developed a range of special incentives and teacher education programmes to familiarize students with teaching in the “outback”.
Teac
her N
umbe
rs, T
each
er Q
ualit
y:
Less
ons
from
Sec
onda
ry E
duca
tion
in A
sia
42
to an increased number of administrative staff. At the same time, it is also expected that improved work conditions will assist the quality of teaching. The paradox is that smaller classes and fewer hours of teaching by definition require additional teachers for a given enrolment. As the Korean Case Study notes, in the general case, it might be better to have one excellent teacher rather than two or three of lower quality.
The key to understanding this paradox is that in Korea “more” does not necessarily mean “worse”. Teaching has enjoyed high social esteem in Korea, and there is no shortage of high-calibre applicants for teacher training. But declining mortality and birth rates have reduced the size of the school age population, the government has not adjusted the intake into pre-service teacher courses, and teaching certificate graduates are being over-supplied. The result is that in recent years, barely 10 percent of applicants have received appointment as secondary school teachers.
While there is clearly a financial cost to such a policy, it has not been a serious constraint in a growing economy. In the short run, employing more teachers and reducing class size eases the problem of oversupply, but in the longer term, the trade-off between teacher numbers and average salary may call into question Korea’s long-standing practice of paying relatively high salaries to its teachers. That in turn raises the question of whether teacher quality can be maintained in the face of falling STRs and increased numbers. The difficult issue of the quality of secondary teachers is the subject of the next section.
Secondary Teachers around the Region: Qualifications and Quality
Section 5
43
5.1 Concerns about Teacher Quality in Asia It is hardly possible to read government policy documents or the research literature without becoming aware of concerns about secondary teacher quality in many Asian countries. In Cambodia, teaching continues to have a certain social status and the stability of the civil servant position is appreciated in a country with high poverty and unemployment rates. However, Duthilleul (2005) notes that prior to the Khmer Rouge era the best secondary students wanted to become teachers, whereas today the best students who can afford it prefer to enter law, medicine or business schools. It is only those who cannot afford it or who do not have the required qualifications for other programmes that are interested in becoming teachers.
Huang (2005) reports that in Viet Nam, candidates often apply to teacher training colleges as a second or third choice. Candidates often receive training for other fields simultaneously to widen their employment options. Many qualified graduates see a degree as a ticket to working in other jobs related to education in the private sector, but do not enter public school teaching. This is particularly serious at the current stage of secondary development in Viet Nam, as it tries to move away from a highly prescriptive teacher-centred approach. Teachers were unexpectedly asked to display and implement in the classroom, skills and competencies they were never taught themselves. While much of the evidence is anecdotal, it is clear that there is widespread concern about the quality and status of secondary teachers in Thailand (Atagi, 2008). In Malaysia, attracting high achieving candidates into teaching is an ongoing issue. As the economy expands and opportunities increase, high achieving candidates prefer other industries (Mokshein et al., 2008).
The common practice (not only in Asian countries) of harking back to a time when teaching was a high status job that attracted the best and brightest is not simply nostalgia for a lost golden age. It has its origins in the changing balance between the demand for, and supply of, educated people. Forty or 50 years ago, in the aftermath of the colonial era, the stocks of educated people were low. They constituted a small and highly selective group which found ready employment, predominantly in the post-colonial public sector and in teaching. Becoming a teacher was the natural outcome of high educational achievement. Teaching was an instrument of upward social mobility, and it was a sought-after profession of high social standing and relatively high pay.
Seco
ndar
y Te
ache
rs a
roun
d th
e Re
gion
: Q
ualif
icat
ions
and
Qua
lity
Teac
her N
umbe
rs, T
each
er Q
ualit
y:
Less
ons
from
Sec
onda
ry E
duca
tion
in A
sia
44
If we now fast-forward to contemporary times, many Asian countries have grown very rapidly, per capita incomes are high and the stock of educated labour has increased many times. Rapid economic growth has brought with it alternative and productive private sector job opportunities that did not exist 30 to 40 years ago. In these circumstances, we should hardly be surprised if teaching is no longer the automatic career of choice. In contemporary times, many students view teaching as a career of last resort because they cannot get into a more desirable position.
The quality of the teaching profession today should not be compared with conditions a generation or so ago when educated people were in short supply and teaching was a leading occupation. A more realistic viewpoint can be achieved through the lens of different supply and demand conditions. On the other hand, while the process of economic development helps us understand present day labour market realities for teachers, there is no economic “law” which condemns any country to a relative decline in the quality and status of its teaching workforce. As will be seen in this section, the most educationally successful of the Asian countries have taken deliberate steps to retain high selectivity and high standards for its teachers.
5.2 Teacher Quality: Does It Matter?At first glance, a question about the importance of teacher quality has a self-evident answer. Teachers have by far the biggest input into secondary education, and in any common sense explanation their role is critical. Most parents and educators would insist that teacher quality is one of the most important determinants of student outcomes. Parents will often go to great lengths to seek out schools with perceived good teaching, and highly motivated parents may even attempt to place their children in particular classrooms where they think the teacher is especially able.
The problem is that there are many influences on student achievement, and reliable evidence on the contribution of teachers has been very hard to find. There is solid evidence going back many years that the largest source of variation in student learning is attributable not to teachers nor even to schools, but to differences in students’ socio-economic background: their abilities, their family and their community, none of which is amenable to policy intervention in the short term.17 This pessimistic, not to say intimidating, conclusion for education policy has to be tempered by more recent research. Despite the overall influence of socio-economic background, there is unambiguous evidence of achievement differences between schools, differences that cannot be explained solely by the quality of the student intake.
17 The argument that academic performance is mainly determined by the intellectual and socio-economic characteristics of the students and to a much lesser extent by the characteristics of the schools goes back to James Coleman’s (1966) study Equality of Educational Opportunity in the United States. The latest PISA study (OECD, 2007b) identifies a number of school-based influences on student performance but then queries whether “specific policy interventions responding to these effects are likely to be overshadowed by the high number of other influences on student performance, whether in terms of the multiple aspects of the school learning environment and organization not covered by any given policy, or in terms of contextual influences including the socio-economic background of the students attending each school” (p. 277).
Seco
ndar
y Te
ache
rs a
roun
d th
e Re
gion
: Q
ualif
icat
ions
and
Qua
lity
45
The second problem is that the contribution of teachers to high student outcomes and the particular characteristics of “good teachers” have been even harder to identify. As Hanushek (2004) has noted:
By many accounts, the quality of teachers is the key element to improving student performance [but] the research evidence suggests that many of the policies that have been pursued have not been very productive. Pupil-teacher ratios and class size have fallen dramatically teacher experience has increased and teacher graduate degrees have grown steadily—but these have not translated into higher student achievement. (pp. 12-13)
Hanushek was specifically referring to the American experience, and indeed most of the empirical literature in this field is drawn from US data. In the Asian context, it is tempting to assess teacher quality in the framework of cultural factors such as the high regard for education and traditional Confucian respect for teachers. The approach of this section is that while the cultural context should be respected as a critical component of the overall story, the evidence suggests that similar policy interventions are effective in different school systems regardless of the cultural setting. The right policies to attract and retain quality teachers work well in all countries!
The problem lies in the identification of those policies, and the next section surveys what is known from international literature on the determinants of quality teachers. The evidence from Asian countries is then reviewed. The section concludes by returning to the theme of the trade-off between teacher numbers and teacher quality. In particular, an attempt is made to answer the question of whether teacher quality has been maintained in the face of increased numbers and falling teacher ratios in the Asian region.
5.3 International Evidence on Teacher QualityIn a seminal contribution to a difficult area, Rivkin, Hanushek and Kain (2005) used a particularly rich set of data for the state of Texas to identify teacher quality as one of the most important determinants of student outcomes. The idea behind the estimation is that where there are achievement gains across grades and cohorts of students within a school, but differences among individual students and the observable characteristics of the school (teacher turnover, class size, principal, curriculum, etc.) have been taken into account, then those achievement gains can reasonably be attributed to differences in teacher quality.

Teac
her N
umbe
rs, T
each
er Q
ualit
y:
Less
ons
from
Sec
onda
ry E
duca
tion
in A
sia
46
Their much-quoted conclusion is that the effect of “pure” teacher quality differences is large in Texas schools: “having…an 84th percentile teacher for five years in a row rather than a 50th percentile teacher would be sufficient to eliminate the average performance gap between poor kids (eligible for free or reduced school meals) and non-poor kids” (Hanushek and Rivkin, 2002, p. 7).18 19
Simply put, consistently having a high quality rather than merely average teacher can lead to students improving their rank position by enough to close the achievement gap between students from low-income and higher-income families.
These specific quantitative results are unlikely to hold in different school systems, but other work supports the main line of argument that students of the most effective teachers have learning gains substantially greater than students of lower quality teachers. Santiago (2002) provides a comprehensive literature review, and the summing up from McKinsey and Company (2007) is judicious: “Studies that take into account all of the available evidence on teacher effectiveness suggest that students placed with high-performing teachers will progress three times as fast as those with low performing teachers” (p. 7).
5.4 How Do We Produce Good Quality Teachers?If there is now reliable evidence that good teachers make a measurable and substantial difference to student performance, the obvious next step is to itemise the characteristics that distinguish high quality teachers from their less effective colleagues. That next step may seem obvious, but a vast body of research has found it extremely difficult to unravel the indicators of teacher quality. Despite the striking and much-quoted results showing the importance of teacher quality, there is nothing in the previously-cited work by Rivkin et al. (2001) which actually identifies the characteristics of good teachers. In their work, the improvement in student performance attributable to teacher quality is essentially residual. It is what is left over after all other measured effects have been accounted for. It is one thing to identify good teachers from their students’ high marks: what we really need to know for policy is not what happens after the event, but how we can predict, select and educate such teachers in the first place.
18 A major reason for the success of this study is the care taken by the authors to exclude what are known as problems of selectivity, or endogenously determined relationships which produce statistical bias. Because teachers and parents select schools, and students may be specifically matched with teachers in the classroom (perhaps through decisions by the principal acting on parental wishes), it is very difficult to distinguish the quality of the teacher from the quality of the students. Rivkin et al. (2001) substantially reduce this problem by concentrating on differences among teachers within a given school (to minimize the effects of parental choice of school) and by comparing grade level performance across different cohorts of students (to avoid effects from the matching of students to specific teachers). See also the discussion in Appendix 1 of the Lao PDR Case Study.
19 Percentile rank is a statistical ranking, such that all observations are listed in order between zero and 100. A teacher placed at the 84th percentile is in the top 16 percent of teacher effectiveness, with 84 percent of teachers having a lower ranking.
Seco
ndar
y Te
ache
rs a
roun
d th
e Re
gion
: Q
ualif
icat
ions
and
Qua
lity
47
In publications stretching back more than 20 years, Hanushek (1986; 1994; 1999; 2004) has been the principal protagonist in the argument that there is very little positive relationship between student performance and measured teacher characteristics such as the duration of their education, experience or salary.
An early investigation established the main thrust of the argument. Out of 106 studies on teacher qualifications and student performance, only six reported a statistically significant positive relationship (Hanushek, 1986). Nearly as many (five) showed a significant negative relationship, and 95 studies could produce no statistically robust effect at all. Of 109 studies measuring the impact of longer teacher experience, only 33 produced a positive and significant coefficient. There were more than twice as many (69) insignificant results. The 60 studies of teacher salary produced only nine significant results, with 50 being statistically insignificant. One study found that increased teacher salaries had a statistically significant negative impact on student performance.
This general lack of association between measured teacher characteristics and student outcomes is partly explained by the nature of statistical investigation. In a country like the United States, where virtually all teachers have been to college, there is simply too little variation to discern with statistical confidence the impact of small differences in their education. There may also be non-linear effects: for example, increased experience may be valuable in the early years but cease to have any measurable effect after, say, three to four years in the classroom. Other researchers have challenged the Hanushek results with further studies (OECD, 2005; Santiago, 2002 survey this literature) but it is fair to note that the conclusions drawn by Hanushek’s (1986) study, and reinforced through his subsequent work, have been broadly accepted. As Santiago (2002) notes with some understatement:
The empirical evidence on the role of observable characteristics of teachers on student performance is weaker than one might have expected. There is strong consensus around the idea that teacher quality is indeed extremely relevant for student achievement. However, far less consensus exists when it comes to define a good measure for teacher quality. (p. 79)
One explanation for that weaker than expected result is that researchers have not directed enough attention to the direct measurement of teacher quality: the teacher characteristics included in the statistical models have, out of data necessity, tested the effect of measurable characteristics such as teacher education, qualifications and experience. Few would deny that these commonly used indicators leave out important (and much harder to measure) factors such as the ability to convey ideas in clear ways, to be enthusiastic and creative, to engage the class actively in learning, and so on. It is an explanation that neatly bridges the gap between the evidence that the quality of teachers is a vital element in improving student performance and our research failure to measure the characteristics of teacher quality that really matter.
A further explanation may be the limited effectiveness of some programs of upgrading. Most countries offer a wide range of programmes of professional development or in-service training, but those programmes may not be closely attuned to improving the quality of instruction. There is no doubt that appropriate professional development is highly worthwhile. Even the best teachers need regular upgrading of skills and knowledge. In Singapore, for
Teac
her N
umbe
rs, T
each
er Q
ualit
y:
Less
ons
from
Sec
onda
ry E
duca
tion
in A
sia
48
example, teachers are provided with 100 hours of professional development every year, and it is development closely focused on improving classroom practice (McKinsey and Company, 2007).
By contrast, a background report on Korea prepared for OECD (2005) noted that “there is no compatibility between the preliminary education and in-service education both in theory and practice” (p.124). OECD concluded that the Korean experience was the more typical, describing professional development as often fragmented, unrelated to teaching practice, lacking in intensity and follow-up, and in many countries left to the discretion of the individual teacher to decide which professional development activities she or he wants to pursue.
There is yet a further and more profound explanation for the negative research findings, with policy implications that go far beyond the trite admonition that researchers must widen the range of variables they include in their tests. One reason for the persistent absence of statistically robust effects from the measured teacher characteristics is that such characteristics, as measured in the mostly American studies, may represent not statistical or data failure, but policy failure. That is to say, governments in many countries have concentrated on longer periods of pre-service education, raising teacher qualifications and worrying about teacher salaries, but these policies will not in themselves lead to adequate improvement in teacher quality.
This argument does not say that longer pre-service education, graduate degrees or upgraded certification are a waste of resources: it says that such factors will only have a measurable effect on school outcomes if there are also policies for selecting the right student teachers in the first place.20 The implication of this line of argument is that in many countries policies have concentrated on improving the measured aspects of teachers such as longer pre-service training, but this does not necessarily boost the quality of teachers when identified by performance of their students. The missing link is that you must get the right people to become teachers. This is crisply summarized in the words from McKinsey and Company (2007) that it is a fallacy to believe “that it is possible to make substantial long-term improvements to the school system without fundamentally raising the quality of people who enter the teaching profession” (p. 23).
This argument needs to be handled with some care so that it does not become merely a lament for a past era of high-quality teachers. It is also an argument which has been presented in compelling form (McKinsey and Company, 2007) by comparing policies for selecting teachers in high and low-performing school systems around the world. Using PISA results as the basis for delineating high- from low-performance countries, the comparison produced two critical findings:
20 Rivkin et al. (2001) found no evidence that having a Master’s degree in the USA improves teacher skills. By contrast, all general education teachers in Finland are required to complete a five-to-six-year course (equivalent to a Master’s degree) and this is seen as contributing to the profession’s high standing. The difference between the two outcomes is likely to result from the fact that in Finland, unlike the USA, the longer period of pre-service education builds upon a very high quality intake into teacher education.
Seco
ndar
y Te
ache
rs a
roun
d th
e Re
gion
: Q
ualif
icat
ions
and
Qua
lity
49
1. The top-performing school systems consistently attract more able people into the teaching profession by recruiting teachers from at least the top third of each cohort graduating from secondary school. In some cases, such as Finland, teachers are drawn from the top 10 percent. Some lower-performing school systems, as in parts of the United States, recruit teachers from the bottom third of high school students going to college.
2. Top-performing school systems have more effective methods of selecting people for teacher training. Lower-performing systems have generally easier or even open entry into teacher colleges, often leading to an oversupply of candidates. Many of those are there precisely because they had few other options. Conversely, top-performing systems select for entry, with an extensive system of screening, testing and selection before training. Enrolments are confined to those who have shown high ability, aptitude and motivation for teaching.
5.5 Teacher Quality in Asian CountriesOne of the key lessons to emerge from the international (albeit mostly American) research literature is the difficulty of measuring the characteristics that make up a quality teacher. It comes as no surprise to find a similar difficulty in the Asian region.
The standard proxy measure of quality used in developing countries is the proportion of quali fied teachers, but this indicator is today of very little value. In the aftermath of the colonial era, when trained teachers (especially in secondary school) were in very short supply, the proportion of trained teachers was a key educational indicator. Newly-independent govern ments gave much priority to teacher training and upgrading. During the 1960s and 1970s, the WB placed emphasis on teacher training facilities in its lending for education (Psacharo poulos and Woodhall, 1985). Since that time, the situation in the Asian region has been transformed.21 An active programme of upgrading has ensured that in much of the region virtually all secondary teachers have received a formal period of pre-service teacher training.
The high-income OECD member countries of Japan and Korea report that almost all their teachers are fully qualified (OECD, 2005). In Korea, out of 217,830 teachers in 2005, 217,699 or 99.94 percent held a teaching certificate. Malaysia has less than one percent of its secondary teachers in the contract or unqualified category (Mokshein et al., 2008). At the other end of the national income scale, Lao PDR and Viet Nam report that the proportion of qualified secondary teachers is 99 percent and 98 percent respectively. No story is more poignant than that of Cambodia, where it is estimated that 76 percent of teachers were killed during the Khmer Rouge regime and the education system had to re-establish itself after 1979 with volunteer teachers. Today, 95 percent of secondary teachers are considered qualified (Duthilleul, 2005).
21 Mulkeen, Chapman, De Jaeghere, and Leu (2007) note that there are still large numbers of unqualified teachers throughout Sub-Saharan Africa. In some countries, the bottleneck is not a lack of sufficient places or candidates for teacher education, but low recruitment into the teaching work force. In Uganda, for example, there is a large stock of trained teachers, but financial constraints have prevented qualified teachers from being recruited into teaching.
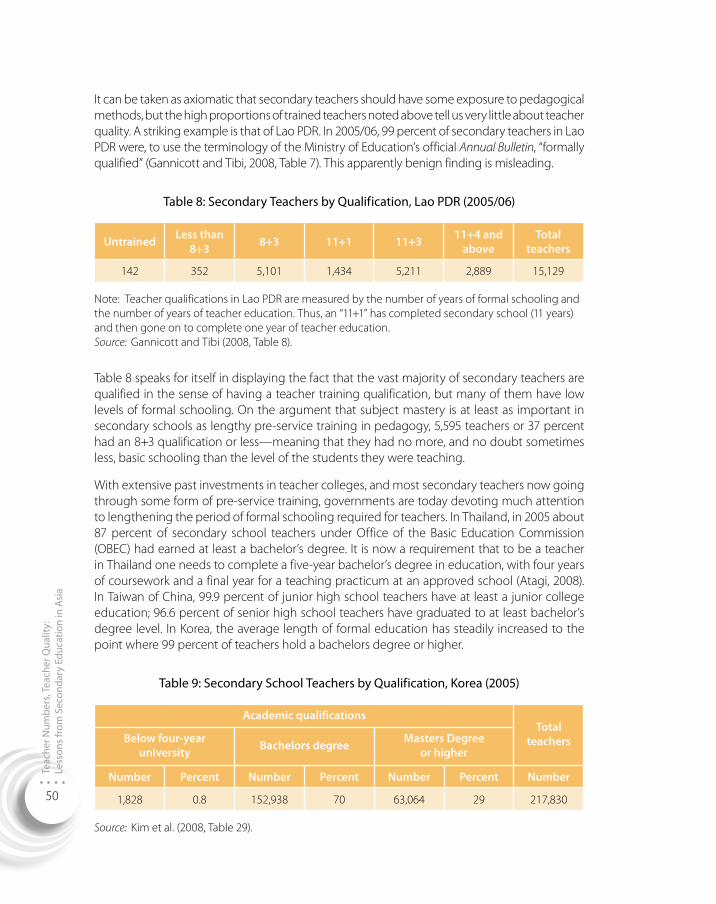
Teac
her N
umbe
rs, T
each
er Q
ualit
y:
Less
ons
from
Sec
onda
ry E
duca
tion
in A
sia
50
It can be taken as axiomatic that secondary teachers should have some exposure to pedagogical methods, but the high proportions of trained teachers noted above tell us very little about teacher quality. A striking example is that of Lao PDR. In 2005/06, 99 percent of secondary teachers in Lao PDR were, to use the terminology of the Ministry of Education’s official Annual Bulletin, “formally qualified” (Gannicott and Tibi, 2008, Table 7). This apparently benign finding is misleading.
Table 8: Secondary Teachers by Qualification, Lao PDR (2005/06)
Untrained Less than 8+3 8+3 11+1 11+3 11+4 and
aboveTotal
teachers
142 352 5,101 1,434 5,211 2,889 15,129
Note: Teacher qualifications in Lao PDR are measured by the number of years of formal schooling and the number of years of teacher education. Thus, an “11+1” has completed secondary school (11 years) and then gone on to complete one year of teacher education. Source: Gannicott and Tibi (2008, Table 8).
Table 8 speaks for itself in displaying the fact that the vast majority of secondary teachers are qualified in the sense of having a teacher training qualification, but many of them have low levels of formal schooling. On the argument that subject mastery is at least as important in secondary schools as lengthy pre-service training in pedagogy, 5,595 teachers or 37 percent had an 8+3 qualification or less—meaning that they had no more, and no doubt sometimes less, basic schooling than the level of the students they were teaching.
With extensive past investments in teacher colleges, and most secondary teachers now going through some form of pre-service training, governments are today devoting much attention to lengthening the period of formal schooling required for teachers. In Thailand, in 2005 about 87 percent of secondary school teachers under Office of the Basic Education Commission (OBEC) had earned at least a bachelor’s degree. It is now a requirement that to be a teacher in Thailand one needs to complete a five-year bachelor’s degree in education, with four years of coursework and a final year for a teaching practicum at an approved school (Atagi, 2008). In Taiwan of China, 99.9 percent of junior high school teachers have at least a junior college education; 96.6 percent of senior high school teachers have graduated to at least bachelor’s degree level. In Korea, the average length of formal education has steadily increased to the point where 99 percent of teachers hold a bachelors degree or higher.
Table 9: Secondary School Teachers by Qualification, Korea (2005)
Academic qualificationsTotal
teachersBelow four-year university Bachelors degree Masters Degree
or higher
Number Percent Number Percent Number Percent Number
1,828 0.8 152,938 70 63,064 29 217,830
Source: Kim et al. (2008, Table 29).
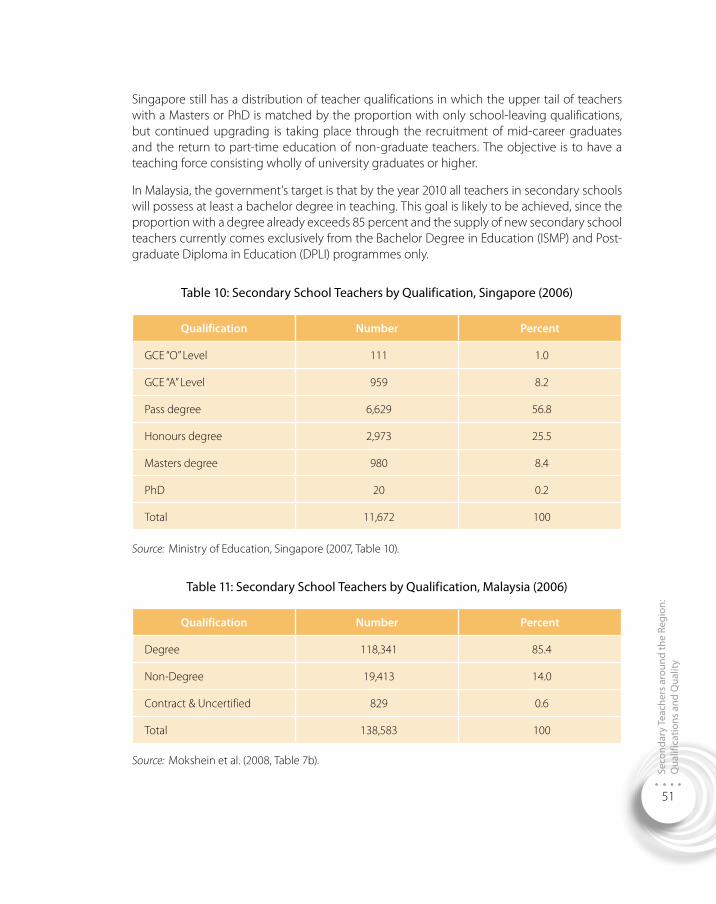
Seco
ndar
y Te
ache
rs a
roun
d th
e Re
gion
: Q
ualif
icat
ions
and
Qua
lity
51
Singapore still has a distribution of teacher qualifications in which the upper tail of teachers with a Masters or PhD is matched by the proportion with only school-leaving qualifications, but continued upgrading is taking place through the recruitment of mid-career graduates and the return to part-time education of non-graduate teachers. The objective is to have a teaching force consisting wholly of university graduates or higher.
In Malaysia, the government’s target is that by the year 2010 all teachers in secondary schools will possess at least a bachelor degree in teaching. This goal is likely to be achieved, since the proportion with a degree already exceeds 85 percent and the supply of new secondary school teachers currently comes exclusively from the Bachelor Degree in Education (ISMP) and Post-graduate Diploma in Education (DPLI) programmes only.
Table 10: Secondary School Teachers by Qualification, Singapore (2006)
Qualification Number Percent
GCE “O” Level 111 1.0
GCE “A” Level 959 8.2
Pass degree 6,629 56.8
Honours degree 2,973 25.5
Masters degree 980 8.4
PhD 20 0.2
Total 11,672 100
Source: Ministry of Education, Singapore (2007, Table 10).
Table 11: Secondary School Teachers by Qualification, Malaysia (2006)
Qualification Number Percent
Degree 118,341 85.4
Non-Degree 19,413 14.0
Contract & Uncertified 829 0.6
Total 138,583 100
Source: Mokshein et al. (2008, Table 7b).
Teac
her N
umbe
rs, T
each
er Q
ualit
y:
Less
ons
from
Sec
onda
ry E
duca
tion
in A
sia
52
The resources devoted to a policy of educational upgrading have not always paid off. In Indonesia, the quality of education has been a persistent concern. In TIMSS 2003, Indonesian students ranked 34th out of 45 countries; and in PISA 2003, Indonesia ranked last out of 40 countries. In the past, the government has tried to lift the quality of teaching and learning by raising the minimum academic qualification for teachers, but “with mixed results and…only limited success” (WB, 2007, p. 2). Following a new law introduced in 2005, it is hoped that raising the minimum academic qualification to four years of post-secondary education will this time be more successful. Teachers will also be required to obtain practical experience as a classroom teacher, and pass a certification examination that will examine proficiency in pedagogical, professional, personal and social skills before being certified as a teacher.
5.6 Much Upgrading, but is Teacher Quality Rising?In Asia, virtually all countries are doing well according to the measurable characteristics of length of education, period of pre-service training and certification which have featured so prominently in the mainly American research. Nearly all secondary teachers are formally qualified in the sense of having undertaken a period of pre-service teacher training. Even in those countries which have a distribution of higher and lesser-educated teachers, the average duration of formal schooling is in most cases very high (bachelors degree); and many countries have explicit policies of continuing to upgrade the educational level of their teachers. The case of Thailand is striking in seeking to ensure that all its secondary teachers become five-year trained.
It is not difficult to understand that countries such as Thailand and Indonesia, which have performed only modestly in TIMSS or PISA, should attach great weight to improving the quality of their teachers through longer educational requirements. The problem is that there is nothing in the international literature to suggest that such policies will achieve the desired result. As noted earlier in this section, the evidence from high versus low-performing education systems is that longer pre-service education, graduate degrees or upgraded certification will only have a measurable impact on school outcomes if there are also policies for selecting the right student teachers in the first place. Without that necessary foundation, elaborate and expensive programmes of upgrade are unlikely to boost the quality of teachers sufficiently to have a measurable impact on student performance.
McKinsey and Company (2007) identifies two critical elements in selecting the “right” student teachers. The first is to attract applicants from the top cohort graduating from secondary school, or from high-quality people making a mid-career move into teaching. The second is to limit enrolments in teacher training to those with genuine aptitude and motivation and to those numbers that will match supply with demand.
Among Asian countries the benchmark for success in these twin policies is set by Singapore. Singapore has implemented a unified selection process run jointly by the Ministry of Education and the principal teacher training body, the National Institute for Education. The selection process is summarized in Box 3.
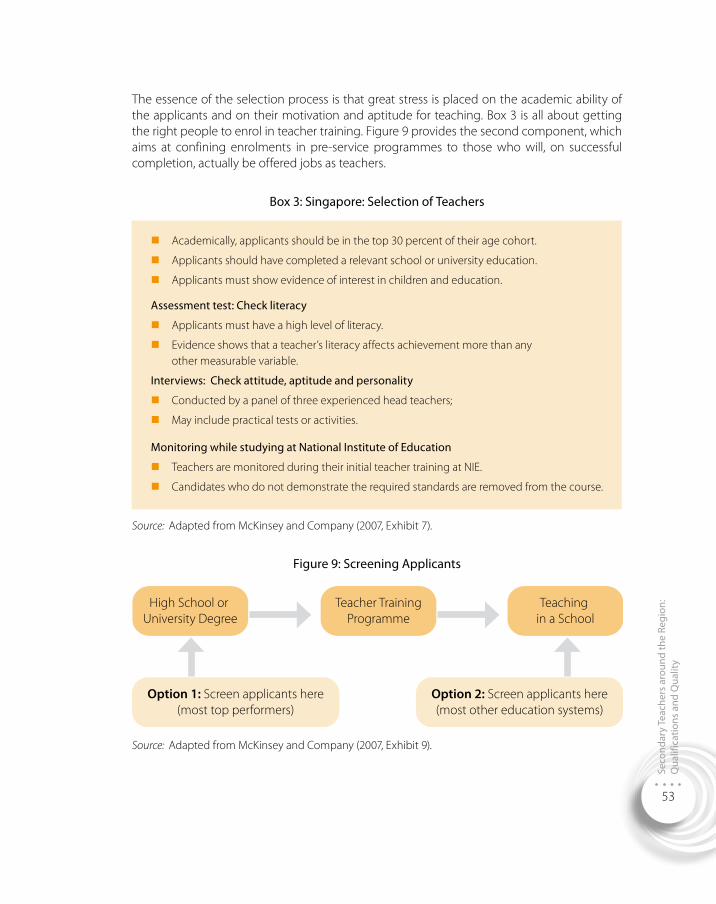
Seco
ndar
y Te
ache
rs a
roun
d th
e Re
gion
: Q
ualif
icat
ions
and
Qua
lity
53
The essence of the selection process is that great stress is placed on the academic ability of the applicants and on their motivation and aptitude for teaching. Box 3 is all about getting the right people to enrol in teacher training. Figure 9 provides the second component, which aims at confining enrolments in pre-service programmes to those who will, on successful completion, actually be offered jobs as teachers.
Box 3: Singapore: Selection of Teachers
nAcademically, applicants should be in the top 30 percent of their age cohort.
nApplicants should have completed a relevant school or university education.
nApplicants must show evidence of interest in children and education.
Assessment test: Check literacy
nApplicants must have a high level of literacy.
nEvidence shows that a teacher’s literacy affects achievement more than any other measurable variable.
Interviews: Check attitude, aptitude and personality
nConducted by a panel of three experienced head teachers;
nMay include practical tests or activities.
Monitoring while studying at National Institute of Education
nTeachers are monitored during their initial teacher training at NIE.
nCandidates who do not demonstrate the required standards are removed from the course.
Source: Adapted from McKinsey and Company (2007, Exhibit 7).
Figure 9: Screening Applicants
High School or University Degree
Teacher TrainingProgramme
Teaching in a School
Option 1: Screen applicants here(most top performers)
Option 2: Screen applicants here(most other education systems)
Source: Adapted from McKinsey and Company (2007, Exhibit 9).
Teac
her N
umbe
rs, T
each
er Q
ualit
y:
Less
ons
from
Sec
onda
ry E
duca
tion
in A
sia
54
Singapore follows Option 1, where applicants are screened, tested and selected (according to the criteria set out in Box 3) before enrolment in teachers’ college. At that point, they are formally employed by the ministry and paid a salary during their training. Of 100 applicants for teacher training in 2005, only 20 received offers of a place in teacher training. There were 18 acceptances, almost all of whom graduated and became teachers (McKinsey and Company, 2007).
The result in Singapore is a system which prepares undeniably high quality teachers who are able to contribute to high student achievement through the following characteristics:
nselective enough to be attractive to high-calibre applicants;
nteacher training is not available for those with few other options;
nbecause it trains no more student teachers than those required, Singapore can spend more per student on teacher training than systems with mass enrolments; and
nfeedback between student quality and course quality means that the quality of the courses is very high.
Until the mid-1990s, teacher education in Taiwan of China was very similar to the Singaporean system. Secondary school teachers were trained exclusively in single-purpose normal universities which recruited high-calibre high school graduates in limited numbers. Graduates from those institutions were guaranteed job placements by the government, and those graduates tended to take up teaching as their only career choice. The Teacher Education Act of 1994 opened up this system. Regular universities were allowed to establish teacher education programmes, recruiting both undergraduate and graduate students. Unlike graduates from the older normal universities, the new graduates have to compete for teaching jobs in an open market.
This more competitive system raises the possibility that teachers will be supplied in much greater numbers, perhaps attracting a lower quality intake of students who now have multiple career options. This does not appear to have happened. While Taiwan of China now has multiple sources of teacher supply, what has not changed is the extensive pre-enrolment screening and the acceptance of only a small number as teacher trainees from a large pool of academically able applicants (Fwu and Wang, 2002). A limited sample survey suggests that most of these students do not take education courses merely as a backup career choice; they decide to pursue a teaching career.
This result is consistent with the argument from McKinsey and Company (2007) that what matters is not the precise method of selecting candidates and controlling entry. Whatever the specific methods, the critical elements are rigorous selection of teacher trainees prior to their enrolment, together with control over trainee numbers to ensure that teacher training is attractive to, and limited to, high performers. These objectives can be achieved by direct control of entry with a single source of supply, as in Singapore, or by controlling places through funding, as in Taiwan of China. If governments limit the funding of teacher training places, universities will then implement appropriate selection procedures to ensure that the best applicants are selected.
Seco
ndar
y Te
ache
rs a
roun
d th
e Re
gion
: Q
ualif
icat
ions
and
Qua
lity
55
As noted earlier, Thailand has embarked on an ambitious programme of teacher upgrading, but it is not clear that this will have any measurable impact on its disappointing PISA and TIMSS results without a more radical overhaul of its pre-service arrangements. In 2007, there were 64 universities offering education programmes throughout the country, 40 of these being the faculties of education at the Rajabhat or “normal” universities. The exact statistics are not known, but it is estimated that there are approximately 15,000 teacher candidates graduating annually and an even larger backlog of graduates from previous years. There are, however, far fewer annual openings. For example, in 2004 there were about 120,000 applicants for 6,802 positions (Atagi, 2008).
It might be thought that such fierce competition is enough almost to guarantee the high quality of those fortunate enough to be offered a position, but the opposite is true. The explanation for this paradox lies in the critical distinction between Options 1 and 2 in Figure 9. Under Option 1, the severe competition is to gain entry into the training programme, with the consequence that only the very best are accepted and trained. Under the procedure followed in Thailand (Option 2), large numbers of students enrol, with little prior vetting of their aptitude and ability. The vast majority (19 in 20 on the 2004 figures) are unlikely to be employed as teachers. An over-supply on this scale makes it improbable that teacher training will attract high performers. Teacher training becomes an option for those with few other options. Even those few who are fortunate enough to gain a position after graduation come from a pool which has not been selected for teaching excellence.
McKinsey and Company (2007) notes that a similar phenomenon is starting to take place in Korea. For primary teaching, the requirements are very demanding. Applicants should be in the top five percent of their cohort in the National College Entrance exam and places are very limited so that the supply of graduates will meet the demand for primary teachers. The primary pre-service courses are therefore highly selective, of high status and high quality.
The system of training secondary teachers is different. As noted in the previous section, declining mortality and birth rates in Korea have reduced the size of the school-age population, but the government has not adjusted the intake into pre-service teacher courses, and secondary teaching certificate graduates are being over-supplied. Potential entrants into secondary teacher courses face fewer restrictions than primary teachers, with more than 350 providers competing for students. The result is a significant over-supply of those with secondary teacher qualifications. In recent years, barely 10 percent of applicants have received appointment as secondary school teachers. The large number of trainee secondary teachers drives down the status and attractiveness of secondary teaching, reducing its appeal for high performers. It should be emphasized that teaching at all levels in Korea remains a socially well-regarded profession, but it is interesting to speculate on the emerging parental dissatisfaction of recent years. Such dissatisfaction may well have its roots in a perceived decline in the quality of secondary teachers.
Teac
her N
umbe
rs, T
each
er Q
ualit
y:
Less
ons
from
Sec
onda
ry E
duca
tion
in A
sia
56
Can We Improve Quality by Paying Teachers More?
Section 6
A good salary is not necessarily the main or even a major motivation for a teaching career. There is ample research evidence to suggest that intrinsic reasons such as the enjoyment of working with children, the desire to teach, or making an educational contribution to society are more important factors in career choice for teachers than extrinsic factors such as job security, long holidays, or salary (see, for example, the country surveys quoted in OECD, 2005). It is for this reason that the previous section emphasized the fundamental foundation for attracting quality teachers: it is critically important to enrol in teacher colleges only those with high motivation, capability, and the aptitude to become teachers.
None of this means that teacher salaries are unimportant. Teaching is not the only profession for people who are academically capable and looking for a career which makes a contribution to society through helping others. Other careers offer strong competition to teaching, and teaching needs to be competitive in attracting talented people. Evidence that intrinsic factors are dominant does not deny that extrinsic issues such as pay and career prospects are important at the margin. That is to say, a competitive salary may be important for those deciding between teaching and professions which offer similar satisfaction, for those deciding whether to stay in teaching, for those existing teachers who leave for financial reasons despite their love for the work, and for those former teachers who want to return to teaching.
6.1 Measuring Teacher SalariesTo note that relative salaries for teachers are important is one thing: measuring them is quite another. Internationally comparative data has been very scarce and researchers have come up with ingenious methods of estimating average salaries from limited source data. Where teachers are employed as public servants, the statutory scale for their pay may be public knowledge, but calculating the overall average for teachers may be very difficult because a teacher’s position on the scale will vary according to qualifications and experience. The scale can be used to calculate average salaries only if the number of teachers at the different salary grades is known. Mingat (1998) used this method to pioneer the estimation of average teachers’ salaries in Lao PDR for the period up to 1996/97.
In the first cross-country compilation of teachers’ salaries in Asia, Tan and Mingat (1992; Mingat and Tan, 1998) exploited the fact that teacher salaries can sometimes be estimated without even the most basic information from the salary scale. In primary education, salaries typically account for the bulk of all spending. Spending per student is then made up of two
Can
We
Impr
ove
Qua
lity
by
Pay
ing
Teac
hers
Mor
e?
57
main components, the STR and average teacher salaries. Since expenditure per student and the teacher ratio are generally known, average teacher salaries can be approximated as the product of expenditure per student and the teacher ratio.
There can often be a substantial difference between statutory and actual salaries. UIS (2006c) reports that supplementary allowances and benefits (typically location allowances and housing) are prevalent in Cambodia, Indonesia, Lao PDR, Malaysia, Philippines and Thailand. In Indonesia, these benefits can account for up to 60 percent of a teacher’s income. In Lao PDR, regular teachers are paid on the public service salary scale, but there is a battery of supplementary allowances which can amount to 25 percent or more of total take-home pay. Some supplements, such as those for multi-grade teaching, are directly related to the teacher’s professional work. Other supplements are intended to encourage teaching in remote, mountainous, or especially difficult areas. Still others, such as those for wife or children, are related to the employee’s personal circumstances. Noonan (2004) used the 2001/02 allowances to calculate teacher earnings for a wide variety of teacher categories, such as being unqualified but teaching multi-grade classes, or being qualified and teaching in a remote district, and so on. In all, he calculated 30 worked examples, which gives some indication not just of how supplements can turn an outwardly simple statutory scale into very complex salary outcomes, but also of the considerable variation around the overall average salary.
Even if ways can be found to estimate teacher salaries within a given country, comparisons between countries raise further issues. It is now widely understood that cross-country comparisons are problematic because official exchange rates often fail to reflect true purchasing power. The earlier method of converting local currencies into a single standard, typically based on the US dollar at the market exchange rate, has given way to conversions based on purchasing power parity (PPP). Purchasing power parities are rates of currency conversion which eliminate differences in price levels between countries. When converted into US dollars at PPP rates, a given sum of money will buy the same basket of goods and services in all countries.
The second method of benchmarking teacher salaries for international comparisons (and often used in conjunction with PPPs) is to express salaries as a proportion of GDP per head. This method has its own disadvantages,22 but by comparing teacher salaries with average community incomes, it provides a readily understood indicator. It is also particularly useful in comparing salaries over time, because it reflects the path of teacher salaries relative to growth in GDP per head as countries develop.
22 Standardizing by GDP per head avoids problems associated with currency conversion and helps control for differences in the price of education inputs. It is appropriate for primary and secondary schooling, but less so for higher education because at that level some input such as equipment, and sometimes even teachers, are tradable. Their prices reflect the outcome of international, rather than local market forces, and relating them to a poor country’s low GNP per capita can produce misleading comparisons (Tan and Mingat, 1992).
Teac
her N
umbe
rs, T
each
er Q
ualit
y:
Less
ons
from
Sec
onda
ry E
duca
tion
in A
sia
58
The standard hypothesis is that teacher salaries will decline relative to GDP as countries get richer. Teachers are paid much more in richer countries, but teacher salaries in relation to GDP per head are generally higher in poorer countries. This argument has its origins in the changing balance between the demand for, and supply of, educated people, exactly the same development described in the previous section when discussing perceptions of declining teacher quality. The underlying economic logic is the same in both cases. In the case of salaries, the argument is that as countries develop and get richer, educated labour becomes more plentiful. When an input becomes more plentiful, it becomes relatively less costly and is used more widely. As argued in the previous section, trained and qualified teachers are today much more plentiful than when the stock of educated labour was low. They can be used more widely, as seen in the reduction in student-teacher ratios, and their earnings will tend to rise less rapidly than per capita gross national product (GNP).
The economic logic is straightforward, but the paucity of long-run data on relative earnings for teachers makes empirical evidence hard to find. OECD (2005) found that during the period from 1994 to 2002 inflation-adjusted statutory salaries of teachers rose in almost all the countries in their sample. Despite the increase in absolute terms, relative salaries fell. Lower secondary salaries relative to GDP per head fell in 14 of the 19 countries with relevant data. Pointing out that job opportunities for academically talented women outside of teaching have increased substantially, and that job opportunities have also broadened for well-educated males, OECD (2005) rightly asks: “whether, as countries develop and provide more alternative job opportunities for graduate labour, teaching will struggle to be attractive to well-qualified people” (p. 71).23
The OECD findings of declining relative salaries are consistent with this line of argument, but wider contributory issues need to be considered. The relative decline of teacher salaries has been partly associated with the growing feminisation of teaching. A second complication is that the period 1994-2002 is too short to exclude the impact of purely short-term fluctuations such as the re-appraisal of the public sector (with resulting lower public salaries) which took place in many developed countries during the 1990s.
A longer-term perspective comes from research work already cited in Section 4 Mingat and Tan (1998) used a large sample of countries, developing as well as developed, to simulate the policy choices open to governments as economic growth makes additional resources available over time. Although they had only cross-section data, it was possible to use the differing country income levels in a given year to simulate a time series of income growth and the associated changes in education expenditure.
23 Nickell and Quintini (2002) concluded that the decline in teachers’ relative salaries in the UK between the late 1970s and early 1990s was associated with a decline in the average academic quality of males entering teaching. Hanushek and Rivkin (2007) argue persuasively that in the US the wages of teachers relative to those of other college graduates have fallen steadily since 1940, but this has to be seen in relation to change in the quality of American teachers over that time. It is known that college students with low examination scores are more inclined to major in education and become primary or secondary teachers than those with the highest scores (Henke, Geis, and Giambattista, 1996), and it has been asserted that “we are now recruiting our teachers from the bottom third of high school students going to college” (McKinsey and Company, 2007, p. 19).
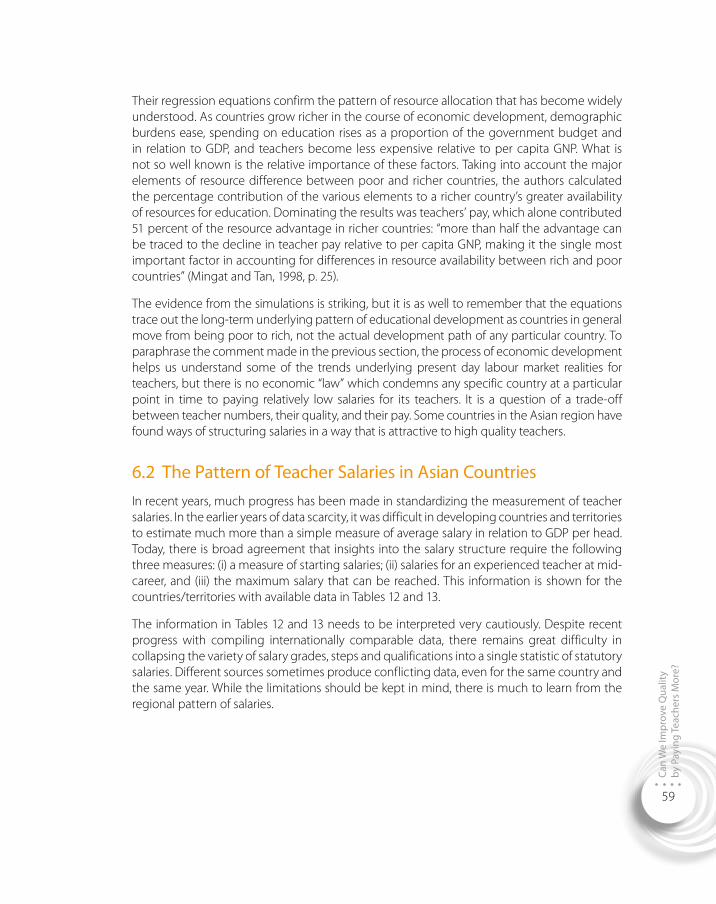
Can
We
Impr
ove
Qua
lity
by
Pay
ing
Teac
hers
Mor
e?
59
Their regression equations confirm the pattern of resource allocation that has become widely understood. As countries grow richer in the course of economic development, demographic burdens ease, spending on education rises as a proportion of the government budget and in relation to GDP, and teachers become less expensive relative to per capita GNP. What is not so well known is the relative importance of these factors. Taking into account the major elements of resource difference between poor and richer countries, the authors calculated the percentage contribution of the various elements to a richer country’s greater availability of resources for education. Dominating the results was teachers’ pay, which alone contributed 51 percent of the resource advantage in richer countries: “more than half the advantage can be traced to the decline in teacher pay relative to per capita GNP, making it the single most important factor in accounting for differences in resource availability between rich and poor countries” (Mingat and Tan, 1998, p. 25).
The evidence from the simulations is striking, but it is as well to remember that the equations trace out the long-term underlying pattern of educational development as countries in general move from being poor to rich, not the actual development path of any particular country. To paraphrase the comment made in the previous section, the process of economic development helps us understand some of the trends underlying present day labour market realities for teachers, but there is no economic “law” which condemns any specific country at a particular point in time to paying relatively low salaries for its teachers. It is a question of a trade-off between teacher numbers, their quality, and their pay. Some countries in the Asian region have found ways of structuring salaries in a way that is attractive to high quality teachers.
6.2 The Pattern of Teacher Salaries in Asian Countries In recent years, much progress has been made in standardizing the measurement of teacher salaries. In the earlier years of data scarcity, it was difficult in developing countries and territories to estimate much more than a simple measure of average salary in relation to GDP per head. Today, there is broad agreement that insights into the salary structure require the following three measures: (i) a measure of starting salaries; (ii) salaries for an experienced teacher at mid-career, and (iii) the maximum salary that can be reached. This information is shown for the countries/territories with available data in Tables 12 and 13.
The information in Tables 12 and 13 needs to be interpreted very cautiously. Despite recent progress with compiling internationally comparable data, there remains great difficulty in collapsing the variety of salary grades, steps and qualifications into a single statistic of statutory salaries. Different sources sometimes produce conflicting data, even for the same country and the same year. While the limitations should be kept in mind, there is much to learn from the regional pattern of salaries.
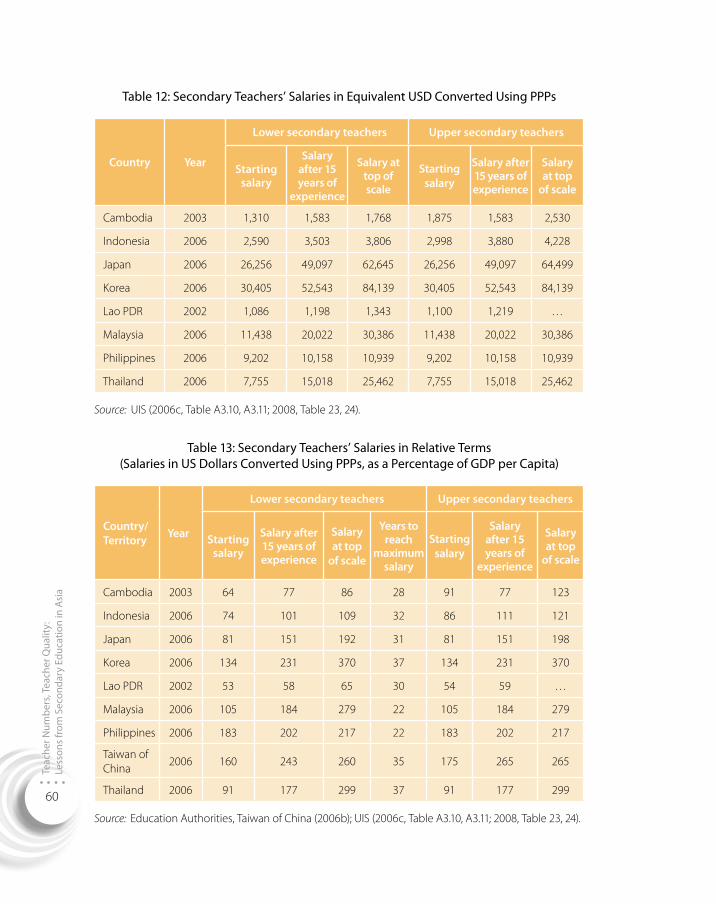
Teac
her N
umbe
rs, T
each
er Q
ualit
y:
Less
ons
from
Sec
onda
ry E
duca
tion
in A
sia
60
Table 12: Secondary Teachers’ Salaries in Equivalent USD Converted Using PPPs
Country Year
Lower secondary teachers Upper secondary teachers
Starting salary
Salary after 15 years of
experience
Salary at top of scale
Starting salary
Salary after 15 years of experience
Salary at top
of scale
Cambodia 2003 1,310 1,583 1,768 1,875 1,583 2,530
Indonesia 2006 2,590 3,503 3,806 2,998 3,880 4,228
Japan 2006 26,256 49,097 62,645 26,256 49,097 64,499
Korea 2006 30,405 52,543 84,139 30,405 52,543 84,139
Lao PDR 2002 1,086 1,198 1,343 1,100 1,219 …
Malaysia 2006 11,438 20,022 30,386 11,438 20,022 30,386
Philippines 2006 9,202 10,158 10,939 9,202 10,158 10,939
Thailand 2006 7,755 15,018 25,462 7,755 15,018 25,462
Source: UIS (2006c, Table A3.10, A3.11; 2008, Table 23, 24).
Table 13: Secondary Teachers’ Salaries in Relative Terms (Salaries in US Dollars Converted Using PPPs, as a Percentage of GDP per Capita)
Country/Territory Year
Lower secondary teachers Upper secondary teachers
Starting salary
Salary after 15 years of experience
Salary at top
of scale
Years to reach
maximumsalary
Starting salary
Salary after 15 years of
experience
Salary at top
of scale
Cambodia 2003 64 77 86 28 91 77 123
Indonesia 2006 74 101 109 32 86 111 121
Japan 2006 81 151 192 31 81 151 198
Korea 2006 134 231 370 37 134 231 370
Lao PDR 2002 53 58 65 30 54 59 …
Malaysia 2006 105 184 279 22 105 184 279
Philippines 2006 183 202 217 22 183 202 217
Taiwan of China
2006 160 243 260 35 175 265 265
Thailand 2006 91 177 299 37 91 177 299
Source: Education Authorities, Taiwan of China (2006b); UIS (2006c, Table A3.10, A3.11; 2008, Table 23, 24).
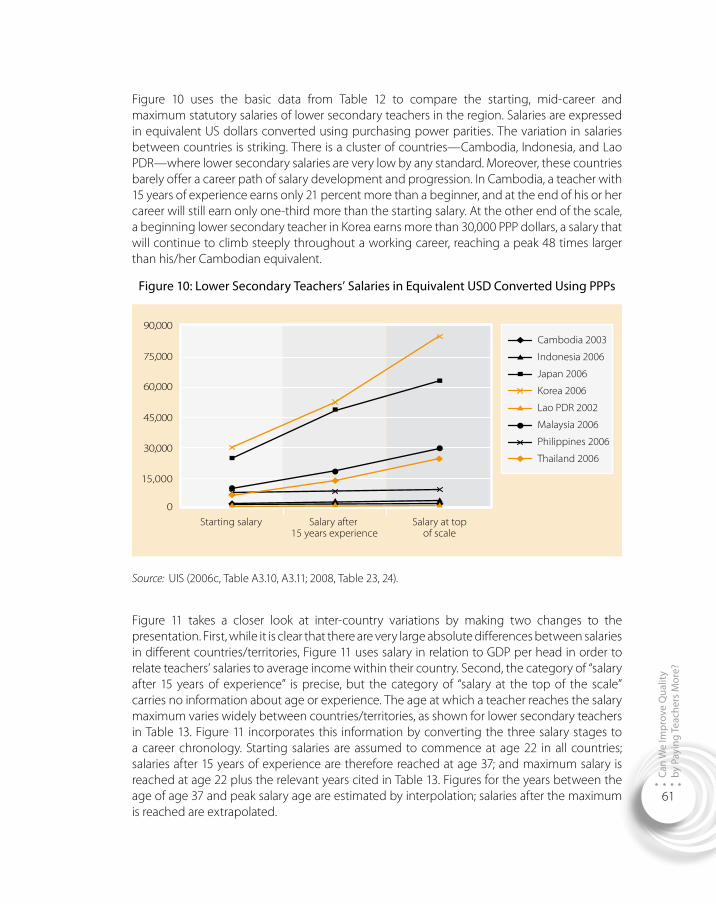
Can
We
Impr
ove
Qua
lity
by
Pay
ing
Teac
hers
Mor
e?
61
Figure 10 uses the basic data from Table 12 to compare the starting, mid-career and maximum statutory salaries of lower secondary teachers in the region. Salaries are expressed in equivalent US dollars converted using purchasing power parities. The variation in salaries between countries is striking. There is a cluster of countries—Cambodia, Indonesia, and Lao PDR—where lower secondary salaries are very low by any standard. Moreover, these countries barely offer a career path of salary development and progression. In Cambodia, a teacher with 15 years of experience earns only 21 percent more than a beginner, and at the end of his or her career will still earn only one-third more than the starting salary. At the other end of the scale, a beginning lower secondary teacher in Korea earns more than 30,000 PPP dollars, a salary that will continue to climb steeply throughout a working career, reaching a peak 48 times larger than his/her Cambodian equivalent.
Figure 10: Lower Secondary Teachers’ Salaries in Equivalent USD Converted Using PPPs
Cambodia 2003
Indonesia 2006
Japan 2006
Korea 2006
Lao PDR 2002
Malaysia 2006
Philippines 2006
Thailand 2006
45,000
60,000
75,000
90,000
30,000
15,000
0Starting salary Salary after
15 years experienceSalary at top
of scale
Source: UIS (2006c, Table A3.10, A3.11; 2008, Table 23, 24).
Figure 11 takes a closer look at inter-country variations by making two changes to the presentation. First, while it is clear that there are very large absolute differences between salaries in different countries/territories, Figure 11 uses salary in relation to GDP per head in order to relate teachers’ salaries to average income within their country. Second, the category of “salary after 15 years of experience” is precise, but the category of “salary at the top of the scale” carries no information about age or experience. The age at which a teacher reaches the salary maximum varies widely between countries/territories, as shown for lower secondary teachers in Table 13. Figure 11 incorporates this information by converting the three salary stages to a career chronology. Starting salaries are assumed to commence at age 22 in all countries; salaries after 15 years of experience are therefore reached at age 37; and maximum salary is reached at age 22 plus the relevant years cited in Table 13. Figures for the years between the age of age 37 and peak salary age are estimated by interpolation; salaries after the maximum is reached are extrapolated.
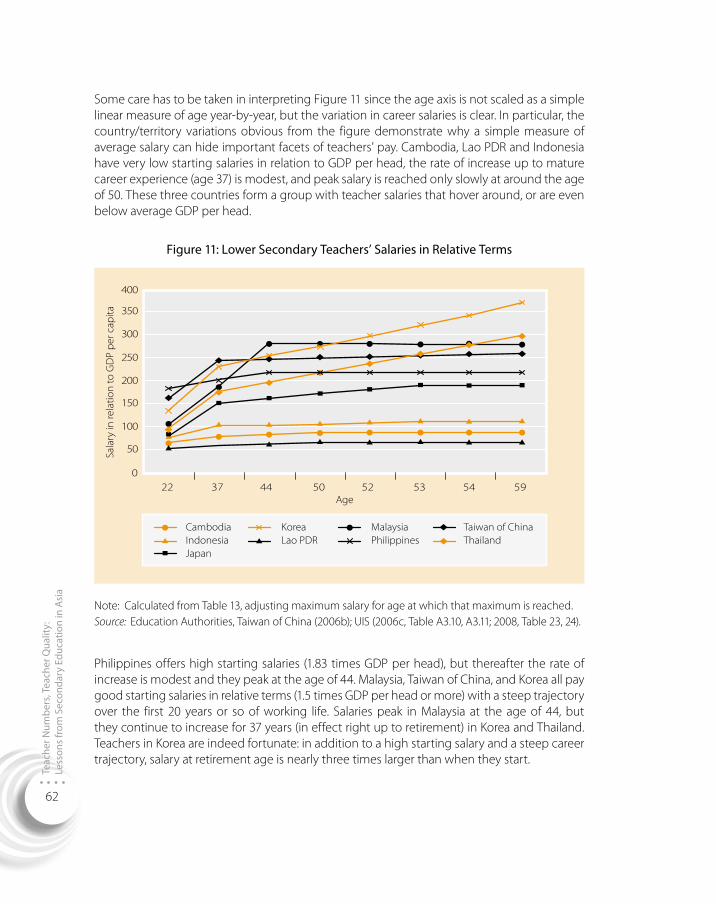
Teac
her N
umbe
rs, T
each
er Q
ualit
y:
Less
ons
from
Sec
onda
ry E
duca
tion
in A
sia
62
Some care has to be taken in interpreting Figure 11 since the age axis is not scaled as a simple linear measure of age year-by-year, but the variation in career salaries is clear. In particular, the country/territory variations obvious from the figure demonstrate why a simple measure of average salary can hide important facets of teachers’ pay. Cambodia, Lao PDR and Indonesia have very low starting salaries in relation to GDP per head, the rate of increase up to mature career experience (age 37) is modest, and peak salary is reached only slowly at around the age of 50. These three countries form a group with teacher salaries that hover around, or are even below average GDP per head.
Figure 11: Lower Secondary Teachers’ Salaries in Relative Terms
CambodiaIndonesiaJapan
KoreaLao PDR
MalaysiaPhilippines
Taiwan of ChinaThailand
200
250
300
350
400
150
100
50
0
Sala
ry in
rela
tion
to G
DP
per c
apita
Age22 37 44 50 52 53 54 59
Note: Calculated from Table 13, adjusting maximum salary for age at which that maximum is reached. Source: Education Authorities, Taiwan of China (2006b); UIS (2006c, Table A3.10, A3.11; 2008, Table 23, 24).
Philippines offers high starting salaries (1.83 times GDP per head), but thereafter the rate of increase is modest and they peak at the age of 44. Malaysia, Taiwan of China, and Korea all pay good starting salaries in relative terms (1.5 times GDP per head or more) with a steep trajectory over the first 20 years or so of working life. Salaries peak in Malaysia at the age of 44, but they continue to increase for 37 years (in effect right up to retirement) in Korea and Thailand. Teachers in Korea are indeed fortunate: in addition to a high starting salary and a steep career trajectory, salary at retirement age is nearly three times larger than when they start.
Can
We
Impr
ove
Qua
lity
by
Pay
ing
Teac
hers
Mor
e?
63
6.3 Salary Variations within the Region: What Differences are Important?
There is such a wide range of salary behaviour among Asian countries that it is tempting simply to characterise the differences as the outcome of country-specific cultural or historical developments. Without totally discounting such factors, the policy differences should not be under-estimated. In any country, the effect of salaries is different at different stages of a teaching career. Raising teachers’ salaries right across the scale may not achieve the main policy objective. There is international evidence that where starting salaries are low, even a small increase in salary relative to other occupations will encourage a strong increase in the supply of teachers. Teacher supply, to use the technical term, is very elastic at low salary levels. Where starting salaries are high, teacher supply is much less elastic: a proportionately much greater salary increase is required to produce a given supply increase. A salary trajectory which starts high and peaks early may attract those who wish to try teaching for a short time rather than making it a lifetime career. Conversely, attrition and turnover of experienced teachers may be a problem where salaries climb at a satisfactory rate until the 15-year experience mark but effectively plateau thereafter.
It follows that the suitability of a salary scale in a particular country has to be judged against the problem at hand: attracting more beginning teachers requires a different salary solution from retaining experienced teachers. Despite these complex considerations within and between countries, recent findings cut through the complexities to argue that the critical priority is to get the right starting salaries. There is, first, the obvious point that if new teachers of the right quality are not attracted into teaching in the right numbers then arguments about mid-career salaries become a second-order issue. Second, despite the importance of intrinsic factors in choosing teaching as a career, there is clear evidence from OECD countries that teacher supply is responsive to relative salary levels: the more teachers earn relative to other graduate occupations, the greater the supply of people who wish to become teachers although, as noted above, the elasticity of response diminishes (OECD, 2005). Third, building upon their work comparing policies for selecting teachers in high and low-performing school systems around the world, McKinsey and Company (2007) found that the “essential ingredient for getting the right people to become teachers is to provide good starting pay” (p. 20).
They found that 10 out of the 11 top-performing systems they benchmarked (Hong Kong SAR, Japan, Singapore and Korea were the Asian members of this elite group) shared a key salary policy. It is not necessary to pay starting salaries that are substantially higher than those for other comparable occupations; it is not essential to worry about the entire salary progression over a working life; nor is it necessary to have a large differential between starting and maximum salary. The critical characteristic shared by the high-performing school systems was front-loading the salary system. That is to say, it is important to pay starting salaries which are fully comparable with alternative professions in the private and public sectors, and which have a decent rate of salary increments in the very early years. Front-loaded compensation works because good performers are attracted by good starting salaries. Salary progression in later years is less important in the decision to become a teacher than the starting salary. Since teacher retention is generally not correlated strongly with salary progression, teachers committed to the job will stay even if mid-career salaries are not as attractive as elsewhere.
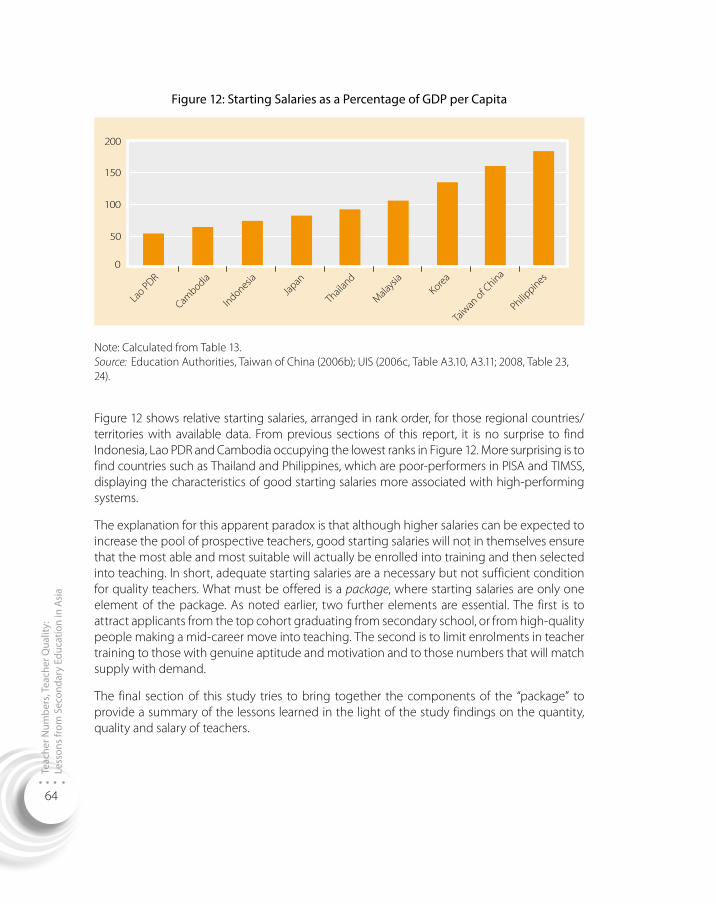
Teac
her N
umbe
rs, T
each
er Q
ualit
y:
Less
ons
from
Sec
onda
ry E
duca
tion
in A
sia
64
Figure 12: Starting Salaries as a Percentage of GDP per Capita
200
150
100
50
0
Lao PDR
Cambodia
IndonesiaJap
an
Thail
and
Malaysi
aKorea
Taiw
an of C
hina
Philippines
Note: Calculated from Table 13. Source: Education Authorities, Taiwan of China (2006b); UIS (2006c, Table A3.10, A3.11; 2008, Table 23, 24).
Figure 12 shows relative starting salaries, arranged in rank order, for those regional countries/territories with available data. From previous sections of this report, it is no surprise to find Indonesia, Lao PDR and Cambodia occupying the lowest ranks in Figure 12. More surprising is to find countries such as Thailand and Philippines, which are poor-performers in PISA and TIMSS, displaying the characteristics of good starting salaries more associated with high-performing systems.
The explanation for this apparent paradox is that although higher salaries can be expected to increase the pool of prospective teachers, good starting salaries will not in themselves ensure that the most able and most suitable will actually be enrolled into training and then selected into teaching. In short, adequate starting salaries are a necessary but not sufficient condition for quality teachers. What must be offered is a package, where starting salaries are only one element of the package. As noted earlier, two further elements are essential. The first is to attract applicants from the top cohort graduating from secondary school, or from high-quality people making a mid-career move into teaching. The second is to limit enrolments in teacher training to those with genuine aptitude and motivation and to those numbers that will match supply with demand.
The final section of this study tries to bring together the components of the “package” to provide a summary of the lessons learned in the light of the study findings on the quantity, quality and salary of teachers.
Key
Issu
es a
nd L
esso
ns L
earn
ed
65
Key Issues and Lessons LearnedSection 7
This final section brings together some of the major findings from the regional comparative analysis and the Case Studies. No attempt is made to repeat in detail the specific findings from each section, but we review the main issues that have arisen from the international experience and discuss the lessons to be learned when framing policies for secondary teachers. To get ahead of the story, it is almost possible to describe the lessons learned from this study as a series of cautionary warnings: reduced student-teacher ratios have their place, but not as a policy right across the board; a focus on teacher upgrading may not be effective in raising teacher quality without a package of complementary policies, especially for the more effective selection of trainee teachers; don’t allow open entry to teacher faculties; and while competitive starting salaries are vital, it is not necessary to pay teachers much more than other comparable professions. Before turning to these (albeit negative) lessons, we attempt to develop a broad context for specific policies by looking at future prospects for teacher numbers.
7.1 A Benign Outlook for Teacher Numbers Lesson 1: Projections of secondary teacher numbers for the next 10 to 15 years suggest a reasonably favourable outlook in the countries under review.
A feature of all the Case Studies was an attempt to project future numbers of secondary teachers. It is a strikingly consistent result from five disparate countries that there is no cause for alarm about the overall outlook for teacher numbers in the countries under review.
In the example of Korea, the Case Study projected the demand for secondary teachers up to 2020, taking into account the population decrease of school age children and policy decisions to reduce the number of students per class, the instructional hours of teachers and the implementation of school-off on Saturdays. The net result is that the projected number of secondary school teachers will be lowest in 2019, at 206,859. This is some 14,500 down from the number of secondary school teachers (220,246) in 2005, a yearly decrease of about 1,000 teachers. After adjusting the supply side for retirements, the estimated number of teachers to be hired each year until 2020 is an average of 1,750. This is vastly lower than the number of potential secondary teachers certified in 2006 (36,387) and well below the number of new teachers actually hired in that year (5,546). Even allowing for the substantial margin of error of such long-term projections, the conclusion has to be that secondary teachers in Korea are being chronically oversupplied.
Teac
her N
umbe
rs, T
each
er Q
ualit
y:
Less
ons
from
Sec
onda
ry E
duca
tion
in A
sia
66
China is already past the demographic bulge of junior secondary enrolments and participation in JSS is high. This means that the main thrust of teacher demand will come from the bulge in the senior secondary age group and the anticipated increase in SSS participation rates. In addition, policy plans for reductions in the STR and improvements in the urban/rural disparity (for both JSS and SSS teachers) will influence the future demand for teachers. The net effect of the arithmetic is that even with the policy changes the number of secondary teachers is projected to decline. Junior secondary teachers will decline from 3.5 million in 2004 to 3.3 million in 2020. For SSS, the Study anticipates that teacher numbers will decline from 1.19 million in 2004 to 1.17 million in 2020, via a “blip” of 1.5 million in 2010.
A broadly similar story of adequate numbers of potential secondary teachers is told in the Lao PDR Case Study. Despite constant worries about shortage, the 10-year projection suggests that the annual supply of qualified teachers will exceed projected annual requirements. While it was not possible to estimate the detailed annual supply of qualified 11+5 upper secondary teachers, the practical reality is that many 11+3 graduates will continue to be hired for upper secondary teaching. It then becomes apparent that the projected supply of new 11+3 teachers is not only sufficient for lower secondary school: in most years it is also adequate to cover requirements for upper secondary. While there is the usual uncertainty about these projections, the major implication for Lao PDR is clear. The problem is not one of insufficient students enrolling in 11+3 programs; the problem is one of encouraging sufficient numbers of those graduates to take up teaching as a profession.
In Malaysia, future demand for teachers depends mainly on replacement demand together with the effect of policies such as improvements in the formula for teacher allocation and reduction in class size. Reporting the results of a projection made by the Ministry of Education, the Case Study notes that the number of lower and upper secondary teachers will increase from 136,598 in 2005 to 164,027 in 2015. This is equivalent to an additional requirement of some 2,700 teachers per year. With 4,590 Bachelor in Education places reserved in all public universities involved in teacher training, together with an annual intake of some 2,000 students for the Post-graduate Diploma in Education there is little danger of Malaysia facing an overall national shortage of secondary teachers.
As the Thailand Case Study notes, reaching the goal of universal secondary enrolment will require additional teachers, and the current estimated shortage of 44,000 also needs to be overcome. Putting these numbers together implies a hiring requirement of 121,545 teachers over the years to 2020.
This is an apparently formidable total, but Thailand has a large pool of unused teachers and each year is graduating approximately 15,000 teachers from 64 faculties of education. On national average Thailand is not, and will not be, short of potential secondary teachers. The problem will be fixing the policies (the under-funding of secondary school relative to other education sectors, the downsizing policy, the early retirement scheme, the limitations of the personnel management system, and the absence of projection and coordination mechanisms) that will lead to the employment of the necessary teachers.
Key
Issu
es a
nd L
esso
ns L
earn
ed
67
7.2 Benign Overall Outlook, but there are Genuine ShortagesLesson 2: There is evidence in the Case Studies, much of it anecdotal but too pervasive to ignore, that the benign national story often conceals a severe problem of teacher shortage in remote, rural or predominantly ethnic areas.
The benign projections outlined above tell us much about the large number of students now making their way through the secondary and tertiary systems of the studied countries. In all countries covered by the Study, the overall availability of qualified secondary teachers seems sufficient in the years ahead, but they are results which do not justify any complacency about “mission accomplished”. A wide range of subject specializations or the ineffective distribution of teachers within a country can limit the lessons to be drawn from teacher projections at the national level.
Quantitative evidence from the Case Studies is not strong, but typically there are shortages of specialized teachers in IT, mathematics and science, or English. China, Lao PDR and Thailand are all characterized by such shortages. In China, shortages in the poorer western provinces result mostly from the drift of highly qualified people with specialized skills to the industrial eastern areas, plus the lower levels of funding available in the remote west. In Lao PDR, explanatory factors are the breakdown of the quota (that is, teacher allocation) system, together with the sheer difficulty of providing staff for a full range of specialized technical subjects in remote districts. Some of these districts are inaccessible during the rainy season and may have a majority of students who are more comfortable in the local dialect than in the national language spoken by most teachers.
There is, in short, no strong evidence of a shortage of secondary teachers on national average, but there is often an ineffective distribution of teachers within a country. Such an outcome is not confined to the countries of Asia. As OECD (2005) and WB (2005) have made clear in recent studies, regional disparities within countries, usually of teachers with specialized technical skills, are commonplace in both developed and developing countries. The difficulty lies not in identifying the problem but in finding a policy solution. Many governments have devoted considerable effort to identifying pecuniary and non-pecuniary incentives that will encourage qualified teachers to move to remote districts.
Lesson 3: There may be only a limited role for policies which subsidize teachers to move to remote regions.
There is a place for policies which offer incentives of salary, subsidy, advanced promotion, or preferential posting after a remote assignment. In some cases, there may be scope for compulsion, in which newly-graduated teachers are required to teach in a remote location for, say, two to three years as a means of repaying the public cost of their training. While there may be a limited role for such policies, it has been shown convincingly in the Lao PDR context (Noonan and Xaiyasensouk, 2007) that there is no evidence to suggest that a range of salary supplements or subsidies has been successful in attracting teachers to remote areas. The fundamental reason is that such supplements provide an extrinsic motivation that may have a short-term impact, but which do not really get to grips with the intrinsic personal motivations for teaching, especially in a remote area.
Teac
her N
umbe
rs, T
each
er Q
ualit
y:
Less
ons
from
Sec
onda
ry E
duca
tion
in A
sia
68
Lesson 4: The most effective policies are likely to be those which adopt a highly localized approach to the problem of remote or rural shortage.
Even marginal improvements brought about by extrinsic factors are not to be dismissed, but what really matters is to train and hire those who do want to become teachers and are prepared to do so in their home districts. If the evidence from Lao PDR can be generalized, such candidates often come from relatively low socio -economic status homes in poor communities. If they receive teacher training, they tend to become teachers rather than being lost to more lucrative occupations. As the Lao PDR Case Study points out, among the most effective donor educational programmes have been those where teacher training, in-service programmes, and upgrading training have been provided in situ. In those cases almost all trainees (all of whom came from rural and remote com munities), returned to their communities and began serving as teachers upon completion of the programmes. Instead of being lost to “the big city” after training, most teachers returned to their com munities because essentially they never left.
In any economy where labour skills are mobile and specialized skills are eagerly sought in burgeoning coastal industries or in the capital cities, it is naïve to think that there are simple policies for solving the problem of teacher shortage in western provinces of China, in rural north-east Thailand or in the northern mountains of Lao PDR. The admittedly limited evidence suggests that the best chance of mitigating the problem is to adopt a thoroughly localized approach. Selecting local people, training them in local colleges, and recruiting them for local schools is likely to be more successful than expensive schemes of subsidy for “outsiders” to come and teach in a remote or rural area.
7.3 Student-Teacher Ratios and Class SizeLesson 5: Unless there are more than 40 to 45 students in a class, there are few gains in student achievement to be gained from reducing the STR.
Countries have not necessarily made poor choices by favouring lower STRs. There may be structural features such as population distribution or multi-ethnic or multi-language issues that require an intensive usage of teachers. Nor does the lack of systematic evidence in favour of small classes deny that ratios may be unacceptably high in disadvantaged regions or between urban and rural areas within a given country. Class sizes of up to 100 secondary students in the poorer districts of Lao PDR speak for themselves; there is no doubting the large classes and shortage of teachers in specialized subjects such as English and IT in China’s central and western areas or in Thailand’s poorer provinces; and the wide variety of subjects offered in Malaysia’s secondary curriculum has created shortages in specific subject teaching.
Despite the genuine problems of data interpretation, the evidence on STRs, stretching over many years, hundreds of studies, and only rare contrary findings, provides an important lesson for policymakers about the limited pedagogical benefits of reduced STRs. There is not much specifically Asian evidence, but what there is (summarized in Section 4) supports the vast range of research findings from developed countries that variations in class size between about 15 and 40 pupils have no measurable impact on student performance.
Key
Issu
es a
nd L
esso
ns L
earn
ed
69
Lesson 6: Large classes may result from a shortage of classrooms, not a shortage of teachers.
A further problem with extensive reliance on STRs as a measure of teacher shortage or large class size is that, by definition, it puts teachers at the center of the problem. But large classes may have little to do with a shortage of teachers. It was a feature of evidence from China and Lao PDR that very large secondary classes are caused more by a lack of classrooms than a lack of teachers. A hypothetical school with 1,000 students and 50 teachers has an STR of 20:1, well within the international range. However, if the school has 15 classrooms, then average class size (on the simplest assumptions that ignore capacity issues and multiple shifts) is a substantial 67. The reason for large classes in this hypothetical school is a lack of classrooms, not a lack of teachers. The low STR is a false friend, concealing the real source of the problem, and detracting from the urgent need to provide more classrooms.
7.4 Policy Trade-Offs and Teacher QualityLesson 7: Trade-offs between teacher numbers, their quality, and their pay have had their main effect on the quality of teachers.
It is not difficult to explain why there has been continued reduction in STRs, despite the lack of evidence for its academic effectiveness and the risk of disguising important requirements in complementary inputs such as an adequate number of classrooms. A growing supply of teachers and a reduction in their relative cost has made it possible simultaneously to expand enrolments and to hire more teachers. More students are enrolled and more teachers are employed, even to the extent of reducing the STR for the increased enrolments, but the decline in teachers’ pay relative to per capita GDP has mitigated the overall impact on public expenditure. None of this means that the trade-offs are irrelevant or non-operational. The critical lesson to be learned—where the trade-offs have truly been operational—has been in teacher quality.
It is hardly possible to read government policy documents or the research literature without becoming aware of concerns about secondary teacher quality in many Asian countries. An earlier section warned against the common practice (and not only in Asia) of nostalgically, comparing today’s teachers to those of yesteryear when teachers constituted a small and highly selective group that attracted the best and brightest.
Despite the dangers of a falsely rosy view of history; an important lesson from this study is that the rapid growth in teacher numbers, to satisfy not just enrolment growth but also the requirement for smaller classes, has meant that school systems have often become less selective about who could become a teacher. Today, for many students, teaching is the career of last resort because they cannot get into a more desirable faculty and standards of entry into a teaching faculty are much lower.
7.5 How Do We Improve Teacher Quality?Countries have been sensitive to the quality of their secondary teachers and have tried to offset declining quality by extensive programs of upgrading. Indeed, policies for raising teacher quality through longer periods of pre-service education, upgraded certification and graduate degrees
Teac
her N
umbe
rs, T
each
er Q
ualit
y:
Less
ons
from
Sec
onda
ry E
duca
tion
in A
sia
70
have probably been second only to reductions in the STR as a policy measure. The extensive international evidence, and the more limited findings from Asia, were explored in Section 5.
Lesson 8: Upgrading under-qualified teachers through longer training or enhanced certification has little measurable effect on teacher quality as measured by student outcomes.
While an often poor standard of professional development may account for much of the extensive research finding that upgrading has little influence on student performance, a further possibility is that even high-quality professional development cannot compensate more than marginally for low standard teachers. In other words, upgrading or enhanced certification is not a substitute for getting good caliber teachers in the first place. This is crisply summarized in the words from McKinsey and Company (2007) that it is a fallacy to believe “that it is possible to make substantial long-term improvements to the school system without fundamentally raising the quality of people who enter the teaching profession” (p. 23).
Lesson 9: The crucial starting point is to reverse the tendency of school systems to produce a large number of trainee secondary teachers through open or only lightly restricted entry.
Easy entry into higher education, often from those who cannot get into more desirable faculties, is a process which drives down the status and attractiveness of secondary teaching, and encourages schools and teacher faculties to be less selective about who can become a teacher. In Singapore and other high-performing Asian school systems, tight selection methods limit enrolments in teacher training to those with genuine aptitude and motivation and to those numbers that will match supply with demand. Greater selectivity raises the standing of teaching as a career. This helps attract applicants from the top cohort graduating from secondary school, or from high-quality people making a mid-career move into teaching.
Lesson 10: It is not necessary to pay lifetime salaries that are substantially higher than those for other comparable occupations.
The critical characteristic shared by the high-performing school systems is front-loading the salary system. That is to say, it is important to pay starting salaries which are fully comparable with alternative professions in the private and public sectors, and which have a decent rate of salary increments in the very early years. Front-loaded compensation works because good performers are attracted by good starting salaries.
It is hardly necessary to reiterate that the prevailing theme of this report is the relationship, or trade-off, between teacher quantity, teacher quality, and teacher pay. It remains only to point out that the top-performing Asian countries/territories such as Singapore, Korea, Hong Kong SAR, Japan and Taiwan of China all have relatively large classes, which is to say that in relation to enrolments they employ fewer teachers than other systems. With fewer teachers, they can spend more money on each teacher without any significant increase in overall secondary expenditure. By paying good starting salaries they attract good teachers into the profession. Also, because they need fewer teachers they can be more selective about whom they select to train and appoint as teachers. A virtuous circle indeed!
Refe
renc
es
71
Atagi, R. 2008. Secondary Education Policy Research: Thailand Case. Working Draft, Bangkok, UNESCO.
Barro, R. J. and Lee, J. H. 2000. International Data on Educational Attainment: Updates and Implications. Cambridge, MA, Harvard University Centre for International Development.
Berryman, S. 2000. Hidden Challenges to Education Systems in Transition Economies. Washington D.C., World Bank.
Chung, Y., Lo, N. K., Lei, W. and Cao, T. 2008. Secondary Teachers in the People’s Republic of China: Policy Issues and Perspectives. Working Draft, Bangkok, UNESCO.
Coleman, J. 1966. Equality of Educational Opportunity. Washington D.C., U.S. Department of Health, Education, and Welfare, Office of Education/National Center for Education Statistics.
de Ferranti, D., Perry, G., Gill., I., Guasch, J., Maloney, W., Sanchez-Paramo, C. and Schady, N. 2003. Closing the Gap in Education and Technology. Washington D.C., World Bank.
di Gropello, E. (ed.) 2006. Meeting the Challenges of Secondary Education in Latin America and East Asia. Washington D.C., World Bank.
Duthilleul, Y. 2005. Learning to teach in the knowledge society: the case of Cambodia. J. Moreno (ed.), Learning to Teach in the Knowledge Society. Washington D.C., World Bank. pp. 83-112.
Education Authorities, Taiwan of China. 2006a. 2006 Educational Statistical Indicators. http://english.moe.gov.tw/lp.asp?CtNode=816&CtUnit=507&BaseDSD=7&mp=2
Education Authorities, Taiwan of China. 2006b. International Comparison of Education Statistical Indicators, 2006 Edition. http://english.moe.gov.tw/ct.asp?xItem=7057&ctNode=815&mp=11
Foster, P. J. 1965. The vocational school fallacy in development planning. C. A. Anderson and M. J. Bowman (eds), Education and Economic Development. Chicago, IL. Aldine, pp. 142-66.
Fuller, B. 1987. What school factors raise achievement in the third world? Review of Educational Research, Vol. 57, No. 3, pp. 255-92.
Fwu, B. and Wang, H. 2002. The social status of teachers in Taiwan. Comparative Education, Vol. 38, No. 2, pp. 211-24.
References
Teac
her N
umbe
rs, T
each
er Q
ualit
y:
Less
ons
from
Sec
onda
ry E
duca
tion
in A
sia
72
Gannicott, K. and Tibi, C. 2008. Secondary Teachers in Lao PDR: Problems and Prospects. Working Draft, Bangkok, UNESCO.
Hanushek, E. 1986. The economics of schooling: production and efficiency in public schools. Journal of Economic Literature, Vol. 24, No. 3, pp. 1141-77.
Hanushek, E. 1994. Making Schools Work: Improving Performance and Controlling Costs. Washington D.C., Brookings Institution.
Hanushek, E. 1999. The evidence on class size. S. Meyer and P. Peterson (eds), Earning and Learning: How Schools Matter. Washington D.C., Brookings Institution, pp. 131-68.
Hanushek, E. 2004. Some Simple Analytics of School Quality. NBER Working Paper 10229.
Hanushek, E., Kain, J. and Rivkin, S. 1998. Teachers, Schools, and Academic Achievement. Cambridge, MA, National Bureau of Economic Research.
Hanushek, E. and Rivkin, S. 2002. Does public school competition affect teacher quality? C.M. Hoxby (ed.), The Economics of School Choice. Chicago, IL, University of Chicago Press, pp. 23-47.
Hanushek, E. and Rivkin, S. 2007. Pay, working conditions, and teacher quality. Future of Children, Vol. 17, No. 1, pp. 69-86.
Harris, S. 1962. Higher Education: Resources and Finance. New York, McGraw-Hill.
Henke, R., Geis, S. and Giambattista, J. 1996. Out of the Lecture Hall and into the Classroom: 1992-93 College Graduates and Elementary/Secondary School Teaching. Washington D.C., Office of Educational Research and Improvement, National Center for Education Statistics, U.S. Department of Education.
Holsinger, D. B. and Cowell, R. N. 2000. Positioning Secondary Education in Developing Countries. Paris, UNESCO/IIEP.
Huang, S. 2005. Learning to teach in a knowledge society: the case of Viet Nam. J. Moreno (ed.), Learning to Teach in the Knowledge Society. Washington D.C., World Bank. pp. 35-82.
Kim, E., Kim, J. and Han, Y. 2008. Secondary Education and Teacher Quality in the Republic of Korea. Working Draft, Bangkok, UNESCO.
Marcelo, C. 2005. Teachers learning for a learning society, literature review. J. Moreno (ed.), Learning to Teach in the Knowledge Society. Washington D.C., World Bank. pp. 4-34.
McKinsey and Company. 2007. How the world’s best-performing school systems come out on top. London, McKinsey and Company.
Mingat, A. 1998. Assessment of Some Basic Education Policy Issues in Lao PDR from a Cost and Financing Analysis. Dijon, France, University of Dijon.
Refe
renc
es
73
Mingat, A. and Tan, J. P. 1998. The Mechanics of Progress in Education: Evidence from Cross Country Data. Washington D.C., World Bank.
Ministry of Education, Singapore. 2007. Education Statistics Digest.
Mishel, L. and Rothstein, R (eds). 2002. The Class Size Debate. Washington D.C., Economic Policy Institute.
Mokshein, S. E., Ahmad, H. H. and Vongalis-Macrow, A. 2008. Towards Providing Quality Secondary Education: Training and Retaining Quality Teachers in Malaysia. Working Draft, Bangkok, UNESCO.
Moreno, J. (ed.). 2005. Learning to Teach in the Knowledge Society. Washington D.C., World Bank.
Mulkeen, A., Chapman, D., De Jaeghere, J. and Leu, E. 2007. Recruiting, Retaining, and Retraining Secondary School Teachers and Principals in Sub-Saharan Africa. Washington, D.C., World Bank.
Nabeshima, K. 2003. Raising the Quality of Secondary Education in East Asia. Washington D.C., World Bank.
National Bureau of Statistics of China. 2004. National Statistical Yearbook 2003. Beijing, China’s Statistics Press. http://www.stats.gov.cn/english/statisticaldata/yearlydata/
National Bureau of Statistics of China. 2007. National Statistical Yearbook 2006. Beijing, China’s Statistics Press. http://www.stats.gov.cn/english/statisticaldata/yearlydata/
National Center for Education Statistics, U.S. Department of Education. 2003. The Condition of Education 2003. NCES 2003–067. Washington D.C., NCES.
Nickell, S. and Quintini, G. 2002. The consequences of the decline in public sector pay in Britain: a little bit of evidence. The Economic Journal, Vol. 112, pp. F107-F118.
Noonan, R. 2004. Teacher Salaries in 2001/2002: An Analysis of the Teacher Salary Scale, Salary Supplements and Income Tax Scale, with Special Reference to Primary Teachers. Manuscript.
Noonan, R. and Xaiyasensouk, V. 2007. Alternative Models of Teacher Training for Remote Areas. Swedish International Development Agency (SIDA).
OECD (1989) Schools and quality: An international report. Paris: Organization for Economic Cooperation and Development.
OECD. 2003. The PISA 2003 Assessment Framework – Reading, Mathematical and Scientific Literacy. Paris, OECD.
OECD. 2005. Teachers Matter: Attracting, Developing and Retaining Effective Teachers. Paris, OECD.
OECD. 2007a. Education at a Glance: OECD Indicators. Paris, OECD.
OECD. 2007b. PISA 2006 - Volume 1 Science Competencies for Tomorrow’s World. Paris, OECD.
Teac
her N
umbe
rs, T
each
er Q
ualit
y:
Less
ons
from
Sec
onda
ry E
duca
tion
in A
sia
74
Psacharopoulos, G. and Woodhall, M. 1985. Education for Development, an Analysis of Investment Choices. Washington D.C., World Bank.
Rivkin, S. G, Hanushek, E. A. and Kain J., Teachers Schools, and Academic Achievement. Econometrica, Vol. 73, No. 2 (March, 2005), 417–458.
Santiago, P. 2002. Teacher Demand and Supply: Improving Teaching Quality and Addressing Teacher Shortages. Paris, OECD.
Tan, J. P. and Mingat, A. 1992. Education in Asia: A Comparative Study of Cost and Financing. Washington D.C., World Bank.
UNESCO Institute for Statistics. 2003. Global Education Digest 2003. Montreal, UIS.
UNESCO Institute for Statistics. 2006a. Education Counts – Benchmarking Progress in 19 WEI Countries. Montreal, UIS.
UNESCO Institute for Statistics. 2006b. Global Education Digest 2006: Comparing Education Statistics Across the World. Montreal, UIS.
UNESCO Institute for Statistics. 2006c. Teachers and Educational Quality, Monitoring Global Needs for 2015. Montreal, UIS.
UNESCO Institute for Statistics. 2007. Global Education Digest 2007: Comparing Education Statistics Across the World. Montreal, UIS.
UNESCO Institute for Statistics. 2008. Global Education Digest 2008: Comparing Education Statistics Across the World. Montreal, UIS.
UNESCO. 2009. Atlas of the World’s Languages. Paris, UNESCO.
Verspoor, A. 2008. At the Crossroads: Challenges for Secondary Education in Africa. Washington D.C., World Bank.
World Bank. 1993. The East Asian Economic Miracle, Economic Growth and Public Policy. Oxford, Oxford University Press.
World Bank. 1995. Priorities and Strategies for Education: A World Bank Review. Washington, D.C., World Bank.
World Bank. 2005. Expanding Opportunities and Building Competencies for Young People: A New Agenda for Secondary Education. Washington, D.C., World Bank.
World Bank. 2006. Thailand Social Monitor: Improving Secondary Education. Bangkok, World Bank.
World Bank. 2007. Better Education through Reformed Management and Universal Teacher Upgrading. Project Appraisal Document, Report No. 3015.
Wu, K. B. 1993. Science and Technology Education in Taiwan, China (China). Washington D.C., World Bank.
Teacher Numbers, Teacher Quality:
Lessons from Secondary Education in Asia