Embed Size (px)
Citation preview
TARGET STRENGTH MEASUREMENTS ON THREE PELAGIC FISHES FROM THE JAVA S E A ~
P. CQTEL, D. PETIT
ABSTRACT Using acoustics for biomass evaluation, the back scattering cross section of species has to be determined
to convert the data into weighted values. During the cruises of EU Project “Java Sea Pelagic Fishery,” TS measurements on 3 pelagic fishes of economic importance : Decapterus russelli, Selar crumenophthalmus, Rastrelliger kanagurta were carried out, using a BioSonics dual beam echo-sounder at a frequency of 120 kHz. The observations on single or multiple targets in a cage, revealed a large dispersion of the responses, even in the same experiment. These results are discussed and compared with Johannesson’s (Anonymous, 1984) in the same area. KEYWORDS : Java Sea, pelagic fishes, acoustics, methodology, Target Strength.
ABSTRAK Penggunaan akustik untuk evaluasi biomassa, harus diikuti ofeh penentuan ”back scattering cross
section” dari jenis ikan sehingga data dapat dikonversikan ke dalam nilai bobot. Selama beberapa pelayaran proyek EU PELFISH, dilakukan pengukuran 3 jenis ikan ekonomi penting : Decapterus russelli, Selar crumenophthalmus dan Rastrelliger kanagurta dengan menggunakan BioSonics bim ganda I20 kHz. Pengamatan terhadap target tunggal atau beberapa target dalam suatu kurung-kurung mengungkap adanya respon yang bervariasi, meskipun dalam suatu percobaan yang sama. Hasil pengamatan ini dibahas dan dibandingkan dengan hasil Johannesson (Anonimous, 1984) di area yang sama. KATA KUNCI : Laut Jawa, perikanan pelagis, akustik, metodologi, Target Strength.
1Reprint from the Fourth Asian Fisheries Forum, 16-20 October 1995, Beijing.
Target Strength measurements on three pelagic fishes 109
With the calibration of acoustic equipment, reflection index measuring of live fish constitutes the first stage in the evaluation of abundance. This operation should allow the adjustment of the threshold on the echo voltages which are to be taken into account. It should also allow the calculation of a conversion constant of integrated voltages during prospecting of biomass measuring. The following observations were made during the “Java Sea Pelagic Fishery Assessment” Project.
MATERIALS AND METHODS
Three series of measuring have been made during the season when pelagic fish abound in the Java Sea : November 1991, October and December 1992. The success of these experiments is dependent upon strict environmental conditions : the location has to be deep and sheltered from the wind and currents; it must moreover be close to a fishing zone. Only 2 places in the Java Sea were found to be acceptable : Bawean Island and Matasiri Island. The former, 17 m depth, in a bay, was the best.
The measurements were made with a Dual Beam BioSonics echo-sounder (7” narrow and 18”wide circular beams). The acoustic characteristics of the equipment were controlled previously on a standard tungsten ball of a -4 1 dB reflection index. Characteristics and adjustments throughout the measurements were the followings :
- Transmitter Source Level : 222.54 dB/pPdm - Narrow beam Receiving Sensitivity : - 173.13 dB/V/pPa - Wide beam Receiving Sensitivity : - 172.17 dBN/pPa - Pulse Duration : 0.4 ms - Ping Rate : 3hecond - Threshold : 100 mV - TVG : 40 Log R+ 2 aR with a = 34.7 dB/km and R= 125 m
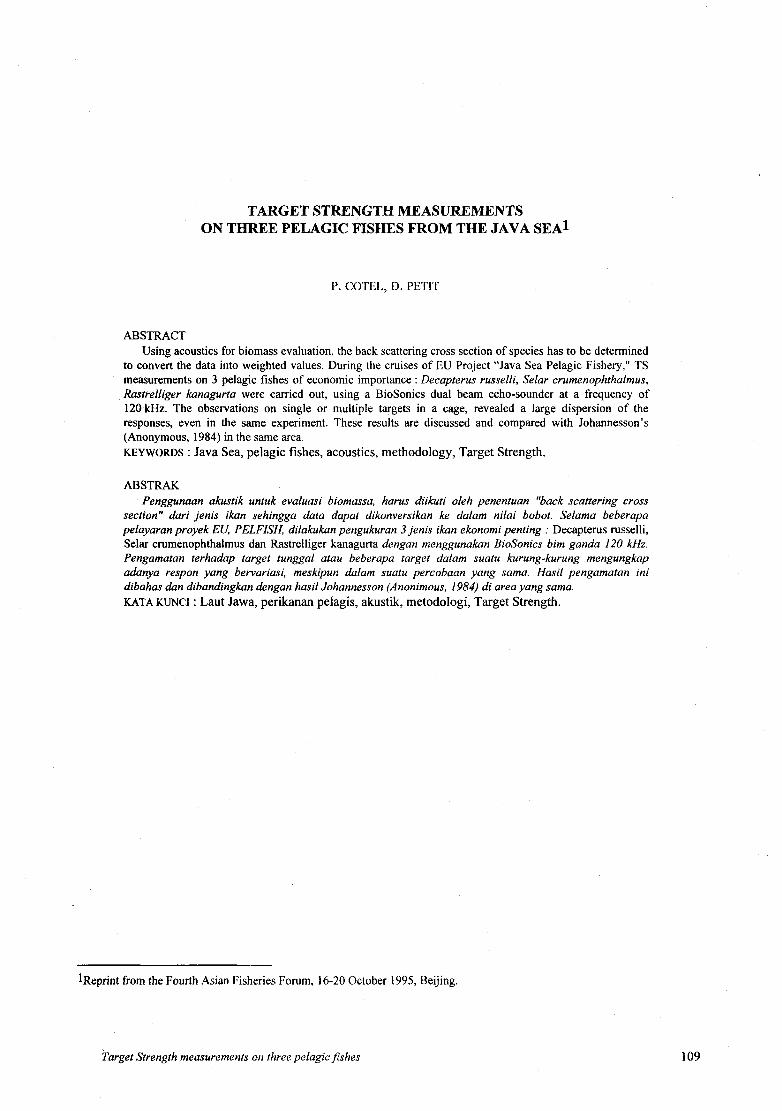
In order to keep the fish in the acoustic beam, the latter is introduced into a conical cage specially built in order to be not disturbed by the reflecting contribution of the lateral surface. The transducer is an integral part of this cage (Fig. 1). In this way, the transmitted signal is not attenuated by the net, the cage is sufficiently spacious to permit the movement of the fish and to record the echoes without interference. The measurements were taken from three pelagic species, among the most exploited in the Java Sea : Decapterus russelli, Selar crumenophtalmus and Rastrelliger kanagurta.
The three species have a swimbladder. The fish were introduced into the cage in sets of 1, 2, 4 or 6; the cage was then submerged. Reverberation measurements were taken night and day.
RESULTS
Dispersal of measurements
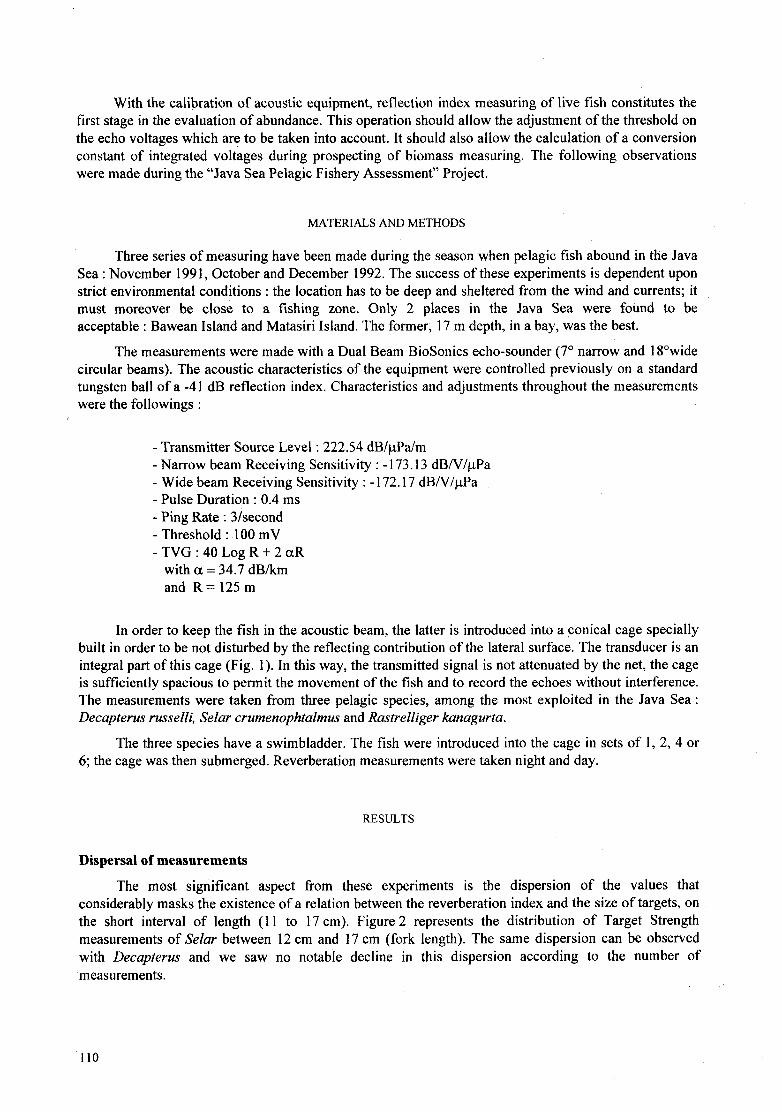
The most significant aspect from these experiments is the dispersion of the values that considerably masks the existence of a relation between the reverberation index and the size of targets, on the short interval of length (1 1 to 17 cm). Figure 2 represents the distribution of Target Strength measurements of Selar between 12 cm and 17 cm (fork length). The same dispersion can be observed with Decapterus and we saw no notable decline in this dispersion according to the number of measurements.
110
xmit I receive cable P
Figure 1 Gambar 1
The live fish calibration cage. Kurung-kurung untuk kalibrasi ikan hidup.
1 tis h L = 1 2 .3 c m 1 1 1 s h L = I 5 . O c m
a - 4 0 .ar I - 4 0
6 5 B 6 5 7 7 0 i--- _.__. -
O 8 0 1 0 0 2 0 4 0 b o N llm b e r o f h i t s
1 f i s h L = 1 5 . 8 c m 1 r i s h L = 1 5 .9 c m 3 0 3 0
I 3 5 1 3 5 s 4 0 I 4 0
4 5 4 5 I 5 0 " 5 5
i 5 0
d 6 0 d 6 0 " 5 3
E 6 5
1 f i a h L = 1 6 . 4 C m 1 1 1 s h 1 = 1 6 .O C m N = 2 4 3
3 0 i - 3 0 3 N = 4 b 6 5 S 1 D = 5 . 5 2
- 4 5 I
Figure 2 Gambar 2
TS related to the size. TS dikaitkan dengan ukuran.
Target Strength measurements on three pelagic fishes ,111
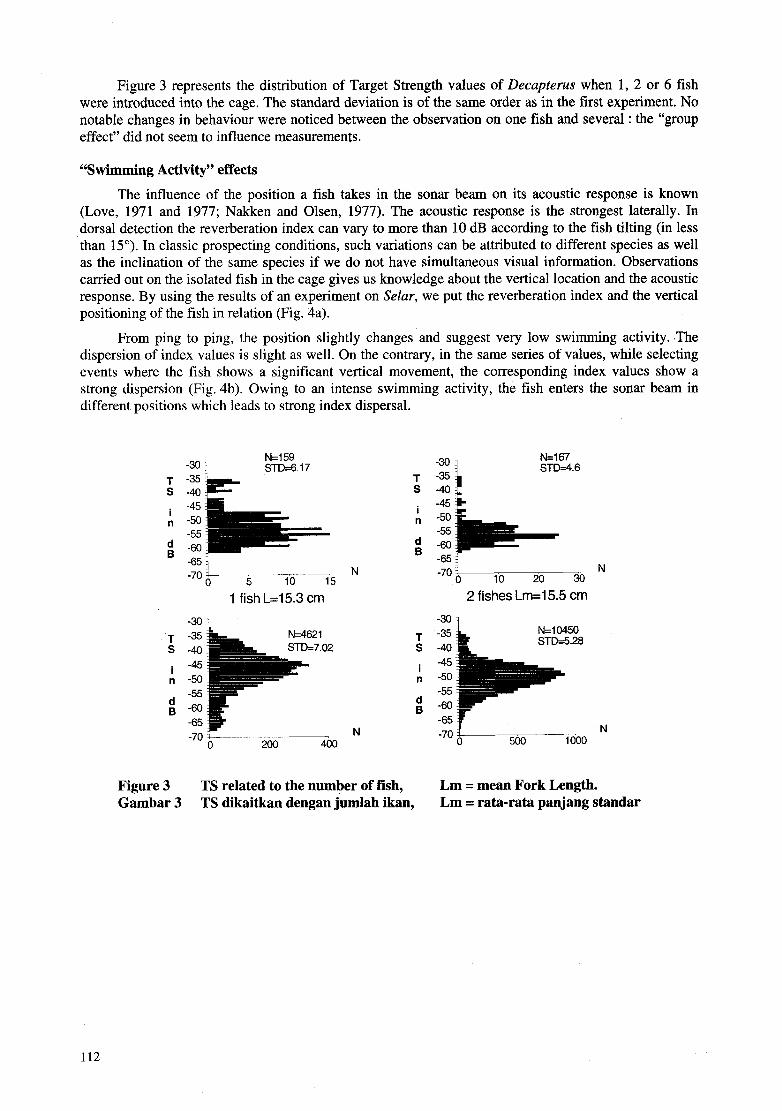
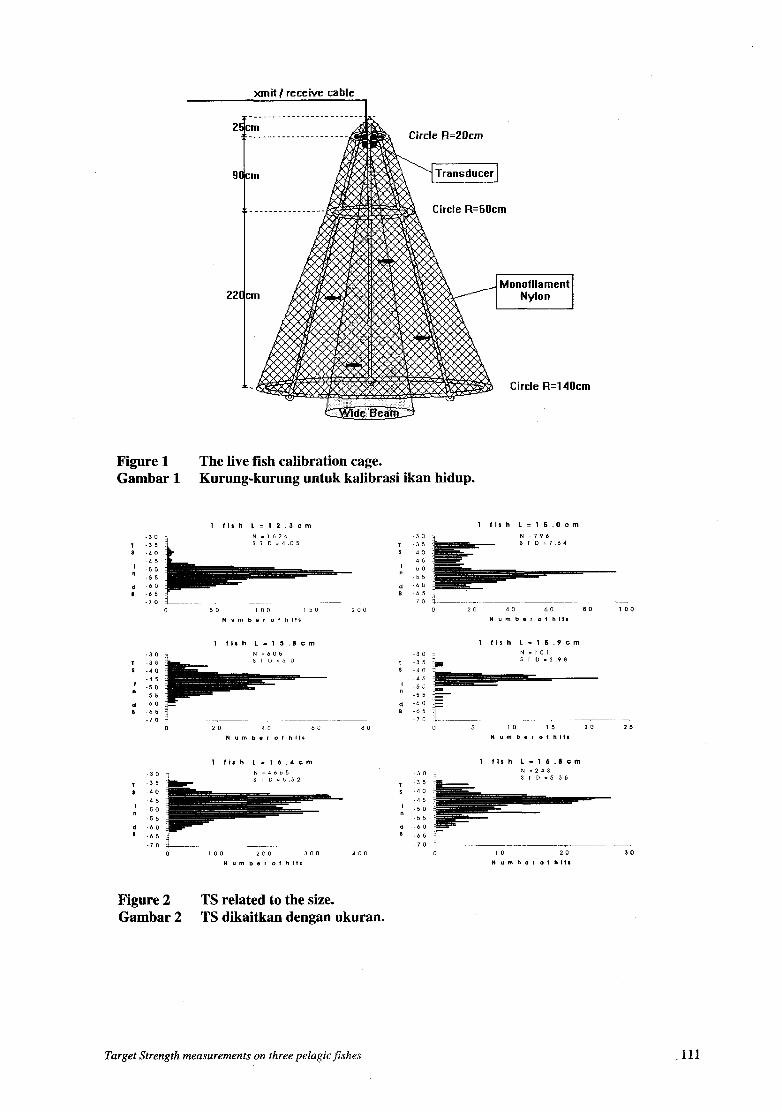
Figure 3 represents the distribution of Target Strength values of Decupterus when 1, 2 or 6 fish were introduced into the cage. The standard deviation is of the same order as in the first experiment. No notable changes in behaviour were noticed between the observation on one fish and several : the “group effect” did not seem to influence measurements.
“Swimming Activity” effects The influence of the position a fish takes in the sonar beam on its acoustic response is known
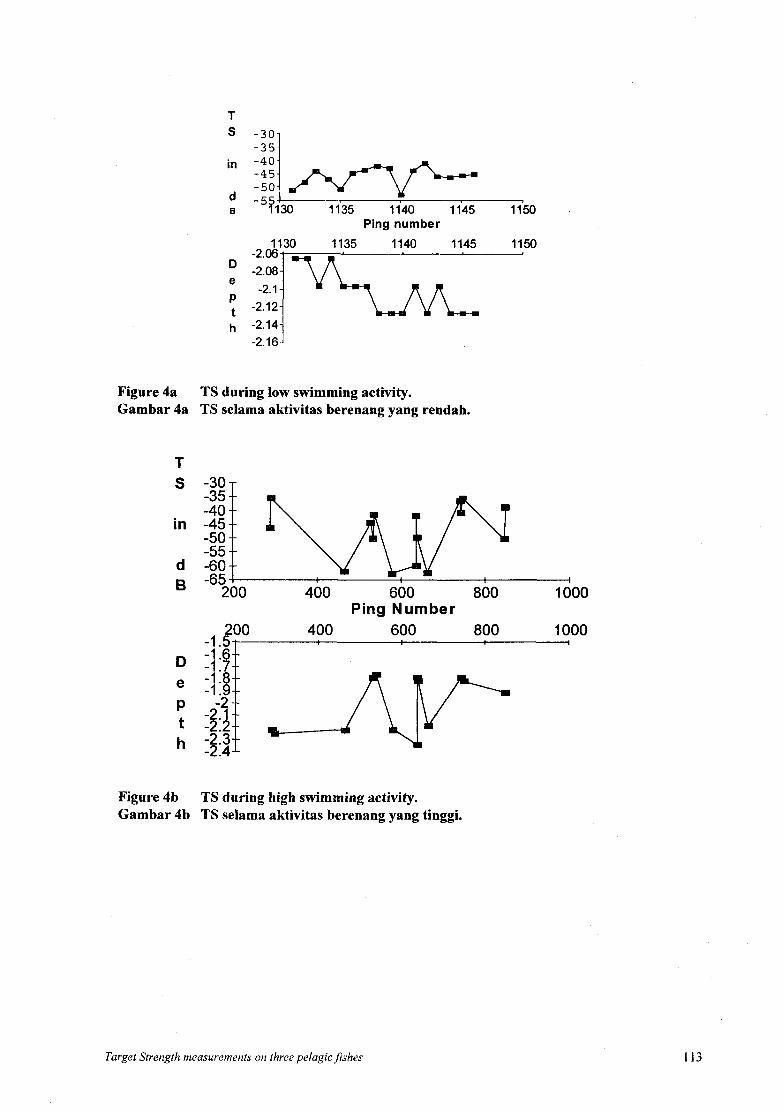
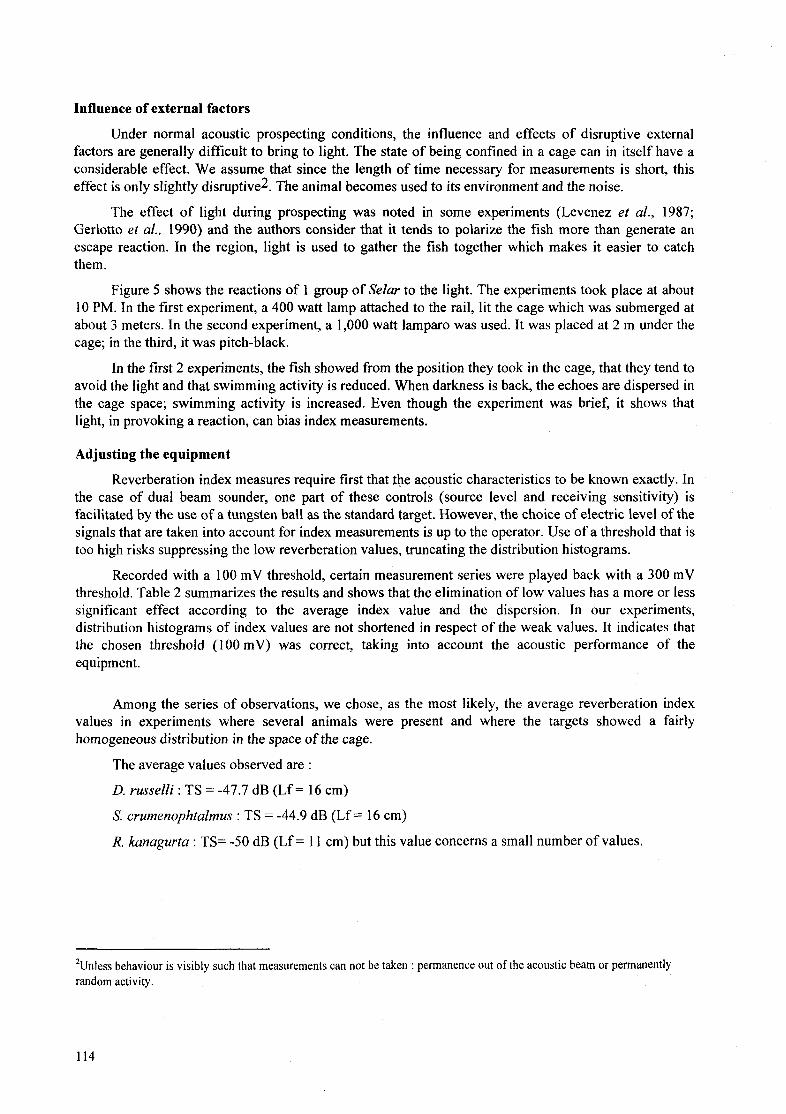
(Love, 1971 and 1977; Nakken and Olsen, 1977). The acoustic response is the strongest laterally. In dorsal detection the reverberation index can vary to more than 10 dB according to the fish tilting (in less than 15’). In classic prospecting conditions, such variations can be attributed to different species as well as the inclination of the same species if we do not have simultaneous visual information. Observations carried out on the isolated fish in the cage gives us knowledge about the vertical location and the acoustic response. By using the results of an experiment on Selur, we put the reverberation index and the vertical positioning of the fish in relation (Fig. 4a).
From ping to ping, the position slightly changes and suggest very low swimming activity. The dispersion of index values is slight as well. O n the contrary, in the same series of values, while selecting events where the fish shows a significant vertical movement, the corresponding index values show a strong dispersion (Fig. 4b). Owing to an intense swimming activity, the fish enters the sonar beam in different positions which leads to strong index dispersal.
N=167 STD=4.6 -30 -30
T -35 T -35 S -40 S -40
-45 n -50 i n -50
-45 i
-55 -55 -60 ; -60
-65 -7o‘---- N -70 N -65
O 5 10 15 1 fish L=l5.3 cm 2 fishes Lm=15.5 cm
-30 -30
s - 4 0 -45
n -50
N=l0450 STDS.28 T -35 T -35
s-40
i n -50
-45 i
-55 -55 d ; -60
-65 N -70
B -60 N -65
-70 1 O00 200 O
Figure 3 Gambar 3
TS related to the number of fish, TS dikaitkan dengan jumlah ikan,
Lm = mean Fork Length. Lm = rata-rata panjang standar
112
T S -30
-351
-50 -5
B 7130 1135 1140 1145 1150 Ping number
1130 1135 1140 1145 1150 -2.06 -2.08 -2.1
e ; -2.12 h -2.14
-2.16
Figure 4a TS during low swimming activity. Gambar 4a TS selama aktivitas berenang yang rendah.
T S
in
d 8
-30 -35 -40 -45 -50 -55 -60 -65 200 400 600 800 1 O00
Ping Number 200 400 600 800 1 O00
-1.5 . I -1.6-- D -1.7--
e -1.8
t -2.2 h -2.3
-2.4
Figure 4b TS during high swimming activity. Gambar 4b TS selama aktivitas berenang yang tinggi.
Target Strength measurements on three pelagic jkhshes 113
Influence of external factors
Under normal acoustic prospecting conditions, the influence and effects of disruptive external factors are generally difficult to bring to light. The state of being confined in a cage can in itself have a considerable effect. W e assume that since the length of time necessary for measurements is short, this effect is only slightly disruptivea. The animal becomes used to its environment and the noise.
The effect of light during prospecting was noted in some experiments (Levenez et al., 1987; Gerlotto et al., 1990) and the authors consider that it tends to polarize the fish more than generate an escape reaction. In the region, light is used to gather the fish together which makes it easier to catch them.
Figure 5 shows the reactions of 1 group of Selar to the light. The experiments took place at about 10 PM. In the first experiment, a 400 watt lamp attached to the rail, lit the cage which was submerged at about 3 meters. In the second experiment, a 1,000 watt lamparo was used. It was placed at 2 m under the cage; in the third, it was pitch-black.
In the first 2 experiments, the fish showed from the position they took in the cage, that they tend to avoid the light and that swimming activity is reduced. When darkness is back, the echoes are dispersed in the cage space; swimming activity is increased. Even though the experiment was brief, it shows that light, in provoking a reaction, can bias index measurements.
Adjusting the equipment
Reverberation index measures require first that the acoustic characteristics to be known exactly. In the case of dual beam sounder, one part of these controls (source level and receiving sensitivity) is facilitated by the use of a tungsten ball as the standard target. However, the choice of electric level of the signals that are taken into account for index measurements is up to the operator. Use of a threshold that is too high risks suppressing the low reverberation values, truncating the distribution histograms.
Recorded with a 100 mV threshold, certain measurement series were played back with a 300 mV threshold. Table 2 summarizes the results and shows that the elimination of low values has a more or less significant effect according to the average index value and the dispersion. In our experiments, distribution histograms of index values are not shortened in respect of the weak values. It indicates that the chosen threshold (100 mV) was correct, taking into account the acoustic performance of the equipment.
Among the series of observations, we chose, as the most likely, the average reverberation index values in experiments where several animals were present and where the targets showed a fairly homogeneous distribution in the space of the cage.
The average values observed are :
D. russelli : TS = -47.7 dB (Lf = 16 cm) S. crumenophtalmus : TS = -44.9 dB (Lf = 16 cm) R. kanagurta : TS= -50 dB (Lf = 11 cm) but this value concerns a small number of values.
Unless behaviour is visibly such that measurements can not be taken : permanence out of the acoustic beam or permanently random activity. 2
114
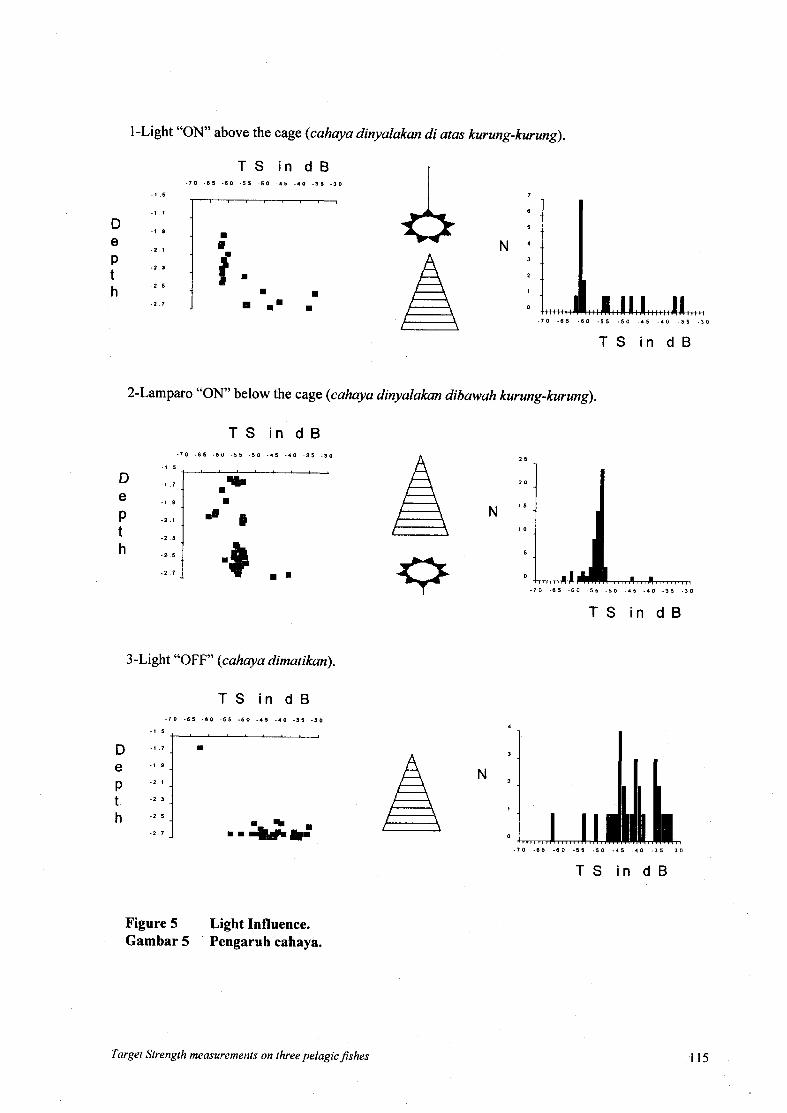
1 -Light "ON" above the cage (cuhuyu dinyalukun di atas kurung-kurung).
T S in d B .70 .E5 -60 - 5 5 - 5 0 .45 -40 - 3 5 -30
1 5
1 " " " " - 1 1
h - 2 5 -2 7
I
8 I I= I
* .10 -65
2-Lamparo "ON" below the cage (cuhuyu dinyuzakan dibuwah kurung-kurung).
T S in d B
o -5 5 .so - 4 5 -40 .a 5 - 3 0
T S in d B
D e P t h
- 1 5
- 1 7 rL. I A 2 5
T S in d B
3 -Light "OFF" (cahuyu dimutikan).
T S in d B
t -2 3
h -2 5
-2 7
4
3
N 2
1
O
T S in d B
Figure 5 Light Influence. Gambar 5 Pengaruh cahaya.
Target Strength measurements on three pelugic$shes 115
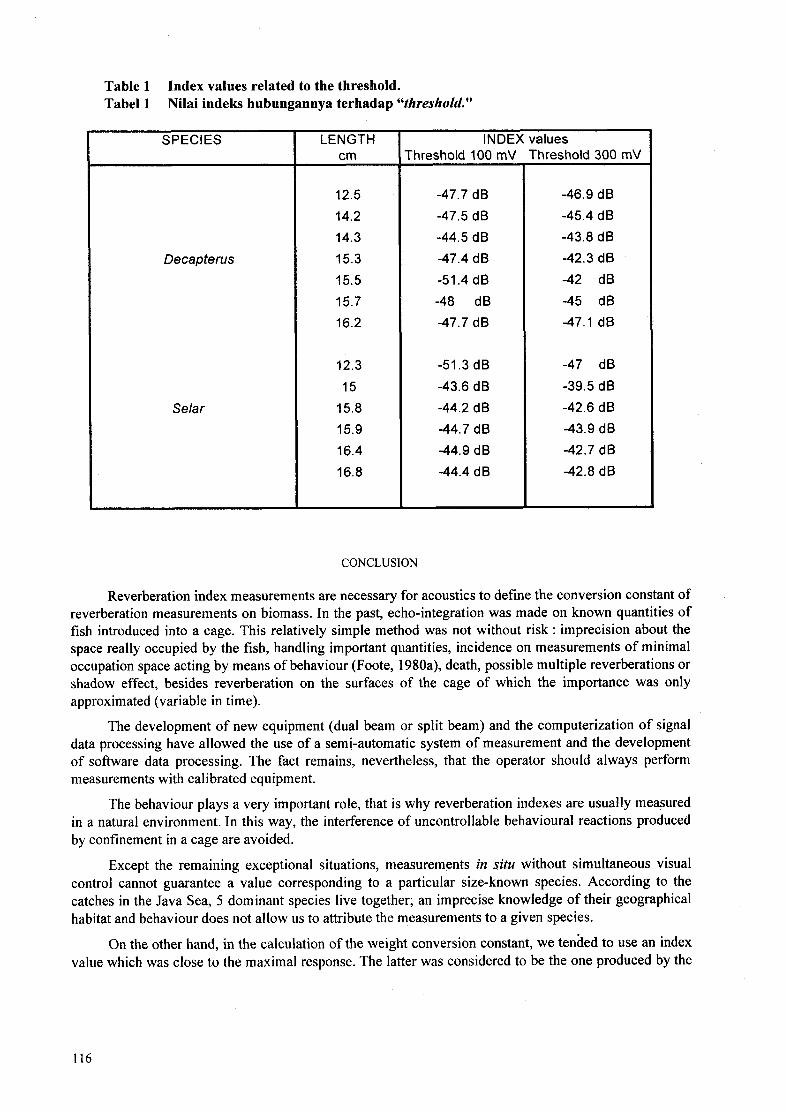
Table 1 Tabel 1
Index values related to the threshold. Nilai indeks hubungannya terhadap "threshold."
I SPECIES
Decapterus
Selar
LENGTH cm
12.5 14.2 14.3 15.3 15.5 15.7 16.2
12.3 15 15.8 15.9 16.4 16.8
INDEX values Threshold 100 mV Threshold 300 mV
-47.7 dB -47.5 d B -44.5 dB -47.4 dB -51.4 d B -48 dB -47.7 dB
-51.3 dB -43.6 dB -44.2 dB -44.7 dB -44.9 dB -44.4 dB
-46.9 d B -45.4 d B -43.8 d B -42.3 d B -42 dB -45 dB -47.1 dB
-47 dB -39.5 d B -42.6 dB -43.9 dB -42.7 d B -42.8 dB
CONCLUSION
Reverberation index measurements are necessary for acoustics to define the conversion constant of reverberation measurements on biomass. In the past, echo-integration was made on known quantities of fish introduced into a cage. This relatively simple method was not without risk : imprecision about the space really occupied by the fish, handling important quantities, incidence on measurements of minimal occupation space acting by means of behaviour (Foote, 1980a), death, possible multiple reverberations or shadow effect, besides reverberation on the surfaces of the cage of which the importance was only approximated (variable in time).
The development of new equipment (dual beam or split beam) and the computerization of signal data processing have allowed the use of a semi-automatic system of measurement and the development of software data processing. The fact remains, nevertheless, that the operator should always perform measurements with calibrated equipment.
The behaviour plays a very important role, that is why reverberation indexes are usually measured in a natural environment. In this way, the interference of uncontrollable behavioural reactions produced by confinement in a cage are avoided.
Except the remaining exceptional situations, measurements in situ without simultaneous visual control cannot guarantee a value corresponding to a particular size-known species. According to the catches in the Java Sea, 5 dominant species live together; an imprecise knowledge of their geographical habitat and behaviour does not allow us to attribute the measurements to a given species.
O n the other hand, in the calculation of the weight conversion constant, w e tended to use an index value which was close to the maximal response. The latter was considered to be the one produced by the
116
fish in a normal position in the acoustic beam3 For a dozen years, acoustic response measurements related to the orientation of the target have been performed (Foote, 1980b) in order to calculate an index according to the most probable directivity of the fish. In situ, these kinds of observations are obviously rare, given the slight chance of encountering favourable conditions and the difficulty of getting the logistics. Very recently, observations on herring (Hamre and Dommasne, 1994) showed that in the reproductive phase, the reverberation index would be more low, in this specific case.
The choice of an index value should then be defined according to the predicated use (Foote, 1987). In our case, w e tried to define an index destined for weight evaluations on “classical” prospecting. To reduce a possible effect of being confined in a cage or isolated behaviour, it is recommended to increase the observations made up of a large number of measurements. The procedure aims to obtain an average index value corresponding to the most frequent position. Our observations show that optimal response values are found to be far away from the mode or the average. It indicates that the stongest echoes are not on average representing the usual position of the fish. In the Java Sea, shoals are not numerous; the fish are scattered. The nycthemeral density variations are strong; they suggest important vertical movements throughout the diurnal cycle. The behaviour observed in the cage, where the fish sustains considerable swimming action, does not seem to contradict the distribution and vertical movements observed in situ.
Until now, the great majority of index measurements has concerned the species of the North Atlantic stocks with sizes that greatly exceed the tropical pelagic ones. In operating on caged fish (measurements in 20 log function), Johannesson (Anonymous, 1984) had obtained -45 d B on the same or related species (D. russelli or D. kuroides), at the same frequency. Other experiments are still necessary to complete the first results.
REFERENCES Anonymous, 1984. Report on 1981-1983. Acoustic fishery resource surveys in Southern Part of South China Sea with
special reference to the waters around Natuna, Anambas, Serasan and Tambalan Islands groups. CIDA/FAO Indonesian Fisheries Development Project GCP/INS/O56/CAN, Draft Report, 12 1 p.
Foote K.G., 1980a. Effect of fish behaviour on echo energy : the need for measurements of orientation distributions. J. Cons.
Foote K.G., 1980b. Averaging of fish Target Strength functions. J. Acoust. Soc. Am., 67(2) : 504-514. Foote K.G., 1987. Fish Target Strength for use in echo-integration surveys. J. Acoust. Soc. Am., 82(3) : 981-987. Gerlotto F., Petit D. and Freon P., 1990. Influence of the light of a survey vessel on TS distribution. CIEM/ICES Rostok,
Hamre J. and Dommasne A., 1994. Test experiments of Target Strength of herting by comparing density indices obtained by
Levenez J.J., Gerlotto F. and Petit D., 1987. Reaction of tropical coastal pelagic species to artificial lighting and implications
Love R.K., 1971. Measurements of fish Target Strength. A review. Fish. Bull., 69(4) : 703-715. Love R.K., 1977. Target Strength of an individual fish at any aspect. J. Acoust. Soc. Am., 62(6) : 1397-1403. Nakken O. and Olsen K., 1977. Target Strength measurements of fish. Rapp. P.V. Reun. Cons. Int. Expl. Mer., 170 : 52-69.
Int. Exp. Mer., 39(2) : 93-201.
IO p.
acoustic method and purse seine catches. ICES, 9 p.
for the assessment of abundance by echointegration. Rapp. P.V. Reun. Cons. Int. Expl. Mer, 189 : 128-134.
3Using a great quantity of encaged fish, we tried to make sure that the fish “turned, having then a behaviour close to the one observed in a natural environment while the fish is in shoal.
Target Strength measurements on three pelagic fishes 117
DISCUSSION
(Chairman Dr. WIDODO)
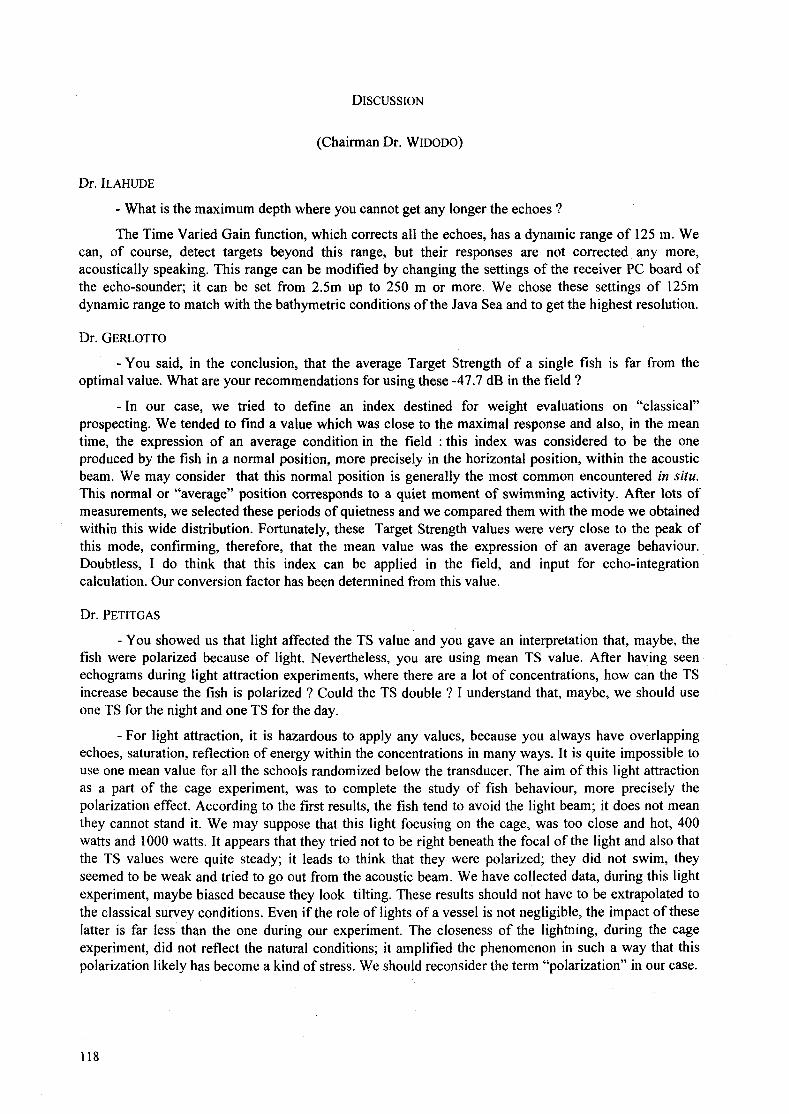
Dr. ILAHUDE - What is the maximum depth where you cannot get any longer the echoes ? The Time Varied Gain function, which corrects all the echoes, has a dynamic range of 125 m . W e
can, of course, detect targets beyond this range, but their responses are not corrected any more, acoustically speaking. This range can be modified by changing the settings of the receiver PC board of the echo-sounder; it can be set from 2.5m up to 250 m or more. W e chose these settings of 125m dynamic range to match with the bathymetric conditions of the Java Sea and to get the highest resolution.
Dr. GERLOTTO
- Y o u said, in the conclusion, that the average Target Strength of a single fish is far from the optimal value. What are your recommendations for using these -47.7 d B in the field ?
- In our case, w e tried to define an index destined for weight evaluations on “classical” prospecting. W e tended to find a value which was close to the maximal response and also, in the mean time, the expression of an average condition in the field : this index was considered to be the one produced by the fish in a normal position, more precisely in the horizontal position, within the acoustic beam. W e may consider that this normal position is generally the most common encountered in situ. This normal or “average” position corresponds to a quiet moment of swimming activity. After lots of measurements, w e selected these periods of quietness and w e compared them with the mode w e obtained within this wide distribution. Fortunately, these Target Strength values were very close to the peak of this mode, confirming, therefore, that the mean value was the expression of an average behaviour. Doubtless, I do think that this index can be applied in the field, and input for echo-integration calculation. Our conversion factor has been determined from this value.
Dr. PETITGAS - You showed us that light affected the TS value and you gave an interpretation that, maybe, the
fish were polarized because of light. Nevertheless, you are using mean TS value. After having seen echograms during light attraction experiments, where there are a lot of concentrations, how can the TS increase because the fish is polarized ? Could the TS double ? I understand that, maybe, w e should use one TS for the night and one TS for the day.
- For light attraction, it is hazardous to apply any values, because you always have overlapping echoes, saturation, reflection of energy within the concentrations in many ways. It is quite impossible to use one mean value for all the schools randomized below the transducer. The aim of this light attraction as a part of the cage experiment, was to complete the study of fish behaviour, more precisely the polarization effect. According to the first results, the fish tend to avoid the light beam; it does not mean they cannot stand it. W e may suppose that this light focusing on the cage, was too close and hot, 400 watts and 1000 watts. It appears that they tried not to be right beneath the focal of the light and also that the TS values were quite steady; it leads to think that they were polarized; they did not swim, they seemed to be weak and tried to go out from the acoustic beam. W e have collected data, during this light experiment, maybe biased because they look tilting. These results should not have to be extrapolated to the classical survey conditions. Even if the role of lights of a vessel is not negligible, the impact of these latter ís far less than the one during our experiment. The closeness of the lightning, during the cage experiment, did not reflect the natural conditions; it amplified the phenomenon in such a way that this polarization likely has become a kind of stress. W e should reconsider the term “polarization” in our case.
118
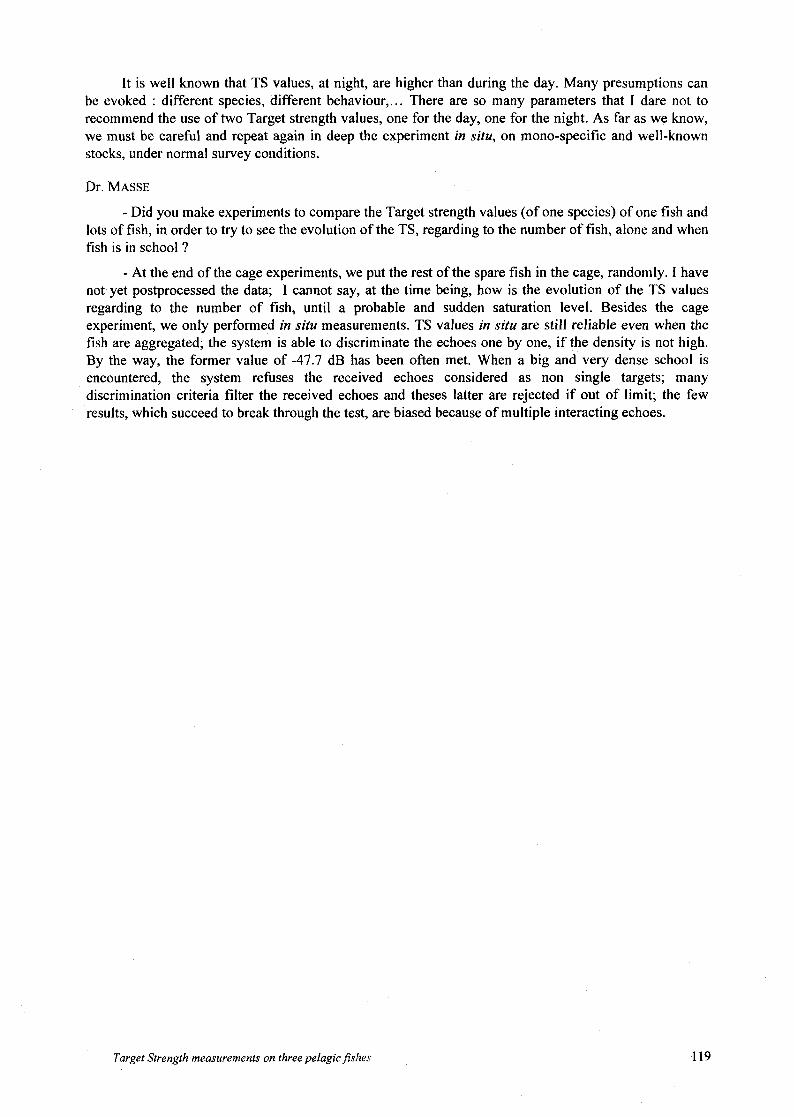
It is well known that TS values, at night, are higher than during the day. Many presumptions can be evoked : different species, different behaviour, ... There are so many parameters that I dare not to recommend the use of two Target strength values, one for the day, one for the night. As far as we know, we must be careful and repeat again in deep the experiment in situ, on mono-specific and well-known stocks, under normal survey conditions.
Dr. MASSE - Did you make experiments to compare the Target strength values (of one species) of one fish and
lots of fish, in order to try to see the evolution of the TS, regarding to the number of fish, alone and when fish is in school ?
- At the end of the cage experiments, we put the rest of the spare fish in the cage, randomly. I have not yet postprocessed the data; I cannot say, at the time being, how is the evolution of the TS values regarding to the number of fish, until a probable and sudden saturation level. Besides the cage experiment, we only performed in situ measurements. TS values in situ are still reliable even when the fish are aggregated; the system is able to discriminate the echoes one by one, if the density is not high. By the way, the former value of -47.7 dB has been often met. When a big and very dense school is encountered, the system refuses the received echoes considered as non single targets; many discrimination criteria filter the received echoes and theses latter are rejected if out of limit; the few results, which succeed to break through the test, are biased because of multiple interacting echoes.
Target Strength measurements on three pelagic fishes 119