Embed Size (px)
Citation preview
Why and When Does a Mindfulness Intervention Promote Job Performance? The
Interpersonal Mechanisms and Individual, Job, and Social Contingencies
A DISSERTATIONSUBMITTED TO THE FACULTY OF THE GRADUATE SCHOOL
OF THE UNIVERSITY OF MINNESOTABY
Tao Yang
IN PARTIAL FULFILLMENT OF THE REQUIREMENTSFOR THE DEGREE OF
DOCTOR OF PHILOSOPHY
Theresa M. Glomb, Adviser
July, 2015

© Tao Yang 2015
i
Acknowledgements
I am deeply grateful to my advisor and friend, Dr. Theresa Glomb, for her
guidance and support throughout my graduate career. It is an honor to have worked with
her over the past six years and I have learned numerous things from her. Her optimism,
talent, and integrity have been influential to me, personally and professionally. She will
undoubtedly be a constant source of inspiration for my development.
I would like to thank my dissertation committee members, Drs. Michelle Duffy,
Joyce Bono, Patricia Frazier, and Elizabeth Campbell, for their insightful comments. I
thank my colleagues at the Department of Work and Organizations, especially Drs. John
Kammeyer-Mueller, Pri Shah, Mary Zellmer-Bruhn, Sophie Leroy, and Betty Zhou, for
enriching many aspects of my professional life. I thank my fellow doctoral students at the
Department for creating an intellectually stimulating, caring, and fun social environment.
I gratefully acknowledge the dissertation grant awards from the SIOP Foundation
Benjamin Schneider Graduate Scholarship and the Department of Work and
Organizations Dissertation Research Grant. I would like to extend special appreciation to
my organizational participants who were willing to take the time to participate in study
activities amidst their already full lives. I also thank Drs. Zhen Zhang and Kristopher
Preacher for helpful suggestions on data analysis.
Finally, I am indebted to my parents for their unconditional love. I am especially
grateful to my fiancée, Shan Zhao. She is a constant source of joy and strength in my life.
ii
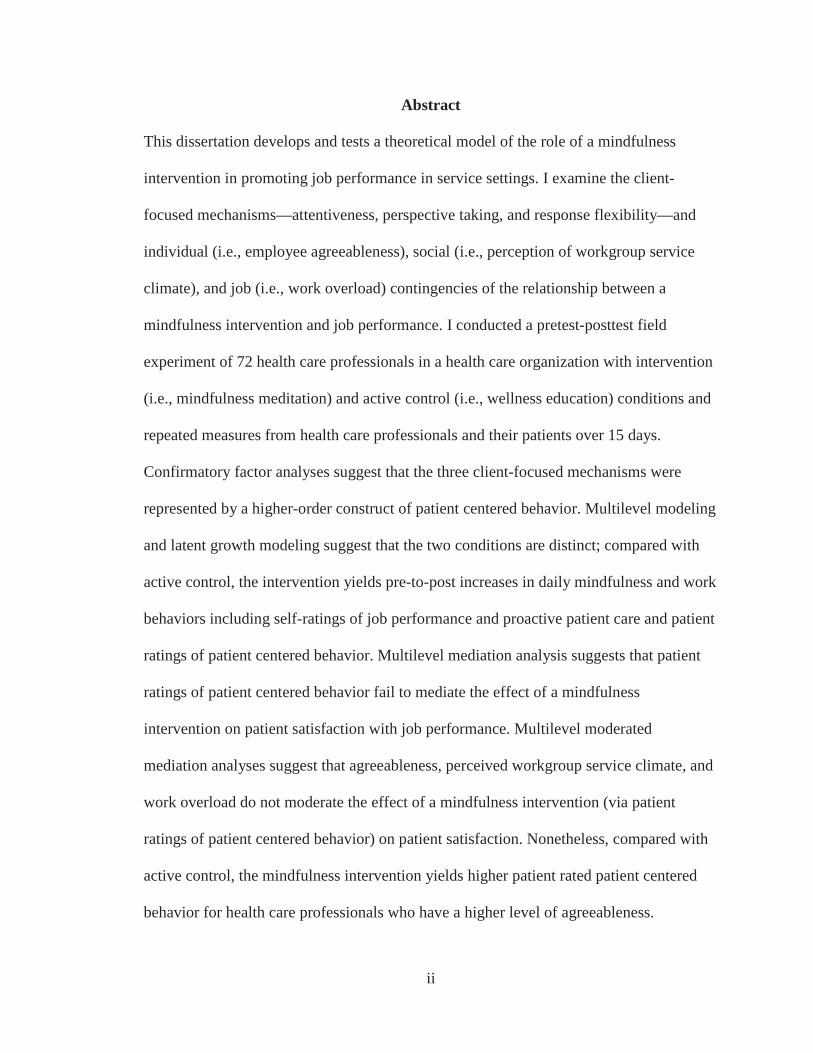
Abstract
This dissertation develops and tests a theoretical model of the role of a mindfulness
intervention in promoting job performance in service settings. I examine the client-
focused mechanisms—attentiveness, perspective taking, and response flexibility—and
individual (i.e., employee agreeableness), social (i.e., perception of workgroup service
climate), and job (i.e., work overload) contingencies of the relationship between a
mindfulness intervention and job performance. I conducted a pretest-posttest field
experiment of 72 health care professionals in a health care organization with intervention
(i.e., mindfulness meditation) and active control (i.e., wellness education) conditions and
repeated measures from health care professionals and their patients over 15 days.
Confirmatory factor analyses suggest that the three client-focused mechanisms were
represented by a higher-order construct of patient centered behavior. Multilevel modeling
and latent growth modeling suggest that the two conditions are distinct; compared with
active control, the intervention yields pre-to-post increases in daily mindfulness and work
behaviors including self-ratings of job performance and proactive patient care and patient
ratings of patient centered behavior. Multilevel mediation analysis suggests that patient
ratings of patient centered behavior fail to mediate the effect of a mindfulness
intervention on patient satisfaction with job performance. Multilevel moderated
mediation analyses suggest that agreeableness, perceived workgroup service climate, and
work overload do not moderate the effect of a mindfulness intervention (via patient
ratings of patient centered behavior) on patient satisfaction. Nonetheless, compared with
active control, the mindfulness intervention yields higher patient rated patient centered
behavior for health care professionals who have a higher level of agreeableness.
iii
Table of Contents
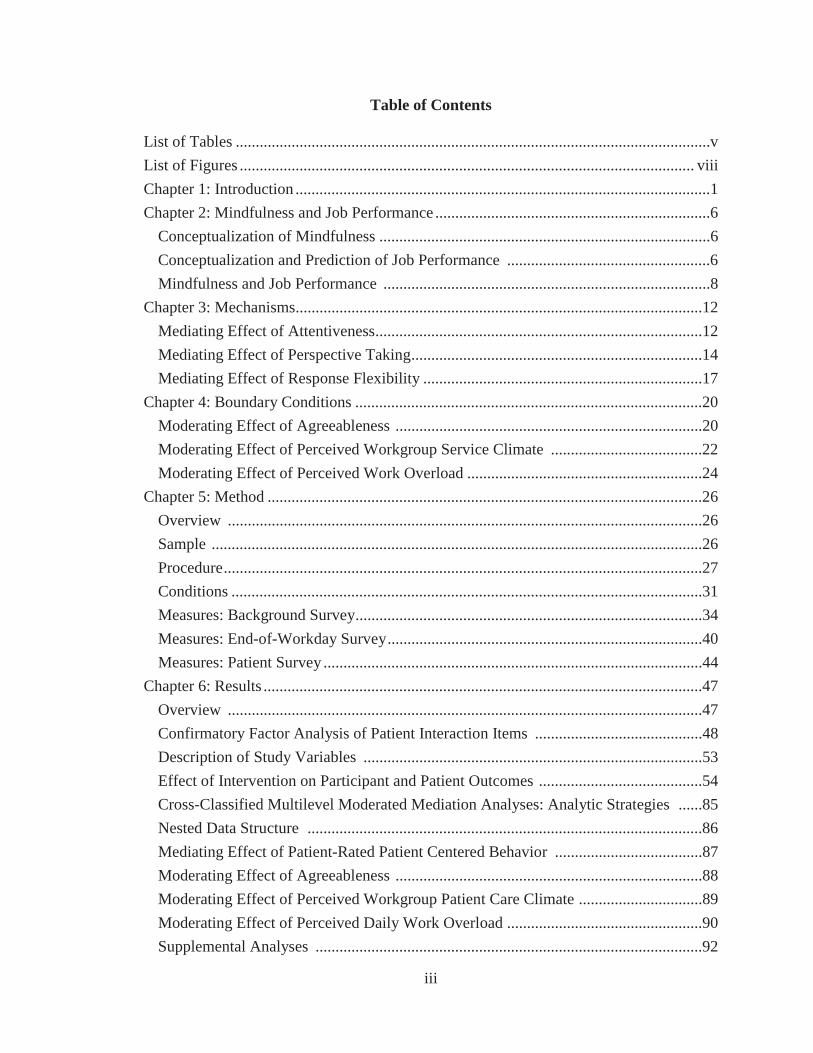
List of Tables .......................................................................................................................vList of Figures .................................................................................................................. viiiChapter 1: Introduction ........................................................................................................1Chapter 2: Mindfulness and Job Performance .....................................................................6
Conceptualization of Mindfulness ...................................................................................6Conceptualization and Prediction of Job Performance ...................................................6Mindfulness and Job Performance ..................................................................................8
Chapter 3: Mechanisms......................................................................................................12Mediating Effect of Attentiveness..................................................................................12Mediating Effect of Perspective Taking.........................................................................14Mediating Effect of Response Flexibility ......................................................................17
Chapter 4: Boundary Conditions .......................................................................................20Moderating Effect of Agreeableness .............................................................................20Moderating Effect of Perceived Workgroup Service Climate ......................................22Moderating Effect of Perceived Work Overload ...........................................................24
Chapter 5: Method .............................................................................................................26Overview .......................................................................................................................26Sample ...........................................................................................................................26Procedure........................................................................................................................27Conditions ......................................................................................................................31Measures: Background Survey.......................................................................................34Measures: End-of-Workday Survey...............................................................................40Measures: Patient Survey ...............................................................................................44
Chapter 6: Results ..............................................................................................................47Overview .......................................................................................................................47Confirmatory Factor Analysis of Patient Interaction Items ..........................................48Description of Study Variables .....................................................................................53Effect of Intervention on Participant and Patient Outcomes .........................................54Cross-Classified Multilevel Moderated Mediation Analyses: Analytic Strategies ......85Nested Data Structure ...................................................................................................86Mediating Effect of Patient-Rated Patient Centered Behavior .....................................87Moderating Effect of Agreeableness .............................................................................88Moderating Effect of Perceived Workgroup Patient Care Climate ...............................89Moderating Effect of Perceived Daily Work Overload .................................................90Supplemental Analyses .................................................................................................92
iv
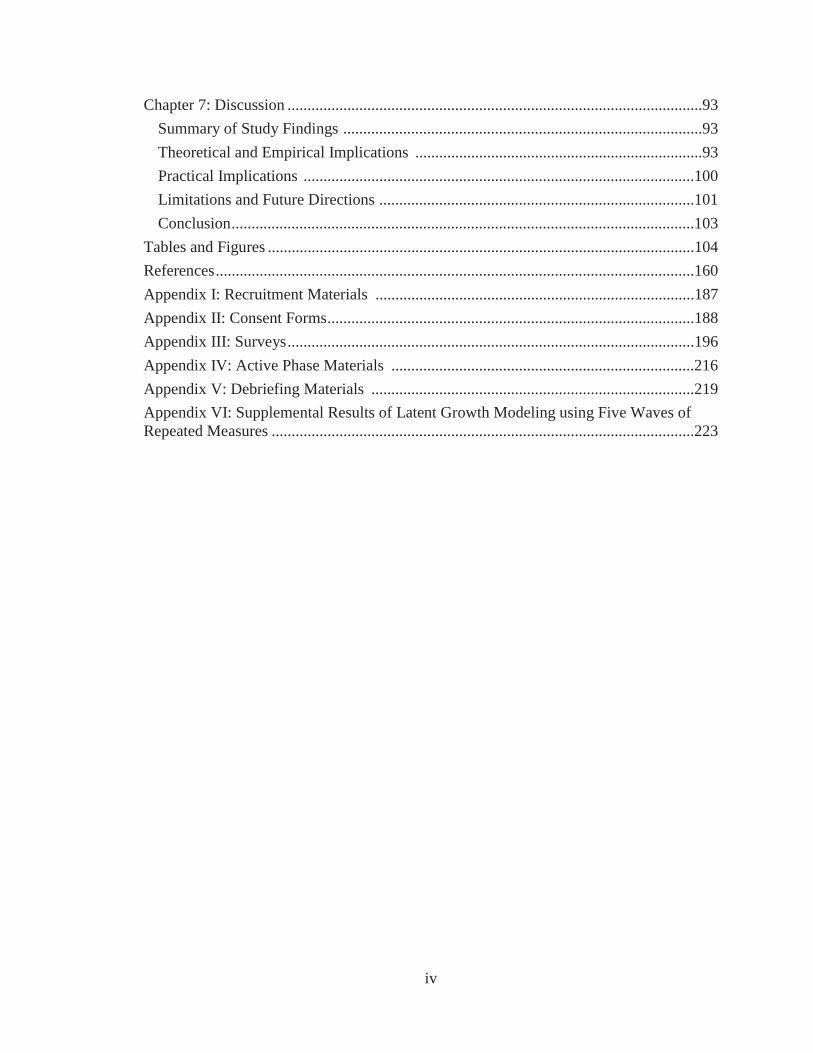
Chapter 7: Discussion ........................................................................................................93Summary of Study Findings ..........................................................................................93Theoretical and Empirical Implications ........................................................................93Practical Implications ..................................................................................................100Limitations and Future Directions ...............................................................................101Conclusion....................................................................................................................103
Tables and Figures ...........................................................................................................104References........................................................................................................................160Appendix I: Recruitment Materials ................................................................................187Appendix II: Consent Forms............................................................................................188Appendix III: Surveys......................................................................................................196Appendix IV: Active Phase Materials ............................................................................216Appendix V: Debriefing Materials .................................................................................219Appendix VI: Supplemental Results of Latent Growth Modeling using Five Waves of Repeated Measures ..........................................................................................................223
v
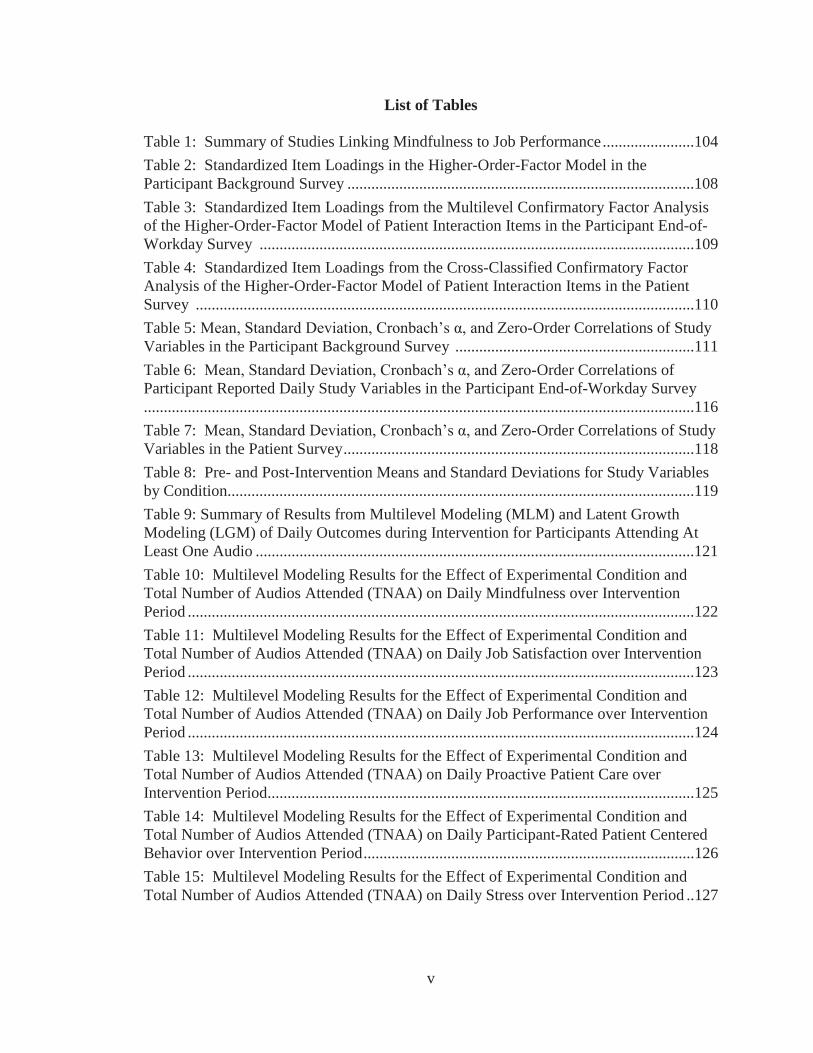
List of Tables
Table 1: Summary of Studies Linking Mindfulness to Job Performance.......................104Table 2: Standardized Item Loadings in the Higher-Order-Factor Model in the Participant Background Survey .......................................................................................108Table 3: Standardized Item Loadings from the Multilevel Confirmatory Factor Analysis of the Higher-Order-Factor Model of Patient Interaction Items in the Participant End-of-Workday Survey .............................................................................................................109Table 4: Standardized Item Loadings from the Cross-Classified Confirmatory Factor Analysis of the Higher-Order-Factor Model of Patient Interaction Items in the Patient Survey .............................................................................................................................110Table 5: -Order Correlations of Study Variables in the Participant Background Survey ............................................................111Table 6: -Order Correlations of Participant Reported Daily Study Variables in the Participant End-of-Workday Survey..........................................................................................................................................116Table 7: -Order Correlations of Study Variables in the Patient Survey........................................................................................118Table 8: Pre- and Post-Intervention Means and Standard Deviations for Study Variables by Condition.....................................................................................................................119Table 9: Summary of Results from Multilevel Modeling (MLM) and Latent Growth Modeling (LGM) of Daily Outcomes during Intervention for Participants Attending At Least One Audio ..............................................................................................................121Table 10: Multilevel Modeling Results for the Effect of Experimental Condition and Total Number of Audios Attended (TNAA) on Daily Mindfulness over Intervention Period ...............................................................................................................................122Table 11: Multilevel Modeling Results for the Effect of Experimental Condition and Total Number of Audios Attended (TNAA) on Daily Job Satisfaction over Intervention Period ...............................................................................................................................123Table 12: Multilevel Modeling Results for the Effect of Experimental Condition andTotal Number of Audios Attended (TNAA) on Daily Job Performance over Intervention Period ...............................................................................................................................124Table 13: Multilevel Modeling Results for the Effect of Experimental Condition and Total Number of Audios Attended (TNAA) on Daily Proactive Patient Care over Intervention Period...........................................................................................................125Table 14: Multilevel Modeling Results for the Effect of Experimental Condition and Total Number of Audios Attended (TNAA) on Daily Participant-Rated Patient Centered Behavior over Intervention Period...................................................................................126Table 15: Multilevel Modeling Results for the Effect of Experimental Condition and Total Number of Audios Attended (TNAA) on Daily Stress over Intervention Period ..127
vi
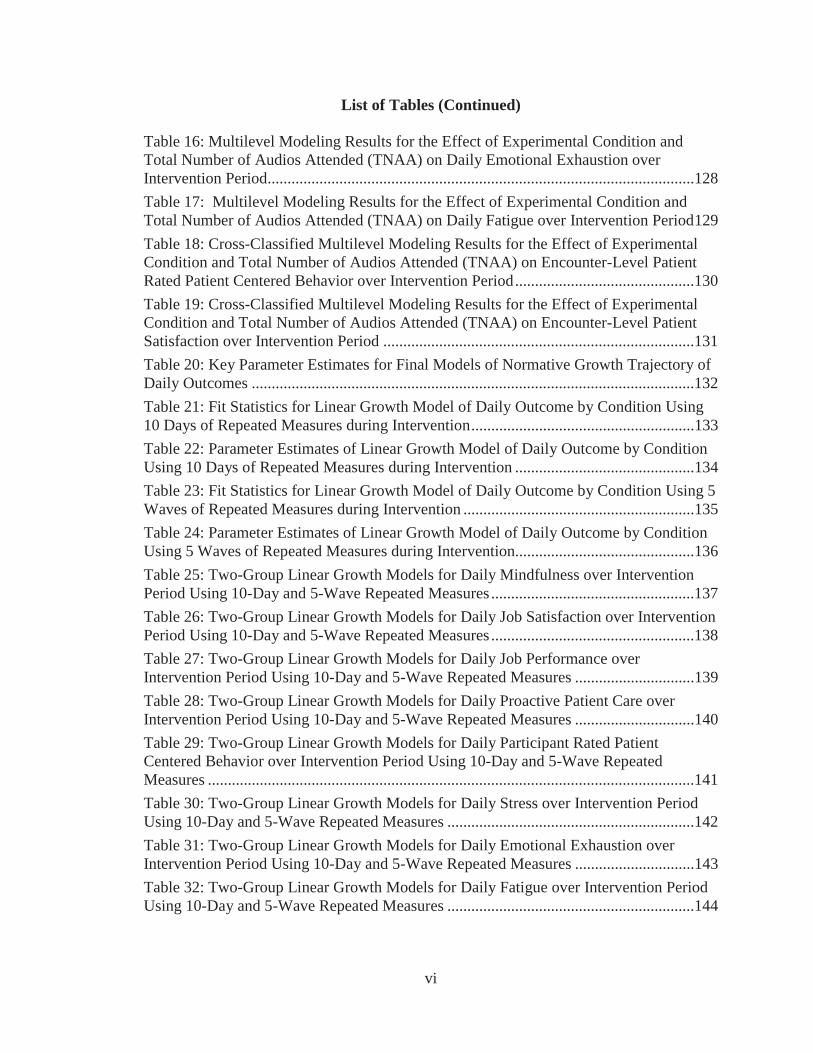
List of Tables (Continued)
Table 16: Multilevel Modeling Results for the Effect of Experimental Condition and Total Number of Audios Attended (TNAA) on Daily Emotional Exhaustion over Intervention Period...........................................................................................................128Table 17: Multilevel Modeling Results for the Effect of Experimental Condition and Total Number of Audios Attended (TNAA) on Daily Fatigue over Intervention Period129Table 18: Cross-Classified Multilevel Modeling Results for the Effect of Experimental Condition and Total Number of Audios Attended (TNAA) on Encounter-Level Patient Rated Patient Centered Behavior over Intervention Period.............................................130Table 19: Cross-Classified Multilevel Modeling Results for the Effect of Experimental Condition and Total Number of Audios Attended (TNAA) on Encounter-Level Patient Satisfaction over Intervention Period ..............................................................................131Table 20: Key Parameter Estimates for Final Models of Normative Growth Trajectory of Daily Outcomes ...............................................................................................................132Table 21: Fit Statistics for Linear Growth Model of Daily Outcome by Condition Using 10 Days of Repeated Measures during Intervention........................................................133Table 22: Parameter Estimates of Linear Growth Model of Daily Outcome by Condition Using 10 Days of Repeated Measures during Intervention .............................................134Table 23: Fit Statistics for Linear Growth Model of Daily Outcome by Condition Using 5 Waves of Repeated Measures during Intervention ..........................................................135Table 24: Parameter Estimates of Linear Growth Model of Daily Outcome by Condition Using 5 Waves of Repeated Measures during Intervention.............................................136Table 25: Two-Group Linear Growth Models for Daily Mindfulness over Intervention Period Using 10-Day and 5-Wave Repeated Measures ...................................................137Table 26: Two-Group Linear Growth Models for Daily Job Satisfaction over Intervention Period Using 10-Day and 5-Wave Repeated Measures ...................................................138Table 27: Two-Group Linear Growth Models for Daily Job Performance over Intervention Period Using 10-Day and 5-Wave Repeated Measures ..............................139Table 28: Two-Group Linear Growth Models for Daily Proactive Patient Care over Intervention Period Using 10-Day and 5-Wave Repeated Measures ..............................140Table 29: Two-Group Linear Growth Models for Daily Participant Rated Patient Centered Behavior over Intervention Period Using 10-Day and 5-Wave Repeated Measures ..........................................................................................................................141Table 30: Two-Group Linear Growth Models for Daily Stress over Intervention Period Using 10-Day and 5-Wave Repeated Measures ..............................................................142Table 31: Two-Group Linear Growth Models for Daily Emotional Exhaustion overIntervention Period Using 10-Day and 5-Wave Repeated Measures ..............................143Table 32: Two-Group Linear Growth Models for Daily Fatigue over Intervention Period Using 10-Day and 5-Wave Repeated Measures ..............................................................144
vii
List of Tables (Continued)
Table 33: Two-Group Linear Growth Models for Daily Patient Rated Patient Centered Behavior over Intervention Period Using 10-Day and 5-Wave Repeated Measures.......145Table 34: Two-Group Linear Growth Models for Daily Patient Satisfaction over Intervention Period Using 10-Day and 5-Wave Repeated Measures ..............................146Table 35: Mean Growth Rate Estimates of Treatment and Active Control Intervention in the Final Two-Group Linear Growth Model of Daily Outcome Using 10-Day and 5-Wave Repeated Measures during Intervention for Participants Attending At Least Five Audios..........................................................................................................................................147Table 36: Cross-Classified Multilevel Mediation Model of Effect of Experimental Condition on Encounter-Specific Patient Satisfaction (PS) via Encounter-Specific Patient-Rated Participants’ Patient Centered Behavior (PCB) ........................................148Table 37: Cross-Classified Multilevel Moderated Mediation Model for Moderating Effect of Participants’ Agreeableness on Effect of Experimental Condition (via Encounter-Specific Patient-Rated Participants’ Patient Centered Behavior [PCB]) on Encounter-Specific Patient Satisfaction (PS) ....................................................................................149Table 38: Cross-Classified Multilevel Moderated Mediation Model for Moderating Effect of Participants’ Perceived Workgroup Patient Care Climate (PWPCC) on Effect of Experimental Condition (via Encounter-Specific Patient-Rated Participants’ Patient Centered Behavior [PCB]) on Encounter-Specific Patient Satisfaction (PS)..................150Table 39: Cross-Classified Multilevel Moderated Mediation Model for Moderating Effect of Participants’ Daily Work Overload on Effect of Experimental Condition (via Encounter-Specific Patient-Rated Participants’ Patient Centered Behavior [PCB]) on Encounter-Specific Patient Satisfaction (PS)...................................................................151Table 40: Cross-Classified Multilevel Moderated Mediation Model for Moderating Effect of Participants’ Agreeableness, Perceived Workgroup Patient Care Climate (PWPCC), and Daily Work Overload on Effect of Experimental Condition (via Encounter-Specific Patient-Rated Participants’ Patient Centered Behavior [PCB]) on Encounter-Specific Patient Satisfaction (PS) ..................................................................................................152Table 41: Participant-Level Path-Analytic Results of Indirect and Total Effects of Experimental Condition (via Encounter-Specific Patient-Rated Participants’ Patient Centered Behavior [PCB]) on Encounter-Specific Patient Satisfaction (PS) at Low and High Levels of Participants’ Agreeableness, Perceived Workgroup Patient Care Climate, and Daily Work Overload, respectively...........................................................................153
viii
List of Figures
Figure 1: Theoretical Model ...........................................................................................154
Figure 2: Daily Data Collection Scheme over 15-Day Period in the Active Phase ........155
Figure 3: Growth Modeling of Repeated Measures of Outcome over 10-Day Intervention Period ..............................................................................................................................156
Figure 4: Moderated Effect of Experimental Condition on Participant Self-Reported Daily Proactive Patient Care at Low and High Levels of Total Number of Audios Attended ..........................................................................................................................157
Figure 5: Moderated Effect of Experimental Condition on Patient Rated Patient Centered Behavior at Low and High Levels of Total Number of Audios Attended ......................158
Figure 6: Moderated Effect of Experimental Condition on Patient Rated Patient Centered Behavior at Low and High Levels of Agreeableness.......................................................159
1
Chapter 1: Introduction
Mindfulness, or the human capacity of nonjudgmental awareness of and attention
to present-moment internal and external experiences (Brown & Ryan, 2003; for a review,
see Hart, Ivtzan, & Hart, 2013), has received surging attention in recent years. A recent
Google search of mindfulness yields about 29 million links and Amazon offers more than
9,200 books about mindfulness. Mindfulness meditation (Kabat-Zinn, 1990), a set of
secular practices aiming to cultivate mindfulness and well-being, has entertained
increasing popularity throughout the United States; numerous meditation centers have
blossomed across communities and a multitude of “apps” for mindfulness exercises have
been created. Organizations, such as Google, Apple, and General Mills, have begun to
incorporate customized mindfulness-based practices into employees’ work lives to
diffuse stress and promote well-being.
In addition to attention from the populace, researchers from a variety of
disciplines, ranging from psychiatry to neuroscience to applied psychology, have devoted
considerable scholarly attention to mindfulness. Research abounds attesting to the
beneficial roles mindfulness and mindfulness-based practices play for healthy and clinical
populations in cognitive and physiological functioning, emotion regulation, stress
reduction, interpersonal relationships, and mental and physical health (for reviews, see
Brown, Ryan, & Creswell, 2007; Chiesa & Serretti, 2010; Glomb, Duffy, Bono, & Yang,
2011; H lzel et al., 2011; Keng, Smoski, & Robins, 2011; for meta-analyses, see
Bohlmeijer, Prenger, Taal, & Cuijpers, 2010; Chiesa & Serretti, 2009; Grossman,
Niemann, Schmidt, & Walach, 2004; Hofmann, Sawyer, Witt, & Oh, 2010; Sedlmeier et
al., 2012).
2
Recent developments in organizational research also suggest that mindfulness and
mindfulness-based practices have implications for work-related attitudinal and well-being
outcomes, including job satisfaction (Hülsheger, Alberts, Feinholdt, & Lang, 2013; Reb,
Narayanan, & Ho, 2015), stress and burnout (Aikens et al., 2014; Bazarko, Cate, Azocar,
& Kreitzer, 2013; Beddoe & Murphy, 2004; Fortney, Luchterhand, Zakletskaia, Zgierska,
& Rakel, 2013; Krasner et al., 2009; Roeser et al., 2013; Wolever et al., 2012), anxiety
and depression (Roche, Haar, & Luthans, 2014), work-family conflict and balance (Allen
& Kiburz, 2012; Kiburz, 2012), resilience (Aikens et al., 2014), and sleep quality
(Hülsheger et al., 2014; Wolever et al., 2012). Qualitative research has also identified
changes in worker outcomes, such as reduced stress and burnout, as a result of
mindfulness training (Beckman et al., 2012; Irving et al., 2014). Recent research focusing
on mindfulness and work-related behaviors has suggested that higher dispositional
mindfulness was associated with higher communication quality (Beach et al., 2013) and a
mindfulness training facilitated employee engagement (Leroy, Anseel, Dimitrova, &
Sels, 2013). A recent study has also suggested that mindfulness meditation attenuates
retaliatory responses to injustice (Long & Christian, 2015).
A small but growing body of research has focused attention on the role
mindfulness and mindfulness-based practices play in affecting job performance, an
important criteria in the workplace. Yet the limited evidence so far has revealed an
equivocal link between mindfulness and job performance. Some studies have
demonstrated positive relationships between dispositional mindfulness and task
performance (Dane & Brummel, 2014; Reb et al., 2015), whereas others have yielded
nonsignificant relationships (Shao & Skarlicki, 2009; Zhang, Ding, Li, & Wu, 2013).
3
Evidence from a field intervention (Giluk, 2010) has suggested that mindfulness-based
practices fall short in producing within-person performance increments over time. These
inconsistent findings point to the possibility that the role of mindfulness and mindfulness-
based practices in job performance may be conditional or indirect. Indeed, recent
theorizing has highlighted task and contextual features as contingencies for the
performance effect of mindfulness (Dane, 2011; Glomb et al., 2011), and extant empirical
research, where mediating mechanisms are often unexamined or unsupported, remains
silent with regard to the theoretical pathways by which mindfulness links to performance
(Dane & Brummel, 2014; Giluk, 2010; Reb et al., 2015; Shao & Skarlicki, 2009; Zhang
et al., 2013). Past research has relied heavily on research designs using correlational data,
single-group intervention with pre- and post-tests, or random assignment without active
control groups, which have drawbacks in making strong causal inferences (Goyal et al.,
2014; MacCoon et al., 2012; Shadish, Cook, & Campbell, 2002). Indeed, in a recent
meta-analysis of meditation research, Sedlmeier et al. (2012) removed almost 75% of the
initially identified studies due to methodological problems. A recent review of stress
management and well-being promotion interventions in the workplace advocates that
scholars should “strive to identify comparison groups” (Tetrick & Winslow, 2015, p.
599). Overall, organizational research is at the dawn of fully understanding why and when
mindfulness and mindfulness-based practices may influence job performance. As Glomb
and her colleagues noted, “The time is ripe to carefully examine the role that mindfulness
might play in the performance and well-being of individuals at work” (Glomb et al.,
2011, p.116).

4
This dissertation aims to address the “why and when” questions by examining the
theoretical pathways of, and contingencies for, the association between a micro
mindfulness intervention and job performance in service settings. Drawing on Glomb et
al.’s (2011) self-regulation framework of mindfulness, I propose that a mindfulness
intervention, compared with an active control intervention, promotes other-focused work
behaviors, which, in turn, contribute to job performance. I focus on three other-focused
work behaviors: (1) attentiveness, (2) perspective taking, and (3) response flexibility. In
response to the recent call for better understanding of dispositional and organizational
factors influencing how individuals respond to workplace interventions (Tetrick &
Winslow, 2015), I examined the boundary condition in which the proposed mediation
chain may be strengthened with a focus on the factors influencing the effect of a
mindfulness intervention on client-focused work behaviors. I focused on three boundary
conditions: workers’ dispositional agreeableness as an individual contingency, perceived
workgroup service climate as a social contingency, and perceived work overload as a job
contingency. Figure 1 depicts the theoretical model.
Using health care professionals in a health care organization in the United States,
I conducted a pretest-posttest field experiment with intervention (i.e., mindfulness
meditation) and active control (i.e., wellness education) groups and with repeated
measures from participants and patients over 15 days. I focused on a health care setting
because the health care industry is one of the biggest contributors of U.S. economy and
health care workers amount to more than 14 million in 2010, approximately 10% of the
U.S. workforce (U.S. Department of Health and Human Services, 2013). The rigorous
design that randomly assigns participants into conditions and uses an active control
5
condition allows for making stronger causal inferences of the effect of mindfulness
intervention. Because the active control group closely parallels design elements of the
treatment group except contents of treatment, I examined whether treatment and active
control have differential impact on an array of workers’ attitudinal, work, and well-being
outcomes.
This dissertation contributes to management research in three important ways.
First, I extend the management literature by explicating client-focused work behaviors in
terms of attentiveness, perspective taking, and response flexibility as underlying
mechanisms of the role of a mindfulness intervention on job performance, offering a
fuller account of the “active ingredients” of mindfulness at work (Glomb et al., 2011, p.
143). Second, I explicate individual, social, and job contingencies that may accentuate the
effect of a mindfulness intervention on client-focused behaviors, thereby identifying the
boundary conditions in which a mindfulness intervention may be more effective. Lastly, I
use a rigorous design to make strong causal inferences of the effect of mindfulness
intervention and provide empirical evidence of the effectiveness of a micro mindfulness
intervention compared with an active control intervention.
Practically, this dissertation provides guidance for management by examining a
customized micro mindfulness exercise that may be incorporated into organizations’
employee wellness initiatives and has the potential to promote employees’ job
performance in the workplace. Such micro interventions, if efficacious, are more likely to
be adopted by organizations and their employees to promote performance and well-being.
6
Chapter 2: Mindfulness and Job Performance
Conceptualization of Mindfulness
Mindfulness has been defined in many ways (e.g., Baer, Smith, Hopkins,
Krietemeyer, & Toney, 2006; Bishop et al., 2004; Brown et al., 2007) with a shared tenet
that mindfulness involves receptive awareness of and attention to present moment
experiences without judgment (Brown et al., 2007). In this dissertation, drawing on
Glomb et al. (2011, p. 119), mindfulness is defined as “a state of consciousness
characterized by receptive attention to and awareness of present events and experiences,
without evaluation, judgment, and cognitive filters” (italics in original; see also Brown &
Ryan, 2003). Mindfulness is inherently a state-like construct; an individual can be more
mindful at a particular moment and less so at another. Mindfulness can be a trait-like
construct that depicts an individual’s average level of state mindfulness over time (e.g.,
Glomb et al., 2011). Mindfulness-based practices, such as mindfulness meditation and
body scan of the Mindfulness-Based Stress Reduction program (Kabat-Zinn, 1990), have
been construed as techniques designed to cultivate mindfulness by fostering present
moment awareness of and attention to internal and external stimuli in an observer stance
without judgment. In this dissertation, I adopt the activity of sitting meditation from the
MBSR as a mindfulness intervention.
Conceptualization and Prediction of Job Performance
Job performance has been commonly conceptualized as task performance,
organizational citizenship behavior, and counterproductive work behaviors (Rotundo &
Sackett, 2002; Motowidlo, 2003). In this dissertation, I focus on task performance,
defined as in-role behaviors that contribute to “the technical core” of a job (Rotundo &
7
Sackett, 2002, p. 67). I focus on task performance because it contributes to organizational
effectiveness and is of growing interest to scholars in mindfulness research (e.g., Dane,
2011; Glomb et al., 2011).
Exploring antecedents of job performance has been a venerable tradition in
organizational research. Decades of investigation have garnered extensive evidence
documenting predictors and correlates of job performance. Research has established a
broad spectrum of correlates and predictors of job performance, including individual
demographic attributes such as age and race (for meta-analyses, see McKay & McDaniel,
2006; Ng & Feldman, 2008; Roth, Huffcutt, & Bobko, 2003), general mental ability (for
a meta-analysis, see Salgado et al., 2003), dispositional attributes such as Big Five
personality traits, positive and negative affectivity, and core self-evaluations (for meta-
analyses, see Barrick & Mount, 1991; Chiaburu, Oh, Berry, Li, & Gardner, 2011;
Dudley, Orvis, Lebiecki, & Cortina, 2006; Hurtz & Donovan, 2000; Ilies, Fulmer,
Spitzmuller, & Johnson, 2009; Judge & Bono, 2001; Judge, Rodell, Klinger, Simon, &
Crawford, 2013; Kaplan, Bradley, Luchman, & Haynes, 2009), job attitudes such as
commitment, satisfaction, and justice perceptions (for meta-analyses, see Colquitt et al.,
2001; Colquitt et al., 2013; Cooper-Hakim & Viswesvaran, 2005; Hoffman, Blair,
Meriac, & Woehr, 2007; Judge, Thoresen, Bono, & Patton, 2001; Lee, Carswell, & Allen,
2000; LePine, Erez, & Johnson, 2002; Wright & Bonett, 2002), supervisor attributes such
as supervisory support and leader-member exchange (for meta-analyses, see Ilies,
Nahrgang, & Morgeson, 2007; LePine et al., 2002), and situational factors such as role
stressors, organizational politics, and workplace climate (for meta-analyses, see Carr,
Schmidt, Ford, & DeShon, 2003; Chang, Rosen, & Levy, 2009; Eatough, Chang,
8
Miloslavic, & Johnson, 2011). In summary, despite the rich literature on predictors and
correlates of job performance, fairly sparse research has examined the role of
mindfulness in job performance, with few exceptions, as discussed below.
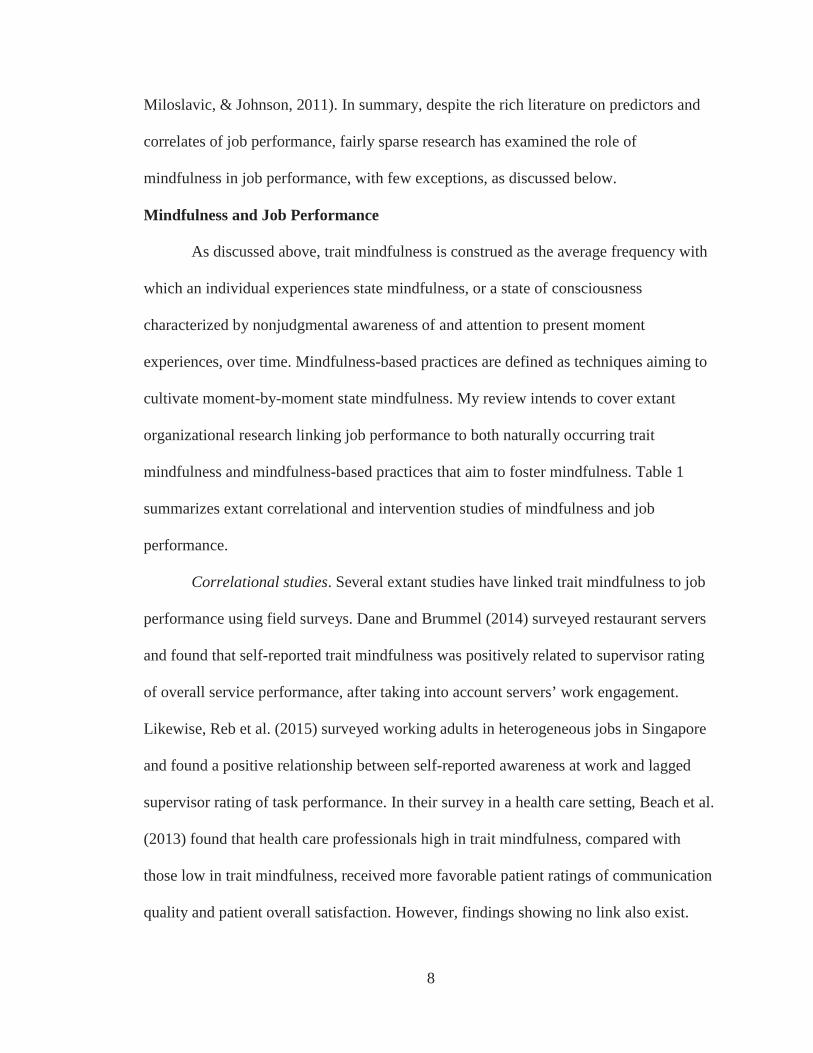
Mindfulness and Job Performance
As discussed above, trait mindfulness is construed as the average frequency with
which an individual experiences state mindfulness, or a state of consciousness
characterized by nonjudgmental awareness of and attention to present moment
experiences, over time. Mindfulness-based practices are defined as techniques aiming to
cultivate moment-by-moment state mindfulness. My review intends to cover extant
organizational research linking job performance to both naturally occurring trait
mindfulness and mindfulness-based practices that aim to foster mindfulness. Table 1
summarizes extant correlational and intervention studies of mindfulness and job
performance.
Correlational studies. Several extant studies have linked trait mindfulness to job
performance using field surveys. Dane and Brummel (2014) surveyed restaurant servers
and found that self-reported trait mindfulness was positively related to supervisor rating
of overall service performance, after taking into account servers’ work engagement.
Likewise, Reb et al. (2015) surveyed working adults in heterogeneous jobs in Singapore
and found a positive relationship between self-reported awareness at work and lagged
supervisor rating of task performance. In their survey in a health care setting, Beach et al.
(2013) found that health care professionals high in trait mindfulness, compared with
those low in trait mindfulness, received more favorable patient ratings of communication
quality and patient overall satisfaction. However, findings showing no link also exist.
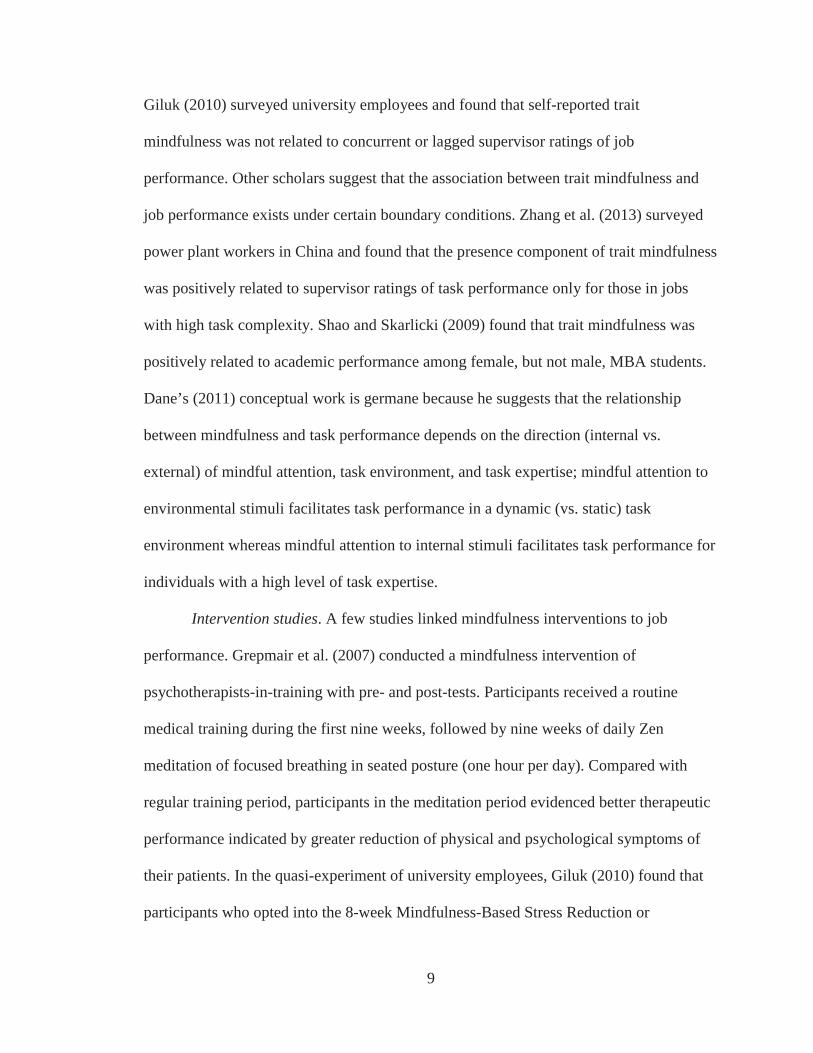
9
Giluk (2010) surveyed university employees and found that self-reported trait
mindfulness was not related to concurrent or lagged supervisor ratings of job
performance. Other scholars suggest that the association between trait mindfulness and
job performance exists under certain boundary conditions. Zhang et al. (2013) surveyed
power plant workers in China and found that the presence component of trait mindfulness
was positively related to supervisor ratings of task performance only for those in jobs
with high task complexity. Shao and Skarlicki (2009) found that trait mindfulness was
positively related to academic performance among female, but not male, MBA students.
Dane’s (2011) conceptual work is germane because he suggests that the relationship
between mindfulness and task performance depends on the direction (internal vs.
external) of mindful attention, task environment, and task expertise; mindful attention to
environmental stimuli facilitates task performance in a dynamic (vs. static) task
environment whereas mindful attention to internal stimuli facilitates task performance for
individuals with a high level of task expertise.
Intervention studies. A few studies linked mindfulness interventions to job
performance. Grepmair et al. (2007) conducted a mindfulness intervention of
psychotherapists-in-training with pre- and post-tests. Participants received a routine
medical training during the first nine weeks, followed by nine weeks of daily Zen
meditation of focused breathing in seated posture (one hour per day). Compared with
regular training period, participants in the meditation period evidenced better therapeutic
performance indicated by greater reduction of physical and psychological symptoms of
their patients. In the quasi-experiment of university employees, Giluk (2010) found that
participants who opted into the 8-week Mindfulness-Based Stress Reduction or

10
Mindfulness-Based Cognitive Therapy group showed higher supervisor rating of
performance at 4-week follow-up (but not immediately after training) compared with
those choosing not to practice meditation. In a field experiment of middle managers,
Shonin, Gordon, Dunn, Singh, & Griffiths (2014) suggest that, compared with an active
control of cognitive-behavioral theories education, 8-week mindfulness awareness
training led to higher improvements of job performance.
In summary, past research using field surveys reveals an equivocal link between
trait mindfulness and job performance and offered a limited few boundary conditions for
a positive relationship between mindfulness and job performance. Similarly, the
underlying mechanisms linking mindfulness to job performance are largely unknown.
Thus, theory must be developed to determine the key pathways by which mindfulness
may result in improved performance and the conditions under which this is more or less
likely.
Methodologically, past intervention studies, despite varying mindfulness practices
employed, tend to suggest that mindfulness intervention is beneficial for job
performance. Nonetheless, those studies bear important limitations. Research designs that
use a single treatment group without control group or allow participants to self-select into
conditions fall short in making strong causal inferences of the performance effect of
mindfulness interventions (Shadish et al., 2002). Comparing mindfulness intervention
with a nonactive control group (e.g., waitlist or work as usual) does not provide strong
confidence in concluding that any observed effect is attributable to the content of
mindfulness intervention rather than the process of carrying out the intervention (Cook &
Campbell, 1979). A mindfulness intervention with strong design entails randomization of
11
participants and inclusion of a carefully chosen active control condition (Goyal et al.,
2014). Therefore, it is a timely endeavor to rigorously investigate the role of mindfulness
in job performance.
In this dissertation, I focus on job performance in service settings. Service settings
constitute a dynamic task environment involving interactions with clients. Individuals
with a higher level of mindfulness are capable of directing heightened attention to service
requests from clients and mobilize cognitive, physical, and affective resources to perform
service tasks. Supporting evidence comes from the correlational study suggesting that
clinicians higher in trait mindfulness showed better communication quality with patients
(Beach et al., 2013) and the field intervention suggesting that mindful awareness training
led to higher job performance, compared with active control (Shonin et al., 2014).
Hypothesis 1: Compared with active control, mindfulness intervention
leads to higher job performance.
12
Chapter 3: Mechanisms
In this section, I propose that a mindfulness intervention promotes client-focused
behaviors, in terms of attentiveness, perspective taking, and response flexibility, which,
in turn, translates into favorable job performance in service settings. I focus on client-
focused behaviors as interpersonal mechanisms because they are at the heart of successful
performance in service settings. As Ryan and Ployhart (2003) noted, “a focus on the
customer has become a major component of organizational strategies, regardless of
whether the organization is in the service or manufacturing sector” (p. 377).
Mediating Effect of Attentiveness
Drawing on the interpersonal communication and therapeutic literatures (Cegala,
Savage, Brunner, & Conrad, 1982; Duncan, Coatsworth, & Greenberg, 2009; Egan,
2014), I conceptualize attentiveness in service settings as the act of paying attention to
clients’ verbal and nonverbal communicative behaviors. Often viewed as an integral
component of listening, attentiveness has been of interest to researchers in a wide variety
of interpersonal settings, including social interaction (Bodie, 2011; Cegala et al., 1982),
parent-child interaction (Duncan et al., 2009), and physician-patient interaction (Egan,
2014). For example, in their study on interaction between parents and their children,
Duncan et al. (2009) highlighted parents’ paying full attention as behaviors of accurately
noticing children’s verbal and behavioral cues. Similarly, paying attention to patients’
verbal and nonverbal cues has been an integrative component of active listening training
among health care professionals (Egan, 2014).
Paying attention is at the heart of mindfulness and mindfulness practices. Kabat-
Zinn (2003, p. 145) describes mindfulness as “the awareness that emerges through paying
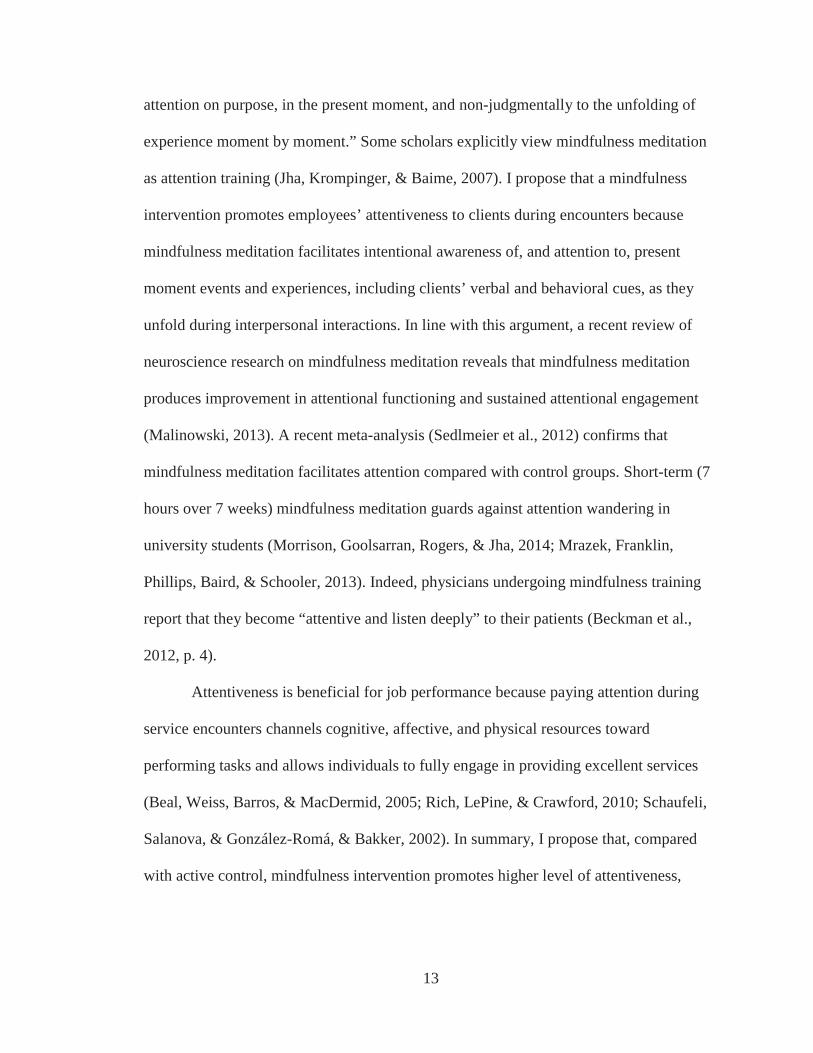
13
attention on purpose, in the present moment, and non-judgmentally to the unfolding of
experience moment by moment.” Some scholars explicitly view mindfulness meditation
as attention training (Jha, Krompinger, & Baime, 2007). I propose that a mindfulness
intervention promotes employees’ attentiveness to clients during encounters because
mindfulness meditation facilitates intentional awareness of, and attention to, present
moment events and experiences, including clients’ verbal and behavioral cues, as they
unfold during interpersonal interactions. In line with this argument, a recent review of
neuroscience research on mindfulness meditation reveals that mindfulness meditation
produces improvement in attentional functioning and sustained attentional engagement
(Malinowski, 2013). A recent meta-analysis (Sedlmeier et al., 2012) confirms that
mindfulness meditation facilitates attention compared with control groups. Short-term (7
hours over 7 weeks) mindfulness meditation guards against attention wandering in
university students (Morrison, Goolsarran, Rogers, & Jha, 2014; Mrazek, Franklin,
Phillips, Baird, & Schooler, 2013). Indeed, physicians undergoing mindfulness training
report that they become “attentive and listen deeply” to their patients (Beckman et al.,
2012, p. 4).
Attentiveness is beneficial for job performance because paying attention during
service encounters channels cognitive, affective, and physical resources toward
performing tasks and allows individuals to fully engage in providing excellent services
(Beal, Weiss, Barros, & MacDermid, 2005; Rich, LePine, & Crawford, 2010; Schaufeli,
Salanova, & González-Romá, & Bakker, 2002). In summary, I propose that, compared
with active control, mindfulness intervention promotes higher level of attentiveness,
14
which, in turn, leads to higher job performance. Because other client-focused
mechanisms are discussed, I propose attentiveness as a partial mediator.
Hypothesis 2: Compared with active control, mindfulness intervention
leads to higher job performance and the effect is partially mediated by
attentiveness.
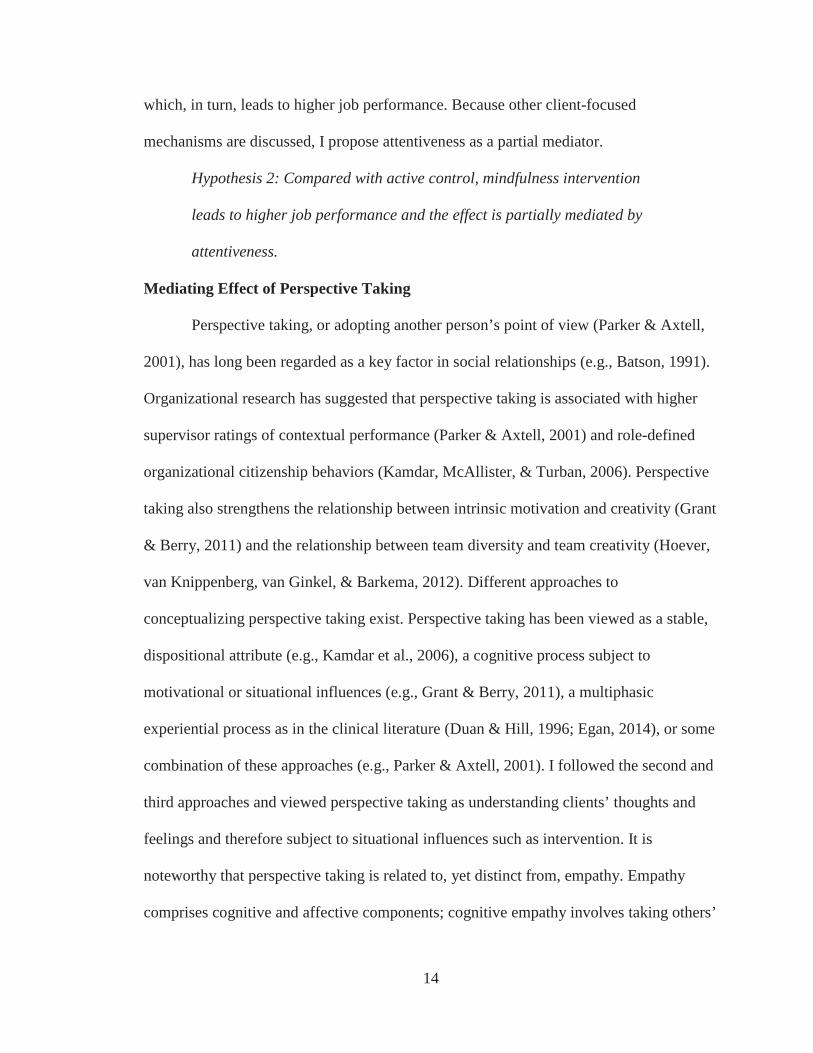
Mediating Effect of Perspective Taking
Perspective taking, or adopting another person’s point of view (Parker & Axtell,
2001), has long been regarded as a key factor in social relationships (e.g., Batson, 1991).
Organizational research has suggested that perspective taking is associated with higher
supervisor ratings of contextual performance (Parker & Axtell, 2001) and role-defined
organizational citizenship behaviors (Kamdar, McAllister, & Turban, 2006). Perspective
taking also strengthens the relationship between intrinsic motivation and creativity (Grant
& Berry, 2011) and the relationship between team diversity and team creativity (Hoever,
van Knippenberg, van Ginkel, & Barkema, 2012). Different approaches to
conceptualizing perspective taking exist. Perspective taking has been viewed as a stable,
dispositional attribute (e.g., Kamdar et al., 2006), a cognitive process subject to
motivational or situational influences (e.g., Grant & Berry, 2011), a multiphasic
experiential process as in the clinical literature (Duan & Hill, 1996; Egan, 2014), or some
combination of these approaches (e.g., Parker & Axtell, 2001). I followed the second and
third approaches and viewed perspective taking as understanding clients’ thoughts and
feelings and therefore subject to situational influences such as intervention. It is
noteworthy that perspective taking is related to, yet distinct from, empathy. Empathy
comprises cognitive and affective components; cognitive empathy involves taking others’

15
perspectives while affective empathy relates to emotional concern and caring of others
(Vachon, Lynam, & Johnson, 2014).
Mindfulness and mindfulness practices are conducive for an individual to put
oneself in others’ shoes because mindfulness practices promote clarity and understanding
of one’s own mind and inner state, which serves as the scaffolding for deep
understanding of others’ thoughts, feelings, and experiences (Cozolino, 2006; Glomb et
al., 2011; Siegel, 2007). Mindfulness practices facilitate deep awareness and knowledge
of internal states through disentangling the self from experiences and reducing
automaticity (Glomb et al., 2011).
Individuals have the innate tendency to use the self as the reference point in
perceiving, evaluating, and reacting to internal and external stimuli. As a primary
appraisal process, individuals consider an event or experience starting with the questions
of whether it is relevant to my needs, beneficial for my well-being, and congruent with
my goals (Lazarus, 1991). Despite its clear benefits for survival, self-referential
processing can paradoxically cloud insights in one’s own mind. For example, positive
emotions arise as one perceives events as advantageous to oneself (Weiss & Cropanzano,
1996). Charged with positive affect, heuristic processing ensues which can curb deep
awareness and understanding of one’s thoughts and internal states (e.g., Forgas, 1995).
Mindfulness facilitates decoupling self from events and experiences by allowing a
receptive, nonjudgmental stance (Brown et al., 2007; Glomb et al., 2011). With
mindfulness, an individual perceives present moment thoughts, feelings, and events as
mental objects rather than what they mean to one’s self (Feldman, Greeson, & Senville,
2010; Shapiro, Carlson, Astin, & Freedman, 2006). Correlational evidence suggests that
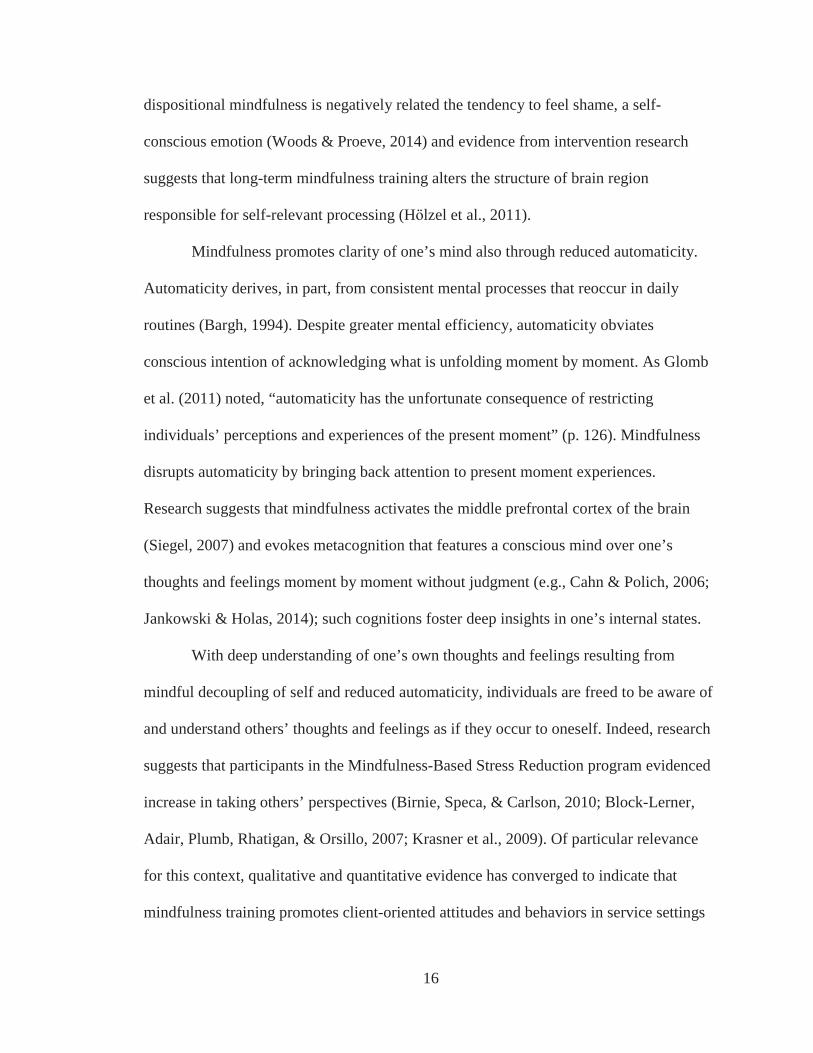
16
dispositional mindfulness is negatively related the tendency to feel shame, a self-
conscious emotion (Woods & Proeve, 2014) and evidence from intervention research
suggests that long-term mindfulness training alters the structure of brain region
responsible for self-relevant processing (H lzel et al., 2011).
Mindfulness promotes clarity of one’s mind also through reduced automaticity.
Automaticity derives, in part, from consistent mental processes that reoccur in daily
routines (Bargh, 1994). Despite greater mental efficiency, automaticity obviates
conscious intention of acknowledging what is unfolding moment by moment. As Glomb
et al. (2011) noted, “automaticity has the unfortunate consequence of restricting
individuals’ perceptions and experiences of the present moment” (p. 126). Mindfulness
disrupts automaticity by bringing back attention to present moment experiences.
Research suggests that mindfulness activates the middle prefrontal cortex of the brain
(Siegel, 2007) and evokes metacognition that features a conscious mind over one’s
thoughts and feelings moment by moment without judgment (e.g., Cahn & Polich, 2006;
Jankowski & Holas, 2014); such cognitions foster deep insights in one’s internal states.
With deep understanding of one’s own thoughts and feelings resulting from
mindful decoupling of self and reduced automaticity, individuals are freed to be aware of
and understand others’ thoughts and feelings as if they occur to oneself. Indeed, research
suggests that participants in the Mindfulness-Based Stress Reduction program evidenced
increase in taking others’ perspectives (Birnie, Speca, & Carlson, 2010; Block-Lerner,
Adair, Plumb, Rhatigan, & Orsillo, 2007; Krasner et al., 2009). Of particular relevance
for this context, qualitative and quantitative evidence has converged to indicate that
mindfulness training promotes client-oriented attitudes and behaviors in service settings
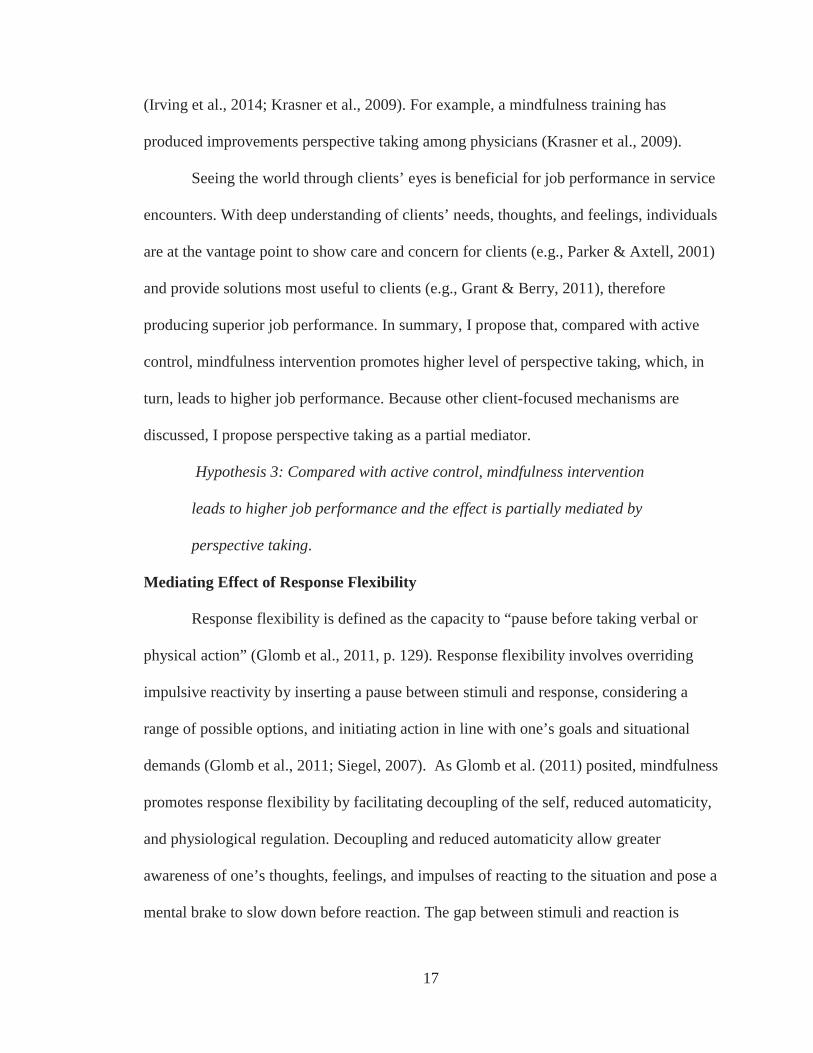
17
(Irving et al., 2014; Krasner et al., 2009). For example, a mindfulness training has
produced improvements perspective taking among physicians (Krasner et al., 2009).
Seeing the world through clients’ eyes is beneficial for job performance in service
encounters. With deep understanding of clients’ needs, thoughts, and feelings, individuals
are at the vantage point to show care and concern for clients (e.g., Parker & Axtell, 2001)
and provide solutions most useful to clients (e.g., Grant & Berry, 2011), therefore
producing superior job performance. In summary, I propose that, compared with active
control, mindfulness intervention promotes higher level of perspective taking, which, in
turn, leads to higher job performance. Because other client-focused mechanisms are
discussed, I propose perspective taking as a partial mediator.
Hypothesis 3: Compared with active control, mindfulness intervention
leads to higher job performance and the effect is partially mediated by
perspective taking.
Mediating Effect of Response Flexibility
Response flexibility is defined as the capacity to “pause before taking verbal or
physical action” (Glomb et al., 2011, p. 129). Response flexibility involves overriding
impulsive reactivity by inserting a pause between stimuli and response, considering a
range of possible options, and initiating action in line with one’s goals and situational
demands (Glomb et al., 2011; Siegel, 2007). As Glomb et al. (2011) posited, mindfulness
promotes response flexibility by facilitating decoupling of the self, reduced automaticity,
and physiological regulation. Decoupling and reduced automaticity allow greater
awareness of one’s thoughts, feelings, and impulses of reacting to the situation and pose a
mental brake to slow down before reaction. The gap between stimuli and reaction is
18
valuable because it allows time and space for individuals to consciously consider the
range of possible alternatives and act in a way that best suits one’s needs and goals
(Siegel, 2007). Better physiological regulation resulting from mindfulness also
contributes to flexible responding because mindfulness down regulates physiological
arousal under stimuli that would otherwise impede one’s capacity to consider alternative
reactions (Cozolino, 2006). Qualitative research suggests that mindfulness meditation
facilitates response flexibility (Beckman et al., 2012). For example, individuals working
in interpersonal settings report that, after mindfulness meditation, they “slow down” and
“come to some wisdom” before answering (Glomb et al., 2011, p. 129). A recent review
also suggests that mindfulness training curbs reactivity and promotes response flexibility
(Davis & Hayes, 2011).
Response flexibility, in turn, facilitates job performance. In service settings,
response flexibility allows thoughtful consideration of the range of response options in an
encounter and initiation of the optimal reaction. The mental process of thinking and
choosing the appropriate behaviors in service encounters contributes to the technical core
of fulfilling one’s duty (Rotundo & Sackett, 2002). Response flexibility is also crucial for
job performance in stressful encounters; individuals refrain from impulsive reactions that
may exacerbate interpersonal conflict (Scott & Duffy, 2015) and choose the optimal
service solution among possible alternatives. In summary, I propose that, compared with
active control, mindfulness intervention promotes higher level of response flexibility,
which, in turn, leads to higher job performance. Because other client-focused
mechanisms are discussed, I propose response flexibility as a partial mediator.

19
Hypothesis 4: Compared with active control, mindfulness intervention
leads to higher job performance and the effect is partially mediated by
response flexibility.
20
Chapter 4: Boundary Conditions
In response to the recent call for understanding dispositional and organizational
factors that influence how individuals respond to workplace interventions (Tetrick &
Winslow, 2015), in this section, I propose trait agreeableness, perceived workgroup
service climate, and perceived work overload as dispositional, social, and job-related
contingencies of the mediated effect of mindfulness intervention on job performance.
Moderating Effect of Agreeableness
Agreeableness refers to the dispositional tendency involving altruism, caring and
rapport building (McCrae & John, 1992). Agreeableness is positively associated with
organizational citizenship behaviors (for a meta-analysis, see Chiaburu et al., 2011), job
satisfaction (for a meta-analysis, see Judge, Heller, & Mount, 2002), affective and
normative commitment (for a meta-analysis, see Choi, Oh, & Colbert, 2015), and
transformational leadership (for a meta-analysis, see Bono & Judge, 2004), and
negatively associated with unsafe work behaviors (for a meta-analysis, see Beus,
Dhanani, & McCord, 2015) and workplace deviance (for a meta-analysis, see Kluemper,
McLarty, & Bing, 2015). Agreeableness has been construed as an other-oriented
personality trait of attending to and concern for others’ needs and well-being (De Dreu
2006; De Dreu & Nauta, 2009; Grant & Wrzesniewski, 2010). As Organ and Lingl
(1995) noted, agreeableness involves “getting along with others in pleasant, satisfying
relationships” (p. 340).
Drawing on the aptitude-treatment interaction theory (Snow, 1991), individuals’
characteristics exert systematic influences on how they react to an intervention. For
example, medical research has focused on the effectiveness of a therapy as a function of

21
individuals’ psychological and biological attributes (e.g., Bockting et al., 2006; Stulz,
Kunzler, Barth, & Hepp, 2014). I propose that agreeableness should affect how
individuals respond to mindfulness intervention. Decades of research suggest that
personality shapes an individual’s motivation, which then directs attention and effort
toward work-related behaviors (Mitchell & Daniels, 2003). As an other-oriented
disposition, agreeableness motivates individuals to focus on information relating to
others’ needs, preferences, and well-being (De Dreu & Nauta, 2009) and engage in
maintaining positive interpersonal relationships (Graziano & Tobin, 2013). It is
reasonable to expect that a mindfulness intervention interacts with agreeableness in
fostering client-focused behaviors in terms of attentiveness, perspective taking, and
response flexibility. Individuals high on agreeableness may be more fertile ground for
mindfulness meditation because they are already dispositionally attuned to the other-
oriented mental and behavioral processes attributable to mindfulness training. Because
mindfulness meditation fosters heightened awareness of and attention to present moment
experiences without judgment (Kabat-Zinn, 1990), for individuals with a high level of
agreeableness, mindfulness training, coupled with the innate motive to be concerned for
others’ welfare and maintain positive relationships with others (e.g., Graziano & Tobin,
2013; Nettle, 2006), produces heightened attention to clients’ verbal and behavioral cues,
stronger effort in understanding clients’ needs and preferences, and more flexibility in
deriving thoughtful reactions to clients. On the contrary, for individuals low on
agreeableness, the client-focused behavioral processes of mindfulness meditation may be
hampered because individuals are less dispositionally motivated to attend to, understand,
and care for others.
22
Given that the client-focused behaviors that mindfulness meditation fosters—
attentiveness, perspective taking, and response flexibility—are expected to link to job
performance and that agreeableness is proposed to influence the effect of mindfulness
meditation on client-focused behaviors, I propose a first-stage moderated indirect effect
(Edwards & Lambert, 2007) of mindfulness intervention on job performance, as stated
below.
Hypothesis 5: Agreeableness moderates the mediated relationship
between mindfulness intervention and job performance (via attentiveness,
perspective taking, and response flexibility, respectively) such that the
indirect effect of mindfulness intervention via (a) attentiveness, (b)
perspective taking, and (c) response flexibility on job performance is
stronger for individuals higher in agreeableness.
Moderating Effect of Perceived Workgroup Service Climate
In the customer service literature, perceived workgroup service climate refers to
an individual’s perception that his or her workgroup emphasizes customer service quality
(Schneider, White, & Paul, 1998). An individual’s perception of service climate derives
from his or her observation and experience of workgroup procedures, practices, and
behaviors regarding the service quality that is expected, supported, and rewarded
(Schneider et al., 1998). Thus, perceived workgroup service climate reflects an
individual’s belief of expected service quality in one’s immediate work environment.
Drawing on norm activation theory (Schwartz, 1977), I propose that perceived
workgroup service climate influences the effect of mindfulness intervention on client-
focused behaviors through internalized obligation to provide quality services. The norm
23
activation theory posits that the awareness of situational demands and consequences of
actions fuels one’s moral obligation to behave toward the norm (Schwartz, 1977). Feeling
a strong service climate, an individual receiving mindfulness meditation would have
heightened awareness that quality service is expected, supported, and rewarded and
develop the obligation to perform well. Striving to provide quality service as prescribed
by the felt obligation, an individual pays attention to clients’ verbal and behavioral cues
without judgment, sees the life through clients’ eyes, and gives thoughtful consideration
before reacting to clients as these are inherently valued in the workgroup. On the
contrary, mindfulness meditation may be less effective for those who perceive lower
workgroup service climate because of weaker internalized obligation to provide quality
service.
Given that client-focused behaviors—attentiveness, perspective taking, and
response flexibility—that mindfulness meditation produces are expected to link to job
performance and that perceived workgroup service climate is expected to influence the
effect of mindfulness meditation on client-focused behaviors, I propose a first-stage
moderated indirect effect (Edwards & Lambert, 2007) of mindfulness intervention on job
performance, as stated below.
Hypothesis 6: Perceived workgroup service climate moderates the
mediated relationship between mindfulness intervention and job
performance (via attentiveness, perspective taking, and response
flexibility, respectively) such that the indirect effect of mindfulness
intervention via (a) attentiveness, (b) perspective taking, and (c) response
24
flexibility on job performance is stronger for individuals who perceive a
higher level of workgroup service climate.
Moderating Effect of Perceived Work Overload
Perceived work overload refers to individuals’ perceptions that “they are engaged
in fulfilling too many responsibilities or activities in light of the time available, their
abilities, and other constraints” (Parker, Johnson, Collins, & Nguyen, 2013. p. 872; see
also Rizzo, House, & Lirtzman, 1970). As an aspect of job demands (Demerouti, Bakker,
Nachreiner, & Schaufeli, 2001), work overload has been considered as a work stressor
and has been linked to increased stress, burnout (e.g., MacDonald, 2003), and work-to-
family conflict (for a meta-analysis, see Michel, Kotrba, Mitchelson, Clark, & Baltes,
2011), and decreased task performance and organizational citizenship behaviors (for a
meta-analysis, see Eatough et al., 2011).
I propose that perceived work overload influences the effect of mindfulness
intervention on client-focused behaviors. Individuals have limited attentional and
cognitive resources (Hobfoll, 1989); deploying these resources to one task tends to
diminish the resources allotted to competing tasks at the same moment (Beal et al., 2005).
According to Hockey (1997), work overload has implications for how individuals
allocate limited attentional resources to achieve performance goals. Under high workload,
individuals may adopt the performance protection strategy by focusing attention on
primary components of the task and diminish attentional focus on its peripheral
components (Hockey, 1997). As Hockey noted on performance under work overload,
“what is perceived as primary is protected, and everything else is dealt with only where
resources permit” (p. 84). Mindfulness meditation involves conscious self-regulation of
25
attention to internal and external experiences moment by moment without judgment
(Kabat-Zinn, 1990; Masicampo & Baumeister 2007). To the extent that work overload
narrows attentional focus on the core aspects of the job (e.g., accuracy and efficiency of
service), mindful awareness of and attention to the peripheral aspects of the job are
inhibited, hampering the self-regulatory effort in obtaining heightened attention to
clients’ verbal and behavioral cures, deep understanding clients’ thoughts and needs, and
thoughtful, flexible responses to clients. On the contrary, under low workload,
mindfulness meditation can mobilize attentional resources with full capacity to attend to,
understand, and react thoughtfully to clients. Disentangling service job performance into
core and peripheral tasks is key to understanding the role of perceived work overload.
Given that the client-focused behaviors—attentiveness, perspective taking, and
response flexibility—that mindfulness meditation fosters are expected to link to job
performance and that perceived work overload will influence the effect of mindfulness
meditation on client-focused behaviors, I propose a first-stage moderated indirect effect
(Edwards & Lambert, 2007) of mindfulness intervention on job performance, as stated
below.
Hypothesis 7: Perceived work overload moderates the mediated
relationship between mindfulness intervention and job performance (via
attentiveness, perspective taking, and response flexibility, respectively)
such that the indirect effect of mindfulness intervention via (a)
attentiveness, (b) perspective taking, and (c) response flexibility on job
performance is stronger for individuals who perceive a lower level of
work overload.
26
Chapter 5: Method
Overview
Participants were health care professionals in a health care organization in
California, United States. I conducted a pretest-posttest field experiment with
intervention (i.e., mindfulness meditation) and active control (i.e., wellness education)
conditions and with repeated measures from employee participants and patients over 15
days. The study included a preliminary phase with a background survey and an active
phase spanning three weeks. During weeks 1 to 3 (Monday to Friday each week, labeled
Day 1 to 15 in the study), participants performed two study tasks: (1) placed a personal
sticker provided by the researcher on a brief survey for each patient they assisted and (2)
completed a short online survey at the end of workday. During week 2 and 3 (Day 6 to
15), an additional study task was added; participants were randomized to conditions and
listened to a 10-minute audio about either (1) mindfulness meditation (treatment
condition) or (2) wellness education (active control condition) each morning prior to the
start of work in designated rooms at work. Figure 2 depicts the data collection scheme in
the active phase.
Sample
Seventy-eight health care professionals expressed interest in participating by
signing up online. Of those 78 indicating interest, 72 completed the background survey
and were enrolled in the study. Thirty-eight (53%) participants were in clinical positions
(e.g., medical assistant, psychotherapist, nurse practitioner) and thirty-four (47%) were in
administrative positions (e.g., patient intake coordinator, referrals specialist, human
resources specialist). Sixty-four participants worked full time (of which 48 worked with
27
patients face-to-face and 16 primarily over the phone) and eight participants worked part
time. Participants were predominantly Hispanic (61%) and White (21%). The distribution
of educational attainment was: graduate or professional degree (MBA, Master’s, Ph.D.,
etc.) (17%), some graduate school (1%), graduated from college (B.A., B.S., or other
Bachelor’s degree) (14%), some college or technical training beyond high school (1-3
years) (53%), graduated from high school or G.E.D. (14%), and some high school (grade
11 or less) (1%). Participants were 93% female, 54% married, and on average 34.0 years
old. On average, participants worked 4.8 years in the organization, 2.6 years in the
current job, 39.7 hours per week, and saw or assisted 22.7 patients in a typical workday.
Twenty-two percent were in supervisory positions.
Procedure
Recruitment. The Chief Executive Officer of the health care organization sent an
email to all employees inviting them to participate in the study. The total number of
employees receiving the email was unavailable. Embedded in the email was a link to the
consent form with detailed study information and sign up procedure. The study was
introduced as the “Worker Wellness Initiative” to examine whether different types of
wellness programs influence worker’s well-being and patient experience. It was made
clear that the study was being conducted by researchers from the University of
Minnesota, participation was completely voluntary, and choosing not to participate would
not affect their relations with their employer. At the start of recruitment, full-time
employees who worked with patients in person were deemed eligible and those who
worked part-time or worked with patients primarily over the phone were placed on the
28
waitlist depending on space availability. All waitlisted employees were eventually
included.
Preliminary and active study phases. In the preliminary phase of the study,
employees who signed up via web recruitment were invited to take a 15-20 minute online
background survey about their jobs, attitudes, behaviors, and characteristics.
During the week prior to the start of the active phase, I was stationed in the break
room to enable participants to check in with me during their breaks to receive a packet
containing instructions of daily activities during the active phase, operation manual of the
audio player, and a set of personal stickers with unique numbers printed on to be attached
to patient surveys.
After completion of the background survey and before the start of the 3-week
active phase (September 15 to October 3, 2014, Monday-Friday), each participant was
randomly assigned into the treatment (i.e., mindfulness meditation) or the active control
condition (i.e., wellness education) using a random number table. The treatment and
active control conditions each included 36 participants. During week 1 (Day 1 to 5),
patients to the clinic received a brief survey upon check in. Participants were asked to
place a personal sticker with a unique number (provided by the researcher) on the survey
for each patient they assisted. During week 1, participants also completed a short online
survey at the end of workday. These activities (patient sticker and end of day online
survey) continued through the study period (Day 1 to 15).
Patient survey procedure. Upon check-in at front desks in the clinic, each patient
received a packet of a short survey, a consent form, and a lottery ticket. Standard scripts
introducing the survey were provided to each front desk personnel. The patient survey,
29
printed on an 8.5” x 11” comment card, asked a patient to rate the first and second (if
any) participants that assisted the patient during the visit as well as general questions
about the visit. No patient identifying information was collected. Several participants
indicated that their patients did not need to go through front desk; they were asked to
distribute survey packets to their patients directly.
Patients rated the first two participants who placed a sticker on the survey.
Numbers printed on the stickers linked patient ratings to health care professionals in our
study. Patients returned completed surveys to one of the two locked collection boxes at
both exits of the clinic. Patients were blind to both the experimental condition the focal
health care professional was assigned to and his or her contents of intervention. I
collected patient surveys from the boxes periodically (at around 10am, noon, 2pm, 4pm,
and 6pm) each day and time stamped each survey. Patients who returned completed
surveys were entered into a drawing of a $25 cash prize for each day of the study day. So
as not to collect patient information, patients were asked to check the website for daily
winning numbers and contact me for the prize. The URL to the website of winning
numbers and contact information was printed on the lottery tickets that uniquely matched
with patient surveys by serial numbers.
A total of 2,018 patient surveys (1,390 in English and 628 in Spanish, two
encounters printed on each survey) were distributed during the three-week period and
1,501 surveys were collected with a response rate of 74.4% (1,055 English surveys
collected: 510 in week 1, 250 in week 2, 287 in week 3, and 8 on unclear date; 446
Spanish surveys collected: 197 in week 1, 123 in week 2, 124 in week 3, and 2 on unclear
date). 56 surveys had no stickers attached for either encounter, 38 surveys had at least
30
one sticker attached but no responses, and 7 additional surveys were discovered other
than in the collection boxes and could not be accurately time stamped. I obtained 1,400
usable patient surveys that had patient ratings for at least one encounter, which produced
patient ratings of 2,075 encounters with 54 health care professionals.
End-of-workday survey procedure. During the active study period (Days 1 to 15),
participants were sent a link to a short online survey each day approximately one hour
prior to the end of their workday, followed by a text message reminder (if they opted to
receive one). They were asked to complete the daily surveys right after finishing their
work and before leaving the workplace. The end-of-workday survey asked about
participants’ well-being and work experience during the day. On the days that
participants did not work, they only answered the questions about sleep, diet, and
exercise yesterday and then exited the survey. During the three-week period, participants
completed 882 of 1,080 daily surveys, yielding an 81.7% response rate. Of 882 surveys,
58 surveys were completed later than the noon of the next day and were removed from
analyses. I obtained 824 usable surveys, including 751 surveys completed on the same
day the survey was sent and 73 completed on the next day before noon (mostly 6am-
10am). Participants completed an average of 11.4 usable daily surveys over 15 days (SD
= 3.9).
Intervention procedure. During week 2 and 3 (Day 6 to 15), the treatment and
control condition activities began. Each day, upon arrival at work, participants checked in
with the researcher for an envelope containing an audio player and a pair of earbuds and
received room assignment. Depending on condition, participants listened to a 10-minute
audio about either (1) mindfulness meditation or (2) wellness education each morning
31
prior to the start of work in designated rooms at work (discussed below). Participants
entered designated rooms, quietly sat in a chair, and listened to the audio. Participants
were asked to return the equipment as soon as they finished the audio. I recorded the time
points that participants checked out and returned the equipment. For participants who
missed the session at the start of work on a given day, a makeup session was available
during the lunch break to listen to the audio content.
Immediately following the last daily survey on the Friday of week 3, participants
took a short online debrief survey asking for their reactions to the study. Participants who
completed at least 80% of daily study activities were compensated for a $100 cash card.
Those who completed fewer than 80% of daily study activities received prorated
payments. A debriefing handout was mailed to participants two weeks after the
conclusion of data collection.
Conditions
Intervention condition. The audio content in the intervention condition was based
on the sitting meditation module in the Mindfulness-Based Stress Reduction program
(MBSR; Kabat-Zinn, 1990). I adapted the audio from the sitting meditation audio CD
narrated by Jean Haley, MBSR Instructor, in the Center for Spirituality and Healing at the
University of Minnesota. The audio contains five 10-minute segments directing
participants to attend to breath, bodily sensations, sound, thoughts, and emotions,
respectively, in a nonjudgmental way. The audios were presented to each participant in a
random order in week 2 (Day 6 to 10) and again in week 3 (Day 11 to 15). The audios
were not described as “mindfulness” or “meditation” to participants.
32
Active control condition. Extant field experiments on mindfulness meditation
commonly adopt nonactive control conditions in which participants were waitlisted or
worked as usual (Aikens et al., 2014; Grepmair et al., 2007; Hülsheger et al., 2013;
Wolever et al., 2012). However, there are concerns as to whether such research designs
are able to conclude that the treatment condition actually worked (Cook & Campbell,
1979; Goyal et al., 2014). An active control condition to match the nonspecific elements
(e.g., length of sessions, audio delivery, and seated posture) of the treatment condition
allows for making stronger causal inferences that the effect of treatment is attributable to
the content rather than implementation of the intervention (Cook & Campbell, 1979;
Goyal et al., 2014). Thus, I selected an active control condition; specifically, wellness
education podcasts that presented scientific information on how to promote health and
well-being (for a similar approach, see Malarkey, Jarjoura, & Klatt, 2013). The active
control condition contains ten 10-minute health education audios on topics of nutrition,
exercise, and social relationships. Topics related to mindfulness or meditation were not
included. Eight audios were adapted from the “15 Minutes to Wellness” podcasts
(American Council on Exercise, 2014), one from the “Health and Longevity” podcast
(LifeTalk Radio, 2013), and one from the “Relationship Matters” podcast (Sage
Publications, 2012). Each participant listened to the audios in a random order in week 2
and 3 (Day 6 to 15). The audio sequences in both conditions were randomized to avoid
participants’ discussing the audio content and potentially guessing conditions. The audio
sequence for each participant was determined and logged prior to the start of active
phase. In each morning session, there was only one audio loaded in the player so
participants could not listen to additional audio content beyond the 10 minutes.
33
To minimize diffusion as a threat to internal validity (Cook & Campbell, 1979),
participants indicated agreement with a statement during enrollment that they would not
share information about their wellness activities with anyone in the organization (e.g.,
their supervisors, coworkers, and patients) for the duration of the study. At the conclusion
of data collection, I probed diffusion among participants with one question: “To what
extent were you aware of the wellness audio content for your coworkers?” (1 = Not at all,
4 = A lot). The average rating of 1.47 (SD = 0.80) suggests that diffusion was not a
concern.
Of the 10 audio segments, participants in the intervention condition attended an
average of 6.78 audios (SD = 3.57, ranging from 0 to 10) and those in the active control
condition attended an average of 6.81 (SD = 3.27, ranging from 0 to 10). Chi-square test
2 (10) = 6.65, p = .76).
Sixty-four participants (32 in the intervention condition and 32 in the active control
condition) attended at least one audio. Fifty-seven participants (27 in the intervention
condition and 30 in the active control condition) attended at least five (50%) audios.
Despite different audio contents in the intervention and active control conditions,
one may argue that both conditions could function similarly because their audios involve
information about certain aspects of well-being. Thus, it is important to verify that the
intervention condition effects changes in outcomes whereas the active control condition
does not. I focus on an array of work related outcomes that have shown, and are
expected, to be susceptible to mindfulness intervention. Research has suggested that,
compared with control group, mindfulness intervention promotes mindfulness (e.g.,
Hülsheger et al., 2013; for a meta-analysis, see Sedlmeier et al 2012) and reduces stress
34
(for a meta-analysis, see Sedlmeier et al., 2012), emotional exhaustion (e.g., Hülsheger et
al., 2013; Krasner et al., 2009), and fatigue (e.g., Zeidan, Johnson, Diamond, David, &
Goolkasian, 2010). Based on my theoretical model described in the previous sections,
mindfulness intervention should also promote performance related behaviors such as
client-focused behaviors (i.e., attentiveness, perspective taking, and response flexibility)
and proactive patient care. As detailed in the Results section, I examine whether the
intervention and active control conditions have differential impact on the above outcomes
using multilevel modeling and latent growth modeling. All variables assessed were
shown below.
Measures: Background Survey
Job autonomy was assessed using the revised three-item job autonomy measure
(Idaszak & Drasgow, 1987) from the Job Diagnostic Survey (Hackman & Oldham,
1975). Consistent with Grandey, Fisk, & Steiner (2005), responses were on an agreement
scale (1 = “strongly disagree” to 7 = “strongly agree”). A sample item was “The job gives
= .76).
Job satisfaction was measured using five items from the Brayfield Rothe scale
(Brayfield & Rothe, 1951). The five-item measure has been used in past research (e.g.,
Bono & Judge, 2003; Judge, Bono, & Locke, 2000). Responses were on an agreement
scale (1 = “strongly disagree” to 7 = “strongly agree”). Sample items were “I feel fairly
= .84).
35
Job stress was measured with two items from the four-item measure developed by
Motowidlo, Packard, and Manning (1986). Responses were on an agreement scale (1 =
“strongly disagree” to 7 = “strongly agree”). The two items were “I feel a great deal of
= .67).
Emotional exhaustion was measured using five items with the highest factor
loadings from the emotional exhaustion scale of the Maslach Burnout Inventory (Maslach
& Jackson, 1981). Responses were on an agreement scale (1 = “strongly disagree” to 7 =
“strongly agree”). Sample items were “I feel emotionally drained from my work” and “I
Supervisor support was measured by six high-loading items from the Perceived
Organizational Support measure (Eisenberger, Armeli, Rexwinkel, Lynch, & Rhoades,
2001). I modified items in reference to one’s immediate supervisor rather than the
organization. Responses were on an agreement scale (1 = “strongly disagree” to 7 =
“strongly agree”). Sample items were “My supervisor values my contributions” and “My
supervisor really cares about my well-
Coworker support was measured by six items from the short version of the
Inventory of Socially Supportive Behavior (Barrera, Sandler, & Ramsay, 1981), which
assesses perception of supportive behaviors and has been used in prior studies (e.g.,
Duffy, Scott, Shaw, Tepper, & Aquino, 2012). The selected items were relevant to the
health care setting. Respondents indicated how frequently their closest coworkers had
enacted these behaviors in the past month, using a six-point scale (1 = “never” to 6 =
36
“every day”). Sample items were “pitched in to help you do something that needed to be
Task self-efficacy was measured by four items adapted from the 8-item New
General Self-Efficacy Scale (Chen, Gully, & Eden, 2001). Items were selected based on
context relevance. “At work...” preceded each item. Responses were on an agreement
scale (1 = “strongly disagree” to 7 = “strongly agree”). Sample items were: “I am
confident that I can perform effectively on many different tasks” and “I will be able to
Core job performance was measured by four items with the stem “How often do
you…” using a seven-point frequency scale (1 = “never” to 7 = “always”). Two items
were from the in-role performance measure (Williams & Anderson, 1991): “perform the
tasks that are expected as part of your job” and “meet performance expectations.” The
other two items were adapted from Parker et al., (2013) to capture core job performance
specific to the medical context. The two items were “provide quality patient care or
assistance” and “provide timely patient care or assistance.” I added “or assistance”
because the sample also included healthcare professionals working at the front desk (e.g.,
receptionist, intake coordinator). I included “not applicable” as a response option for the
Proactive patient care was measured by two items from Johnson, Hong, Groth,
and Parkeret (2011) with the stem “How often do you…” using a seven-point frequency
scale (1 = “never” to 7 = “always”) with the additional “not applicable” option. The two
context specific items were “spend time thinking ahead to prevent possible
37
complications” and “spend time planning how a patient’s status and needs might change
Attentiveness was measured by six items adapted from the Interaction
Involvement Scale (Cegala et al., 1982) and the Active-Empathic Listening Scale (Bodie,
2011). I selected items of both global and specific statements of attentiveness and adapted
the wording to be relevant to the hospital context. Following the stem “During
interactions with patients…,” the items were “I listen carefully to patients,” “I am
sensitive to patients’ subtle meanings or cues,” “I ask questions that show my
understanding of patients’ situations,” “I find my mind wandering” (reverse scored), “I
show patients that I am listening by using verbal acknowledgements or body language
(e.g.., head nods),” and “I carefully observe how patients respond.” Responses were on
an agreement scale (1 = “strongly disagree” to 7 = “strongly agree”). As discussed below
in the confirmatory factor analysis section, the reverse scored item was uncorrelated with
the other items and had nonsignificant factor loading. Thus, it was removed from
Perspective taking was measured by four items adapted from the Davis, Conklin,
Smith, & Luce (1996) perspective taking measure. The measure has been used in past
research (e.g., Grant & Berry, 2011). The stem was “During interactions with patients…”
The items were “I frequently try to take patients’ perspectives,” “I regularly seek to
understand patients’ viewpoints,” “I make an effort to see the world through patients’
eyes,” and “I often imagine how patients are feeling.” Responses were on an agreement
scale
38
Response flexibility was measured by four items, using the stem “During
interactions with patients…” Two items were adapted from the Cognitive Flexibility
Inventory (Dennis & Vander Wal, 2010) to reflect the cognitive aspect of response
flexibility (i.e., pause to consider multiple options). The items were “I pause to consider
multiple options before responding to patients” and “I think of more than one way to
react to patients.” I developed two items to capture the behavioral aspect of response
flexibility (i.e., react based on conscious consideration). The items were “I respond to
patients after careful consideration” and “I react to patients based on their situations.”
Responses were on an agreement scale (1 = “strongly disagree” to 7 = “strongly agree”)
Perceived workgroup service climate was measured by 7 items adapted from the
Global Service Climate (Schneider et al., 1998) for health care settings, using a 5-point
scale (1 = “poor” to 5 = “excellent”). I adapted the items to capture an individual’s
perception of patient care climate within his or her team/department. The stem was “How
would you rate…” Sample items were “the overall quality of patient care and assistance
provided by your team/department” and “the job knowledge and skills of employees in
your team/department to del
Big five personality traits were measured by four-item scales from the Mini-IPIP
(Donnellan, Oswald, Baird, & Lucas, 2006), a widely used short measure of the big five
traits. Responses were on an agreement scale (1 = “strongly disagree” to 7 = “strongly
agree”). The stem was “I see myself as someone who…” Sample items were “is the life
39
Trait mindfulness was measured by the 15-item Mindful Attention Awareness
Scale (MAAS; Brown & Ryan, 2003), a widely used measure of dispositional
mindfulness with good psychometric properties (e.g., Hülsheger et al., 2013; Hülsheger et
al., 2014; Long & Christian, 2015). Respondents rated how frequently they had had these
experiences on a six-point scale (1 = “almost never” to 6 = “almost always”). Sample
items were “I do jobs or tasks automatically, without being aware of what I’m doing”
(reverse scored) and “I find myself doing things without paying attention” (reverse
scored). Higher composite score indicated higher dispositional
measurement validation study, Brown and Ryan (2003) correlated this measure with an
alternate measure in which items were positively worded (e.g., “I find it easy to stay
focused on what’s happening in the present”). The two measures correlated at .70. They
showed similar pattern of correlations with an array of personality, self-esteem,
optimism, anxiety, and depression scales. Thus, the MAAS measures mindfulness rather
than lack of mindfulness.
Mental health was measured by the 12-item abbreviated version of the Mental
Health Index (Veit & Ware, 1983). The measure focuses on the symptoms of distress
(i.e., depression and anxiety) and has been used in the general population (e.g., Lim,
Cortina, & Magley, 2008). Respondents indicated how frequently they had experienced
the symptoms over the past three months on a 5-point response scale (1 = “never” to 5 =
“most of the time”). Sample items were “felt tense or high strung” (reverse scored) and

40
“felt depressed” (reverse scored). Higher composite score indicated better mental health
Overall health was measured by one item adapted from DeSalvo et al. (2006),
“Over the last three months, would you say your health is…?” (1 = “poor” to 5 =
“excellent”). Single-item measure of general health has been used in past studies (e.g.,
Dahm, Glomb, Manchester, & Leroy, 2015).
Fatigue was measured by two items from the fatigue dimension of the Positive
and Negative Affect Schedule Expanded Form (PANAS-X; Watson & Clark, 1994).
Participants indicated how often they had felt “tired” and “sluggish” over the past three
months on a 5-
Participants also provided background information, including sex (1 = female, 0 =
male), age, educational attainment (1 = some high school (grade 11 or less, 2 = graduated
from high school or G.E.D., 3 = some college or technical training beyond high school
(1-3 years), 4 = graduated from college (B.A., B.S., or other Bachelor’s degree, 5 = some
graduate school, 6 = graduate or professional degree (MBA, Master’s, Ph.D., J.D., etc),
ethnic background (1 = White, 0 = other), current marital status (1 = married, same-sex
domestic partner, or living with a significant other or partner, 0 = single, divorced,
separated, or widowed), job tenure, job title, clinical position (1 = clinical position, 0 =
administrative position), workgroup affiliation, supervisory position (1 = yes, 0 = no),
average work hours per week, and average number of patients see or assist per day.
Measures: End-of-Workday Survey
Work overload was measured by three items from the five-item perceived role
overload measure (Parker et al., 2013). The selected items had the highest factor loadings
41
and were relevant to the hospital context (Parker et al., 2013). The response scale was
anchored at 1 = “not at all” and 5 = “very much.” The items were “Today at work, did
you have to work faster than you would like to complete your work,” “Today at work, did
you have too much work to do in too little time,” and “Today at work, how much
Job autonomy was measured by one item modified from Trougakos, Hideg,
Cheng, & Beal (2014) lunch break autonomy measure. The item was closest to the
conceptual definition of perceived autonomy and was suitable to the hospital context.
Participants rated the item, “Today at work, did you feel like you decided for yourself
what to do,” using a 5-point scale (1 = “not at all” to 5 = “to a very large extent”).
Daily mindfulness was measured by three items from the 5-item state mindfulness
measure (Brown & Ryan, 2003) on a 5-point response scale (1 = “not at all” to 5 = “very
much”). The state measure has been used in past studies to capture daily mindfulness at
work (e.g., Hülsheger et al., 2013; Hülsheger et al., 2014). The selected items had the
highest loadings (Hülsheger et al., 2014; Brown & Ryan, 2003). The items were “Today
at work, I found myself doing things without paying attention,” “Today at work, I did
jobs or tasks automatically, without being aware of what I was doing,” and “Today at
work, I rushed through activities without being really attentive to them” (all reversed
Core job performance assessed daily global and specific job performance in
reference to an individual’s personal average. I used three items adapted from the core
job performance measure in the background survey, using a 5-point scale, 1 = “far below
my personal average” to 5 = “far above my personal average” (for a similar approach, see

42
Miner & Glomb, 2010). The items were “Today at work, the quality of care or assistance
I provided has been…,” “Today at work, the timeliness of care or assistance I provided
has been…,” and “T
Proactive patient care was measured by one item from the proactive patient care
measure in the background survey, using a 5-point response scale (1 = “never” to 5 =
“always”) with the “not applicable” option. The item was “Today at work, how often did
you spend time planning how a patient’s status and needs might change over time.”
Attentiveness was measured by two items that captured the global concept from
the attentiveness measure as described in the background survey. The responses were on
a 5-point scale (1 = “never” to 5 = “always”). The items were “Today at work, I listened
carefully to patients,” and “Today at work, I was sensitive to patients’ subtle meanings or
Perspective taking was measured by two items from the perspective taking
measure as described in the background survey, using a 5-point response scale (1 =
“never” to 5 = “always”). The items were “Today at work, I made an effort to see the
world through patients’ eyes,” and “Today at work, I tried to take patients’ perspectives”
Response flexibility was measured by two items that most closely captured the
construct from the response flexibility measure as described in the background survey,
using a 5-point response scale (1 = “never” to 5 = “always”). The items were “Today at
work, I paused to consider multiple options before responding to patients,” and “Today at
work, I thought of more than one way to react to patients” ).
43
Stress was measured by one item adapted from the single-item stress measure in
Beal, Trougakos, Weiss, and Dalal (2013) and Bono, Glomb, Shen, Kim, and Koch
(2013). The item captured the global concept using a 5-point scale (1 = “not at all” to 5 =
“very much”). The item was “Today at work, how stressed did you feel.”
Mood was measured by a single item from Fuller et al., (2003) to capture general
mood each day. The item was “Today at work, I was in a good mood,” using a 5-point
response scale (1 = “not at all” to 5 = “very much”).
Job satisfaction was measured by a single item of global job satisfaction (Fuller et
al., 2003), “Today, I was satisfied with my job.” The responses were on a 5-point scale (1
= “not at all” to 5 = “very much”). A past meta-analysis supported the validity of one-
item job satisfaction measures (Wanous, Reichers, & Hudy, 1997).
Emotional exhaustion was measured by a single item that closely captured the
construct from the Maslach Burnout Inventory (Maslach & Jackson, 1981). The item was
“Today, I felt emotionally drained from my work” with a 5-point response scale (1 =
“strongly disagree” to 5 = “strongly agree”).
Fatigue was measured by a single item from the PANAS-X (Watson & Clark,
1994), “Right now, do you feel tired,” using a 5-point scale (1 = “not at all” to 5 = “to a
very large extent”). Past experience sampling research has used the measure to assess
end-of-workday fatigue (e.g., Trougakos et al., 2014).
Sleep quality was measured by a single item from the Westerberg et al., (2010)
sleep quality measure. The item was “How well did you sleep last night,” using a 5-point
response scale (1 = “very poorly” to 5 = “very well”).

44
Diet was measured by one item that I wrote, “How nutritious and healthy were
your meals and snacks yesterday (during the day and evening),” using a 5-point scale (1 =
“not at all” to 5 = “very much”).
Exercise was measured by one item that I wrote, “How physically active
(walking, biking, exercising) were you yesterday (during the day and evening),” using a
5-point scale (1 = “not at all” to 5 = “very much”).
In the end-of-workday surveys, participants also indicated what shift they worked,
hours worked, and the number of patients they saw or assisted each day.
Measures: Patient Survey
Our discussions with clinic management reveled that a considerable portion of the
patient population was Spanish speaking. Thus, the patient packet was available in
English and Spanish versions. Following Brislin (1980), two professional translators
independently translated the English version into Spanish. A third more experienced
translator reviewed both Spanish versions against the English version and edited them
into a best Spanish version. A fourth translator independently back translated the best
Spanish version into English. The resulting English version was almost identical to the
original. Minor discrepancies were discussed by all translators and the researcher and
consensual translation was obtained.
Patient satisfaction, as patient perception of participants’ job performance, was
measured by five items. I used four items from the Visit-Specific Satisfaction
Questionnaire (VSQ-9; Rubin et al., 1993) to assess patients’ global satisfaction and
satisfaction with specific aspects (i.e., technical skills, personal manner, and explanation)
of the quality of care. The VSQ-9 has been a widely used patient satisfaction measure in
45
the medical literature (e.g., Rubin et al., 1993; Chai-Coetzer et al., 2013; Frank, Stange,
Langa, & Workings, 1997). I adapted the items to capture a patient’s satisfaction with
performance of the focal health care professional who had provided him/her with care or
assistance rather than with the visit. I included an additional item to capture satisfaction
with the timeliness of care such that the targets of patient evaluation matched the
conceptual space of core job performance (i.e., quality care, timely care, and overall
performance) as perceived by participants themselves. Patients rated their satisfaction
with the health care professional they had just interacted with on a 5-point scale, 1 = “not
at all satisfied” to 5 = “very satisfied” (Cooper-Patrick et al., 1999; Frank et al., 1997).
Following the stem, “How satisfied are you with…,” the items were “the visit with this
person overall,” “the technical skills (thoroughness, carefulness, competence) of this
person,” “the personal manner (courtesy, respect, sensitivity, friendliness) of this
person,” “this person’s explanation of what was done for you,” and “the timeliness of
Perceived attentiveness was measured by three items adapted from the
attentiveness measure as described in the background survey. Two of the original items
have the highest loadings in the background survey. Patients rated their perceptions of the
focal health care professional’s behaviors using a 7-point scale (1 = “strongly disagree”
to 7 = “strongly agree”). The items were “This person listened carefully to me,” “This
person was sensitive to my subtle meanings or cues,” and “This person carefully
observe
Perceived perspective taking was measured by three items adapted from the
highest loading items in the perspective taking measure described in the background

46
survey. Patients rated their perceptions of the focal health care professional’s behaviors
using a 7-point scale, 1 = “strongly disagree” to 7 = “strongly agree.” The items were
“This person tried to take my perspective,” “This person made an effort to see the world
through my eyes,” and “This person sought to understand m
Perceived response flexibility was measured by three items adapted from the
highest loading items in the response flexibility measure described in the background
survey. Patients rated their perceptions of the focal health care professional’s behaviors
using a 7-point scale, 1 = “strongly disagree” to 7 = “strongly agree.” The items were
“This person paused to consider multiple options before responding to me,” ”This person
responded to me after careful consideration,” and “This person thought of more than one
For each health care professional, patients also indicated whether they had been
treated by this person in the past (yes or no) and the time they spent with this person (in
minutes). Patients also provided the total time they spent at the clinic (in munities), the
reason for the visit, overall health, and sex.
47
Chapter 6: Results
Overview
I performed analyses in several ways. First, I performed a series of confirmatory
factor analyses of the patient interaction items for attentiveness, perspective taking, and
response flexibility in the participant background survey, participant end-of-workday
survey, and patient survey. The three constructs were found to be represented by a
higher-order construct of patient centered behavior, which was robust at participant-,
day-, patient-, and encounter-levels across surveys. Second, I reported descriptive
statistics and zero-order correlations of study variables in the background survey, end-of-
workday survey, and patient survey. I also reported the pre- and post- intervention means
and standard deviations of each outcome by condition. Third, I examined the effect of
intervention for each outcome using (1) multilevel modeling to examine whether
treatment and active control led to differential post-intervention means across participants
for each outcome (including patient ratings of job performance which depicts the main
effect of mindfulness intervention in Hypothesis 1), and (2) latent growth modeling to
examine whether treatment and active control produced differential growth trajectories of
each outcome during intervention. Both analyses were necessary because they looked at
the effects of the intervention and active conditions from different angles. Fourth, I used
cross-classified multilevel moderated mediation modeling to examine the effect of
experimental condition (via patient perception of patient centered behavior) on patient
perception of job performance (i.e., patient satisfaction) and the moderating effects of
participant agreeableness, perceived workgroup patient care climate, and daily work
overload. All analyses were performed using Mplus 7.11 (Muthén & Muthén, 2012).
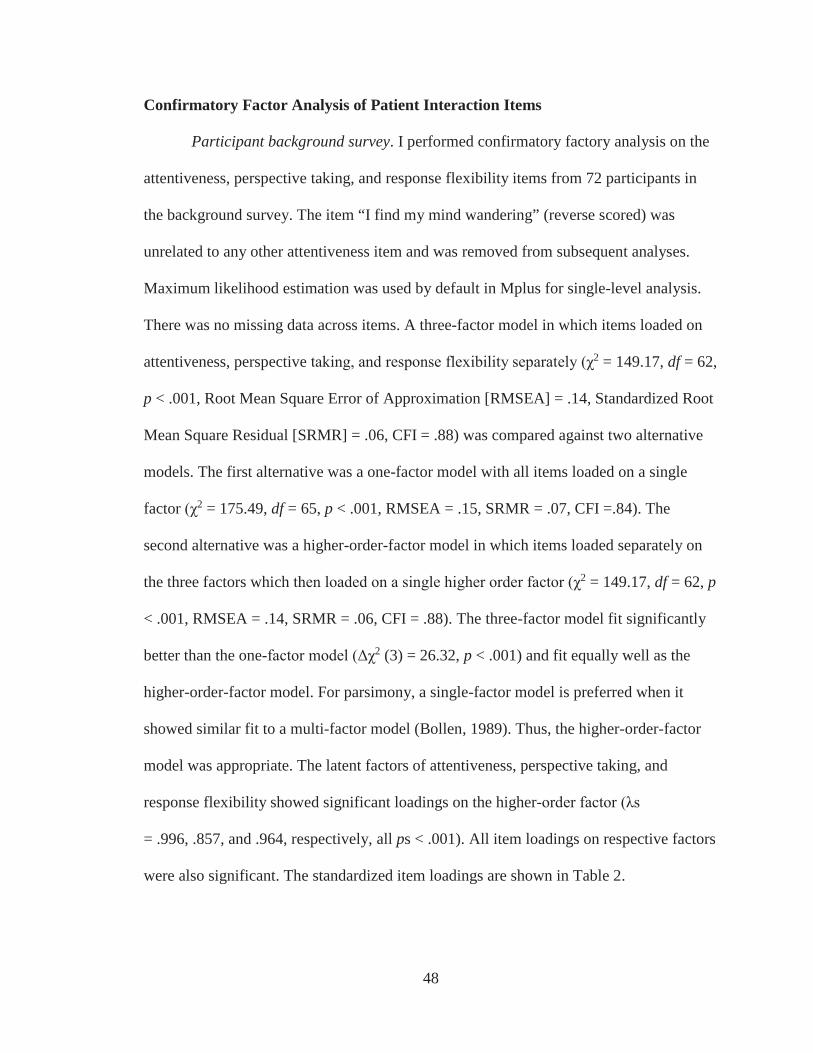
48
Confirmatory Factor Analysis of Patient Interaction Items
Participant background survey. I performed confirmatory factory analysis on the
attentiveness, perspective taking, and response flexibility items from 72 participants in
the background survey. The item “I find my mind wandering” (reverse scored) was
unrelated to any other attentiveness item and was removed from subsequent analyses.
Maximum likelihood estimation was used by default in Mplus for single-level analysis.
There was no missing data across items. A three-factor model in which items loaded on
attentiveness, perspective 2 = 149.17, df = 62,
p < .001, Root Mean Square Error of Approximation [RMSEA] = .14, Standardized Root
Mean Square Residual [SRMR] = .06, CFI = .88) was compared against two alternative
models. The first alternative was a one-factor model with all items loaded on a single
factor 2 = 175.49, df = 65, p < .001, RMSEA = .15, SRMR = .07, CFI =.84). The
second alternative was a higher-order-factor model in which items loaded separately on
the three factors which 2 = 149.17, df = 62, p
< .001, RMSEA = .14, SRMR = .06, CFI = .88). The three-factor model fit significantly
better than the one- 2 (3) = 26.32, p < .001) and fit equally well as the
higher-order-factor model. For parsimony, a single-factor model is preferred when it
showed similar fit to a multi-factor model (Bollen, 1989). Thus, the higher-order-factor
model was appropriate. The latent factors of attentiveness, perspective taking, and
response flexibility showed significant loadings on the higher-
= .996, .857, and .964, respectively, all ps < .001). All item loadings on respective factors
were also significant. The standardized item loadings are shown in Table 2.
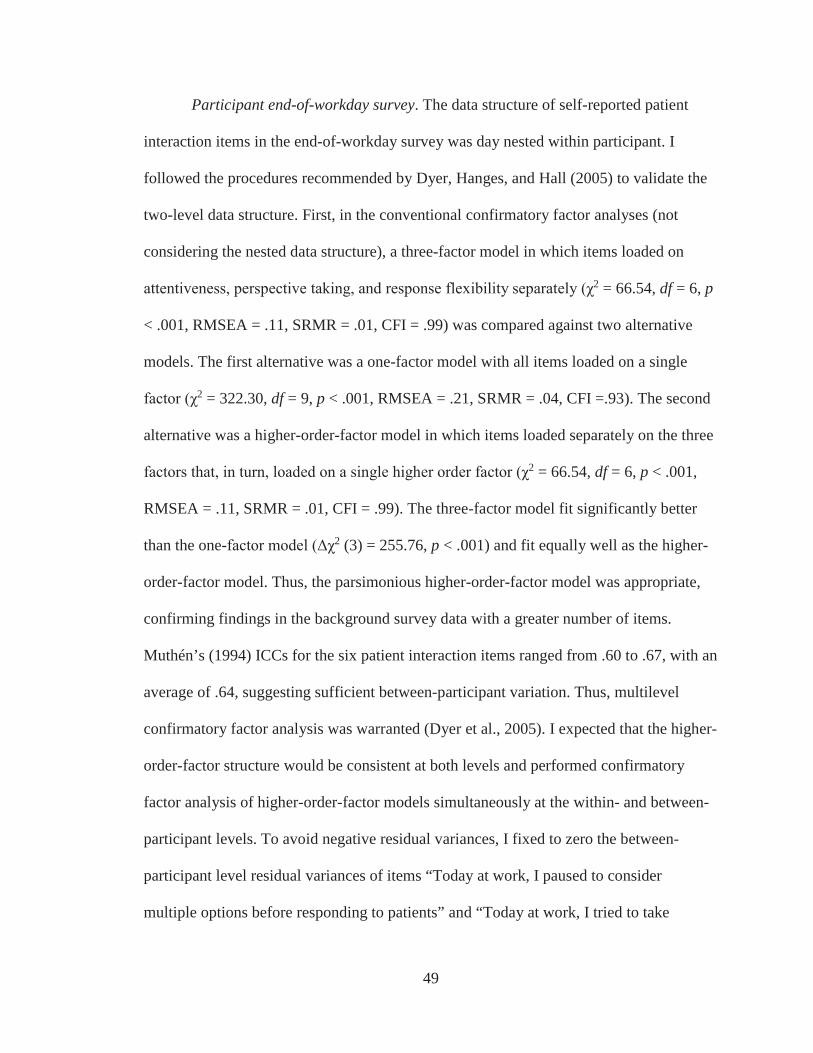
49
Participant end-of-workday survey. The data structure of self-reported patient
interaction items in the end-of-workday survey was day nested within participant. I
followed the procedures recommended by Dyer, Hanges, and Hall (2005) to validate the
two-level data structure. First, in the conventional confirmatory factor analyses (not
considering the nested data structure), a three-factor model in which items loaded on
2 = 66.54, df = 6, p
< .001, RMSEA = .11, SRMR = .01, CFI = .99) was compared against two alternative
models. The first alternative was a one-factor model with all items loaded on a single
2 = 322.30, df = 9, p < .001, RMSEA = .21, SRMR = .04, CFI =.93). The second
alternative was a higher-order-factor model in which items loaded separately on the three
2 = 66.54, df = 6, p < .001,
RMSEA = .11, SRMR = .01, CFI = .99). The three-factor model fit significantly better
than the one- 2 (3) = 255.76, p < .001) and fit equally well as the higher-
order-factor model. Thus, the parsimonious higher-order-factor model was appropriate,
confirming findings in the background survey data with a greater number of items.
Muthén’s (1994) ICCs for the six patient interaction items ranged from .60 to .67, with an
average of .64, suggesting sufficient between-participant variation. Thus, multilevel
confirmatory factor analysis was warranted (Dyer et al., 2005). I expected that the higher-
order-factor structure would be consistent at both levels and performed confirmatory
factor analysis of higher-order-factor models simultaneously at the within- and between-
participant levels. To avoid negative residual variances, I fixed to zero the between-
participant level residual variances of items “Today at work, I paused to consider
multiple options before responding to patients” and “Today at work, I tried to take

50
patients’ perspectives” and the within-participant level residual variance of response
flexibility factor (Dyer et al., 2005). Robust maximum likelihood estimation was used by
default in Mplus for multilevel analysis. The higher-order-factor model yielded
acceptable fit at the day and participant 2 = 73.48, df = 15, p < .001, RMSEA
= .07, CFI =.95, SRMRbetween = .01, SRMRwithin = .04) (see Hirst et al., 2009; Hirst et al
2011, for empirical examples of multilevel confirmatory factor analysis). All items had
significant loadings on respective latent factors. The standardized item loadings at the
within- and between-participant levels are shown in Table 3.
Patient survey. The patient interaction items in patient survey had a complex data
structure; encounters were nested within days nested within participants and encounters
were also nested within patients. To quantify the amount of variance for each item at each
level, I started with three-level variance decomposition with encounter nested within day
nested within participant. The average of within-level variance estimates across items
was 0.83 (range = 0.50 to 1.03, all ps < .001), the average of day-level variance estimates
across items was 0.01 (range = 0.003 to 0.025, ps > .10 except p < .10 for two items), and
the average of participant-level variance estimates across items was 0.02 (range = 0.009
to 0.031, p < .001 for one item, p < .01 for four items, p < .05 for two items, p < .10 for
one item, and p > .10 for one item). Because of nonsignificant variance at day level
across items, day was not considered a meaningful cluster. Next, I partitioned variance of
each item based on cross-classified data structure with encounters nested simultaneously
within participant and patient. Bayesian estimation with noninformative priors for
parameters was used by default in Mplus for cross-classified analysis (Asparouhov &
Muthén, 2010; Muthén & Asparouhov, 2012). The average of within-level variance
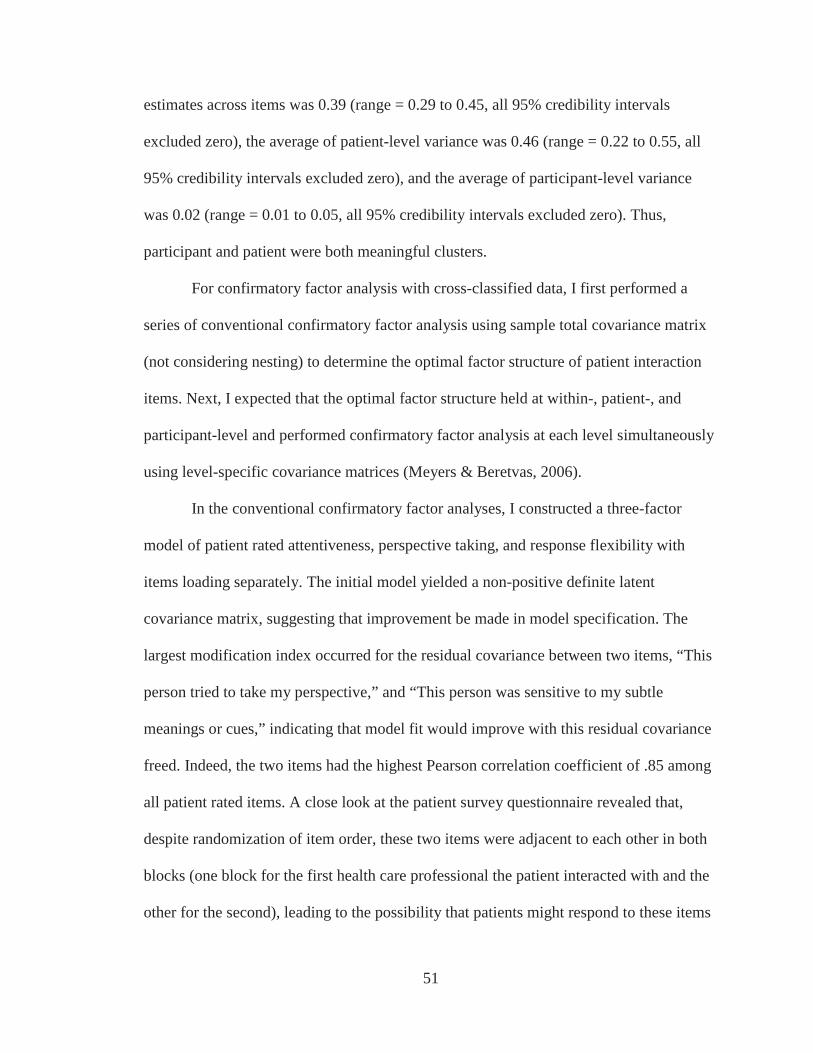
51
estimates across items was 0.39 (range = 0.29 to 0.45, all 95% credibility intervals
excluded zero), the average of patient-level variance was 0.46 (range = 0.22 to 0.55, all
95% credibility intervals excluded zero), and the average of participant-level variance
was 0.02 (range = 0.01 to 0.05, all 95% credibility intervals excluded zero). Thus,
participant and patient were both meaningful clusters.
For confirmatory factor analysis with cross-classified data, I first performed a
series of conventional confirmatory factor analysis using sample total covariance matrix
(not considering nesting) to determine the optimal factor structure of patient interaction
items. Next, I expected that the optimal factor structure held at within-, patient-, and
participant-level and performed confirmatory factor analysis at each level simultaneously
using level-specific covariance matrices (Meyers & Beretvas, 2006).
In the conventional confirmatory factor analyses, I constructed a three-factor
model of patient rated attentiveness, perspective taking, and response flexibility with
items loading separately. The initial model yielded a non-positive definite latent
covariance matrix, suggesting that improvement be made in model specification. The
largest modification index occurred for the residual covariance between two items, “This
person tried to take my perspective,” and “This person was sensitive to my subtle
meanings or cues,” indicating that model fit would improve with this residual covariance
freed. Indeed, the two items had the highest Pearson correlation coefficient of .85 among
all patient rated items. A close look at the patient survey questionnaire revealed that,
despite randomization of item order, these two items were adjacent to each other in both
blocks (one block for the first health care professional the patient interacted with and the
other for the second), leading to the possibility that patients might respond to these items
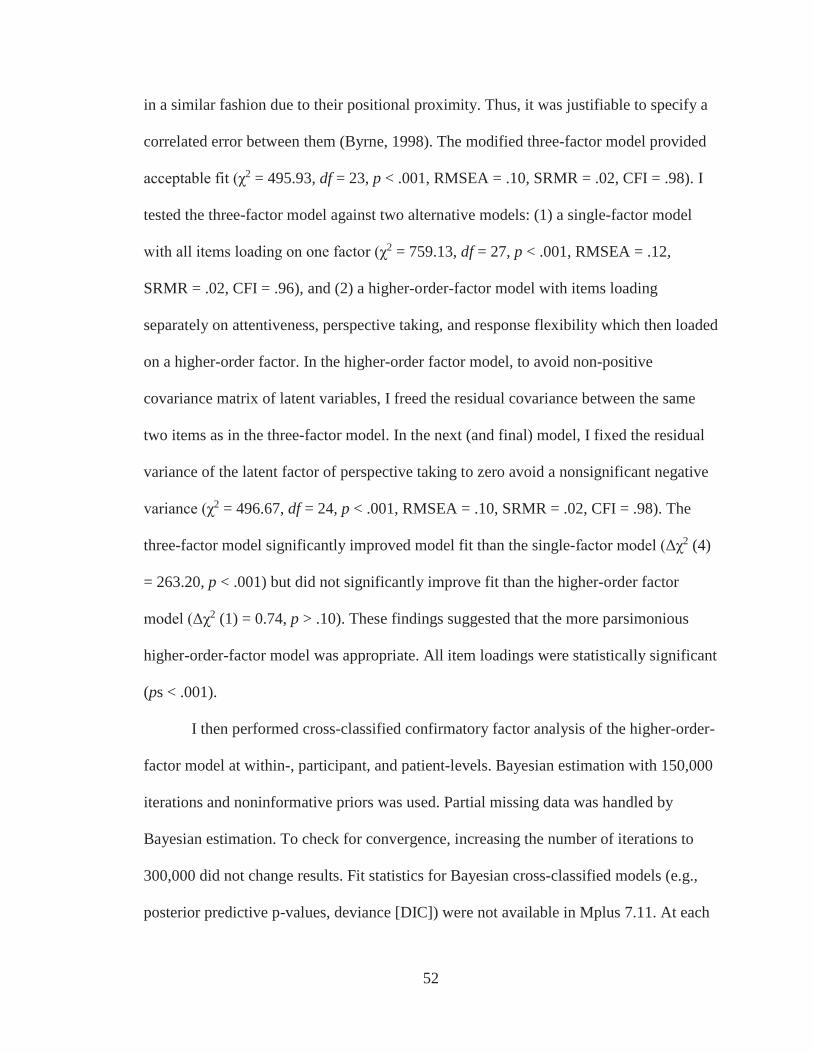
52
in a similar fashion due to their positional proximity. Thus, it was justifiable to specify a
correlated error between them (Byrne, 1998). The modified three-factor model provided
2 = 495.93, df = 23, p < .001, RMSEA = .10, SRMR = .02, CFI = .98). I
tested the three-factor model against two alternative models: (1) a single-factor model
2 = 759.13, df = 27, p < .001, RMSEA = .12,
SRMR = .02, CFI = .96), and (2) a higher-order-factor model with items loading
separately on attentiveness, perspective taking, and response flexibility which then loaded
on a higher-order factor. In the higher-order factor model, to avoid non-positive
covariance matrix of latent variables, I freed the residual covariance between the same
two items as in the three-factor model. In the next (and final) model, I fixed the residual
variance of the latent factor of perspective taking to zero avoid a nonsignificant negative
2 = 496.67, df = 24, p < .001, RMSEA = .10, SRMR = .02, CFI = .98). The
three-factor model significantly improved model fit than the single- 2 (4)
= 263.20, p < .001) but did not significantly improve fit than the higher-order factor
2 (1) = 0.74, p > .10). These findings suggested that the more parsimonious
higher-order-factor model was appropriate. All item loadings were statistically significant
(ps < .001).
I then performed cross-classified confirmatory factor analysis of the higher-order-
factor model at within-, participant, and patient-levels. Bayesian estimation with 150,000
iterations and noninformative priors was used. Partial missing data was handled by
Bayesian estimation. To check for convergence, increasing the number of iterations to
300,000 did not change results. Fit statistics for Bayesian cross-classified models (e.g.,
posterior predictive p-values, deviance [DIC]) were not available in Mplus 7.11. At each
53
level, item loadings on attentiveness, perspective taking, and response flexibility factors
were all high and significant and the three factors loaded significantly on a higher-order
factor. Thus, the higher-order-factor model of patient interaction items was appropriate at
within-, participant-, and patient-levels. The standardized item loadings at each level are
shown in Table 4.
Summary. A series of confirmatory factor analyses of patient interaction items in
employee background survey, employee daily survey, and patient survey converged to
suggest that the measurement model in which attentiveness, perspective taking, and
response flexibility loaded on a higher-order factor consistently provided excellent fit
across levels. Thus, in the subsequent analyses, I focused on the patient interaction
composite (termed patient centered behavior) by aggregating items into a single scale
rather than attentiveness, perspective taking, and response flexibility separately.
Description of Study Variables
The means, standard deviations, and zero-order correlations of study variables in
the participant background survey are shown in Table 5. Experimental condition was
unrelated to all variables except fatigue (r = –.27, p < .05), suggesting random
assignment of participants was successful. As expected, patient centered behavior was
positively correlated with core job performance (r = .32, p < .01) and proactive patient
care (r = .31, p < .01). The means, standard deviations, and zero-order correlations of
participant-reported daily variables in the end-of-workday survey during the baseline and
intervention periods (Day 1 to 15) are shown in Table 6. As expected, daily patient
centered behavior was positively related to daily job performance (r = .32, p < .001) and
proactive patient care (r = .49, p < .001). The means, standard deviations, and zero-order
54
correlations of patient-reported variables in the patient survey during baseline and
intervention periods (Day 1 to 15) are shown in Table 7. As expected, patient perception
of participants’ patient centered behavior was positively related to encounter-specific
patient satisfaction (r = .49, p < .001). Table 8 showed the pre- and post-intervention
means and standard deviations for study variables by condition.
Effect of Intervention on Participant and Patient Outcomes
Analytic strategies
I examined the impact of the treatment and active control intervention on an array
of work related outcomes over the 10-day intervention period. The work related
outcomes included participant self-reported daily mindfulness, job satisfaction, work
behaviors (i.e., job performance, proactive patient care, patient centered behavior), and
stress-related outcomes (i.e., stress, emotional exhaustion, fatigue). The work related
outcomes also included patient ratings of the encounter-specific participants’ patient
centered behavior and patient satisfaction.
For each outcome, I examined whether the treatment and active control conditions
had differential impact on the outcome using multilevel modeling and latent growth
modeling, as detailed below. I first performed intent-to-treat analysis (Shadish et al.,
2002) using participants who attended at least one audio over the 10-day intervention
period. Participants’ self-reported daily outcome was useable if it was responded to on
the same day a daily survey was sent or by noon the following day. Because intent-to-
treat analysis revealed the effect of being assigned to a condition rather than actually
listening to audios, I then replicated the analyses using participants who attended at least
five (50%) of audios.
55
Multilevel modeling. For participant reported daily outcomes, given the data
structure of day nested within participant, I used multilevel random intercept modeling
(Hox, 2010; Raudenbush & Bryk, 2002; Snijders & Bosker, 2012) to examine the effect
of experimental condition as a participant-level predictor on daily outcome over
intervention period, provided that the outcome had a significant amount of variance at the
between-participant level. First, variance decomposition of daily outcome was performed
by estimating a null model without predictors at either the participant level or the day
level. ICC(1), or participant-level variance divided by the sum of variance at the
participant- and day-level, indicated the proportion of total variance at the participant
level (Bliese, 2000). Next, I used a random intercept model to capture the extent to which
variability in participants’ person-averaged daily outcome was accounted for by the
experimental condition to which they were assigned. I controlled for the outcome at
baseline, computed as the average of daily measures over the 5-day pre-intervention
period for each participant. Daily observations with missing data on the outcome were
removed from analyses by default in Mplus. Robust maximum likelihood estimation as
the default in Mplus was used to produce standard errors that were robust to non-
normality and non-independence of observations (Muthén & Muthén, 2012; Preacher,
Zyphur, & Zhang, 2010).
Because participants attended varying numbers of audios in total over the
intervention period, I then explored the potential impact of total number of audios
attended on the effect of experimental condition on the outcome. This was achieved by
including total number of audios attended and its product term with experimental
condition as additional participant-level predictors in the random intercept model. In
56
cases of significant interaction effect, simple slope tests (Aiken & West, 1991) were
performed for the conditional effect of experimental condition on the outcome at high
and low levels (i.e., 1 SD above and below the mean) of total number of audios attended.
For patient rated encounter-specific outcomes (i.e., patient centered behavior and
patient satisfaction), cross-classified multilevel modeling (e.g., Hox, 2010) was used to
take into account encounter nested within the cross-classification of participant and
patient, given that each outcome had nonsignificant variance at the day level. The effect
of experimental condition on participant-level variability of each outcome was modeled
using Bayesian estimation by default in Mplus.
Latent growth modeling. I performed multiple-group latent growth modeling
(Bollen & Curran, 2006; Lipsey & Cordray, 2000) to examine whether the treatment and
active control conditions produced differential growth trajectories of a daily outcome
over the 10-day intervention period. Although multilevel modeling and latent growth
modeling both deal with repeated measures of an outcome, multilevel modeling answers
the question of whether participants’ means of repeated measures of an outcome differ
between the treatment and active control conditions, whereas latent growth modeling
addresses between-condition difference in the developmental trajectory of an outcome
over time (Preacher, Wichman, MacCallum, & Briggs, 2008; Wright, Hallquist, Swartz,
Frank, & Cyranowski, 2014). In their seminal work, Muthén and Curran (1997)
integrated multiple-group latent growth modeling in randomized intervention research to
model the effect of an intervention on growth of outcome over time (for an empirical
example, see Dekovic, Asscher, Manders, Prins, & van der Laan, 2012). The tenet of
Muthén and Curran’s (1997) approach is to decompose the observed growth trajectory of
57
repeated measures of an outcome over intervention period into (1) the normative growth
trajectory that would have been observed had participants not received any intervention
and (2) the growth trajectory attributable to intervention. One way to identify the
normative growth trajectory was using repeated measures of an outcome over the course
of intervention from participants in a randomly assigned nonactive control group that
received no treatment (Muthén & Curran, 1997).
As recommended by Muthén and Curran (1997), I proceeded with the following
steps. First, I modeled normative developmental trajectory of an outcome using repeated
measures over the five days before the intervention started. The normative trajectory
captured potential influence of all other study activities (i.e., patient survey handoff, end-
of-workday survey) on the outcome except that of audio intervention. Given that
participants in both conditions engaged in the same study activities except listening to
audio throughout all days before and during intervention, it was appropriate to treat the
trajectory prior to the start of intervention as the normative trajectory over intervention
period, reflecting the otherwise observed development of outcome without either the
intervention or active control. Participants in both conditions were included because the
normative development would not differ across conditions due to randomization of
participants. I expected the normative development of each outcome to be a flat trajectory
over study period. In latent growth modeling, the flat trajectory was represented by a
latent initial status factor without any latent growth (i.e., rate of change) factor. The initial
status factor had loadings of 1.0 on 5 days of the outcome before intervention. The flat
trajectory was compared with a linear growth trajectory. As typical specifications of
linear growth model (Bollen & Curran, 2006), the intercept factor loadings of the
58
outcome on Day 1 to Day 5 prior to intervention were fixed at 1.0 and the growth factor
loadings were fixed at 0, 1, 2, 3, and 4 such that one unit of time was one day. The
variances and covariance of the intercept and growth factors were freely estimated. The
residuals of the outcome over five days were allowed to have unequal variances and be
uncorrelated. Partial missing data were handled by maximum likelihood estimation by
default in Mplus to produce unbiased parameter estimates under the assumption of
missing at random (MAR; Graham, 2009). The expected flat trajectory can be obtained
by fixing the growth factor mean and variance (therefore its covariance with initial status
factor) to zero. Chi-square difference test was used for model comparison. For patient
ratings of patient centered behavior and patient satisfaction, daily patient rated outcome
was computed by averaging patient ratings across encounters on each day for each
participant. As discussed below, all of the daily outcomes showed flat normative
development during days prior to intervention. Thus, flat trajectory was adopted for all
outcomes in the subsequent analyses.
Second, to assess the fit of linear growth model, latent growth modeling with
linear form was performed separately on participants in the treatment and active control
conditions, using baseline outcome (computed as the averaged outcome over 5 days prior
to intervention) and 10 days of repeated measures of the outcome during intervention.
The initial status factor had loadings of 1.0 on all time points and the slope factor had
loadings of 0, 1, 2, 3, 4, 5, 6, 7, 8, 9, and 10 on baseline and Day 1 to Day 10 during
intervention (Bollen & Curran, 2006). Therefore, one unit of time was defined as one
day.

59
Third, two-group latent growth modeling (Muthén & Curran, 1997; Preacher et
al., 2008) was performed simultaneously on participants in the treatment and active
control conditions, using baseline and 10 days of repeated measures. As depicted in
Figure 3, in each condition, daily observations were determined by normative
development (i.e., initial status factor) and linear increase or decline specific to the
intervention (i.e., linear slope factor). The initial status factor had loadings of 1.0 on all
time points to represent flat normative development and the slope factor had loadings of 0
on baseline and 1 through 10 on Day 1 through Day 10 to represent linear growth specific
to intervention. One unit of time was defined as one day. Although my hypotheses
focused on the average level of treatment and active control effects across participants,
intervention effect can also be characterized by the extent to which it varied across
participants and covaried with initial status before intervention started (Muthén & Curran,
1997). Thus, in each condition, I allowed the intervention growth factor variance and its
covariance with initial status to be freely estimated. In the two-group analysis, equality
constraints were applied to the parameters (i.e., mean and variance) of initial status factor
across conditions to represent the common normative development. However, parameters
(i.e., mean, variance, and covariance) of the linear growth factor were freely estimated in
each condition to reflect the realism of treatment and active control effects.
Fourth, I examined whether linear growth factor specific to treatment was
different from that specific to active control. In the two-group model from step 3, means,
variances, and covariances (with initial status) of linear growth factors were constrained
to be equal across conditions, respectively. The chi-square of model fit was compared
with the step 3 model. Significant increase in chi-square in step 4 would indicate that the

60
step 3 model showed better fit and would suggest that treatment effect was different from
active control effect.
Lastly, given that random assignment may be influenced by attrition of
participants, I examined whether baseline outcome was different across conditions. In the
two-group model in step 3, I relaxed equality constraints on mean and variance of initial
status factors across conditions. For each outcome (except proactive patient care),
relaxing equality constraints on initial status parameters did not significantly improve
model fit, suggesting that the outcome at baseline was not different across conditions and
that randomization was not affected by attrition.
In supplemental analyses in the Appendix, to reduce model complexity, I repeated
steps 2 to 4 using five repeated measures of an outcome during intervention by averaging
measures on two adjacent days (i.e., wave 1 measure as the averaged outcome on Day 1
and 2, wave 2 as the averaged outcome on Day 3 and 4, and so forth) (for a similar
approach, see Van Iddekinge et al., 2009). As a robustness check for the aggregated
measures, analyses were replicated separately using measures on Day 1, 3, 5, 7, and 9 and
Day 2, 4, 6, 8, and 10 during intervention (Z. Zhang, May 2015, personal
communication).
Because the treatment and active control effects may be subject to the extent to
which participants received intervention, as supplemental analyses, I reran latent growth
modeling analyses described above using a constrained sample of participants who
attended at least 50% (five) audios. Below I provided a summary of findings, followed by
detailed results for each outcome.
61
Summary of findings
Table 9 summarizes the findings for participants attending at least one audio.
Multilevel modeling suggests that participants’ means of daily proactive patient care and
patient ratings of patient centered behavior in the treatment condition during intervention
was higher than that in the active control condition for participants attending a higher
(rather than lower) number of audios. For all other day- and encounter-level outcomes,
participants’ means of repeated measures of the outcome during intervention did not
differ between the treatment and active control conditions, regardless of total number of
audios attended.
Latent growth modeling of 10 days of repeated measures suggests that treatment
and active control conditions produced distinguishable growth trajectories for
mindfulness, job performance, proactive patient care, and patient satisfaction. The
treatment condition, rather than active control, yielded significant increases in self-
reported mindfulness and job performance over the intervention period. However, growth
trajectories of proactive patient care and patient satisfaction failed to reach significance in
the treatment and active control conditions. Although the treatment condition yielded
significant increase in self-reported patient centered behavior and decline in fatigue over
time, the trajectories were not significantly distinguishable from those in the active
control condition.
Taken together of the findings from multilevel modeling and latent growth
modeling, compared with active control, treatment yielded pre-to-post increases in
mindfulness and work related behaviors in terms of self-reported job performance and
proactive patient care and patient ratings of patient centered behavior.
62
Mindfulness
Multilevel modeling. Variance decomposition of daily mindfulness over
intervention period suggested significant between- 00 = 0.34, p
< .01) and within- 2 = 0.34, p < .001); 50% of total variance resided
between participants. Thus, multilevel modeling was warranted. As shown in Model 1 in
Table 10, exper –.01, p > .10),
after controlling for baseline mindfulness. In Model 2 in Table 10, the interaction term of
= .01, p > .10), suggesting that total number of audios attended did not influence the
effect of experimental condition on daily mindfulness.
Latent growth modeling. First, normative development of daily mindfulness as
2 (10) = 8.05, RMSEA < .001, CFI = 1.00) did not significantly improve
2 2 (3) =
5.46, p = .14. Thus, the overall normative development of daily mindfulness among
participants was a flat trajectory, as shown in Table 20. Second, as shown in Table 21,
linear growth model yielded modest fit in the treatment and active control groups
separat 2 2 (63) =
181.23, RMSEA = .24, CFI = .57). As shown in Table 22, growth factor mean was
positive and significant in the treatment condition (mean slope = 0.02, p < .05) and was
nonsignificant in the active control condition (mean slope = 0.001, p > .10). Third, in the
two-group latent growth modeling with equality constraints on initial status parameters
2 (126) = 332.76,
RMSEA = .23, CFI = .59, treatment growth factor mean was positive and significant
63
(mean slope = .02, p < .05) whereas active control growth factor mean was not significant
(mean slope = .002, p > .10), as shown in Table 25. Results suggested that treatment led
to a 0.02-unit increase of mindfulness each day over intervention period after taking into
account normative development, whereas active control did not produce change in
mindfulness over time. Fourth, the two-group analysis with additional equality
2 (127) = 337.81, RMSEA
2 (1) = 5.05, p = .02. Thus, the
treatment effect was different from active control effect.
Summary. Multilevel modeling suggests that participants’ means of daily
mindfulness during intervention did not differ between the treatment and active control
conditions, regardless of total number of audios attended. Latent growth modeling
suggests that treatment, rather than active control, produced increase in daily mindfulness
over time. The treatment and active control trajectories were distinguishable based on 10
days of repeated measures.
64
Job satisfaction
Multilevel modeling. Variance decomposition of daily job satisfaction over
intervention period suggested significant between- 00 = 0.39, p
< .001) and within- 2 = 0.55, p < .001); 41% of total variance
resided between participants. Thus, multilevel modeling was warranted. As shown in
Model 1 in Table 11
= .13, p > .10), after controlling for baseline job satisfaction. In Model 2 in Table 11, the
interaction term of condition and total number of audios attended was unrelated to daily
–.04, p > .10), suggesting that total number of audios attended did
not influence the effect of experimental condition on daily job satisfaction.
Latent growth modeling. First, normative development of daily job satisfaction as
2 (10) = 13.71, RMSEA = .08, CFI = .96) did not significantly improve
2 2 (3) =
5.79, p > .10. Thus, the overall normative development of daily job satisfaction among
participants was a flat trajectory, as shown in Table 20. Second, as shown in Table 21,
linear growth model yielded modest fit in the treatment and active control groups
2 (61) = 183.43, RMSEA = . 2 (61) =
176.58, RMSEA = .24, CFI = .36). As shown in Table 22, growth factor mean was not
significant in either the treatment or active control condition (mean slope = .02 and .001,
respectively, ps > .10). Third, in the two-group latent growth modeling with equality
constraints on initial status parameters across conditions and free parameters of
2 (124) = 360.29, RMSEA = .24, CFI = .47, treatment and
active control growth factor means were not significant (mean slope = .02 and .001,
65
respectively, ps > .10), as shown in Table 26. Results suggested that neither treatment nor
active control produced change of job satisfaction over time. Fourth, the two-group
analysis with additional equality constraints on parameters of growth factors across
2 (127) = 363.66, RMSEA = .24, CFI = .47) did not significantly worsen
2 (3) = 3.37, p > .10. Thus, the treatment effect was not different from active
control effect.
Summary. Multilevel modeling suggests that participants’ means of daily job
satisfaction during intervention did not differ between the treatment and active control
conditions, regardless of total number of audios attended. Latent growth modeling
suggests that neither treatment nor active control produced change in daily job
satisfaction over time. The treatment and active control trajectories were not
distinguishable based on 10 days of repeated measures.
66
Job performance
Multilevel modeling. Variance decomposition of daily job performance over
intervention period suggested significant between- 00 = 0.27, p
< .001) and within- 2 = 0.21, p < .001); 56% of total variance
resided between participants. Thus, multilevel modeling was warranted. As shown in
Model 1 in Table 12
= .15, p > .10), after controlling for baseline job performance. In Model 2 in Table 12, the
interaction term of condition and total number of audios attended was unrelated to daily
–.05, p > .10), suggesting that total number of audios attended did
not influence the effect of experimental condition on daily job performance.
Latent growth modeling. First, normative development of daily job performance
2 (12) = 15.58, RMSEA = .07, CFI = .97) significantly improved model
2 2 (1) = 6.75, p
< .01. Thus, the average normative development of daily job performance among
participants was a flat trajectory, although individuals’ growth trajectories vary, as shown
in Table 20. Second, as shown in Table 21, linear growth model yielded modest fit in the
treatment and active 2 (61) = 136.60, RMSEA
2 (61) = 238.54, RMSEA = .30, CFI = .38). As shown in
Table 22, growth factor mean was positive and significant in the treatment condition
(mean slope = .03, p < .01) but was not significant in the active control condition (mean
slope = .004, p > .10). Third, in the two-group latent growth modeling with equality
constraints on initial status parameters across conditions and free parameters of
intervention growt 2 (124) = 377.60, RMSEA = .25, CFI = .57, treatment
67
growth factor mean was positive and significant (mean slope = .03, p < .01) whereas
active control growth factor mean was not significant (mean slope = .003, p > .10), as
shown in Table 27. Results suggested that treatment produced a 0.03-unit increase of job
performance each day while active control failed to produce change of job performance
over time. Fourth, the two-group analysis with additional equality constraints on
parameters of growth 2 (127) = 385.30, RMSEA = .25, CFI
2 (3) = 7.7, p = .05. Thus, the treatment effect
was different from active control effect.
Summary. Multilevel modeling suggests that participants’ means of daily job
performance during intervention did not differ between the treatment and active control
conditions, regardless of total number of audios attended. Latent growth modeling
suggests that treatment, rather than active control, produced increase in daily job
performance over time. The treatment and active control trajectories were distinguishable
based on 10 days of repeated measures.
68
Proactive patient care
Multilevel modeling. Variance decomposition of self-reported daily proactive
patient care over intervention period suggested significant between-participant variance
00 = 0.74, p < .001) and within- 2 = 0.37, p < .001); 67% of total
variance resided between participants. Thus, multilevel modeling was warranted. As
shown in Model 1 in Table 13, experimental condition was unrelated to daily proactive
p > .10), after controlling for baseline proactive patient care. In
Model 2 in Table 13, the interaction term of condition and total number of audios
p < .05), suggesting that total
number of audios attended influenced the effect of experimental condition on daily
proactive patient care. Simple slope tests indicated that experimental condition was
positively related to proactive patient care for participants attending a high level (1 SD
above the mean) of total audios (b = .49, p < .05) but was unrelated to proactive patient
care for those attending a low level (1 SD below the mean) of total audios (b = –.16,
p > .10). As shown in Figure 4, compared with active control, treatment led to a higher
level of proactive patient care for participants attending a higher number of audios.
Latent growth modeling. First, normative development of daily proactive patient
2 (10) = 19.26, RMSEA = .13, CFI = .90) did not significantly
2 (13) = 23.44, RMSEA = .12, CFI = .89),
2 (3) = 4.18, p > .10. Thus, the overall normative development of daily proactive
patient care among participants was a flat trajectory, as shown in Table 20. Second, as
shown in Table 21, linear growth model yielded modest fit in the treatment and active
2 (61) = 161.98, RMSEA = .24, CFI = .65; active
69
2 (61) = 263.72, RMSEA = .34, CFI = .47). As shown in Table 22, growth factor
mean was not significant in either the treatment or active control condition (mean slope
= .02 and –.004, respectively, ps > .10). Third, in the two-group latent growth modeling
with equality constraints on initial status parameters across conditions and free
2 (124) = 431.73, RMSEA = .29, CFI = .54,
treatment and active control growth factor means were not significant (mean slope = .02
and –.01, ps > .10), as shown in Table 28. Results suggested that neither treatment nor
active control produced change in proactive patient care over time. Fourth, the two-group
analysis with additional equality constraints on parameters of growth factors across
2 (127) = 440.28, RMSEA = .29, CFI = .53) significantly worsened model
2 (3) = 8.55, p < .05. Thus, the treatment effect was different from active control
effect.
Summary. Multilevel modeling suggests that participants’ means of daily
proactive patient care in the treatment condition was higher than that in the active control
condition for participants attending a higher (rather than lower) amount of audios. Latent
growth modeling suggests that neither treatment nor active control produced change in
daily proactive patient care over time. Nonetheless, the treatment and active control
trajectories were distinguishable based on 10 days of repeated measures.
70
Participant-rated patient centered behavior
Multilevel modeling. Variance decomposition of daily participant-rated patient
centered behavior over intervention period suggested significant between-participant
00 = 0.61, p < .001) and within-part 2 = 0.17, p < .001); 78%
of total variance resided between participants. Thus, multilevel modeling was warranted.
As shown in Model 1 in Table 14, experimental condition was unrelated to daily
participant-rated patient centered behavior p > .10), after controlling for baseline
participant-rated patient centered behavior. In Model 2 in Table 14, the interaction term
of condition and total number of audios attended was unrelated to daily participant-rated
patient centered behavior p > .10), suggesting that total number of audios
attended did not influence the effect of experimental condition on daily participant-rated
patient centered behavior.
Latent growth modeling. First, normative development of daily participant-rated
2 (12) = 7.50, RMSEA < .001, CFI = 1.00)
2 (13) = 16.80, RMSEA = .07,
2 (1) = 9.30, p < .01. Thus, the average normative development of daily
participant-rated patient centered behavior among participants was a flat trajectory,
although individuals’ growth trajectories vary, as shown in Table 20. Second, as shown in
Table 21, linear growth model yielded modest fit in the treatment and active control
2 (61) = 155.25, RMSEA = .22, CFI = .78; active control:
2 (61) = 138.24, RMSEA = .20, CFI = .85). As shown in Table 22, growth factor mean
was positive and significant in the treatment condition (mean slope = .03, p < .01) but
was not significant in the active control condition (mean slope = .01, p > .10). Third, in
71
the two-group latent growth modeling with equality constraints on initial status
parameters across conditions and free parameters of intervention 2 (124)
= 294.54, RMSEA = .21, CFI = .81, treatment growth factor mean was positive and
significant (mean slope = .03, p < .01) whereas active control growth factor mean was not
significant (mean slope = .01, p > .10), as shown in Table 29. Results suggested that
treatment led to a 0.03-unit increase of patient centered behavior each day while active
control did not produce change in patient centered behavior over time. Fourth, the two-
group analysis with additional equality constraints on parameters of growth factors across
2 (127) = 299.66, RMSEA = .21, CFI = .81) did not significantly worsen
2 (3) = 5.12, p = .16. Thus, the treatment effect was not different from active
control effect.
Summary. Multilevel modeling suggests that participants’ means of self-reported
daily patient centered behavior during intervention did not differ between the treatment
and active control conditions, regardless of total number of audios attended. Latent
growth modeling suggests that treatment, rather than active control, produced increase in
daily self-reported patient centered behavior over time. The treatment and active control
trajectories were not distinguishable based on 10 days of repeated measures.

72
Stress
Multilevel modeling. Variance decomposition of daily stress over intervention
period suggested significant between- 00 = 0.49, p < .001) and
within- 2 = 0.85, p < .001); 37% of total variance resided between
participants. Thus, multilevel modeling was warranted. As shown in Model 1 in Table 15,
–.13, p > .10), after controlling
for baseline stress. In Model 2 in Table 15, the interaction term of condition and total
nu p > .10), suggesting that
total number of audios attended did not influence the effect of experimental condition on
daily stress.
Latent growth modeling. First, normative development of daily stress as linear
2 (11) = 7.50, RMSEA = .09, CFI = .91) significantly improved model fit
2 2 (2) = 20.5, p
< .001. Thus, the overall normative development of daily stress among participants was a
flat trajectory with variability of growth rates among participants, as shown in Table 20.
Second, as shown in Table 21, linear growth model yielded good fit in the treatment
group and modest??? fit in the active control group separatel 2 (61) = 85.09,
2 (61) = 167.18, RMSEA = .23, CFI = .35). As
shown in Table 22, growth factor mean was not significant in the treatment and active
control conditions (mean slope = –.01 and –.01, ps > .10). Third, in the two-group latent
growth modeling with equality constraints on initial status parameters across conditions
2 (124) =252.87, RMSEA = .18, CFI
= .57, treatment and active control growth factor means were not significant (mean slope
73
= –.01 and –.001, ps > .10), as shown in Table 30. Results suggested that neither
treatment nor active control produced change in stress over time. Fourth, the two-group
analysis with additional equality constraints on parameters of growth factors across
2 (127) = 253.76, RMSEA = .18, CFI = .58) did not significantly worsen
2 (3) = 0.89, p > .10. Thus, the treatment effect was not different from active
control effect.
Summary. Multilevel modeling suggests that participants’ means of daily stress
during intervention did not differ between the treatment and active control conditions,
regardless of total number of audios attended. Latent growth modeling suggests that
neither treatment nor active control produced change in daily stress over time. The
treatment and active control trajectories were not distinguishable based on 10 days of
repeated measures.
74
Emotional exhaustion
Multilevel modeling. Variance decomposition of daily emotional exhaustion over
intervention period suggested significant between- 00 = 0.50, p
< .001) and within- 2 = 0.83, p < .001); 38% of total variance
resided between participants. Thus, multilevel modeling was warranted. As shown in
Model 1 in Table 16, experimental condition was unrelated to daily emotional exhaustion
–.17, p > .10), after controlling for baseline emotional exhaustion. In Model 2 in
Table 16, the interaction term of condition and total number of audios attended was
p > .10), suggesting that total number of
audios attended did not influence the effect of experimental condition on daily emotional
exhaustion.
Latent growth modeling. First, normative development of daily emotional
2 (12) = 8.47, RMSEA = .00, CFI = 1.00) significantly
2 (13) = 13.17, RMSEA = .01, CFI = 1.00),
2 (1) = 4.70, p < .05. Thus, the overall normative development of daily emotional
exhaustion among participants was a flat trajectory with variability of growth rates
among participants, as shown in Table 20. Second, as shown in Table 21, linear growth
model yielded modest fit in the treatment and active control groups separately (treatment:
2 2 (61) = 164.16, RMSEA
= .23, CFI = .49). As shown in Table 22, growth factor means were not significant in the
treatment and active control conditions (mean slope = –.02 and .01, ps > .10). Third, in
the two-group latent growth modeling with equality constraints on initial status
2 (124)
75
=274.62, RMSEA = .20, CFI = .55, treatment and active control growth factor means
were not significant (mean slope = –.02 and .01, ps > .10), as shown in Table 31. Results
suggested that neither treatment nor active control produced change in emotional
exhaustion over time. Fourth, the two-group analysis with additional equality constraints
2 (127) = 280.56, RMSEA = .19, CFI
2 (3) = 5.94, p > .10. Thus, the treatment
effect was not different from active control effect.
Summary. Multilevel modeling suggests that participants’ means of daily
emotional exhaustion during intervention did not differ between the treatment and active
control conditions, regardless of total number of audios attended. Latent growth modeling
suggests that neither treatment nor active control produced change in daily emotional
exhaustion over time. The treatment and active control trajectories were not
distinguishable based on 10 days of repeated measures.
76
Fatigue
Multilevel modeling. Variance decomposition of daily fatigue over intervention
period suggested significant between- 00 = 0.34, p < .001) and
within- 2 = 0.93, p < .001); 27% of total variance resided between
participants. Thus, multilevel modeling was warranted. As shown in Model 1 in Table 17,
–.17, p > .10), after controlling
for baseline fatigue. In Model 2 in Table 17, the interaction term of condition and total
p > .10), suggesting
that total number of audios attended did not influence the effect of experimental
condition on daily fatigue.
Latent growth modeling. First, normative development of daily fatigue as linear
2 (12) = 14.45, RMSEA = .06, CFI = .97) did not significantly improve model
2 2 (1) = 0.31,
p > .10. Thus, the overall normative development of daily fatigue among participants was
a flat trajectory, as shown in Table 20. Second, as shown in Table 21, linear growth
model yielded modest fit in the treatment and active control groups separately (treatment:
2 2 (61) = 157.76, RMSEA
= .22, CFI = .41). As shown in Table 22, growth factor mean was negative and significant
in the treatment condition (mean slope = –.05, p < .05) but was not significant in the
active control condition (mean slope = –.03, p > .10). Third, in the two-group latent
growth modeling with equality constraints on initial status parameters across conditions
2 (124) =290.25, RMSEA = .21, CFI
= .42, treatment growth factor mean was negative and significant (mean slope = –.05, p
77
< .01) and active control growth factor mean was not significant (mean slope = –.02,
p > .10), as shown in Table 32. Results suggested that treatment led to a 0.05-unit
decrease of fatigue each day whereas active control produced no change in fatigue over
time. Fourth, the two-group analysis with additional equality constraints on parameters of
2 (127) = 291.54, RMSEA = .20, CFI = .42) did not
2 (3) = 1.29, p > .10. Thus, the treatment effect was not
different from active control effect.
Summary. Multilevel modeling suggests that participants’ means of daily fatigue
during intervention did not differ between the treatment and active control conditions,
regardless of total number of audios attended. Latent growth modeling suggests that
treatment, rather than active control, produced decline in daily fatigue over time. The
treatment and active control trajectories were not distinguishable based on 10 days of
repeated measures.
78
Summary of participant self-reported outcomes
Multilevel modeling suggests that participants’ means of daily proactive patient
care in the treatment condition was higher than that in the active control condition for
participants attending a higher (rather than lower) amount of audios. For other self-
reported outcomes, participants’ means of the daily outcome during intervention did not
differ between the treatment and active control conditions, regardless of total number of
audios attended.
Latent growth modeling of 10 days of repeated measures suggests that treatment
and active control conditions produced distinguishable growth trajectories for
mindfulness, job performance, and proactive patient care. The treatment condition, rather
than active control, yielded significant increases in self-reported mindfulness and job
performance over the intervention period. However, growth trajectories of proactive
patient care failed to reach significance in the treatment and active control conditions.
Although the treatment condition yielded significant increase in self-reported patient
centered behavior and decline in fatigue over time, the trajectories were not significantly
distinguishable from those in the active control condition.
Below I examined the effect of intervention on patient rated outcomes (i.e.,
patient centered behavior and patient satisfaction).
79
Patient-rated patient centered behavior
Multilevel modeling. The data structure of patient-rated patient centered behavior
over intervention period was complex; encounter was nested within day nested within
participant and encounter was also nested within patients. Although the nesting structure
has been examined for each item in the “confirmatory factor analysis” section above, it is
necessary to determine the appropriate variance structure for the composite. I first
performed three-level variance decomposition (i.e., encounter within day within
participant), yielding significant amounts of variance at the participant (.02, p = .06) and
encounter levels (.79, p < .001) but nonsignificant variance at the day level (.01, p > .10).
Thus, day was not treated as a meaningful cluster. Next, I partitioned variance using a
cross-classified data structure with encounter simultaneously nested within participant
and patient, yielding significant amounts of variance at the participant (variance = .02,
95% Bayesian Credibility Interval (CI) = [.01, .07]), patient (variance = .57, 95% CI =
[.49, .66]), and encounter (variance = .24, 95% CI = [.21, .29]) levels. 2.4% of total
variance resided between participants. Thus, cross-classified multilevel modeling was
warranted.
As shown in Model 1 in Table 18, experimental condition was unrelated to
patient- –.05, .20]), after controlling
for baseline patient-rated patient centered behavior. In Model 2 in Table 18, the
interaction term of condition and total number of audios attended was related to patient-
number of audios attended influenced the effect of experimental condition on patient-
rated patient centered behavior. Simple slope tests indicated that experimental condition
80
was positively related to patient-rated patient centered behavior for participants attending
a high level (1 SD above the mean) of total audios (b = .20, 95% CI = [.04, .37]) but was
unrelated to patient-rated patient centered behavior for those attending a low level (1 SD
below the mean) of total audios (b = –.20, 95% CI = [–.51, .07]). As shown in Figure 5,
compared with active control, treatment led to a higher level of patient-rated patient
centered behavior for participants attending a higher number of audios.
Latent growth modeling. First, normative development of daily patient-rated
patient centered beh 2 (12) =11.33, RMSEA = .00, CFI = 1.00)
2 (13) = 11.36, RMSEA
2 (1) = 0.03, p > .10. Thus, the overall normative development of
daily patient-rated patient centered behavior among participants was a flat trajectory, as
shown in Table 20. Second, as shown in Table 21, linear growth model yielded poor fit in
2 (61) =208.26, RMSEA
= 2 (63) = 235.50, RMSEA = .33, CFI = .13). As shown in
Table 22, growth factor mean was not significant in the treatment or active control
condition (mean slope = .004 and .001, ps > .10). Third, in the two-group latent growth
modeling with equality constraints on initial status parameters across conditions and free
2 (126) = 445.64, RMSEA = .32, CFI = .09,
treatment and active control growth factor means were not significant (mean slope = .000
and .002, ps > .10), as shown in Table 33. Results suggested that neither treatment nor
active control produced change in patient rated patient centered behavior over time.
Fourth, the two-group analysis with additional equality constraints on parameters of
2 (129) = 446.49, RMSEA = .31, CFI = .10) did not
81
2 (3) = 0.85, p > .10. Thus, the treatment effect was not
different from active control effect.
Summary. Participants’ means of patient ratings of patient centered behavior in
the treatment condition was higher than that in the active control condition for
participants attending a higher (rather than lower) amount of audios. Latent growth
modeling suggests that neither treatment nor active control produced change in daily
averages of patient ratings of patient centered behavior over time. The treatment and
active control trajectories were not distinguishable based on 10 days of repeated
measures.
82
Patient satisfaction (main effect of the mindfulness intervention)
Multilevel modeling. Hypothesis 1 predicts that, compared with active control, a
mindfulness intervention leads to higher job performance. I focused on patient
satisfaction as patient ratings of job performance. The data structure of patient
satisfaction over intervention period was complex; encounter was nested within day
nested within participant while encounter was also nested within patients. To determine
the appropriate variance structure, I first performed three-level variance decomposition
(i.e., encounter within day within participant), yielding significant amounts of variance at
the encounter level (variance = .19, p < .001) but nonsignificant variance at the day
(variance = .002, p > .10) and participant levels (variance < .001, p > .10). Thus, day and
participant may not be meaningful clusters. Nonetheless, I partitioned variance using a
cross-classified data structure with encounter simultaneously nested within participant
and patient, yielding significant amounts of variance at the participant (variance = .002,
95% Bayesian Credibility Interval (CI) = [.001, .005]), patient (variance = .13, 95% CI =
[.11, .15]), and encounter (variance = .07, 95% CI = [.06, .09]) levels. 1.0% of total
variance resided between participants. Thus, cross-classified multilevel modeling was
warranted.
As shown in Model 1 in Table 19, experimental condition was unrelated to patient
–.02, .06]), after controlling for baseline patient
satisfaction. Thus, Hypothesis 1 was not supported. In Model 2 in Table 19, the
interaction term of condition and total number of audios attended was unrelated to patient
–.01, .06]), suggesting that total number of audios
83
attended did not influence the effect of experimental condition on patient rated patient
satisfaction.
Latent growth modeling. First, normative development of daily patient
2 (12) =14.51, RMSEA = .07, CFI = .16) did not
sig 2 (13) = 15.29, RMSEA = .06,
2 (1) = 0.78, p > .10. Thus, the overall normative development of daily
patient satisfaction among participants was a flat trajectory, as shown in Table 20.
Second, as shown in Table 21, linear growth model yielded poor fit in the treatment and
2 (64) =203.19, RMSEA = .29, CFI = .00;
2 (63) = 188.46, RMSEA = .28, CFI = .00). As shown in Table 22, growth
factor mean was negative and significant in the treatment condition (mean slope = –.01, p
< .01) but was not significant in the active control condition (mean slope = .002, p > .10).
Third, in the two-group latent growth modeling with equality constraints on initial status
2 (127)
= 412.71, RMSEA = .30, CFI = .00, treatment and active control growth factor means
were not significant (mean slope = –.001 and –.01, ps > .10), as shown in Table 34.
Results suggested that neither treatment nor active control produced change in patient
satisfaction over time. Fourth, the two-group analysis with additional equality constraints
on parameters of growth factors across conditions 2 (129) = 419.21, RMSEA = .30, CFI
2 (2) = 6.50, p < .05. Thus, the treatment effect
was different from active control effect.
Summary. Multilevel modeling suggests that participants’ means of patient
satisfaction during intervention did not differ between the treatment and active control
84
conditions, regardless of total number of audios attended. Latent growth modeling using
10 days of repeated measures suggests that neither treatment nor active control produced
change in daily averages of patient satisfaction over time, although the treatment and
active control trajectories were distinguishable.
Supplemental analyses
For each outcome above, I replicated the two-group analyses using 10 days and 5
waves of repeated measures, using a constrained sample of participants who attended at
least five (50%) audios during intervention. Same pattern of results as using the intent-to-
treat sample were obtained for each outcome, as shown in Table 35.
85
Cross-Classified Multilevel Moderated Mediation Analyses: Analytic Strategies
Hypotheses 2 to 4 predict that participant’ attentiveness, perspective taking, and
response flexibility each mediates the effect of experimental condition on participants’
job performance. As shown in the zero-correlation matrices of the background survey,
end-of-workday survey, and patient survey in Tables 5 to 7 and the “confirmatory factor
analysis” section, attentiveness, perspective taking, and response flexibility were highly
intercorrelated and represented by a higher-order construct of patient centered behavior.
Thus, I tested the mediation hypotheses using patient centered behavior instead of its
three facets separately. I focused on patient ratings of participants’ patient centered
behavior and job performance (i.e., patient satisfaction with performance) as the
mediating mechanism and outcome, respectively. Using patient ratings instead of
participant self-reports avoided inflated relationships due to common method bias
(Podsakoff, MacKenzie, Lee, & Podsakoff, 2003). Given the complex structure of the
data, I first performed variance decomposition of variables to determine the appropriate
nesting structure. Then, I tested the mediation hypothesis following the multilevel
mediation recommendations of Preacher et al. (2010). Next, I tested the moderated
mediation hypotheses in Hypotheses 5 to 7 following the multilevel moderation
recommendations of Preacher, Zhang, & Zyphur (in press). I examined each moderator in
a separate model and then included three moderators in one model.
I performed intent-to-treat analysis using participants who attended at least one
audio during intervention (992 encounters from 41 participants and 714 patients). As a
robustness check, I replicated the above analyses using a constrained sample of
86
participants who attended at least five (50%) audios during intervention (968 encounters
from 38 participants and 710 patients).
Nested Data Structure
The data structure was complex; encounter was nested within day nested with
participant while encounter was simultaneously nested within patient. This represented a
three-level model with the extra factor (i.e., patients) crossed with the level-3 units (i.e.,
participants) (Snijders & Bosker, 2012). Although extant theoretical and applied research
on cross-classified multilevel modeling has mainly focused on two-level model with a
crossed factor (e.g., Hox, 2010; Raudenbush & Bryk, 2002; for empirical examples, see
Leckie & Baird, 2011; Rasbash, Leckie, Pillinger, & Jenkins, 2010; Timmermans,
Snijders, & Bosker, 2013), statistical treatment of more complex cross-classified
multilevel models has been advanced (e.g., Goldstein, 2011; Leckie, 2013) and a limited
few applications, such as MLwiN (Rasbash, Charlton, Browne, Healy, & Cameron, 2009)
and WinBUGS (Spiegelhalter, Thomas, Best, & Lunn, 2002), have incorporated such
models using Bayesian estimation. However, a three-level model with a crossed factor
has not been implemented in Mplus (B. Muthén, June 5, 2015, personal communication).
Nonetheless, I first partitioned variance of each study variable across levels to
determine the appropriate nesting structure. As shown in the previous section (“Effect of
intervention on participant and patient outcomes”), patient satisfaction and patient rated
patient centered behavior had negligible, nonsignificant amount of variance at the day
level and significant amount of variance at the participant, patient, and encounter levels.
Thus, a cross-classified two-level model was warranted with encounter nested within the
cross-classification of participant and patient. Although I did not hypothesize patient-
87
level predictors of encounter-specific outcomes, it is important to take into account the
crossed factor (i.e., patients) to obtain accurate estimates of standard errors (Meyers &
Beretvas, 2006).
Mediating Effect of Patient-Rated Patient Centered Behavior
Hypothesis 2 to 4 predicted that, compared with active control, treatment led to a
higher level of patient satisfaction (i.e., patient rated job performance) mediated by a
higher level of patient perception of patient centered behavior during encounter. The
predictor (experimental condition) was at participant level, and the mediator (patient
centered behavior) and outcome (patient satisfaction) were both at encounter level. I
tested the mediation effect following the 2-1-1 multilevel mediation framework proposed
by Preacher et al. (2010). The mediation of interest occurred at the participant level.
Focused on multilevel mediation of two-level data, Preacher et al. (2010) recommended
disentangling variables measured at level-1 in a 2-1-1 model into latent Between and
Within components to obtain unbiased estimates of Between indirect effect. This
approach is advantageous compared with the unconflated multilevel modeling approach
in which a level-1 variable is decomposed into level-2 cluster mean and level-1 variable
centered at cluster mean; treating Between component as observed cluster mean produces
biased estimates of population Between effect (Preacher et al., 2010). The multilevel
mediation approach has been adopted in recent studies (e.g., Hülsheger et al., 2013;
Zhou, Wang, Chen, & Shi, 2012) and extended to two-level data with a crossed factor
(Muthén & Muthén, 2012).
In the cross-classified two-level mediation model, estimation was simultaneously
performed at participant, patient, and within levels. At participant level, outcome latent
component was regressed on mediator latent component and observed experimental
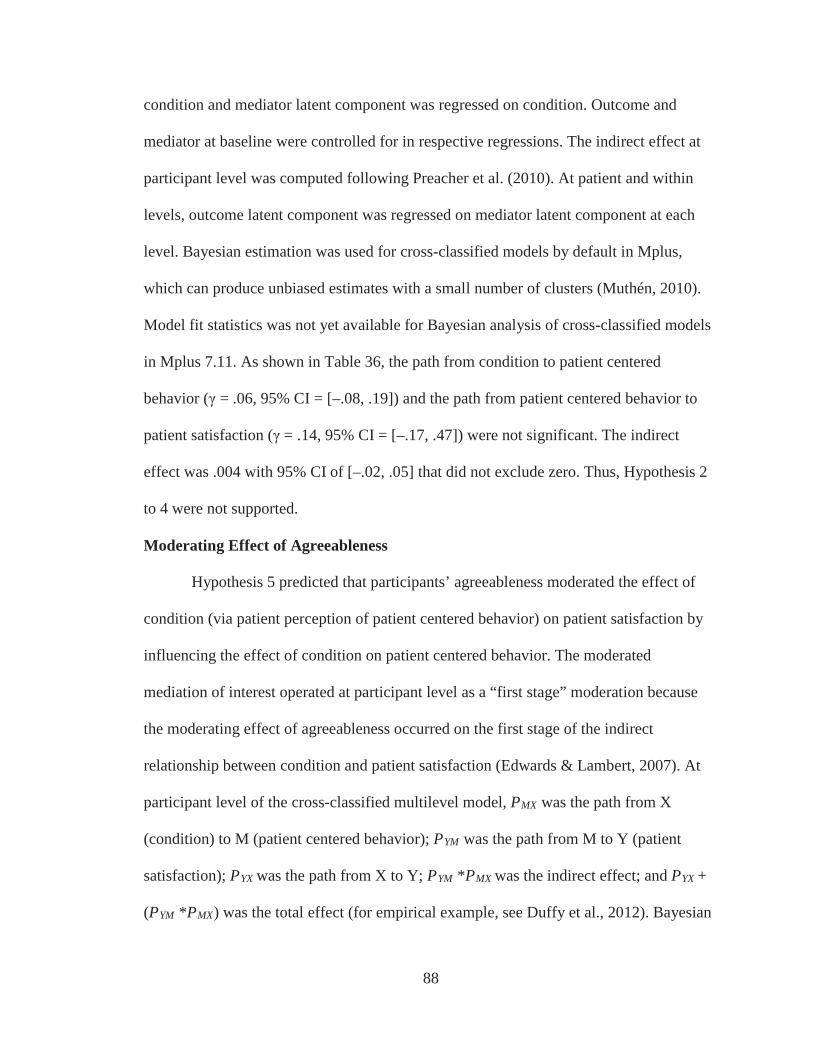
88
condition and mediator latent component was regressed on condition. Outcome and
mediator at baseline were controlled for in respective regressions. The indirect effect at
participant level was computed following Preacher et al. (2010). At patient and within
levels, outcome latent component was regressed on mediator latent component at each
level. Bayesian estimation was used for cross-classified models by default in Mplus,
which can produce unbiased estimates with a small number of clusters (Muthén, 2010).
Model fit statistics was not yet available for Bayesian analysis of cross-classified models
in Mplus 7.11. As shown in Table 36, the path from condition to patient centered
behavior ( = .06, 95% CI = [–.08, .19]) and the path from patient centered behavior to
patient satisfaction ( = .14, 95% CI = [–.17, .47]) were not significant. The indirect
effect was .004 with 95% CI of [–.02, .05] that did not exclude zero. Thus, Hypothesis 2
to 4 were not supported.
Moderating Effect of Agreeableness
Hypothesis 5 predicted that participants’ agreeableness moderated the effect of
condition (via patient perception of patient centered behavior) on patient satisfaction by
influencing the effect of condition on patient centered behavior. The moderated
mediation of interest operated at participant level as a “first stage” moderation because
the moderating effect of agreeableness occurred on the first stage of the indirect
relationship between condition and patient satisfaction (Edwards & Lambert, 2007). At
participant level of the cross-classified multilevel model, PMX was the path from X
(condition) to M (patient centered behavior); PYM was the path from M to Y (patient
satisfaction); PYX was the path from X to Y; PYM *PMX was the indirect effect; and PYX +
(PYM *PMX) was the total effect (for empirical example, see Duffy et al., 2012). Bayesian
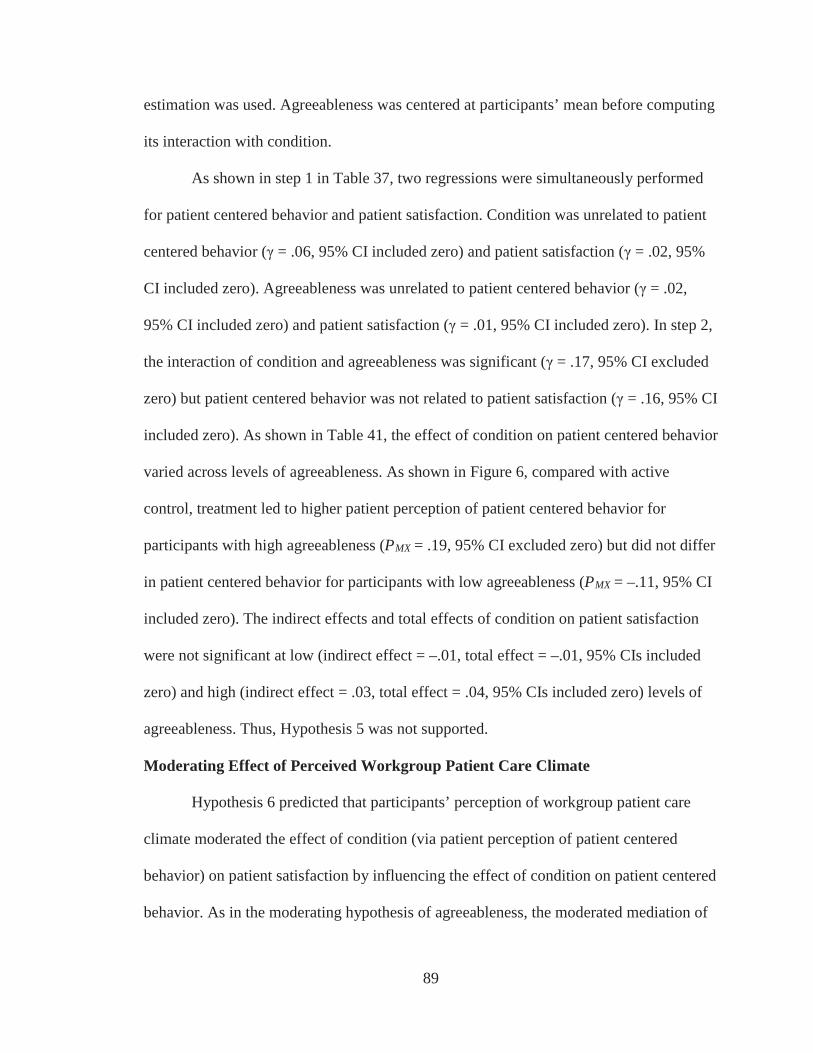
89
estimation was used. Agreeableness was centered at participants’ mean before computing
its interaction with condition.
As shown in step 1 in Table 37, two regressions were simultaneously performed
for patient centered behavior and patient satisfaction. Condition was unrelated to patient
centered behavior ( = .06, 95% CI included zero) and patient satisfaction ( = .02, 95%
CI included zero). Agreeableness was unrelated to patient centered behavior ( = .02,
95% CI included zero) and patient satisfaction ( = .01, 95% CI included zero). In step 2,
the interaction of condition and agreeableness was significant ( = .17, 95% CI excluded
zero) but patient centered behavior was not related to patient satisfaction ( = .16, 95% CI
included zero). As shown in Table 41, the effect of condition on patient centered behavior
varied across levels of agreeableness. As shown in Figure 6, compared with active
control, treatment led to higher patient perception of patient centered behavior for
participants with high agreeableness (PMX = .19, 95% CI excluded zero) but did not differ
in patient centered behavior for participants with low agreeableness (PMX = –.11, 95% CI
included zero). The indirect effects and total effects of condition on patient satisfaction
were not significant at low (indirect effect = –.01, total effect = –.01, 95% CIs included
zero) and high (indirect effect = .03, total effect = .04, 95% CIs included zero) levels of
agreeableness. Thus, Hypothesis 5 was not supported.
Moderating Effect of Perceived Workgroup Patient Care Climate
Hypothesis 6 predicted that participants’ perception of workgroup patient care
climate moderated the effect of condition (via patient perception of patient centered
behavior) on patient satisfaction by influencing the effect of condition on patient centered
behavior. As in the moderating hypothesis of agreeableness, the moderated mediation of
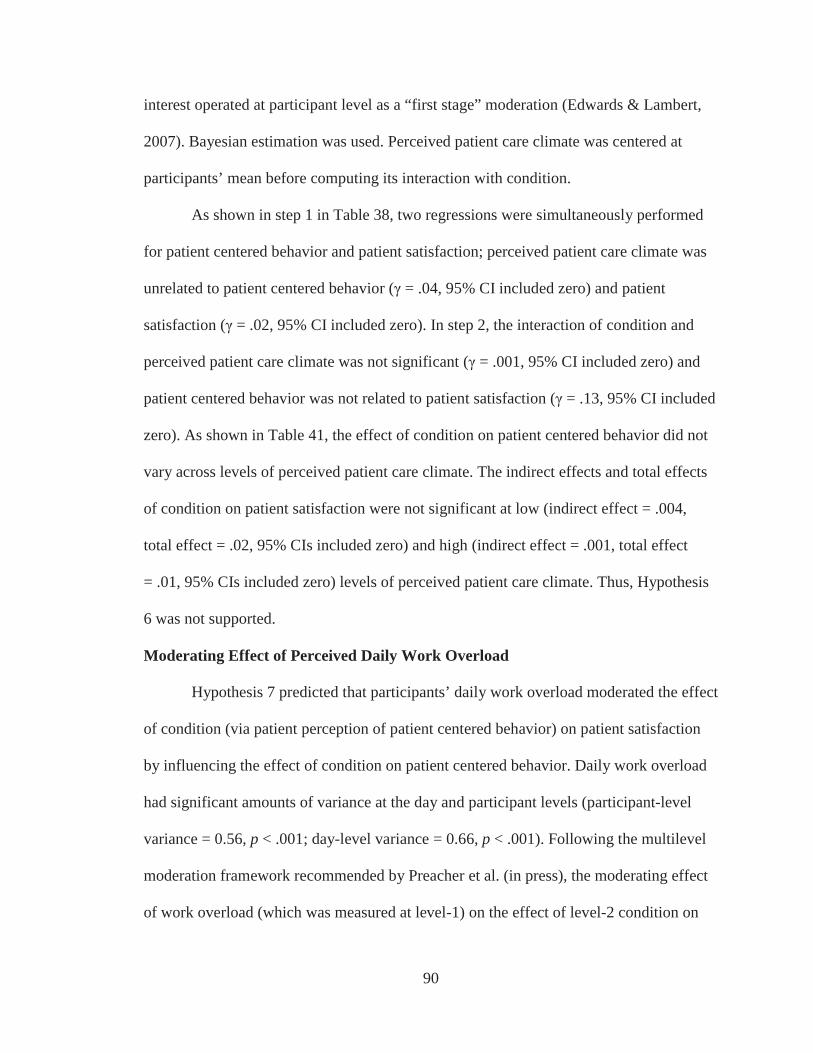
90
interest operated at participant level as a “first stage” moderation (Edwards & Lambert,
2007). Bayesian estimation was used. Perceived patient care climate was centered at
participants’ mean before computing its interaction with condition.
As shown in step 1 in Table 38, two regressions were simultaneously performed
for patient centered behavior and patient satisfaction; perceived patient care climate was
unrelated to patient centered behavior ( = .04, 95% CI included zero) and patient
satisfaction ( = .02, 95% CI included zero). In step 2, the interaction of condition and
perceived patient care climate was not significant ( = .001, 95% CI included zero) and
patient centered behavior was not related to patient satisfaction ( = .13, 95% CI included
zero). As shown in Table 41, the effect of condition on patient centered behavior did not
vary across levels of perceived patient care climate. The indirect effects and total effects
of condition on patient satisfaction were not significant at low (indirect effect = .004,
total effect = .02, 95% CIs included zero) and high (indirect effect = .001, total effect
= .01, 95% CIs included zero) levels of perceived patient care climate. Thus, Hypothesis
6 was not supported.
Moderating Effect of Perceived Daily Work Overload
Hypothesis 7 predicted that participants’ daily work overload moderated the effect
of condition (via patient perception of patient centered behavior) on patient satisfaction
by influencing the effect of condition on patient centered behavior. Daily work overload
had significant amounts of variance at the day and participant levels (participant-level
variance = 0.56, p < .001; day-level variance = 0.66, p < .001). Following the multilevel
moderation framework recommended by Preacher et al. (in press), the moderating effect
of work overload (which was measured at level-1) on the effect of level-2 condition on
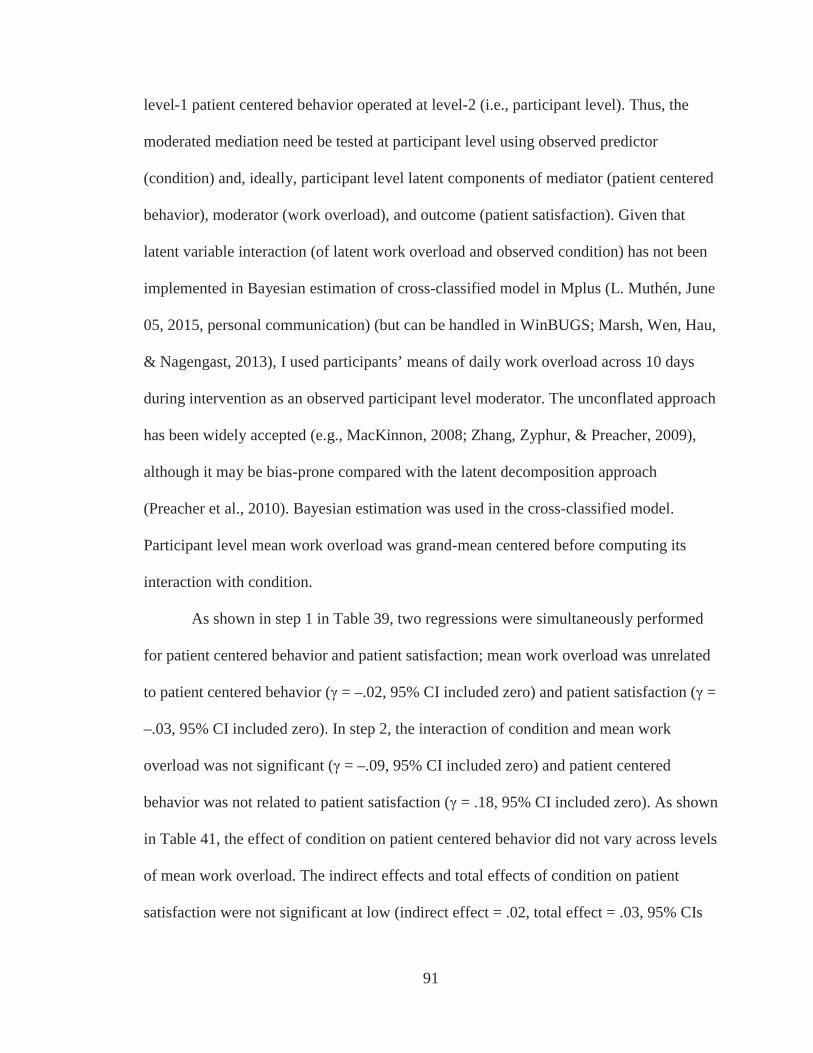
91
level-1 patient centered behavior operated at level-2 (i.e., participant level). Thus, the
moderated mediation need be tested at participant level using observed predictor
(condition) and, ideally, participant level latent components of mediator (patient centered
behavior), moderator (work overload), and outcome (patient satisfaction). Given that
latent variable interaction (of latent work overload and observed condition) has not been
implemented in Bayesian estimation of cross-classified model in Mplus (L. Muthén, June
05, 2015, personal communication) (but can be handled in WinBUGS; Marsh, Wen, Hau,
& Nagengast, 2013), I used participants’ means of daily work overload across 10 days
during intervention as an observed participant level moderator. The unconflated approach
has been widely accepted (e.g., MacKinnon, 2008; Zhang, Zyphur, & Preacher, 2009),
although it may be bias-prone compared with the latent decomposition approach
(Preacher et al., 2010). Bayesian estimation was used in the cross-classified model.
Participant level mean work overload was grand-mean centered before computing its
interaction with condition.
As shown in step 1 in Table 39, two regressions were simultaneously performed
for patient centered behavior and patient satisfaction; mean work overload was unrelated
to patient centered behavior ( = –.02, 95% CI included zero) and patient satisfaction ( =
–.03, 95% CI included zero). In step 2, the interaction of condition and mean work
overload was not significant ( = –.09, 95% CI included zero) and patient centered
behavior was not related to patient satisfaction ( = .18, 95% CI included zero). As shown
in Table 41, the effect of condition on patient centered behavior did not vary across levels
of mean work overload. The indirect effects and total effects of condition on patient
satisfaction were not significant at low (indirect effect = .02, total effect = .03, 95% CIs
92
included zero) and high (indirect effect = –.001, total effect = .003, 95% CIs included
zero) levels of mean work overload. Thus, Hypothesis 7 was not supported.
Supplemental Analyses
I tested the three moderators simultaneously by including them and their
respective interaction terms with condition in the same model. As shown in Table 40,
same pattern of results were obtained. In step 2, the interaction of condition and
agreeableness was a significant predictor of patient centered behavior ( = .18, 90% CI
excluded zero). In Table 41, the effect of condition on patient centered behavior varied
across levels of agreeableness. Compared with active control, treatment led to higher
patient perception of patient centered behavior for participants with high agreeableness
(PMX = .20, 90% CI excluded zero) but did not differ in patient centered behavior for
participants with low agreeableness (PMX = –.12, 95% CI included zero). The indirect
effects and total effects were not different across levels of agreeableness.
I replicated the above analyses using a restrained sample of participants who
attended at least five audios during intervention (968 encounters from 38 participants and
710 patients). The same pattern of results were obtained.
93
Chapter 7 Discussion
Summary of Study Findings
This dissertation examined the role of a brief mindfulness intervention in
promoting job performance in service settings and the client-focused mediating
mechanisms (i.e., attentiveness, perspective taking, and response flexibility) and
individual, social, and job contingencies (i.e., agreeableness, perceived workgroup
service climate, and daily work overload) of this relationship. I conducted a pretest-
posttest field experiment with random assignment to a treatment and active control
condition in a health care organization. A series of confirmatory factor analyses of the
client-focused items in the background, end-of-workday, and patient surveys converged
to suggest that attentiveness, perspective taking, and response flexibility were represented
by a higher-order construct of patient centered behavior. Using multilevel modeling and
latent growth modeling, in comparisons of the treatment (i.e., mindfulness meditation)
and active control (i.e., wellness education) conditions, treatment yielded pre-to-post
increases in mindfulness and work related behaviors in terms of self-reported job
performance and proactive patient care and patient ratings of patient centered behavior.
Multilevel moderated mediation modeling with cross classification suggests that
compared with active control, treatment produced a higher level of the proposed
mediator, patient-rated patient centered behavior, for participants higher in agreeableness.
Theoretical and Empirical Implications
Past research into the role of mindfulness and mindfulness-based practices in job
performance has yielded mixed findings. This research has focused on performance
across a variety of settings, such as restaurant (Dane & Brummel, 2014), health care
94
(Grepmair et al., 2007), power plant (Zhang et al., 2013), MBA classes (Shao &
Skarlicki, 2009), university employees (Giluk, 2010), insurance company (Wolever et al.,
2012), and heterogamous organizations (Reb et al., 2015). The nature of task
environment may be key to channeling mindful awareness and attention toward fulfilling
task-related duties. Dane (2011) has suggested that heightened attention toward external
stimuli is conducive to task performance in dynamic task environments such as service
settings (see also Glomb et al., 2011). By focusing on the role of mindfulness in job
performance in service settings, this dissertation offers a more clear delineation of the
external validity (i.e., generalizability) of the performance effect of mindfulness and
information into the intervening processes.
Given that little is known regarding the mechanisms by which mindfulness and
mindfulness-based practices effect performance, this work contributes to knowledge of
the client-focused behavioral mechanisms—attentiveness, perspective taking, and
response flexibility—that are germane to service settings in general and health care
settings in particular. The emergence of the higher-order construct of patient centered
behavior in participants’ self-reports echoes the theoretical argument that the three
mechanisms are driven by intertwined core processes of mindfulness, including
decoupling of the self from events and experiences, decreased automaticity, and
physiological regulation (Glomb et al., 2011). The emergence of the higher-order
construct in patient ratings suggests that the three behavioral constructs manifest in a
coherent fashion and that observers tend to develop global rather than faceted perceptions
of participants’ behaviors during encounters.
95
The mindfulness intervention, compared with active control, did not yield
consistently higher patient ratings across outcomes. Specifically, it only yielded effects
for one of the key job performance outcome—patient centered behaviors (both self and
patient rated)—but not for patient satisfaction. The absence of strong and consistent
effects of the intervention on outcomes may be related to several design factors.
Unlike prior research often comparing mindfulness intervention with a nonactive
control condition in which participants were waitlisted or worked as usual (e.g.., Aikens
et al., 2014; Grepmair et al., 2007; Hülsheger et al., 2013; Wolever et al., 2012), I used an
active control condition in which participants listened to wellness education audios.
Given that the active control and treatment conditions share all intervention elements
(i.e., daily 10-minute audios, daily end-of-workday surveys, and patient survey handoffs)
except the contents of audios, one would have more confidence in attributing differences
in an outcome across conditions to the contents of audios (Cook & Campbell, 1979;
Goyal et al., 2014). However, it is also more challenging to detect such differences when
the treatment condition was compared with an active control condition than with a
nonactive control condition for two important reasons. First, participants in the active
control condition are likely to expect that they will have improvements as a result of
engaging in some kinds of intervention activity and be motivated to behave equally well
as their counterparts in the treatment condition (Shadish et al., 2002). Second, because
my treatment and active control conditions both use audios pertinent to some aspects of
well-being, one may question whether the active control should really be considered a
control, but rather an alternative type of intervention. Taken together, the multilevel
modeling and latent growth modeling analytical approaches reveal that, compared with
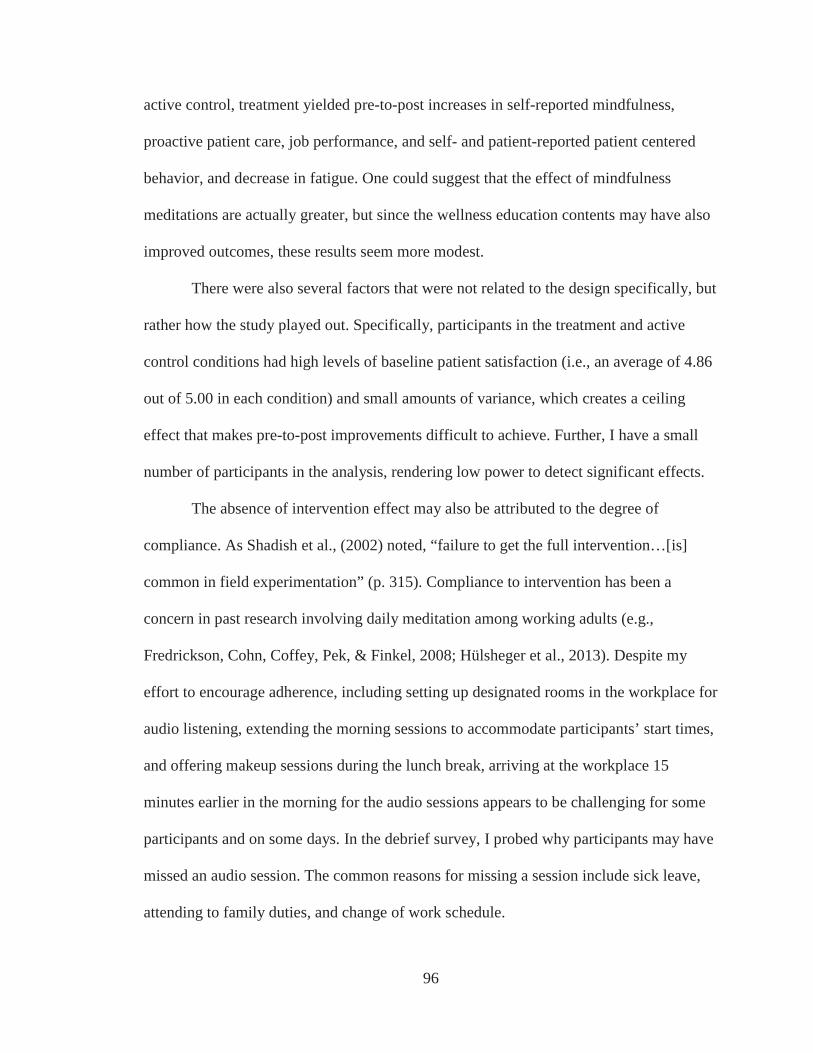
96
active control, treatment yielded pre-to-post increases in self-reported mindfulness,
proactive patient care, job performance, and self- and patient-reported patient centered
behavior, and decrease in fatigue. One could suggest that the effect of mindfulness
meditations are actually greater, but since the wellness education contents may have also
improved outcomes, these results seem more modest.
There were also several factors that were not related to the design specifically, but
rather how the study played out. Specifically, participants in the treatment and active
control conditions had high levels of baseline patient satisfaction (i.e., an average of 4.86
out of 5.00 in each condition) and small amounts of variance, which creates a ceiling
effect that makes pre-to-post improvements difficult to achieve. Further, I have a small
number of participants in the analysis, rendering low power to detect significant effects.
The absence of intervention effect may also be attributed to the degree of
compliance. As Shadish et al., (2002) noted, “failure to get the full intervention…[is]
common in field experimentation” (p. 315). Compliance to intervention has been a
concern in past research involving daily meditation among working adults (e.g.,
Fredrickson, Cohn, Coffey, Pek, & Finkel, 2008; Hülsheger et al., 2013). Despite my
effort to encourage adherence, including setting up designated rooms in the workplace for
audio listening, extending the morning sessions to accommodate participants’ start times,
and offering makeup sessions during the lunch break, arriving at the workplace 15
minutes earlier in the morning for the audio sessions appears to be challenging for some
participants and on some days. In the debrief survey, I probed why participants may have
missed an audio session. The common reasons for missing a session include sick leave,
attending to family duties, and change of work schedule.
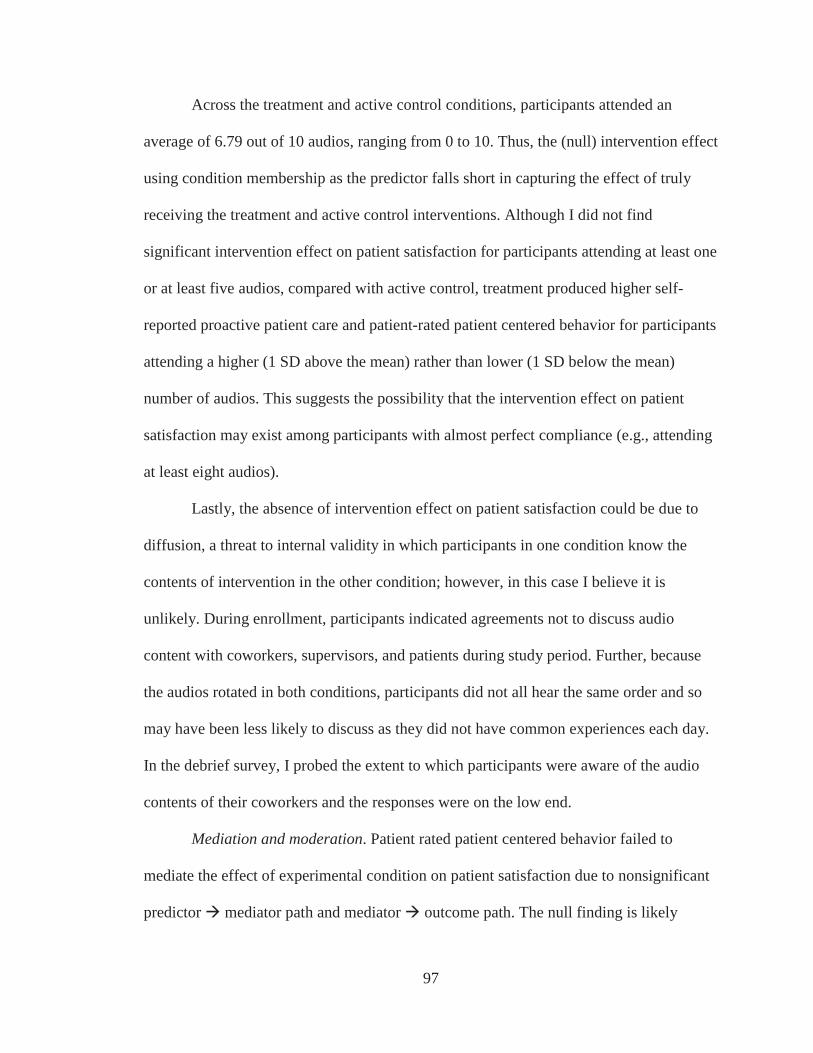
97
Across the treatment and active control conditions, participants attended an
average of 6.79 out of 10 audios, ranging from 0 to 10. Thus, the (null) intervention effect
using condition membership as the predictor falls short in capturing the effect of truly
receiving the treatment and active control interventions. Although I did not find
significant intervention effect on patient satisfaction for participants attending at least one
or at least five audios, compared with active control, treatment produced higher self-
reported proactive patient care and patient-rated patient centered behavior for participants
attending a higher (1 SD above the mean) rather than lower (1 SD below the mean)
number of audios. This suggests the possibility that the intervention effect on patient
satisfaction may exist among participants with almost perfect compliance (e.g., attending
at least eight audios).
Lastly, the absence of intervention effect on patient satisfaction could be due to
diffusion, a threat to internal validity in which participants in one condition know the
contents of intervention in the other condition; however, in this case I believe it is
unlikely. During enrollment, participants indicated agreements not to discuss audio
content with coworkers, supervisors, and patients during study period. Further, because
the audios rotated in both conditions, participants did not all hear the same order and so
may have been less likely to discuss as they did not have common experiences each day.
In the debrief survey, I probed the extent to which participants were aware of the audio
contents of their coworkers and the responses were on the low end.
Mediation and moderation. Patient rated patient centered behavior failed to
mediate the effect of experimental condition on patient satisfaction due to nonsignificant
predictor mediator path and mediator outcome path. The null finding is likely
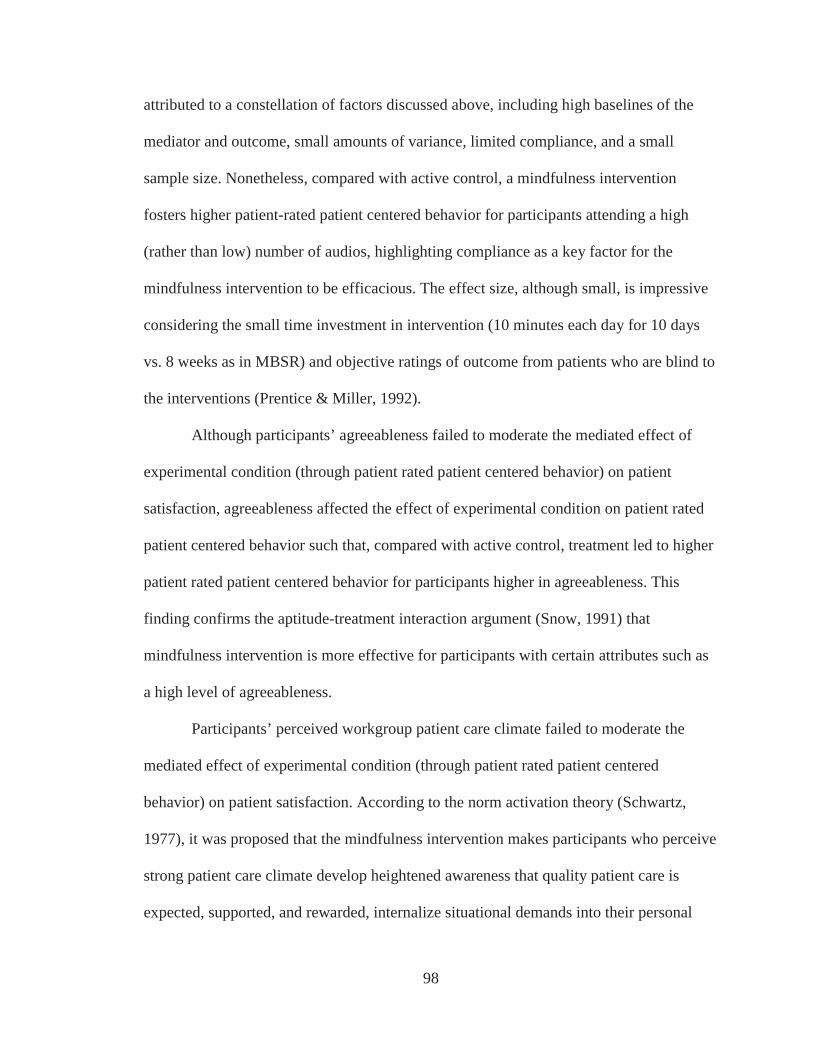
98
attributed to a constellation of factors discussed above, including high baselines of the
mediator and outcome, small amounts of variance, limited compliance, and a small
sample size. Nonetheless, compared with active control, a mindfulness intervention
fosters higher patient-rated patient centered behavior for participants attending a high
(rather than low) number of audios, highlighting compliance as a key factor for the
mindfulness intervention to be efficacious. The effect size, although small, is impressive
considering the small time investment in intervention (10 minutes each day for 10 days
vs. 8 weeks as in MBSR) and objective ratings of outcome from patients who are blind to
the interventions (Prentice & Miller, 1992).
Although participants’ agreeableness failed to moderate the mediated effect of
experimental condition (through patient rated patient centered behavior) on patient
satisfaction, agreeableness affected the effect of experimental condition on patient rated
patient centered behavior such that, compared with active control, treatment led to higher
patient rated patient centered behavior for participants higher in agreeableness. This
finding confirms the aptitude-treatment interaction argument (Snow, 1991) that
mindfulness intervention is more effective for participants with certain attributes such as
a high level of agreeableness.
Participants’ perceived workgroup patient care climate failed to moderate the
mediated effect of experimental condition (through patient rated patient centered
behavior) on patient satisfaction. According to the norm activation theory (Schwartz,
1977), it was proposed that the mindfulness intervention makes participants who perceive
strong patient care climate develop heightened awareness that quality patient care is
expected, supported, and rewarded, internalize situational demands into their personal
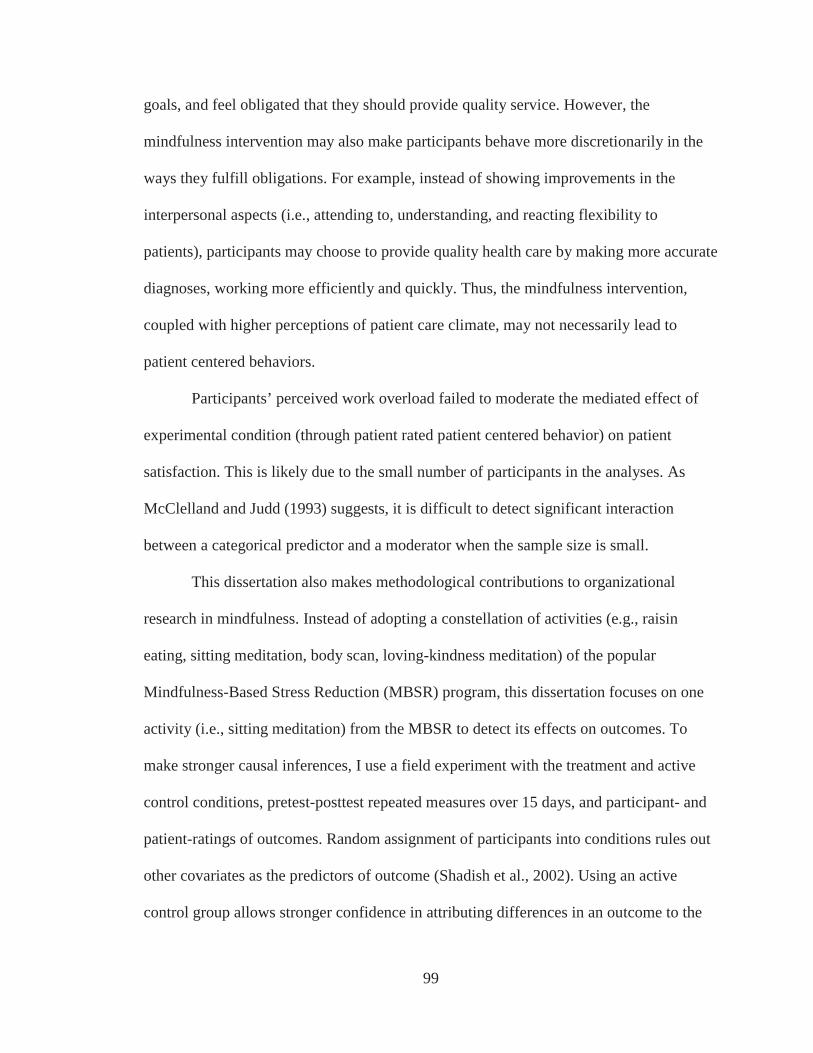
99
goals, and feel obligated that they should provide quality service. However, the
mindfulness intervention may also make participants behave more discretionarily in the
ways they fulfill obligations. For example, instead of showing improvements in the
interpersonal aspects (i.e., attending to, understanding, and reacting flexibility to
patients), participants may choose to provide quality health care by making more accurate
diagnoses, working more efficiently and quickly. Thus, the mindfulness intervention,
coupled with higher perceptions of patient care climate, may not necessarily lead to
patient centered behaviors.
Participants’ perceived work overload failed to moderate the mediated effect of
experimental condition (through patient rated patient centered behavior) on patient
satisfaction. This is likely due to the small number of participants in the analyses. As
McClelland and Judd (1993) suggests, it is difficult to detect significant interaction
between a categorical predictor and a moderator when the sample size is small.
This dissertation also makes methodological contributions to organizational
research in mindfulness. Instead of adopting a constellation of activities (e.g., raisin
eating, sitting meditation, body scan, loving-kindness meditation) of the popular
Mindfulness-Based Stress Reduction (MBSR) program, this dissertation focuses on one
activity (i.e., sitting meditation) from the MBSR to detect its effects on outcomes. To
make stronger causal inferences, I use a field experiment with the treatment and active
control conditions, pretest-posttest repeated measures over 15 days, and participant- and
patient-ratings of outcomes. Random assignment of participants into conditions rules out
other covariates as the predictors of outcome (Shadish et al., 2002). Using an active
control group allows stronger confidence in attributing differences in an outcome to the
100
contents of the intervention rather than the process of implementing the intervention
(Cook & Campbell, 1979; Goyal et al., 2014). Compared with participants’ self-reports,
patient ratings of outcomes allow for objective measures that are resistant to common
method bias and experimental demands effect (Podsakoff et al., 2003; Shadish et al.,
2002).
Practical Implications
A growing number of organizations, such as Google, Apple, and General Mills,
have begun to incorporate mindfulness-based practices into their workplace wellness
programs (Tetrik & Winslow, 2015). A brief yet efficacious mindfulness intervention at
work would be welcomed by employees with busy work lives. This dissertation offers
such an intervention. The mindfulness meditation is brief, efficacious, easily accessible,
and cost effective to organizations. As my findings suggest, for certain employees, a daily
time investment of 10 minutes yields higher client ratings of client-focused behaviors
(i.e., paying attention to clients, taking clients’ perspectives, and reacting flexibly to
clients), higher self-reports of job performance and mindfulness, and lower fatigue.
Organizations should incorporate mindfulness practices that allow flexibility for
employees to engage in. In my study, meditating for 10 minutes in the morning at work
for 10 days appeared to be challenging for some participants and on some days. An
accessible mindfulness practice needs to be tailored around employees’ work schedules
and activities. For example, employees could bring mindful awareness and attention
while having lunch, taking a break, or even performing routine activities like walking
down a hallway or washing their hands. Employees may also have the option to meditate
in a designated room as a group or individually in their own offices.
101
Organizations need to be aware that a mindfulness intervention may be more (or
less) effective for employees with certain characteristics and in certain social contexts at
work. As my findings suggest, the mindfulness intervention is more effective for
participants higher in agreeableness. Workplace norms, culture, and job characteristics
may influence the extent to which a mindfulness intervention translates into work related
outcomes. For example, service jobs focusing on people may utilize different mindful
skills than manufacturing jobs focusing on equipment (Dane, 2011).
Limitations and Future Directions
This dissertation is not without limitations. First, my aim was to examine the
effect of a brief mindfulness meditation at work. However, one may question whether 10
minutes of meditation per day for 10 days were sufficient for the intervention to make a
change to participants (Carmody & Baer, 2009). Past field interventions have generally
required more intensive mindfulness practices, such as one hour class each week plus a 2-
hour retreat over 12 weeks (Wolever et al., 2012), one hour each morning over 9 weeks
(Grepmair et al., 2007), and 2.5 hours per week plus an all-day retreat over 8 weeks (e.g.,
Giluk, 2010). My findings suggest that the mindfulness intervention has an effect on
certain outcomes (i.e., patient rated patient centered behavior and self rated proactive
patient care) only for participants attending a high number of audios, indicating that the
brief mindfulness training may have been even more influential in effecting changes if it
had persisted over a longer period of time.
Second, the patient rated outcomes have high baselines, yielding ceiling effect
that makes it difficult for the mindfulness intervention to make improvements. Despite
these high ratings, the mindfulness intervention produced higher patient rated patient
102
centered behavior, making these findings more impressive. Future research might adopt a
pre-screening procedure to enroll participants who have a low level of outcome to allow
observable changes resulting from a mindfulness intervention (e.g., Wolever et al., 2012).
Third, despite random assignment of participants into conditions, attrition of
participants could jeopardize randomization. In comparing the baseline outcomes
between the treatment and active control conditions for participants retained in the
analyses, results suggests that attrition is not a concern for randomization.
Fourth, although participants were asked to handoff a survey to every patient they
assisted each day, for some participants, the number of patient surveys returned on a
given day tend to be fewer than the total number of patients they assisted that day as
reported in the end-of-workday survey. Patient ratings obtained were unlikely to cover all
the encounters on all days for all participants, introducing measurement errors in the
aggregated measures of patient rated outcomes. In the debrief survey, participants
indicated the common reasons for missing a survey include returning patients who had
taken a survey before, too busy working, and patient declining the survey. To the extent
that patients who are unsatisfied with the encounter may have declined the survey, the
effect of the mindfulness intervention may be overestimated. I included obtained patient
ratings of all encounters in the analyses. However, some encounters were very brief (e.g.,
less than one minute), which may introduce biases in patients’ perceptions of
participants’ behaviors.
Fifth, I focus on cognitive empathy (i.e., perspective taking) as one of the client-
focused behavioral constructs. However, a mindfulness meditation may also foster the
affective aspect of empathy, or emotional concern (Scott & Duffy, 2015). A mindfulness
103
intervention may make individuals see the world through others’ eyes and feel others’
emotions and sufferings, leading to a desire to care and concern for others. Future
research could examine the role of a mindfulness intervention in promoting affective
empathy in conjunction with cognitive empathy.
Sixth, my sample size is small, rendering low power to detect significant effects.
Future research could replicate the field experiment in other organizations to obtain a
larger sample to evaluate the effect of the mindfulness intervention with greater power.
Conclusion
This dissertation examines the role of a micro mindfulness intervention in
promoting job performance in service settings and its client-focused mechanisms and
individual, social, and job contingencies. In the field experiment in a health care
organization, a mindfulness intervention, compared with active control, leads to higher
self-reported proactive patient care and patient ratings of patient centered behavior
among health care professionals who attended a higher number of audios. Compared with
active control, the mindfulness intervention produces day-to-day increases in self-
reported mindfulness, job performance, and patient centered behavior and decline in
fatigue over time. The mindfulness intervention also yields higher patient rated patient
centered behaviors for health care professionals who have a higher level of
agreeableness. The findings suggest that a brief mindfulness intervention may be
beneficial for employees’ job performance in interpersonal settings.
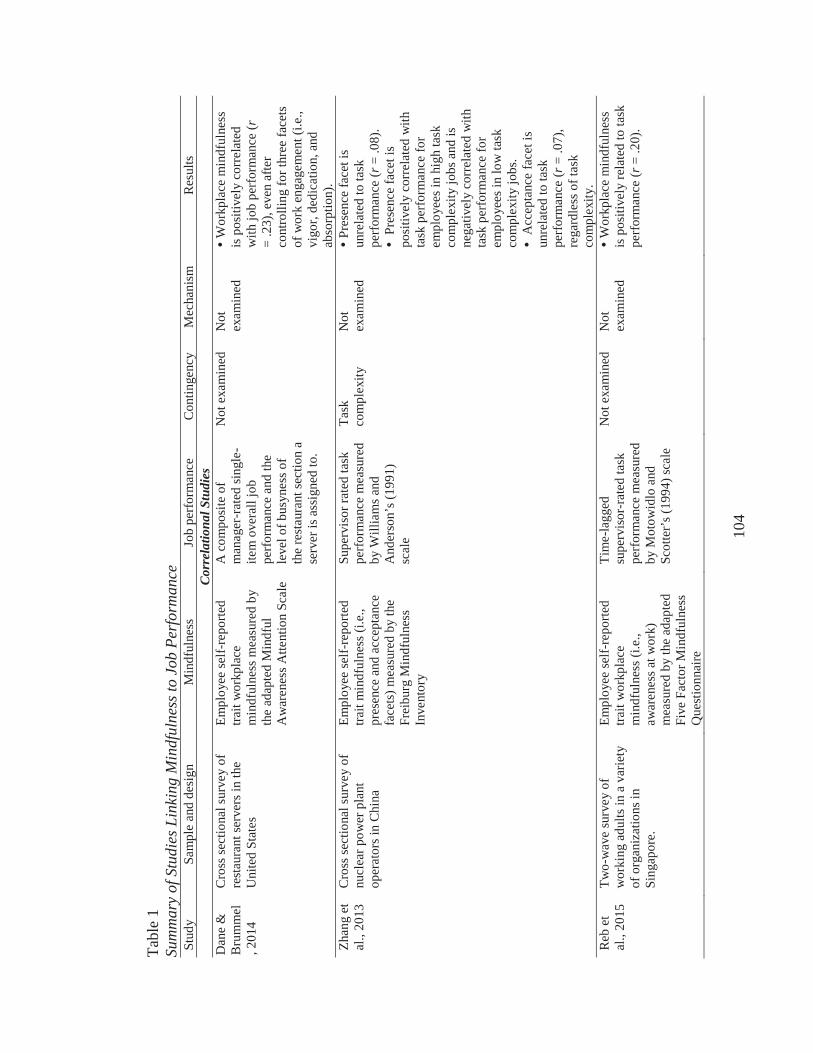
104
Tabl
e 1
Sum
mar
y of
Stu
dies
Lin
king
Min
dful
ness
to J
ob P
erfo
rman
ceSt
udy
Sam
ple
and
desi
gnM
indf
ulne
ssJo
b pe
rfor
man
ceC
ontin
genc
yM
echa
nism
Res
ults
Corr
elat
iona
l Stu
dies
Dan
e &
B
rum
mel
, 201
4
Cro
ss se
ctio
nal s
urve
y of
re
stau
rant
serv
ers i
n th
e U
nite
d St
ates
Empl
oyee
self-
repo
rted
trait
wor
kpla
ce
min
dful
ness
mea
sure
d by
th
e ad
apte
d M
indf
ul
Aw
aren
ess A
ttent
ion
Scal
e
A c
ompo
site
of
man
ager
-rat
ed si
ngle
-ite
m o
vera
ll jo
b pe
rfor
man
ce a
nd th
e le
vel o
f bus
ynes
s of
the
rest
aura
nt se
ctio
n a
serv
er is
ass
igne
d to
.
Not
exa
min
edN
ot
exam
ined
Wor
kpla
ce m
indf
ulne
ss
is p
ositi
vely
cor
rela
ted
with
job
perf
orm
ance
(r=
.23)
, eve
n af
ter
cont
rolli
ng fo
r thr
ee fa
cets
of
wor
k en
gage
men
t (i.e
., vi
gor,
dedi
catio
n, a
nd
abso
rptio
n).
Zhan
g et
al
., 20
13C
ross
sect
iona
l sur
vey
of
nucl
ear p
ower
pla
nt
oper
ator
s in
Chi
na
Empl
oyee
self-
repo
rted
trait
min
dful
ness
(i.e
., pr
esen
ce a
nd a
ccep
tanc
e fa
cets
) mea
sure
d by
the
Frei
burg
Min
dful
ness
In
vent
ory
Supe
rvis
or ra
ted
task
pe
rfor
man
ce m
easu
red
by W
illia
ms a
nd
And
erso
n’s (
1991
) sc
ale
Task
co
mpl
exity
Not
ex
amin
edPr
esen
ce fa
cet i
s un
rela
ted
to ta
sk
perf
orm
ance
(r=
.08)
. Pr
esen
ce fa
cet i
s po
sitiv
ely
corr
elat
ed w
ith
task
per
form
ance
for
empl
oyee
s in
high
task
co
mpl
exity
jobs
and
is
nega
tivel
y co
rrel
ated
with
ta
sk p
erfo
rman
ce fo
r em
ploy
ees i
n lo
w ta
sk
com
plex
ity jo
bs.
Acc
epta
nce
face
t is
unre
late
d to
task
pe
rfor
man
ce (r
= .0
7),
rega
rdle
ss o
f tas
k co
mpl
exity
.R
eb e
t al
., 20
15Tw
o-w
ave
surv
ey o
f w
orki
ng a
dults
in a
var
iety
of
org
aniz
atio
ns in
Si
ngap
ore.
Empl
oyee
self-
repo
rted
trait
wor
kpla
ce
min
dful
ness
(i.e
., aw
aren
ess a
twor
k)
mea
sure
d by
the
adap
ted
Five
Fac
tor M
indf
ulne
ss
Que
stio
nnai
re
Tim
e-la
gged
su
perv
isor
-rat
ed ta
sk
perf
orm
ance
mea
sure
d by
Mot
owid
lo a
nd
Scot
ter’
s (19
94) s
cale
Not
exa
min
edN
ot
exam
ined
Wor
kpla
ce m
indf
ulne
ss
is p
ositi
vely
rela
ted
to ta
sk
perf
orm
ance
(r=
.20)
.
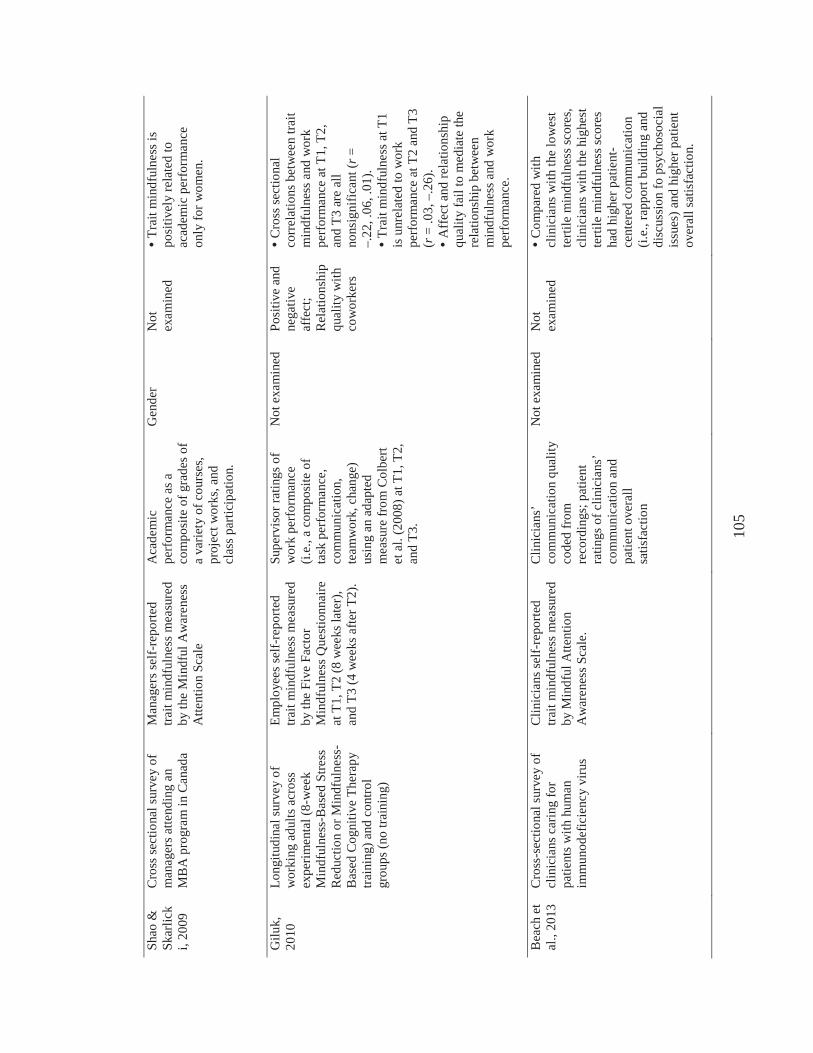
105
Shao
&
Skar
lick
i, 20
09
Cro
ss se
ctio
nal s
urve
y of
m
anag
ers a
ttend
ing
an
MB
A p
rogr
am in
Can
ada
Man
ager
s sel
f-re
porte
d tra
it m
indf
ulne
ss m
easu
red
by th
e M
indf
ul A
war
enes
s A
ttent
ion
Scal
e
Aca
dem
ic
perf
orm
ance
as a
co
mpo
site
of g
rade
s of
a va
riety
of c
ours
es,
proj
ect w
orks
, and
cl
ass p
artic
ipat
ion.
Gen
der
Not
ex
amin
edTr
ait m
indf
ulne
ss is
po
sitiv
ely
rela
ted
to
acad
emic
per
form
ance
on
ly fo
r wom
en.
Gilu
k,
2010
Long
itudi
nal s
urve
y of
w
orki
ng a
dults
acr
oss
expe
rimen
tal(
8-w
eek
Min
dful
ness
-Bas
ed S
tress
R
educ
tion
or M
indf
ulne
ss-
Bas
ed C
ogni
tive
Ther
apy
train
ing)
and
cont
rol
grou
ps(n
o tra
inin
g)
Empl
oyee
s sel
f-re
porte
d tra
it m
indf
ulne
ss m
easu
red
by th
e Fi
ve F
acto
r M
indf
ulne
ss Q
uest
ionn
aire
at
T1,
T2
(8 w
eeks
late
r),
and
T3(4
wee
ks a
fter T
2).
Supe
rvis
or ra
tings
of
wor
k pe
rfor
man
ce
(i.e.
, a c
ompo
site
of
task
per
form
ance
, co
mm
unic
atio
n,
team
wor
k, c
hang
e)
usin
g an
ada
pted
m
easu
re fr
om C
olbe
rt et
al.
(200
8) a
t T1,
T2,
an
d T3
.
Not
exa
min
edPo
sitiv
e an
d ne
gativ
e af
fect
; R
elat
ions
hip
qual
ity w
ith
cow
orke
rs
Cro
ss se
ctio
nal
corr
elat
ions
bet
wee
n tra
it m
indf
ulne
ss a
nd w
ork
perf
orm
ance
at T
1, T
2,
and
T3 a
re a
ll no
nsig
nific
ant (
r=–.
22, .
06, .
01).
Trai
t min
dful
ness
at T
1 is
unr
elat
ed to
wor
k pe
rfor
man
ce a
t T2
and
T3
(r=
.03,
–.2
6).
Aff
ect a
nd re
latio
nshi
p qu
ality
fail
to m
edia
te th
e re
latio
nshi
p be
twee
n m
indf
ulne
ss a
nd w
ork
perf
orm
ance
.
Bea
ch e
t al
., 20
13C
ross
-sec
tiona
l sur
vey
of
clin
icia
ns c
arin
g fo
r pa
tient
s with
hum
an
imm
unod
efic
ienc
y vi
rus
Clin
icia
ns se
lf-re
porte
d tra
it m
indf
ulne
ss m
easu
red
by M
indf
ul A
ttent
ion
Aw
aren
ess S
cale
.
Clin
icia
ns’
com
mun
icat
ion
qual
ity
code
d fr
om
reco
rdin
gs; p
atie
nt
ratin
gs o
f clin
icia
ns’
com
mun
icat
ion
and
patie
nt o
vera
ll sa
tisfa
ctio
n
Not
exa
min
edN
ot
exam
ined
Com
pare
d w
ith
clin
icia
ns w
ith th
e lo
wes
t te
rtile
min
dful
ness
scor
es,
clin
icia
ns w
ith th
e hi
ghes
t te
rtile
min
dful
ness
scor
es
had
high
er p
atie
nt-
cent
ered
com
mun
icat
ion
(i.e.
, rap
port
build
ing
and
disc
ussi
on fo
psy
chos
ocia
l is
sues
) and
hig
her p
atie
nt
over
all s
atis
fact
ion.
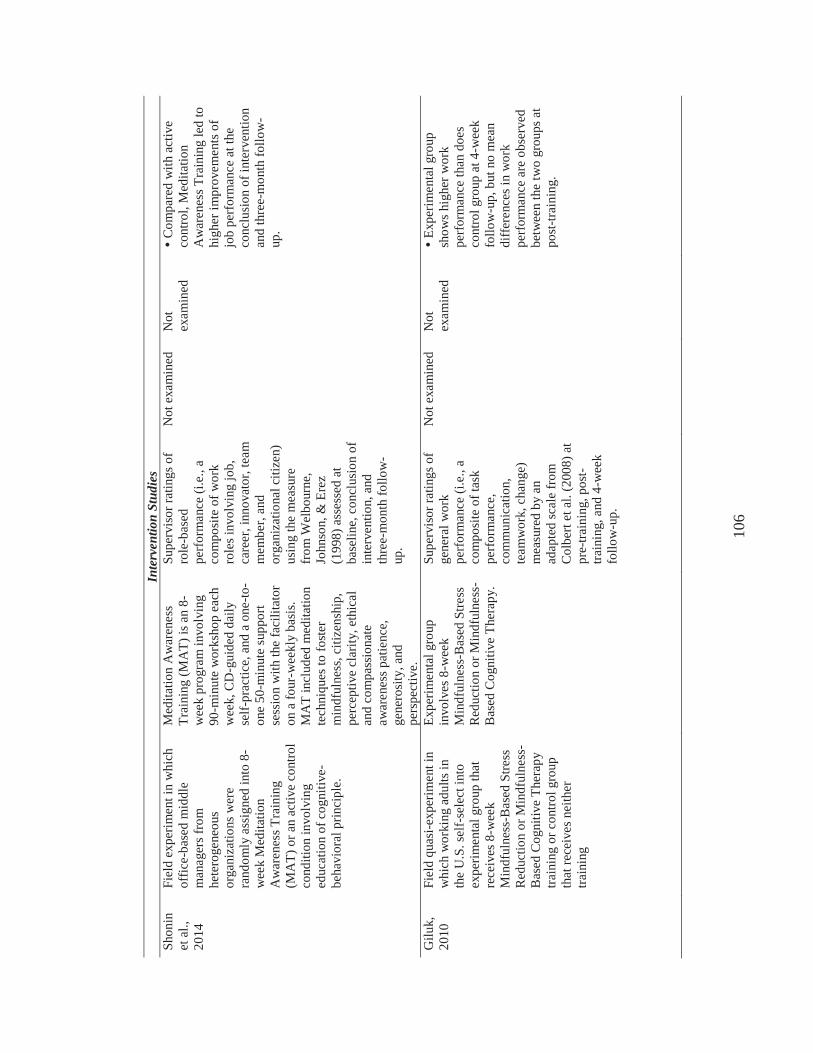
106
Inte
rven
tion
Stud
ies
Shon
in
et a
l.,
2014
Fiel
d ex
perim
ent i
n w
hich
of
fice-
base
d m
iddl
e m
anag
ers f
rom
he
tero
gene
ous
orga
niza
tions
wer
e ra
ndom
ly a
ssig
ned
into
8-
wee
k M
edita
tion
Aw
aren
ess T
rain
ing
(MA
T)or
an
activ
e co
ntro
l co
nditi
on in
volv
ing
educ
atio
n of
cog
nitiv
e-be
havi
oral
prin
cipl
e.
Med
itatio
n A
war
enes
s Tr
aini
ng (M
AT)
is a
n 8-
wee
k pr
ogra
m in
volv
ing
90-m
inut
e w
orks
hop
each
w
eek,
CD
-gui
ded
daily
se
lf-pr
actic
e, a
nd a
one
-to-
one
50-m
inut
e su
ppor
t se
ssio
n w
ith th
e fa
cilit
ator
on
a fo
ur-w
eekl
y ba
sis.
MA
T in
clud
ed m
edita
tion
tech
niqu
es to
fost
er
min
dful
ness
, citi
zens
hip,
pe
rcep
tive
clar
ity, e
thic
al
and
com
pass
iona
te
awar
enes
s pat
ienc
e,
gene
rosi
ty, a
nd
pers
pect
ive.
Supe
rvis
or ra
tings
of
role
-bas
ed
perf
orm
ance
(i.e
., a
com
posi
te o
f wor
k ro
les i
nvol
ving
job,
ca
reer
, inn
ovat
or, t
eam
m
embe
r, an
d or
gani
zatio
nal c
itize
n)
usin
g th
e m
easu
re
from
Wel
bour
ne,
John
son,
& E
rez
(199
8) a
sses
sed
at
base
line,
con
clus
ion
of
inte
rven
tion,
and
th
ree-
mon
th fo
llow
-up
.
Not
exa
min
edN
ot
exam
ined
Com
pare
d w
ith a
ctiv
e co
ntro
l, M
edita
tion
Aw
aren
ess T
rain
ing
led
to
high
er im
prov
emen
ts o
f jo
b pe
rfor
man
ce a
t the
co
nclu
sion
of i
nter
vent
ion
and
thre
e-m
onth
follo
w-
up.
Gilu
k,
2010
Fiel
d qu
asi-e
xper
imen
t in
whi
ch w
orki
ng a
dults
in
the
U.S
. sel
f-se
lect
into
ex
perim
enta
l gro
up th
at
rece
ives
8-w
eek
Min
dful
ness
-Bas
ed S
tress
R
educ
tion
or M
indf
ulne
ss-
Bas
ed C
ogni
tive
Ther
apy
train
ing
or c
ontro
l gro
up
that
rece
ives
nei
ther
tra
inin
g
Expe
rimen
tal g
roup
in
volv
es 8
-wee
k M
indf
ulne
ss-B
ased
Stre
ss
Red
uctio
n or
Min
dful
ness
-B
ased
Cog
nitiv
e Th
erap
y.
Supe
rvis
or ra
tings
of
gene
ral w
ork
perf
orm
ance
(i.e
., a
com
posi
te o
f tas
k pe
rfor
man
ce,
com
mun
icat
ion,
te
amw
ork,
cha
nge)
m
easu
red
by a
n ad
apte
d sc
ale
from
C
olbe
rt et
al.
(200
8) a
t pr
e-tra
inin
g, p
ost-
train
ing,
and
4-w
eek
follo
w-u
p.
Not
exa
min
edN
ot
exam
ined
Expe
rimen
tal g
roup
sh
ows h
ighe
r wor
k pe
rfor
man
ce th
an d
oes
cont
rol g
roup
at 4
-wee
k fo
llow
-up,
but
no
mea
n di
ffere
nces
in w
ork
perf
orm
ance
are
obs
erve
d be
twee
n th
e tw
o gr
oups
at
post
-trai
ning
.
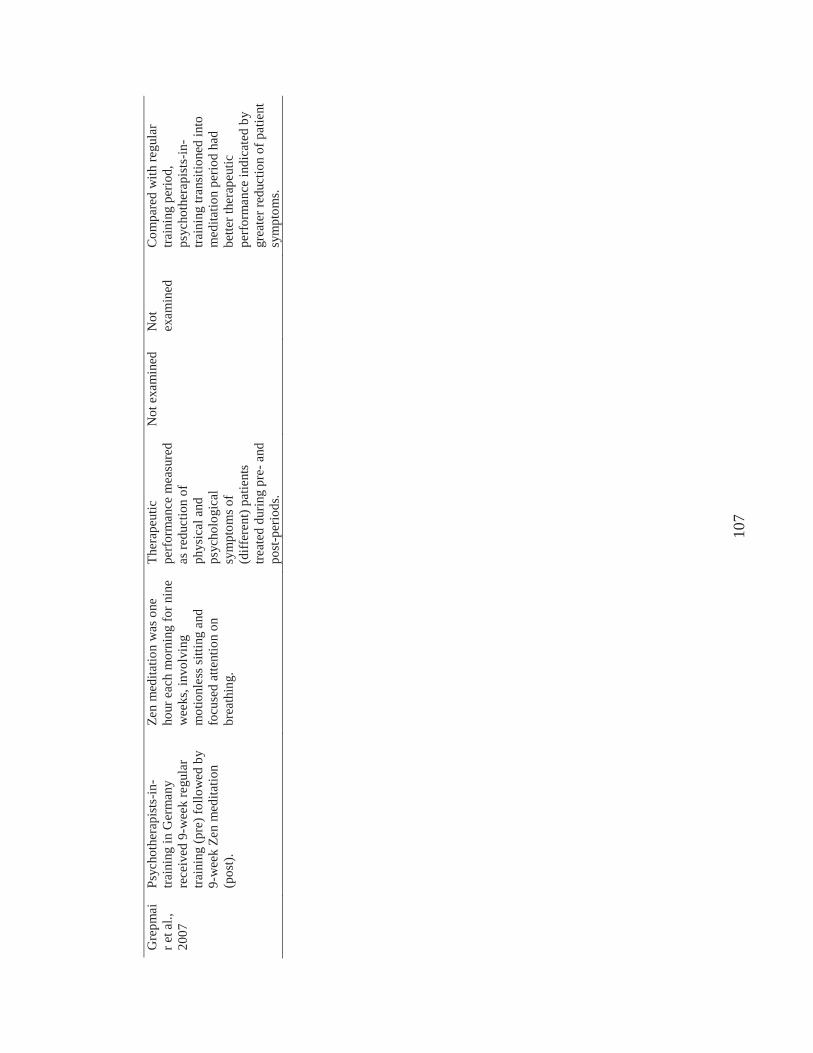
107
Gre
pmai
r et a
l.,
2007
Psyc
hoth
erap
ists
-in-
train
ing
in G
erm
any
rece
ived
9-w
eek
regu
lar
train
ing
(pre
) fol
low
ed b
y 9-
wee
k Ze
n m
edita
tion
(pos
t).
Zen
med
itatio
n w
as o
ne
hour
eac
h m
orni
ng fo
r nin
e w
eeks
, inv
olvi
ng
mot
ionl
ess s
ittin
g an
d fo
cuse
d at
tent
ion
on
brea
thin
g.
Ther
apeu
tic
perf
orm
ance
mea
sure
d as
redu
ctio
n of
ph
ysic
al a
nd
psyc
holo
gica
l sy
mpt
oms o
f(d
iffer
ent)
patie
nts
treat
ed d
urin
g pr
e-an
d po
st-p
erio
ds.
Not
exa
min
edN
ot
exam
ined
Com
pare
d w
ith re
gula
r tra
inin
g pe
riod,
ps
ycho
ther
apis
ts-in
-tra
inin
gtra
nsiti
oned
into
med
itatio
n pe
riod
had
bette
r the
rape
utic
pe
rfor
man
ce in
dica
ted
by
grea
ter r
educ
tion
of p
atie
nt
sym
ptom
s.
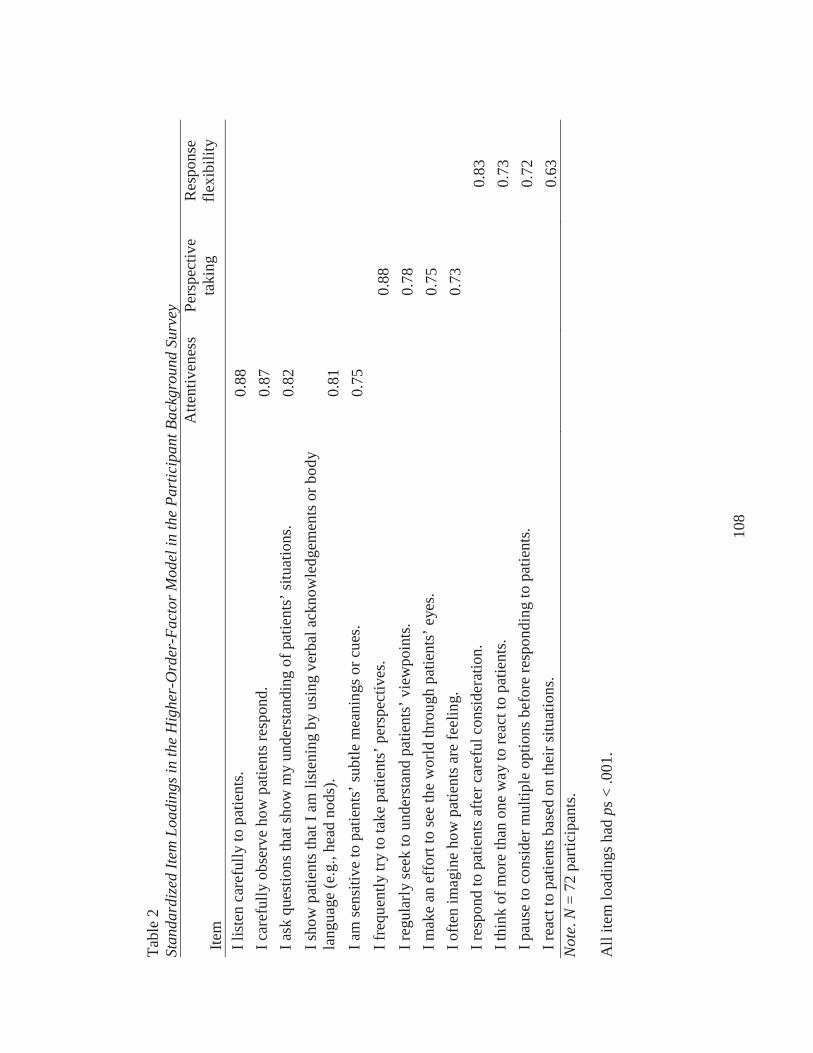
108
Tabl
e 2
Stan
dard
ized
Item
Loa
ding
s in
the
Hig
her-
Ord
er-F
acto
r Mod
el in
the
Part
icip
ant B
ackg
roun
d Su
rvey
Item
A
ttent
iven
ess
Pers
pect
ive
taki
ngR
espo
nse
flexi
bilit
y
I lis
ten
care
fully
to p
atie
nts.
0.88
I car
eful
ly o
bser
ve h
ow p
atie
nts r
espo
nd.
0.87
I ask
que
stio
ns th
at sh
ow m
y un
ders
tand
ing
of p
atie
nts’
situ
atio
ns.
0.82
I sho
w p
atie
nts t
hat I
am
list
enin
g by
usi
ng v
erba
l ack
now
ledg
emen
ts o
r bod
y la
ngua
ge (e
.g.,
head
nod
s).
0.81
I am
sens
itive
to p
atie
nts’
subt
le m
eani
ngs o
r cue
s.0.
75I f
requ
ently
try
to ta
ke p
atie
nts’
per
spec
tives
. 0.
88I r
egul
arly
seek
to u
nder
stan
d pa
tient
s’ v
iew
poin
ts.
0.78
I mak
e an
eff
ort t
o se
e th
e w
orld
thro
ugh
patie
nts’
eye
s. 0.
75I o
ften
imag
ine
how
pat
ient
s are
feel
ing.
0.
73I r
espo
nd to
pat
ient
s afte
r car
eful
con
side
ratio
n.
0.83
I thi
nk o
f mor
e th
an o
ne w
ay to
reac
t to
patie
nts.
0.73
I pau
se to
con
side
r mul
tiple
opt
ions
bef
ore
resp
ondi
ng to
pat
ient
s. 0.
72I r
eact
to p
atie
ntsb
ased
on
thei
r situ
atio
ns.
0.63
Not
e.N
= 72
par
ticip
ants
.
All
item
load
ings
had
ps<
.001
.
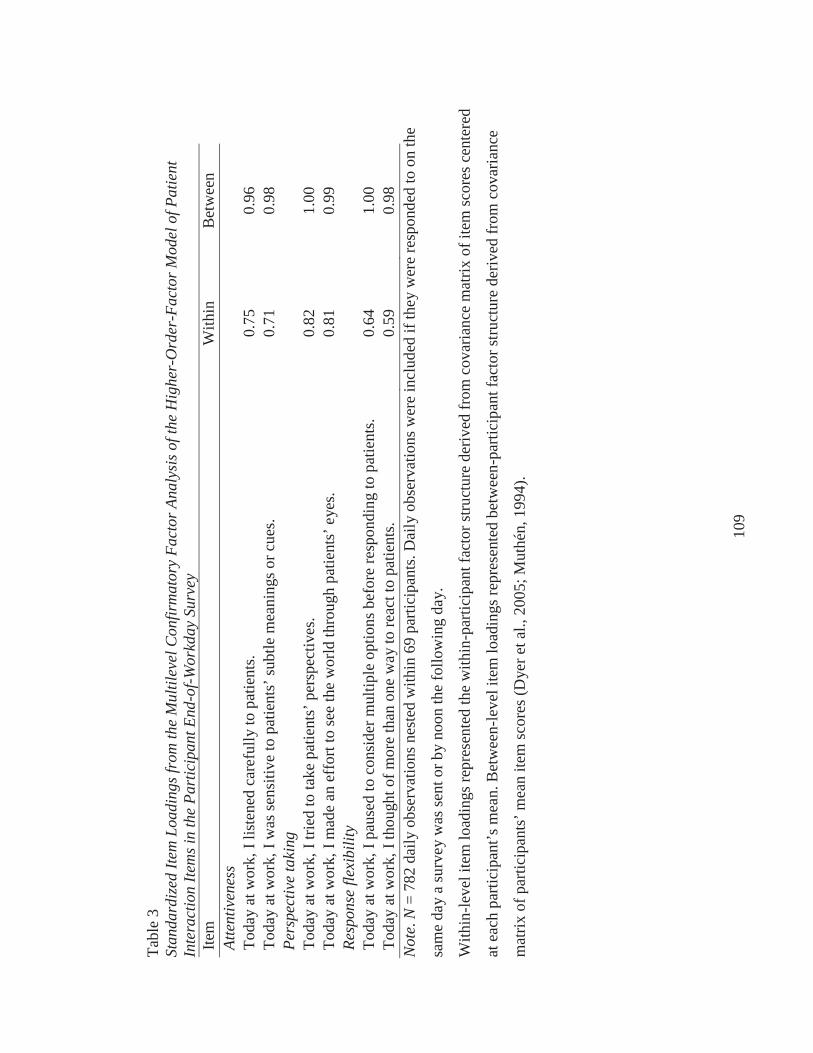
109
Tabl
e 3
Stan
dard
ized
Item
Loa
ding
s fro
m th
e M
ultil
evel
Con
firm
ator
y Fa
ctor
Ana
lysi
s of t
he H
ighe
r-O
rder
-Fac
tor M
odel
of P
atie
nt
Inte
ract
ion
Item
s in
the
Part
icip
ant E
nd-o
f-Wor
kday
Sur
vey
Item
W
ithin
Bet
wee
nAt
tent
iven
ess
Toda
y at
wor
k, I
liste
ned
care
fully
to p
atie
nts.
0.75
0.96
Toda
y at
wor
k, I
was
sens
itive
to p
atie
nts’
subt
le m
eani
ngs o
r cue
s.0.
710.
98Pe
rspe
ctiv
e ta
king
Toda
y at
wor
k, I
tried
to ta
ke p
atie
nts’
per
spec
tives
.0.
821.
00To
day
at w
ork,
I m
ade
an e
ffor
t to
see
the
wor
ld th
roug
h pa
tient
s’ e
yes.
0.81
0.99
Resp
onse
flex
ibili
tyTo
day
at w
ork,
I pa
used
to c
onsi
der m
ultip
le o
ptio
ns b
efor
e re
spon
ding
to p
atie
nts.
0.64
1.00
Toda
y at
wor
k, I
thou
ght o
f mor
e th
an o
ne w
ay to
reac
t to
patie
nts.
0.59
0.98
Not
e.N
= 78
2 da
ily o
bser
vatio
ns n
este
d w
ithin
69
parti
cipa
nts.
Dai
ly o
bser
vatio
ns w
ere
incl
uded
if th
ey w
ere
resp
onde
d to
on
the
sam
e da
y a
surv
ey w
as se
nt o
r by
noon
the
follo
win
g da
y.
With
in-le
vel i
tem
load
ings
repr
esen
ted
the
with
in-p
artic
ipan
t fac
tor s
truct
ure
deriv
ed fr
om c
ovar
ianc
e m
atrix
of i
tem
scor
es c
ente
red
at e
ach
parti
cipa
nt’s
mea
n. B
etw
een-
leve
l ite
m lo
adin
gs re
pres
ente
d be
twee
n-pa
rtici
pant
fact
or st
ruct
ure
deriv
ed fr
om c
ovar
ianc
e
mat
rix o
f par
ticip
ants
’ mea
n ite
m sc
ores
(Dye
r et a
l., 2
005;
Mut
hén,
1994
).
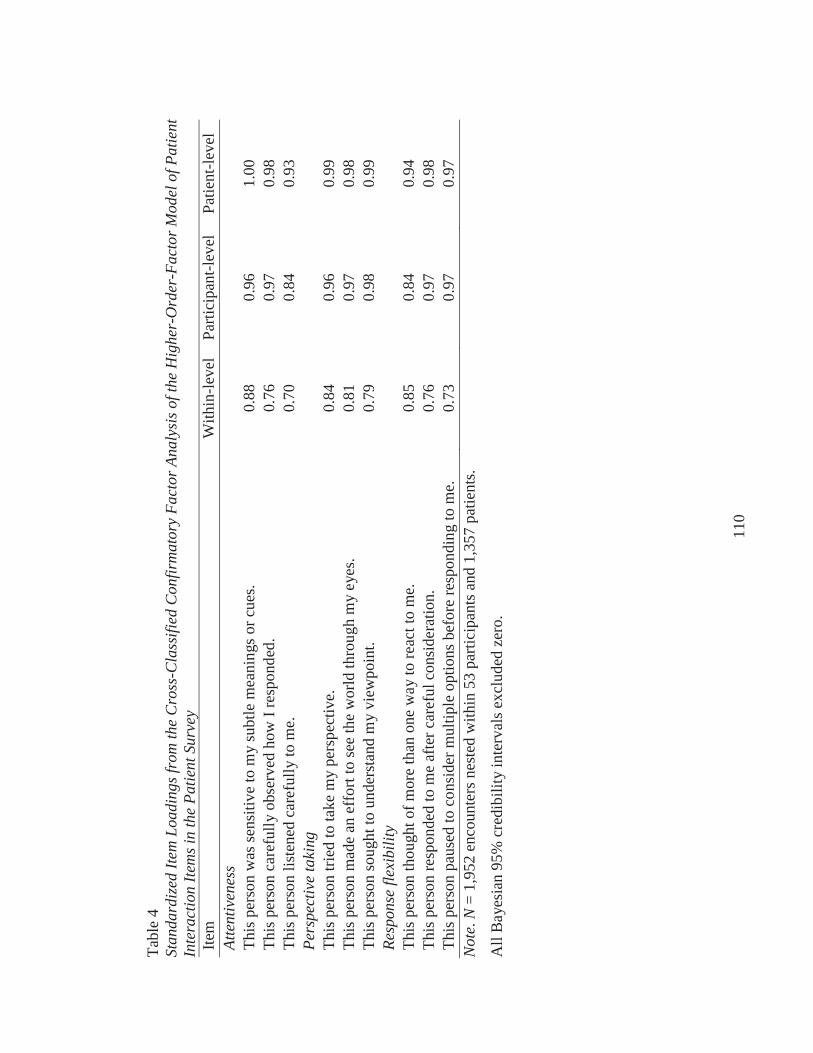
110
Tabl
e 4
Stan
dard
ized
Item
Loa
ding
s fro
m th
e C
ross
-Cla
ssifi
ed C
onfir
mat
ory
Fact
or A
naly
sis o
f the
Hig
her-
Ord
er-F
acto
r Mod
el o
f Pat
ient
In
tera
ctio
n Ite
ms i
n th
e Pa
tient
Sur
vey
Item
W
ithin
-leve
lPa
rtici
pant
-leve
lPa
tient
-leve
lAt
tent
iven
ess
This
per
son
was
sens
itive
to m
ysu
btle
mea
ning
s or c
ues.
0.88
0.96
1.00
This
per
son
care
fully
obs
erve
d ho
w I
resp
onde
d.
0.76
0.97
0.98
This
per
son
liste
ned
care
fully
to m
e.0.
700.
840.
93Pe
rspe
ctiv
e ta
king
This
per
son
tried
to ta
ke m
y pe
rspe
ctiv
e.0.
840.
960.
99Th
is p
erso
n m
ade
an e
ffor
t to
see
the
wor
ld th
roug
h m
yey
es.
0.81
0.97
0.98
This
per
son
soug
ht to
und
erst
and
my
view
poin
t.0.
790.
980.
99Re
spon
se fl
exib
ility
This
per
son
thou
ght o
f mor
e th
an o
ne w
ay to
reac
t to
me.
0.85
0.84
0.94
This
per
son
resp
onde
d to
me
afte
r car
eful
con
side
ratio
n.
0.76
0.97
0.98
This
per
son
paus
ed to
con
side
r mul
tiple
opt
ions
bef
ore
resp
ondi
ng to
me.
0.73
0.97
0.97
Not
e.N
= 1,
952
enco
unte
rs n
este
d w
ithin
53
parti
cipa
nts a
nd 1
,357
pat
ient
s.
All
Bay
esia
n 95
% c
redi
bilit
y in
terv
als e
xclu
ded
zero
.
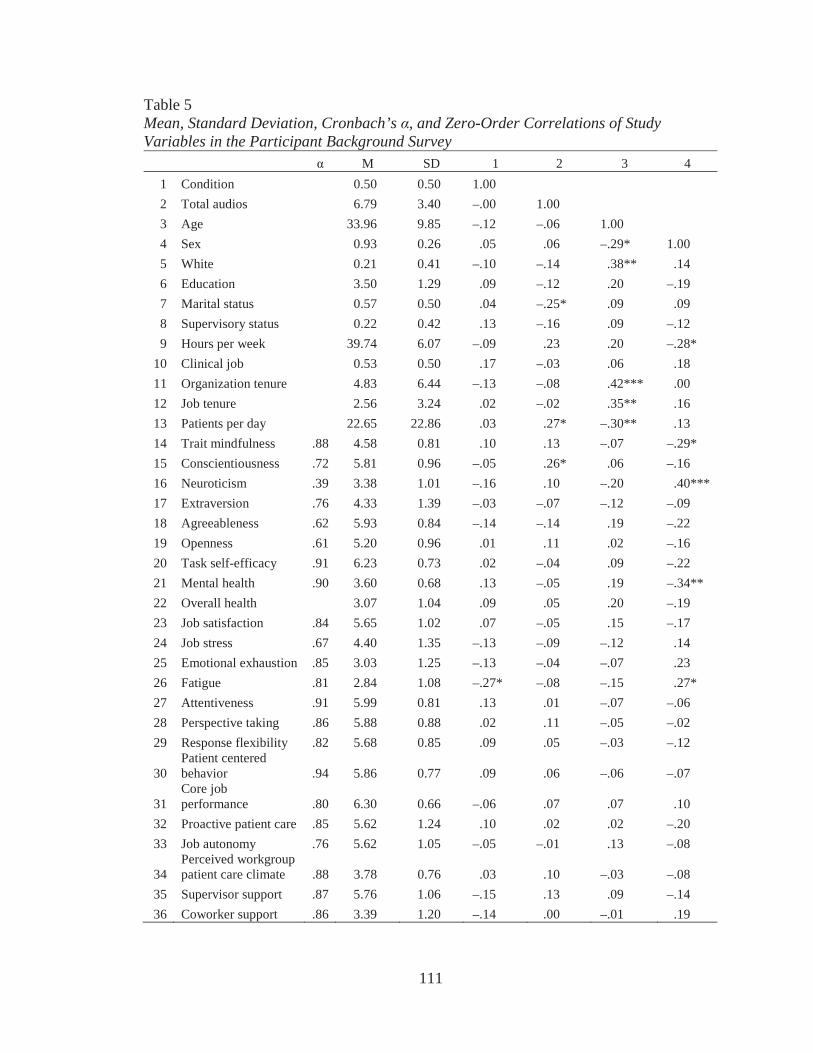
111
Table 5Mean, Standard Deviation, Cronbach’s , and Zero-Order Correlations of Study Variables in the Participant Background Survey
M SD 1 2 3 41 Condition 0.50 0.50 1.002 Total audios 6.79 3.40 –.00 1.003 Age 33.96 9.85 –.12 –.06 1.004 Sex 0.93 0.26 .05 .06 –.29* 1.005 White 0.21 0.41 –.10 –.14 .38** .146 Education 3.50 1.29 .09 –.12 .20 –.197 Marital status 0.57 0.50 .04 –.25* .09 .098 Supervisory status 0.22 0.42 .13 –.16 .09 –.129 Hours per week 39.74 6.07 –.09 .23 .20 –.28*
10 Clinical job 0.53 0.50 .17 –.03 .06 .1811 Organization tenure 4.83 6.44 –.13 –.08 .42*** .0012 Job tenure 2.56 3.24 .02 –.02 .35** .1613 Patients per day 22.65 22.86 .03 .27* –.30** .1314 Trait mindfulness .88 4.58 0.81 .10 .13 –.07 –.29*15 Conscientiousness .72 5.81 0.96 –.05 .26* .06 –.1616 Neuroticism .39 3.38 1.01 –.16 .10 –.20 .40***17 Extraversion .76 4.33 1.39 –.03 –.07 –.12 –.0918 Agreeableness .62 5.93 0.84 –.14 –.14 .19 –.2219 Openness .61 5.20 0.96 .01 .11 .02 –.1620 Task self-efficacy .91 6.23 0.73 .02 –.04 .09 –.2221 Mental health .90 3.60 0.68 .13 –.05 .19 –.34**22 Overall health 3.07 1.04 .09 .05 .20 –.1923 Job satisfaction .84 5.65 1.02 .07 –.05 .15 –.1724 Job stress .67 4.40 1.35 –.13 –.09 –.12 .1425 Emotional exhaustion .85 3.03 1.25 –.13 –.04 –.07 .2326 Fatigue .81 2.84 1.08 –.27* –.08 –.15 .27*27 Attentiveness .91 5.99 0.81 .13 .01 –.07 –.0628 Perspective taking .86 5.88 0.88 .02 .11 –.05 –.0229 Response flexibility .82 5.68 0.85 .09 .05 –.03 –.12
30Patient centered behavior .94 5.86 0.77 .09 .06 –.06 –.07
31Core job performance .80 6.30 0.66 –.06 .07 .07 .10
32 Proactive patient care .85 5.62 1.24 .10 .02 .02 –.2033 Job autonomy .76 5.62 1.05 –.05 –.01 .13 –.08
34Perceived workgroup patient care climate .88 3.78 0.76 .03 .10 –.03 –.08
35 Supervisor support .87 5.76 1.06 –.15 .13 .09 –.1436 Coworker support .86 3.39 1.20 –.14 .00 –.01 .19
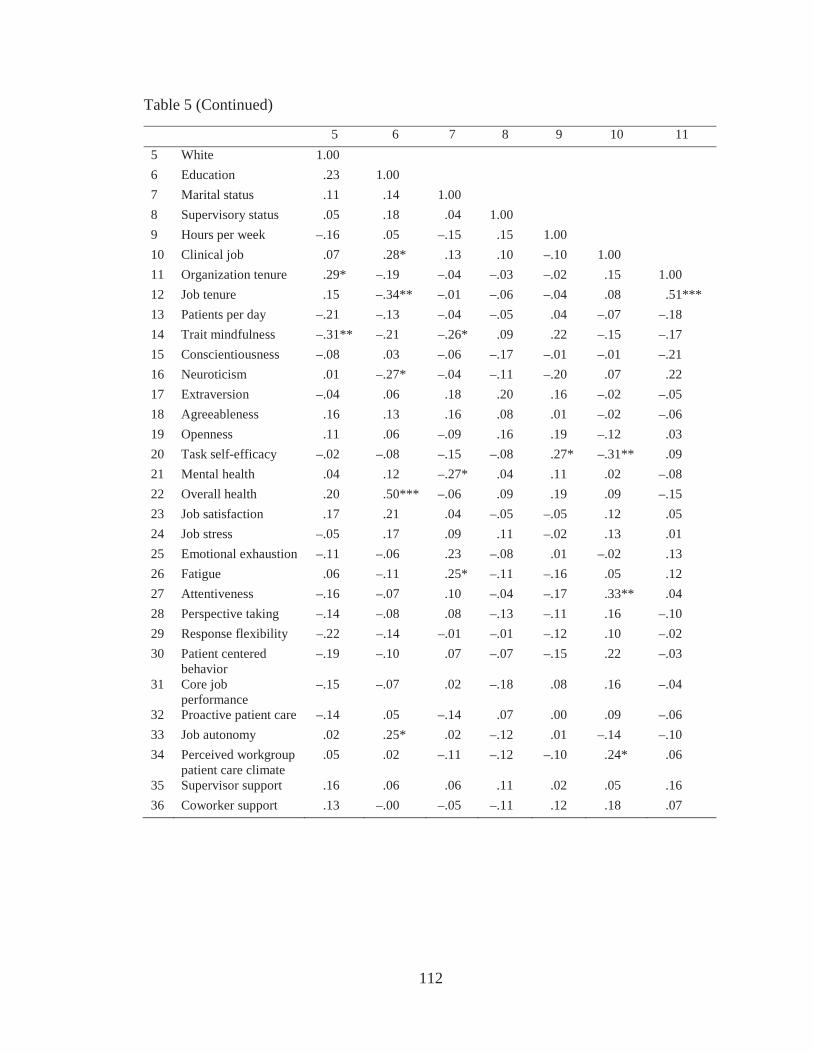
112
Table 5 (Continued)
5 6 7 8 9 10 115 White 1.006 Education .23 1.007 Marital status .11 .14 1.008 Supervisory status .05 .18 .04 1.009 Hours per week –.16 .05 –.15 .15 1.0010 Clinical job .07 .28* .13 .10 –.10 1.0011 Organization tenure .29* –.19 –.04 –.03 –.02 .15 1.0012 Job tenure .15 –.34** –.01 –.06 –.04 .08 .51***13 Patients per day –.21 –.13 –.04 –.05 .04 –.07 –.1814 Trait mindfulness –.31** –.21 –.26* .09 .22 –.15 –.1715 Conscientiousness –.08 .03 –.06 –.17 –.01 –.01 –.2116 Neuroticism .01 –.27* –.04 –.11 –.20 .07 .2217 Extraversion –.04 .06 .18 .20 .16 –.02 –.0518 Agreeableness .16 .13 .16 .08 .01 –.02 –.0619 Openness .11 .06 –.09 .16 .19 –.12 .0320 Task self-efficacy –.02 –.08 –.15 –.08 .27* –.31** .0921 Mental health .04 .12 –.27* .04 .11 .02 –.0822 Overall health .20 .50*** –.06 .09 .19 .09 –.1523 Job satisfaction .17 .21 .04 –.05 –.05 .12 .0524 Job stress –.05 .17 .09 .11 –.02 .13 .0125 Emotional exhaustion –.11 –.06 .23 –.08 .01 –.02 .1326 Fatigue .06 –.11 .25* –.11 –.16 .05 .1227 Attentiveness –.16 –.07 .10 –.04 –.17 .33** .0428 Perspective taking –.14 –.08 .08 –.13 –.11 .16 –.1029 Response flexibility –.22 –.14 –.01 –.01 –.12 .10 –.0230 Patient centered
behavior–.19 –.10 .07 –.07 –.15 .22 –.03
31 Core job performance
–.15 –.07 .02 –.18 .08 .16 –.04
32 Proactive patient care –.14 .05 –.14 .07 .00 .09 –.0633 Job autonomy .02 .25* .02 –.12 .01 –.14 –.1034 Perceived workgroup
patient care climate.05 .02 –.11 –.12 –.10 .24* .06
35 Supervisor support .16 .06 .06 .11 .02 .05 .1636 Coworker support .13 –.00 –.05 –.11 .12 .18 .07
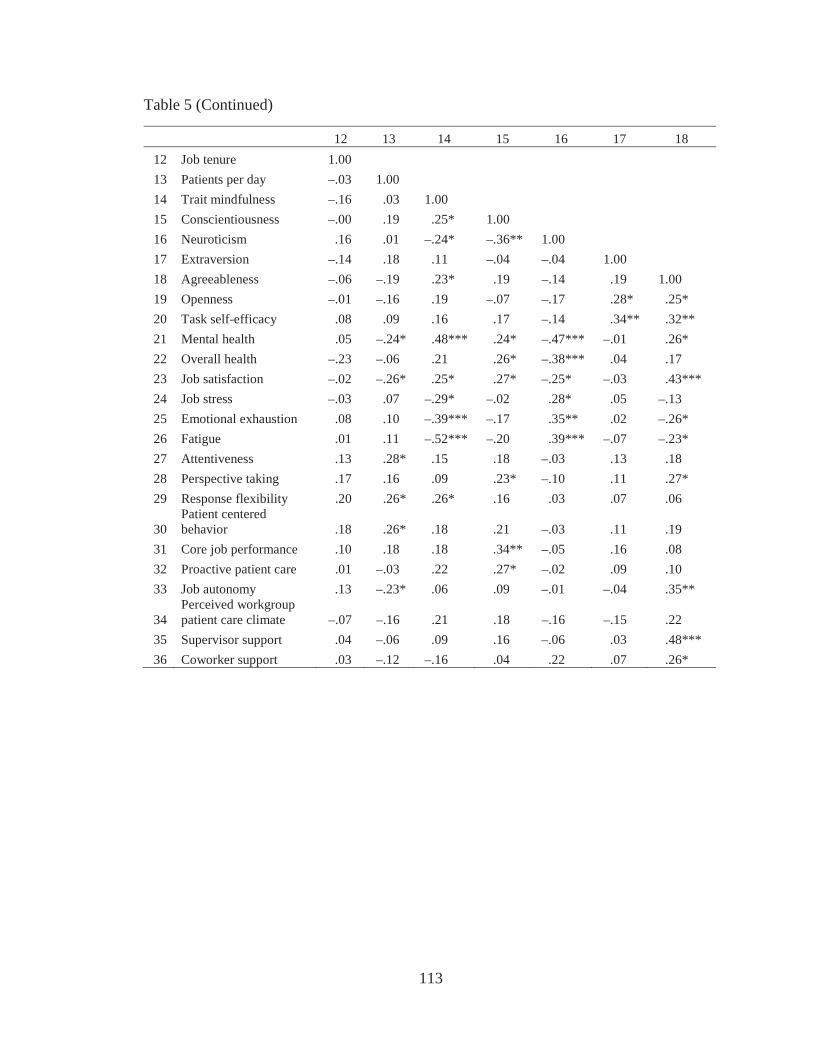
113
Table 5 (Continued)
12 13 14 15 16 17 1812 Job tenure 1.0013 Patients per day –.03 1.0014 Trait mindfulness –.16 .03 1.0015 Conscientiousness –.00 .19 .25* 1.0016 Neuroticism .16 .01 –.24* –.36** 1.0017 Extraversion –.14 .18 .11 –.04 –.04 1.0018 Agreeableness –.06 –.19 .23* .19 –.14 .19 1.0019 Openness –.01 –.16 .19 –.07 –.17 .28* .25*20 Task self-efficacy .08 .09 .16 .17 –.14 .34** .32**21 Mental health .05 –.24* .48*** .24* –.47*** –.01 .26*22 Overall health –.23 –.06 .21 .26* –.38*** .04 .1723 Job satisfaction –.02 –.26* .25* .27* –.25* –.03 .43***24 Job stress –.03 .07 –.29* –.02 .28* .05 –.1325 Emotional exhaustion .08 .10 –.39*** –.17 .35** .02 –.26*26 Fatigue .01 .11 –.52*** –.20 .39*** –.07 –.23*27 Attentiveness .13 .28* .15 .18 –.03 .13 .1828 Perspective taking .17 .16 .09 .23* –.10 .11 .27*29 Response flexibility .20 .26* .26* .16 .03 .07 .06
30Patient centered behavior .18 .26* .18 .21 –.03 .11 .19
31 Core job performance .10 .18 .18 .34** –.05 .16 .0832 Proactive patient care .01 –.03 .22 .27* –.02 .09 .1033 Job autonomy .13 –.23* .06 .09 –.01 –.04 .35**
34Perceived workgroup patient care climate –.07 –.16 .21 .18 –.16 –.15 .22
35 Supervisor support .04 –.06 .09 .16 –.06 .03 .48***36 Coworker support .03 –.12 –.16 .04 .22 .07 .26*
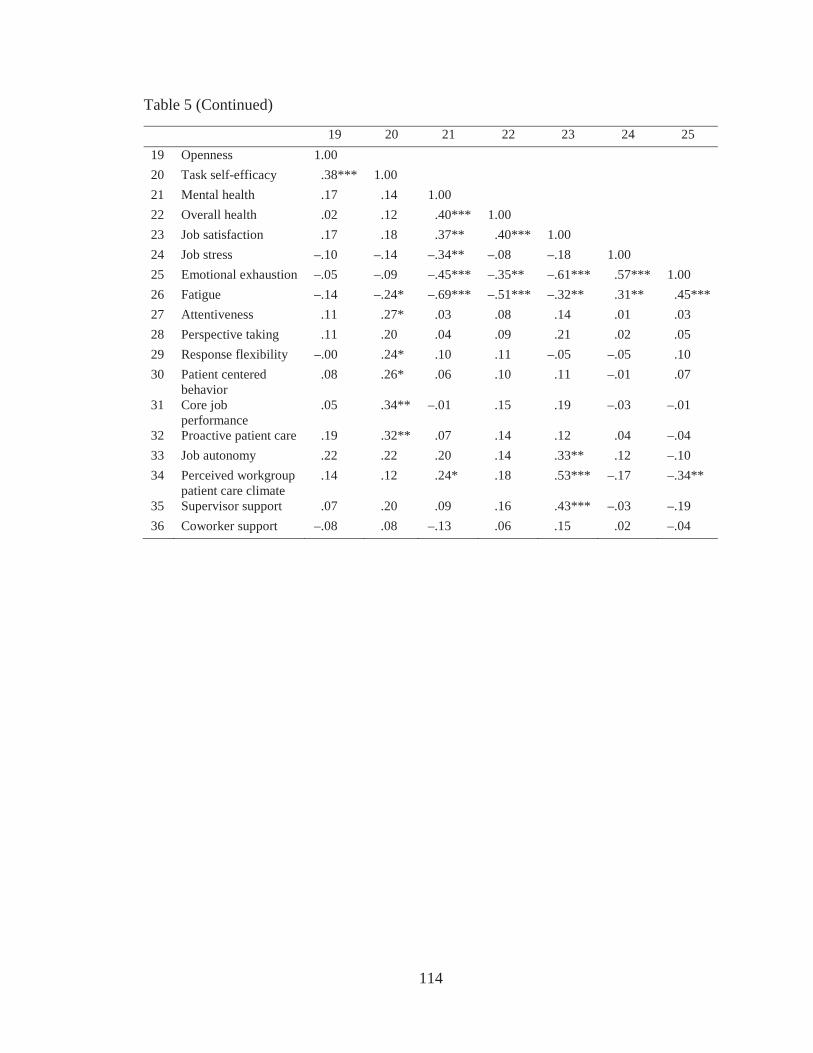
114
Table 5 (Continued)
19 20 21 22 23 24 2519 Openness 1.0020 Task self-efficacy .38*** 1.0021 Mental health .17 .14 1.0022 Overall health .02 .12 .40*** 1.0023 Job satisfaction .17 .18 .37** .40*** 1.0024 Job stress –.10 –.14 –.34** –.08 –.18 1.0025 Emotional exhaustion –.05 –.09 –.45*** –.35** –.61*** .57*** 1.0026 Fatigue –.14 –.24* –.69*** –.51*** –.32** .31** .45***27 Attentiveness .11 .27* .03 .08 .14 .01 .0328 Perspective taking .11 .20 .04 .09 .21 .02 .0529 Response flexibility –.00 .24* .10 .11 –.05 –.05 .1030 Patient centered
behavior.08 .26* .06 .10 .11 –.01 .07
31 Core job performance
.05 .34** –.01 .15 .19 –.03 –.01
32 Proactive patient care .19 .32** .07 .14 .12 .04 –.0433 Job autonomy .22 .22 .20 .14 .33** .12 –.1034 Perceived workgroup
patient care climate.14 .12 .24* .18 .53*** –.17 –.34**
35 Supervisor support .07 .20 .09 .16 .43*** –.03 –.1936 Coworker support –.08 .08 –.13 .06 .15 .02 –.04
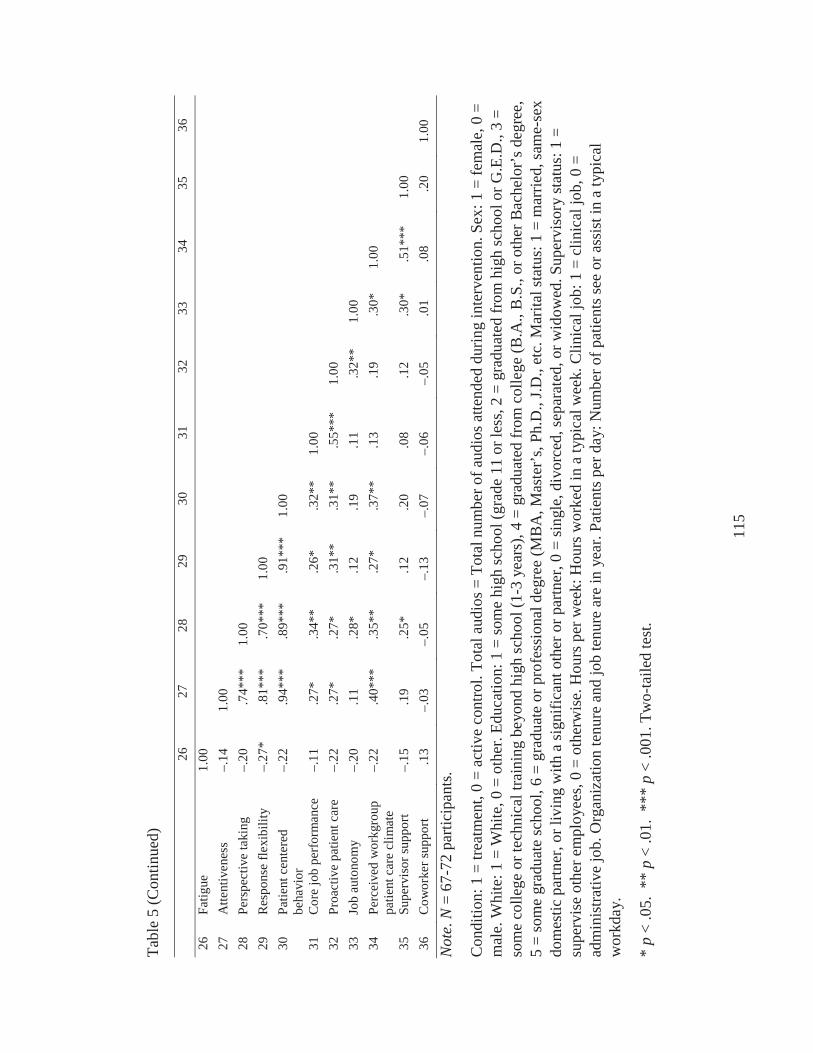
115
Tabl
e 5
(Con
tinue
d)
2627
2829
3031
3233
3435
3626
Fatig
ue1.
0027
Atte
ntiv
enes
s–.
141.
0028
Pers
pect
ive
taki
ng–.
20.7
4***
1.00
29R
espo
nse
flexi
bilit
y–.
27*
.81*
**.7
0***
1.00
30Pa
tient
cen
tere
d be
havi
or–.
22.9
4***
.89*
**.9
1***
1.00
31C
ore
job
perf
orm
ance
–.11
.27*
.34*
*.2
6*.3
2**
1.00
32Pr
oact
ive
patie
nt c
are
–.22
.27*
.27*
.31*
*.3
1**
.55*
**1.
0033
Job
auto
nom
y–.
20.1
1.2
8*.1
2.1
9.1
1.3
2**
1.00
34Pe
rcei
ved
wor
kgro
up
patie
nt c
are
clim
ate
–.22
.40*
**.3
5**
.27*
.37*
*.1
3.1
9.3
0*1.
00
35Su
perv
isor
supp
ort
–.15
.19
.25*
.12
.20
.08
.12
.30*
.51*
**1.
0036
Cow
orke
r sup
port
.13
–.03
–.05
–.13
–.07
–.06
–.05
.01
.08
.20
1.00
Not
e.N
= 67
-72
parti
cipa
nts.
Con
ditio
n: 1
= tr
eatm
ent,
0 =
activ
e co
ntro
l. To
tal a
udio
s = T
otal
num
ber o
f aud
ios a
ttend
ed d
urin
g in
terv
entio
n. S
ex: 1
= fe
mal
e, 0
=
mal
e. W
hite
: 1 =
Whi
te, 0
= o
ther
. Edu
catio
n: 1
= so
me
high
scho
ol (g
rade
11
or le
ss, 2
= g
radu
ated
from
hig
h sc
hool
or G
.E.D
., 3
= so
me
colle
ge o
r tec
hnic
al tr
aini
ng b
eyon
d hi
gh sc
hool
(1-3
yea
rs),
4 =
grad
uate
d fr
om c
olle
ge (B
.A.,
B.S
., or
oth
er B
ache
lor’
s deg
ree,
5
= so
me
grad
uate
scho
ol, 6
= g
radu
ate
or p
rofe
ssio
nal d
egre
e (M
BA
, Mas
ter’
s, Ph
.D.,
J.D.,
etc.
Mar
ital s
tatu
s: 1
= m
arrie
d, sa
me-
sex
dom
estic
par
tner
, or l
ivin
g w
ith a
sign
ifica
nt o
ther
or p
artn
er, 0
= si
ngle
, div
orce
d, se
para
ted,
or w
idow
ed. S
uper
viso
ry st
atus
: 1 =
su
perv
ise
othe
r em
ploy
ees,
0 =
othe
rwis
e. H
ours
per
wee
k: H
ours
wor
ked
in a
typi
cal w
eek.
Clin
ical
job:
1 =
clin
ical
job,
0 =
ad
min
istra
tive
job.
Org
aniz
atio
n te
nure
and
job
tenu
re a
re in
yea
r. Pa
tient
s per
day
: Num
ber o
f pat
ient
s see
or a
ssis
t in
a ty
pica
l w
orkd
ay.
*p
< .0
5. *
* p
< .0
1. *
** p
< .0
01. T
wo-
taile
d te
st.
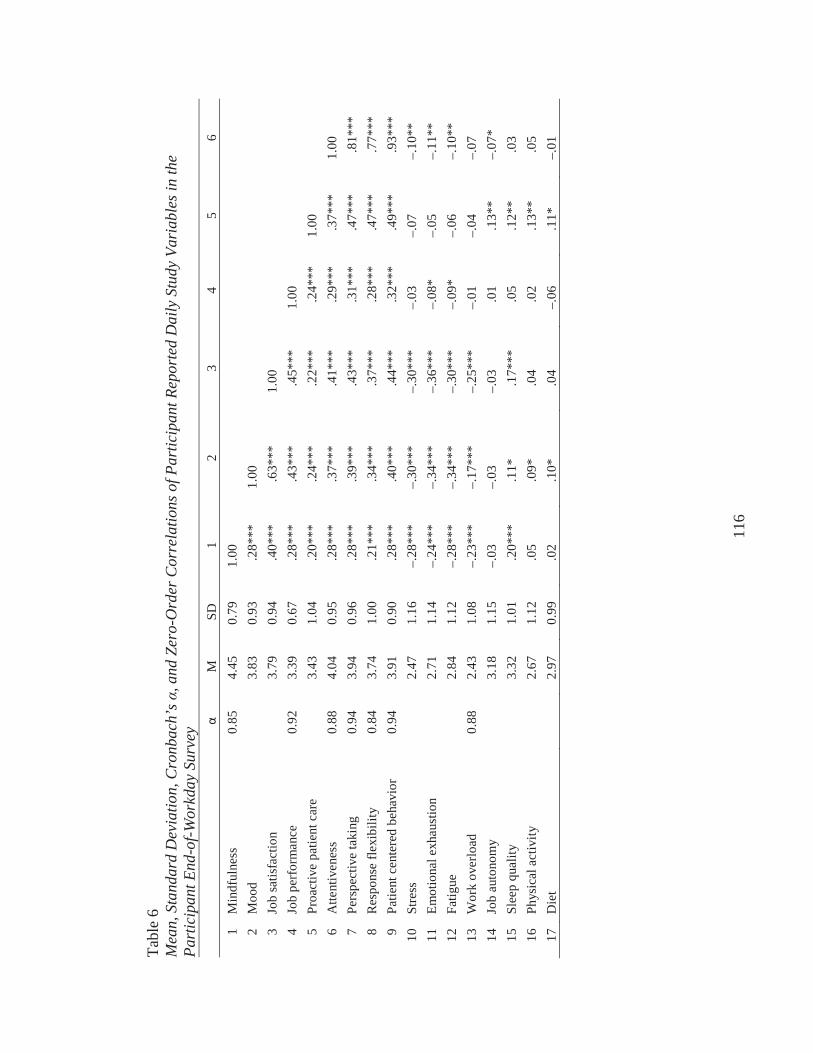
116
Tabl
e 6
Mea
n, S
tand
ard
Dev
iatio
n, C
ronb
ach’
s , a
nd Z
ero-
Ord
er C
orre
latio
ns o
f Par
ticip
ant R
epor
ted
Dai
ly S
tudy
Var
iabl
es in
the
Part
icip
ant E
nd-o
f-Wor
kday
Sur
vey
MSD
12
34
56
1M
indf
ulne
ss0.
854.
450.
791.
002
Moo
d3.
830.
93.2
8***
1.00
3Jo
b sa
tisfa
ctio
n3.
790.
94.4
0***
.63*
**1.
004
Job
perf
orm
ance
0.92
3.39
0.67
.28*
**.4
3***
.45*
**1.
005
Proa
ctiv
e pa
tient
car
e3.
431.
04.2
0***
.24*
**.2
2***
.24*
**1.
006
Atte
ntiv
enes
s0.
884.
040.
95.2
8***
.37*
**.4
1***
.29*
**.3
7***
1.00
7Pe
rspe
ctiv
e ta
king
0.94
3.94
0.96
.28*
**.3
9***
.43*
**.3
1***
.47*
**.8
1***
8R
espo
nse
flexi
bilit
y0.
843.
741.
00.2
1***
.34*
**.3
7***
.28*
**.4
7***
.77*
**9
Patie
nt c
ente
red
beha
vior
0.
943.
910.
90.2
8***
.40*
**.4
4***
.32*
**.4
9***
.93*
**10
Stre
ss2.
471.
16–.
28**
*–.
30**
*–.
30**
*–.
03–.
07–.
10**
11Em
otio
nal e
xhau
stio
n2.
711.
14–.
24**
*–.
34**
*–.
36**
*–.
08*
–.05
–.11
**12
Fatig
ue2.
841.
12–.
28**
*–.
34**
*–.
30**
*–.
09*
–.06
–.10
**13
Wor
k ov
erlo
ad0.
882.
431.
08–.
23**
*–.
17**
*–.
25**
*–.
01–.
04–.
0714
Job
auto
nom
y3.
181.
15–.
03–.
03–.
03.0
1.1
3**
–.07
*15
Slee
p qu
ality
3.32
1.01
.20*
**.1
1*.1
7***
.05
.12*
*.0
316
Phys
ical
act
ivity
2.67
1.12
.05
.09*
.04
.02
.13*
*.0
517
Die
t2.
970.
99.0
2.1
0*.0
4–.
06.1
1*–.
01
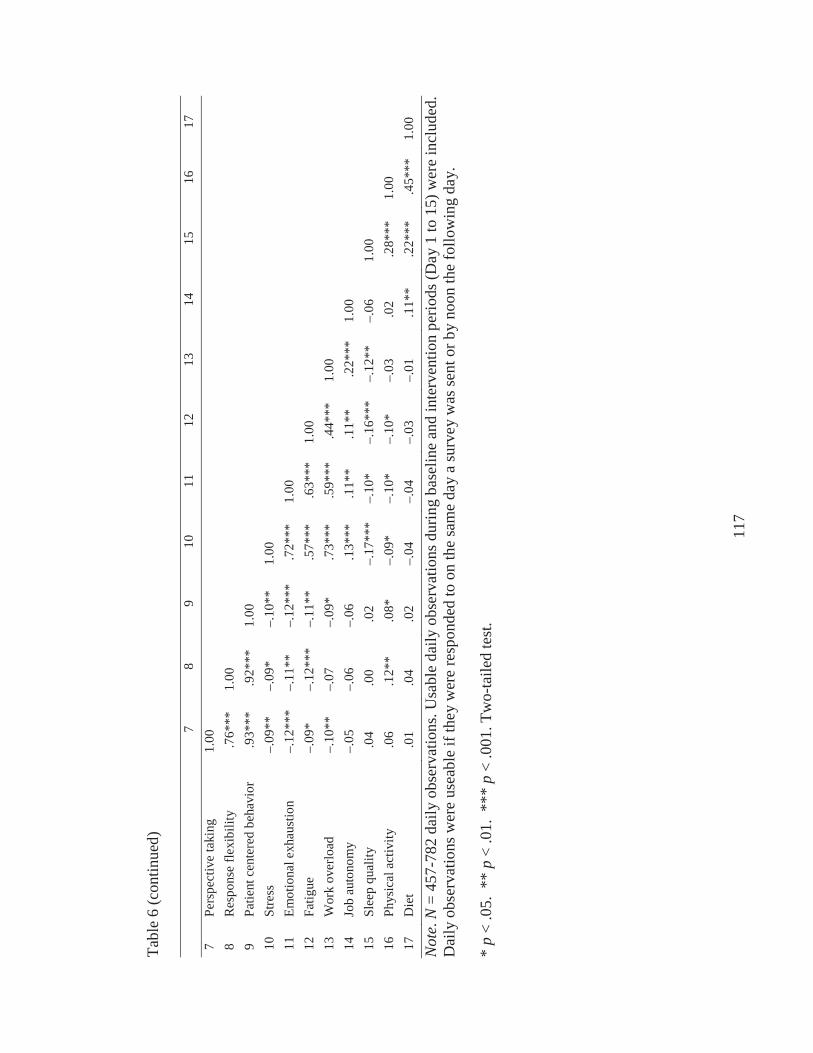
117
Tabl
e6
(con
tinue
d)
78
910
1112
1314
1516
177
Pers
pect
ive
taki
ng1.
008
Res
pons
e fle
xibi
lity
.76*
**1.
009
Patie
nt c
ente
red
beha
vior
.9
3***
.92*
**1.
0010
Stre
ss–.
09**
–.09
*–.
10**
1.00
11Em
otio
nal e
xhau
stio
n–.
12**
*–.
11**
–.12
***
.72*
**1.
0012
Fatig
ue–.
09*
–.12
***
–.11
**.5
7***
.63*
**1.
0013
Wor
k ov
erlo
ad–.
10**
–.07
–.09
*.7
3***
.59*
**.4
4***
1.00
14Jo
b au
tono
my
–.05
–.06
–.06
.13*
**.1
1**
.11*
*.2
2***
1.00
15Sl
eep
qual
ity.0
4.0
0.0
2–.
17**
*–.
10*
–.16
***
–.12
**–.
061.
0016
Phys
ical
act
ivity
.06
.12*
*.0
8*–.
09*
–.10
*–.
10*
–.03
.02
.28*
**1.
0017
Die
t.0
1.0
4.0
2–.
04–.
04–.
03–.
01.1
1**
.22*
**.4
5***
1.00
Not
e.N
= 45
7-78
2 da
ily o
bser
vatio
ns. U
sabl
e da
ily o
bser
vatio
ns d
urin
g ba
selin
e an
d in
terv
entio
n pe
riods
(Day
1 to
15)
wer
e in
clud
ed.
Dai
ly o
bser
vatio
ns w
ere
usea
ble
if th
ey w
ere
resp
onde
d to
on
the
sam
e da
y a
surv
ey w
as se
nt o
r by
noon
the
follo
win
g da
y.
*p
<.0
5. *
* p
< .0
1. *
** p
< .0
01. T
wo-
taile
d te
st.
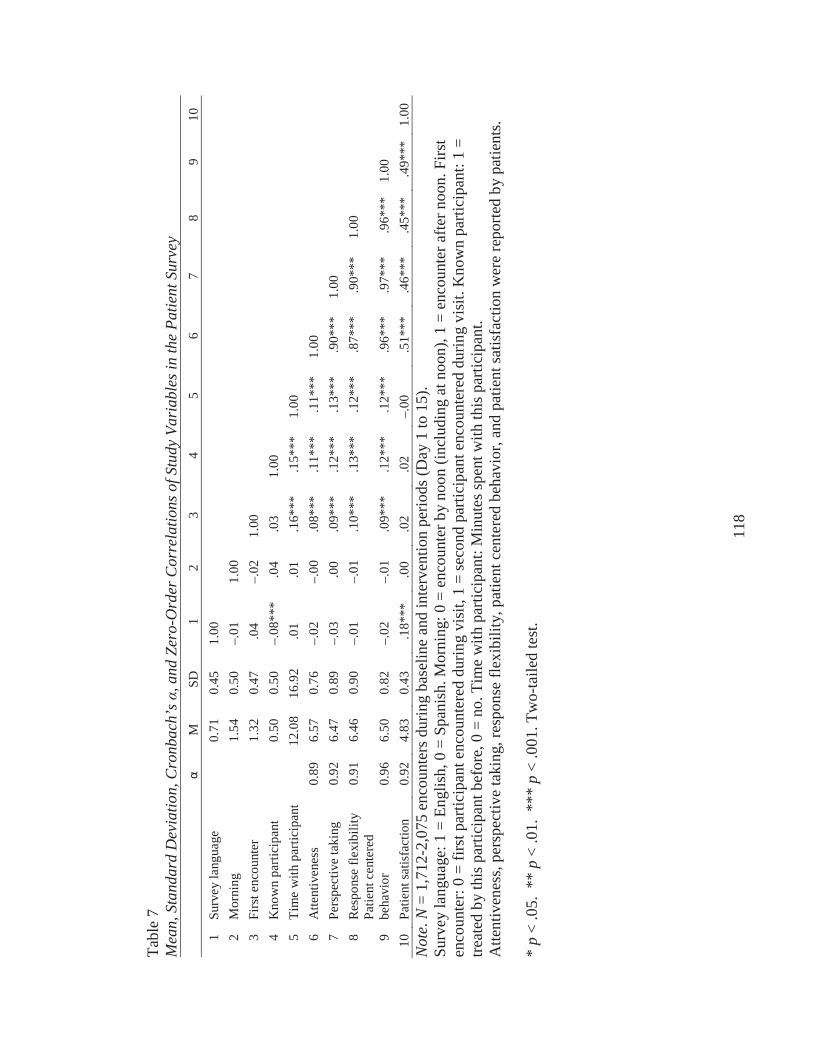
118
Tabl
e 7
Mea
n, S
tand
ard
Dev
iatio
n, C
ronb
ach’
s , a
nd Z
ero-
Ord
er C
orre
latio
ns o
f Stu
dy V
aria
bles
in th
e Pa
tient
Sur
vey
MSD
12
34
56
78
910
1Su
rvey
lang
uage
0.
710.
451.
002
Mor
ning
1.
540.
50–.
011.
003
Firs
t enc
ount
er
1.32
0.47
.04
–.02
1.00
4K
now
n pa
rtici
pant
0.50
0.50
–.08
***
.04
.03
1.00
5Ti
me
with
par
ticip
ant
12.0
816
.92
.01
.01
.16*
**.1
5***
1.00
6A
ttent
iven
ess
0.89
6.57
0.76
–.02
–.00
.08*
**.1
1***
.11*
**1.
007
Pers
pect
ive
taki
ng0.
926.
470.
89–.
03.0
0.0
9***
.12*
**.1
3***
.90*
**1.
008
Res
pons
e fle
xibi
lity
0.91
6.46
0.90
–.01
–.01
.10*
**.1
3***
.12*
**.8
7***
.90*
**1.
00
9Pa
tient
cen
tere
d be
havi
or0.
966.
500.
82–.
02–.
01.0
9***
.12*
**.1
2***
.96*
**.9
7***
.96*
**1.
0010
Patie
nt sa
tisfa
ctio
n0.
924.
830.
43.1
8***
.00
.02
.02
–.00
.51*
**.4
6***
.45*
**.4
9***
1.00
Not
e.N
= 1,
712-
2,07
5 en
coun
ters
dur
ing
base
line
and
inte
rven
tion
perio
ds (D
ay 1
to 1
5).
Surv
ey la
ngua
ge: 1
= E
nglis
h, 0
= S
pani
sh. M
orni
ng: 0
= e
ncou
nter
by
noon
(inc
ludi
ng a
t noo
n), 1
= e
ncou
nter
afte
r noo
n. F
irst
enco
unte
r: 0
= fir
st p
artic
ipan
t enc
ount
ered
dur
ing
visi
t, 1
= se
cond
par
ticip
ant e
ncou
nter
ed d
urin
g vi
sit.
Kno
wn
parti
cipa
nt: 1
=tre
ated
by
this
par
ticip
ant b
efor
e, 0
= n
o. T
ime
with
par
ticip
ant:
Min
utes
spen
t with
this
par
ticip
ant.
Atte
ntiv
enes
s, pe
rspe
ctiv
e ta
king
, res
pons
e fle
xibi
lity,
pat
ient
cen
tere
d be
havi
or, a
nd p
atie
nt sa
tisfa
ctio
n w
ere
repo
rted
bypa
tient
s.
*p
<.0
5. *
* p
< .0
1. *
** p
< .0
01. T
wo-
taile
d te
st.
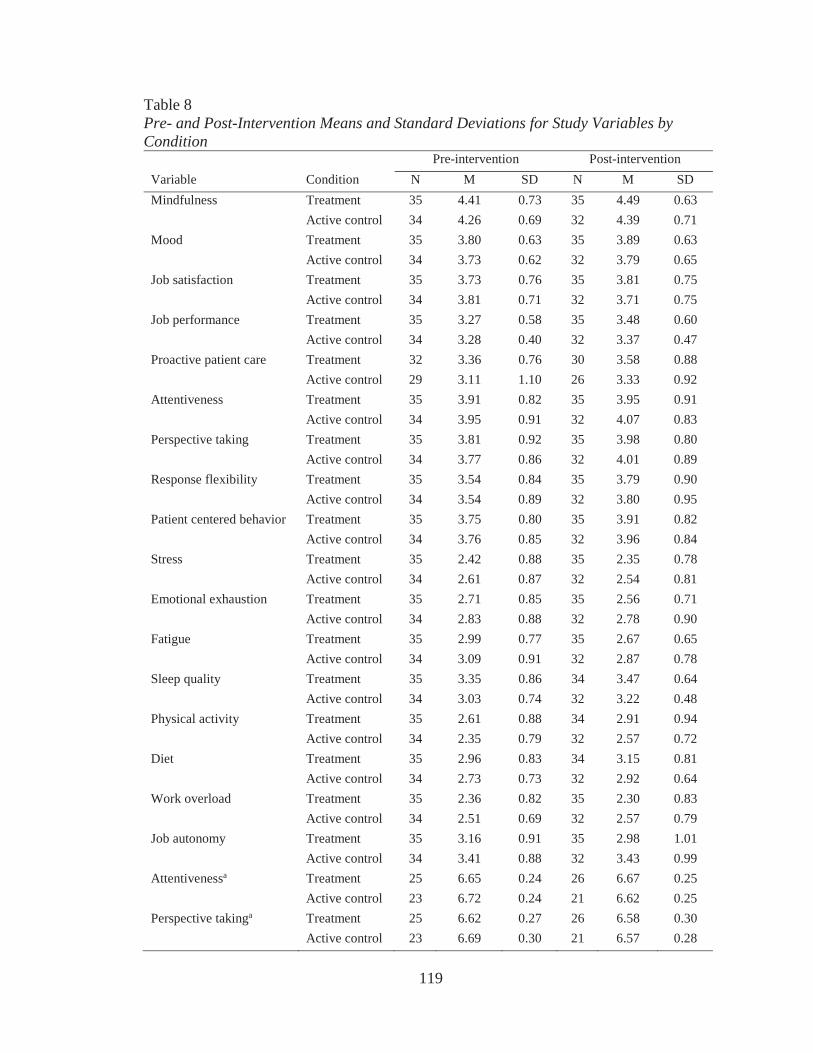
119
Table 8Pre- and Post-Intervention Means and Standard Deviations for Study Variables by Condition
Pre-intervention Post-interventionVariable Condition N M SD N M SDMindfulness Treatment 35 4.41 0.73 35 4.49 0.63
Active control 34 4.26 0.69 32 4.39 0.71Mood Treatment 35 3.80 0.63 35 3.89 0.63
Active control 34 3.73 0.62 32 3.79 0.65Job satisfaction Treatment 35 3.73 0.76 35 3.81 0.75
Active control 34 3.81 0.71 32 3.71 0.75Job performance Treatment 35 3.27 0.58 35 3.48 0.60
Active control 34 3.28 0.40 32 3.37 0.47Proactive patient care Treatment 32 3.36 0.76 30 3.58 0.88
Active control 29 3.11 1.10 26 3.33 0.92Attentiveness Treatment 35 3.91 0.82 35 3.95 0.91
Active control 34 3.95 0.91 32 4.07 0.83Perspective taking Treatment 35 3.81 0.92 35 3.98 0.80
Active control 34 3.77 0.86 32 4.01 0.89Response flexibility Treatment 35 3.54 0.84 35 3.79 0.90
Active control 34 3.54 0.89 32 3.80 0.95Patient centered behavior Treatment 35 3.75 0.80 35 3.91 0.82
Active control 34 3.76 0.85 32 3.96 0.84Stress Treatment 35 2.42 0.88 35 2.35 0.78
Active control 34 2.61 0.87 32 2.54 0.81Emotional exhaustion Treatment 35 2.71 0.85 35 2.56 0.71
Active control 34 2.83 0.88 32 2.78 0.90Fatigue Treatment 35 2.99 0.77 35 2.67 0.65
Active control 34 3.09 0.91 32 2.87 0.78Sleep quality Treatment 35 3.35 0.86 34 3.47 0.64
Active control 34 3.03 0.74 32 3.22 0.48Physical activity Treatment 35 2.61 0.88 34 2.91 0.94
Active control 34 2.35 0.79 32 2.57 0.72Diet Treatment 35 2.96 0.83 34 3.15 0.81
Active control 34 2.73 0.73 32 2.92 0.64Work overload Treatment 35 2.36 0.82 35 2.30 0.83
Active control 34 2.51 0.69 32 2.57 0.79Job autonomy Treatment 35 3.16 0.91 35 2.98 1.01
Active control 34 3.41 0.88 32 3.43 0.99Attentivenessa Treatment 25 6.65 0.24 26 6.67 0.25
Active control 23 6.72 0.24 21 6.62 0.25Perspective takinga Treatment 25 6.62 0.27 26 6.58 0.30
Active control 23 6.69 0.30 21 6.57 0.28
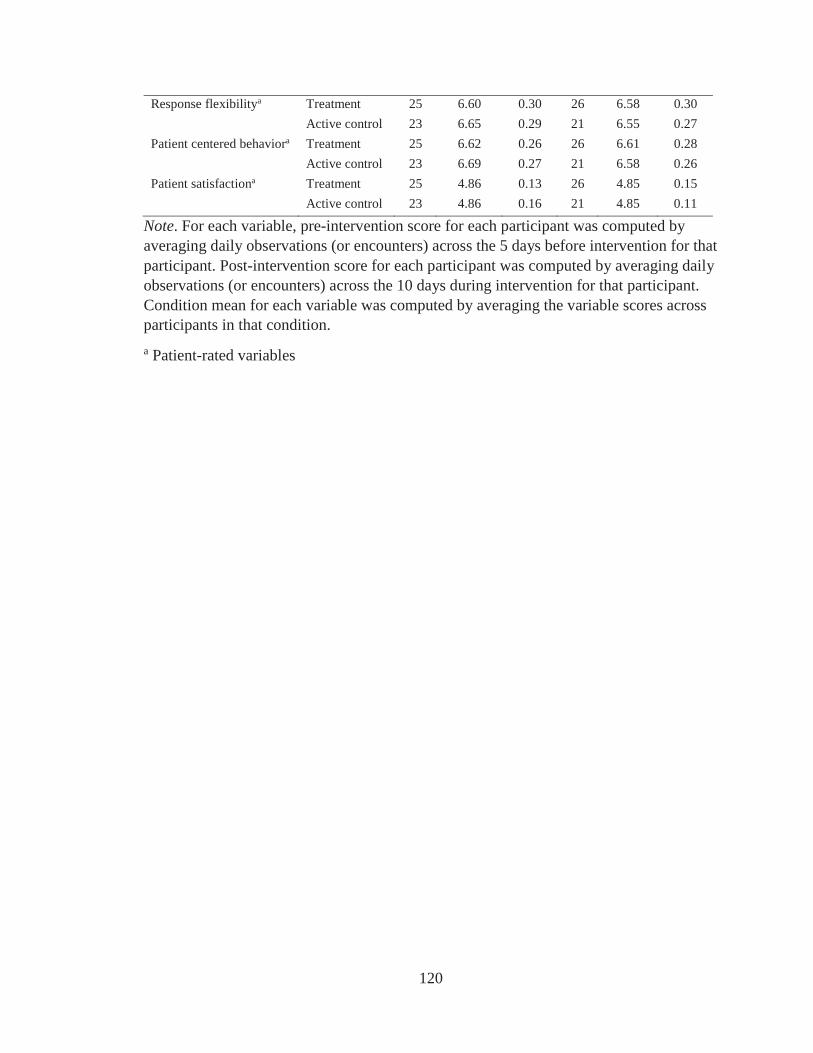
120
Response flexibilitya Treatment 25 6.60 0.30 26 6.58 0.30Active control 23 6.65 0.29 21 6.55 0.27
Patient centered behaviora Treatment 25 6.62 0.26 26 6.61 0.28Active control 23 6.69 0.27 21 6.58 0.26
Patient satisfactiona Treatment 25 4.86 0.13 26 4.85 0.15Active control 23 4.86 0.16 21 4.85 0.11
Note. For each variable, pre-intervention score for each participant was computed by averaging daily observations (or encounters) across the 5 days before intervention for thatparticipant. Post-intervention score for each participant was computed by averaging daily observations (or encounters) across the 10 days during intervention for that participant. Condition mean for each variable was computed by averaging the variable scores across participants in that condition.a Patient-rated variables
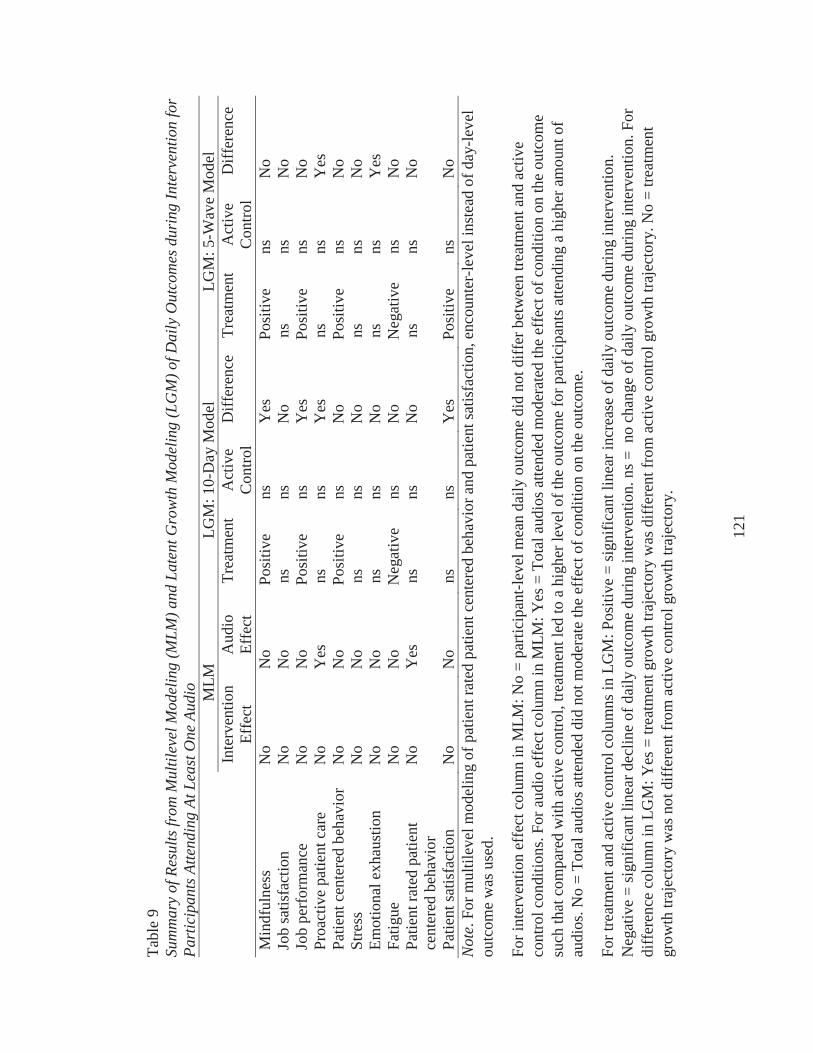
121
Tabl
e 9
Sum
mar
y of
Res
ults
from
Mul
tilev
el M
odel
ing
(MLM
) and
Lat
ent G
row
th M
odel
ing
(LG
M) o
f Dai
ly O
utco
mes
dur
ing
Inte
rven
tion
for
Part
icip
ants
Atte
ndin
g At
Lea
st O
ne A
udio
M
LMLG
M: 1
0-D
ay M
odel
LGM
: 5-W
ave
Mod
elIn
terv
entio
n Ef
fect
Aud
io
Effe
ctTr
eatm
ent
Act
ive
Con
trol
Diff
eren
ceTr
eatm
ent
Act
ive
Con
trol
Diff
eren
ce
Min
dful
ness
No
No
Posi
tive
nsY
esPo
sitiv
ens
No
Job
satis
fact
ion
No
No
nsns
No
nsns
No
Job
perf
orm
ance
No
No
Posi
tive
nsY
esPo
sitiv
ens
No
Proa
ctiv
e pa
tient
car
eN
oY
esns
nsY
esns
nsY
esPa
tient
cen
tere
d be
havi
orN
oN
oPo
sitiv
ens
No
Posi
tive
nsN
oSt
ress
No
No
nsns
No
nsns
No
Emot
iona
l exh
aust
ion
No
No
nsns
No
nsns
Yes
Fatig
ueN
oN
oN
egat
ive
nsN
oN
egat
ive
nsN
oPa
tient
rate
d pa
tient
ce
nter
ed b
ehav
ior
No
Yes
nsns
No
nsns
No
Patie
nt sa
tisfa
ctio
nN
oN
ons
nsY
esPo
sitiv
e ns
No
Not
e. F
or m
ultil
evel
mod
elin
g of
pat
ient
rate
d pa
tient
cen
tere
d be
havi
or a
nd p
atie
nt sa
tisfa
ctio
n, e
ncou
nter
-leve
l ins
tead
of d
ay-le
vel
outc
ome
was
use
d.
For i
nter
vent
ion
effe
ct c
olum
n in
MLM
: No
= pa
rtici
pant
-leve
l mea
n da
ily o
utco
me
did
not d
iffer
bet
wee
n tre
atm
ent a
nd a
ctiv
e co
ntro
l con
ditio
ns. F
or a
udio
eff
ect c
olum
n in
MLM
: Yes
= T
otal
aud
ios a
ttend
ed m
oder
ated
the
effe
ct o
f con
ditio
n on
the
outc
ome
such
that
com
pare
d w
ith a
ctiv
e co
ntro
l, tre
atm
ent l
ed to
a h
ighe
r lev
el o
f the
out
com
e fo
r par
ticip
ants
atte
ndin
g a
high
er a
mou
nt o
f au
dios
. No
= To
tal a
udio
s atte
nded
did
not
mod
erat
e th
e ef
fect
of c
ondi
tion
on th
e ou
tcom
e.
For t
reat
men
t and
act
ive
cont
rol c
olum
ns in
LG
M: P
ositi
ve =
sign
ifica
nt li
near
incr
ease
of d
aily
out
com
e du
ring
inte
rven
tion.
Neg
ativ
e =
sign
ifica
nt li
near
dec
line
of d
aily
out
com
e du
ring
inte
rven
tion.
ns =
no
chan
ge o
f dai
ly o
utco
me
durin
g in
terv
entio
n. F
or
diff
eren
ce c
olum
n in
LG
M: Y
es =
trea
tmen
t gro
wth
traj
ecto
ry w
as d
iffer
ent f
rom
act
ive
cont
rol g
row
th tr
ajec
tory
. No
= tre
atm
ent
grow
thtra
ject
ory
was
not
diff
eren
t fro
m a
ctiv
e co
ntro
l gro
wth
traj
ecto
ry.

122
Table 10Multilevel Modeling Results for the Effect of Experimental Condition and Total Number of Audios Attended (TNAA) on Daily Mindfulness over Intervention Period
Model 1 Model 2Parameter Estimate SE Estimate SEBetween-participant levelIntercept 1.51*** .41 1.45** .47Outcome at baseline .68*** .09 .66*** .08Condition –.01 .10 –.06 .38Total number of audios attended (TNAA) .02 .04Condition x TNAA .01 .05Residual variance .12*** .03 .12*** .03Within-participant levelResidual variance .34*** .07 .34*** .07Model deviance 939.46 938.60
Note. Each model included individuals who attended at least one audio over the 10-day intervention period and had nonmissing baseline outcome. Daily outcome was included in the analyses if it was responded to on the same day a daily survey was sent or by noon the following day.
N = 489 daily observations nested with 64 participants. Robust maximum likelihood estimator was used to produce standard errors that were robust to non-normality and non-independence of observations (Muthén & Muthén, 2012; Preacher et al., 2010). Model deviance = –2 x log-likelihood of the full maximum-likelihood estimate. Smaller deviance indicates better model fit.
Outcome at baseline refers to averaged daily mindfulness across the 5 days before the intervention started for each participant.
Condition: 1 = treatment, 0 = active control. Estimates were unstandardized coefficients.
* p < .05. ** p < .01. *** p < .001. Two-tailed test.
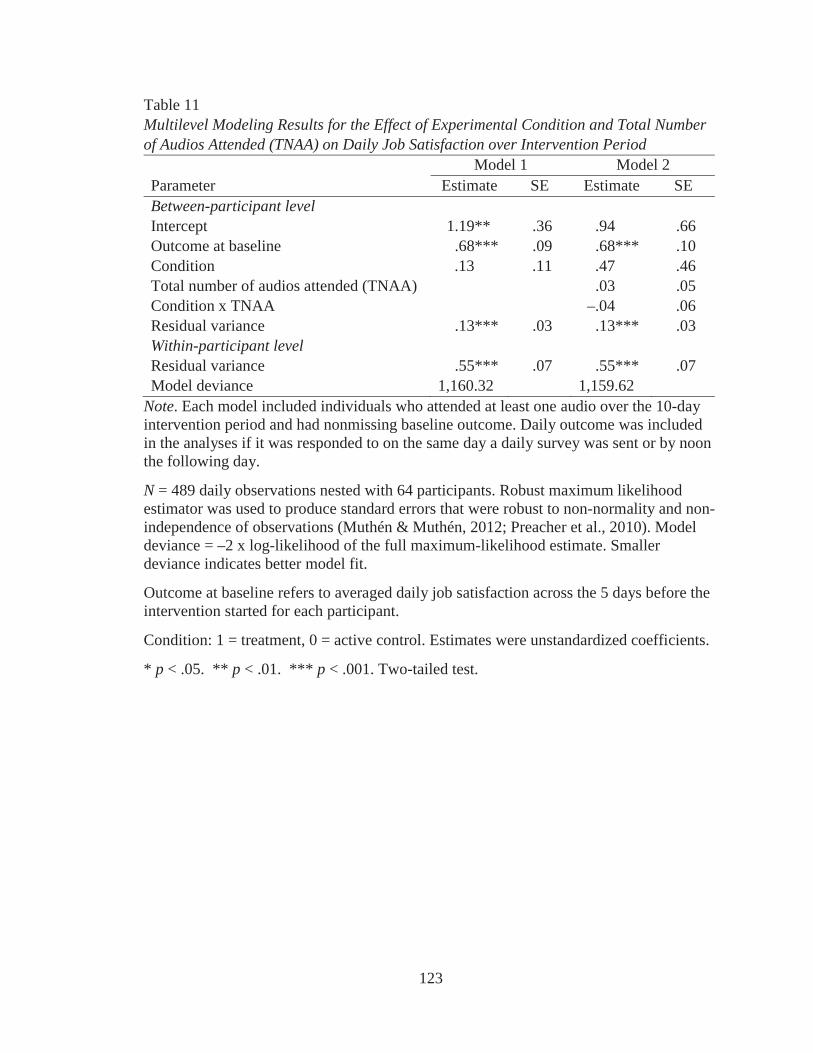
123
Table 11Multilevel Modeling Results for the Effect of Experimental Condition and Total Number of Audios Attended (TNAA) on Daily Job Satisfaction over Intervention Period
Model 1 Model 2Parameter Estimate SE Estimate SEBetween-participant levelIntercept 1.19** .36 .94 .66Outcome at baseline .68*** .09 .68*** .10Condition .13 .11 .47 .46Total number of audios attended (TNAA) .03 .05Condition x TNAA –.04 .06Residual variance .13*** .03 .13*** .03Within-participant levelResidual variance .55*** .07 .55*** .07Model deviance 1,160.32 1,159.62
Note. Each model included individuals who attended at least one audio over the 10-day intervention period and had nonmissing baseline outcome. Daily outcome was included in the analyses if it was responded to on the same day a daily survey was sent or by noon the following day.
N = 489 daily observations nested with 64 participants. Robust maximum likelihood estimator was used to produce standard errors that were robust to non-normality and non-independence of observations (Muthén & Muthén, 2012; Preacher et al., 2010). Model deviance = –2 x log-likelihood of the full maximum-likelihood estimate. Smaller deviance indicates better model fit.
Outcome at baseline refers to averaged daily job satisfaction across the 5 days before the intervention started for each participant.
Condition: 1 = treatment, 0 = active control. Estimates were unstandardized coefficients.
* p < .05. ** p < .01. *** p < .001. Two-tailed test.
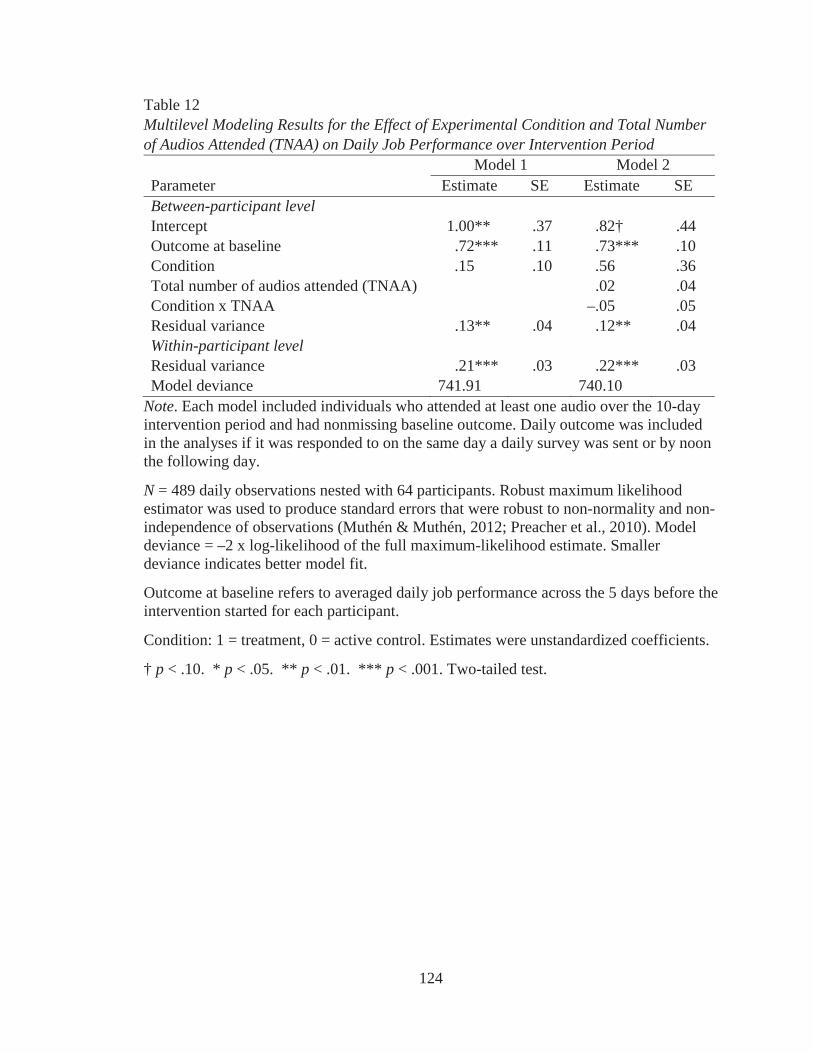
124
Table 12Multilevel Modeling Results for the Effect of Experimental Condition and Total Number of Audios Attended (TNAA) on Daily Job Performance over Intervention Period
Model 1 Model 2Parameter Estimate SE Estimate SEBetween-participant levelIntercept 1.00** .37 .82† .44Outcome at baseline .72*** .11 .73*** .10Condition .15 .10 .56 .36Total number of audios attended (TNAA) .02 .04Condition x TNAA –.05 .05Residual variance .13** .04 .12** .04Within-participant levelResidual variance .21*** .03 .22*** .03Model deviance 741.91 740.10
Note. Each model included individuals who attended at least one audio over the 10-day intervention period and had nonmissing baseline outcome. Daily outcome was included in the analyses if it was responded to on the same day a daily survey was sent or by noon the following day.
N = 489 daily observations nested with 64 participants. Robust maximum likelihood estimator was used to produce standard errors that were robust to non-normality and non-independence of observations (Muthén & Muthén, 2012; Preacher et al., 2010). Model deviance = –2 x log-likelihood of the full maximum-likelihood estimate. Smaller deviance indicates better model fit.
Outcome at baseline refers to averaged daily job performance across the 5 days before the intervention started for each participant.
Condition: 1 = treatment, 0 = active control. Estimates were unstandardized coefficients.
† p < .10. * p < .05. ** p < .01. *** p < .001. Two-tailed test.
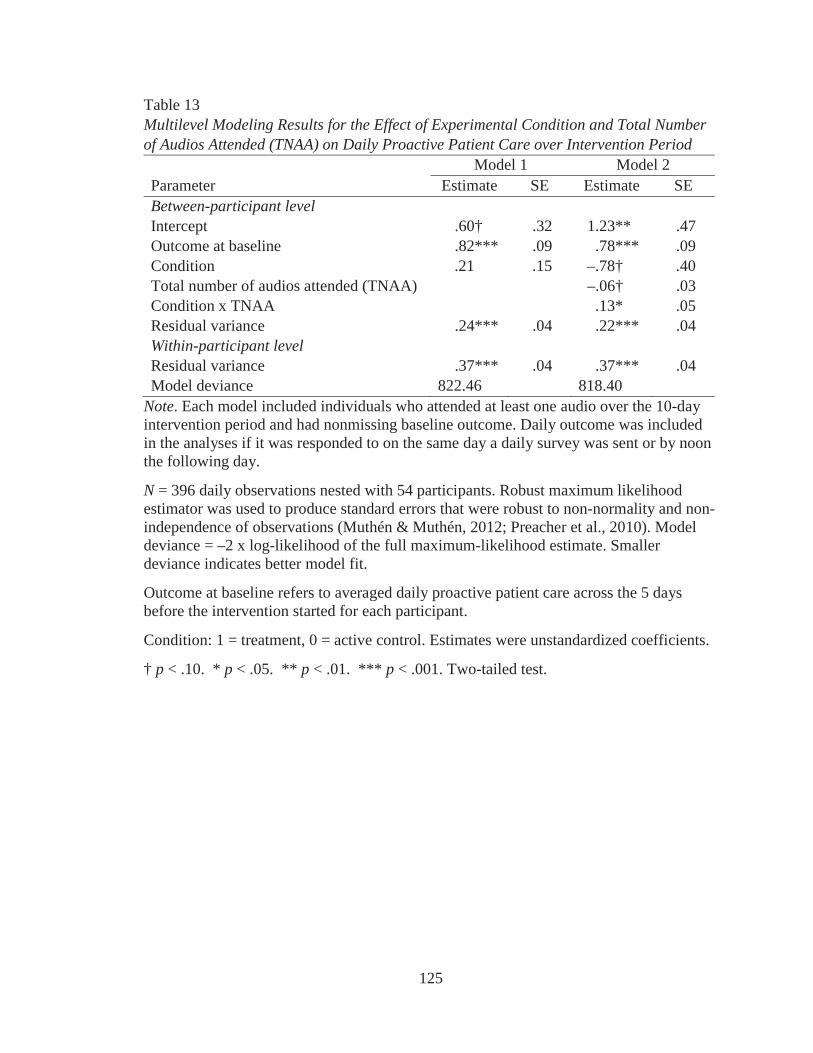
125
Table 13Multilevel Modeling Results for the Effect of Experimental Condition and Total Number of Audios Attended (TNAA) on Daily Proactive Patient Care over Intervention Period
Model 1 Model 2Parameter Estimate SE Estimate SEBetween-participant levelIntercept .60† .32 1.23** .47Outcome at baseline .82*** .09 .78*** .09Condition .21 .15 –.78† .40Total number of audios attended (TNAA) –.06† .03Condition x TNAA .13* .05Residual variance .24*** .04 .22*** .04Within-participant levelResidual variance .37*** .04 .37*** .04Model deviance 822.46 818.40
Note. Each model included individuals who attended at least one audio over the 10-day intervention period and had nonmissing baseline outcome. Daily outcome was included in the analyses if it was responded to on the same day a daily survey was sent or by noonthe following day.
N = 396 daily observations nested with 54 participants. Robust maximum likelihood estimator was used to produce standard errors that were robust to non-normality and non-independence of observations (Muthén & Muthén, 2012; Preacher et al., 2010). Model deviance = –2 x log-likelihood of the full maximum-likelihood estimate. Smaller deviance indicates better model fit.
Outcome at baseline refers to averaged daily proactive patient care across the 5 days before the intervention started for each participant.
Condition: 1 = treatment, 0 = active control. Estimates were unstandardized coefficients.
† p < .10. * p < .05. ** p < .01. *** p < .001. Two-tailed test.
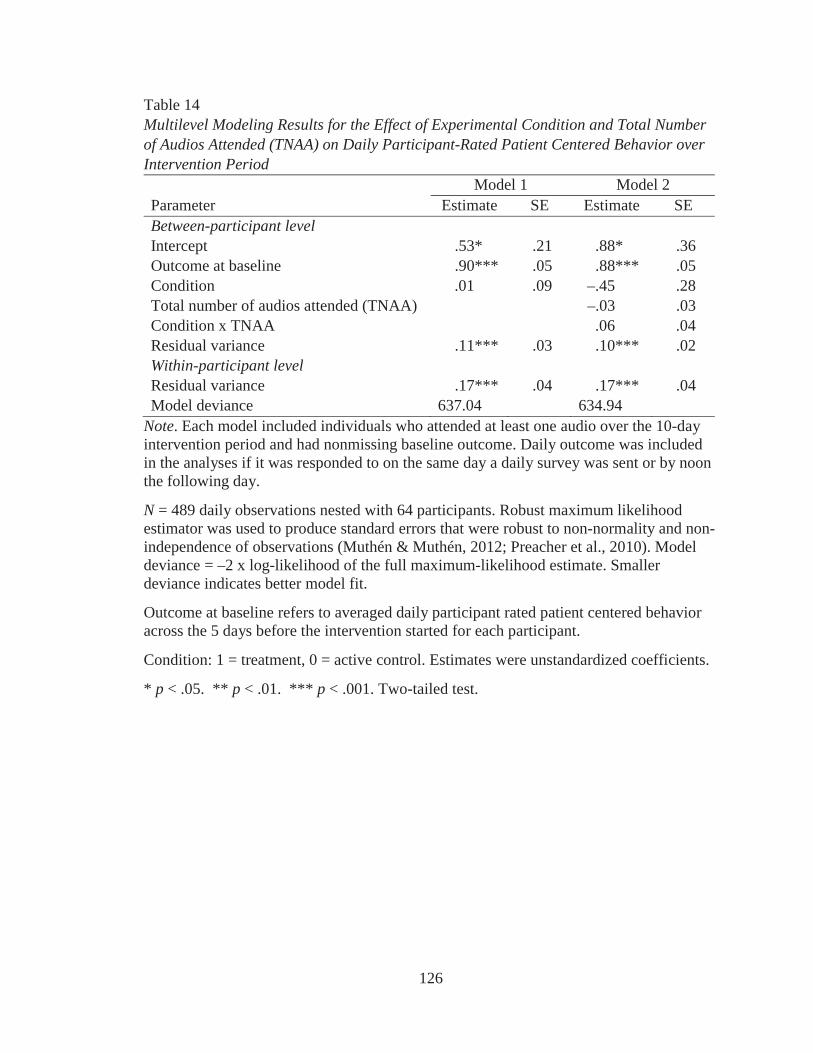
126
Table 14Multilevel Modeling Results for the Effect of Experimental Condition and Total Number of Audios Attended (TNAA) on Daily Participant-Rated Patient Centered Behavior over Intervention Period
Model 1 Model 2Parameter Estimate SE Estimate SEBetween-participant levelIntercept .53* .21 .88* .36Outcome at baseline .90*** .05 .88*** .05Condition .01 .09 –.45 .28Total number of audios attended (TNAA) –.03 .03Condition x TNAA .06 .04Residual variance .11*** .03 .10*** .02Within-participant levelResidual variance .17*** .04 .17*** .04Model deviance 637.04 634.94
Note. Each model included individuals who attended at least one audio over the 10-day intervention period and had nonmissing baseline outcome. Daily outcome was included in the analyses if it was responded to on the same day a daily survey was sent or by noon the following day.
N = 489 daily observations nested with 64 participants. Robust maximum likelihood estimator was used to produce standard errors that were robust to non-normality and non-independence of observations (Muthén & Muthén, 2012; Preacher et al., 2010). Model deviance = –2 x log-likelihood of the full maximum-likelihood estimate. Smaller deviance indicates better model fit.
Outcome at baseline refers to averaged daily participant rated patient centered behavior across the 5 days before the intervention started for each participant.
Condition: 1 = treatment, 0 = active control. Estimates were unstandardized coefficients.
* p < .05. ** p < .01. *** p < .001. Two-tailed test.
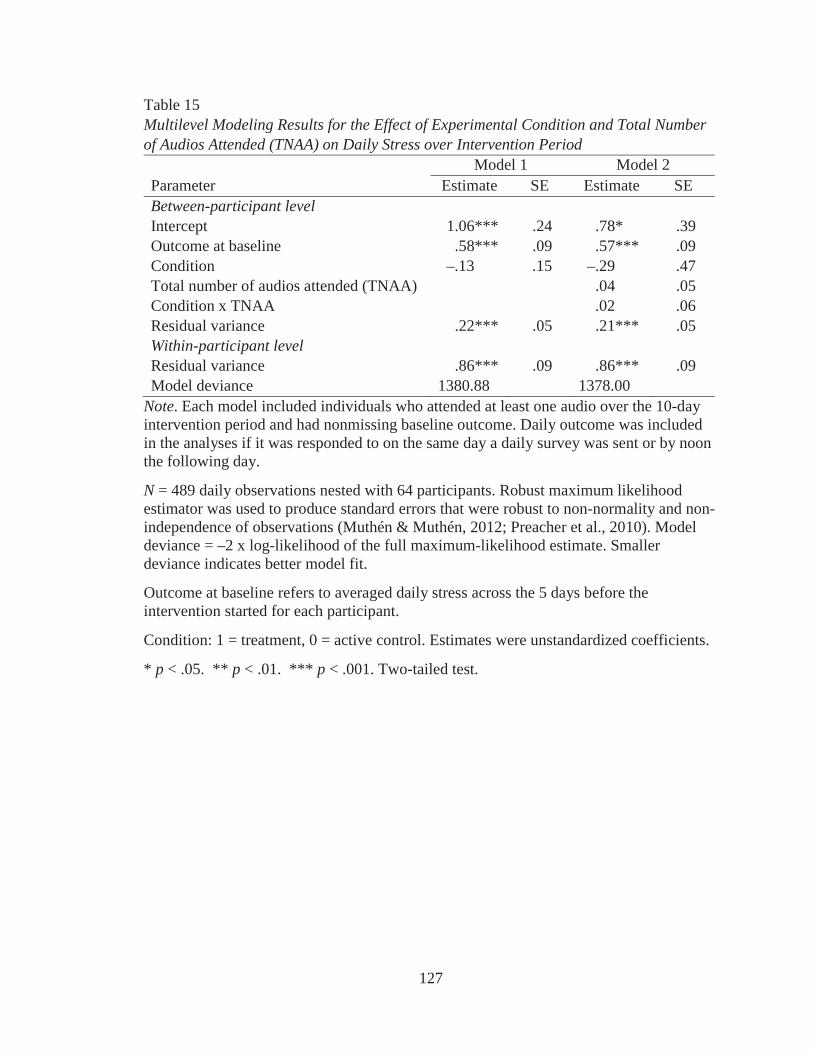
127
Table 15Multilevel Modeling Results for the Effect of Experimental Condition and Total Number of Audios Attended (TNAA) on Daily Stress over Intervention Period
Model 1 Model 2Parameter Estimate SE Estimate SEBetween-participant levelIntercept 1.06*** .24 .78* .39Outcome at baseline .58*** .09 .57*** .09Condition –.13 .15 –.29 .47Total number of audios attended (TNAA) .04 .05Condition x TNAA .02 .06Residual variance .22*** .05 .21*** .05Within-participant levelResidual variance .86*** .09 .86*** .09Model deviance 1380.88 1378.00
Note. Each model included individuals who attended at least one audio over the 10-day intervention period and had nonmissing baseline outcome. Daily outcome was included in the analyses if it was responded to on the same day a daily survey was sent or by noon the following day.
N = 489 daily observations nested with 64 participants. Robust maximum likelihood estimator was used to produce standard errors that were robust to non-normality and non-independence of observations (Muthén & Muthén, 2012; Preacher et al., 2010). Model deviance = –2 x log-likelihood of the full maximum-likelihood estimate. Smaller deviance indicates better model fit.
Outcome at baseline refers to averaged daily stress across the 5 days before the intervention started for each participant.
Condition: 1 = treatment, 0 = active control. Estimates were unstandardized coefficients.
* p < .05. ** p < .01. *** p < .001. Two-tailed test.
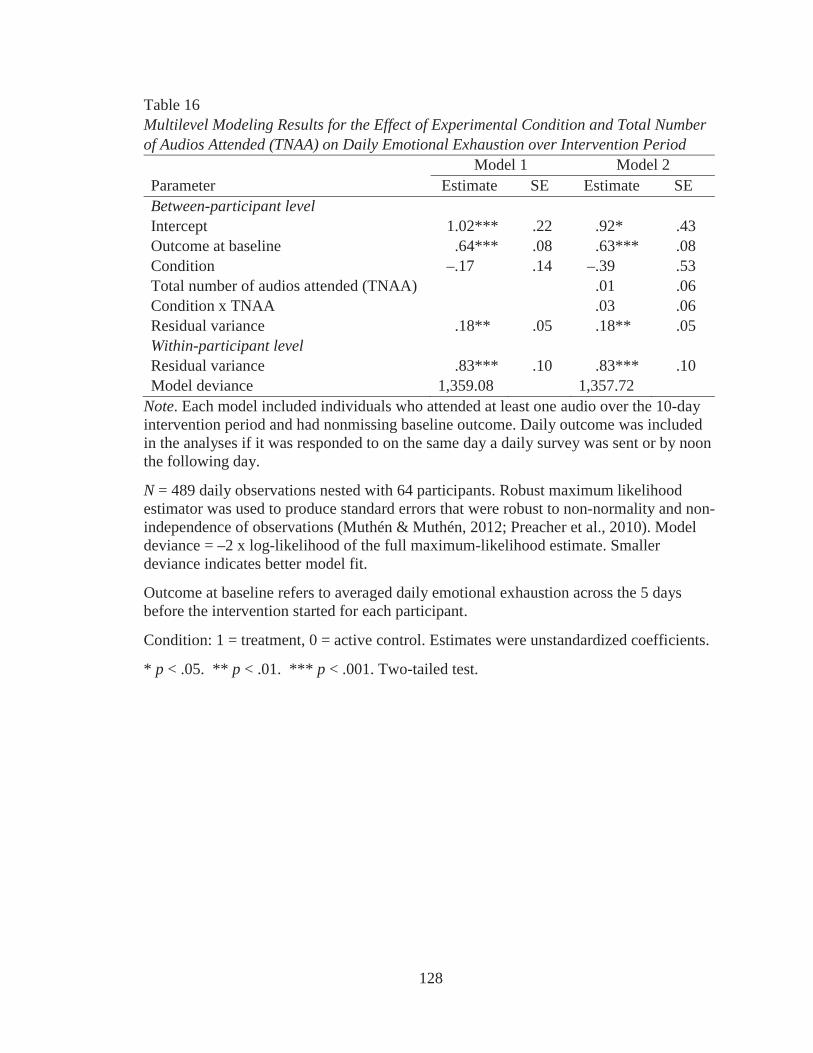
128
Table 16Multilevel Modeling Results for the Effect of Experimental Condition and Total Number of Audios Attended (TNAA) on Daily Emotional Exhaustion over Intervention Period
Model 1 Model 2Parameter Estimate SE Estimate SEBetween-participant levelIntercept 1.02*** .22 .92* .43Outcome at baseline .64*** .08 .63*** .08Condition –.17 .14 –.39 .53Total number of audios attended (TNAA) .01 .06Condition x TNAA .03 .06Residual variance .18** .05 .18** .05Within-participant levelResidual variance .83*** .10 .83*** .10Model deviance 1,359.08 1,357.72
Note. Each model included individuals who attended at least one audio over the 10-day intervention period and had nonmissing baseline outcome. Daily outcome was included in the analyses if it was responded to on the same day a daily survey was sent or by noon the following day.
N = 489 daily observations nested with 64 participants. Robust maximum likelihood estimator was used to produce standard errors that were robust to non-normality and non-independence of observations (Muthén & Muthén, 2012; Preacher et al., 2010). Model deviance = –2 x log-likelihood of the full maximum-likelihood estimate. Smaller deviance indicates better model fit.
Outcome at baseline refers to averaged daily emotional exhaustion across the 5 days before the intervention started for each participant.
Condition: 1 = treatment, 0 = active control. Estimates were unstandardized coefficients.
* p < .05. ** p < .01. *** p < .001. Two-tailed test.

129
Table 17Multilevel Modeling Results for the Effect of Experimental Condition and Total Number of Audios Attended (TNAA) on Daily Fatigue over Intervention Period
Model 1 Model 2Parameter Estimate SE Estimate SEBetween-participant levelIntercept 1.33*** .27 1.33** .47Outcome at baseline .51*** .09 .52*** .09Condition –.17 .13 –.37 .55Total number of audios attended (TNAA) –.001 .05Condition x TNAA .03 .07Residual variance .14** .04 .14** .04Within-participant levelResidual variance .93*** .10 .93*** .11Model deviance 1,402.80 1,402.22
Note. Each model included individuals who attended at least one audio over the 10-day intervention period and had nonmissing baseline outcome. Daily outcome was included in the analyses if it was responded to on the same day a daily survey was sent or by noon the following day.
N = 489 daily observations nested with 64 participants. Robust maximum likelihood estimator was used to produce standard errors that were robust to non-normality and non-independence of observations (Muthén & Muthén, 2012; Preacher et al., 2010). Model deviance = –2 x log-likelihood of the full maximum-likelihood estimate. Smaller deviance indicates better model fit.
Outcome at baseline refers to averaged daily fatigue across the 5 days before the intervention started for each participant.
Condition: 1 = treatment, 0 = active control. Estimates were unstandardized coefficients.
* p < .05. ** p < .01. *** p < .001. Two-tailed test.
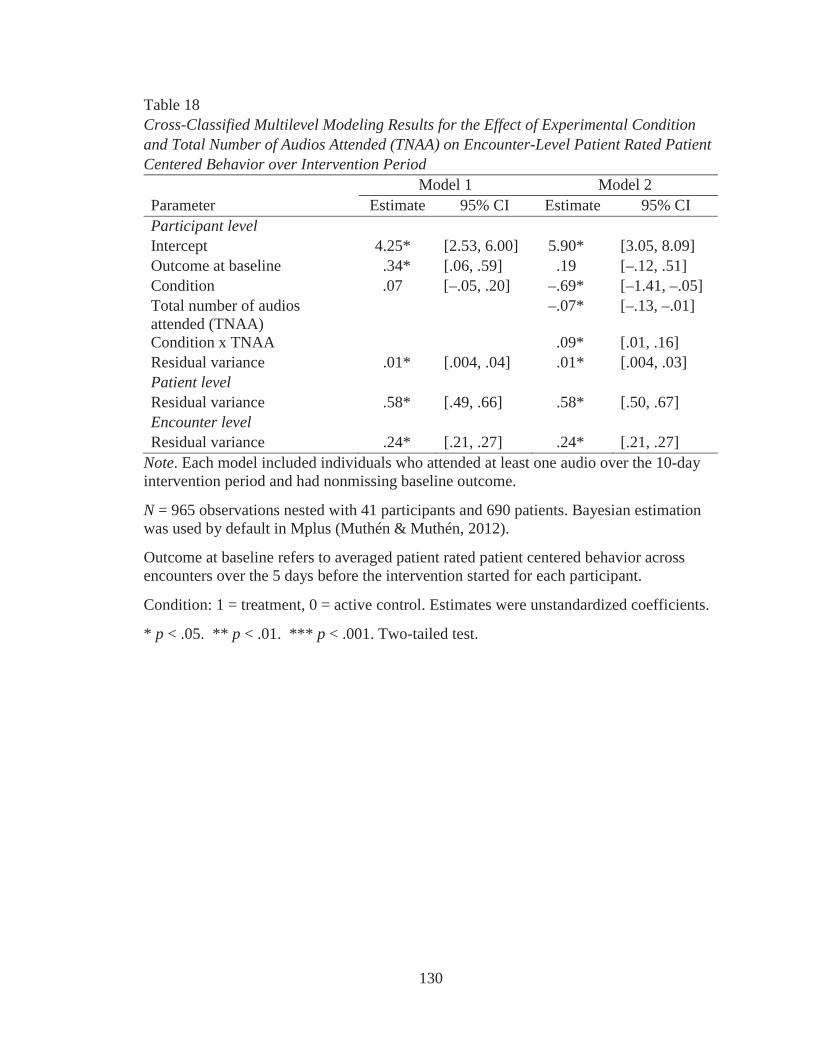
130
Table 18Cross-Classified Multilevel Modeling Results for the Effect of Experimental Condition and Total Number of Audios Attended (TNAA) on Encounter-Level Patient Rated Patient Centered Behavior over Intervention Period
Model 1 Model 2Parameter Estimate 95% CI Estimate 95% CIParticipant levelIntercept 4.25* [2.53, 6.00] 5.90* [3.05, 8.09]Outcome at baseline .34* [.06, .59] .19 [–.12, .51]Condition .07 [–.05, .20] –.69* [–1.41, –.05]Total number of audios attended (TNAA)
–.07* [–.13, –.01]
Condition x TNAA .09* [.01, .16]Residual variance .01* [.004, .04] .01* [.004, .03]Patient levelResidual variance .58* [.49, .66] .58* [.50, .67]Encounter levelResidual variance .24* [.21, .27] .24* [.21, .27]
Note. Each model included individuals who attended at least one audio over the 10-day intervention period and had nonmissing baseline outcome.
N = 965 observations nested with 41 participants and 690 patients. Bayesian estimation was used by default in Mplus (Muthén & Muthén, 2012).
Outcome at baseline refers to averaged patient rated patient centered behavior across encounters over the 5 days before the intervention started for each participant.
Condition: 1 = treatment, 0 = active control. Estimates were unstandardized coefficients.
* p < .05. ** p < .01. *** p < .001. Two-tailed test.
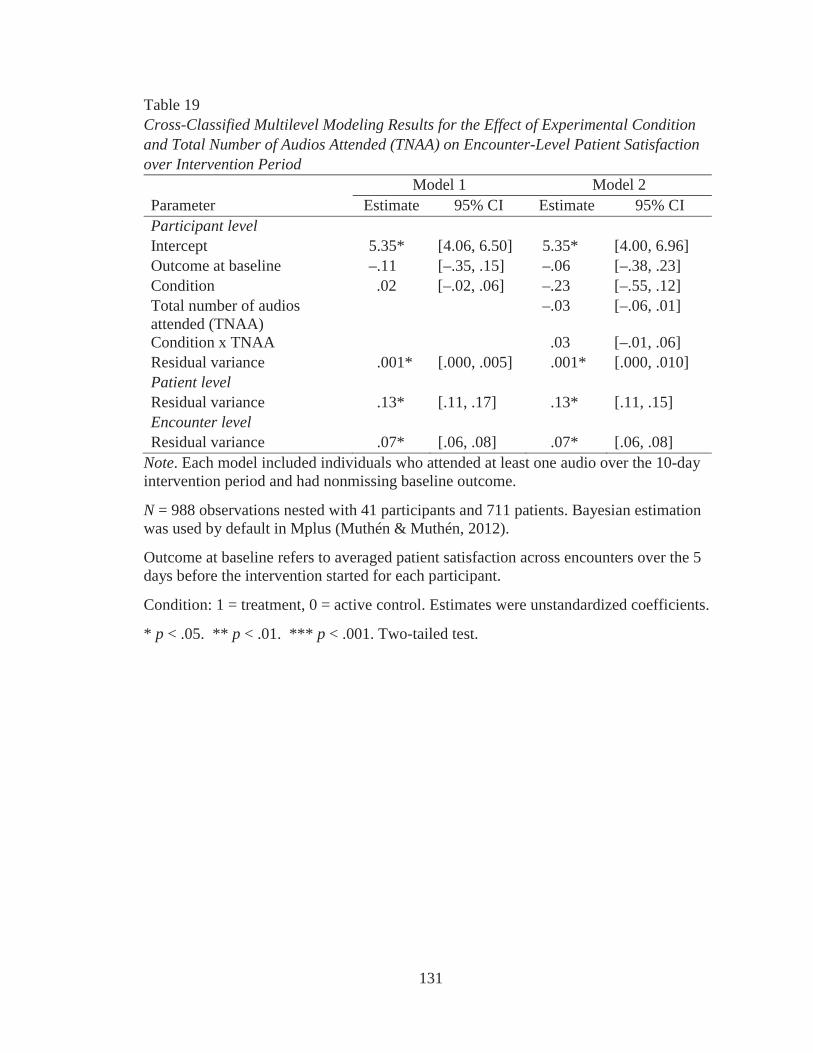
131
Table 19Cross-Classified Multilevel Modeling Results for the Effect of Experimental Condition and Total Number of Audios Attended (TNAA) on Encounter-Level Patient Satisfaction over Intervention Period
Model 1 Model 2Parameter Estimate 95% CI Estimate 95% CIParticipant levelIntercept 5.35* [4.06, 6.50] 5.35* [4.00, 6.96]Outcome at baseline –.11 [–.35, .15] –.06 [–.38, .23]Condition .02 [–.02, .06] –.23 [–.55, .12]Total number of audios attended (TNAA)
–.03 [–.06, .01]
Condition x TNAA .03 [–.01, .06]Residual variance .001* [.000, .005] .001* [.000, .010]Patient levelResidual variance .13* [.11, .17] .13* [.11, .15]Encounter levelResidual variance .07* [.06, .08] .07* [.06, .08]
Note. Each model included individuals who attended at least one audio over the 10-day intervention period and had nonmissing baseline outcome.
N = 988 observations nested with 41 participants and 711 patients. Bayesian estimation was used by default in Mplus (Muthén & Muthén, 2012).
Outcome at baseline refers to averaged patient satisfaction across encounters over the 5 days before the intervention started for each participant.
Condition: 1 = treatment, 0 = active control. Estimates were unstandardized coefficients.
* p < .05. ** p < .01. *** p < .001. Two-tailed test.
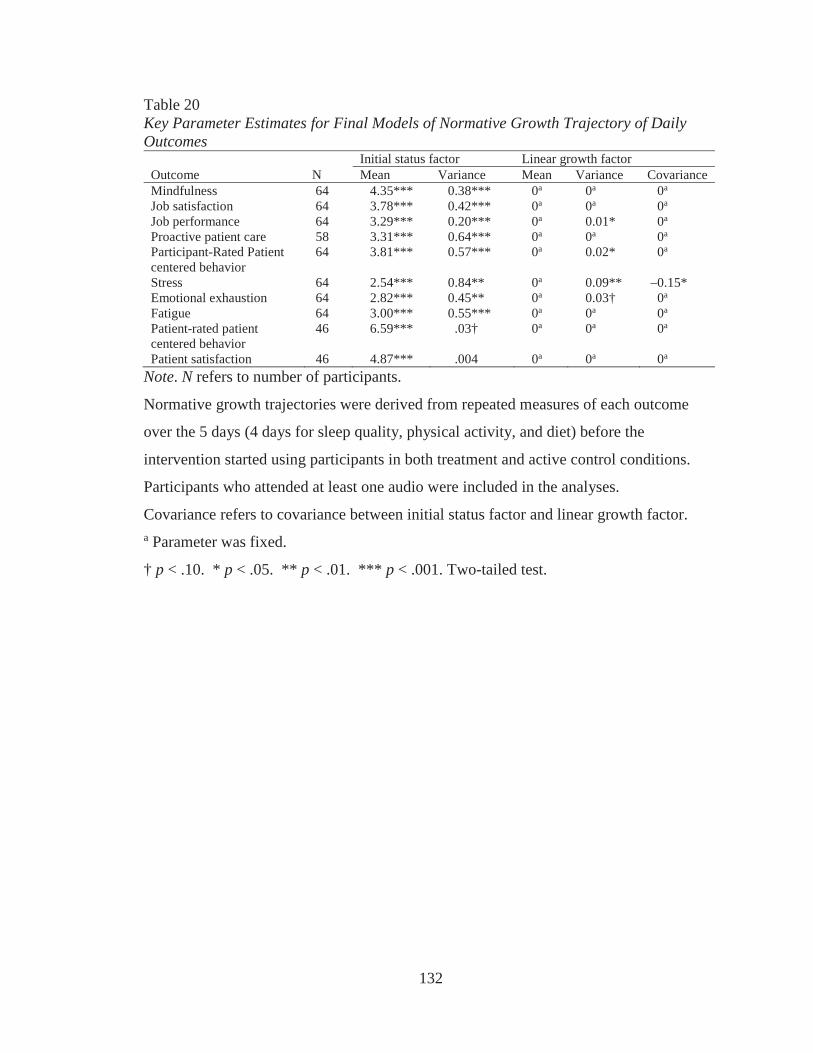
132
Table 20Key Parameter Estimates for Final Models of Normative Growth Trajectory of Daily Outcomes
Initial status factor Linear growth factorOutcome N Mean Variance Mean Variance CovarianceMindfulness 64 4.35*** 0.38*** 0a 0a 0a
Job satisfaction 64 3.78*** 0.42*** 0a 0a 0a
Job performance 64 3.29*** 0.20*** 0a 0.01* 0a
Proactive patient care 58 3.31*** 0.64*** 0a 0a 0a
Participant-Rated Patient centered behavior
64 3.81*** 0.57*** 0a 0.02* 0a
Stress 64 2.54*** 0.84** 0a 0.09** –0.15*Emotional exhaustion 64 2.82*** 0.45** 0a 0.03† 0a
Fatigue 64 3.00*** 0.55*** 0a 0a 0a
Patient-rated patient centered behavior
46 6.59*** .03† 0a 0a 0a
Patient satisfaction 46 4.87*** .004 0a 0a 0a
Note. N refers to number of participants.
Normative growth trajectories were derived from repeated measures of each outcome
over the 5 days (4 days for sleep quality, physical activity, and diet) before the
intervention started using participants in both treatment and active control conditions.
Participants who attended at least one audio were included in the analyses.
Covariance refers to covariance between initial status factor and linear growth factor. a Parameter was fixed.
† p < .10. * p < .05. ** p < .01. *** p < .001. Two-tailed test.
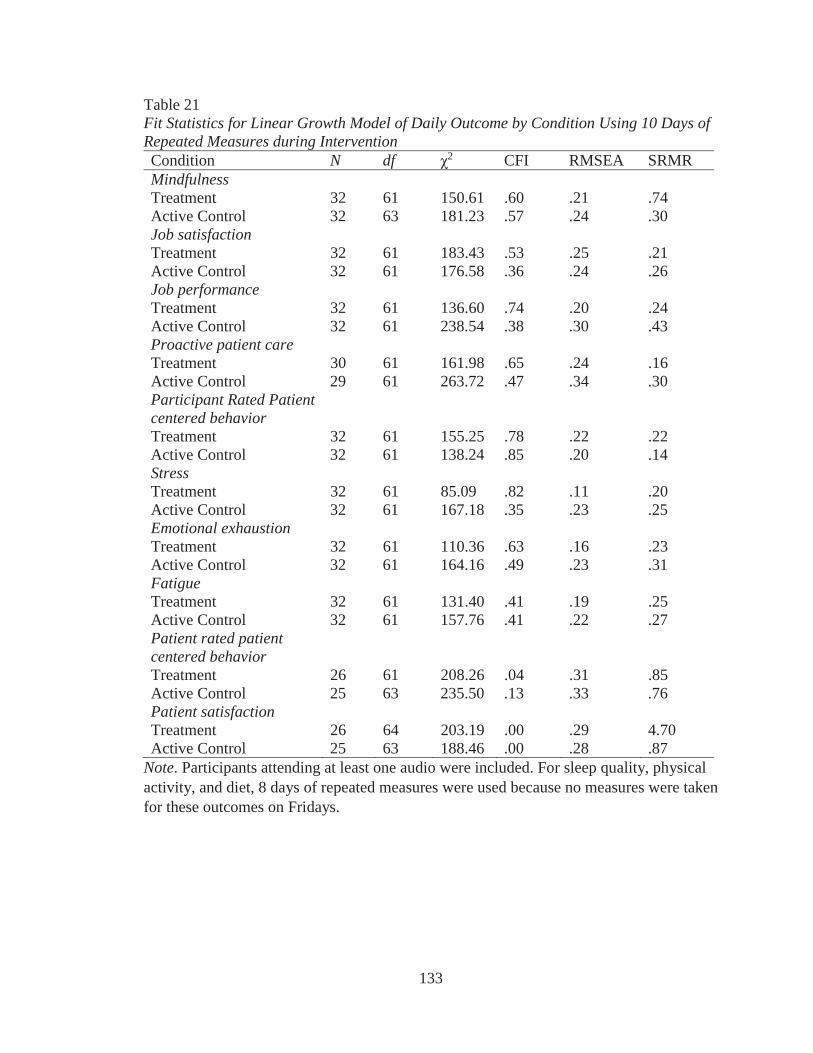
133
Table 21Fit Statistics for Linear Growth Model of Daily Outcome by Condition Using 10 Days of Repeated Measures during InterventionCondition N df 2 CFI RMSEA SRMRMindfulnessTreatment 32 61 150.61 .60 .21 .74Active Control 32 63 181.23 .57 .24 .30Job satisfactionTreatment 32 61 183.43 .53 .25 .21Active Control 32 61 176.58 .36 .24 .26Job performanceTreatment 32 61 136.60 .74 .20 .24Active Control 32 61 238.54 .38 .30 .43Proactive patient careTreatment 30 61 161.98 .65 .24 .16Active Control 29 61 263.72 .47 .34 .30Participant Rated Patient centered behaviorTreatment 32 61 155.25 .78 .22 .22Active Control 32 61 138.24 .85 .20 .14StressTreatment 32 61 85.09 .82 .11 .20Active Control 32 61 167.18 .35 .23 .25Emotional exhaustionTreatment 32 61 110.36 .63 .16 .23Active Control 32 61 164.16 .49 .23 .31FatigueTreatment 32 61 131.40 .41 .19 .25Active Control 32 61 157.76 .41 .22 .27Patient rated patient centered behaviorTreatment 26 61 208.26 .04 .31 .85Active Control 25 63 235.50 .13 .33 .76Patient satisfactionTreatment 26 64 203.19 .00 .29 4.70Active Control 25 63 188.46 .00 .28 .87
Note. Participants attending at least one audio were included. For sleep quality, physical activity, and diet, 8 days of repeated measures were used because no measures were taken for these outcomes on Fridays.
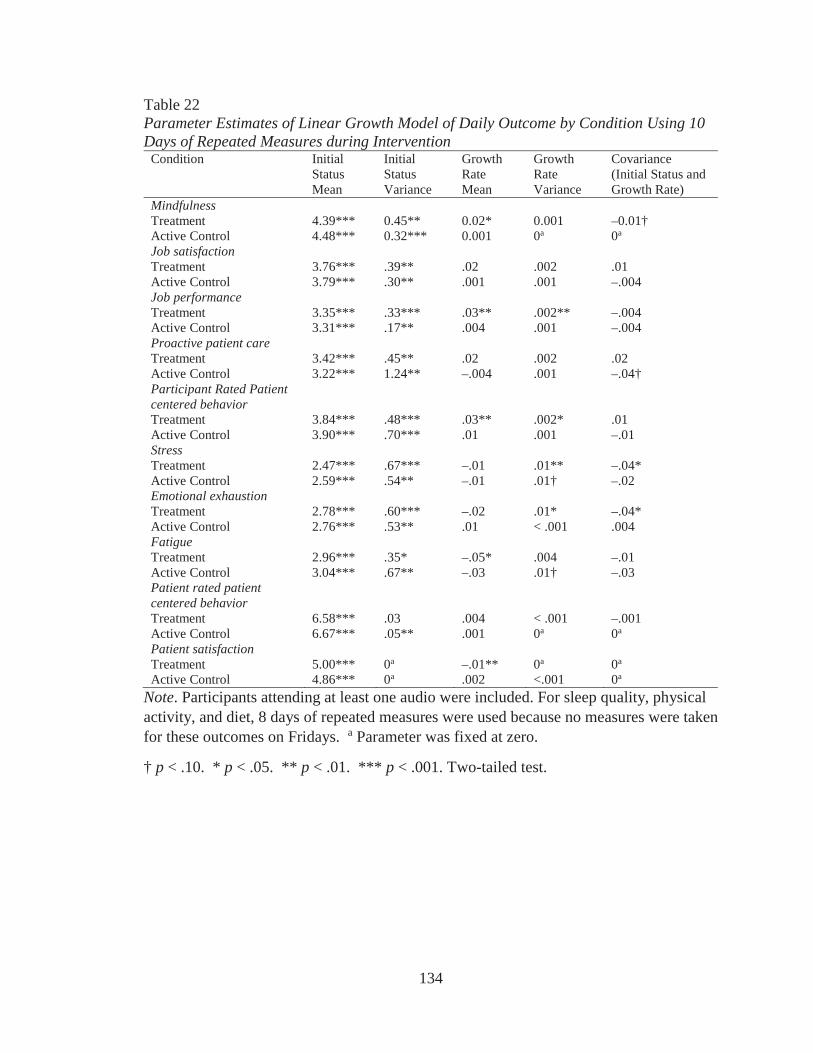
134
Table 22Parameter Estimates of Linear Growth Model of Daily Outcome by Condition Using 10 Days of Repeated Measures during Intervention
Condition Initial Status Mean
Initial Status Variance
Growth Rate Mean
Growth Rate Variance
Covariance (Initial Status and Growth Rate)
MindfulnessTreatment 4.39*** 0.45** 0.02* 0.001 –0.01†Active Control 4.48*** 0.32*** 0.001 0a 0a
Job satisfactionTreatment 3.76*** .39** .02 .002 .01Active Control 3.79*** .30** .001 .001 –.004Job performanceTreatment 3.35*** .33*** .03** .002** –.004Active Control 3.31*** .17** .004 .001 –.004Proactive patient careTreatment 3.42*** .45** .02 .002 .02Active Control 3.22*** 1.24** –.004 .001 –.04†Participant Rated Patient centered behaviorTreatment 3.84*** .48*** .03** .002* .01Active Control 3.90*** .70*** .01 .001 –.01StressTreatment 2.47*** .67*** –.01 .01** –.04*Active Control 2.59*** .54** –.01 .01† –.02Emotional exhaustionTreatment 2.78*** .60*** –.02 .01* –.04*Active Control 2.76*** .53** .01 < .001 .004FatigueTreatment 2.96*** .35* –.05* .004 –.01Active Control 3.04*** .67** –.03 .01† –.03Patient rated patient centered behaviorTreatment 6.58*** .03 .004 < .001 –.001Active Control 6.67*** .05** .001 0a 0a
Patient satisfactionTreatment 5.00*** 0a –.01** 0a 0a
Active Control 4.86*** 0a .002 <.001 0a
Note. Participants attending at least one audio were included. For sleep quality, physical activity, and diet, 8 days of repeated measures were used because no measures were taken for these outcomes on Fridays. a Parameter was fixed at zero.
† p < .10. * p < .05. ** p < .01. *** p < .001. Two-tailed test.
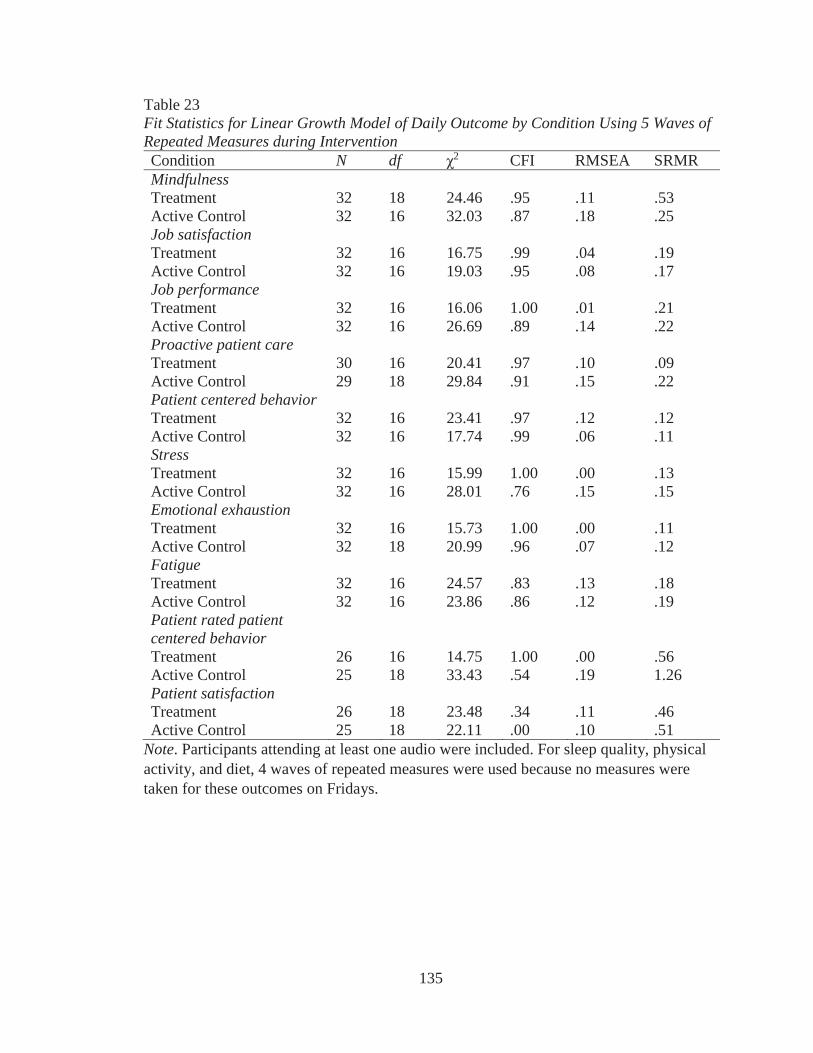
135
Table 23Fit Statistics for Linear Growth Model of Daily Outcome by Condition Using 5 Waves of Repeated Measures during InterventionCondition N df 2 CFI RMSEA SRMRMindfulnessTreatment 32 18 24.46 .95 .11 .53Active Control 32 16 32.03 .87 .18 .25Job satisfactionTreatment 32 16 16.75 .99 .04 .19Active Control 32 16 19.03 .95 .08 .17Job performanceTreatment 32 16 16.06 1.00 .01 .21Active Control 32 16 26.69 .89 .14 .22Proactive patient careTreatment 30 16 20.41 .97 .10 .09Active Control 29 18 29.84 .91 .15 .22Patient centered behaviorTreatment 32 16 23.41 .97 .12 .12Active Control 32 16 17.74 .99 .06 .11StressTreatment 32 16 15.99 1.00 .00 .13Active Control 32 16 28.01 .76 .15 .15Emotional exhaustionTreatment 32 16 15.73 1.00 .00 .11Active Control 32 18 20.99 .96 .07 .12FatigueTreatment 32 16 24.57 .83 .13 .18Active Control 32 16 23.86 .86 .12 .19Patient rated patient centered behaviorTreatment 26 16 14.75 1.00 .00 .56Active Control 25 18 33.43 .54 .19 1.26Patient satisfactionTreatment 26 18 23.48 .34 .11 .46Active Control 25 18 22.11 .00 .10 .51
Note. Participants attending at least one audio were included. For sleep quality, physical activity, and diet, 4 waves of repeated measures were used because no measures were taken for these outcomes on Fridays.
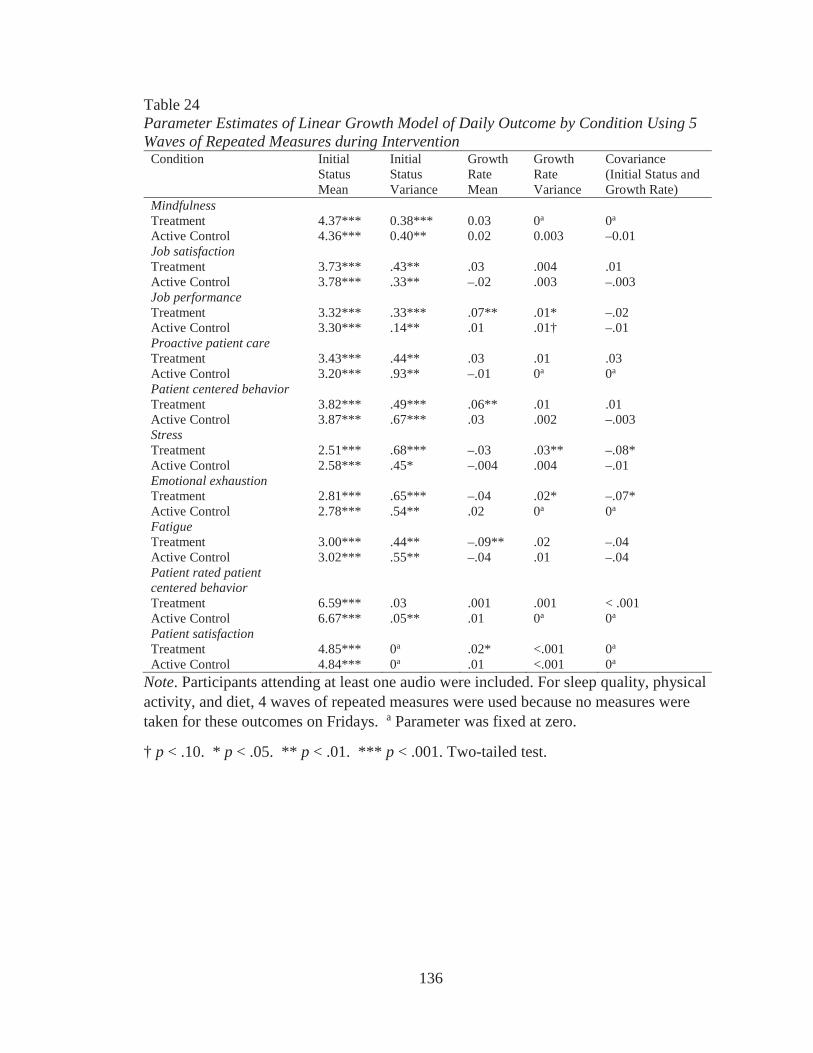
136
Table 24Parameter Estimates of Linear Growth Model of Daily Outcome by Condition Using 5 Waves of Repeated Measures during Intervention
Condition Initial Status Mean
Initial Status Variance
Growth Rate Mean
Growth Rate Variance
Covariance (Initial Status and Growth Rate)
MindfulnessTreatment 4.37*** 0.38*** 0.03 0a 0a
Active Control 4.36*** 0.40** 0.02 0.003 –0.01Job satisfactionTreatment 3.73*** .43** .03 .004 .01Active Control 3.78*** .33** –.02 .003 –.003Job performanceTreatment 3.32*** .33*** .07** .01* –.02Active Control 3.30*** .14** .01 .01† –.01Proactive patient careTreatment 3.43*** .44** .03 .01 .03Active Control 3.20*** .93** –.01 0a 0a
Patient centered behaviorTreatment 3.82*** .49*** .06** .01 .01Active Control 3.87*** .67*** .03 .002 –.003StressTreatment 2.51*** .68*** –.03 .03** –.08*Active Control 2.58*** .45* –.004 .004 –.01Emotional exhaustionTreatment 2.81*** .65*** –.04 .02* –.07*Active Control 2.78*** .54** .02 0a 0a
FatigueTreatment 3.00*** .44** –.09** .02 –.04Active Control 3.02*** .55** –.04 .01 –.04Patient rated patient centered behaviorTreatment 6.59*** .03 .001 .001 < .001Active Control 6.67*** .05** .01 0a 0a
Patient satisfactionTreatment 4.85*** 0a .02* <.001 0a
Active Control 4.84*** 0a .01 <.001 0a
Note. Participants attending at least one audio were included. For sleep quality, physical activity, and diet, 4 waves of repeated measures were used because no measures were taken for these outcomes on Fridays. a Parameter was fixed at zero.
† p < .10. * p < .05. ** p < .01. *** p < .001. Two-tailed test.
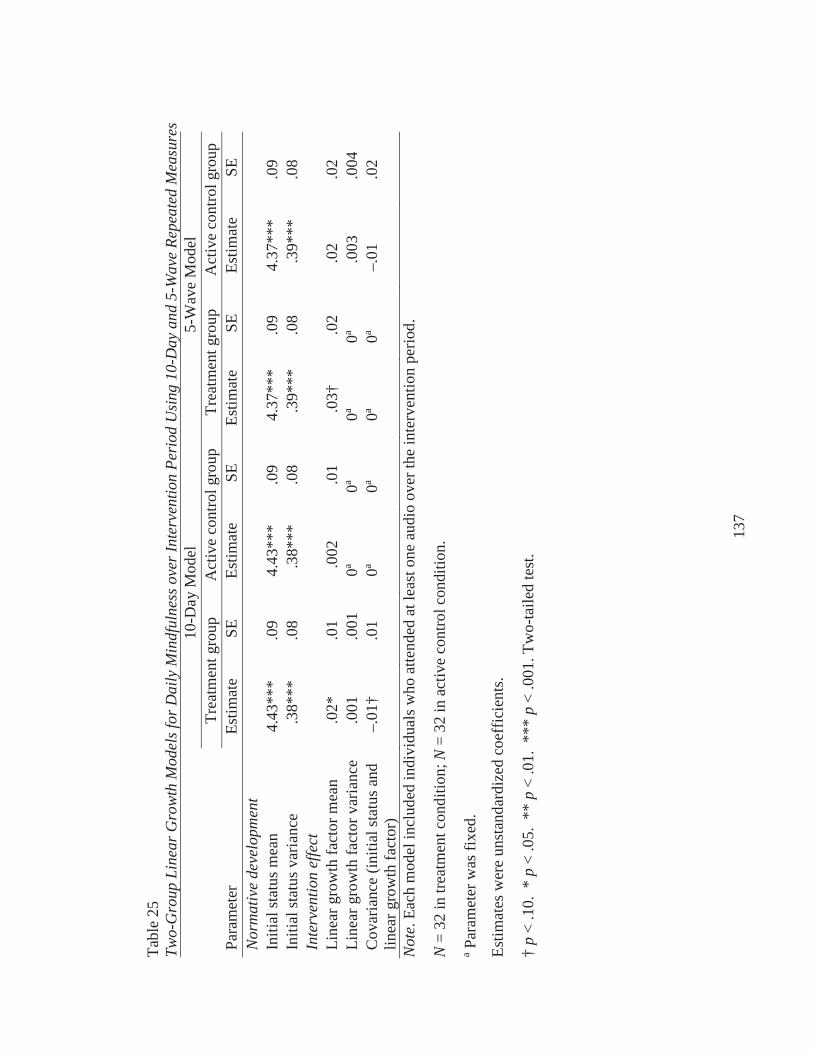
137
Tabl
e 25
Two-
Gro
up L
inea
r Gro
wth
Mod
els f
or D
aily
Min
dful
ness
ove
r Int
erve
ntio
n Pe
riod
Usi
ng 1
0-D
ay a
nd 5
-Wav
e Re
peat
ed M
easu
res
10-D
ay M
odel
5-W
ave
Mod
elTr
eatm
ent g
roup
Act
ive
cont
rol g
roup
Trea
tmen
t gro
upA
ctiv
e co
ntro
l gro
upPa
ram
eter
Estim
ate
SEEs
timat
eSE
Estim
ate
SEEs
timat
eSE
Nor
mat
ive
deve
lopm
ent
Initi
al st
atus
mea
n4.
43**
*.0
94.
43**
*.0
94.
37**
*.0
94.
37**
*.0
9In
itial
stat
us v
aria
nce
.38*
**.0
8.3
8***
.08
.39*
**.0
8.3
9***
.08
Inte
rven
tion
effe
ctLi
near
gro
wth
fact
or m
ean
.02*
.01
.002
.01
.03†
.02
.02
.02
Line
ar g
row
th fa
ctor
var
ianc
e.0
01.0
010a
0a0a
0a.0
03.0
04C
ovar
ianc
e (in
itial
stat
us a
nd
linea
r gro
wth
fact
or)
–.01
†.0
10a
0a0a
0a–.
01.0
2
Not
e. E
ach
mod
el in
clud
ed in
divi
dual
s who
atte
nded
at l
east
one
aud
io o
ver t
he in
terv
entio
n pe
riod.
N=
32 in
trea
tmen
t con
ditio
n; N
= 32
in a
ctiv
e co
ntro
l con
ditio
n.
aPa
ram
eter
was
fixe
d.
Estim
ates
wer
e un
stan
dard
ized
coe
ffic
ient
s.
†p
< .1
0. *
p<
.05.
**
p<
.01.
***
p<
.001
. Tw
o-ta
iled
test
.
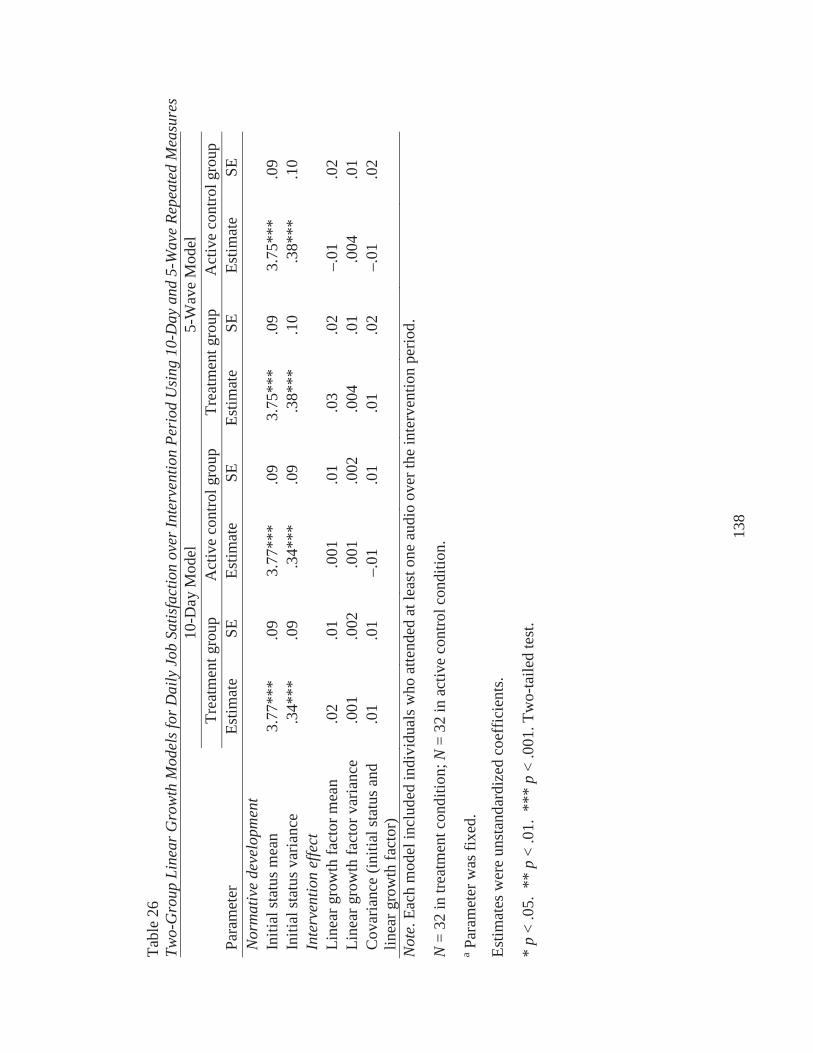
138
Tabl
e 26
Two-
Gro
up L
inea
r Gro
wth
Mod
els f
or D
aily
Job
Sat
isfa
ctio
n ov
er In
terv
entio
n Pe
riod
Usi
ng 1
0-D
ay a
nd 5
-Wav
e Re
peat
ed M
easu
res
10-D
ay M
odel
5-W
ave
Mod
elTr
eatm
ent g
roup
Act
ive
cont
rol g
roup
Trea
tmen
t gro
upA
ctiv
e co
ntro
l gro
upPa
ram
eter
Estim
ate
SEEs
timat
eSE
Estim
ate
SEEs
timat
eSE
Nor
mat
ive
deve
lopm
ent
Initi
al st
atus
mea
n3.
77**
*.0
93.
77**
*.0
93.
75**
*.0
93.
75**
*.0
9In
itial
stat
us v
aria
nce
.34*
**.0
9.3
4***
.09
.38*
**.1
0.3
8***
.10
Inte
rven
tion
effe
ctLi
near
gro
wth
fact
or m
ean
.02
.01
.001
.01
.03
.02
–.01
.02
Line
ar g
row
th fa
ctor
var
ianc
e.0
01.0
02.0
01.0
02.0
04.0
1.0
04.0
1C
ovar
ianc
e (in
itial
stat
us a
nd
linea
r gro
wth
fact
or)
.01
.01
–.01
.01
.01
.02
–.01
.02
Not
e. E
ach
mod
el in
clud
ed in
divi
dual
s who
atte
nded
at l
east
one
aud
io o
ver t
he in
terv
entio
n pe
riod.
N=
32 in
trea
tmen
t con
ditio
n; N
= 32
in a
ctiv
e co
ntro
l con
ditio
n.
aPa
ram
eter
was
fixe
d.
Estim
ates
wer
e un
stan
dard
ized
coe
ffic
ient
s.
*p
<.0
5. *
* p
< .0
1. *
** p
< .0
01. T
wo-
taile
d te
st.
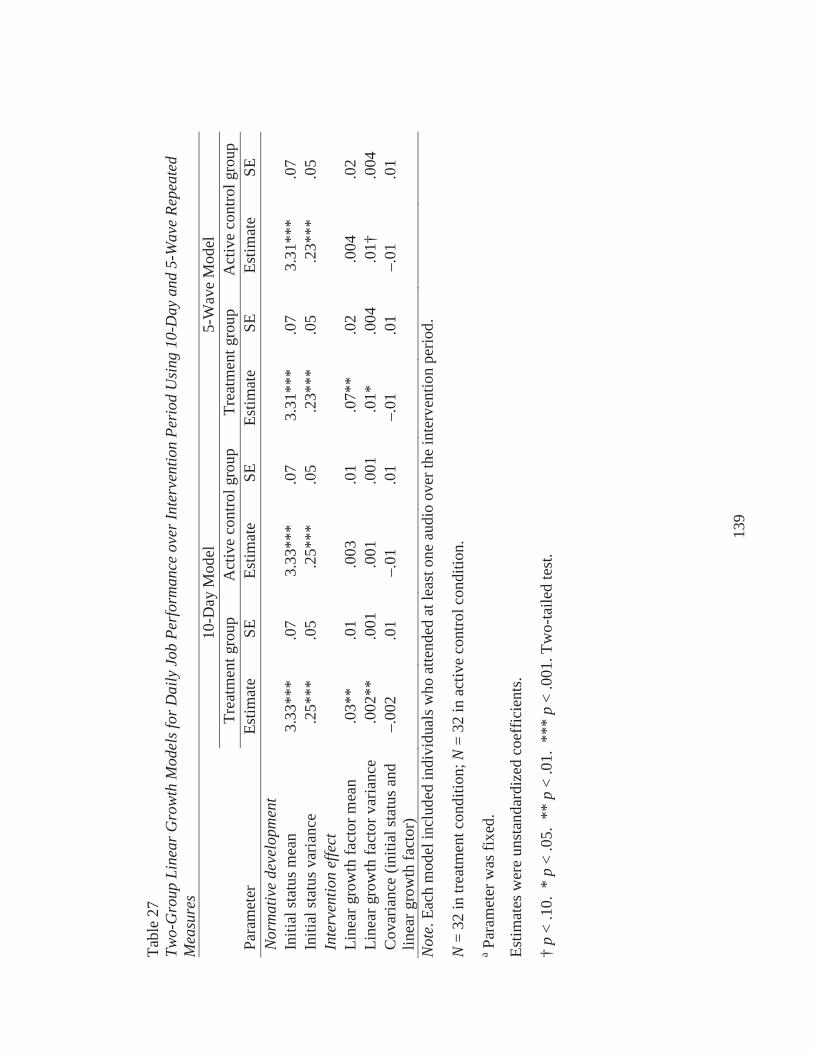
139
Tabl
e 27
Two-
Gro
up L
inea
r Gro
wth
Mod
els f
or D
aily
Job
Per
form
ance
ove
r Int
erve
ntio
n Pe
riod
Usi
ng 1
0-D
ay a
nd 5
-Wav
e Re
peat
ed
Mea
sure
s10
-Day
Mod
el5-
Wav
e M
odel
Trea
tmen
t gro
upA
ctiv
e co
ntro
l gro
upTr
eatm
ent g
roup
Act
ive
cont
rol g
roup
Para
met
erEs
timat
eSE
Estim
ate
SEEs
timat
eSE
Estim
ate
SEN
orm
ativ
e de
velo
pmen
tIn
itial
stat
us m
ean
3.33
***
.07
3.33
***
.07
3.31
***
.07
3.31
***
.07
Initi
al st
atus
var
ianc
e.2
5***
.05
.25*
**.0
5.2
3***
.05
.23*
**.0
5In
terv
entio
n ef
fect
Line
ar g
row
th fa
ctor
mea
n.0
3**
.01
.003
.01
.07*
*.0
2.0
04.0
2Li
near
gro
wth
fact
or v
aria
nce
.002
**.0
01.0
01.0
01.0
1*.0
04.0
1†.0
04C
ovar
ianc
e (in
itial
stat
us a
nd
linea
r gro
wth
fact
or)
–.00
2.0
1–.
01.0
1–.
01.0
1–.
01.0
1
Not
e. E
ach
mod
el in
clud
ed in
divi
dual
s who
atte
nded
at l
east
one
aud
io o
ver t
he in
terv
entio
n pe
riod.
N=
32 in
trea
tmen
t con
ditio
n; N
= 32
in a
ctiv
e co
ntro
l con
ditio
n.
aPa
ram
eter
was
fixe
d.
Estim
ates
wer
e un
stan
dard
ized
coe
ffic
ient
s.
†p
< .1
0. *
p<
.05.
**
p<
.01.
***
p<
.001
. Tw
o-ta
iled
test
.

140
Tabl
e 28
Two-
Gro
up L
inea
r Gro
wth
Mod
els f
or D
aily
Pro
activ
e Pa
tient
Car
e ov
er In
terv
entio
n Pe
riod
Usi
ng 1
0-D
ay a
nd 5
-Wav
e Re
peat
ed
Mea
sure
s10
-Day
Mod
el5-
Wav
e M
odel
Trea
tmen
t gro
upA
ctiv
e co
ntro
l gro
upTr
eatm
ent g
roup
Act
ive
cont
rol g
roup
Para
met
erEs
timat
eSE
Estim
ate
SEEs
timat
eSE
Estim
ate
SEN
orm
ativ
e de
velo
pmen
tIn
itial
stat
us m
ean
3.33
***
.13
3.33
***
.13
3.32
***
.12
3.32
***
.12
Initi
al st
atus
var
ianc
e.8
3***
.18
.83*
**.1
8.6
9***
.15
.69*
**.1
5In
terv
entio
n ef
fect
Line
ar g
row
th fa
ctor
mea
n.0
2.0
2–.
01.0
1.0
3.0
3–.
01.0
3Li
near
gro
wth
fact
or v
aria
nce
.002
.002
.001
.001
.01
.01
0a0a
Cov
aria
nce
(initi
al st
atus
and
lin
ear g
row
th fa
ctor
).0
2.0
2–.
02.0
1.0
3.0
30a
0a
Not
e. E
ach
mod
el in
clud
ed in
divi
dual
s who
atte
nded
at l
east
one
aud
io o
ver t
he in
terv
entio
n pe
riod.
N=
30 in
trea
tmen
t con
ditio
n; N
= 29
in a
ctiv
e co
ntro
l con
ditio
n.
aPa
ram
eter
was
fixe
d.
Estim
ates
wer
e un
stan
dard
ized
coe
ffic
ient
s.
*p
< .0
5. *
* p
< .0
1. *
** p
< .0
01. T
wo-
taile
d te
st.
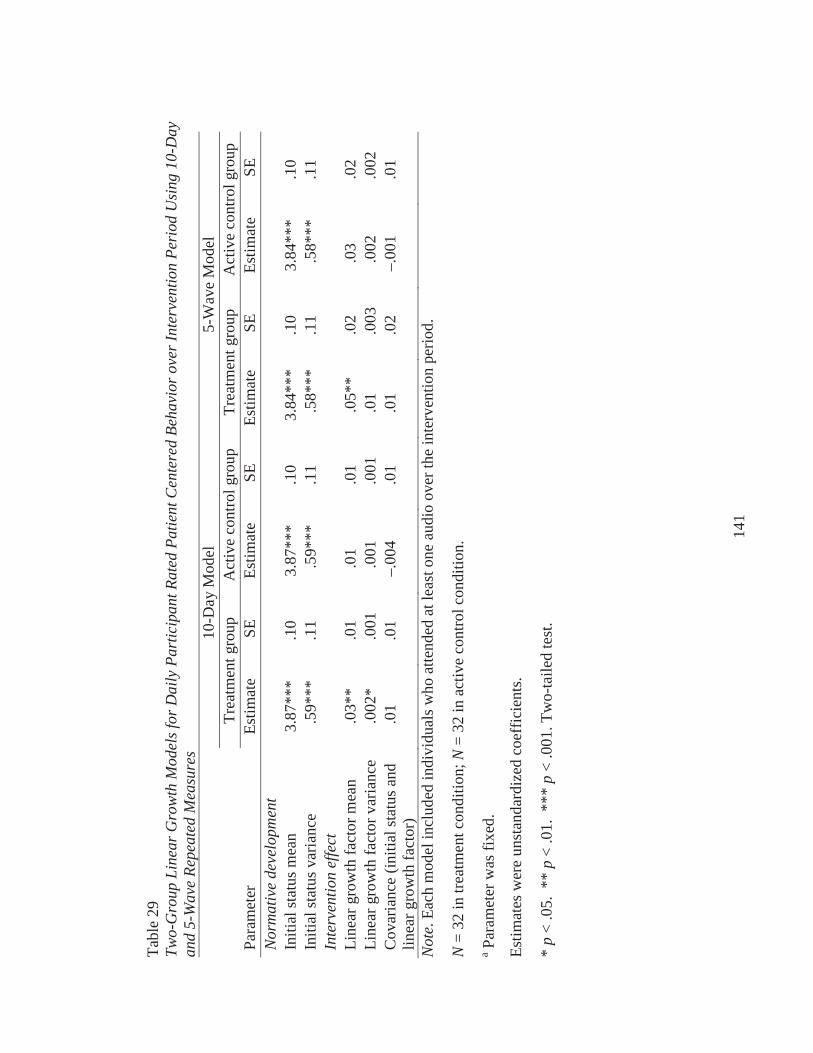
141
Tabl
e 29
Two-
Gro
up L
inea
r Gro
wth
Mod
els f
or D
aily
Par
ticip
ant R
ated
Pat
ient
Cen
tere
d Be
havi
or o
ver I
nter
vent
ion
Peri
od U
sing
10-
Day
an
d 5-
Wav
e Re
peat
ed M
easu
res
10-D
ay M
odel
5-W
ave
Mod
elTr
eatm
ent g
roup
Act
ive
cont
rol g
roup
Trea
tmen
t gro
upA
ctiv
e co
ntro
l gro
upPa
ram
eter
Estim
ate
SEEs
timat
eSE
Estim
ate
SEEs
timat
eSE
Nor
mat
ive
deve
lopm
ent
Initi
al st
atus
mea
n3.
87**
*.1
03.
87**
*.1
03.
84**
*.1
03.
84**
*.1
0In
itial
stat
us v
aria
nce
.59*
**.1
1.5
9***
.11
.58*
**.1
1.5
8***
.11
Inte
rven
tion
effe
ctLi
near
gro
wth
fact
or m
ean
.03*
*.0
1.0
1.0
1.0
5**
.02
.03
.02
Line
ar g
row
th fa
ctor
var
ianc
e.0
02*
.001
.001
.001
.01
.003
.002
.002
Cov
aria
nce
(initi
al st
atus
and
lin
ear g
row
th fa
ctor
).0
1.0
1–.
004
.01
.01
.02
–.00
1.0
1
Not
e. E
ach
mod
el in
clud
ed in
divi
dual
s who
atte
nded
at l
east
one
aud
io o
ver t
he in
terv
entio
n pe
riod.
N=
32 in
trea
tmen
t con
ditio
n; N
= 32
in a
ctiv
e co
ntro
l con
ditio
n.
aPa
ram
eter
was
fixe
d.
Estim
ates
wer
e un
stan
dard
ized
coe
ffic
ient
s.
*p
< .0
5. *
* p
< .0
1. *
** p
< .0
01. T
wo-
taile
d te
st.

142
Tabl
e 30
Two-
Gro
up L
inea
r Gro
wth
Mod
els f
or D
aily
Str
ess o
ver I
nter
vent
ion
Peri
od U
sing
10-
Day
and
5-W
ave
Repe
ated
Mea
sure
s10
-Day
Mod
el5-
Wav
e M
odel
Trea
tmen
t gro
upA
ctiv
e co
ntro
l gro
upTr
eatm
ent g
roup
Act
ive
cont
rol g
roup
Para
met
erEs
timat
eSE
Estim
ate
SEEs
timat
eSE
Estim
ate
SEN
orm
ativ
e de
velo
pmen
tIn
itial
stat
us m
ean
2.53
***
.11
2.53
***
.11
2.54
***
.11
2.54
***
.11
Initi
al st
atus
var
ianc
e.6
2***
.13
.62*
**.1
3.6
0***
.13
.60*
**.1
3In
terv
entio
n ef
fect
Line
ar g
row
th fa
ctor
mea
n–.
01.0
2–.
001
.02
–.03
.04
< .0
01.0
3Li
near
gro
wth
fact
or v
aria
nce
.01*
*.0
03.0
1†.0
03.0
3**
.01
.01
.01
Cov
aria
nce
(initi
al st
atus
and
lin
earg
row
th fa
ctor
)–.
04*
.02
–.02
.02
–.07
*.0
3–.
03.0
4
Not
e. E
ach
mod
el in
clud
ed in
divi
dual
s who
atte
nded
at l
east
one
aud
io o
ver t
he in
terv
entio
n pe
riod.
N=
32 in
trea
tmen
t con
ditio
n; N
= 32
in a
ctiv
e co
ntro
l con
ditio
n.
aPa
ram
eter
was
fixe
d.
Estim
ates
wer
e un
stan
dard
ized
coe
ffic
ient
s.
†p
< .1
0. *
p<
.05.
**
p<
.01.
***
p<
.001
. Tw
o-ta
iled
test
.
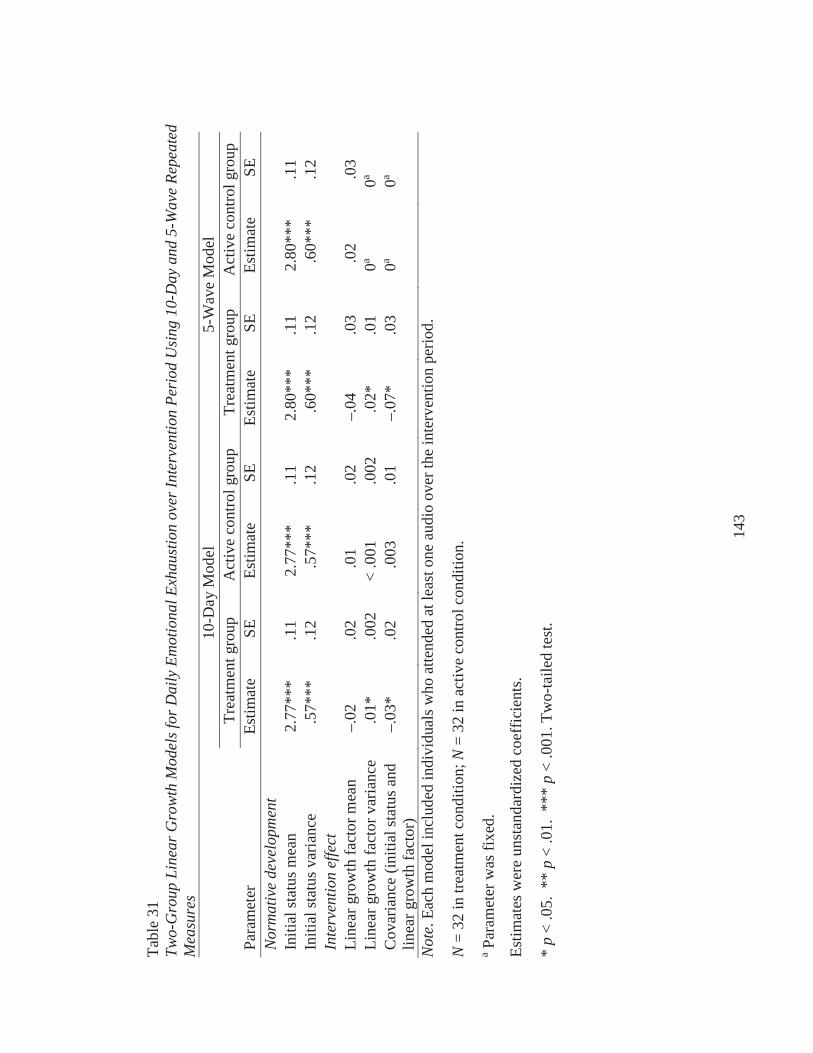
143
Tabl
e 31
Two-
Gro
up L
inea
r Gro
wth
Mod
els f
or D
aily
Em
otio
nal E
xhau
stio
n ov
er In
terv
entio
n Pe
riod
Usi
ng 1
0-D
ay a
nd 5
-Wav
e Re
peat
ed
Mea
sure
s10
-Day
Mod
el5-
Wav
e M
odel
Trea
tmen
t gro
upA
ctiv
e co
ntro
l gro
upTr
eatm
ent g
roup
Act
ive
cont
rol g
roup
Para
met
erEs
timat
eSE
Estim
ate
SEEs
timat
eSE
Estim
ate
SEN
orm
ativ
e de
velo
pmen
tIn
itial
stat
us m
ean
2.77
***
.11
2.77
***
.11
2.80
***
.11
2.80
***
.11
Initi
al st
atus
var
ianc
e.5
7***
.12
.57*
**.1
2.6
0***
.12
.60*
**.1
2In
terv
entio
n ef
fect
Line
ar g
row
th fa
ctor
mea
n–.
02.0
2.0
1.0
2–.
04.0
3.0
2.0
3Li
near
gro
wth
fact
or v
aria
nce
.01*
.002
< .0
01.0
02.0
2*.0
10a
0a
Cov
aria
nce
(initi
al st
atus
and
lin
ear g
row
th fa
ctor
)–.
03*
.02
.003
.01
–.07
*.0
30a
0a
Not
e. E
ach
mod
el in
clud
ed in
divi
dual
s who
atte
nded
at l
east
one
aud
io o
ver t
he in
terv
entio
n pe
riod.
N=
32 in
trea
tmen
t con
ditio
n; N
= 32
in a
ctiv
e co
ntro
l con
ditio
n.
aPa
ram
eter
was
fixe
d.
Estim
ates
wer
e un
stan
dard
ized
coe
ffic
ient
s.
*p
< .0
5. *
* p
< .0
1. *
** p
< .0
01. T
wo-
taile
d te
st.
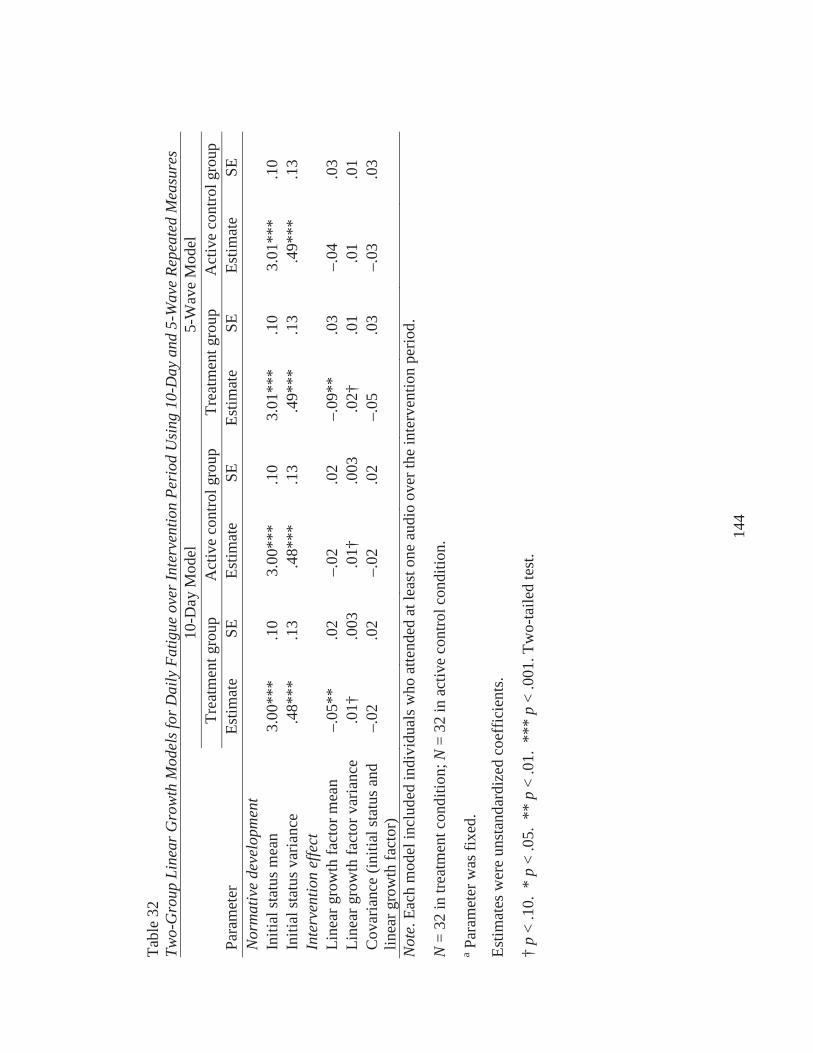
144
Tabl
e 32
Two-
Gro
up L
inea
r Gro
wth
Mod
els f
or D
aily
Fat
igue
ove
r Int
erve
ntio
n Pe
riod
Usi
ng 1
0-D
ay a
nd 5
-Wav
e Re
peat
ed M
easu
res
10-D
ay M
odel
5-W
ave
Mod
elTr
eatm
ent g
roup
Act
ive
cont
rol g
roup
Trea
tmen
t gro
upA
ctiv
e co
ntro
l gro
upPa
ram
eter
Estim
ate
SEEs
timat
eSE
Estim
ate
SEEs
timat
eSE
Nor
mat
ive
deve
lopm
ent
Initi
al st
atus
mea
n3.
00**
*.1
03.
00**
*.1
03.
01**
*.1
03.
01**
*.1
0In
itial
stat
us v
aria
nce
.48*
**.1
3.4
8***
.13
.49*
**.1
3.4
9***
.13
Inte
rven
tion
effe
ctLi
near
gro
wth
fact
or m
ean
–.05
**.0
2–.
02.0
2–.
09**
.03
–.04
.03
Line
ar g
row
th fa
ctor
var
ianc
e.0
1†.0
03.0
1†.0
03.0
2†.0
1.0
1.0
1C
ovar
ianc
e (in
itial
stat
us a
nd
linea
r gro
wth
fact
or)
–.02
.02
–.02
.02
–.05
.03
–.03
.03
Not
e. E
ach
mod
el in
clud
ed in
divi
dual
s who
atte
nded
at l
east
one
aud
io o
ver t
he in
terv
entio
n pe
riod.
N=
32 in
trea
tmen
t con
ditio
n; N
= 32
in a
ctiv
e co
ntro
l con
ditio
n.
aPa
ram
eter
was
fixe
d.
Estim
ates
wer
e un
stan
dard
ized
coe
ffic
ient
s.
†p
< .1
0. *
p<
.05.
**
p<
.01.
***
p<
.001
. Tw
o-ta
iled
test
.
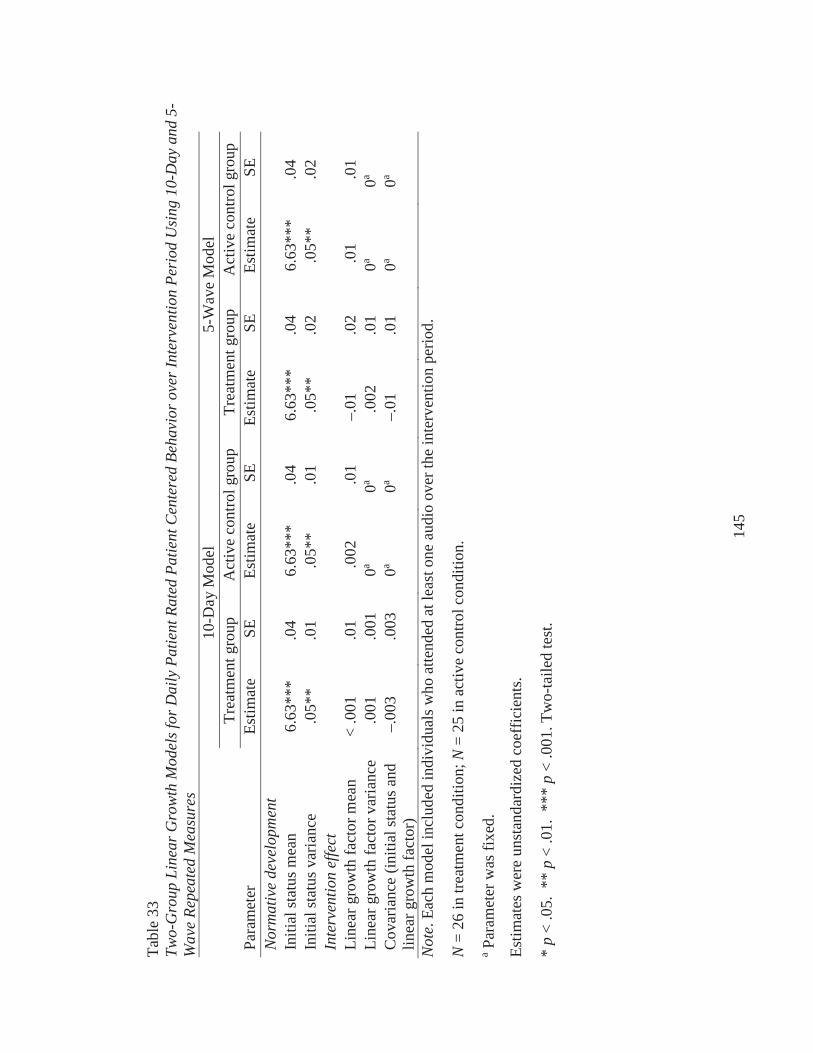
145
Tabl
e 33
Two-
Gro
up L
inea
r Gro
wth
Mod
els f
or D
aily
Pat
ient
Rat
ed P
atie
nt C
ente
red
Beha
vior
ove
r Int
erve
ntio
n Pe
riod
Usi
ng 1
0-D
ay a
nd 5
-W
ave
Repe
ated
Mea
sure
s10
-Day
Mod
el5-
Wav
e M
odel
Trea
tmen
t gro
upA
ctiv
e co
ntro
l gro
upTr
eatm
ent g
roup
Act
ive
cont
rol g
roup
Para
met
erEs
timat
eSE
Estim
ate
SEEs
timat
eSE
Estim
ate
SEN
orm
ativ
e de
velo
pmen
tIn
itial
stat
us m
ean
6.63
***
.04
6.63
***
.04
6.63
***
.04
6.63
***
.04
Initi
al st
atus
var
ianc
e.0
5**
.01
.05*
*.0
1.0
5**
.02
.05*
*.0
2In
terv
entio
n ef
fect
Line
ar g
row
th fa
ctor
mea
n<
.001
.01
.002
.01
–.01
.02
.01
.01
Line
ar g
row
th fa
ctor
var
ianc
e.0
01.0
010a
0a.0
02.0
10a
0a
Cov
aria
nce
(initi
al st
atus
and
lin
ear g
row
th fa
ctor
)–.
003
.003
0a0a
–.01
.01
0a0a
Not
e. E
ach
mod
el in
clud
ed in
divi
dual
s who
atte
nded
at l
east
one
aud
io o
ver t
he in
terv
entio
n pe
riod.
N=
26 in
trea
tmen
t con
ditio
n; N
= 25
in a
ctiv
e co
ntro
l con
ditio
n.
aPa
ram
eter
was
fixe
d.
Estim
ates
wer
e un
stan
dard
ized
coe
ffic
ient
s.
*p
< .0
5. *
* p
< .0
1. *
** p
< .0
01. T
wo-
taile
d te
st.
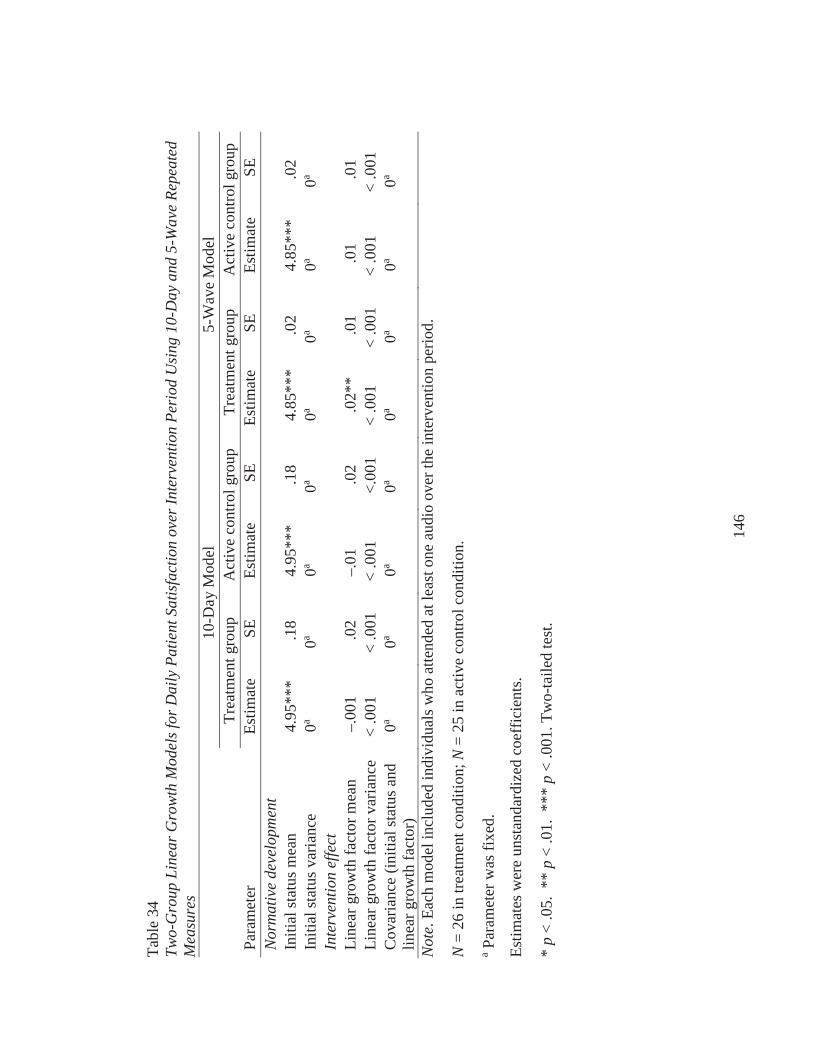
146
Tabl
e 34
Two-
Gro
up L
inea
r Gro
wth
Mod
els f
or D
aily
Pat
ient
Sat
isfa
ctio
n ov
er In
terv
entio
n Pe
riod
Usi
ng 1
0-D
ay a
nd 5
-Wav
e Re
peat
ed
Mea
sure
s10
-Day
Mod
el5-
Wav
e M
odel
Trea
tmen
t gro
upA
ctiv
e co
ntro
l gro
upTr
eatm
ent g
roup
Act
ive
cont
rol g
roup
Para
met
erEs
timat
eSE
Estim
ate
SEEs
timat
eSE
Estim
ate
SEN
orm
ativ
e de
velo
pmen
tIn
itial
stat
us m
ean
4.95
***
.18
4.95
***
.18
4.85
***
.02
4.85
***
.02
Initi
al st
atus
var
ianc
e0a
0a0a
0a0a
0a0a
0a
Inte
rven
tion
effe
ctLi
near
gro
wth
fact
or m
ean
–.00
1.0
2–.
01.0
2.0
2**
.01
.01
.01
Line
ar g
row
th fa
ctor
var
ianc
e<
.001
< .0
01<
.001
<.00
1<
.001
< .0
01<
.001
< .0
01C
ovar
ianc
e (in
itial
stat
us a
nd
linea
r gro
wth
fact
or)
0a0a
0a0a
0a0a
0a0a
Not
e. E
ach
mod
el in
clud
ed in
divi
dual
s who
atte
nded
at l
east
one
aud
io o
ver t
he in
terv
entio
n pe
riod.
N=
26 in
trea
tmen
t con
ditio
n; N
= 25
in a
ctiv
e co
ntro
l con
ditio
n.
aPa
ram
eter
was
fixe
d.
Estim
ates
wer
e un
stan
dard
ized
coe
ffic
ient
s.
*p
< .0
5. *
* p
< .0
1. *
** p
< .0
01. T
wo-
taile
d te
st.
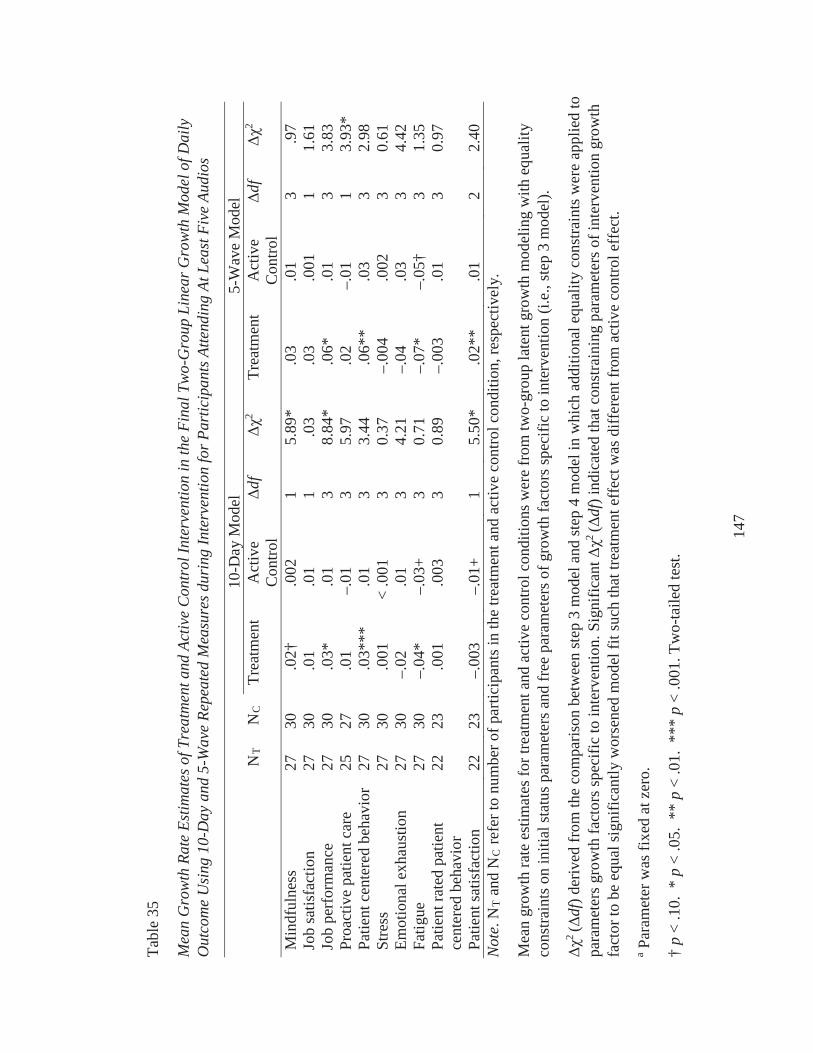
147
Tabl
e 35
Mea
n G
row
th R
ate
Estim
ates
of T
reat
men
t and
Act
ive
Con
trol
Inte
rven
tion
in th
e Fi
nal T
wo-
Gro
up L
inea
r Gro
wth
Mod
el o
f Dai
ly
Out
com
e U
sing
10-
Day
and
5-W
ave
Repe
ated
Mea
sure
s dur
ing
Inte
rven
tion
for P
artic
ipan
ts A
ttend
ing
At L
east
Fiv
e Au
dios
10-D
ay M
odel
5-W
ave
Mod
elN
TN
CTr
eatm
ent
Act
ive
Con
trol
df2
Trea
tmen
tA
ctiv
e C
ontro
ldf
2
Min
dful
ness
2730
.02†
.002
15.
89*
.03
.01
3.9
7Jo
b sa
tisfa
ctio
n27
30.0
1.0
11
.03
.03
.001
11.
61Jo
b pe
rfor
man
ce27
30.0
3*.0
13
8.84
*.0
6*.0
13
3.83
Proa
ctiv
e pa
tient
car
e25
27.0
1–.
013
5.97
.02
–.01
13.
93*
Patie
nt c
ente
red
beha
vior
2730
.03*
**.0
13
3.44
.06*
*.0
33
2.98
Stre
ss27
30.0
01<
.001
30.
37–.
004
.002
30.
61Em
otio
nal e
xhau
stio
n27
30–.
02.0
13
4.21
–.04
.03
34.
42Fa
tigue
2730
–.04
*–.
03+
30.
71–.
07*
–.05
†3
1.35
Patie
nt ra
ted
patie
nt
cent
ered
beh
avio
r22
23.0
01.0
033
0.89
–.00
3.0
13
0.97
Patie
nt sa
tisfa
ctio
n22
23–.
003
–.01
+1
5.50
*.0
2**
.01
22.
40N
ote.
NT
and
NC
refe
r to
num
ber o
f par
ticip
ants
in th
e tre
atm
ent a
nd a
ctiv
e co
ntro
l con
ditio
n, re
spec
tivel
y.
Mea
n gr
owth
rate
est
imat
es fo
r tre
atm
ent a
nd a
ctiv
e co
ntro
l con
ditio
ns w
ere
from
two-
grou
p la
tent
gro
wth
mod
elin
g w
ith e
qual
ity
cons
train
ts o
n in
itial
stat
us p
aram
eter
s and
free
par
amet
ers o
f gro
wth
fact
ors s
peci
fic to
inte
rven
tion
(i.e.
, ste
p 3
mod
el).
2(
df) d
eriv
ed fr
om th
e co
mpa
rison
bet
wee
n st
ep 3
mod
el a
nd st
ep 4
mod
el in
whi
ch a
dditi
onal
equ
ality
con
stra
ints
wer
e ap
plie
d to
pa
ram
eter
s gro
wth
fact
ors s
peci
fic to
inte
rven
tion.
Sig
nific
ant
2(
df) i
ndic
ated
that
con
stra
inin
g pa
ram
eter
s of i
nter
vent
ion
grow
th
fact
or to
be
equa
l sig
nific
antly
wor
sene
d m
odel
fit s
uch
that
trea
tmen
t eff
ect w
as d
iffer
ent f
rom
act
ive
cont
rol e
ffec
t. a
Para
met
er w
as fi
xed
at z
ero.
†p
< .1
0. *
p<
.05.
**
p<
.01.
***
p<
.001
. Tw
o-ta
iled
test
.
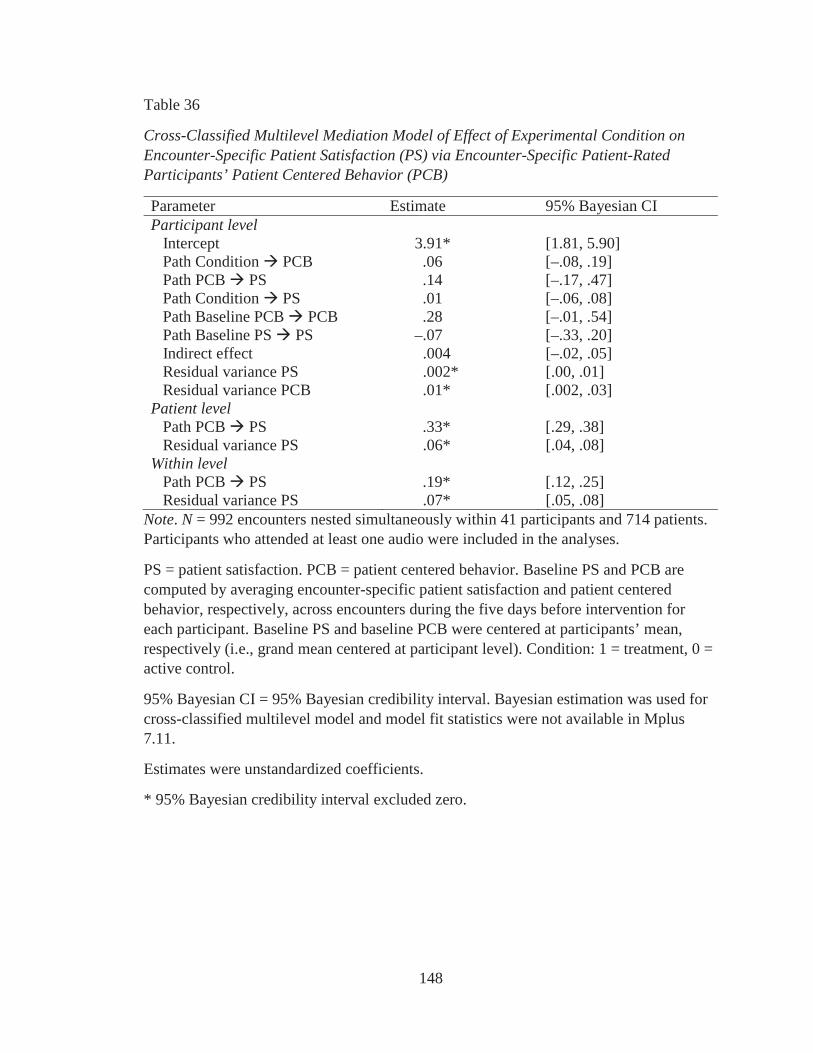
148
Table 36
Cross-Classified Multilevel Mediation Model of Effect of Experimental Condition on Encounter-Specific Patient Satisfaction (PS) via Encounter-Specific Patient-Rated Participants’ Patient Centered Behavior (PCB)
Parameter Estimate 95% Bayesian CI Participant level
Intercept 3.91* [1.81, 5.90]Path Condition PCB .06 [–.08, .19]Path PCB PS .14 [–.17, .47]Path Condition PS .01 [–.06, .08]Path Baseline PCB PCB .28 [–.01, .54]Path Baseline PS PS –.07 [–.33, .20]Indirect effect .004 [–.02, .05]Residual variance PS .002* [.00, .01]Residual variance PCB .01* [.002, .03]
Patient levelPath PCB PS .33* [.29, .38]Residual variance PS .06* [.04, .08]
Within levelPath PCB PS .19* [.12, .25]Residual variance PS .07* [.05, .08]
Note. N = 992 encounters nested simultaneously within 41 participants and 714 patients. Participants who attended at least one audio were included in the analyses.
PS = patient satisfaction. PCB = patient centered behavior. Baseline PS and PCB are computed by averaging encounter-specific patient satisfaction and patient centered behavior, respectively, across encounters during the five days before intervention for each participant. Baseline PS and baseline PCB were centered at participants’ mean, respectively (i.e., grand mean centered at participant level). Condition: 1 = treatment, 0 = active control.
95% Bayesian CI = 95% Bayesian credibility interval. Bayesian estimation was used for cross-classified multilevel model and model fit statistics were not available in Mplus 7.11.
Estimates were unstandardized coefficients.
* 95% Bayesian credibility interval excluded zero.
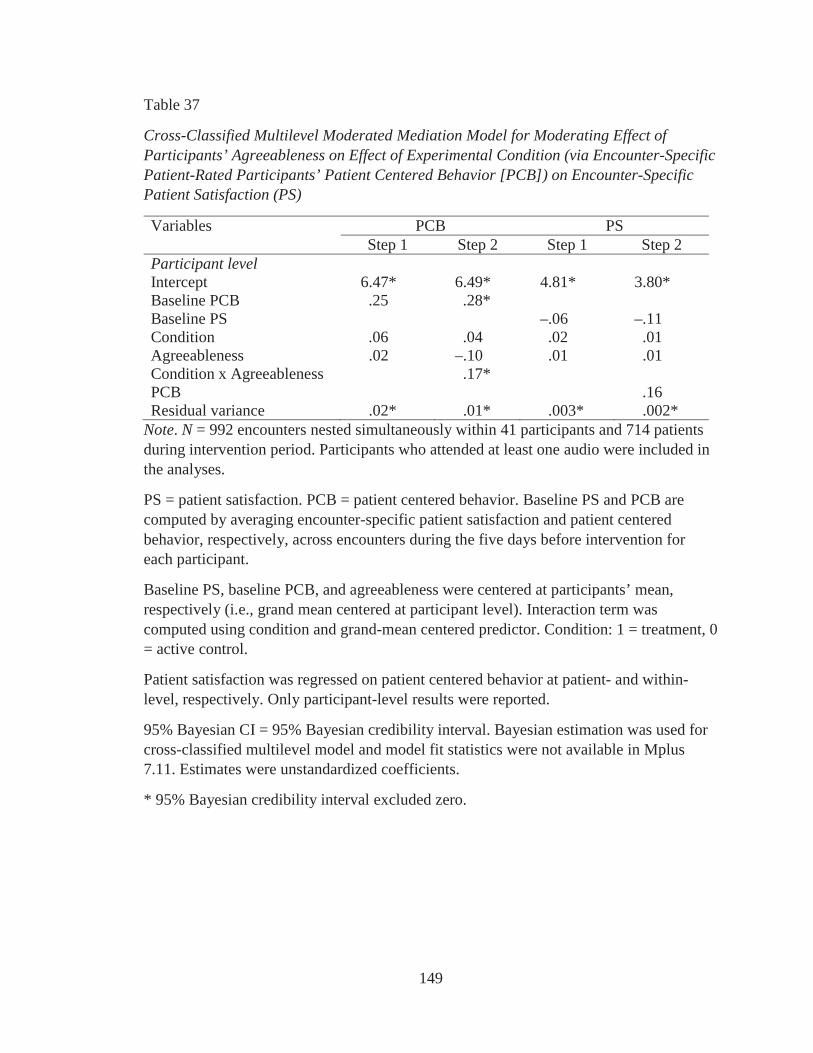
149
Table 37
Cross-Classified Multilevel Moderated Mediation Model for Moderating Effect of Participants’ Agreeableness on Effect of Experimental Condition (via Encounter-Specific Patient-Rated Participants’ Patient Centered Behavior [PCB]) on Encounter-Specific Patient Satisfaction (PS)
Variables PCB PSStep 1 Step 2 Step 1 Step 2
Participant levelIntercept 6.47* 6.49* 4.81* 3.80*Baseline PCB .25 .28*Baseline PS –.06 –.11Condition .06 .04 .02 .01Agreeableness .02 –.10 .01 .01Condition x Agreeableness .17*PCB .16Residual variance .02* .01* .003* .002*
Note. N = 992 encounters nested simultaneously within 41 participants and 714 patients during intervention period. Participants who attended at least one audio were included in the analyses.
PS = patient satisfaction. PCB = patient centered behavior. Baseline PS and PCB are computed by averaging encounter-specific patient satisfaction and patient centered behavior, respectively, across encounters during the five days before intervention for each participant.
Baseline PS, baseline PCB, and agreeableness were centered at participants’ mean, respectively (i.e., grand mean centered at participant level). Interaction term was computed using condition and grand-mean centered predictor. Condition: 1 = treatment, 0 = active control.
Patient satisfaction was regressed on patient centered behavior at patient- and within-level, respectively. Only participant-level results were reported.
95% Bayesian CI = 95% Bayesian credibility interval. Bayesian estimation was used forcross-classified multilevel model and model fit statistics were not available in Mplus 7.11. Estimates were unstandardized coefficients.
* 95% Bayesian credibility interval excluded zero.
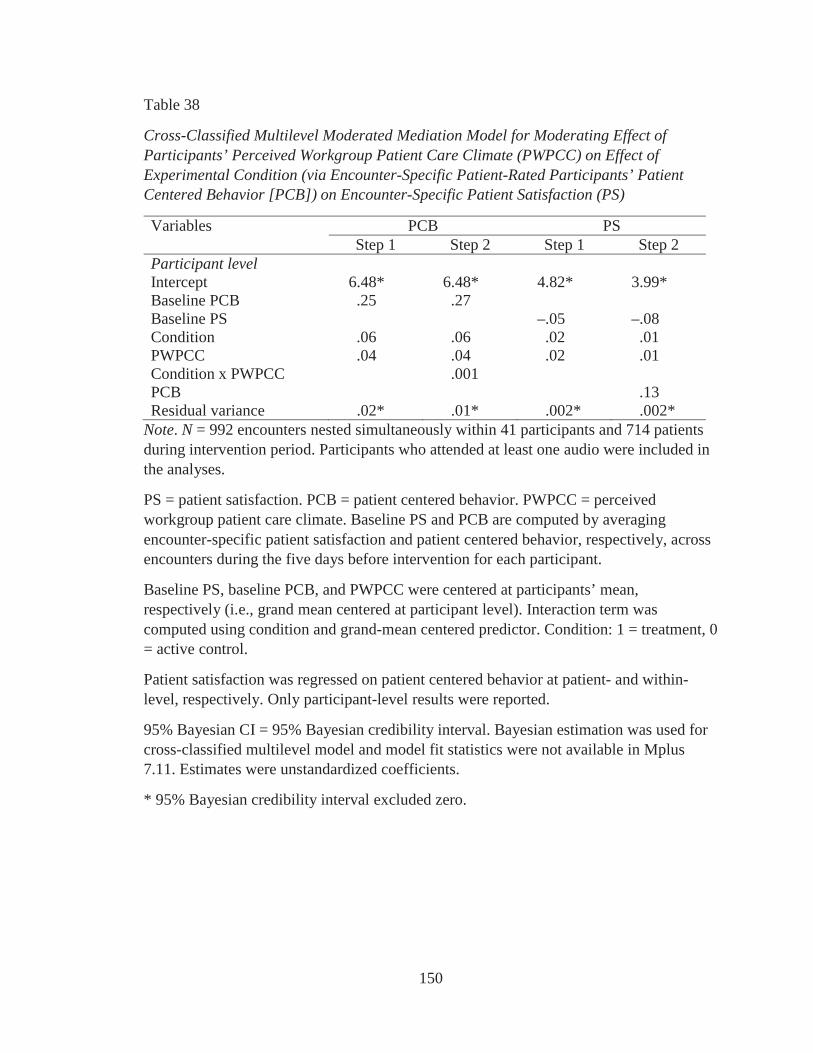
150
Table 38
Cross-Classified Multilevel Moderated Mediation Model for Moderating Effect of Participants’ Perceived Workgroup Patient Care Climate (PWPCC) on Effect of Experimental Condition (via Encounter-Specific Patient-Rated Participants’ Patient Centered Behavior [PCB]) on Encounter-Specific Patient Satisfaction (PS)
Variables PCB PSStep 1 Step 2 Step 1 Step 2
Participant levelIntercept 6.48* 6.48* 4.82* 3.99*Baseline PCB .25 .27Baseline PS –.05 –.08Condition .06 .06 .02 .01PWPCC .04 .04 .02 .01Condition x PWPCC .001PCB .13Residual variance .02* .01* .002* .002*
Note. N = 992 encounters nested simultaneously within 41 participants and 714 patients during intervention period. Participants who attended at least one audio were included in the analyses.
PS = patient satisfaction. PCB = patient centered behavior. PWPCC = perceived workgroup patient care climate. Baseline PS and PCB are computed by averaging encounter-specific patient satisfaction and patient centered behavior, respectively, across encounters during the five days before intervention for each participant.
Baseline PS, baseline PCB, and PWPCC were centered at participants’ mean, respectively (i.e., grand mean centered at participant level). Interaction term was computed using condition and grand-mean centered predictor. Condition: 1 = treatment, 0 = active control.
Patient satisfaction was regressed on patient centered behavior at patient- and within-level, respectively. Only participant-level results were reported.
95% Bayesian CI = 95% Bayesian credibility interval. Bayesian estimation was used for cross-classified multilevel model and model fit statistics were not available in Mplus 7.11. Estimates were unstandardized coefficients.
* 95% Bayesian credibility interval excluded zero.
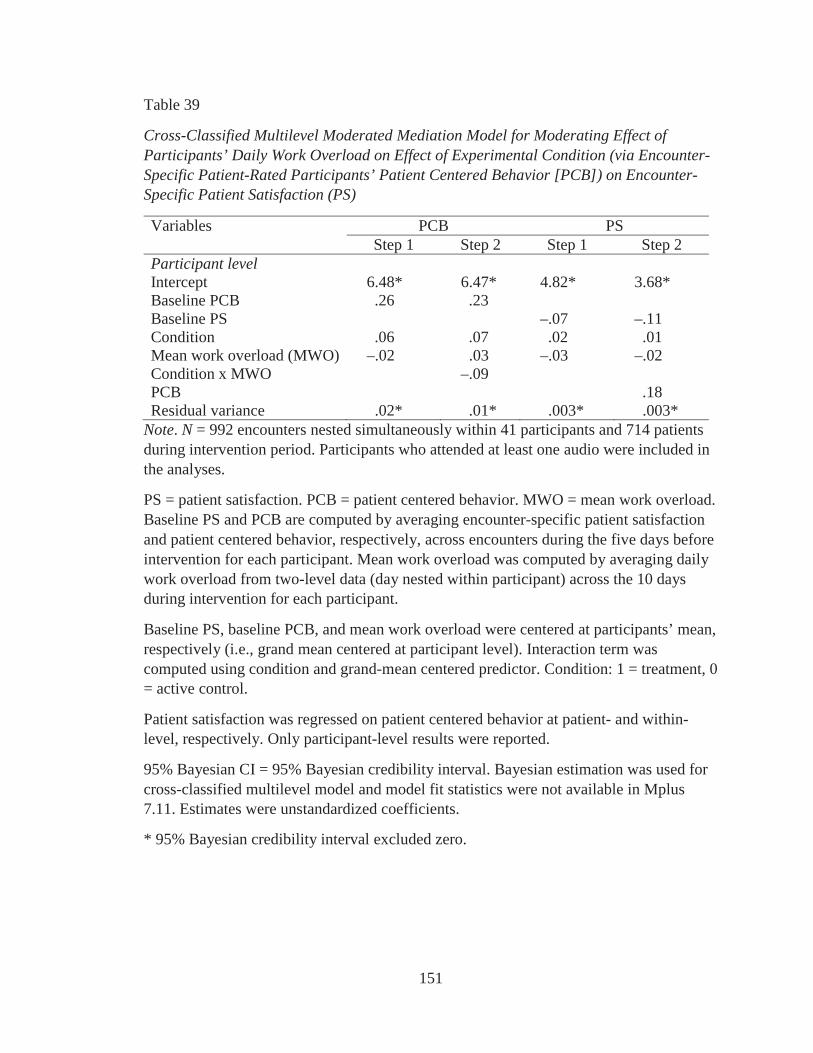
151
Table 39
Cross-Classified Multilevel Moderated Mediation Model for Moderating Effect of Participants’ Daily Work Overload on Effect of Experimental Condition (via Encounter-Specific Patient-Rated Participants’ Patient Centered Behavior [PCB]) on Encounter-Specific Patient Satisfaction (PS)
Variables PCB PSStep 1 Step 2 Step 1 Step 2
Participant levelIntercept 6.48* 6.47* 4.82* 3.68*Baseline PCB .26 .23Baseline PS –.07 –.11Condition .06 .07 .02 .01Mean work overload (MWO) –.02 .03 –.03 –.02Condition x MWO –.09PCB .18Residual variance .02* .01* .003* .003*
Note. N = 992 encounters nested simultaneously within 41 participants and 714 patients during intervention period. Participants who attended at least one audio were included in the analyses.
PS = patient satisfaction. PCB = patient centered behavior. MWO = mean work overload. Baseline PS and PCB are computed by averaging encounter-specific patient satisfaction and patient centered behavior, respectively, across encounters during the five days before intervention for each participant. Mean work overload was computed by averaging daily work overload from two-level data (day nested within participant) across the 10 days during intervention for each participant.
Baseline PS, baseline PCB, and mean work overload were centered at participants’ mean, respectively (i.e., grand mean centered at participant level). Interaction term was computed using condition and grand-mean centered predictor. Condition: 1 = treatment, 0= active control.
Patient satisfaction was regressed on patient centered behavior at patient- and within-level, respectively. Only participant-level results were reported.
95% Bayesian CI = 95% Bayesian credibility interval. Bayesian estimation was used for cross-classified multilevel model and model fit statistics were not available in Mplus 7.11. Estimates were unstandardized coefficients.
* 95% Bayesian credibility interval excluded zero.
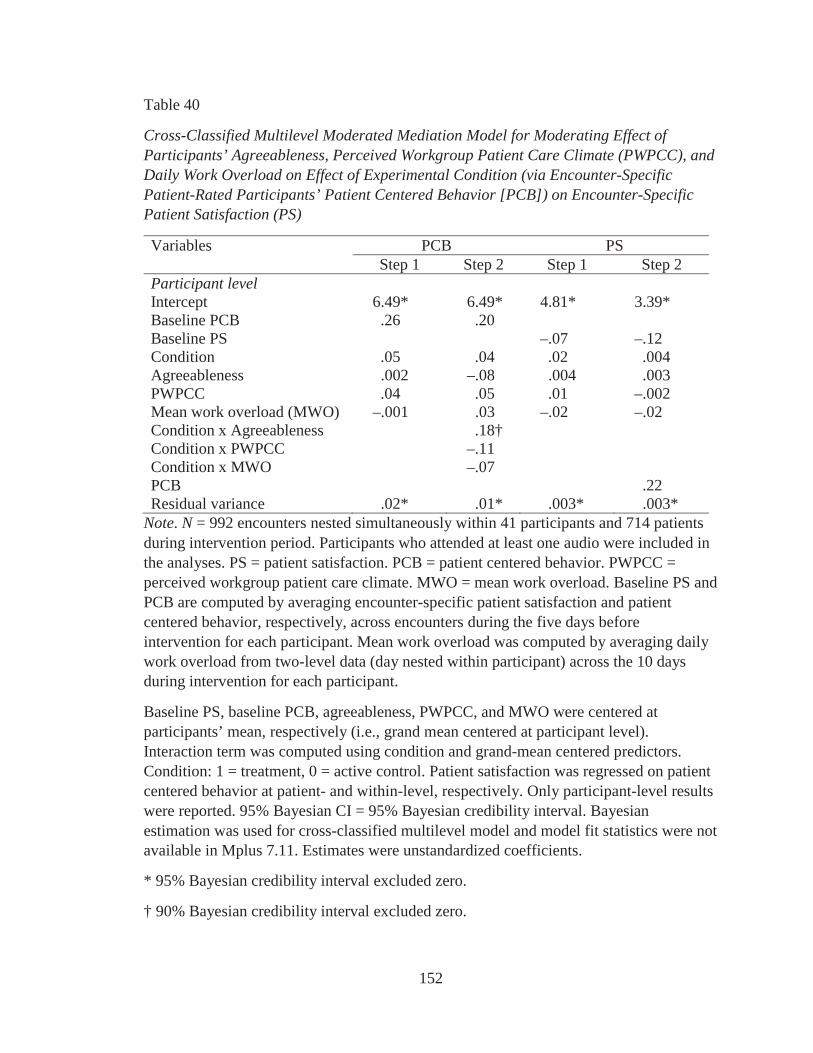
152
Table 40
Cross-Classified Multilevel Moderated Mediation Model for Moderating Effect of Participants’ Agreeableness, Perceived Workgroup Patient Care Climate (PWPCC), and Daily Work Overload on Effect of Experimental Condition (via Encounter-Specific Patient-Rated Participants’ Patient Centered Behavior [PCB]) on Encounter-Specific Patient Satisfaction (PS)
Variables PCB PSStep 1 Step 2 Step 1 Step 2
Participant levelIntercept 6.49* 6.49* 4.81* 3.39*Baseline PCB .26 .20Baseline PS –.07 –.12Condition .05 .04 .02 .004Agreeableness .002 –.08 .004 .003PWPCC .04 .05 .01 –.002Mean work overload (MWO) –.001 .03 –.02 –.02Condition x Agreeableness .18†Condition x PWPCC –.11Condition x MWO –.07PCB .22Residual variance .02* .01* .003* .003*
Note. N = 992 encounters nested simultaneously within 41 participants and 714 patients during intervention period. Participants who attended at least one audio were included in the analyses. PS = patient satisfaction. PCB = patient centered behavior. PWPCC = perceived workgroup patient care climate. MWO = mean work overload. Baseline PS and PCB are computed by averaging encounter-specific patient satisfaction and patient centered behavior, respectively, across encounters during the five days before intervention for each participant. Mean work overload was computed by averaging daily work overload from two-level data (day nested within participant) across the 10 days during intervention for each participant.
Baseline PS, baseline PCB, agreeableness, PWPCC, and MWO were centered at participants’ mean, respectively (i.e., grand mean centered at participant level). Interaction term was computed using condition and grand-mean centered predictors. Condition: 1 = treatment, 0 = active control. Patient satisfaction was regressed on patient centered behavior at patient- and within-level, respectively. Only participant-level results were reported. 95% Bayesian CI = 95% Bayesian credibility interval. Bayesian estimation was used for cross-classified multilevel model and model fit statistics were not available in Mplus 7.11. Estimates were unstandardized coefficients.
* 95% Bayesian credibility interval excluded zero.
† 90% Bayesian credibility interval excluded zero.
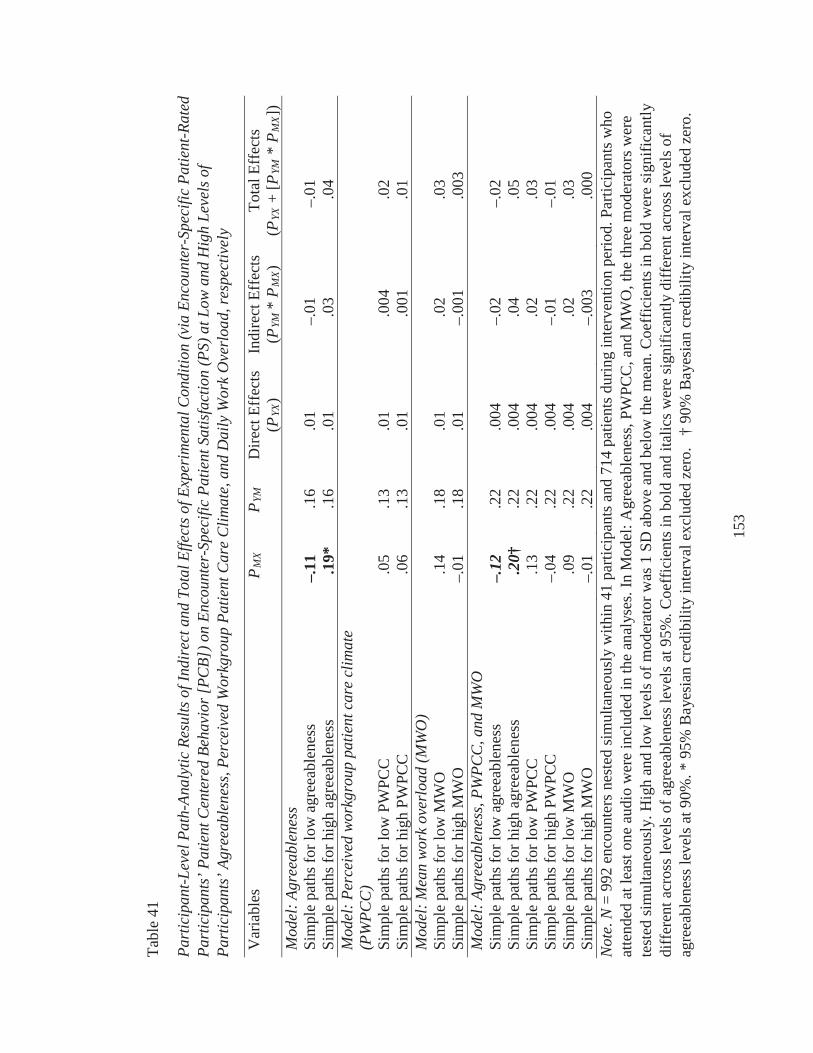
153
Tabl
e 41
Part
icip
ant-L
evel
Pat
h-An
alyt
ic R
esul
ts o
f Ind
irec
t and
Tot
al E
ffect
s of E
xper
imen
tal C
ondi
tion
(via
Enc
ount
er-S
peci
fic P
atie
nt-R
ated
Pa
rtic
ipan
ts’ P
atie
nt C
ente
red
Beha
vior
[PC
B]) o
n En
coun
ter-
Spec
ific
Patie
nt S
atis
fact
ion
(PS)
at L
ow a
nd H
igh
Leve
ls o
f Pa
rtic
ipan
ts’ A
gree
able
ness
, Per
ceiv
ed W
orkg
roup
Pat
ient
Car
e C
limat
e, a
nd D
aily
Wor
k O
verl
oad,
resp
ectiv
ely
Var
iabl
es
PM
XP
YMD
irect
Eff
ects
(PYX
)In
dire
ct E
ffec
ts(P
YM *
PM
X)
Tota
l Eff
ects
(PYX
+ [P
YM*
PM
X])
Mod
el: A
gree
able
ness
Sim
ple
path
s for
low
agr
eeab
lene
ss–.
11.1
6.0
1–.
01–.
01Si
mpl
e pa
ths f
or h
igh
agre
eabl
enes
s.1
9*.1
6.0
1.0
3.0
4M
odel
: Per
ceiv
ed w
orkg
roup
pat
ient
car
e cl
imat
e (P
WPC
C)
Sim
ple
path
s for
low
PW
PCC
.05
.13
.01
.004
.02
Sim
ple
path
s for
hig
h PW
PCC
.06
.13
.01
.001
.01
Mod
el:M
ean
wor
k ov
erlo
ad (M
WO
)Si
mpl
e pa
ths f
or lo
w M
WO
.14
.18
.01
.02
.03
Sim
ple
path
s for
hig
h M
WO
–.01
.18
.01
–.00
1.0
03M
odel
: Agr
eeab
lene
ss, P
WPC
C, a
nd M
WO
Sim
ple
path
s for
low
agr
eeab
lene
ss–.
12.2
2.0
04–.
02–.
02Si
mpl
e pa
ths f
or h
igh
agre
eabl
enes
s.2
0†.2
2.0
04.0
4.0
5Si
mpl
e pa
ths f
or lo
w P
WPC
C.1
3.2
2.0
04.0
2.0
3Si
mpl
e pa
ths f
or h
igh
PWPC
C–.
04.2
2.0
04–.
01–.
01Si
mpl
e pa
ths f
or lo
w M
WO
.09
.22
.004
.02
.03
Sim
ple
path
s for
hig
h M
WO
–.01
.22
.004
–.00
3.0
00N
ote.
N=
992
enco
unte
rs n
este
d si
mul
tane
ousl
y w
ithin
41
parti
cipa
nts a
nd 7
14 p
atie
nts d
urin
g in
terv
entio
n pe
riod.
Par
ticip
ants
who
at
tend
ed a
t lea
st o
ne a
udio
wer
e in
clud
ed in
the
anal
yses
. In
Mod
el: A
gree
able
ness
, PW
PCC
, and
MW
O, t
he th
ree
mod
erat
ors w
ere
test
ed si
mul
tane
ousl
y. H
igh
and
low
leve
ls o
f mod
erat
or w
as 1
SD
abo
ve a
nd b
elow
the
mea
n. C
oeff
icie
nts i
n bo
ld w
ere
sign
ifica
ntly
diff
eren
t acr
oss l
evel
s of a
gree
able
ness
leve
ls a
t 95%
. Coe
ffic
ient
s in
bold
and
ital
ics w
ere
sign
ifica
ntly
diff
eren
t acr
oss l
evel
s of
agre
eabl
enes
s lev
els a
t 90%
.*95
% B
ayes
ian
cred
ibili
ty in
terv
al e
xclu
ded
zero
. †
90%
Bay
esia
n cr
edib
ility
inte
rval
exc
lude
d ze
ro.
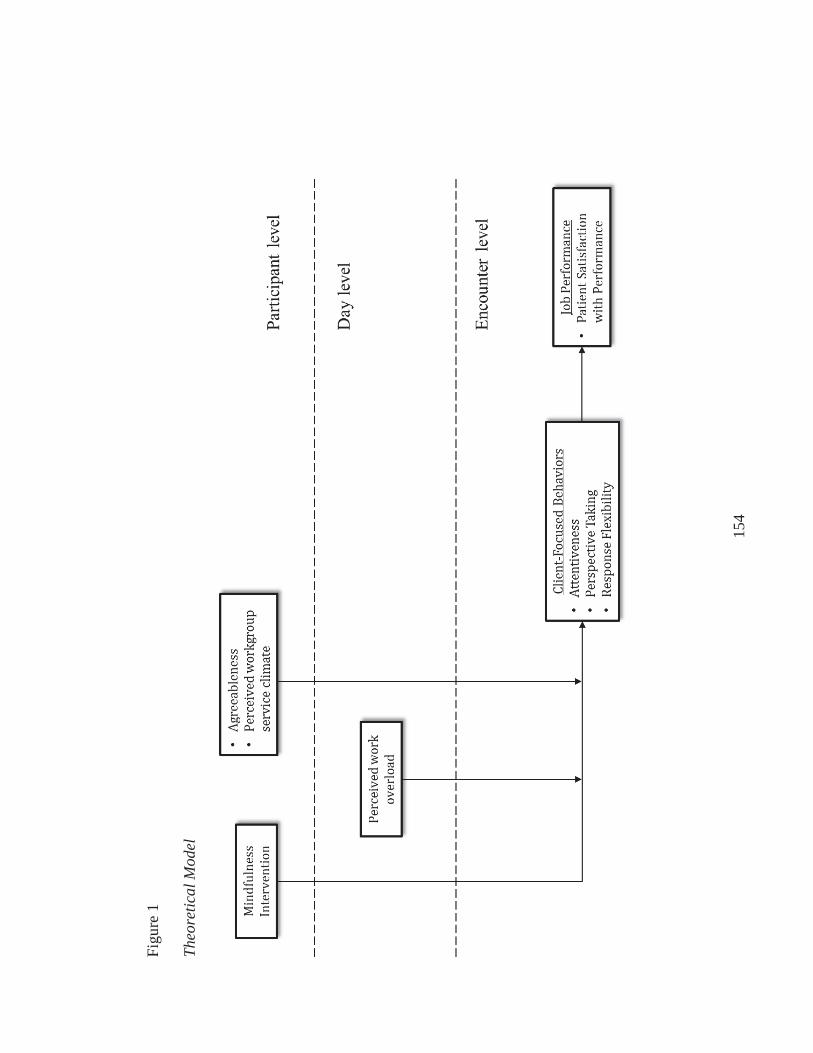
154
Figu
re 1
Theo
retic
al M
odel
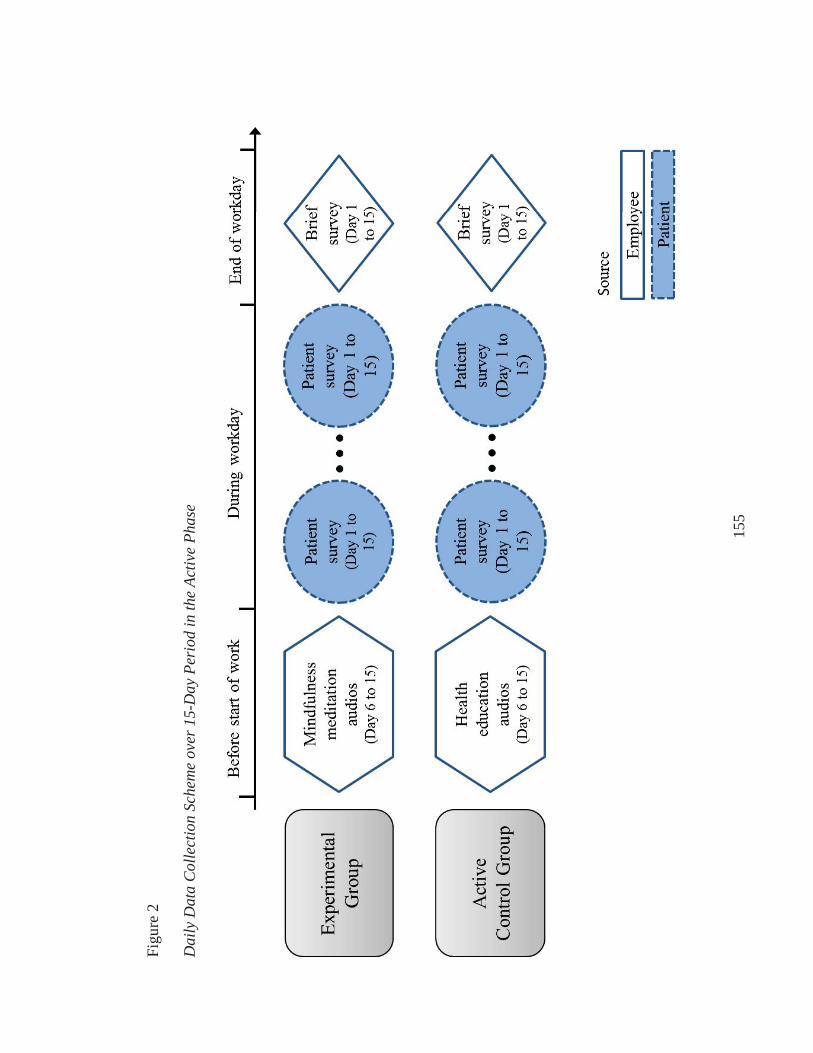
155
Figu
re 2
Dai
ly D
ata
Col
lect
ion
Sche
me
over
15-
Day
Per
iod
in th
e Ac
tive
Phas
e
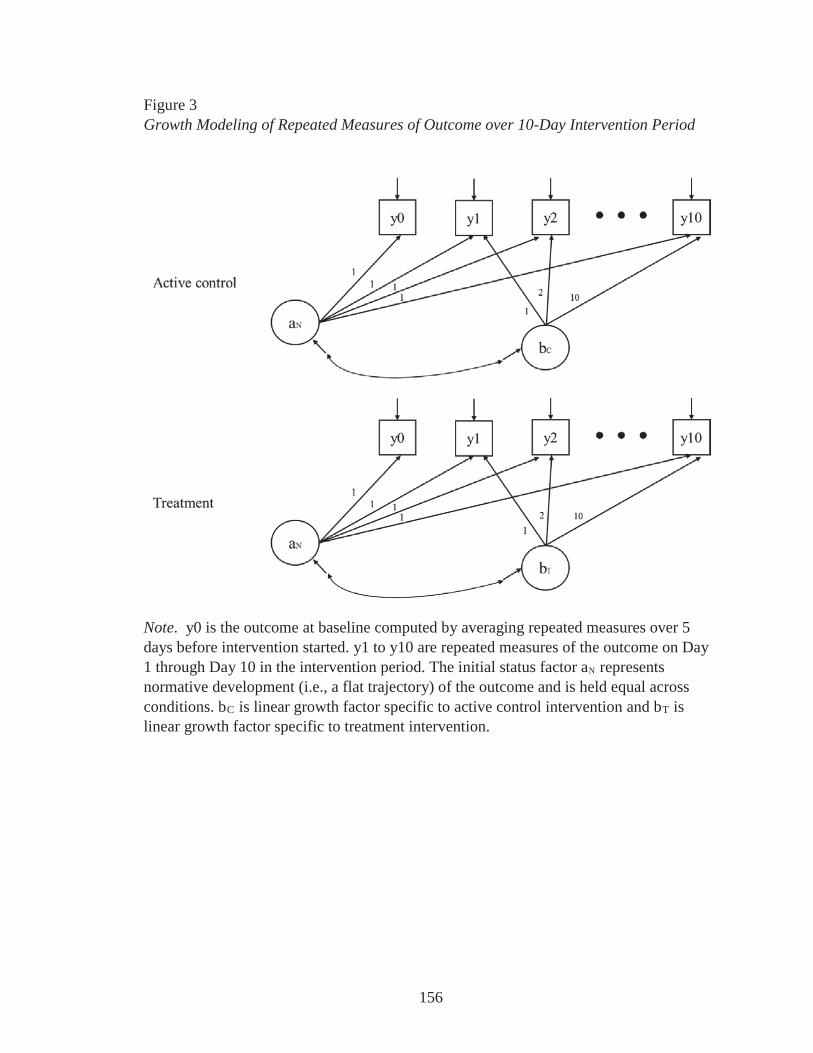
156
Figure 3Growth Modeling of Repeated Measures of Outcome over 10-Day Intervention Period
Note. y0 is the outcome at baseline computed by averaging repeated measures over 5 days before intervention started. y1 to y10 are repeated measures of the outcome on Day 1 through Day 10 in the intervention period. The initial status factor aN represents normative development (i.e., a flat trajectory) of the outcome and is held equal across conditions. bC is linear growth factor specific to active control intervention and bT is linear growth factor specific to treatment intervention.
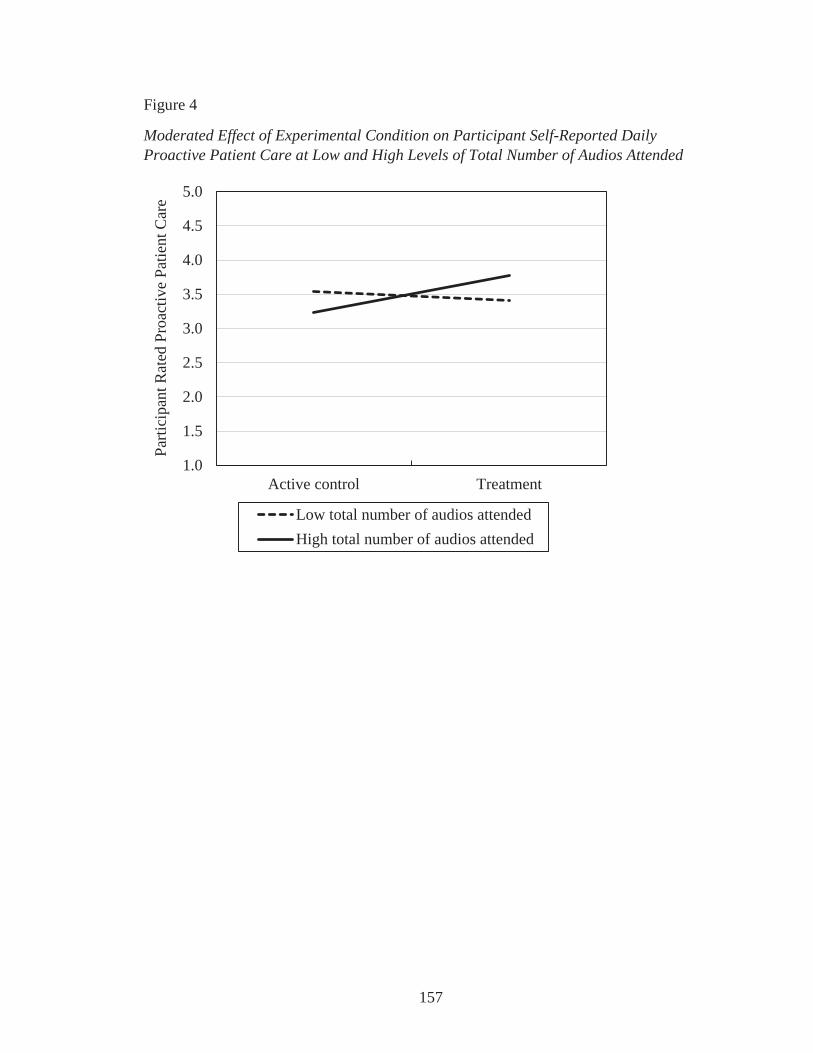
157
Figure 4
Moderated Effect of Experimental Condition on Participant Self-Reported Daily Proactive Patient Care at Low and High Levels of Total Number of Audios Attended
1.0
1.5
2.0
2.5
3.0
3.5
4.0
4.5
5.0
Active control Treatment
Parti
cipa
nt R
ated
Pro
activ
e Pa
tient
Car
e
Low total number of audios attendedHigh total number of audios attended
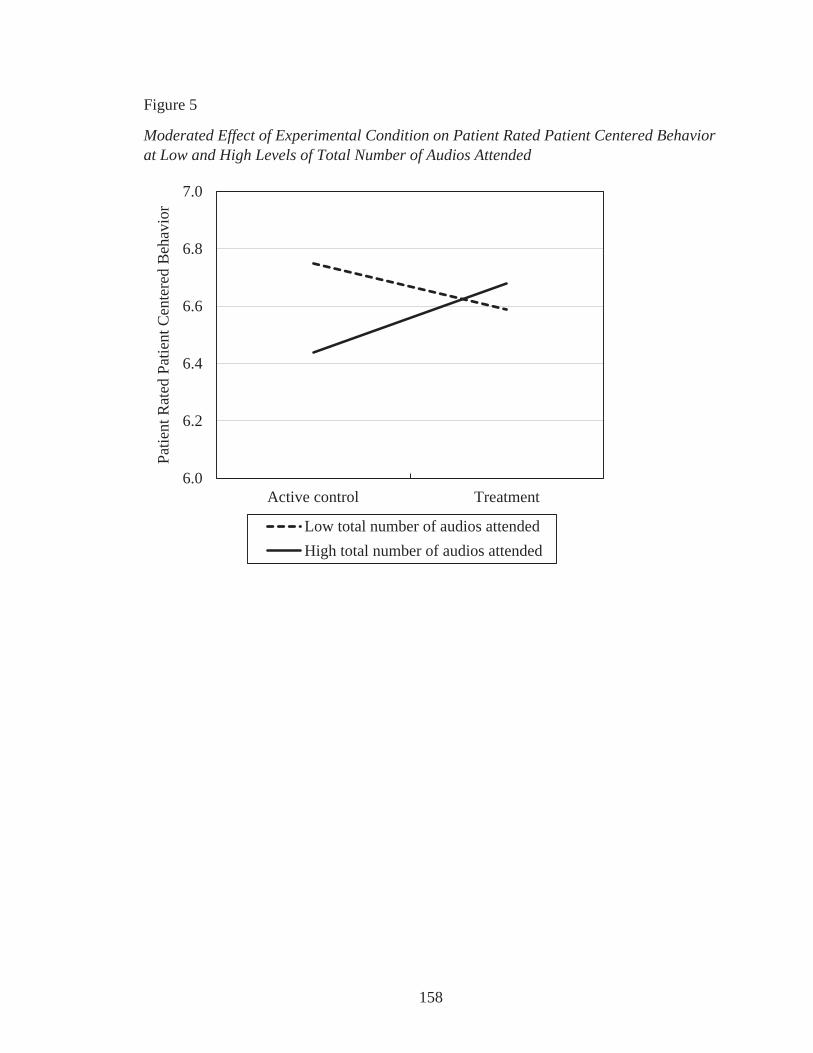
158
Figure 5
Moderated Effect of Experimental Condition on Patient Rated Patient Centered Behavior at Low and High Levels of Total Number of Audios Attended
6.0
6.2
6.4
6.6
6.8
7.0
Active control Treatment
Patie
nt R
ated
Pat
ient
Cen
tere
d B
ehav
ior
Low total number of audios attendedHigh total number of audios attended
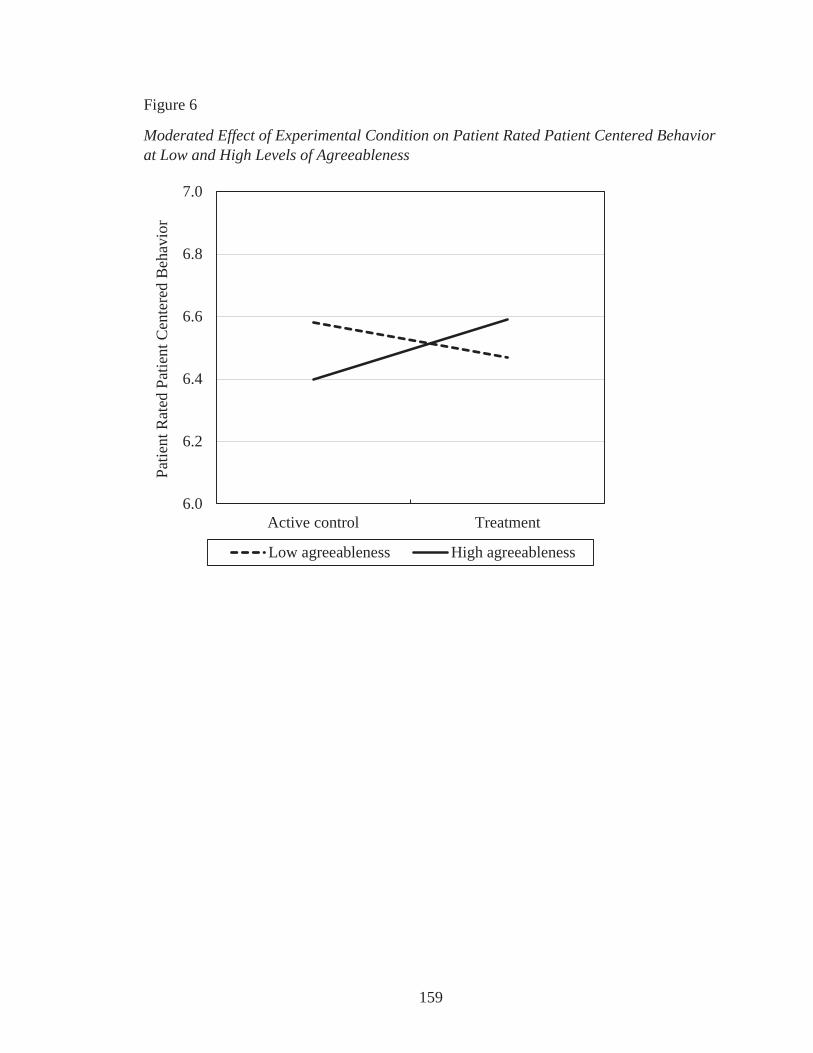
159
Figure 6
Moderated Effect of Experimental Condition on Patient Rated Patient Centered Behavior at Low and High Levels of Agreeableness
6.0
6.2
6.4
6.6
6.8
7.0
Active control Treatment
Patie
nt R
ated
Pat
ient
Cen
tere
d B
ehav
ior
Low agreeableness High agreeableness
160
References
Aiken, L. S., & West, S. G. (1991). Multiple regression: Testing and interpreting
interactions. Newbury Park, CA: Sage.
Aikens, K. A., Astin, J., Pelletier, K. R., Levanovich, K., Baase, C. M., Park, Y. Y., et al.
(2014). Mindfulness goes to work: Impact of an online workplace intervention.
Journal of Occupational and Environmental Medicine, 56, 721-731.
Allen, T. D., & Kiburz, K. M. (2012). Trait mindfulness and work-family balance among
working parents: The mediating effects of vitality and sleep quality. Journal of
Vocational Behavior, 80, 372-379.
American Council on Exercise. (2014). 15 Minutes to Wellness Podcast. Accessed at
http://www.acefitness.org/acefit/podcasts/
Asparouhov, T., & Muthén, B. (2010). Bayesian analysis of latent variable models using
Mplus (Technical report). Los Angeles, CA: Muthén & Muthén.
Baer, R. A., Smith. G. T., Hopkins, J., Krietemeyer, J., & Toney, L. (2006). Using self-
report assessment methods to explore facets of mindfulness. Assessment, 13, 27-
45.
Barrera, M., Sandler, I. N., & Ramsay, T. B. (1981). Preliminary development of a scale
of social support: Studies on college students. American Journal of Community
Psychology, 9, 435-447.
Barrick, M. R., & Mount, M. K. (1991). The Big Five personality dimensions and job
performance: A meta-analysis. Personnel Psychology, 44, 1-26.
Batson, C. D. (1991). The altruism question: Towards a social-psychological answer.
Hillsdale, NJ: Erlbaum.
161
Bazarko, D., Cate, R. A., Azocar, F., & Kreitzer, M. J. (2013). The impact of an
innovative mindfulness-based stress reduction program on the health and well-
being of nurses employed in a corporate setting. Journal of Workplace Behavioral
Health, 28, 107-133.
Beckman, H. B., Wendland, M., Mooney, C., Krasner, M. S., Quill, T. E., Suchman, A.
L., & Epstein, R. M. (2012). The impact of a program in mindful communication
on primary care physicians. Academic Medicine, 87, 815-819.
Beach, M. C., Roter, D., Korthuis, P. T., Epstein, R. M., Sharp, V., Ratanawongsa, N.,
Cohn, J., . . . Saha, S. (2013). A multicenter study of physician mindfulness and
health care quality. Annals of Family Medicine, 11, 421-428.
Beal, D. J., Trougakos, J. P., Weiss, H. M., & Dalal, R. S. (2013). Affect spin and the
emotion regulation process at work. Journal of Applied Psychology, 98, 593-605.
Beal, D. J., Weiss, H. M., Barros, E., & MacDermid, S. M. (2005). An episodic process
model of affective influences on performance. Journal of Applied Psychology, 90,
1054-1068.
Beddoe, A. E., & Murphy, S. O. (2004). Does mindfulness decrease stress and foster
empathy among nursing students? Journal of Nursing Education, 43, 305-312.
Beus, J. M., Dhanani, L. Y., & McCord, M. A. (2015). A meta-analysis of personality
and workplace safety: Addressing unanswered questions. Journal of Applied
Psychology, 100, 481-498.
Birnie, K., Speca, M., & Carlson, L. E. (2010). Exploring self-compassion and empathy
in the context of mindfulness-based stress reduction (MBSR). Stress and Health:
Journal of the International Society for the Investigation of Stress, 26, 359-371.
162
Bishop, S. R., Lau, M., Shapiro, S., Carlson, L., Anderson, N.D., Carmody, J., Segal, Z.
V., Abbey, S., Speca, M., Velting, D., & Devins, G. (2004). Mindfulness: A
proposed operational definition. Clinical Psychology: Science and Practice, 11,
230-241.
Bliese, P. D. (2000). Within-group agreement, non-independence, and reliability:
Implications for data aggregation and analysis. In K. J. Klein, S. W. J. Kozlowski
(Eds.), Multilevel theory, research, and methods in organizations: Foundations,
extensions, and new directions. San Francisco, CA: Jossey-Bass.
Block-Lerner, J., Adair, C., Plumb, J. C., Rhatigan, D. L., & Orsillo, S. M. (2007). The
case for mindfulness-based approaches in the cultivation of empathy: Does
nonjudgmental, present-moment awareness increase capacity for perspective-
taking and empathic concern? Journal of Marital and Family Therapy, 33, 501-
516.
Bockting, C. L. H., Spinhoven, P., Koeter, M. W. J., Wouters, L. F., Visser, I., & Schene,
A. H. (2006). Differential predictors of response to preventive cognitive therapy
in recurrent depression: A 2-year prospective study. Psychotherapy and
Psychosomatics, 75, 229-236.
Bodie, G. D. (2011). The Active-Empathic Listening Scale (AELS): Conceptualization
and evidence of validity within the interpersonal domain. Communication
Quarterly, 59, 277-295.
Bohlmeijer, E., Prenger, R., Taal, E., & Cuijpers, P. (2010). The effects of mindfulness-
based stress reduction therapy on mental health of adults with a chronic medical
disease: A meta-analysis. Journal of Psychosomatic Research, 68, 539-544.
163
Bollen, K. A., & Curran, P. J. (2006). Latent curve models: A structural equation
perspective. Hoboken, NJ: Wiley.
Bono, J. E., & Judge, T. A. (2003). Self-concordance at work: Toward understanding the
motivational effects of transformational leaders. Academy of Management
Journal, 46, 554-571.
Bono, J. E., Glomb, T. M., Shen, W., Kim, E., & Koch, A. J. (2013). Building positive
resources: Effects of positive events and positive reflection on work stress and
health. Academy of Management Journal, 56, 1601-1627.
Bono, J. E., & Judge, T. A. (2004). Personality and transformational and transactional
leadership: A meta-analysis. Journal of Applied Psychology, 89, 901-910.
Brislin, R. W. (1980). Translation and content analysis of oral and written materials. In
H. Triandis & J. W. Berry (Eds.), Handbook of cross-cultural psychology (pp.
389-444). Boston: Allyn & Bacon.
Brown, K. W., & Ryan, R. M. (2003). The benefits of being present: Mindfulness and its
role in psychological well-being. Journal of Personality and Social Psychology,
84, 822-848.
Brown, K. W., Ryan, R. M., & Creswell, J. D. (2007). Mindfulness: Theoretical
foundations and evidence for its salutary effects. Psychological Inquiry, 18, 211-
237.
Brayfield, A. H., & Rothe, H. F. (1951). An index of job satisfaction. Journal of Applied
Psychology, 35, 307–311.
Cahn, B. R., & Polich, J. (2006). Meditation states and traits: EEG, ERP, and
neuroimaging studies. Psychological Bulletin, 132, 180-211.
164
Carmody, J., & Baer, R. A. (2009). How long does a mindfulness-based stress reduction
program need to be? A review of class contact hours and effect sizes for
psychological distress. Journal of Clinical Psychology, 65, 627-638.
Carr, J. Z., Schmidt, A. M., Ford, J. K., & DeShon, R. P. (2003). Climate perceptions
matter: A meta-analytic path analysis relating molar climate, cognitive and
affective states, and individual level work outcomes. Journal of Applied
Psychology, 88, 605-619.
Cegala, D. J., Savage, G. T., Brunner, C. C., & Conrad, A. B. (1982). An elaboration of
the meaning of interaction involvement: Toward the development of a theoretical
concept. Communication Monographs, 49, 229-248.
Chai-Coetzer, C. L., Antic, N. A., Rowland, L. S., Reed, R. L., Esterman, A., Catcheside,
P. G., et al. (2013). Primary care vs. specialist sleep center management of
obstructive sleep apnea and daytime sleepiness and quality of life: A randomized
trial. JAMA: Journal of the American Medical Association, 309, 997-1004.
Chang, C., Rosen, C. C., & Levy, P. E. (2009). The relationship between perceptions of
organizational politics and employee attitudes, strain, and behavior: A meta-
analytic examination. Academy of Management Journal, 52, 779-801.
Chen, G., Gully, S. M., & Eden, D. (2001). Validation of a new general self-efficacy
scale. Organizational Research Methods, 4, 62-83.
Chiaburu, D. S., Oh, I., Berry, C. M., Li, N., & Gardner, R. G. (2011). The five-factor
model of personality traits and organizational citizenship behaviors: A meta-
analysis. Journal of Applied Psychology, 96, 1140-1166.
165
Chiesa, A., & Serretti, A. (2009). Mindfulness-based stress reduction for stress
management in healthy people: A review and meta-analysis. Journal of
Alternative and Complementary Medicine, 15, 593-600.
Chiesa, A., & Serretti, A. (2010). A systematic review of neurobiological and clinical
features of mindfulness meditations. Psychological Medicine: A Journal of
Research in Psychiatry and the Allied Sciences, 40, 1239-1252.
Choi, D., Oh, I., & Colbert, A. E. (2015). Understanding organizational commitment: A
meta-analytic examination of the roles of the five-factor model of personality and
culture. Journal of Applied Psychology. No Pagination Specified.
Colquitt, J. A., Conlon, D. E., Wesson, M. J., Porter, Christopher O. L. H, & Ng, K. Y.
(2001). Justice at the millennium: A meta-analytic review of 25 years of
organizational justice research. Journal of Applied Psychology, 86, 425-445.
Colquitt, J. A., Scott, B. A., Rodell, J. B., Long, D. M., Zapata, C. P., Conlon, D. E., et al.
(2013). Justice at the millennium, a decade later: A meta-analytic test of social
exchange and affect-based perspectives. Journal of Applied Psychology, 98, 199-
236.
Cook, T. D., & Campbell, D. T. (1979). Quasi-experimentation: Design and analysis
issues for field settings. Chicago, IL: Rand-McNally.
Cooper-Hakim, A., & Viswesvaran, C. (2005). The Construct of work commitment:
Testing an integrative framework. Psychological Bulletin, 131, 241-259.
Cooper-Patrick, L., Gallo, J. J., Gonzales, J. J., Vu, H. T., Powe, N. R., Nelson, C., &
Ford, D. E. (1999). Race, gender, and partnership in the patient-phyician
relationship. JAMA: Journal of the American Medical Association, 282, 583-589.
166
Cozolino, L. (2006). The neuroscience of human relationships: Attachment and the
developing social brain. New York: Norton.
Dahm, P. C., Glomb, T. M., Manchester, C. F., & Leroy, S. (2015). Work-family conflict
and self-discrepant time allocation at work. Journal of Applied Psychology, 100,
767-792.
Dane, E. (2011). Paying attention to mindfulness and its effects on task performance in
the workplace. Journal of Management, 37, 997-1018.
Dane, E., & Brummel, B. J. (2014). Examining workplace mindfulness and its relations
to job performance and turnover intention. Human Relations, 67, 105-128.
Davis, M. H., Conklin, L., Smith, A., & Luce, C. (1996). Effect of perspective taking on
the cognitive representation of persons: A merging of self and other. Journal of
Personality and Social Psychology, 70, 713–726.
Davis, D. M., & Hayes, J. A. (2011). What are the benefits of mindfulness? A practice
review of psychotherapy-related research. Psychotherapy, 48, 198-208.
De Dreu, C. K. W. (2006). Rational self-interest and other orientation in organizational
behavior: A critical appraisal and extension of Meglino and Korsgaard (2004).
Journal of Applied Psychology, 91, 1245-1252.
De Dreu, C. K. W., & Nauta, A. (2009). Self-interest and other-orientation in
organizational behavior: Implications for job performance, prosocial behavior,
and personal initiative. Journal of Applied Psychology, 94, 913-926.
Dekovic, M., Asscher, J. J., Manders, W. A., Prins, P. J. M., & van der Laan, P. (2012).
Within-intervention change: Mediators of intervention effects during
167
multisystemic therapy. Journal of Consulting and Clinical Psychology, 80, 574-
587.
Demerouti, E., Bakker, A. B., Nachreiner, F., & Schaufeli, W. B. (2001). The job
demands-resources model of burnout. Journal of Applied Psychology, 86, 499-
512.
Dennis, J. P., & Vander Wal, J. S. (2010). The Cognitive Flexibility Inventory:
Instrument development and estimates of reliability and validity. Cognitive
Therapy and Research, 34, 241-253.
DeSalvo, K. B., Fisher, W. P., Tran, K., Bloser, N., Merrill, W., & Peabody, J. (2006).
Assessing measurement properties of two single- item general health measures.
Quality of Life Research: An International Journal of Quality of Life Aspects of
Treatment, Care and Rehabilitation, 15, 191–201.
Donnellan, M. B., Oswald, F. L., Baird, B. M., & Lucas, R. E. (2006). The Mini-IPIP
Scales: Tiny-yet-effective measures of the Big Five Factors of Personality.
Psychological Assessment, 18, 192-203.
Duan, C., & Hill, C. E. (1996). The current state of empathy research. Journal of
Counseling Psychology, 43, 261-274.
Dudley, N. M., Orvis, K. A., Lebiecki, J. E., & Cortina, J. M. (2006). A meta-analytic
investigation of conscientiousness in the prediction of job performance:
Examining the intercorrelations and the incremental validity of narrow traits.
Journal of Applied Psychology, 91, 40-57.
168
Duffy, M. K., Scott, K. L., Shaw, J. D., Tepper, B. J., & Aquino, K. (2012). A social
context model of envy and social undermining. Academy of Management Journal,
55, 643-666.
Duncan, L. G., Coatsworth, J. D., & Greenberg, M. T. (2009). A model of mindful
parenting: Implications for parent-child relationships and prevention research.
Clinical Child and Family Psychology Review, 12, 255-270.
Dyer, N. G., Hanges, P. J., & Hall, R. J. (2005). Applying multilevel confirmatory factor
analysis techniques to the study of leadership. Leadership Quarterly, 16, 149-167.
Eatough, E. M., Chang, C., Miloslavic, S. A., & Johnson, R. E. (2011). Relationships of
role stressors with organizational citizenship behavior: A meta-analysis. Journal
of Applied Psychology, 96, 619-632.
Edwards, J. R., & Lambert, L. S. (2007). Methods for integrating moderation and
mediation: A general analytical framework using moderated path analysis.
Psychological Methods, 12, 1-22.
Egan, G. (2014). The skilled helper: A problem-management and opportunity-
development approach to helping (10th ed.). Belmont, CA: Brooks/Cole, Cengage
Learning.
Eisenberger, R., Armeli, S., Rexwinkel, B., Lynch, P. D., & Rhoades, L. (2001).
Reciprocation of perceived organizational support. Journal of Applied
Psychology, 86, 42-51.
Feldman, G., Greeson, J., & Senville, J. (2010). Differential effects of mindful breathing,
progressive muscle relaxation, and loving-kindness meditation on decentering and
169
negative reactions to repetitive thoughts. Behaviour Research and Therapy, 48,
1002- 1011.
Forgas, J. P. (1995). Mood and judgment: The Affect Infusion Model (AIM).
Psychological Bulletin, 117, 39-66.
Fortney, L., Luchterhand, C., Zakletskaia, L., Zgierska, A., & Rakel, D. (2013).
Abbreviated mindfulness intervention for job satisfaction, quality of life, and
compassion in primary care clinician: A pilot study. Annals of Family Medicine,
11, 412-420.
Frank, S. H., Stange, K. C., Langa, D., & Workings, M. (1997). Direct observation of
community-based ambulatory encounters involving medical students. JAMA:
Journal of the American Medical Association, 278, 712-716.
Fredrickson, B. L., Cohn, M. A., Coffey, K. A., Pek, J., & Finkel, S. M. (2008). Open
hearts build lives: Positive emotions, induced through loving-kindness meditation,
build consequential personal resources. Journal of Personality and Social
Psychology, 95, 1045-1062.
Fuller, J. A., Stanton, J. M., Fisher, G. G., Spitzmuller, C., Russell, S. S., & Smith, P. C.
(2003). A lengthy look at the daily grind: Time series analysis of events, mood,
stress, and satisfaction. Journal of Applied Psychology, 88, 1019-1033.
Giluk, T. L. (2010). Mindfulness-based stress reduction: Facilitating work outcomes
through experienced affect and high-quality relationships. Doctoral dissertation.
Retrieved from Iowa Research Online at http://ir.uiowa.edu/etd/674
Glomb, T. M., Duffy, M. K., Bono, J. E., & Yang, T. (2011). Mindfulness at work.
Research in Personnel and Human Resources Management, 30, 115-157.

170
Goldstein, H. (2011). Multilevel Statistical Models (4th ed.). London: Wiley.
Goyal et al. (2014). Meditation programs for psychological stress and well-being: A
systematic review and meta-analysis. JAMA Internal Medicine, 174, 357-368.
Graham, J. W. (2009). Missing data analysis: Making it work in the real world. Annual
Review of Psychology, 60, 549-576.
Grandey, A. A., Fisk, G. M., & Steiner, D. D. (2005). Must "service with a smile" be
stressful? The moderating role of personal control for American and French
employees. Journal of Applied Psychology, 90, 893-904.
Grant, A., & Berry, J. (2011). The necessity of others is the mother of invention: Intrinsic
and prosocial motivations, perspective-taking, and creativity, Academy of
Management Journal, 54, 73-96.
Grant, A. M., & Wrzesniewski, A. (2010). I won't let you down…or will I? Core self-
evaluations, other-orientation, anticipated guilt and gratitude, and job
performance. Journal of Applied Psychology, 95, 108-121.
Graziano, W. G. & Tobin, R. M. (2013). The cognitive and motivational foundations
underlying agreeableness. In M. D. Robinson, E. Watkins, & E. Harmon-Jones
(Eds.), Handbook of Cognition and Emotion. (pp. 347-364). New York: Guilford.
Grepmair, L., Mitterlehner, F., Loew, T., Bachler, E., Rother, W., & Nickel, M. (2007).
Promoting mindfulness in psychotherapists in training influences the treatment
results of their patients: A randomized, double-blind, controlled study.
Psychotherapy and Psychosomatics, 76, 332-338.

171
Grossman, P., Niemann, L., Schmidt, S., & Walach, H. (2004). Mindfulness-based stress
reduction and health benefits: A meta-analysis. Journal of Psychosomatic
Research, 57, 35-43.
Hackman, J. R., & Oldham, G. R. (1975). Development of the Job Diagnostic Survey.
Journal of Applied Psychology, 60, 159–170.
Hart, R., Ivtzan, I., & Hart, D. (2013). Mind the gap in mindfulness research: A
comparative account of the leading schools of thought. Review of General
Psychology, 17, 453-466.
Hobfoll, S. E. (1989). Conservation of resources: A new attempt at conceptualizing
stress. American Psychologist, 44, 513-524.
Hockey, G. R. J. (1997). Compensatory control in the regulation of human performance
under stress and high workload: A cognitive-energetical framework. Biological
Psychology, 45, 73-93.
Hoever, I. J., van Knippenberg, D., van Ginkel, W. P., & Barkema, H. G. (2012).
Fostering team creativity: Perspective taking as key to unlocking diversity's
potential. Journal of Applied Psychology, 97, 982-996.
Hoffman, B. J., Blair, C. A., Meriac, J. P., & Woehr, D. J. (2007). Expanding the
criterion domain? A quantitative review of the OCB literature. Journal of Applied
Psychology, 92, 555-566.
Hofmann, S. G., Sawyer, A. T., Witt, A. A., & Oh, D. (2010). The effect of mindfulness-
based therapy on anxiety and depression: A meta-analytic review. Journal of
Consulting and Clinical Psychology, 78, 169-183.
172
-Olivier, Z., Vago, D. R., & Ott, U.
(2011). How does mindfulness meditation work? Proposing mechanisms of action
from a conceptual and neural perspective. Perspectives on Psychological Science,
6, 537-559.
Hox, J. J. (2010). Multilevel analysis: Techniques and Applications. (2nd ed.). New York,
NY: Routledge.
Hülsheger, U. R., Alberts, H. J. E. M., Feinholdt, A., & Lang, J. W. B. (2013). Benefits
of mindfulness at work: The role of mindfulness in emotion regulation, emotional
exhaustion, and job satisfaction. Journal of Applied Psychology, 98, 310-325.
Hülsheger, U. R., Lang, J. W. B., Depenbrock, F., Fehrmann, C., Zijlstra, F. R. H., &
Alberts, H. J. E. M. (2014). The power of presence: The role of mindfulness at
work for daily levels and change trajectories of psychological detachment and
sleep quality. Journal of Applied Psychology, 99,, 1113-1128.
Hurtz, G. M., & Donovan, J. J. (2000). Personality and job performance: The Big Five
revisited. Journal of Applied Psychology, 85, 869-879.
Idaszak, J. R., & Drasgow, F. (1987). A revision of the job diagnostic survey:
Elimination of a measurement artifact. Journal of Applied Psychology, 72, 69-74.
Ilies, R., Fulmer, I. S., Spitzmuller, M., & Johnson, M. D. (2009). Personality and
citizenship behavior: The mediating role of job satisfaction. Journal of Applied
Psychology, 94, 945-959.
Ilies, R., Nahrgang, J. D., & Morgeson, F. P. (2007). Leader-member exchange and
citizenship behaviors: A meta-analysis. Journal of Applied Psychology, 92, 269-
277.
173
Irving, J. A., Park-Saltzman, J., Fitzpatrick, M., Dobkin, P. L., Chen, A., & Hutchinson,
T. (2014). Experiences of health care professionals enrolled in mindfulness-based
medical practice: A grounded theory model. Mindfulness, 5, 60-71.
Jankowski, T., & Holas, P. (2014). Metacognitive model of mindfulness. Consciousness
and Cognition: An International Journal, 28, 64-80.
Jha, A. P., Krompinger, J., & Baime, M. J. (2007). Mindfulness training modifies
subsystems of attention. Cognitive, Affective & Behavioral Neuroscience, 7, 109-
119.
Johnson, A., Hong, H., Groth, M., & Parker, S. K. (2011). Learning and development:
Promoting nurses' performance and work attitudes. Journal of Advanced Nursing,
67, 609-620.
Judge, T. A., & Bono, J. E. (2001). Relationship of core self-evaluations traits—self-
esteem, generalized self-efficacy, locus of control, and emotional stability—with
job satisfaction and job performance: A meta-analysis. Journal of Applied
Psychology, 86, 80-92.
Judge, T. A., Bono, J. E., & Locke, E. A. (2000). Personality and job satisfaction: The
mediating role of job characteristics. Journal of Applied Psychology, 85, 237-249.
Judge, T. A., Heller, D., & Mount, M. K. (2002). Five-factor model of personality and
job satisfaction: A Meta-analysis. Journal of Applied Psychology, 87, 530-541.
Judge, T. A., Rodell, J. B., Klinger, R. L., Simon, L. S., & Crawford, E. R. (2013).
Hierarchical representations of the five-factor model of personality in predicting
job performance: Integrating three organizing frameworks with two theoretical
perspectives. Journal of Applied Psychology, 98, 875-925.
174
Judge, T. A., Thoresen, C. J., Bono, J. E., & Patton, G. K. (2001). The job satisfaction-
job performance relationship: A qualitative and quantitative review.
Psychological Bulletin, 127, 376-407.
Kabat-Zinn, J. (1990). Full catastrophe living: Using the wisdom of your body and mind
to face stress, pain, and illness. New York, NY: Delacorte Press.
Kabat-Zinn, J. (2003). Mindfulness-based interventions in context: Past, present, and
future. Clinical Psychology: Science and Practice, 10, 144-156.
Kamdar, D., McAllister, D. J., & Turban, D. B. (2006). "All in a day's work": How
follower individual differences and justice perceptions predict OCB role
definitions and behavior. Journal of Applied Psychology, 91, 841-855.
Kaplan, S., Bradley, J. C., Luchman, J. N., & Haynes, D. (2009). On the role of positive
and negative affectivity in job performance: A meta-analytic investigation.
Journal of Applied Psychology, 94, 162-176.
Keng, S., Smoski, M. J., & Robins, C. J. (2011). Effects of mindfulness on psychological
health: A review of empirical studies. Clinical Psychology Review, 31, 1041-
1056.
Kiburz, K. M. (2012). Being present at work and at home: Can a mindfulness-based
intervention reduce work-family conflict? Graduate School Theses and
Dissertations. Retrieved at http://scholarcommons.usf.edu/etd/4348
Kluemper, D. H., McLarty, B. D., & Bing, M. N. (2015). Acquaintance ratings of the Big
Five personality traits: Incremental validity beyond and interactive effects with
self-reports in the prediction of workplace deviance. Journal of Applied
Psychology, 100, 237-248.
175
Krasner, M. S., Epstein, R. M., Beckman, H., Suchman, A. L., Chapman, B., Mooney, C.
J., et al. (2009). Association of an educational program in mindful communication
with burnout, empathy, and attitudes among primary care physicians. JAMA:
Journal of the American Medical Association, 302, 1284-1293.
Lazarus, R. S. (1991). Progress on a cognitive-motivational-relational theory of emotion.
American Psychologist, 46, 819-834.
Leckie, G. (2013). Cross-classified multilevel models. LEMMA VLE Module 12, 1-60.
Accessed at http://www.bristol.ac.uk/cmm/learning/course.html
Leckie, G. and Baird, J.-A. (2011). Rater effects on essay scoring: A multilevel analysis
of severity drift, central tendency and rater experience. Journal of Educational
Measurement, 48, 399-418.
Lee, K., Carswell, J. J., & Allen, N. J. (2000). A meta-analytic review of occupational
commitment: Relations with person- and work-related variables. Journal of
Applied Psychology, 85, 799-811.
LePine, J. A., Erez, A., & Johnson, D. E. (2002). The nature and dimensionality of
organizational citizenship behavior: A critical review and meta-analysis. Journal
of Applied Psychology, 87, 52-65.
Leroy, H., Anseel, F., Dimitrova, N. G., & Sels, L. (2013). Mindfulness, authentic
functioning, and work engagement: A growth modeling approach. Journal of
Vocational Behavior, 82, 238-247.
LifeTalk Radio. (2013). Health and Longevity Podcast. Accessed at
http://www.lifetalk.net/podcast.php?channel=8
176
Lim, S., Cortina, L. M., & Magley, V. J. (2008). Personal and workgroup incivility:
Impact on work and health outcomes. Journal of Applied Psychology, 93, 95-107.
Lipsey, M. W., & Cordray, D. S. (2000). Evaluation methods for social intervention.
Annual Review of Psychology, 51, 345-375.
Long, E. C., & Christian, M. S. (2015). Mindfulness buffers retaliatory responses to
injustice: A regulatory approach. Journal of Applied Psychology. Advance online
publication. http://dx.doi.org/10.1037/apl0000019
MacCoon, D. G., Imel, Z. E., Rosenkranz, M. A., Sheftel, J. G., Weng, H. Y., Sullivan, J.
C., et al. (2012). The validation of an active control intervention for Mindfulness
Based Stress Reduction (MBSR). Behaviour Research and Therapy, 50, 3-12.
MacDonald, W. (2003). The impact of job demands and workload on stress and fatigue.
Australian Psychologist, 38, 102-117.
MacKinnon, D. P. (2008). Introduction to statistical mediation analysis. New York, NY:
Erlbaum
Malarkey, W. B., Jarjoura, D., & Klatt, M. (2013). Workplace based mindfulness practice
and inflammation: A randomized trial. Brain, Behavior, and Immunity, 27, 145-
154.
Malinowski, P. (2013). Neural mechanisms of attentional control in mindfulness
meditation. Frontiers in Neuroscience, 7, 1-11.
Marsh, H. W., Wen, Z., Hau, K., & Nagengast, B. (2013). Structural equation models of
latent interaction and quadratic effects. In G. R. Hancock & R. O. Mueller (eds.),
Structural equation modeling: A second course (2nd ed.). (pp. 267-308).
Charlotte, NC: IAP Information Age Publishing.
177
Masicampo, E. J., & Baumeister, R. F. (2007). Relating mindfulness and self-regulatory
processes. Psychological Inquiry, 18, 255-258.
Maslach, C., & Jackson, S. E. (1981). The measurement of experienced burnout. Journal
of Occupational Behaviour, 2, 99-113.
McClelland, G. H., & Judd, C. M. (1993). Statistical difficulties of detecting interactions
and moderator effects. Psychological Bulletin, 114, 376-390.
McCrae, R. R., & John, O. P. (1992). An introduction to the five-factor model and its
applications. Journal of Personality, 2, 175-215.
McKay, P. F., & McDaniel, M. A. (2006). A reexamination of black-white mean
differences in work performance: More data, more moderators. Journal of Applied
Psychology, 91, 538-554.
Meyers, J. L., & Beretvas, S. N. (2006). The impact of inappropriate modeling of cross-
classified data structures. Multivariate Behavioral Research, 41, 473-497.
Michel, J. S., Kotrba, L. M., Mitchelson, J. K., Clark, M. A., & Baltes, B. B. (2011).
Antecedents of work-family conflict: A meta-analytic review. Journal of
Organizational Behavior, 32, 689-725.
Miner, A. G., & Glomb, T. M. (2010). State mood, task performance, and behavior at
work: A within-persons approach. Organizational Behavior and Human Decision
Processes, 112, 43-57.
Mitchell, T. R., & Daniels, D. (2003). Motivation in organizations. In W.C. Borman, R.
Klimoski, and D.R. Ilgen (Eds.), Handbook of psychology: Industrial and
organizational psychology, Vol. 12, New York: Wiley.
178
Morrison, A. B., Goolsarran, M., Rogers, S. L., & Jha, A. P. (2014). Taming a wandering
attention: Short-form mindfulness training in student cohorts. Frontiers in Human
Neuroscience, 7, 897.
Motowidlo, S. J. (2003). Job performance. In W. C. Borman, D. R. Ilgen, & R. J.
Klimoski (eds), Handbook of Psychology, Vol. 12: Industrial and Organizational
Psychology (pp. 39-53). Hoboken, NJ: Wiley.
Motowidlo, S. J., Packard, J. S., & Manning, M. R. (1986). Occupational stress: Its
causes and consequences for job performance. Journal of Applied Psychology, 71,
618-629.
Mrazek, M. D., Franklin, M. S., Phillips, D. T., Baird, B., & Schooler, J. W. (2013).
Mindfulness training improves working memory capacity and GRE performance
while reducing mind wandering. Psychological Science, 24, 776-781.
Muthén, B. O. (1994). Multilevel covariance structure analysis. Sociological Methods
and Research, 22, 376-398.
Muthén, B. O. (2010). Bayesian analysis in Mplus: A brief introduction. Accessed at
https://www.statmodel.com/download/IntroBayesVersion%203.pdf
Muthén, B., & Asparouhov, T. (2012). Bayesian structural equation modeling: A more
flexible representation of substantive theory. Psychological Methods, 17, 313-
335.
Muthén, B. O., & Curran, P. J. (1997). General longitudinal modeling of individual
differences in experimental designs: A latent variable framework for analysis and
power estimation. Psychological Methods, 2, 371-402.
179
Muthén, L. K., & Muthén, B. O. (2012). Mplus user’s guide (7th ed.). Los Angeles, CA:
Muthén & Muthén.
Nettle, D. (2006). The evolution of personality variation in humans and other animals.
American Psychologist, 61, 622-631.
Ng, T. W. H., & Feldman, D. C. (2008). The relationship of age to ten dimensions of job
performance. Journal of Applied Psychology, 93, 392-423.
Organ, D. W., & Lingl, A. (1995). Personality, satisfaction, and organizational
citizenship behavior. Journal of Social Psychology, 135, 339-350.
Parker, S. K., & Axtell, C. M. (2001). Seeing another viewpoint: Antecedents and
outcomes of employee perspective taking. Academy of Management Journal, 44,
1085-1100.
Parker, S. K., Johnson, A., Collins, C., & Nguyen, H. (2013). Making the most of
structural support: Moderating influence of employees' clarity and negative affect.
Academy of Management Journal, 56, 867-892.
Podsakoff, P. M., MacKenzie, S. B., Lee, J., & Podsakoff, N. P. (2003). Common method
biases in behavioral research: A critical review of the literature and recommended
remedies. Journal of Applied Psychology, 88, 879-903.
Preacher, K. J., Wichman, A. L., MacCallum, R. C., & Briggs, N. E. (2008). Latent
growth curve modeling (Vol. 157). Thousand Oaks, CA: Sage.
Preacher, K. J., Zhang, Z., & Zyphur, M. J. (in press). Multilevel structural equation
models for assessing moderation within and across levels of analysis.
Psychological Methods. Accessed at
http://www.quantpsy.org/pubs/preacher_zhang_zyphur_%28in.press%29.pdf
180
Preacher, K. J., Zyphur, M. J., & Zhang, Z. (2010). A general multilevel SEM framework
for assessing multilevel mediation. Psychological Methods, 15, 209-233.
Prentice, D. A., & Miller, D. T. (1992). When small effects are impressive. Psychological
Bulletin, 112, 160-164
Rasbash, J., Charlton, C., Browne, W.J., Healy, M. and Cameron, B. (2009) MLwiN
Version 2.1. Centre for Multilevel Modelling, University of Bristol.
Rasbash, J., Leckie, G., Pillinger, R. & Jenkins, J. (2010). Children's educational
progress: partitioning family, school and area effects, Journal of the Royal
Statistical Society: Series A, 173, 1-26.
Raudenbush, S. W., & Bryk, A. S. (2002). Hierarchical linear models: Applications and
data analysis methods (2nd ed.). Thousand Oaks, CA: Sage.
Reb, J., Narayanan, J., & Ho, Z. W. (2015). Mindfulness at work: Antecedents and
consequences of employee awareness and absent-mindedness. Mindfulness, 6,
111-122.
Rich, B. L., LePine, J. A., & Crawford, E. R. (2010). Job engagement: Antecedents and
effects on job performance. Academy of Management Journal, 53, 617-635.
Rizzo, J. R., House, R. J., & Lirtzman, S. I. (1970). Role conflict and ambiguity in
complex organizations. Administrative Science Quarterly, 15, 150-163.
Roche, M., Haar, J. M., & Luthans, F. (2014). The role of mindfulness and psychological
capital on the well-being of leaders. Journal of Occupational Health Psychology,
19, 476-489.
Roeser, R. W., Schonert-Reichl, K. A., Jha, A., Cullen, M., Wallace, L., Wilensky, R., et
al. (2013). Mindfulness training and reductions in teacher stress and burnout:
181
Results from two randomized, waitlist-control field trials. Journal of Educational
Psychology, 105, 787-804.
Roth, P. L., Huffcutt, A. I., & Bobko, P. (2003). Ethnic group differences in measures of
job performance: A new meta-analysis. Journal of Applied Psychology, 88, 694-
706.
Rotundo, M., & Sackett, P. R. (2002). The relative importance of task, citizenship, and
counterproductive performance to global ratings of job performance: A policy-
capturing approach. Journal of Applied Psychology, 87, 66-80.
Rubin, H. R., Gandek, B., Rogers, W. H., Kosinski, M., McHorney, C. A., & Ware, J. E.
Jr. (1993). Patients' ratings of outpatient visits in different practice settings:
Results from the Medical Outcomes Study. Journal of the American Medical
Association, 270, 835-840.
Ryan, A. M., & Ployhart, R. E. (2003). Customer service behavior. In W. C. Borman, D.
R. Ilgen, & R. J. Klimoski (Eds.), Handbook of psychology: Industrial and
organizational psychology (Vol. 12, pp. 377–397). London: Wiley.
Sage Publications. (2012). Relationship Matters Podcast Number 18 “Positive social ties
and long-term health outcomes”. Accessed at
http://spr.sagepub.com/site/podcast/podcast_dir.xhtml
Salgado, J. F., Anderson, N., Moscoso, S., Bertua, C., de Fruyt, F., & Rolland, J. P.
(2003). A meta-analytic study of general mental ability validity for different
occupations in the European community. Journal of Applied Psychology, 88,
1068-1081.
182
Schaufeli, W.B., Salanova, M., González-Romá, V., & Bakker, A. B. (2002). The
measurement of engagement and burnout: A confirmative analytic approach.
Journal of Happiness Studies, 3, 71-92.
Schneider, B., White, S. S., & Paul, M. C. (1998). Linking service climate and customer
perceptions of service quality: Tests of a causal model. Journal of Applied
Psychology, 83, 150-163.
Schwartz, S. H. (1977). Normative influences on altruism. In L. Berkowitz (Ed.),
Advances in Experimental Social Psychology (Vol. 10, pp. 221–279). New York:
Academic Press.
Scott, K. L., & Duffy, M. K. (2015). Antecedents of workplace ostracism: New directions
in research and intervention, Research in Occupational Stress and Well-being, 13,
137-165.
Sedlmeier, P., Eberth, J., Schwarz, M., Zimmermann, D., Haarig, F., Jaeger, S., et al.
(2012). The psychological effects of meditation: A meta-analysis. Psychological
Bulletin, 138, 1139-1171.
Shadish, W. R., Cook, T. D., & Campbell, D. T. (2002). Experimental and quasi-
experimental designs for generalized causal inference. Boston, MA: Houghton
Mifflin.
Shao, R., & Skarlicki, D. P. (2009). The role of mindfulness in predicting individual
performance. Canadian Journal of Behavioural Science, 41, 195- 201.
Shapiro, S. L., Carlson, L. E., Astin, J. A., & Freedman. B. (2006). Mechanisms of
mindfulness. Journal of Clinical Psychology, 62, 373-386.

183
Shonin, E., Gordon, W. V., Dunn, T. J., Singh, N. N., & Griffiths, M. D. (2014).
Meditation Awareness Training (MAT) for work-related wellbeing and job
performance: A randomised controlled trial. International Journal of Mental
Health and Addiction, 12, 806-823.
Siegel, D. J. (2007). The mindful brain: Reflection and attunement in the cultivation of
well-being. New York: Norton.
Snijders, T. A. B., & Bosker, R. (2012). Multilevel analysis: An introduction to basic and
advanced multilevel modeling (2nd ed.). Los Angeles, CA: Sage.
Snow, R. (1991). Aptitude-treatment interaction as a framework for research on
individual differences in psychotherapy. Journal of Consulting and Clinical
Psychology, 59, 205-216.
Spiegelhalter, D. J., Thomas, A., Best, N. G., & Lunn, D. (2002). WinBUGS user manual
(Version 1.4). Cambridge, England: MRC Biostatistics Unit 26.
Stulz, N., Kunzler, A., Barth, J., & Hepp, U. (2014). Aptitude-treatment interaction
effects in psychooncological interventions. General Hospital Psychiatry, 36, 68-
73.
Tetrick, L. E., & Winslow, C. J. (2015). Workplace stress management interventions and
health promotion. Annual Review of Organizational Psychology and
Organizational Behavior, 2, 583-603.
Timmermans, A. C., Snijders, T. A. B., & Bosker, R. J. (2013). In search of value added
in the case of complex school effects. Educational and Psychological
Measurement, 73, 210-228.
184
Trougakos, J. P., Hideg, I., Cheng, B. H., & Beal, D. J. (2014). Lunch breaks unpacked:
The role of autonomy as a moderator of recovery during lunch. Academy of
Management Journal, 57, 405-421.
U.S. Department of Health and Human Services. (2013). The U.S. Health Workforce
Chartbook. Accessed online at
http://bhpr.hrsa.gov/healthworkforce/supplydemand/usworkforce/chartbook/index
.html
Vachon, D. D., Lynam, D. R., & Johnson, J. A. (2014). The (non)relation between
empathy and aggression: Surprising results from a meta-analysis. Psychological
Bulletin, 140, 751-773.
Van Iddekinge, C. H., Ferris, G. R., Perrewe, P. L., Perryman, A. A., Blass, F. R., &
Heetderks, T. D. (2009). Effects of selection and training on unit-level
performance over time: A latent growth modeling approach. Journal of Applied
Psychology, 94, 829-843.
Veit, C. T., & Ware, J. E., Jr. (1983). The structure of psychological distress and well-
being in general populations. Journal of Counseling and Clinical Psychology, 51,
730-742.
Wanous, J. P., Reichers, A. E., & Hudy, M. J. (1997). Overall job satisfaction: How good
are single-item measures? Journal of Applied Psychology, 82, 247–252.
Watson, D., & Clark, L. A. (1994). The PANAS-X: Manual for the Positive and Negative
Affect Schedule-Expanded Form. Accessed at
http://www2.psychology.uiowa.edu/faculty/clark/panas-x.pdf
185
Weiss, H. M., & Cropanzano, R. (1996). Affective events theory: A theoretical
discussion of the causes and consequences of affective experiences at work. In B.
M. Staw & L. L. Cummings (Eds.), Research in Organizational Behavior, Vol.
18, pp. 1-74, Greenwich, CT: JAI Press.
Westerberg, C. E., Lundgren, E. M., Florczak, S. M., Mesulam, M. M., Weintraub, S.,
Zee, P. C., et al. (2010). Sleep influences the severity of memory disruption in
amnestic mild cognitive impairment: Results from sleep self-assessment and
continuous activity monitoring. Alzheimer Disease and Associated Disorders, 24,
325-333.
Williams, L. J., & Anderson, S. E. (1991). Job satisfaction and organizational
commitment as predictors of organizational citizenship and in-role behaviors.
Journal of Management, 17, 601–617.
Wolever, R. Q., Bobinet, K. J., McCabe, K., Mackenzie, E. R., Fekete, E., Kusnick, C.
A., et al. (2012). Effective and viable mind-body stress reduction in the
workplace: A randomized controlled trial. Journal of Occupational Health
Psychology, 17, 246-258.
Woods, H., & Proeve, M. (2014). Relationships of mindfulness, self-compassion, and
meditation experience with shame-proneness. Journal of Cognitive
Psychotherapy, 28, 20-33.
Wright, T. A., & Bonett, D. G. (2002). The moderating effects of employee tenure on the
relation between organizational commitment and job performance: A meta-
analysis. Journal of Applied Psychology, 87, 1183-1190.
186
Wright, A. G. C., Hallquist, M. N., Swartz, H. A., Frank, E., & Cyranowski, J. M. (2014).
Treating co-occurring depression and anxiety: Modeling the dynamics of
psychopathology and psychotherapy using the time-varying effect model. Journal
of Consulting and Clinical Psychology, 82, 839-853.
Zeidan, F., Johnson, S. K., Diamond, B. J., David, Z., & Goolkasian, P. (2010).
Mindfulness meditation improves cognition: Evidence of brief mental training.
Consciousness and Cognition: An International Journal, 19, 597-605.
Zhang, J., Ding, W., Li, Y., & Wu, C. (2013). Task complexity matters: The influence of
trait mindfulness on task and safety performance of nuclear power plant operators.
Personality and Individual Differences, 55, 433-439.
Zhang, Z., Zyphur, M. J., & Preacher, K. J. (2009). Testing multilevel mediation using
hierarchical linear models: Problems and solutions. Organizational Research
Methods, 12, 695–719.
Zhou, L., Wang, M., Chen, G., & Shi, J. (2012). Supervisors' upward exchange
relationships and subordinate outcomes: Testing the multilevel mediation role of
empowerment. Journal of Applied Psychology, 97, 668-680.

187
Appendix I: Recruitment Materials
Recruitment Handout

188
Appendix II: Consent Forms
Employee Consent Form
University of Minnesota Worker Wellness Initiative
You are invited to be in a research study focused on patient experience and worker wellness. You were selected as a possible participant because you work for [Organization Name]. Please read this form and contact the researchers with any questions you havebefore agreeing to be in the study.
This study is being conducted by Tao Yang, Ph.D. Candidate, and Theresa Glomb,Professor, at the University of Minnesota, Carlson School of Management.
The purposes of this study are twofold: 1) to find out whether different types of wellness programs influence workers’ well-being, and 2) to collect information about patient experience.
The study is approved by the University of Minnesota Institutional Review Board (#1405P51001).
Click “Continue” to learn more about your eligibility to participate in the study.
The following employees are currently eligible for the study:
1. Full time employees (five days a week)* available during the study period between September 15 and October 3, 2014.
2. Employees who work with patients in person ** (administrative and clinical)
* Part-time or full-time 4-day work week employees will be put on a wait list and may be included in the study if space is available.
** Employees who work with patients primarily over the phone will be put on a wait list and may be included in the study if space is available.
Click “Continue” to learn more about what you would be asked to do if you chose to participate in our study.
This study has two stages – Preliminary and Active. If you agree to be in this study, you will be asked to do one thing in the Preliminary stage:
1. Complete a background survey online (15-20 minutes) that asks general questions about your job and your attitudes, behaviors, and characteristics. Once you complete the Preliminary stage, you will be eligible to enter the Active stage of the study, which will last three weeks, from September 15 to October 3, 2014, Monday through Friday. There will be no research activity on the weekend.
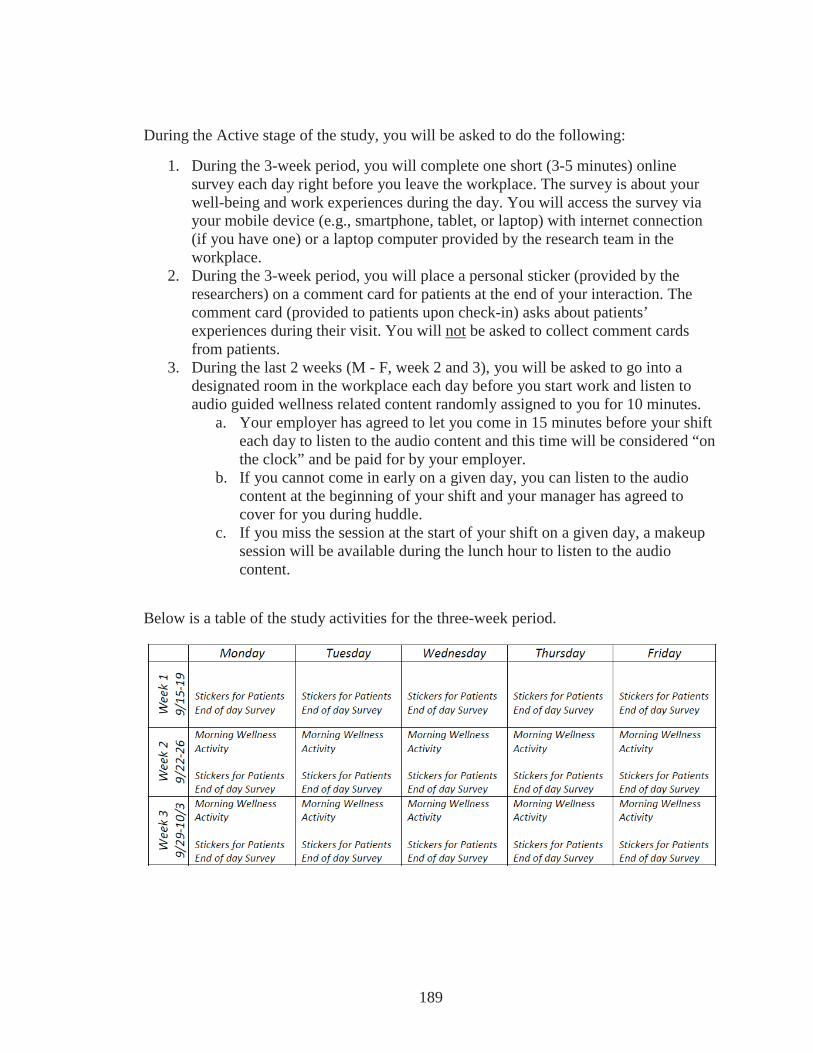
189
During the Active stage of the study, you will be asked to do the following:
1. During the 3-week period, you will complete one short (3-5 minutes) online survey each day right before you leave the workplace. The survey is about your well-being and work experiences during the day. You will access the survey via your mobile device (e.g., smartphone, tablet, or laptop) with internet connection (if you have one) or a laptop computer provided by the research team in the workplace.
2. During the 3-week period, you will place a personal sticker (provided by the researchers) on a comment card for patients at the end of your interaction. The comment card (provided to patients upon check-in) asks about patients’ experiences during their visit. You will not be asked to collect comment cards from patients.
3. During the last 2 weeks (M - F, week 2 and 3), you will be asked to go into a designated room in the workplace each day before you start work and listen to audio guided wellness related content randomly assigned to you for 10 minutes.
a. Your employer has agreed to let you come in 15 minutes before your shift each day to listen to the audio content and this time will be considered “on the clock” and be paid for by your employer.
b. If you cannot come in early on a given day, you can listen to the audio content at the beginning of your shift and your manager has agreed to cover for you during huddle.
c. If you miss the session at the start of your shift on a given day, a makeup session will be available during the lunch hour to listen to the audio content.
Below is a table of the study activities for the three-week period.
190
Overall time commitment
Your total active time commitment for the study will be approximately 4-5 hours. During the first 5 workdays, you will complete one survey a day at work of approximately 3-5 minutes and place a sticker on comment cards for each patient you have interacted with (a total of 3-4 minutes per day). During the last 10 workdays, you will add the wellness activity (10 minutes each day) in addition to the daily surveys and stickers. You will also spend 15-20 minutes to complete the background survey.
Click “Continue” to learn more about potential risks and benefits associated with participation in the study and how you can earn up to $100 for your participation.
Risks and Benefits of Being in the Study
There are only minimal risks associated with participation in this study that we want to make you aware of.
1. You might feel frustrated by having to answer one survey and place stickers on patient cards each day. For some participants, the demands of the study might become frustrating over the course of three weeks.
2. The study has the potential to interfere with your work duties. Your employer has agreed to let you do the end-of-workday surveys, sticker handoffs, and wellness activity on work time. But, if these activities interfere with your job duties, you are asked to skip the research activities and make your job the first priority.
3. Although it is only listening to wellness audio content, some participants may feel uneasy or not enjoy these activities.
4. We will be asking you to report personal information about your work attitudes and behaviors (in the background survey and daily surveys), which may feel intrusive to some participants. Since it is important to our study to have complete data, you will generally not be allowed to skip survey items except some optional items on the background survey.
If you start the study and then feel uncomfortable at any point in the process, you are free to stop your participation at any time. If you want to stop, simply stop responding to the surveys, and then let the researcher know that you are no longer going to participate in the study (email: [email protected]).
There are no proven direct benefits to participation in the study.
Compensation:
You will receive a cash card as compensation for your time and participation in this study. Payment for the three-week period is $100.00 if you have completed at least 80% of the required surveys, sticker handoffs, and wellness activities. Participants who complete the three weeks but who complete fewer than 80% of the total surveys, sticker handoffs, and wellness activities will receive $75.00. Payment will be prorated for those

191
who stop the study before the end of the three-week period ($25.00 for one week, $50.00 for two weeks).
Click “Continue” to learn more about confidentiality and how to enroll in the study, or get answers to any questions you may have.
Confidentiality:
The records of this study will be kept private. In any report we might publish, we will not include any information that will make it possible to identify you. Your surveys will be associated only with a randomly assigned ID number (not your name) so that we can link the data from different sources. In reports to your organization, no individual participants will be identified and your data will be combined with those of other participants. Only the researchers will have access to your individual records, which will be identified with a randomly assigned ID number.
Voluntary Nature of the Study:
Participation in this study is voluntary. Your decision whether or not to participate will not affect your current or future relations with the University of Minnesota, or with the researchers (PhD Candidate Yang and Professor Glomb), or with [Organization Name]. If you decide to participate, you are free to withdraw at any time without affecting those relationships.
Contacts and Questions:
The researchers conducting this study are: Theresa Glomb, McFarland Professor of Organizational Behavior, and Tao Yang, Ph.D. Candidate. If you have any questions about this research, please click on the “contact researchers” button below to send an email. If you have questions later, you are encouraged to contact the researchers by email at [email protected] or 651.434.7749. If you have any questions or concerns regarding this study and would like to talk to someone other than the researcher(s), you are encouraged to contact the Research Subjects’ Advocate Line, D528 Mayo, 420 Delaware St. Southeast, Minneapolis, Minnesota 55455; (612) 625-1650.
If you would like to participate in the study, please click on the “Yes, I would like to participate” button below.
If you do not wish to participate in the study, click “No, I do not want to participate”
If you would like to ask a question, please click on the “I would like to contact the researchers with questions” button below.
[ ] Yes, I would like to participate (please click here even if you are unsure if you are eligible)
[ ] No, I do not want to participate

192
[ ] I would like to contact the researchers with questions
If no,
Thank you for considering participation in the University of Minnesota Worker Wellness Initiative.
If contacting the researchers with questions,
You can contact the project researchers by writing us at [email protected] or call us at (651) 434-7749. Thank you for your interest in this study!
If yes,
Thank you for your interest in our study. Please fill in the following information so that we may contact you with information about the next step.
First Name: _____________
Last Name: _____________
Phone Number: ____________
E-mail Address: ____________
Confirm E-mail Address: ________
Please click “continue” to complete some brief screening questions, to make sure you are eligible to participate in the study.
Are you between age 18 and 65 (Yes/No)If Yes, go to next item. If No, “At this time you do not meet the requirements for participation in the study. Thank you for your interest.”
Do you work full time (five days a week)? (Yes/No)If Yes, go to next item.
If No, “Please tell us a little about your schedule. How many hours a week do you work? How many days per week do you work? Does your regular schedule include evening hours?”
Your information has been forwarded to the researchers. We are currently seeking full time employees but employees who work four days a week may also be eligible. You will be contacted by the researchers concerning your eligibility to participate in this study.
During a typical day, do you work with patients face-to-face? (Yes/No)
If Yes, “You have passed the screening criteria for the study. Please read carefully the non-disclosure statement and indicate your agreement by checking the box below.”
193
To protect the random assignment study design, the researchers ask you not to share information about your wellness activity with anyone in your organization (e.g., your supervisor, coworkers, and patients) for the duration of the study, from September 15 to October 3, 2014. After completion of the study and following debriefing from the researchers, you will be free to share with others.
___ I agree with the above statement.
Thank you for agreeing to be in the study. A researcher will be contacting you soon to arrange for completion of the background survey.
If No, “Your information has been forwarded to the researchers. We are currently seeking employees who work with patients in person, but employees who work with patients by other means may also be eligible. You will be contacted by the researchers concerning your eligibility to participate in this study.”
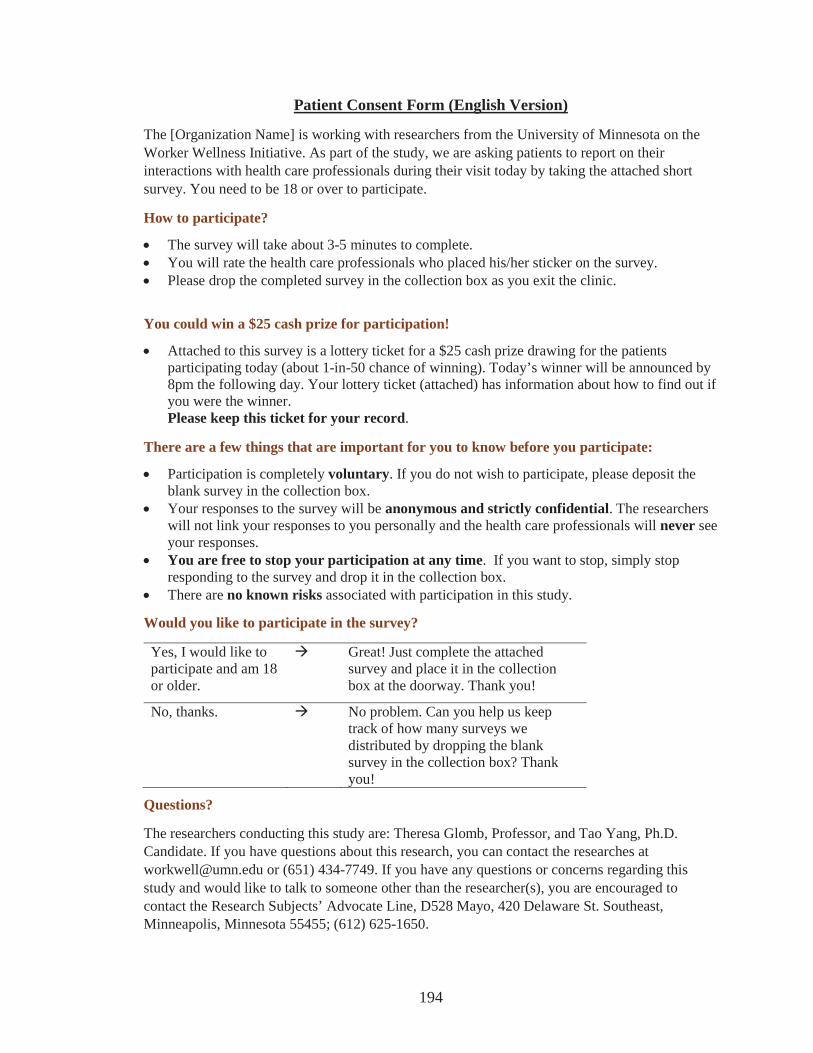
194
Patient Consent Form (English Version)
The [Organization Name] is working with researchers from the University of Minnesota on the Worker Wellness Initiative. As part of the study, we are asking patients to report on their interactions with health care professionals during their visit today by taking the attached short survey. You need to be 18 or over to participate.
How to participate?
The survey will take about 3-5 minutes to complete.You will rate the health care professionals who placed his/her sticker on the survey. Please drop the completed survey in the collection box as you exit the clinic.
You could win a $25 cash prize for participation!
Attached to this survey is a lottery ticket for a $25 cash prize drawing for the patients participating today (about 1-in-50 chance of winning). Today’s winner will be announced by 8pm the following day. Your lottery ticket (attached) has information about how to find out if you were the winner. Please keep this ticket for your record.
There are a few things that are important for you to know before you participate:
Participation is completely voluntary. If you do not wish to participate, please deposit the blank survey in the collection box. Your responses to the survey will be anonymous and strictly confidential. The researchers will not link your responses to you personally and the health care professionals will never see your responses. You are free to stop your participation at any time. If you want to stop, simply stop responding to the survey and drop it in the collection box. There are no known risks associated with participation in this study.
Would you like to participate in the survey?
Yes, I would like to participate and am 18 or older.
Great! Just complete the attached survey and place it in the collection box at the doorway. Thank you!
No, thanks. No problem. Can you help us keep track of how many surveys we distributed by dropping the blank survey in the collection box? Thank you!
Questions?
The researchers conducting this study are: Theresa Glomb, Professor, and Tao Yang, Ph.D. Candidate. If you have questions about this research, you can contact the researches at [email protected] or (651) 434-7749. If you have any questions or concerns regarding this study and would like to talk to someone other than the researcher(s), you are encouraged to contact the Research Subjects’ Advocate Line, D528 Mayo, 420 Delaware St. Southeast, Minneapolis, Minnesota 55455; (612) 625-1650.
195
Patient Consent Form (Spanish Version)
La [XXX] está trabajando con investigadores de la Universidad de Minnesota en la Iniciativa para el Bienestar de los Trabajadores. Como parte del estudio, estamos solicitándole a los pacientes que nos informen acerca dela interacción que tuvieron con los profesionales del cuidado de la salud el día de hoy durante su visita, respondiendo la breve encuesta adjunta. Es necesario que usted sea mayor de 18 años para poder participar. ¿Cómo participar?
Le tomará de 3 a 5 minutos completar la encuesta.Usted evaluará a el/la profesional de la salud que haya colocado su etiqueta en la encuesta. Por favor, coloque la encuesta terminada dentro de la caja de recolección, al salir de la clínica.
¡Usted podría ganar un premio de $25 dólares por participar!Adjunto a esta encuesta se encuentra un boleto de lotería por un premio de $25 dólares, que será sorteado entre los pacientes que participen hoy (con a una probabilidad de ganar de 1 entre 50, aproximadamente). El ganador de hoy será anunciado a las 8 pm del día de mañana. Su boleto de lotería (adjunto) contiene la información para saber si usted ha resultado ganador. Por favor, conserve este boleto.
Es importante que usted sepa algunas cosas antes de participar: La participación es completamente voluntaria. Si usted no desea participar, por favor deposite la encuesta sin responder en la caja de recolección. Las respuestas que usted proporcione en la encuesta serán anónimas y estrictamente confidenciales. Los investigadores no vincularán sus respuestas con usted de manera personal, y los profesionales del cuidado de la salud nunca verán sus respuestas. Usted es libre de dejar de participar en cualquier momento. Si usted desea detenerse, simplemente deje de responder la encuesta y deposítela en la caja de recolección. No hay riesgos asociados conocidos con la participación en este estudio.
¿Le gustaría participar en esta encuesta?Sí, me gustaría participar y soy mayor de 18 años.
¡Estupendo! Solo complete la encuesta adjunta y colóquela en la caja de recolección ubicada en la puerta. ¡Gracias!
No, gracias. No hay problema. ¿Puede ayudarnos a llevar el conteo de las encuestas que distribuimos, colocando la encuesta en blanco dentro de la caja de recolección? ¡Gracias!
¿Preguntas?Los investigadores que realizan este estudio son: Theresa Glomb, Catedrática, y Tao Yang, Candidato a Doctorado. Si usted tiene preguntas o inquietudes acerca de esta investigación, puede contactar a los investigadores en [email protected] o en el número telefónico (651) 434-7749.Si usted tiene preguntas o inquietudes con respecto a este estudio y le gustaría hablar con alguien más que no sean los investigadores, le recomendamos contactar a la Línea para la Defensa de los Sujetos de Investigación, en: D528 Mayo, 420 Delaware St. Southeast, Minneapolis, Minnesota 55455; (612) 625-1650.

196
Appendix III: Surveys
Employee Background Survey
Section A: About Your Work
1. Below are some descriptions of your job. How much do you agree or disagree with
these descriptions?
1 = strongly disagree, 2 = disagree, 3 = slightly disagree, 4 = neither agree nor disagree, 5
= slightly agree, 6 = agree, 7 = strongly agree
a) The job gives me a chance to use my personal initiative and judgment in carrying
out the work.
b) The job allows me to decide on my own how to go about doing my work.
c) The job gives me considerable opportunity for independence and freedom in how
I do the work.
2. Below are some ways people may feel about their jobs. Using the scale below, please
indicate how much you agree or disagree with the following statements.
1 = strongly disagree, 2 = disagree, 3 = slightly disagree, 4 = neither agree nor disagree, 5
= slightly agree, 6 = agree, 7 = strongly agree
a) Most days I am enthusiastic about my work.
b) I feel fairly satisfied with my present job.
c) I find real enjoyment in my work.
d) Each day at work seems like it will never end.
e) I consider my job rather unpleasant.
3. Please tell us about the stress you feel because of your job. Please answer candidly;
remember that all of your responses will be kept completely confidential.
1 = strongly disagree, 2 = disagree, 3 = slightly disagree, 4 = neither agree nor disagree, 5
= slightly agree, 6 = agree, 7 = strongly agree
a) I feel a great deal of stress because of my job.
b) I almost never feel stressed at work.

197
4. To what extent do you agree or disagree with the following statements?
1 = strongly disagree, 2 = disagree, 3 = slightly disagree, 4 = neither agree nor disagree, 5
= slightly agree, 6 = agree, 7 = strongly agree
a) I feel emotionally drained from my work.
b) I dread having to face another day of work.
c) I feel used up from my job.
d) I feel burned out from my job.
e) I feel frustrated by my job.
5. Below are some statements regarding your skills and ability to perform your job.
Please indicate to what extent you agree or disagree with these statements.
1 = strongly disagree, 2 = disagree, 3 = slightly disagree, 4 = neither agree nor disagree, 5
= slightly agree, 6 = agree, 7 = strongly agree
At work…
a) when facing difficult tasks, I am certain that I will accomplish them.
b) I will be able to successfully overcome many challenges.
c) I am confident that I can perform effectively on many different tasks.
d) even when things are tough, I can perform quite well.
Section B: Interaction with Patients
1. These questions concern how you are able to carry out your job. Please rate what you
actually do, not what you think you should do.
How often do you. . .
1 = never, 2 = almost never, 3 = once in a while, 4 = sometimes, 5 = often, 6 = almost
always, 7 = always
a) perform the tasks that are expected as part of your job?
b) meet performance expectations?
How often do you. . .

198
–9 = not applicable, 1= never, 2 = almost never, 3 = once in a while, 4 = sometimes, 5 =
often, 6 = almost always, 7 = always
a) provide quality patient care or assistance?
b) provide timely patient care or assistance?
c) spend time thinking ahead to prevent possible complications?
d) spend time planning how a patient’s status and needs might change over time?
2. How much do you agree or disagree with the following statements about your
interactions with patients?
1 = strongly disagree, 2 = disagree, 3 = slightly disagree, 4 = neither agree nor disagree, 5
= slightly agree, 6 = agree, 7 = strongly agree
During interactions with patients, …
a) I frequently try to take patients’ perspectives.
b) I ask questions that show my understanding of patients’ situations.
c) I listen carefully to patients.
d) I respond to patients after careful considerations.
e) I make an effort to see the world through patients’ eyes.
f) I regularly seek to understand patients’ viewpoints.
g) I find my mind wandering.
h) I show patients that I am listening by using verbal acknowledgements or body
language (e.g., head nods).
i) I am sensitive to patients’ subtle meanings or cues.
j) I think of more than one way to react to patients.
k) I carefully observe how patients respond.
l) I pause to consider multiple options before responding to patients.
m) I react to patients in ways based on their situations.
n) I often imagine how patients are feeling.
3. On average, how many patients do you see or assist in a typical workday?
__________
4. In the last three months, how many medical errors did you report? ___
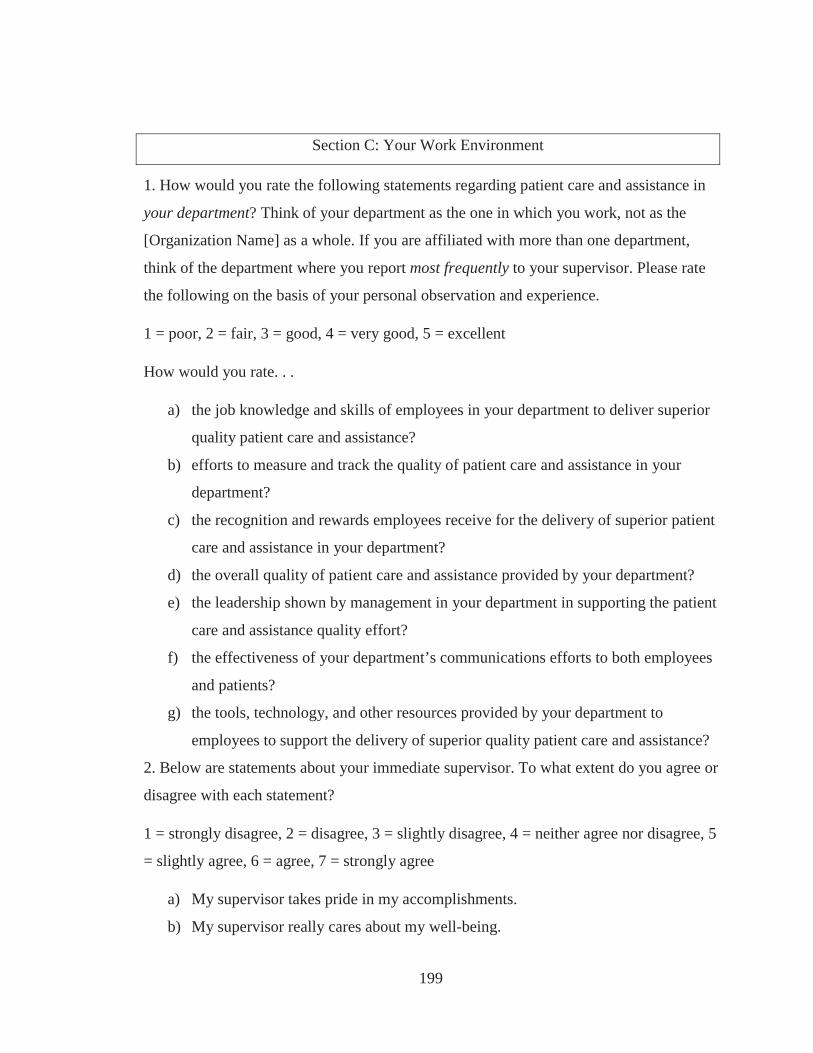
199
Section C: Your Work Environment
1. How would you rate the following statements regarding patient care and assistance in
your department? Think of your department as the one in which you work, not as the
[Organization Name] as a whole. If you are affiliated with more than one department,
think of the department where you report most frequently to your supervisor. Please rate
the following on the basis of your personal observation and experience.
1 = poor, 2 = fair, 3 = good, 4 = very good, 5 = excellent
How would you rate. . .
a) the job knowledge and skills of employees in your department to deliver superior
quality patient care and assistance?
b) efforts to measure and track the quality of patient care and assistance in your
department?
c) the recognition and rewards employees receive for the delivery of superior patient
care and assistance in your department?
d) the overall quality of patient care and assistance provided by your department?
e) the leadership shown by management in your department in supporting the patient
care and assistance quality effort?
f) the effectiveness of your department’s communications efforts to both employees
and patients?
g) the tools, technology, and other resources provided by your department to
employees to support the delivery of superior quality patient care and assistance?
2. Below are statements about your immediate supervisor. To what extent do you agree or
disagree with each statement?
1 = strongly disagree, 2 = disagree, 3 = slightly disagree, 4 = neither agree nor disagree, 5
= slightly agree, 6 = agree, 7 = strongly agree
a) My supervisor takes pride in my accomplishments.
b) My supervisor really cares about my well-being.

200
c) My supervisor values my contributions.
d) My supervisor strongly considers my goals and values.
e) My supervisor shows little concern for me.
f) My supervisor is willing to help me if I need a special favor.
3. Think about the coworkers who are closest to you at work. Below you will find a list of
things that your closest coworkers may have done in recent weeks. Please read each item
carefully and indicate how often these things have happened in your life in the previous
month.
1 = never, 2 = once or twice, 3 = about once a week, 4 = several times a week, 5 = almost
every day, 6 = every day
How often have the coworkers closest to you . . .
a) let you know that you did something well?
b) told you what s/he did in a situation that was similar to yours?
c) pitched in to help you do something that needed to be done?
d) expressed respect for a personal characteristic/quality of yours?
e) listened to your concerns about work?
f) helped you handle a stressful day at work?
Section D: About Yourself
1. Below are some ways people describe themselves. Using the scale below, please
indicate to what extent you agree or disagree with these statements about you. Think
about yourself as you generally are, not as you wish to be or think you should be.
1 = strongly disagree, 2 = disagree, 3 = slightly disagree, 4 = neither agree nor disagree, 5
= slightly agree, 6 = agree, 7 = strongly agree
I see myself as someone who. . .
a) is the life of the party.
b) sympathizes with others’ feelings.
c) gets chores done right away.
d) has frequent mood swings.

201
e) has a vivid imagination.
f) doesn’t talk a lot.
g) is not interested in other people's problems.
h) often forgets to put things back in their proper place.
i) is relaxed most of the time.
j) is not interested in abstract ideas.
k) talks to a lot of different people at parties.
l) feels others’ emotions.
m) likes order.
n) gets upset easily.
o) has difficulty understanding abstract ideas.
p) keeps in the background.
q) is not really interested in others.
r) makes a mess of things.
s) seldom feels blue.
t) does not have a good imagination.
2. Below is a collection of statements about your everyday experience. Using the scale
below, please indicate how frequently or infrequently you generally have each
experience. Please answer according to what really reflects your experience rather than
what you think your experience should be.
6 = almost always, 5 = very frequently, 4 = somewhat frequently, 3 = somewhat
infrequently, 2 = very infrequently, 1 = almost never
a) I could be experiencing some emotion and not be conscious of it until some time
later.
b) I break or spill things because of carelessness, not paying attention, or thinking of
something else.
c) I find it difficult to stay focused on what’s happening in the present.
d) I tend to walk quickly to get where I’m going without paying attention to what I
experience along the way.

202
e) I tend not to notice feelings of physical tension or discomfort until they really
grab my attention.
f) I forget a person’s name almost as soon as I’ve been told it for the first time.
g) It seems I am “running on automatic” without much awareness of what I’m doing.
h) I rush through activities without being really attentive to them.
i) I get so focused on the goal I want to achieve that I lose touch with what I am
doing right now to get there.
j) I do jobs or tasks automatically, without being aware of what I’m doing.
k) I find myself listening to someone with one ear, doing something else at the same
time.
l) I drive places on “automatic pilot” and then wonder why I went there.
m) I find myself preoccupied with the future or the past.
n) I find myself doing things without paying attention.
o) I snack without being aware that I’m eating.
3. Over the last three months, would you say your health is ...
Poor
Fair
Good
Very Good
Excellent
4. Over the past three months, how often have you . . .
1 = never, 2 = occasionally, 3 = sometimes, 4 = fairly often, 5 = most of the time
a) generally enjoyed the things you do?
b) felt tense or high-strung?
c) felt calm and peaceful?
d) felt downhearted and blue?
e) felt restless, fidgety, or impatient?

203
f) been moody or brooded about things?
g) felt cheerful and lighthearted?
h) been rattled, upset, or frustrated?
i) been a happy person?
j) been in low or very low spirits?
k) been anxious or worried?
l) felt tired?
m) felt depressed?
n) felt sluggish?
5. Are you . . . (select one)
[ ] male? [ ] female?[ ] Choose not to answer
6. How old are you? (in years) ________
7. What is the highest level of education you have completed? (select one)
Some high school (grade 11 or less) Graduated from high school or G.E.D. Some college or technical training beyond high school (1-3 years) Graduated from college (B.A., B.S., or other Bachelor’s degree) Some graduate school Graduate or professional degree (MBA, Master’s, Ph.D., J.D., etc.)

204
8. Are you . . . (check all that apply)
Asian, Asian American, or Pacific Islander? Black, African, or African American? Hispanic, Chicano, Latino, or Hispanic American? Middle Eastern, Arab, or Arab American? Native American, American Indian, or Alaskan Native? White, European, or European American? Other? Choose not to answer
9. What is your current marital status?
Single Married Same-sex domestic partnerLiving with a significant other or partner Divorced or separated Widowed Choose not to answer
10. How many hours do you work in a typical week? __________
11. When did you first come to work for your organization? ___ (month)/___ (year)
12. When did you start your current job in this organization? ___ (month)/___ (year)
13. What is your official job title? ___________
14. In which team/department at the [Organization Name] do you work? ___________
15. In your current position, do you supervise or manage other employees?
Yes
No
16. To best accommodate your work schedule during the Active Phase of the study,
please indicate your work schedule during the three-week period from September 15
(Monday of week1) to October 3, 2014 (Friday of week 3). We will arrange daily
research activities around your schedule.

205
From September 15 (Monday of week 1) to October 3, 2014 (Friday of week 3). . .
a) when will you normally start work? ____ am / pm (circle one)
b) when will your work normally end? ____ am / pm (circle one)
17. To access daily short surveys before leaving the workplace, do you prefer to use…?
[ ] personal device with internet connection (e.g., smartphone, tablet, laptop)?
(Recommended)
[ ] laptop provided by researchers at the worksite?

206
Employee End-of-Workday Survey
The first set of questions ask about your experiences yesterday. Tell us about your sleep, physical activity, and meals from yesterday.
How well did you sleep last night?
Very Poorly Poorly Moderately Well Well Very Well
How physically active (walking, biking, exercising) were you yesterday (during the day and evening)?
Not At All Slightly Moderately Quite A Bit Very Much
How nutritious and healthy were your meals and snacks yesterday (during the day and evening)?
Not At All Slightly Moderately Quite A Bit Very Much
The next set of questions ask about your experience today during your workday.
Today, which shift did you work?
I did not work today. I worked morning shift only. I worked afternoon shift only. I worked both morning and afternoon shifts.
Today, how many hours did you work? _______ (choose from 1, 2 …16, 17 or more)

207
Today at work, approximately how many patients did you see or assist? (choose from 0, 1, … 100, 101 or more)
Today at work, did you have to work faster than you would like to complete your work?
Not At All Slightly Somewhat Quite A Bit Very Much
Today at work, did you have too much work to do in too little time?
Not At All Slightly Somewhat Quite A Bit Very Much
Today at work, how much pressure did you feel under?
Not At All Slightly Somewhat Quite A Bit Very Much
Today at work, did you feel like you decided for yourself what to do?
Not At All To A Very Little Extent To Some Extent To A Large Extent To A Very Large Extent
Today at work, I found myself doing things without paying attention.
Not At All Slightly Somewhat Quite A Bit Very Much

208
Today at work, I did jobs or tasks automatically, without being aware of what I was doing.
Not At All Slightly Somewhat Quite A Bit Very Much
Today at work, I rushed through activities without being really attentive to them.
Not At All Slightly Somewhat Quite A Bit Very Much
Today at work, the quality of care or assistance I provided has been
Far below my personal average Below my personal average About my personal average Above my personal average Far above my personal average
Today at work, the timeliness of care or assistance I provided has been
Far below my personal average Below my personal average About my personal average Above my personal average Far above my personal average
Today at work, my overall performance has been
Far below my personal average Below my personal average About my personal average Above my personal average Far above my personal average

209
Today at work, how often did you spend time planning how a patient’s status and needs might change over time?
Not Applicable Never Rarely Sometimes Often Always
Today at work, I made an effort to see the world through patients’ eyes.
Never Rarely Sometimes Often Always
Today at work, I paused to consider multiple options before responding to patients.
Never Rarely Sometimes Often Always
Today at work, I tried to take patients’ perspectives.
Never Rarely Sometimes Often Always
Today at work, I listened carefully to patients.
Never Rarely Sometimes Often Always

210
Today at work, I was sensitive to patients’ subtle meanings or cues.
Never Rarely Sometimes Often Always
Today at work, I thought of more than one way to react to patients.
Never Rarely Sometimes Often Always
Today at work, how stressed did you feel?
Not At All Slightly Moderately Quite A Bit Very Much
Today at work, I was in a good mood.
Not At All Slightly Moderately Quite A Bit Very Much
Today, I was satisfied with my job.
Not At All Slightly Moderately Quite A Bit Very Much
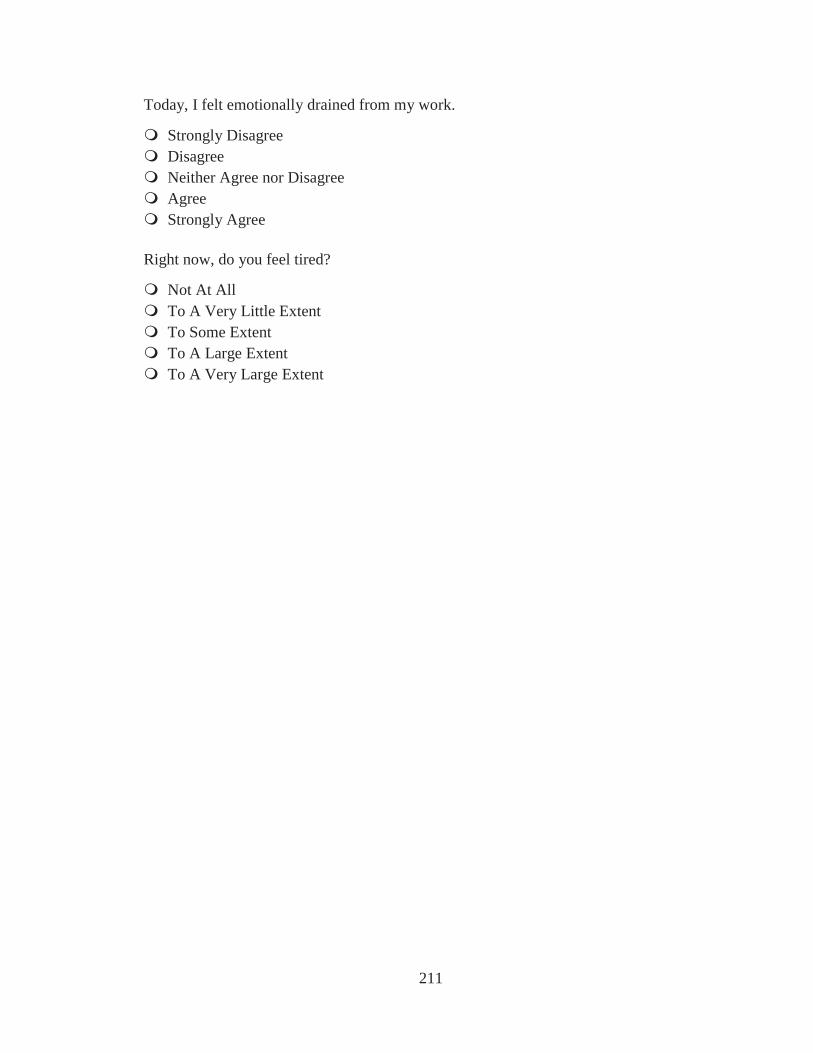
211
Today, I felt emotionally drained from my work.
Strongly Disagree Disagree Neither Agree nor Disagree Agree Strongly Agree
Right now, do you feel tired?
Not At All To A Very Little Extent To Some Extent To A Large Extent To A Very Large Extent
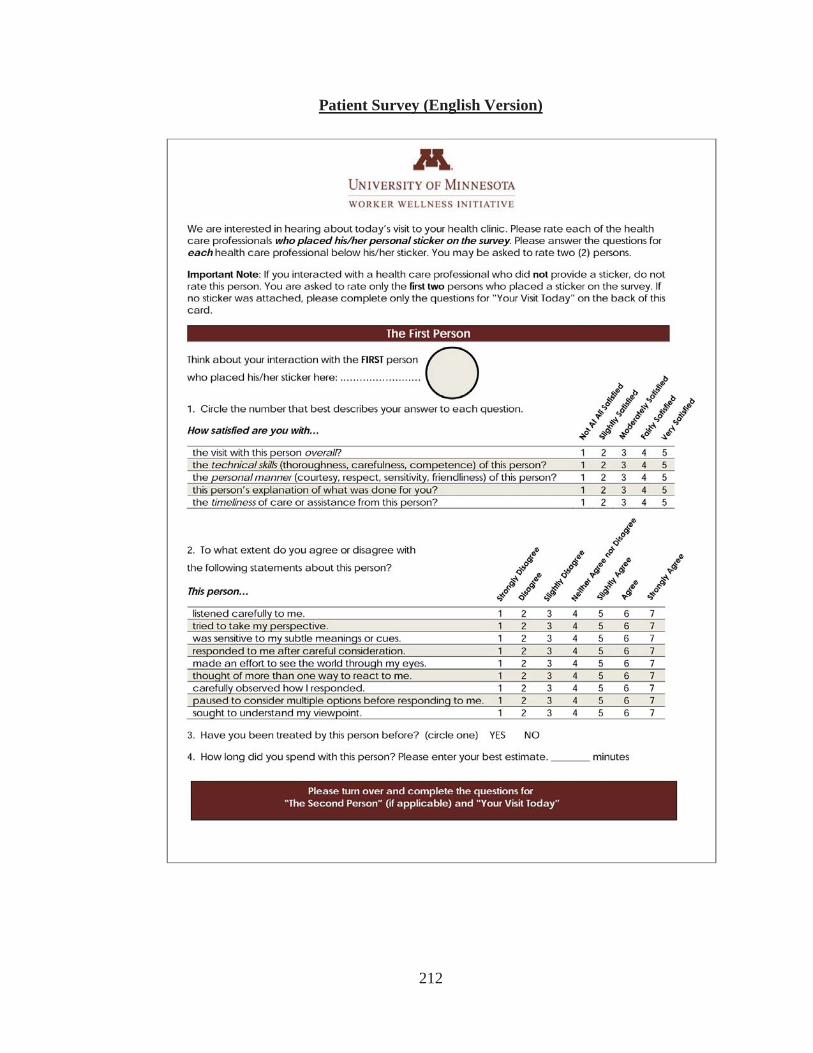
212
Patient Survey (English Version)
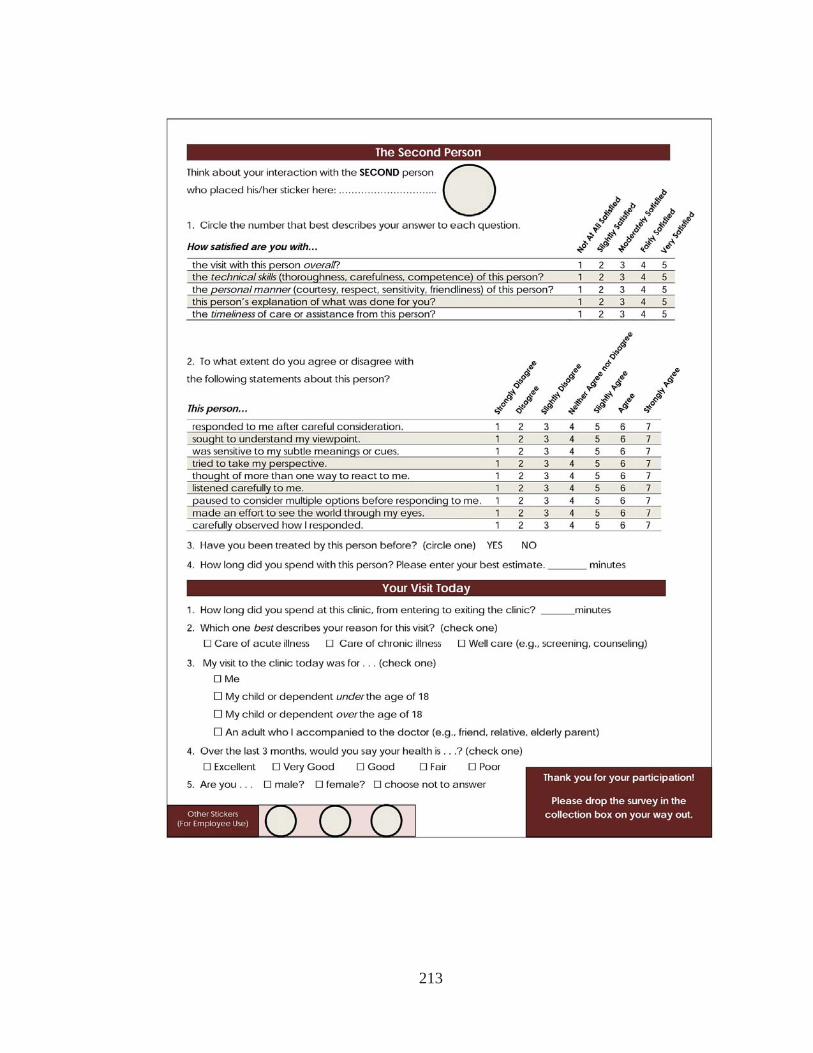
213
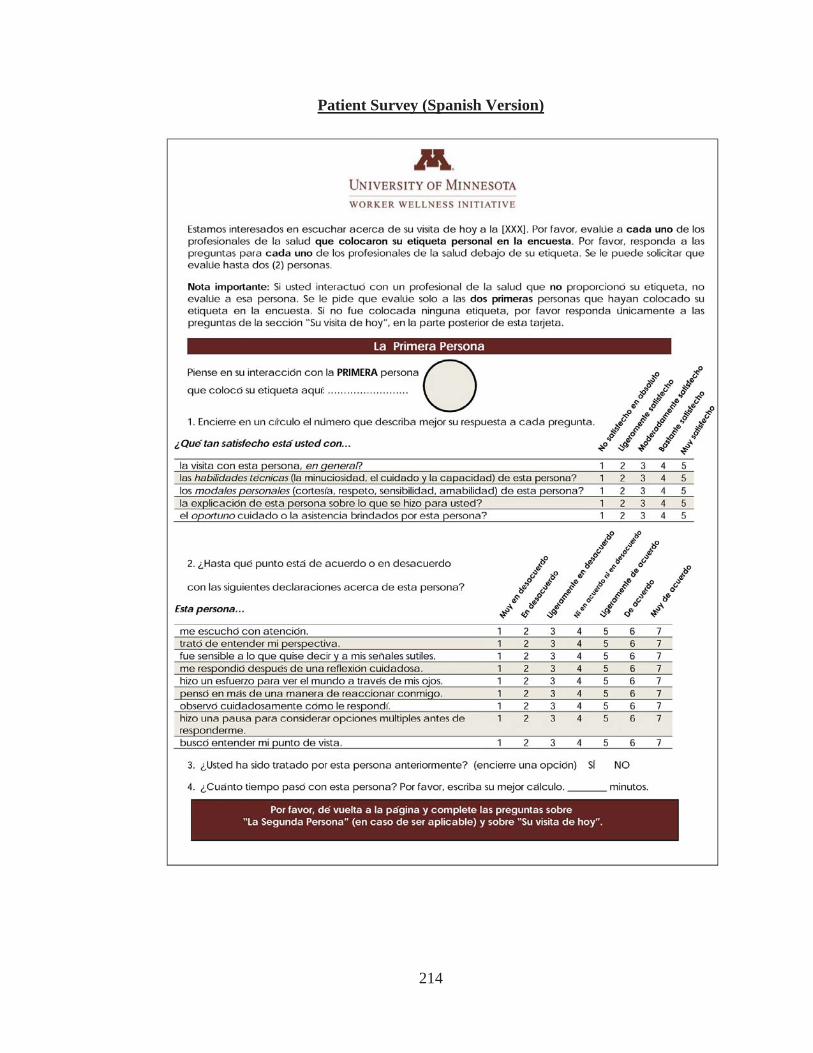
214
Patient Survey (Spanish Version)
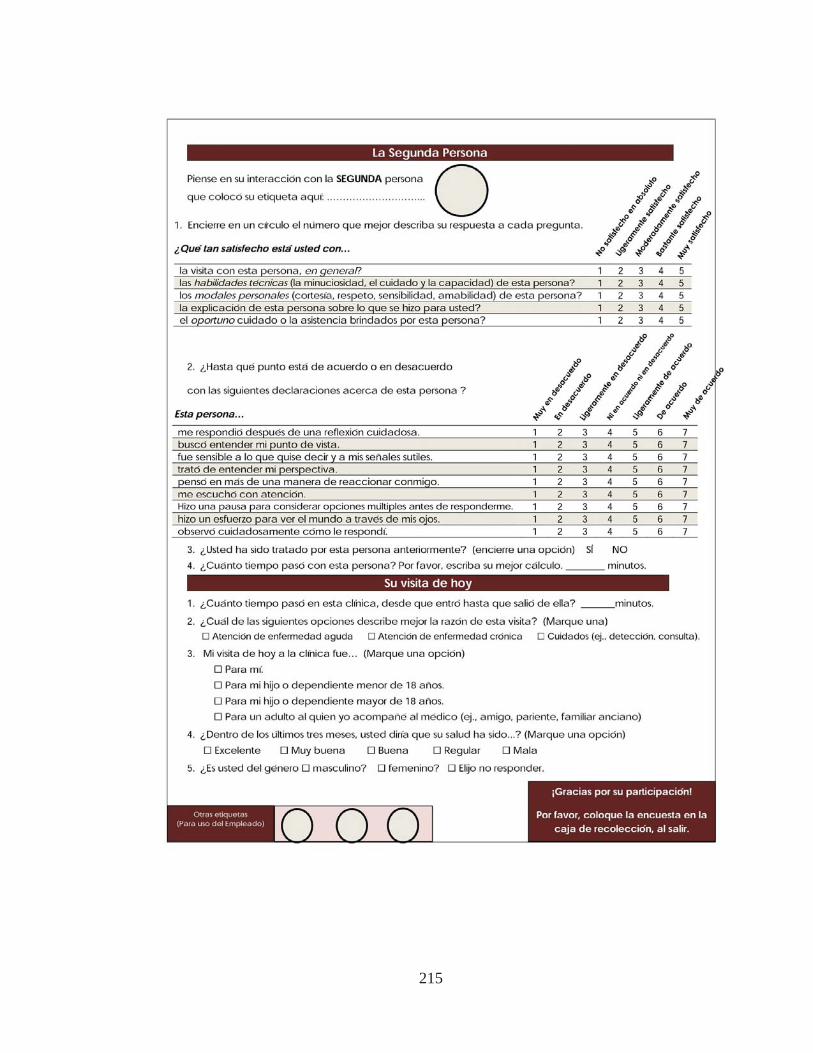
215

216
Appendix IV: Active Phase Materials Active Phase Guide
217
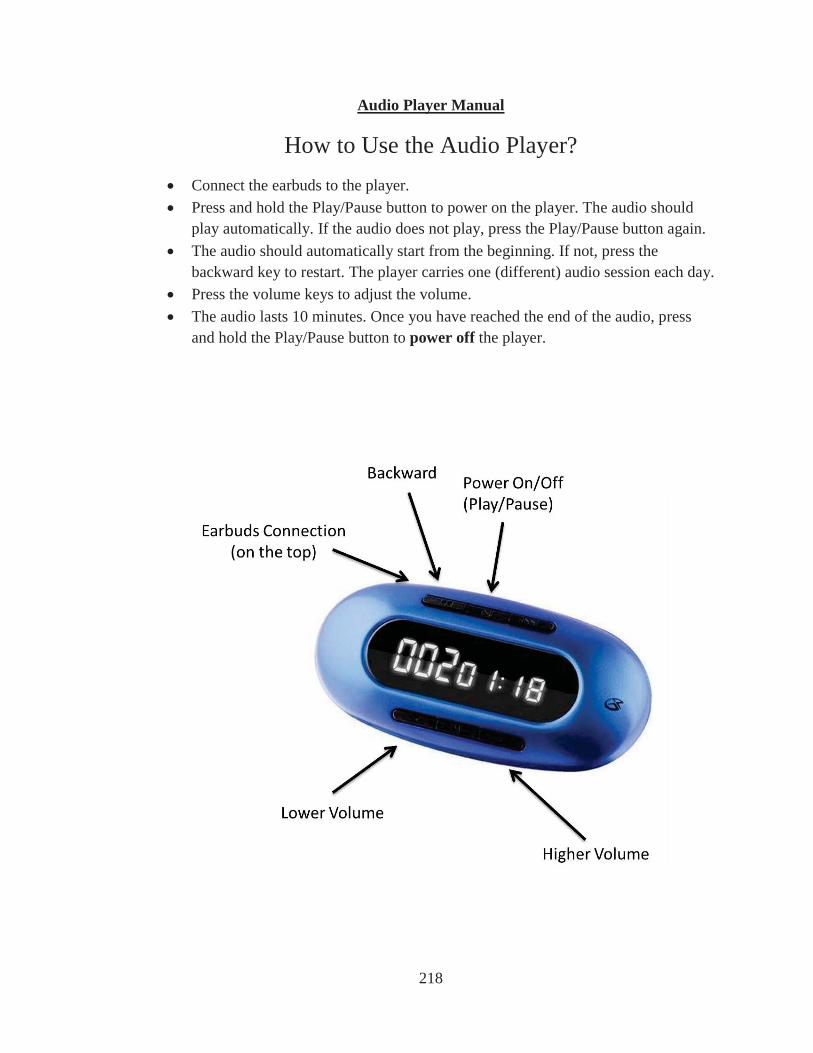
218
Audio Player Manual
How to Use the Audio Player?Connect the earbuds to the player. Press and hold the Play/Pause button to power on the player. The audio should play automatically. If the audio does not play, press the Play/Pause button again. The audio should automatically start from the beginning. If not, press the backward key to restart. The player carries one (different) audio session each day. Press the volume keys to adjust the volume. The audio lasts 10 minutes. Once you have reached the end of the audio, press and hold the Play/Pause button to power off the player.

219
Appendix V: Debriefing Materials
Employee Debriefing Questionnaire
Thank you for your time and participation in the Worker Wellness Initiative! We would like some information about your reactions to the activities that you completed in the study. Please choose the circle that best describes your reactions to the study.
To what extent did you enjoy being a participant in the study?
Not at all A little A moderate amount A lot
To what extent did your study activities interfere with your carrying out work activities?
Not at allA little A moderate amount A lot
To what extent did your study activities interfere with your personal/family activities?
Not at all A little A moderate amount A lot
To what extent were you aware of the wellness audio content for your coworkers?
Not at all A little A moderate amount A lot
How supportive did you think your organization was for your participation in the study?
Not at all A little A moderate amount A great deal
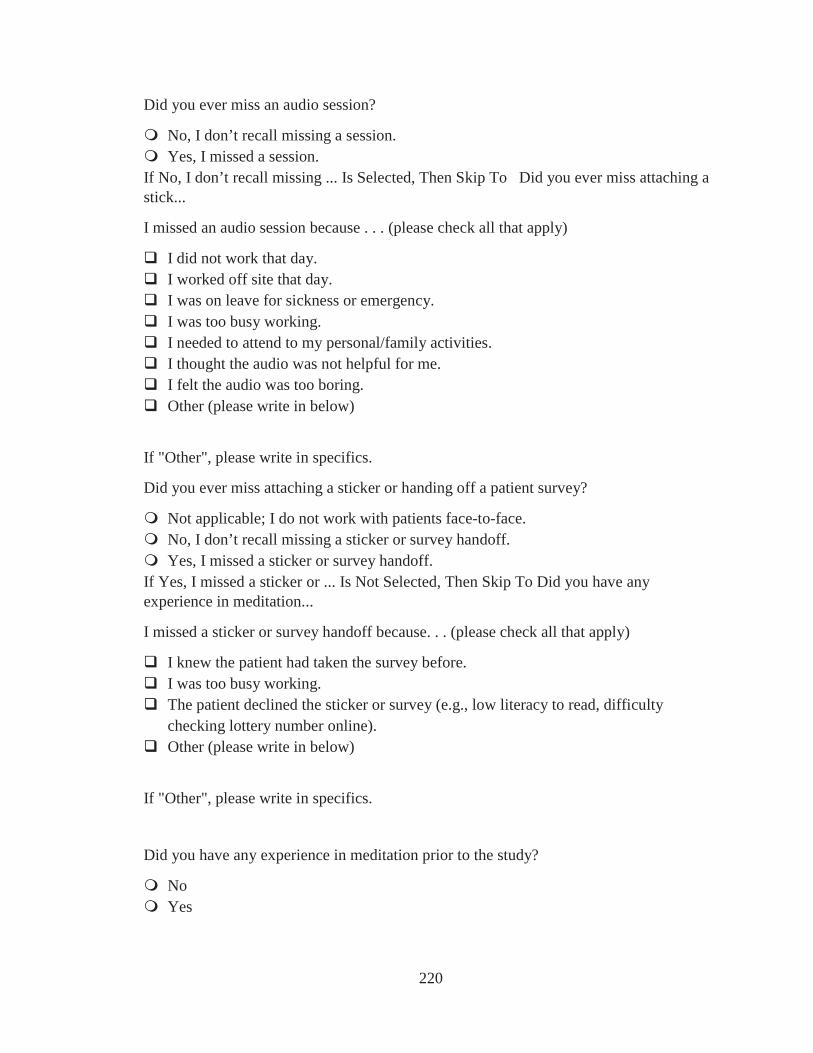
220
Did you ever miss an audio session?
No, I don’t recall missing a session. Yes, I missed a session.
If No, I don’t recall missing ... Is Selected, Then Skip To Did you ever miss attaching a stick...
I missed an audio session because . . . (please check all that apply)
I did not work that day. I worked off site that day. I was on leave for sickness or emergency. I was too busy working. I needed to attend to my personal/family activities. I thought the audio was not helpful for me. I felt the audio was too boring. Other (please write in below)
If "Other", please write in specifics.
Did you ever miss attaching a sticker or handing off a patient survey?
Not applicable; I do not work with patients face-to-face. No, I don’t recall missing a sticker or survey handoff. Yes, I missed a sticker or survey handoff.
If Yes, I missed a sticker or ... Is Not Selected, Then Skip To Did you have any experience in meditation...
I missed a sticker or survey handoff because. . . (please check all that apply)
I knew the patient had taken the survey before. I was too busy working. The patient declined the sticker or survey (e.g., low literacy to read, difficulty checking lottery number online). Other (please write in below)
If "Other", please write in specifics.
Did you have any experience in meditation prior to the study?
No Yes

221
If Yes, please tell us a bit more about your meditation experience (e.g., what kind of meditation, when, where, and for how long) ___________
We may be interested in following up with you in the future to learn about any potential long-term influence of the Worker Wellness Initiative. Would it be all right if the researchers followed up with you in the future?
No Yes
If you would like, use the space below to give us feedback about your experiences in the study.
_________________
In about 10 days, we will mail you a notice of your completion rate, your compensation for participation (cash card with the amount according to your completion rate), and information about the wellness audio content and additional resources. Please fill out your name and valid mailing address.
First Name ________
Last Name ________
Stress Address ________
City ________
State ________
Zip ________
Email ________
Thank you for your time and participation in the Worker Wellness Initiative!
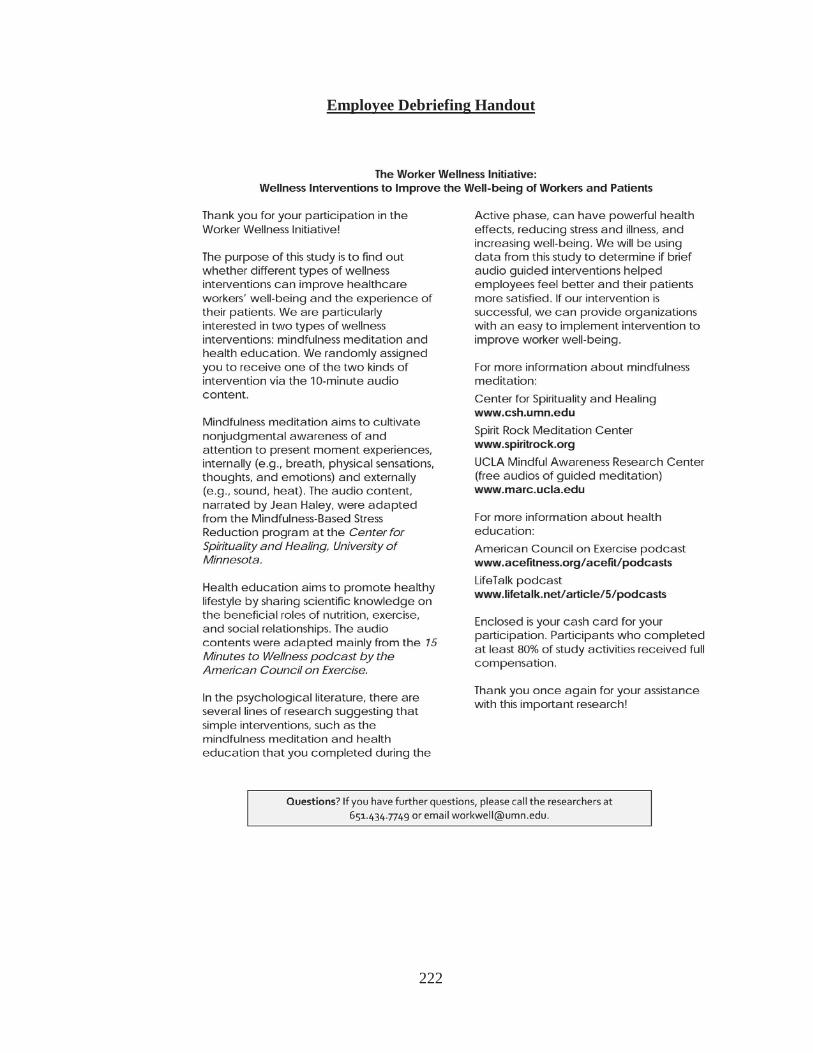
222
Employee Debriefing Handout
223
Appendix VI: Supplemental Results of Latent Growth Modeling using Five Waves of Repeated Measures
Mindfulness
As shown in Table 23, linear growth model using five waves of repeated
measures yielded good fit in the treatment and active control groups separately
2 2 (16) = 32.03,
RMSEA = .18, CFI = .87). As shown in Table 24, growth factor mean was positive and
close to significance in the treatment condition (mean slope = 0.03, p = .10) and was
nonsignificant in the active control condition (mean slope = 0.02, p > .10). In the two-
group latent growth modeling with equality constraints on initial status parameters across
conditi 2 (36) = 56.51, RMSEA
= .13, CFI = .92, treatment growth factor mean was positive and marginally significant
(mean slope = .03, p < .10) whereas active control growth factor mean was not significant
(mean slope = .02, p > .10), as shown in Table 25. Results suggested that treatment led to
a 0.03-unit increase of mindfulness each wave (i.e., every two days) over intervention
period after taking into account normative development, whereas active control did not
produce change in mindfulness over time. The two-group analysis with additional
2 (39) = 57.58,
2 (3) = 1.07, p > .10.
Thus, the treatment effect was not different from active control effect. As robustness
check, I reran the above analyses using mindfulness on Day 1, 3, 5, 7, and 9 and Day 2, 4,
6, 8, and 10 during intervention, respectively. The results were consistent with those from
the 5-wave analyses; the treatment effect was not different from the active control effect.
224
Job satisfaction
As shown in Table 23, linear growth model using five waves of repeated
measures yielded very good fit in the treatment and active control groups separately
2 2 (16) = 19.03,
RMSEA = .08, CFI = .95). As shown in Table 24, growth factor means were not
significant in the treatment or active control condition (mean slope = .03 and –.02,
respectively, ps > .10). In the two-group latent growth modeling with equality constraints
on initial status parameters across conditions and free parameters of intervention growth
2 (34) = 36.16, RMSEA = .05, CFI = .99, treatment and active control growth
factor means were not significant (mean slope = .03 and –.01, respectively, ps > .10), as
shown in Table 26. Results suggested that neither treatment nor active control produced
change in job satisfaction over time. The two-group analysis with additional equality
2 (37) = 38.79, RMSEA
2 (3) = 2.63, p > .10. Thus, the
treatment effect was not different from active control effect.
Job performance
As shown in Table 23, linear growth model using five waves of repeated
measures yielded very good fit in the treatment and active control groups separately
2 2 (16) = 26.69,
RMSEA = .14, CFI = .89). As shown in Table 24, growth factor mean was positive and
significant in the treatment condition (mean slope = .07, p < .01) but was not significant
in the active control condition (mean slope = .01, p > .10). In the two-group latent growth
modeling with equality constraints on initial status parameters across conditions and free
2 (34) = 46.68, RMSEA = .11, CFI = .95,
225
treatment growth factor mean was positive and significant (mean slope = .07, p < .01)
whereas active control growth factor mean was not significant (mean slope = .004,
p > .10), as shown in Table 27. Results suggested that treatment led to 0.07-unit increase
of job performance each wave (i.e., every two days) while active control produced no
change in job performance over time. The two-group analysis with additional equality
2 (37) = 51.95, RMSEA
2 (3) = 5.27, p = .15. Thus, the
treatment effect was not different from active control effect.
Proactive patient care
As shown in Table 23, linear growth model using five waves of repeated
measures yielded very good fit in the treatment and active control groups separately
2 2 (18) = 29.84,
RMSEA = .15, CFI = .91). As shown in Table 24, growth factor mean was not significant
in either the treatment or active control condition (mean slope = .03 and –.01, p > .10). In
the two-group latent growth modeling with equality constraints on initial status
parameters across conditions and free parameters of intervention growth factors, 2 (36) =
53.99, RMSEA = .13, CFI = .93, treatment and active control growth factor means were
not significant (mean slope = .03 and –.01, ps > .10), as shown in Table 28. Results
suggested that neither treatment nor active control led to change in proactive patient care
over time. The two-group analysis with additional equality constraints on parameters of
2 (37) = 60.37, RMSEA = .15, CFI = .91) significantly
2 (1) = 6.38, p < .05. Thus, the treatment effect was different from
active control effect.
226
Participant-rated patient centered behavior
As shown in Table 23, linear growth model using five waves of repeated
measures yielded very good fit in the treatment and active control groups separately
(tr 2 2 (16) = 17.74,
RMSEA = .06, CFI = .99). As shown in Table 24, growth factor mean was positive and
significant in the treatment condition (mean slope = .06, p < .01) but was not significant
in the active control condition (mean slope = .03, p > .10). In the two-group latent growth
modeling with equality constraints on initial status parameters across conditions and free
2 (34) = 41.83, RMSEA = .09, CFI = .98,
treatment growth factor mean was positive and significant (mean slope = .05, p < .01)
while active control growth factor mean was not significant, as shown in Table 29. The
two-group analysis with additional equality constraints on parameters of growth factors
2 (37) = 43.91, RMSEA = .08, CFI = .99) did not significantly worsen
2 (3) = 2.08, p > .10. Thus, the treatment effect was not different from active
control effect.
Stress
As shown in Table 23, linear growth model using five waves of repeated
measures yielded very good fit in the treatment and active control groups separately
2 2 (16) = 28.01,
RMSEA = .15, CFI = .76). As shown in Table 24, growth factor mean was not significant
in the treatment or active control condition (mean slope = –.03 and –.004, p > .10). In the
two-group latent growth modeling with equality constraints on initial status parameters
across conditions and free param 2 (34) = 44.91,
RMSEA = .10, CFI = .91, treatment and active control growth factor means were not
227
significant (mean slope = –.03 and < .001, ps > .10), as shown in Table 30. The two-
group analysis with additional equality constraints on parameters of growth factors across
2 (37) = 47.18, RMSEA = .09, CFI = .92) did not significantly worsen model
2 (3) = 2.27, p > .10. Thus, the treatment effect was not different from active control
effect.
Emotional exhaustion
As shown in Table 23, linear growth model using five waves of repeated
measures yielded very good fit in the treatment and active control groups separately
2 2 (18) = 20.99,
RMSEA = .07, CFI = .96). As shown in Table 24, growth factor mean was not significant
in the treatment or active control condition (mean slope = –.04 and .02, ps > .10). In the
two-group latent growth modeling with equality constraints on initial status parameters
2 (36) =36.95,
RMSEA = .03, CFI = .99, treatment and active control growth factor means were not
significant (mean slope = –.04 and .02, ps > .10), as shown in Table 31. The two-group
analysis with additional equality constraints on parameters of growth factors across
2 (37) = 43.33, RMSEA = .07, CFI = .95) significantly worsened model fit,
2 (1) = 6.38, p < .05. Thus, the treatment effect was different from active control effect.
Fatigue
As shown in Table 23, linear growth model using five waves of repeated
measures yielded very good fit in the treatment and active control groups separately
2 2 (16) = 23.86,
RMSEA = .12, CFI = .86). As shown in Table 24, growth factor mean was negative and
significant in the treatment condition (mean slope = –.09, p < .01) but was not significant
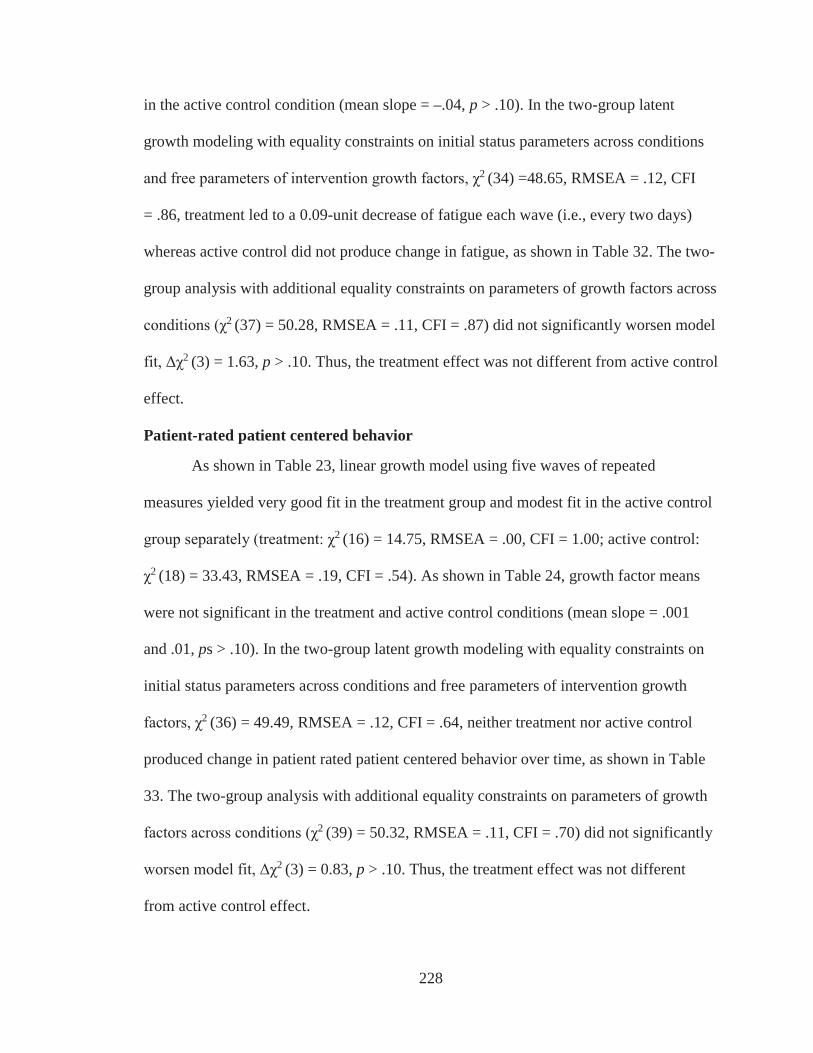
228
in the active control condition (mean slope = –.04, p > .10). In the two-group latent
growth modeling with equality constraints on initial status parameters across conditions
2 (34) =48.65, RMSEA = .12, CFI
= .86, treatment led to a 0.09-unit decrease of fatigue each wave (i.e., every two days)
whereas active control did not produce change in fatigue, as shown in Table 32. The two-
group analysis with additional equality constraints on parameters of growth factors across
2 (37) = 50.28, RMSEA = .11, CFI = .87) did not significantly worsen model
2 (3) = 1.63, p > .10. Thus, the treatment effect was not different from active control
effect.
Patient-rated patient centered behavior
As shown in Table 23, linear growth model using five waves of repeated
measures yielded very good fit in the treatment group and modest fit in the active control
2 (16) = 14.75, RMSEA = .00, CFI = 1.00; active control:
2 (18) = 33.43, RMSEA = .19, CFI = .54). As shown in Table 24, growth factor means
were not significant in the treatment and active control conditions (mean slope = .001
and .01, ps > .10). In the two-group latent growth modeling with equality constraints on
initial status parameters across conditions and free parameters of intervention growth
2 (36) = 49.49, RMSEA = .12, CFI = .64, neither treatment nor active control
produced change in patient rated patient centered behavior over time, as shown in Table
33. The two-group analysis with additional equality constraints on parameters of growth
2 (39) = 50.32, RMSEA = .11, CFI = .70) did not significantly
2 (3) = 0.83, p > .10. Thus, the treatment effect was not different
from active control effect.
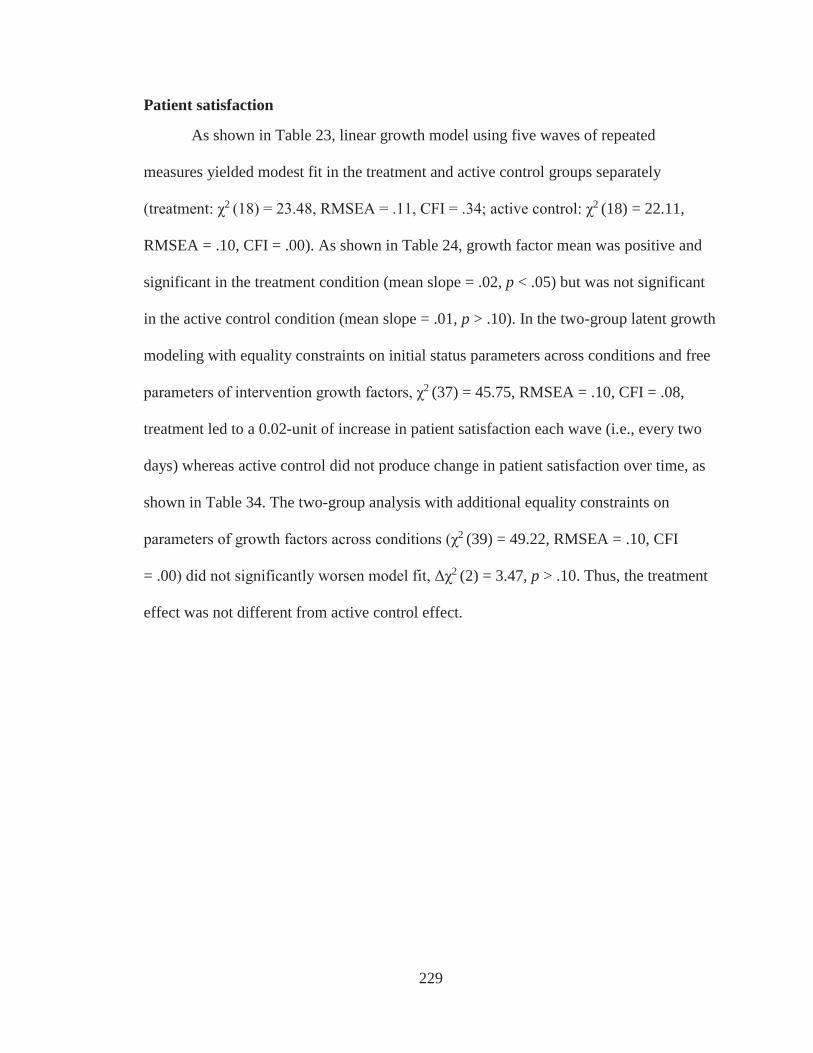
229
Patient satisfaction
As shown in Table 23, linear growth model using five waves of repeated
measures yielded modest fit in the treatment and active control groups separately
2 2 (18) = 22.11,
RMSEA = .10, CFI = .00). As shown in Table 24, growth factor mean was positive and
significant in the treatment condition (mean slope = .02, p < .05) but was not significant
in the active control condition (mean slope = .01, p > .10). In the two-group latent growth
modeling with equality constraints on initial status parameters across conditions and free
2 (37) = 45.75, RMSEA = .10, CFI = .08,
treatment led to a 0.02-unit of increase in patient satisfaction each wave (i.e., every two
days) whereas active control did not produce change in patient satisfaction over time, as
shown in Table 34. The two-group analysis with additional equality constraints on
2 (39) = 49.22, RMSEA = .10, CFI
= .00 2 (2) = 3.47, p > .10. Thus, the treatment
effect was not different from active control effect.