Embed Size (px)
Citation preview

Copyright © 2020 The Authors; exclusive licensee Bio-protocol LLC. 1
www.bio-protocol.org/e3535 Bio-protocol 10(05): e3535. DOI:10.21769/BioProtoc.3535
Tandem Tag Assay Optimized for Semi-automated in vivo Autophagic Activity Measurement in Arabidopsis thaliana roots
Adrian N. Dauphinee1, Jonas A. Ohlsson1 and Elena A. Minina1, 2, *
1Department of Molecular Sciences, Uppsala BioCenter, Swedish University of Agricultural Sciences
and Linnean Center for Plant Biology, P.O. Box 7015, Uppsala, SE-750 07, Sweden; 2COS, Heidelberg
University. Im Neuenheimer Feld 230. 69120 Heidelberg, Germany
*For correspondence: [email protected]
[Abstract] Autophagy is the main catabolic process in eukaryotes and plays a key role in cell
homeostasis. In vivo measurement of autophagic activity (flux) is a powerful tool for investigating the
role of the pathway in organism development and stress responses. Here we describe a significant
optimization of the tandem tag assay for detection of autophagic flux in planta in epidermal root cells of
Arabidopsis thaliana seedlings. The tandem tag consists of TagRFP and mWasabi fluorescent proteins
fused to ATG8a, and is expressed in wildtype or autophagy-deficient backgrounds to obtain reporter and
control lines, respectively. Upon autophagy activation, the TagRFP-mWasabi-ATG8a fusion protein is
incorporated into autophagosomes and delivered to the lytic vacuole. Ratiometric quantification of the
low pH-tolerant TagRFP and low pH-sensitive mWasabi fluorescence in the vacuoles of control and
reporter lines allows for a reliable estimation of autophagic activity. We provide a step by step protocol
for plant growth, imaging and semi-automated data analysis. The protocol presents a rapid and robust
method that can be applied for any studies requiring in planta quantification of autophagic flux.
Keywords: Plant autophagy, Autophagic activity, Arabidopsis, Tandem tag, Autophagic activity in vivo,
In planta autophagic activity assay, High-throughput autophagic activity measurement, Autophagic flux
[Background] The Tandem Tag (TT) assay is a widespread approach for quantifying autophagic flux in
yeast and mammalian cells (Zhou et al., 2012; Klionsky et al., 2016; Yoshii and Mizushima, 2017). It has
been previously described to be applicable for plant cells in a study using tobacco BY-2 cell suspension
cultures (Hanamata et al., 2013; Klionsky et al., 2016). Here we provide a detailed protocol for in planta
quantification of autophagic flux in epidermal root cells of Arabidopsis thaliana seedlings (Figure 1). The
TT assay employs ratiometric quantification of red and green fluorescence and allows to quantify relative
induction or inhibition of autophagy. Another advantage of this method is that it provides valuable
information on subcellular localization of ATG8, i.e., translocation of ATG8 from the nuclei to cytoplasm
(Zhou et al., 2012), incorporation into puncta of different morphologies and motility, and its accumulation
in the vacuole.
For this protocol we used stable transgenic Arabidopsis lines expressing the optimized TT (Huang et
al., 2015) fused to AtATG8a and driven by a double 35S promoter. The TT-AtATG8a fusion was
introduced into wild-type or atg5atg7 double knockout backgrounds, to produce reporter and control
lines, respectively (Dauphinee et al., 2019). Under normal growth conditions TT-AtATG8a is localized in
Please cite this article as: Dauphinee et. al., (2020). Tandem Tag Assay Optimized for Semi-automated in vivo Autophagic Activity Measurement in Arabidopsis thaliana roots,Bio-protocol 10 (5): e3535. DOI: 10.21769/BioProtoc.3535.

Copyright © 2020 The Authors; exclusive licensee Bio-protocol LLC. 2
www.bio-protocol.org/e3535 Bio-protocol 10(05): e3535. DOI:10.21769/BioProtoc.3535
the cytoplasm and in the nuclei of the root epidermal cells, but upon induction of autophagy it is gradually
translocated to the cytoplasm, then incorporated into autophagosome membranes and delivered
together with the cargo to the lytic vacuole. While TagRFP shows relatively high tolerance to the pH of
the lytic compartments (Huang et al., 2015), fluorescence of mWasabi is significantly reduced under the
same conditions. Thus, ratiometric measurement of the TagRFP and mWasabi fluorescence allows to
estimate the delivery rate of the fusion protein to the lytic compartment and eliminates potential bias
coming from differences in fusion protein expression. Furthermore, since the assay relies on confocal
microscopy image acquisition and analysis, it is possible to obtain time-resolved and dose-dependent
data about the changes in autophagic activity. Although we describe only a protocol for detection of the
TT-AtATG8a delivery to the vacuole, it is also possible to use the same imaging data to visualize and
quantify dynamics of autophagosome formation.
We observed that response to known modulators of autophagic activity, such as AZD8055, which
induces autophagy by inhibiting TORC1 activity, and concanamycin A (ConA) (Dauphinee et al., 2019),
which inhibits autophagy by inactivating vacuolar vATPase and thus changing the pH of the lytic
compartment, in Arabidopsis roots significantly varied depending on the area of the root zone scanned.
By comparing data obtained from different root zones, we established that the most reproducible
measurements could be obtained by analyzing images of root epidermal cells located in the beginning
of the differentiation zone. Nevertheless, we still observed quite significant variation between responses
in tricho- and atrichoblasts. Hence, a relatively large number of images was required for the data
analysis to obtain a reliable mean value representative of average autophagic activity in root cells.
This assay provides a significant improvement of autophagic activity measurement in planta. It is
based on high-throughput image analysis, thus improving reproducibility and robustness of the results.
It relies on the use of designated macros written in ImageJ Macro Language (IJM) and R scripts. We
ensured that it can be universally used for imaging data obtained using confocal laser scanning
microscopes (CLSMs) of various manufacturers. Furthermore, to enable applicability of the protocol for
images obtained on different CLSM systems that will naturally vary in efficacy of detection, we added
an extra step of threshold values adjustments that will maximize the capacity of the vacuole area
selection tool.
Importantly, the TT assay described here allows quantification of autophagy-dependent delivery of
ATG8 to the lytic vacuole. Although it can be used as a very good indication for estimating autophagic
activity, it is still preferable to combine this assay with other techniques verifying degradation of
autophagic cargo e.g., the GFP-ATG8 cleavage assay or long-lived proteins assay (Dauphinee et al.,
2019; Klionsky et al., 2016).
Please cite this article as: Dauphinee et. al., (2020). Tandem Tag Assay Optimized for Semi-automated in vivo Autophagic Activity Measurement in Arabidopsis thaliana roots,Bio-protocol 10 (5): e3535. DOI: 10.21769/BioProtoc.3535.

Copyright © 2020 The Authors; exclusive licensee Bio-protocol LLC. 3
www.bio-protocol.org/e3535 Bio-protocol 10(05): e3535. DOI:10.21769/BioProtoc.3535
Figure 1. A workflow scheme of the Tandem Tag assay. The protocol for the assay comprises
six major steps. The time required for each step was estimated based on experienced user progress.
It is recommended to use a seed plating guide in the first step to establish equal distance between
seedlings and reproducible growth conditions. In the second step, seedlings are grown on the
vertically positioned plates to ensure that roots remain on the surface of the medium. We suggest
to perform drug treatments in liquid medium for faster, more even and more reproducible delivery of
the drugs into the root cells. The required treatment time will be compound-specific. The time
required for confocal microscopy might vary depending on microscope configuration and software.
Please cite this article as: Dauphinee et. al., (2020). Tandem Tag Assay Optimized for Semi-automated in vivo Autophagic Activity Measurement in Arabidopsis thaliana roots,Bio-protocol 10 (5): e3535. DOI: 10.21769/BioProtoc.3535.

Copyright © 2020 The Authors; exclusive licensee Bio-protocol LLC. 4
www.bio-protocol.org/e3535 Bio-protocol 10(05): e3535. DOI:10.21769/BioProtoc.3535
Materials and Reagents
1. 1.5 ml Eppendorf tubes
2. Petri dishes (Thermo Fisher Scientific, catalog number: 150239)
3. Pipette tips
4. 6-well tissue culture plates (Thermo Fisher Scientific, catalog number: 15213338)
5. Micro cover glass 25 x 50 mm and 25 x 25 mm (VWR, catalog numbers: 48382-136 and 48366-
089)
6. Sealing Film, PVC (Phytotechlab, Product ID: A003) or Parafilm (VWR, catalog number: 52859-
079)
7. Bleach solution (Klorin, Colgate Palmolive)
8. Tween-20, Polysorbate (VWR, catalog number: 97062)
9. 3D printed seed plating guide (https://www.thingiverse.com/thing:4016917)
10. Murashige and Skoog, MS medium (Duchefa Biochemi, catalog number: M0222) liquid medium
11. MES, 2-(N-morpholino) ethanesulfonic acid (Duchefa Biochemi, catalog number: M1503)
12. Sucrose (Duchefa Biochemi, catalog number: S0809)
13. KOH (VWR, catalog number: 470302)
14. Plant agar (Duchefa Biochemi, catalog number: P1001)
15. DMSO (Sigma-Aldrich, catalog number: 276855) or other vehicle
16. AZD8055 (Selleckchem, catalog number: S1555)
17. Immersion oil (Zeiss, catalog number: 444960)
18. Transgenic Arabidopsis lines used to establish this protocol were published in Dauphinee et al.
(2019)
19. Milli-Q (MQ) water
20. Liquid 0.5x MS medium (see Recipes)
21. Solid 0.5x MS medium (see Recipes)
22. Bleach solution (see Recipes)
23. ConA 1 mM stock in DMSO (see Recipes)
Equipment
1. Pipettes for 100-1,000 µl and 1-10 μl
2. Forceps (Dumont, catalog number: 11251-10)
3. 4 °C fridge
4. Arabidopsis growth cabinet/growth room: 20-22 °C, 50-70% humidity, 150 µM light
5. Confocal Laser Scanning Microscope (CLSM; Zeiss, LSM 800)
Please cite this article as: Dauphinee et. al., (2020). Tandem Tag Assay Optimized for Semi-automated in vivo Autophagic Activity Measurement in Arabidopsis thaliana roots,Bio-protocol 10 (5): e3535. DOI: 10.21769/BioProtoc.3535.

Copyright © 2020 The Authors; exclusive licensee Bio-protocol LLC. 5
www.bio-protocol.org/e3535 Bio-protocol 10(05): e3535. DOI:10.21769/BioProtoc.3535
Software
1. Fiji, the version of ImageJ with included set of plugins (https://fiji.sc/, for this study, we utilized
versions 1.51s and 2.0.0-rc-69/1.52i)
2. AuTToFlux repository containing three ImageJ macro and three R script files
(https://github.com/jonasoh/AuTToFlux/archive/master.zip):
a. CalibrateThreshold.ijm
b. ImageProcessor.ijm
c. FluorescenceIntensity.ijm
d. EvaluateCalibration.R
e. Control-vs-Reporter.R
f. Flux-vs-Time.R
3. R (https://www.r-project.org, we used 3.5.2 and 3.5.1)
4. RStudio (https://www.rstudio.com/, we used versions 1.1.453 and 1.2.1186)
5. Git (https://git-scm.com/downloads, we used the version 2.24.1)
6. R packages:
a. dplyr (https://CRAN.R-project.org/package=dplyr)
b. ggplot2 (https://CRAN.R-project.org/package=ggplot2)
c. readr (https://CRAN.R-project.org/package=readr)
Procedure
A. Seed sterilization (40 min)
1. Place ca. 15 μl of seeds of reporter and control lines into 1.5 ml Eppendorf tubes. Generally, the
aim is to have at least four-six biological replicates for each treatment and time point planned in
the experiment.
2. Add ca. 1.5 ml of the bleach solution.
3. Incubate the seeds for ca. 30 min, agitating.
4. Under sterile conditions, pipette out the bleach solution.
5. Add sterile water to the seeds. Mix and pipette it out.
6. Perform the wash with sterile water at least three times to wash out the leftovers of the bleach
solution.
7. Seeds can be vernalized either in the sterile water or as described in the Procesure C.
B. Seed plating (40 min)
1. Use 1 ml pipette to transfer single seeds onto a Petri dish with solid 0.5x MS medium. Keep ca.
2-5 mm distance between the seeds in the same row to avoid entanglement of roots. Keep ca.
5 cm distance between the rows (Figures 2A-2B). It is recommended to use a seed plating guide
for this procedure (Figure 1, Figure 2A, https://www.thingiverse.com/thing:4016917).
Please cite this article as: Dauphinee et. al., (2020). Tandem Tag Assay Optimized for Semi-automated in vivo Autophagic Activity Measurement in Arabidopsis thaliana roots,Bio-protocol 10 (5): e3535. DOI: 10.21769/BioProtoc.3535.

Copyright © 2020 The Authors; exclusive licensee Bio-protocol LLC. 6
www.bio-protocol.org/e3535 Bio-protocol 10(05): e3535. DOI:10.21769/BioProtoc.3535
2. Seal the plates with a strip of Parafilm or sealing film.
Figure 2. Arabidopsis Tandem Tag autophagic flux assay. A. 3D printed seed plating guide
for 9 cm Petri plates. B. Arabidopsis thaliana seeds plated using the seed plating guide (left half)
and then grown with the plate positioned vertically for 5 days (right half). C. Arabidopsis
seedlings placed in a 6-well plate for treatment. Note that the roots should be submerged gently
(white arrow) and should not be floating on the surface (red arrow). D. Seedlings mounted on a
glass slide (left) or coverslip (right) for CLSM. E. Approximate beginning of the root differentiation
zone F. Images 0, 1 and 2 represent good, bad and ugly quality scans of differentiation zone
vacuoles in the reporter line, respectively. G. Vacuole layer masks generated during calibration
Please cite this article as: Dauphinee et. al., (2020). Tandem Tag Assay Optimized for Semi-automated in vivo Autophagic Activity Measurement in Arabidopsis thaliana roots,Bio-protocol 10 (5): e3535. DOI: 10.21769/BioProtoc.3535.

Copyright © 2020 The Authors; exclusive licensee Bio-protocol LLC. 7
www.bio-protocol.org/e3535 Bio-protocol 10(05): e3535. DOI:10.21769/BioProtoc.3535
using the CalibrationThreshold.jim macro. Note that ugly scans F. may lead to complete or
partial failure of vacuole detection. H. Sum vacuole areas detected on all analyzed images (2 is
the recommended upper threshold value) vs. threshold values generated by the
EvaluateCalibration.R script. I. Flux-vs-Time.R script output for vehicle and a compound
treatment generated in R using ggplot2. Scale bars = 1.5 cm (B-D); 50 µm (E, F).
C. Vernalization (24-48 h)
Incubate the plates in the dark at 4 °C for 24-48 h.
D. Growth on vertical plates (5 days)
1. Place the plates into growth conditions (150 µM light, 22 °C for 16 h, 0 µM light, 20 °C for 8 h).
Make sure the plates are perfectly vertical to ensure root growth on the top of the medium
(Figure 2B).
2. Grow the seedlings on the plates for ca. 5 days, the root length should reach ca. 2 cm.
E. Drug treatment (2-24 h)
1. Pipette 3 ml of liquid 0.5x MS into wells of a 6-well tissue culture plate. Add the chemical
compounds of the required concentration.
2. Using soft forceps, gently pick seedlings from the plates and transfer into liquid 0.5x MS (not
more than 20 seedlings/well).
3. Gently pipette the medium from the well onto the seedlings in the well to submerge the roots
(white arrow, Figure 2C).
4. Seal the plate with a sealing film or as trip of Parafilm.
5. Incubate the plate under the same growth conditions for the required amount of time.
F. Mounting the samples (1 min)
1. Pipette a drop of medium, ca. 50 μl, from a well on the 25 mm x 50 mm cover slip.
2. Using soft forceps, gently pick seedlings from the well and place it onto the drop of medium
making sure that the root is straight. Avoid drying the roots during transfer!
3. Place up to six seedlings on the cover slip.
4. Cover the roots with 25 mm x 25 mm cover slip (Figure 2D).
5. Apply immersion if needed to the objective lens and place the sample on the microscope stage.
G. Setting up scanning parameters for confocal laser microscopy (30 min, required only once)
1. To estimate optimal range of settings for scanning, it is advisable to perform a pilot experiment
using three control treatments with 500 nM AZD 8055 for 4 h, 500 nM ConA for 6 h and
corresponding amount of vehicle (e.g., 0.05% DMSO).
2. Configure settings for sequential scanning of two channels:
Please cite this article as: Dauphinee et. al., (2020). Tandem Tag Assay Optimized for Semi-automated in vivo Autophagic Activity Measurement in Arabidopsis thaliana roots,Bio-protocol 10 (5): e3535. DOI: 10.21769/BioProtoc.3535.
Copyright © 2020 The Authors; exclusive licensee Bio-protocol LLC. 8
www.bio-protocol.org/e3535 Bio-protocol 10(05): e3535. DOI:10.21769/BioProtoc.3535
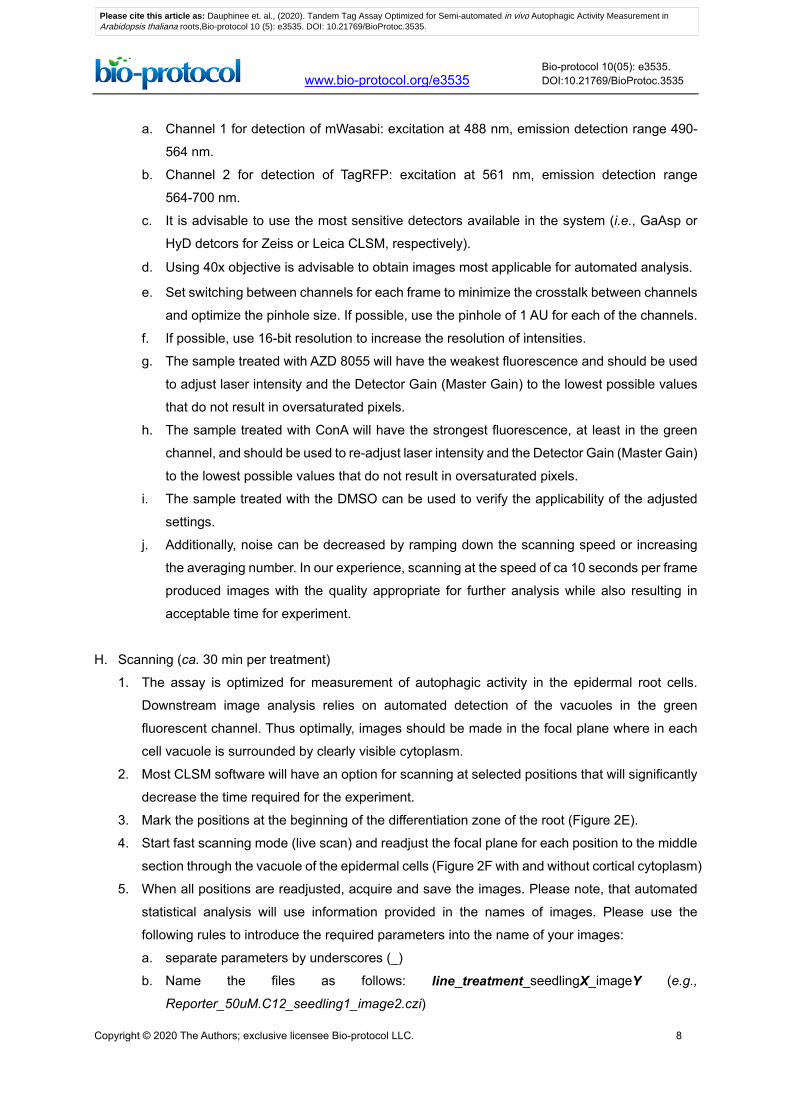
a. Channel 1 for detection of mWasabi: excitation at 488 nm, emission detection range 490-
564 nm.
b. Channel 2 for detection of TagRFP: excitation at 561 nm, emission detection range
564-700 nm.
c. It is advisable to use the most sensitive detectors available in the system (i.e., GaAsp or
HyD detcors for Zeiss or Leica CLSM, respectively).
d. Using 40x objective is advisable to obtain images most applicable for automated analysis.
e. Set switching between channels for each frame to minimize the crosstalk between channels
and optimize the pinhole size. If possible, use the pinhole of 1 AU for each of the channels.
f. If possible, use 16-bit resolution to increase the resolution of intensities.
g. The sample treated with AZD 8055 will have the weakest fluorescence and should be used
to adjust laser intensity and the Detector Gain (Master Gain) to the lowest possible values
that do not result in oversaturated pixels.
h. The sample treated with ConA will have the strongest fluorescence, at least in the green
channel, and should be used to re-adjust laser intensity and the Detector Gain (Master Gain)
to the lowest possible values that do not result in oversaturated pixels.
i. The sample treated with the DMSO can be used to verify the applicability of the adjusted
settings.
j. Additionally, noise can be decreased by ramping down the scanning speed or increasing
the averaging number. In our experience, scanning at the speed of ca 10 seconds per frame
produced images with the quality appropriate for further analysis while also resulting in
acceptable time for experiment.
H. Scanning (ca. 30 min per treatment)
1. The assay is optimized for measurement of autophagic activity in the epidermal root cells.
Downstream image analysis relies on automated detection of the vacuoles in the green
fluorescent channel. Thus optimally, images should be made in the focal plane where in each
cell vacuole is surrounded by clearly visible cytoplasm.
2. Most CLSM software will have an option for scanning at selected positions that will significantly
decrease the time required for the experiment.
3. Mark the positions at the beginning of the differentiation zone of the root (Figure 2E).
4. Start fast scanning mode (live scan) and readjust the focal plane for each position to the middle
section through the vacuole of the epidermal cells (Figure 2F with and without cortical cytoplasm)
5. When all positions are readjusted, acquire and save the images. Please note, that automated
statistical analysis will use information provided in the names of images. Please use the
following rules to introduce the required parameters into the name of your images:
a. separate parameters by underscores (_)
b. Name the files as follows: line_treatment_seedlingX_imageY (e.g.,
Reporter_50uM.C12_seedling1_image2.czi)
Please cite this article as: Dauphinee et. al., (2020). Tandem Tag Assay Optimized for Semi-automated in vivo Autophagic Activity Measurement in Arabidopsis thaliana roots,Bio-protocol 10 (5): e3535. DOI: 10.21769/BioProtoc.3535.

Copyright © 2020 The Authors; exclusive licensee Bio-protocol LLC. 9
www.bio-protocol.org/e3535 Bio-protocol 10(05): e3535. DOI:10.21769/BioProtoc.3535
Where line and treatment are text variables or strings identifying the lines (either “Reporter”
or “Control”) and treatments (i.e., “50uM.C12”) used. One treatment must be named
“Vehicle”. X and Y are numbers indicating seedling and image replicates thus representing
biological and technical replicates, respectively. Note that “seedling” and “image” are fixed
strings and only the numbers X and Y are changed from image to image.
Data analysis
Data needs to be processed prior to the analysis. The processing is done in four steps: (i) conversion of
confocal images into .TIF files; (ii) adjustment of the threshold values to optimize recognition of the
vacuoles. This step must be performed when using the protocol for the first time and, if needed, can be
redone for individual experiments; (iii) quantification of fluorescence intensities in the vacuoles; (iv)
quantification of the ratios and plotting of the data as control vs reporter lines, or ratios vs time and
concentration.
We provide demo data (https://github.com/jonasoh/AuTToFlux), which can be used to ensure that the
analysis works as expected.
A. Set up the analysis pipeline
For more detailed instructions see Video 1 (https://youtu.be/6oY3CyvGFPk).
1. Place all images for processing into a single folder. If several experiments should be processed,
place them as subfolders within a single folder.
2. Download and install Fiji, the version of ImageJ with included set of plugins (https://fiji.sc/) for
this study, we utilized versions 1.51s and 2.0.0-rc-69/1.52i).
3. Download and install R (https://www.r-project.org, we used 3.5.2 and 3.5.1) and RStudio
(https://www.rstudio.com/, we used versions 1.1.453 and 1.2.1186).
4. Either clone the GitHub repository (https://github.com/jonasoh/AuTToFlux) or download it as a
zip file. If cloning the repository, RStudio can be used to automate this task: In RStudio, start a
new project (File -> New Project -> Version Control -> GIT and input the following URL:
https://github.com/jonasoh/AuTToFlux. The repository is automatically cloned into the chosen
location.
5. Before running the R scripts for the first time you need to make sure its dependencies are
installed. Either use RStudio’s interface for installing packages, and install the packages ggplot2,
dplyr, and readr, or install them manually by typing the following command into the console:
install.packages(c("ggplot2", "dplyr", "readr"))
Please cite this article as: Dauphinee et. al., (2020). Tandem Tag Assay Optimized for Semi-automated in vivo Autophagic Activity Measurement in Arabidopsis thaliana roots,Bio-protocol 10 (5): e3535. DOI: 10.21769/BioProtoc.3535.

Copyright © 2020 The Authors; exclusive licensee Bio-protocol LLC. 10
www.bio-protocol.org/e3535 Bio-protocol 10(05): e3535. DOI:10.21769/BioProtoc.3535
Video 1. Repository version control in R studio
B. Convert images into TIFF files
For more detailed instructions see Video 2 (https://youtu.be/nKPq0kNvW_U).
1. Place all images for processing into a single folder. If several experiments are to be processed,
place them as subfolders within a single folder.
2. Run the Image Processor: launch ImageJ and go to Plugins -> Macros -> Run -> locate
ImageProcessor.ijm.
3. The image processor macro opens all compatible images in the target folder and saves them
as .TIF files (with the file extension .tif); original acquisition dates of the images are saved in
separate files. Multi-image files from experiments scanned using the “Positions“ function are
split so that each image is saved as a separate .TIF file.
Video 2. Image processing
C. Select proper threshold values
For more detailed instructions see Video 3 (https://youtu.be/Wkw3VXFj2is). Copy at least three TIFF
images generated by the ImageProcessor into a separate folder. Aim to select images representing
the best, the worst, and average quality.
Please cite this article as: Dauphinee et. al., (2020). Tandem Tag Assay Optimized for Semi-automated in vivo Autophagic Activity Measurement in Arabidopsis thaliana roots,Bio-protocol 10 (5): e3535. DOI: 10.21769/BioProtoc.3535.

Copyright © 2020 The Authors; exclusive licensee Bio-protocol LLC. 11
www.bio-protocol.org/e3535 Bio-protocol 10(05): e3535. DOI:10.21769/BioProtoc.3535
1. Launch ImageJ and go to Plugins -> Macros -> Run -> locate CalibrateThreshold.ijm. This runs
the macro. In the file picker immediately presented, locate the folder with representative images.
Macro will record the area sizes corresponding to the vacuoles and also save masks as tiff files
containing threshold values in their names, e.g., file named *.thr0-3.tiff would correspond to the
mask created with the threshold values (0;3). The results overview will be generated as
threshold-overview.tif (Figure 2G).
2. Launch RStudio.
3. Open the RStudio project file (AuTToFlux.Rproj).
4. To estimate what threshold values provide the largest selected vacuole area for all analyzed
images, run the EvaluateCalibration.R script (select the R script, click Code -> Source and then
choose the folder containing the .CSV files generated in the previous step–note: on non-
Windows systems you need to type in the pathname of the folder).
5. The script will plot average sum vacuole areas selected on all analyzed images vs threshold
values. Select the threshold value that corresponds to the largest area (Figure 2H).
6. Using the information gathered from the threshold-overview and the threshold graph, select an
appropriate upper threshold value for marking. The masks should not contain any background
areas.
7. Before proceeding with image thresholding and data analysis, ensure that the calibration folder
is removed from the directory containing the processed images.
Video 3. Treshold callibration
D. Measure fluorescence intensities
For more detailed instructions see Video 4 (https://youtu.be/6jYqkYXOpiQ).
1. Run the threshold macro: launch ImageJ -> Plugins -> Macros -> Run -> locate and open the
macro file FluorescenceIntensity.ijm.
2. Select the folder containing images to be analyzed, previously converted using the image
processor macro (step B).
Please cite this article as: Dauphinee et. al., (2020). Tandem Tag Assay Optimized for Semi-automated in vivo Autophagic Activity Measurement in Arabidopsis thaliana roots,Bio-protocol 10 (5): e3535. DOI: 10.21769/BioProtoc.3535.

Copyright © 2020 The Authors; exclusive licensee Bio-protocol LLC. 12
www.bio-protocol.org/e3535 Bio-protocol 10(05): e3535. DOI:10.21769/BioProtoc.3535
3. The macro will prompt you to select the threshold value determined earlier in the calibration
process. For each image the threshold macro automatically selects areas corresponding to the
vacuoles using the GFP channel and saves the masks for the selected areas as TIFF files. The
masks are then used to quantify intensities of RFP and GFP fluorescence in the corresponding
channels of the image. Ratios of vacuolar RFP/GFP fluorescence intensities are saved to .CSV
files with matching filenames.
Video 4. Fluorescence intensity measurement
E. Analyze data
To estimate dose and time-dependent responses the RFP/GFP ratios are plotted vs time using Flux-
vs-Time.R. For more detailed instructions see Video 5 (https://youtu.be/0_wDY7RN_hk).
1. Create an info.txt file in the folder in the folder containing the .CSV files for analysis. The initial
time of treatment (format YYYY-MM-DD HH:MM, 24-hour time) is user-specified by creating a
tab-delimited text file (using any spreadsheet software, e.g., Microsoft Excel) with two columns,
which should be saved as info.txt e.g.,
Treatment StartTime
Vehicle 2018-07-06 09:50
Treatment 2018-07-06 10:00
2. Launch RStudio.
3. Locate the R project file in the directory created from the GitHub repository and open it if it is
not already opened:
a. In R select Flux-vs-Time.R, click Code -> Source and then choose the folder containing
the .CSV files generated in step D.
b. A summary of the experiment data is generated with ratios normalized to the vehicle and
grouped by treatment and seedling number (Figure 2I). To plot the data, we recommend
ggplot2 (https://ggplot2.tidyverse.org/), axes (x = Elapsed time, y = Normalized ratios, color
= Treatment)
Please cite this article as: Dauphinee et. al., (2020). Tandem Tag Assay Optimized for Semi-automated in vivo Autophagic Activity Measurement in Arabidopsis thaliana roots,Bio-protocol 10 (5): e3535. DOI: 10.21769/BioProtoc.3535.

Copyright © 2020 The Authors; exclusive licensee Bio-protocol LLC. 13
www.bio-protocol.org/e3535 Bio-protocol 10(05): e3535. DOI:10.21769/BioProtoc.3535
c. Further statistical analysis will depend on the treatments present in the experiment and can
be performed using R or other software, e.g. Origin, JMP.
d. The data can be also used to estimate IC50 using R, e.g., with the aid of the drc package
(Ritz et al., 2015), or other software such as Prism.
Video 5. Flux vs. time
To demonstrate autophagy-dependent response, RFP/GFP ratios of control lines are plotted vs
ratios of reporter lines. For more detailed instructions see Video 6 (https://youtu.be/PQRZ1oOBgws):
1. Launch RStudio.
2. Locate the R project file in the directory created from the GitHub repository and open it if it is
not already opened:
a. In R select Control-vs-Reporter.R, click Code -> Source and then choose the folder
containing the .CSV files generated in step D.
b. This script may take as its argument either a folder containing several treatments as
subfolders, or a folder without subfolders that contains a single experiment.
c. The script summarizes RFP/GFP ratios (normalized to vehicle) and groups by line (control
or reporter), treatment and seedling number. An unpaired, two-tailed Student’s t-test is used
to compare log-transformed normalized means of the control and reporter groups. A
summary table named pvals.txt is generated. If P-values derived from permutation (i.e.,
exact P-values) are desired, uncomment the appropriate sections marked in the R script.
Note: For both Control-vs-Reporter.R and Flux-vs-Time.R, data is saved both as raw data (as
summary-full.txt in the experiment directory) and as per-seedling summary statistics (summary-
perseedling.txt), to facilitate analysis using other statistical software.
Please cite this article as: Dauphinee et. al., (2020). Tandem Tag Assay Optimized for Semi-automated in vivo Autophagic Activity Measurement in Arabidopsis thaliana roots,Bio-protocol 10 (5): e3535. DOI: 10.21769/BioProtoc.3535.

Copyright © 2020 The Authors; exclusive licensee Bio-protocol LLC. 14
www.bio-protocol.org/e3535 Bio-protocol 10(05): e3535. DOI:10.21769/BioProtoc.3535
Video 6. Control vs. Reporter
Notes
See Table 1 for further troubleshooting steps.
Table 1. Troubleshooting
Problem Possible cause Solution
Low number of data points High noise on the images Adjust scanning settings to decrease the
noise
Adjust threshold values during data
analysis
Focusing not on the middle
section of the vacuoles
Make sure that the roots on the samples
are not drifting during imaging and are
placed in the thinnest possible layer of
solution
Wrong threshold values in the
FluorescenceIntensity.ijm macro
Follow the instruction in the procedure for
estimating optimal values and adjusting
the macro
Incorrectly assigned groups
in Flux-v-Time.R
Different number of data points
for each timepoint
The script requires the number of data
points for each group to be roughly equal.
Remove or add data points to balance the
experiment.
Time-v-Flux.R exits with
error "Error in eval (ei,
envir): file. exists (infofile) is
not TRUE"
There is no info.txt in the
directory.
Create the info.txt file according to the
instructions.
Please cite this article as: Dauphinee et. al., (2020). Tandem Tag Assay Optimized for Semi-automated in vivo Autophagic Activity Measurement in Arabidopsis thaliana roots,Bio-protocol 10 (5): e3535. DOI: 10.21769/BioProtoc.3535.
Copyright © 2020 The Authors; exclusive licensee Bio-protocol LLC. 15
www.bio-protocol.org/e3535 Bio-protocol 10(05): e3535. DOI:10.21769/BioProtoc.3535
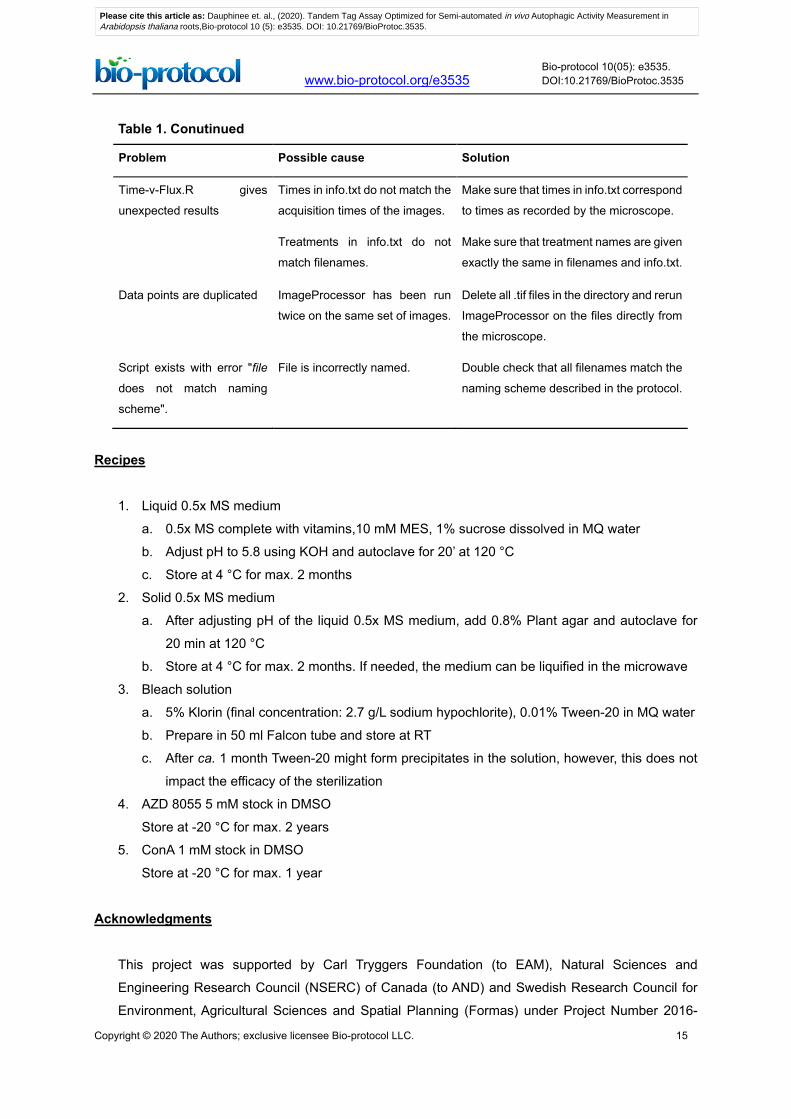
Table 1. Conutinued
Problem Possible cause Solution
Time-v-Flux.R gives
unexpected results
Times in info.txt do not match the
acquisition times of the images.
Make sure that times in info.txt correspond
to times as recorded by the microscope.
Treatments in info.txt do not
match filenames.
Make sure that treatment names are given
exactly the same in filenames and info.txt.
Data points are duplicated ImageProcessor has been run
twice on the same set of images.
Delete all .tif files in the directory and rerun
ImageProcessor on the files directly from
the microscope.
Script exists with error "file
does not match naming
scheme".
File is incorrectly named. Double check that all filenames match the
naming scheme described in the protocol.
Recipes
1. Liquid 0.5x MS medium
a. 0.5x MS complete with vitamins,10 mM MES, 1% sucrose dissolved in MQ water
b. Adjust pH to 5.8 using KOH and autoclave for 20’ at 120 °C
c. Store at 4 °C for max. 2 months
2. Solid 0.5x MS medium
a. After adjusting pH of the liquid 0.5x MS medium, add 0.8% Plant agar and autoclave for
20 min at 120 °C
b. Store at 4 °C for max. 2 months. If needed, the medium can be liquified in the microwave
3. Bleach solution
a. 5% Klorin (final concentration: 2.7 g/L sodium hypochlorite), 0.01% Tween-20 in MQ water
b. Prepare in 50 ml Falcon tube and store at RT
c. After ca. 1 month Tween-20 might form precipitates in the solution, however, this does not
impact the efficacy of the sterilization
4. AZD 8055 5 mM stock in DMSO
Store at -20 °C for max. 2 years
5. ConA 1 mM stock in DMSO
Store at -20 °C for max. 1 year
Acknowledgments
This project was supported by Carl Tryggers Foundation (to EAM), Natural Sciences and
Engineering Research Council (NSERC) of Canada (to AND) and Swedish Research Council for
Environment, Agricultural Sciences and Spatial Planning (Formas) under Project Number 2016-
Please cite this article as: Dauphinee et. al., (2020). Tandem Tag Assay Optimized for Semi-automated in vivo Autophagic Activity Measurement in Arabidopsis thaliana roots,Bio-protocol 10 (5): e3535. DOI: 10.21769/BioProtoc.3535.

Copyright © 2020 The Authors; exclusive licensee Bio-protocol LLC. 16
www.bio-protocol.org/e3535 Bio-protocol 10(05): e3535. DOI:10.21769/BioProtoc.3535
20031. This protocol was established for the study carried out by Dauphinee et al. (2019)
Competing interests
The authors declare no competing financial interests.
References
1. Dauphinee, A. N., Cardoso, C., Dalman, K., Ohlsson, J. A., Berglund Fick, S., Robert, S., Hicks,
G. R., Bozhkov, P. and Minina, E. A. (2019). Chemical screening pipeline for identification of
specific plant autophagy modulators. Plant Physiol 181(3):855-866.
2. Hanamata, S., Kurusu, T., Okada, M., Suda, A., Kawamura, K., Tsukada, E. and Kuchitsu, K.
(2013). In vivo imaging and quantitative monitoring of autophagic flux in tobacco BY-2 cells.
Plant Signal Behav 8(1): e22510.
3. Huang, R., Xu, Y., Wan, W., Shou, X., Qian, J., You, Z., Liu, B., Chang, C., Zhou, T., Lippincott-
Schwartz, J. and Liu, W. (2015). Deacetylation of nuclear LC3 drives autophagy initiation under
starvation. Mol Cell 57(3): 456-466.
4. Klionsky, D. J., Abdelmohsen, K., Abe, A., et al. (2016). Guidelines for the use and interpretation
of assays for monitoring autophagy (3rd edition). Autophagy 12: 1554-8635 (Online).
5. Zhou, C., Zhong, W., Zhou, J., Sheng, F., Fang, Z., Wei, Y., Chen, Y., Deng, X., Xia, B. and Lin,
J. (2012). Monitoring autophagic flux by an improved tandem fluorescent-tagged LC3
(mTagRFP-mWasabi-LC3) reveals that high-dose rapamycin impairs autophagic flux in cancer
cells. Autophagy 8(8): 1215-1226.
6. Ritz, C., Baty, F. and Strebig, J. C. (2015). Dose-response Analysing Using R. PLoS ONE 10(12):
e0146021.
Please cite this article as: Dauphinee et. al., (2020). Tandem Tag Assay Optimized for Semi-automated in vivo Autophagic Activity Measurement in Arabidopsis thaliana roots,Bio-protocol 10 (5): e3535. DOI: 10.21769/BioProtoc.3535.