Embed Size (px)
DESCRIPTION
A Strategic Environmental Assessment (SEA) comprises an analytical toolkit for strategic decision-making that aims to integrate environmental considerations into policies, plans and programmes. This SEA was conducted to inform the process of formulating the Tana Delta Land Use Plan. It outlines the main measures that must be taken towards achievement of sustainable development of the delta: describing the factors influencing land use; ensuring integration of stakeholders’ socio-economic and environmental perspectives into the Land Use Plan; assessing the implications of the plan on the Delta’s sustainable management; and, assessing alternative land use options for the Land Use Plan. Without consideration of such measures, the future of the Tana Delta will continue to be threatened by multiple factors, some of which are external to the Delta.
Citation preview


Tana River DeltaSTRATEGIC ENVIRONMENTAL
ASSESSMENT
2014
Produced to support preparation of theTana River Delta Land Use Plan
Connecting people for change

TANA RIVER DELTA STRATEGIC ENVIRONMENT ASSESSMENT 2014
Compiled by:Peter Odhengo , Paul Matiku, John Nyangena, King’uru Wahome, Benard Opaa, Serah Munguti, George Koyier, Peter Nelson, Eugene Mnyamwezi and Paul Misati
Edited by:Serah Munguti, Caroline Kabilu, Fleur Ng’weno, John Nyangena, Peter Nelson, John Mwacharo, Peter Odhengo and Paul Matiku
Design and Layout:John Mwacharo
Lead institutions:Governments of Tana River and Lamu Counties, Ministry of Lands, The National Treasury, Kenya Institute for Public Policy Research and Analysis, and Nature Kenya
Collaborating Institutions:Ministry of Environment, Water and Natural Resources; Ministry of Agriculture, Livestock and Fisheries; Ministry of Information, Communication and Technology; Ministry of Planning and Devolution; Ministry of Land, Housing and Urban Development; The National Treasury; Ministry of Interior and Coordination of National GovernmentGovernment Agencies: Kenya Wildlife Service, Kenya Forest Service, National Environment Management Authority, Kenya Institute for Public Policy Research and Analysis; National Museums of Kenya, Tana and Athi Rivers Development Authority, Imarisha Naivasha BoardCivil Society: Nature Kenya - the East Africa Natural History Society; the Royal Society for the Protection of Birds and the World Wide Fund for Nature.
Technical Advisor: Peter Nelson
GIS Expert: Dickens Odeny
External Advisor:Netherlands Commission for Environmental Assessment
Published by:The Tana River and Lamu County Governments
Tana River CountyP.O. Box 29-70101 GPO, Hola, [email protected] www.tanariver.go.ke
Lamu CountyP.O Box 74 – 80500, [email protected]
© 2014
Recommended Citation: Odhengo P., Matiku P., Nyangena J., Wahome K., Opaa B., Munguti, S., Koyier G., Nelson, P., Mnyamwezi, E. (2014a). Tana River Delta Strategic Environmental Assessment.
i

TANA RIVER DELTA STRATEGIC ENVIRONMENT ASSESSMENT 2014
NO. NAME ORGANIZATION 1. Anderson Koyo Imarisha Board – Naivasha 2. Paul Matiku Nature Kenya 3. Robert Ndetei World Wide Fund for Nature 4. Kenneth Waithiru Ministry of Finance 5. Benard Opaa National Environment Management Authority 6. Fred Omego Kenya Wildlife Service 7. Judith Nyunja Kenya Wildlife Service 8. John Nyangena Kenya Institute for Public Policy Research and Analysis; 9. Joan Gichuki Nature Kenya 10. Richard Fox Imarisha Board – Naivasha 11. Samuel Gitonga Tana and Athi Rivers Development Authority 12. Naftali Abuya Ministry of Environment, Water and Natural Resources 13. Patrick Adolwa Ministry of Planning and Devolution 14. Patrick Waweru Ministry of Land, Housing and Urban Development 15. Brian Waswala Kenya Wildlife Service 16. Daniel M. Mbithi Kenya Forest Service 17. Ernest Mwongela Nature Kenya 18. Serah Munguti Nature Kenya 19. Zephania O. Ouma National Environment Management Authority 20. George A. Koyier Ministry of Environment, Water and Natural Resources 21. Verity Mghanga Office of the Prime Minister 22. Emily Boro Office of the Prime Minister 23. Dan O. Oguda Ministry of Agriculture, Livestock and Fisheries 24. King’uru Wahome Ministry of Environment, Water and Natural Resources 25. Dickson O. Nyandiga Ministry of Information, Communication and Technology 26. Dr. K. I. Ondimu National Environment Management Authority 27. Robert Mounde Kenya Water Towers Agency 28. Peter Odhengo The National Treasury 29. Bahati Mwita Kenya Water Towers Agency 30. Eugene Mnyamwezi Ministry of Environment, Water and Natural Resources 31. Sammy Kathike Ministry of Land, Housing and Urban Development 32. Jane Kibwage Ministry of Agriculture, Livestock and Fisheries 33. Dickens Odeny National Museums of Kenya 34. Benjamin Tuikong Ministry of Information, Communication and Technology 35. Sam Kosgei Ministry of Energy and Petroleum 36. Patrick Oloo Ministry of Environment, Water and Natural Resources 37. David Gitonga Ministry of East Africa Affairs, Commerce, and Tourism 38. Tom Kinara Ministry of Agriculture, Livestock and Fisheries
Members of the Inter-Ministerial Technical Committee on Sustainable Management of Deltas in Kenya
ii

TANA RIVER DELTA STRATEGIC ENVIRONMENT ASSESSMENT 2014
NO. NAME ORGANIZATION 1. Omar W. Buketa Tana River County Executive for Lands, Agriculture,
Livestock and Fisheries 2. Amina Rashid Masoud Lamu County Executive for Land, Physical Planning,
Infrastructure Urban Development, Water and Natural Resources
3. Sophia O. Wedo Tana River County Executive for Environment, Natural Resources and Wildlife
4. Abdi Bile Tana River County Executive for Cohesion and Special Programmes
5. Salim Mohamed Tana River County Executive for Water, Health and Sanitation
6. Anthony Macharia Ag. District Commissioner Tana Delta 7. Ali K. Ahmed District Development Officer – Tana Delta 8. Paul Njau District Development Officer -‐ Lamu 9. Judy Hamasa Agriculture Extension Officer, Tana Delta 10. Maurice Ochieng Physical Planning Officer, Tana River 11. Maurice Ogoma Fisheries Officer, Lamu 12. Dominic Mumbu Nature Kenya 13. Peter Munywoki District Livestock Production Officer’s Office – Tana
Delta 14. Swaleh Wario Orma Council of Elders 15. Hassan Barisa Wardei Council of Elders 16. Dabane SoSo Watha Council of Elders 17. Justin Nkaduda Pokomo Council of Elders 18. Said Botaya Farmers’ representative 19. Moses Jaoko Beach Management Unit – Freshwater 20. Hadija Bante Beach Management Unit -‐ Marine 21. Ijema Godana District Peace Committee 22. Said Nyara Conservation Groups representative 23. Margaret Hiribae Maendeleo ya Wanawake Chair-‐ Tana Delta 24. Mary Kaingu Maendeleo ya Wanawake -‐ Kipini 25. Zainab Golo District Livestock Marketing Council 26. Abdalla Bakero Ranchers Forum 27. Ayub Israel People with Disabilities representative 28. Aladdin Malibe Youth Representative 29. Mohamed Bworu Business Community representative 30. Ustadh Abdulahi Hajj Gudo Council of Imam Preachers in Kenya ; CDF Chairman
Garsen Constituency 31. Bishop Douglas Machafu National Council of Churches in Kenya 32. Maurice Karisa Maridhiano CBO 33. Stanley Robert Member of Parliament’s Office, Garsen Constituency 34. Yahya Ali Member of Parliament’s Office, Garsen Constituency 35. Mohamed Roba Senator’s Office, Tana River County 36. Abdulkadir Rashid
Mohammed Senator’s Office, Tana River County
37. Lennox C. Mbwana Planning Office, Tana River County 38. Hassan Roble District Peace Committee 39. Juma M. Mohammed Agricultural Sector Development Office 40. Odera George Nature Kenya, Tana Delta Office 41. Natasha J. Dulu Maendeleo ya Wanawake, Tana Delta 42. Fredrick Aloo Medium Term ASAL Programme (MTAP/NRM) Tana
River County 43. Nimrod Imani National Council of Churches in Kenya
Members of the Tana Planning Advisory Committee (TPAC)
iii

TANA RIVER DELTA STRATEGIC ENVIRONMENT ASSESSMENT 2014
NO. NAME ORGANIZATION 1. Omar W. Buketa Tana River County Executive for Lands, Agriculture,
Livestock and Fisheries 2. Amina Rashid Masoud Lamu County Executive for Land, Physical Planning,
Infrastructure Urban Development, Water and Natural Resources
3. Sophia O. Wedo Tana River County Executive for Environment, Natural Resources and Wildlife
4. Abdi Bile Tana River County Executive for Cohesion and Special Programmes
5. Salim Mohamed Tana River County Executive for Water, Health and Sanitation
6. Anthony Macharia Ag. District Commissioner Tana Delta 7. Ali K. Ahmed District Development Officer – Tana Delta 8. Paul Njau District Development Officer -‐ Lamu 9. Judy Hamasa Agriculture Extension Officer, Tana Delta 10. Maurice Ochieng Physical Planning Officer, Tana River 11. Maurice Ogoma Fisheries Officer, Lamu 12. Dominic Mumbu Nature Kenya 13. Peter Munywoki District Livestock Production Officer’s Office – Tana
Delta 14. Swaleh Wario Orma Council of Elders 15. Hassan Barisa Wardei Council of Elders 16. Dabane SoSo Watha Council of Elders 17. Justin Nkaduda Pokomo Council of Elders 18. Said Botaya Farmers’ representative 19. Moses Jaoko Beach Management Unit – Freshwater 20. Hadija Bante Beach Management Unit -‐ Marine 21. Ijema Godana District Peace Committee 22. Said Nyara Conservation Groups representative 23. Margaret Hiribae Maendeleo ya Wanawake Chair-‐ Tana Delta 24. Mary Kaingu Maendeleo ya Wanawake -‐ Kipini 25. Zainab Golo District Livestock Marketing Council 26. Abdalla Bakero Ranchers Forum 27. Ayub Israel People with Disabilities representative 28. Aladdin Malibe Youth Representative 29. Mohamed Bworu Business Community representative 30. Ustadh Abdulahi Hajj Gudo Council of Imam Preachers in Kenya ; CDF Chairman
Garsen Constituency 31. Bishop Douglas Machafu National Council of Churches in Kenya 32. Maurice Karisa Maridhiano CBO 33. Stanley Robert Member of Parliament’s Office, Garsen Constituency 34. Yahya Ali Member of Parliament’s Office, Garsen Constituency 35. Mohamed Roba Senator’s Office, Tana River County 36. Abdulkadir Rashid
Mohammed Senator’s Office, Tana River County
37. Lennox C. Mbwana Planning Office, Tana River County 38. Hassan Roble District Peace Committee 39. Juma M. Mohammed Agricultural Sector Development Office 40. Odera George Nature Kenya, Tana Delta Office 41. Natasha J. Dulu Maendeleo ya Wanawake, Tana Delta 42. Fredrick Aloo Medium Term ASAL Programme (MTAP/NRM) Tana
River County 43. Nimrod Imani National Council of Churches in Kenya
44. Ali Jillo National Security Intelligence Service, Tana Delta 45. Evans Juma Subcounty Livestock Production and Development
Officer, Tana Delta 46. Lilian Mudia Youth representative 47. Andrew Waweru Subcounty Planning and Development Officer, Lamu 48. Matthew Bwaboya Subcounty Planning and Development Officer, Tana
River 49. Vincent Osewe Physical Planner, Lamu 50. Jilo Kokani Tana Delta Conservation Network 51. Mohamed B. Athman Agricultural Extension Officer, Tana Delta 52. Dr. Ong’are D.O. Subcounty Veterinary Officer, Tana Delta 53. Hiribae Tufani Subcounty Planning and Development Officer, Tana
Delta 54. Dara Ali Abubakar WAYPRI CBO 55. Hussein O. Goricha Personal Assistant, Garsen Central Ward 56. Robinson Thuku Officer in Charge of Police Division, Tana Delta 57. Boaz M. Shiramba Agricultural Sector Development Support Programme,
Tana River County 58. Abaroba Barisa Office of the Governor, Tana River County 59. Kahindi Yeri National Environment Management Authority, Tana River
County 60. Hassan Roble Peace Committee representative 61. Salat Dakau Member of County Assembly, Tana River 62. Hadija Guya Women representative, Tana River County 63. Wilson Abashuba Golbanti Farmers Association 64. Hope Mwanyuma National Environment Management Authority, Tana River
County 65. Mohammed Roble Businessman 66. Rashid A. Were Assistant Deputy County Commissioner 67. Hussein Gobu Godana Member of County Assembly, Tana River
Members of the Tana Planning Advisory Committee (TPAC)
NO. NAME ORGANIZATION 1. Omar W. Buketa Tana River County Executive for Lands, Agriculture,
Livestock and Fisheries 2. Amina Rashid Masoud Lamu County Executive for Land, Physical Planning,
Infrastructure Urban Development, Water and Natural Resources
3. Sophia O. Wedo Tana River County Executive for Environment, Natural Resources and Wildlife
4. Abdi Bile Tana River County Executive for Cohesion and Special Programmes
5. Salim Mohamed Tana River County Executive for Water, Health and Sanitation
6. Anthony Macharia Ag. District Commissioner Tana Delta 7. Ali K. Ahmed District Development Officer – Tana Delta 8. Paul Njau District Development Officer -‐ Lamu 9. Judy Hamasa Agriculture Extension Officer, Tana Delta 10. Maurice Ochieng Physical Planning Officer, Tana River 11. Maurice Ogoma Fisheries Officer, Lamu 12. Dominic Mumbu Nature Kenya 13. Peter Munywoki District Livestock Production Officer’s Office – Tana
Delta 14. Swaleh Wario Orma Council of Elders 15. Hassan Barisa Wardei Council of Elders 16. Dabane SoSo Watha Council of Elders 17. Justin Nkaduda Pokomo Council of Elders 18. Said Botaya Farmers’ representative 19. Moses Jaoko Beach Management Unit – Freshwater 20. Hadija Bante Beach Management Unit -‐ Marine 21. Ijema Godana District Peace Committee 22. Said Nyara Conservation Groups representative 23. Margaret Hiribae Maendeleo ya Wanawake Chair-‐ Tana Delta 24. Mary Kaingu Maendeleo ya Wanawake -‐ Kipini 25. Zainab Golo District Livestock Marketing Council 26. Abdalla Bakero Ranchers Forum 27. Ayub Israel People with Disabilities representative 28. Aladdin Malibe Youth Representative 29. Mohamed Bworu Business Community representative 30. Ustadh Abdulahi Hajj Gudo Council of Imam Preachers in Kenya ; CDF Chairman
Garsen Constituency 31. Bishop Douglas Machafu National Council of Churches in Kenya 32. Maurice Karisa Maridhiano CBO 33. Stanley Robert Member of Parliament’s Office, Garsen Constituency 34. Yahya Ali Member of Parliament’s Office, Garsen Constituency 35. Mohamed Roba Senator’s Office, Tana River County 36. Abdulkadir Rashid
Mohammed Senator’s Office, Tana River County
37. Lennox C. Mbwana Planning Office, Tana River County 38. Hassan Roble District Peace Committee 39. Juma M. Mohammed Agricultural Sector Development Office 40. Odera George Nature Kenya, Tana Delta Office 41. Natasha J. Dulu Maendeleo ya Wanawake, Tana Delta 42. Fredrick Aloo Medium Term ASAL Programme (MTAP/NRM) Tana
River County 43. Nimrod Imani National Council of Churches in Kenya
iv

TANA RIVER DELTA STRATEGIC ENVIRONMENT ASSESSMENT 2014v
UNITS OF MEASUREMENTHa One Hectare (10,000 square metres)Km2 One hundred hectaresM3/sec Cubicmetrepersecond(measurementofriverflow)

TANA RIVER DELTA STRATEGIC ENVIRONMENT ASSESSMENT 2014
LIST OF FIGURES ............................................................................................................................................................................ xiLIST OF TABLES ............................................................................................................................................................................. xiiLIST OF ACRONYMS ................................................................................................................................................................... xiiiMESSAGE FROM TANA RIVER COUNTY GOVERNOR ...................................................................................................... xivMESSAGE FROM LAMU COUNTY GOVERNOR .................................................................................................................. xivFOREWORD .................................................................................................................................................................................. xviACKNOWLEDGEMENT ............................................................................................................................................................. xviiPREFACE ....................................................................................................................................................................................... xviiiOUTLINE .......................................................................................................................................................................................... xx
PART ONE: THE BASELINECHAPTER 1: CONTEXT AND ROLE OF SEA ............................................................................................................................. 11.1 Background ........................................................................................................................................................................... 11.2 Conduct of the LUP and SEA ............................................................................................................................................ 11.3 Role of the SEA .................................................................................................................................................................... 11.4 Policy Context ...................................................................................................................................................................... 21.5 SEAPreparationProcess...................................................................................................................................................2
CHAPTER 2: SITUATION ANALYSIS .......................................................................................................................................... 4 Introduction..........................................................................................................................................................................4
Part One: Description of the Tana River Basin ........................................................................................................................... 42.1 Geography of the Tana River Basin .................................................................................................................................. 4
Part Two: Socio-Economic Conditions and Land Use ............................................................................................................... 52.2 Socio-economicConditions..............................................................................................................................................52.3 Land use in the Tana Delta ................................................................................................................................................ 72.4 Economic Base, Jobs, and Livelihoods in the Delta ................................................................................................... 102.5 Development Trends ........................................................................................................................................................ 122.6 Governance ........................................................................................................................................................................ 12
Part Three: Environmental Conditions ....................................................................................................................................... 132.7 Geology and Soils .............................................................................................................................................................. 132.8 Hydrology of the Tana River Basin ................................................................................................................................ 142.9 Hydrology of the Tana Delta ........................................................................................................................................... 182.10 Future Water Supply and Demand ................................................................................................................................ 202.11 Climate Change ................................................................................................................................................................. 22
Part Four: Biodiversity .................................................................................................................................................................... 252.12 BiodiversityCharacteristicsoftheTanaRiverBasin.................................................................................................252.14 SummaryofBaselineCharacteristicsintheTanaDelta...........................................................................................30
Part Five: Key Issues in the Tana Delta ...................................................................................................................................... 332.14 Introduction........................................................................................................................................................................33
CHAPTER 3: NATIONAL AND REGIONAL DEVELOPMENT SCENARIOS .................................................................... 40 Introduction.......................................................................................................................................................................40
Part One: National Scenario 1 - Changes to 2013-2030 ...................................................................................................... 403.1 Population..........................................................................................................................................................................403.2 Livelihoods ......................................................................................................................................................................... 403.3 Social Welfare ................................................................................................................................................................... 403.4 EconomicActivity.............................................................................................................................................................413.5 Water Demand .................................................................................................................................................................. 413.6 Hydrology ........................................................................................................................................................................... 463.7 Biodiversity ........................................................................................................................................................................ 46
TABLE OF CONTENT
vi

TANA RIVER DELTA STRATEGIC ENVIRONMENT ASSESSMENT 2014
Part Two: National Scenario 2 - Changes from 2030 to 2050 .............................................................................................. 463.8 Population...........................................................................................................................................................................463.9 Livelihoods .......................................................................................................................................................................... 463.10 Social Welfare ..................................................................................................................................................................... 473.11 EconomicActivity..............................................................................................................................................................473.12 Water Resources ................................................................................................................................................................ 473.13 Conclusions ........................................................................................................................................................................ 48
PART 2 ASSESSMENT OF THE BASELINE (EXISTING SITUATION) AND THREE SCENARIOS ............................... 50Preamble ............................................................................................................................................................................................. 51Levels of Accuracy ............................................................................................................................................................................ 51Introduction.......................................................................................................................................................................................51Tangible (Measurable) Values ......................................................................................................................................................... 51Less Tangible Values ......................................................................................................................................................................... 52
CHAPTER 4: ASSESSMENT OF EXISTING SITUATION ....................................................................................................... 53 Introduction........................................................................................................................................................................534.1 Land ...................................................................................................................................................................................... 534.2 Water .................................................................................................................................................................................... 544.3 Jobs ....................................................................................................................................................................................... 554.4 Value ..................................................................................................................................................................................... 574.5 Nature .................................................................................................................................................................................. 574.6 Culture ................................................................................................................................................................................. 574.7 Security ................................................................................................................................................................................ 57
CHAPTER 5: ASSESSMENT OF SCENARIO A ........................................................................................................................ 58 Introduction........................................................................................................................................................................585.1 Assessing Impacts on and Related to Land ................................................................................................................. 585.2 Assessing Impacts on and Related to Water ............................................................................................................... 635.3 Assessing Impacts on and Related to Livelihoods/Jobs ........................................................................................... 66 5.4 Value .................................................................................................................................................................................... 685.5 NatureConservationandBiodiversity.........................................................................................................................685.6 Culture ................................................................................................................................................................................. 695.7 Security ................................................................................................................................................................................ 70
CHAPTER 6: ASSESSMENT OF SCENARIO B......................................................................................................................... 72 Introduction........................................................................................................................................................................726.1 Assessing Impacts on and Related to Land ................................................................................................................. 726.2 Impacts on and Related to Water................................................................................................................................... 756.3 Impacts on and Related to Jobs and Livelihoods ....................................................................................................... 776.4 Value ..................................................................................................................................................................................... 796.5 Impacts on and Related to Nature and Biodiversity .................................................................................................. 806.6 Culture ................................................................................................................................................................................. 816.7 Security ................................................................................................................................................................................ 81
CHAPTER 7: ASSESSMENT OF SCENARIO C Introduction........................................................................................................................................................................827.1 Impacts on and Related to Land .................................................................................................................................... 81 7.2 ImpactsonandRelatingtoWater.................................................................................................................................847.3 Impacts on and Related to Jobs and Livelihoods ....................................................................................................... 857.4 Impacts on and Related to Value ................................................................................................................................... 86 7.5 ImpactsonandRelatingtoNature..................................................................................................................................877.6 Culture ................................................................................................................................................................................. 89 7.7 Security ................................................................................................................................................................................ 90
TABLE OF CONTENT
vii

TANA RIVER DELTA STRATEGIC ENVIRONMENT ASSESSMENT 2014
CHAPTER 8: SUMMARY OF FINDINGS ON THE EXISTING SITUATION AND THREE SCENARIOS ...................... 91 Introduction.......................................................................................................................................................................918.1 Demand for Land .............................................................................................................................................................. 918.2 Water Requirements ........................................................................................................................................................ 968.3 JobCreation....................................................................................................................................................................1008.4 Economic Value ............................................................................................................................................................... 1028.5 Adjustments to the Economic Values of the three Scenarios .............................................................................. 1058.6 Social and Cultural Impacts .......................................................................................................................................... 1068.7 Biodiversity Impacts ....................................................................................................................................................... 106
CHAPTER 9: CONCLUSIONS AND RECOMMENDATIONS ............................................................................................. 107 Introduction......................................................................................................................................................................107Part One – The Tana River Basin .............................................................................................................................................. 1079.1 EconomicDevelopmentInitiatives.............................................................................................................................107
Part Two - The Tana Rivear Delta ............................................................................................................................................. 108
REFERENCES ................................................................................................................................................................................ 109
Annex 1: Review of Data on the River Tana Flows and Discharge in the Lower Catchment ..................................... 117
TABLE OF CONTENT
viii

TANA RIVER DELTA STRATEGIC ENVIRONMENT ASSESSMENT 2014
Figure 2.1 River Tana CatchmentFigure2.2 SettlementPatternsintheTanaRiverDeltaShowingLocationofVillagesFigure2.3 SettlementPatternsintheTanaRiverDeltabyLivelihoodSourceFigure 2.4 Land Use Classes in the Tana Delta Planning AreaFigure 2.5 The River Tana CatchmentFigure 2.6 Historic Channels of the River TanaFigure2.7 ManuallyPlottedOneMetreContoursfortheTanaDelta,Ortho-correctedandGeo-referenced using ESRI GISFigure2.8 AreasPotentiallyAffectedbySeaLevelRiseinthePeriodto2100Figure2.9 DistributionofVegetationandLandCoverintheDelta(2010)Figure2.10 WildlifeandlivestockMigrationRoutesFigure 2.11 Summary of Key Issues in the Tana River DeltaFigure3.1 AnticipatedPopulationGrowthinKenyaFigure 3.2 Predicted Water ResourcesFigure3.3 RenewableWaterResourcesbycatchmentin2030Figure 3.4 Water Demand by Catchment in 2030Figure4.1 SimplifiedVegetation/LandCoverZoneswiththePlanAreaFigure4.2 DetailedVegetation,LandCoverandLandUsewithinthePlanArea(AreaKm2)Figure4.3 ImportanceofLand,WaterandEnvironmentalQualitytospecificLandUsesFigure4.4 ExistingWaterUsesintheTanaDelta(ExcludingtheEnvironmentalReserve)Figure4.5 ExistingWaterUsesintheTanaDeltaIncludingtheEnvironmentalReserveFigure4.6 ExistingJobs/LivelihoodswithintheTanaDelta(2010estimate)Figure4.7 ValueofLandUseActivityin2010Figure5.1 ExistingVegetationandLandCoverintheDeltaFigure5.2 DailyWaterDemandforMainLandUseActivitiesFigure5.3 WaterDemandforLandUseActivities(ExcludingNatureConservation)Figure 5.4 Increase in Livelihoods (Jobs) Under Scenario AFigure5.5 GrossValueofLandUseActivitiesunderScenarioAFigure6.1 LandDemandofDifferentActivitiesFigure6.2 OverallWaterBalanceFollowingDevelopmentofAgriculturalCropsin2030and2050Figure6.3 RelativeDemandofAgriculturalandIndustrialCrops(SugarCane)inm3/secFigure 6.4 Number of Jobs/Livelihoods Created under Scenario BFigure6.5 GrossValueofLandUseActivitiesunderScenarioB(includingsugar)Figure6.6 GrossValueofLandUseActivitiesunderScenarioC(excludingsugar)Figure 7.1 Maintenance of the environmental reserve dominates Water Demand under Scenario CFigure 7.2 Water Demand under Scenario C excluding the environmental reserveFigure7.3 JobCreationunderScenarioCby2030and2050Figure7.4: GrossValueofEconomicActivitiesin2030and2050underScenarioCFigure8.1 GrossDemandforLandforScenariosA,B&Cin2050ComparedwiththeExistingSituationin 2010 Figure8.2 GrossDemandforLandforScenariosA,B&Cin2050ComparedwiththeExistingSituationFigure8.3 DemandforwaterinM3/Sec for each scenario in 2010, 2030 and 2050Figure 8.4 Increase in Water Demand over the Base Rate of 60m3/secFigure 8.5 Number of Jobs Generated under each ScenarioFigure8.6 NotionalEconomicValueAssessedinKShMillionfortheThreeScenariosFigure8.7 AdditionofScenariosA1andB1showingNotionalEconomicValueAssessedinKShMillion
LIST OF FIGURES
xi

TANA RIVER DELTA STRATEGIC ENVIRONMENT ASSESSMENT 2014
Table 2.1 Areas Occupied by Various Land Use Classes in the Tana Delta Planning AreaTable 2.2 Number of Animals per Household (2010)Table2.3 EconomicActivityintheDelta(2010)Table2.4 EvapotranspirationfromFloodplainGrasslandandWetlandFarmingAreasinaDryMonthTable2.5 EvapotranspirationfromallAreasoftheFloodplaininaDryMonthTable2.6 WildlifePopulationintheTanaDeltaTable 2.7 Rare and Endangered Birds found in Tana River DeltaTable 2.8 Primary Habitats Making up the Core of the Tana DeltaTable2.9 EcosystemServicesintheLowerTanaTable 2.10 Baseline SummaryTable2.11 SummaryofKeyIssuesandPossibleSolutionsTable 3.1 Water Demand Forecasts for the Lamu Port and LAPSSET ProjectTable3.2 CumulativeWaterDemandby2030intheTanaRiverBasinTable 3.3 Water Demand in 2030Table 3.4 Balanced Water Demands in 2030Table 3.5 Summary of Water Resources DevelopmentTable4.1 SimplifiedVegetationandLandCoverintheTanaDeltaPlanAreaTable4.2 ExistingWaterUsesintheTanaDeltaTable4.3 LandUseActivitiesandRelatedNumberofLivelihoods/Jobsin2010Table4.4 ValueofIndividualLandUseActivitiesin2010Table5.1 PotentialImpactsfromExpansionofAgricultureandUrbanAreasonImportantHabitatsby2030 and 2050Table5.2 ScenarioA-DailyWaterConsumptioninM3/day for Main Land UsesTable5.3 LossofHabitatbetween2010and2050underScenarioATable 5.4 Jobs/Livelihoods under Scenario ATable5.5 ValueofDifferentActivitiesTable5.6 PredictionofTropicalLivestockUnitsin2030and2050,andEquivalentAreasatDifferent StockingDensities.Table6.1 AnnualWaterDemandforCropsGrownintheTanaDeltaunderScenarioBTable6.2 DistributionofLivelihoodsunderScenarioB(FTE)Table7.1 WaterDemandofDifferentActivitiesTable7.2 JobsbyActivity(FTE)Table7.3 ValueofDifferentActivities(KSh)Table8.1 DemandforLandbyDifferentEconomicActivities;allScenariosin2030Table8.2 DemandforLandbyDifferentEconomicActivities;allScenariosin2050Table8.3 GrossDemandforLandforScenariosA,B&Cin2030ComparedwiththeExistingSituationin 2010Table8.4 GrossDemandforLandforScenariosA,B&Cin2050ComparedwiththeExistingSituationin 2010 Table 8.5 Demand for Water in M3/Sec for each Scenario in 2010, 2030 and 2050Table8.6 WaterDemandforEconomicActivitiesundereachScenariointheYear,2030Table8.7 WaterDemandforEconomicActivitiesundereachScenariointheYear,2050Table 8.8 Number of Jobs Generated under each ScenarioTable8.9 JobsandLivelihoodsCreatedbyEconomicActivityby2030Table8.10 JobsandLivelihoodsCreatedbyEconomicActivityby2050Table8.11 NotionalEconomicValueAssessedinKShMillionfortheThreeScenariosTable8.12 FullRangeofEconomicActivitiesConsideredintheThreeScenariosintheYear2030 Table8.13 FullRangeofEconomicActivitiesConsideredintheThreeScenariosin2050Table8.14 AdditionofScenariosA1andB1showingNotionalEconomicValueAssessedinKShMillion
LIST OF TABLES
xii

TANA RIVER DELTA STRATEGIC ENVIRONMENT ASSESSMENT 2014
0C DegreescentigradeAsl Above sea levelAEZ Agro-ecologicalzonationCBD ConventiononBiologicalDiversityCEDAW ConventiononEliminationofallformsofDiscriminationagainstWomenCITES ConventiononInternationalTradeinEndangeredSpeciesCL CoastalLowlandcm centimetreCSO CivilSocietyOrganisationCumecs Cubic metres per secondDDC DistrictDevelopmentCommitteeDDP District Development PlanEIA Environment Impact AssessmentEIA/EA Environment Impact Assessment/Environment AuditEPS EconomicStimulusPlanFTE FulltimeequivalentGIS GeographicInformationSystemGMP General Management PlanHGFD High Grand Falls DamHa Hectareshr. Hour IBA Important Bird Area IMTC Inter-MinisterialTechnicalCommitteeIUCN InternationalUnionforConservationofNatureKengen KenyaElectricityGeneratingCompanyKFS Kenya Forest Service Km Kilometres Km2 Kilometres squaredKSh Kenya ShillingKWS Kenya Wildlife Service L/IL Lowland/InnerlowlandLAPSSET Lamu Port-South Sudan-Ethiopia Transport corridorLH LowerHighlandLM LowerMidlandzoneslu Livestock UnitsLUP Land Use Plan SEA Strategic Environment Assessmentm3 Cubic metres m3/sec Cubic metres per secondMDG’s Millennium Development Goals mm MillimetresMt. MountMEA MultilateralEnvironmentalAgreement
LIST OF ACRONYMS
xiii

TANA RIVER DELTA STRATEGIC ENVIRONMENT ASSESSMENT 2014
Over the years, the Tana River Delta, which
covers a total area of 130,000 ha and fallswithinTanaRiverand Lamu Countieshas experienced environmental and land use changes majorly due to the rising human population andcompetition for land,water, pasture andother finite naturalresources. The Tana River Delta has huge biodiversity values. It supports diversespeciesofplantsandanimalsandisofinternationalimportance as a key site forwater bird conservation. Inspiteofthesevalues,noseriousattemptshavebeenmadeinthepasttoaddresssomeofthenegativelanduseandenvironmental changes affecting the Delta. If anything,thedecliningwaterflowinTanaRiver,theeffectsoftheclimatechange, interestsof themultinationalcompaniesalongside these local negative changes have threatenedthe sustainability and the very existence of the Delta.
The County Government of Tana River therefore applauds the efforts aimed at developing a clear framework fordecisionmakingondevelopmentswithintheDeltainformof a Land Use Plan. The County Government supported andcontinuestosupportthisuniqueprocess.Isayuniquebecause unlike other plans, the Tana Delta LUP wassubjected a Strategic Environmental Assessment [SEA] whichessentiallyisnewphenomenoninKenyaandAfricaby extension. The SEA report gives us, as leaders of the Countygovernment,confidenceontherecommendationsof theLUPas it integratesenvironmentalconsiderationsinto policies, plans and programmes. The SEA report indicatesclearlytheimplicationsoftheLUPonsustainabledevelopment by assessing both internal and external factors influencing land use in the Delta. One greatcontributionof thisprocess toour countyGovernmentsis thatwe now clearly understand the amount ofwaterweneedtocontinuouslyflowintheTanaRivertoensurebasicsupportoflifeandotherprocesseswithintheDelta.
As elected leaders, ours is to serve the people andwestandtodefendtherightsofthepeopleweserve.
H.E Hussein DadoGovernor, Tana River County
MESSAGES FROM TANA RIVER COUNTY GOVERNOR
xiv
In the Kenyan history, it has been difficultand sometimes
almost impossible to find middle groundfor environmental conservation anddevelopment. Tana Deltaisacriticalhabitatboth for biodiversity and environmental conservation andalso for the huge population residingthere. This means that for sustainability, some understanding supportedbyscientificfactshastobearrivedat.Tothisend, the Tana Delta land Use Plan has been one of the most remarkably developed plans as its development process was entirely subjected to a Strategic EnvironmentalAssessment [SEA]. This, in essence, maximizes sustainable economic development opportunities while alsoidentifying potential impacts of development on humanwelfareandNaturalsystems.
As a County Government, we work to promote co-existence among the local communities inhabiting thedelta. This however remains a challenge due to thedifferent lifestyles, cultures and livelihood requirementsfor the inhabitants. We are determined to ensure that our peopleco-existpeacefullywithintheDeltaaswerenderthem services to the best of our knowledge and ability.ThisSEAreportwillbegreatly important inharmonizingthe different and sometimes conflicting land use formswithintheDelta.ThereportalsopreparesusasaCountyGovernment,movingforward,andinviewoftheseriousinfrastructural developments planned for Lamu County such as Lamu Port and South Sudan Ethiopia Transport (LAPSSET) Corridor on the kind of preparedness, projections and adjustmentswe need to make in orderensurethattheneedsofourpeopleareattendedtoeveninthetimesofsuchdevelopments.
TheCountyGovernmentofLamuwillbeattheforefrontin engaging other users of the River Tana to ensure that such uses are responsible and take cognizant of the Lamu residentswho live at the tail end of the river.We shallalsoensurethatresidentsofthelowerTanaDeltausethewaterandotherresourcesresponsibly.
H.E Issa A. Timamy Governor, Lamu County
MESSAGE FROM LAMU COUNTY GOVERNOR
TANA RIVER DELTA STRATEGIC ENVIRONMENT ASSESSMENT 2014xv
In lightof this,weshall ensure thatwe initiatedialoguebetweenusandtheNationalGovernmentalongsidethecounties upstream of the Tana River, who plan to putup massive developments that will lead to huge waterabstractions.Theaimofthisdialoguewillbetoensurethatnosuchdevelopmentsnegativelyaffect lifedownstreamin the Delta. We shall therefore stand by this SEA report and its findings. We shall also take bold and decisivesteps in ensuring a good mix of development activitiesand conservation of natural resources through creatingjob opportunities and sustainable economic activitiesaccessible to all.
H.E. Amb. Hussein DadoGovernor, Tana River County
Finally, the County Government of Lamu will promoteresource sharing among thevarious communities in thedeltawithaviewtofosteringintegrationandpeacefulco-existence
H.E Issa TimamyGovernor, Lamu County

TANA RIVER DELTA STRATEGIC ENVIRONMENT ASSESSMENT 2014
TheTanaRiverDeltaStrategicEnvironmentalAssessment(SEA)waspreparedtosupportthelanduseplanningprocessfortheArea.TheSEAisaresultofextensiveconsultationatcommunity,countyandnationallevelwiththeinputofinternationalSEAexperts.
ThecoreareaoftheTanaRiverDeltacompriseslandwithinTanaRiverandLamuCounties.TheTanaRiverDeltaisavastpatchworkofpalmsavanna,seasonallyfloodedgrassland,forestfragments,lakes,marinewetlandsandtheriveritself.ThiscombinationofhabitatsmakestheTanaDeltaabiodiversityhotspot.ItisdesignatedasaRamsarsite–awetlandofinternationalimportance–andanImportantBirdandBiodiversityArea.
The Delta is sparsely populated and inhabited by three major communities comprising Pokomo farmers, Ormapastoralists and Wardei pastoralists. Other ethnic groups include the Bajuni, Luo, Luhya, Boni, Wataa/Sanye, Malakote andMunyoyaya,amongothers.LargeandsmallscaleirrigationfarmingtakesplaceintheTanaDelta.LargeherdsofcattlegrazeintheDeltaduringthedryseason.Inaddition,anumberofprojectswithinKenya’sVision2030areplannedwithintheDeltaanditscatchment.
Overthepastdecade,conflictshavebeenincreasing intheTanaRiverDeltaasaresultof increasingpopulation,competitionforland,land-basedresourcesandaccesstowater,andencroachmentintofragileecosystems.Theseconflictsarecompoundedbylackofageneralframeworktoguidedecision-makingondevelopmentoftheDelta.Thishas compromisednatural resource conservationefforts andcommunity interests.Thechallenges facing theDelta require a coordinated approach to planning and management of the resources in the Delta. Only land use planning can provide that opportunity, as sectoral planning tends to be single-resource focused.
Preparationof a LandUsePlan forTanaRiverDelta to guide policy formulation anddecision-making on futuredevelopmentoftheDeltastartedinSeptember2011throughtheMinistryofLandsandwithinvolvementofotheragencies.ItispartofaprogrammetocoordinatethesustainablemanagementofDeltasinKenya,initiatedinJuly2011bytheOfficeofthePrimeMinisterwithanInter-MinisterialTechnicalCommitteecomposedof18ministries.ThisSEAwasconductedconcurrentlywiththeTanaRiverDelta landuseplanningprocess.TheSEAinparticularseekstostrengthentheintegrationofsocio-economicandecologicalaspectsintheTanaDeltaLandUsePlan.Theseinclude:i. Describingtheexternalandin-situfactorsinfluencinglanduseintheTanaRiverDelta;ii. Ensuringintegrationofstakeholders’socio-economicandenvironmentalperspectivesintotheproposed LUP;iii. EstablishingtheimplicationsoftheproposedLUPonTanaRiverDeltasustainablemanagementand development;iv. Identifyingandmappingoutspecifichabitats,naturalresourcesorlandusezonesthatshouldbepreserved inperpetuitytoensurethesurvivaloftheTanaRiverDeltaecosystem;v. Assessingalternativelanduseoptionsthatcaninformthepreferredstrategyandplan.
InparticulartheanalyseswithinthisSEAwereinstrumentalfortheinterrogationofdevelopmentoflanduseoptionsin theTanaDeltaandthedevelopmentof thepreferred landusestrategythatstrikes thebestbalancebetweendevelopmentandconservation.
TheTanaRiverDeltaSEA isbasedon theOrganisation forEconomicCooperationandDevelopmentAssistanceCommittee(OECD-DAC)SEAframeworkonwhichKenya’sSEAGuidelinesarelargelybased,andtheWorldBankapproachtoInstitutionalSEAinwhichattentionisgiventoinstitutionalstrengthsandweaknessesandthecapacityofinstitutionstoimplementdecisions.
FOREWORD
xvi
TANA RIVER DELTA STRATEGIC ENVIRONMENT ASSESSMENT 2014
TheStrategicEnvironmentalAssessment(SEA)processfortheLandUsePlanforTanaRiverDeltawascarriedoutundertheguidanceoftheInter-ministerialTechnicalCommittee(IMTC)onDeltasinKenya.ThetechnicalproductionoftheTanaDeltaSEAwasundertakenbytheSEATeam,coordinatedbyPeterOdhengoinitially
fromtheOfficeofthePrimeMinisterandlaterfromtheNationalTreasury.TheSEAteamcomprisedrepresentativesfromvariouspublicandprivateorganizations:PeterOdhengo(theNationalTreasury),PaulMatiku(NatureKenya),JohnNyangena(KenyaInstituteforPublicPolicyResearchandAnalysis),WahomeKing’uru(MinistryofEnvironment,WaterandNaturalResources),BenardOpaa(NationalEnvironmentManagementAuthority),DickensOdeny(NationalMuseumsofKenya), SerahMunguti (NatureKenya),GeorgeKoyier (MinistryofEnvironment,WaterandNaturalResources),EugeneMmyamwezi(MinistryofEnvironment,WaterandNaturalResources),andPaulMisati(DynamoConsultingLtd).TheSEAteamwasresponsibleforcompilingthisreport.
TheTanaPlanningAdvisoryCommittee(TPAC),composedofrepresentativesofkeystakeholdersatthelocallevel,wasinstrumentalinprovidinginformationforthisreportaswellasincreatingawarenessamongthecommunitiesbyorganizingandparticipatinginvillageconsultations.HelenByronofRoyalSocietyforProtectionofBirds(RSPB)inUnitedKingdomprovidedtechnicalsupportwhilePeterNelsonofPlanningGreenfutures(PGF)providedconsultancyservicesthroughouttheprocess.TheNetherlandsCommissionforEnvironmentalAssessmentreviewedinitialreportsandensuredcompliancetointernationalstandards.Toallthesewewouldliketoexpressourdeepappreciation.
We are highly indebted and also grateful to Nature Kenya for mobilizing funding from DFID, the Royal Society for the ProtectionofBirds,USFishandWildlifeService,EcosystemAlliance(IUCNNetherlands,WetlandsInternationalandBothENDS)andtheWorldBanktosupportthisactivity,providinglogisticalsupport,andavailingpersonnelatthelocallevelduringcommunityconsultations.
Sincere thanksgo to theGovernmentsof theTanaRiverandLamuCounties, theGovernmentofKenya throughMinistries, agencies and non government institutions which provided technical staff to the IMTC: Ministry ofEnvironment,WaterandNaturalResources;MinistryofAgriculture,LivestockandFisheries;MinistryofInformation,Communication and Technology; Ministry of Planning and Devolution; Ministry of Land, Housing and UrbanDevelopment;TheNationalTreasury;TheMinistryofInteriorandCoordinationofNationalGovernment,GovernmentAgencies:KenyaWildlifeService,KenyaForestService,NationalEnvironmentManagementAuthority,KenyaInstituteforPublicPolicyResearchandAnalysis;NationalMuseumsofKenya,TanaandAthiRiversDevelopmentAuthority,ImarishaNaivashaBoard,andCivilSociety:NatureKenya-TheEastAfricaNaturalHistorySociety;theRoyalSocietyfortheProtectionofBirdsandtheWorldWideFundforNature.
Peter O. OdhengoDeltas Secretariat Team LeaderTheNationalTreasury
ACKNOWLEDGEMENT
xvii

TANA RIVER DELTA STRATEGIC ENVIRONMENT ASSESSMENT 2014
A StrategicEnvironmentalAssessment(SEA)comprisesananalyticaltoolkitforstrategicdecision-makingthataimstointegrateenvironmentalconsiderationsintopolicies,plansandprogrammes.ThisSEAwasconductedtoinformtheprocessofformulatingtheTanaDeltaLandUsePlan.Itoutlinesthemainmeasuresthatmust
be taken towards achievement of sustainable development of the delta: describing the factors influencing landuse;ensuringintegrationofstakeholders’socio-economicandenvironmentalperspectivesintotheLandUsePlan;assessingtheimplicationsoftheplanontheDelta’ssustainablemanagement;and,assessingalternativelanduseoptionsfortheLandUsePlan.Withoutconsiderationofsuchmeasures,thefutureoftheTanaDeltawillcontinuetobethreatenedbymultiplefactors,someofwhichareexternaltotheDelta.
TanaRiverDeltaisanimportantareaforbiodiversityandenvironmentalservices.Itcontainsaverywidevarietyofhabitats,includingriverineforest,grassland,woodland,bushland,lakes,mangroves,dunes,beaches,estuariesandcoastalwaters.SomeofthegloballythreatenedbirdspeciesfoundintheareaareMalindiPipit,BasraReedWarblerand Tana River Cisticola. Other important biodiversity resources found in the Delta include hippos, crocodiles,wetlands,mangroveforests,fisheriesandfisheriesspawninggrounds.
TheTanaDeltaisunderpressurefromdecliningwaterinRiverTana,risinghumanpopulation,intensiveeconomicactivities,andlandusechanges.Thus,thereisurgentneedtoregulatethewayinwhichlandiscurrentlyallocatedto various users and interest groups. A Land Use Plan spearheaded by the County Governments of Tana River and Lamuprovides a framework fordecision-making atbothnational and county level.ThisStrategicEnvironmentalAssessmentwasconductedtoinformandguidetheTanaDeltaLandUsePlan.
ThisSEAprovides,perhapsforthefirsttime,adetailedassessmentofkeyissuesthatdrivechangeintheTanaDeltaandoffersoptionsforintegrationintheLandUsePlan.TheSEAreportistheproductofawideconsultationrangingfromlocalcommunitiesatthevillages,governmentandcivilsocietypersonnelatcountyandnationallevel,aswellastechnicalinputfrominternationalSEAexperts.
TheSEAhasdemonstratedconclusivelythat,contrarytotheestablishedviewthatfloodeventsoriginatingintheUpperandMiddleRiverTanacatchmenthavelittleornoeffectonthedelta,thelowerRiverTanarespondsinthesameway to rainfall events in thehighlands as theupper river. It is also affectedbyflashflooding frommajorseasonalstreams,whichbringverylargebutunquantifiablevolumesoffloodwaterintothedelta.
PoliticalandsocialconditionsintheTanaDeltahavebeenvolatileforsomedecades,reflectingtheverydifferentlifestyles,cultureandlivelihoodrequirementsofthetwomaingroupsofinhabitantswhicharebasedonsedentaryfarmingandlivestockrearing.EvidencefromtheSEAsuggeststhatcompetitionforscarcenaturalresourcesiscertaintoincreaseintheshortterm,andonlytheintroductionofagreedstandardsforlanduseplanningcanhelptominimisedisputes.Risinghumanpopulationhasreducedthewidthofmigratorycorridors,aswitnessedinsomeareaswhereindividualhomesteadshavebeenbuiltwithinthecorridors.TheDeltaalsofacesrealthreatsfromtheimpactsofproposed developments in the larger coastal region such as the Lamu Port South Sudan Ethiopia Transport corridor, TanaDeltaIrrigationProjectandtheHighGrandFallsDam.Basedonthisbackground,theSEAconcludesthatanyfuturedevelopmentoftheDeltashouldbebasedonacombinationofself-sufficiency,community-ledenterpriseandpublic/private partnership.
ThisLandUsePlancallsforboldactiontoensureagoodmixofdevelopmentactivitiesandconservationofnaturalresourcesthroughcreatingjobopportunitiesandsustainableeconomicactivities.
EconomicactivitiesshouldincludeimprovedmanagementoflivestockwithintheDeltaandsurroundingareasandthepromotionofcommunitybasedfarmingenterprises,supportedbyprivatepartners.Developmentoffreshwaterfisherieswillalsobecontinuedandextendedsinceitcanprovidesignificantincomeaswellasanimportantsourceoffoodandprotein.Acoreareaofhabitatsincludingriverineforest,forestsfragments,mangroveforests,andwetgrasslandinthefloodplainwillcontinuetoserviceawiderangeoffunctions,includingmaterialsforhousebuilding,food, medicinal plants, honey and livestock grazing. Establishment of nature conservancies to support tourism and strengthencommunitieswillbecomeimportantincome-generatingsourcesofnewemployment.
PREFACE
xviii

TANA RIVER DELTA STRATEGIC ENVIRONMENT ASSESSMENT 2014
TheSEArecommendsthatahierarchyofsettlementsisapprovedundertheLandUsePlanwhereprioritywillbegiventoprovisionofpublicservices.MainurbansettlementsthatformthefirsttierincludeGarsen,Witu,TarasaaandKipini.Asecondarytierofsettlementsshouldbeidentifiedbasedondetailedsurveysundertakeninthenext2-3years.
Forfutureirrigationschemestosucceed,thefirstrequirementwillbeforthesetobeownedanddevelopedbythecommunitiesthemselvesinpartnership,whereappropriate,withrelevantbusinessandtechnicalexperts.Akeyissueforall irrigationschemesistodetermineareliablesourceofwater.AttemptstodiverttheTanaRiverandprovideweirsandsluiceshaveoftenfailedbecausetheriverhassubsequentlyadoptedanewmeanderpatternafterflooding.
Solutions to provide employment opportunities must lie in adding value to local produce through processing,manufacturing and trading and effort should be focused on creating marketing cooperatives for packaging andtransportingfoodstuffstomajornationalmarkets.VegetableproductioncouldbeamajoreconomicactivityintheTanaDelta,providingthatthenecessarytransportationandmarketingfacilitiesaredevelopedintandemwithfoodproduction.TherangeofcropsthatcanbegrownintheDeltaisverywideandthis,combinedwithopportunitiesforgrowingthreecropsayear,providesmajoropportunities.SomeenterprisingfarmersfromboththePokomoandOrmacommunitiesarealreadygrowingtomatoesandothervegetablesonacommercialscaleinthelowerdelta.
The SEA puts strong emphasis on developing both subsistence and commercial agriculture and manufacturing and industry.InconsequencetherewillbepressuresonnaturalresourcesintheDelta,particularlyintermsofconversionofwetgrasslandtofarmingareas.Thesepressureswillneedtobemanagedcarefullybyintroducinglocalsettlementdevelopmentactionplans,andanoverallmanagementplanforthecoreareaoftheRamsarsiteinordertopreventrandom growth and development which could fragment the ecosystem and cause disproportionate damage toprecious habitats.
The Land Use Strategies that are explored in Scenario C will require increased cooperation between pastoralcommunities in managing livestock and similar demands for cooperation between farming communities in thedevelopmentof jointenterprisesbetweengroupsof farmersandbusinesspartners.Reducingcurrent tensions intheTanaDeltaoverlandandwaterresourceswillnotbeachievedovernight.Insteaditwillneedtofollowaseriesofsteps.Thefirstofwhichistointroducetheconceptsofsharingresourceswhichunderpinsalloftheanalysissetoutin this SEA.
xix

TANA RIVER DELTA STRATEGIC ENVIRONMENT ASSESSMENT 2014
Chapter 1 Context and Role of SEAThis chapter outlines the LUP/SEA processes, described in the SEA Scoping Report. It sets the context for readers whohavenopriorknowledgeoftheprocessorpurposeoftheTanaDeltaSEA.
Chapter 2 Situation AnalysisAsummaryofthekeyissuesandinformationprovidedintheSEABaselineReport.
Chapter 3 National and Regional Development Scenarios Thischapterdealswith ‘macro-level’ issuesaffectingtheentireTanaRiverBasinandNorthEastKenya. NationalScenario1paintsapictureofwhatthegrowthanddevelopmentforecastsfortheTanaRiverBasin(andotherregionalgeographicandadministrativeareas)arelikelytomeanforthelowerTanaRiverandtheTanaDeltain2030.NationalScenario2considerspossiblechangesbetween2030and2050.The key components that are assessed are:1.Population2. Livelihoods3. Social Welfare4.EconomicActivity5. Water (demand, supply and balance)6. Biodiversity
Chapters4-8TheExistingSituationandScenariosfortheTanaDeltaChapter4 AssessmentoftheExistingSituationChapter 5 Assessment of Scenario AChapter 6 Assessment of Scenario BChapter 7 Assessment of Scenario CChapter8 Summaryoffindingsontheexistingsituationandthreescenarios
Chapter 9 Conclusions and RecommendationsThis chapter sets out guidelines and recommendations to assist decision-makers in constructing, adopting andimplementingthefinalLandUsePlan(LUP).
Annexes The report contains a number of technical annexes
OUTLINE
xx

TANA RIVER DELTA STRATEGIC ENVIRONMENT ASSESSMENT 201420

TANA RIVER DELTA STRATEGIC ENVIRONMENT ASSESSMENT 2014 21
PART ONETHE BASELINE

TANA RIVER DELTA STRATEGIC ENVIRONMENT ASSESSMENT 20141
CHAPTER1 Context and Role of SEA
1.1 BackgroundTheTanaRiverDeltaliesattheendofKenya’slongestand largest river and covers an area of over 100,000 hectares (or 225,000 ha, including the adjacent terraces). ItisoneofthemostdistinctivepartsofKenya.TheTanaDeltaliesonKenya’sNorthcoastandhas,formorethana century, been isolated from the rest of the country by poor roads and its own forests, swamps andmarshes.During the rainy seasons the core areas of the delta are largely impenetrable, exceptbyboat and canoe,whenflooding turns most of the delta into a vast lake andwetland. Thesephysicalcharacteristicscreateanareaof international importanceforplants,birds,andotherwildlife.
Atthesametimetheareasupportsanumberofethniccommunitieswhoseway of life is completely adaptedtothisspecialenvironmentwithalternatingfloodsanddroughts.Onegroup,thePokomo,arefarmerswhohavecultivatedthebanksoftheRiverTanaforoveracentury.Another group, the Orma, and Wardei, are pastoralists whoused tomigratewith theirherdsof cattle, sheep,goats and camels but have adopted permanent settlements intheTanaDeltaoverthe lastsixtyyears.Athirdgroup,theLuoandLuhya,wereattractedtotheDelta in order to continue their traditionalway of lifebased on freshwater fishing. The Mijikenda/Giriamaand other tribes are more recent migrants, who havetravelled from other parts of Kenya in search of vacant landonwhichtofarmandrearlivestock.
Since the colonial era the Delta has been considered, erroneously, as a largely undeveloped area suitable for agricultural development using water from the RiverTana.However,allofthehistoricschemesforlargescaleirrigationhavebeencostly failures,becausetheyweredesignedwithoutproperunderstandingofthehydrologyandwith little or no regard for the needs of existingcommunities.Poormanagementhasalsocontributedtothe collapse of most of these projects. Within the last decadeanewthreattotheDeltahasemergedthroughwidespreadinternationalinterestinexploitingthearea’sresources for biofuels and food export schemes.
Rising population within the delta and increasingcompetitionfor its limitedresourcesofwaterandlandhave all led to increased tensions between differentgroups,whichhavehistoricallyspilledoverintoviolence,often coinciding with periods of political activismassociated with national elections. The most recentclashes in 2012 -2013 resulted in the massacre of more than180men,womenandchildren.
It is against this background that the Government of KenyainconjunctionwithNatureKenya,Africa’soldestconservationsociety,decidedtoadoptanewapproachto planning and resource management by preparing a Land Use Plan (LUP) guided by Strategic Environmental Assessment (SEA).
1.2 Conduct of the LUP and SEASince November 2011, the Government, through the Ministryof Lands, hasbeen formulating the LandUsePlan (LUP) for Tana River Delta to guide the decision making process on the future development of the Delta.Followingdevolutionofmanyplanningfunctionsto the new County governments inMarch 2013, thisresponsibilityhasbeensharedwiththeTanaRiverandLamu County Governments.The LUP will significantly influence the way land isallocated to various users and interest groups by providing a framework for decision-making at bothnational leveland inthedevolvedcountygovernment.Given the implications of the LUP on the sustainabledevelopmentoftheDelta,itwasconsideredimportantto subject it to a Strategic Environment Assessment (SEA) process.
1.3 Role of the SEATheSEAseeks to strengthen the integrationof socio-economic and ecological aspects in the LUP by:• Describing the external and in-situ factors
influencinglanduseintheTanaRiverDelta;• Ensuring integration of stakeholders’ socio-
economicandenvironmentalperspectives intotheproposedLUP;
• Establishing the implications of the proposed LUPon Tana River Delta sustainable management and development;
• Identifying and mapping out specific habitats,natural resources or land use zones that should be preserved in perpetuity to ensure the survival of the TanaRiverDeltaecosystem;
• Assessing alternative land use options that caninform the preferred strategy and plan.
Theprocesshasadoptedaconsultativeapproachwithall stakeholders interested in the Delta. It is based on the Organisation for Economic Cooperation andDevelopmentAssistanceCommittee (OECD-DAC)SEAframeworkonwhichKenya’sSEAGuidelinesarelargelybased, and the World Bank approach to InstitutionalSEAinwhichattentionisgiventoinstitutionalstrengthsand weaknesses and the capacity of institutions toimplement decisions.

TANA RIVER DELTA STRATEGIC ENVIRONMENT ASSESSMENT 2014 2
1.4 Policy ContextConcern for environmental planning in Kenya started back in1974with theadoptionofaNationalDevelopmentPlan. In this plan, competition and conflicts betweenlanduseinterestswereobservedtobegrowing,henceaneedforgreaterco-ordinationbetweenvariousagenciesof the government (Government of Kenya, 1974). The subsequent development plan (1979-83) stressed the needsforenvironmentalinputsinthenationalplanningprocesspointingoutthatenvironmentalconsiderationsmust permeate development decisions at every level. Theurgencyofthisconcernwasreflectedinthe1994-96developmentplanwhichcalledforaSessionalpaperon sustainable development to set comprehensive guidelines and strategies for government action. ThisSessionalpaperwashowevernotproduced.ANationalEnvironmentActionPlanwasproducedin1994.
Nonetheless the principles of sustainable development are enshrined in the Constitution of Kenya, 2010.Chapter five Part 1 Section 60(1) of the Constitutionstates that land in Kenya shall be held, used and managed inamanner that isequitable,efficient,productiveandsustainable, and in accordance with the principles oflandpolicywithequitableaccesstoland,securityoflandrights,sustainableandproductivemanagementoflandresources,transparentandcosteffectiveadministrationofland,soundconservationandprotectionofecologicallysensitiveareas,eliminationofgenderdiscrimination inlaw,customsandpracticesrelatedtolandandpropertyinlandandencouragementofcommunitiestosettlelanddisputesthroughrecognisedlocalcommunityinitiativesconsistentwiththeConstitution.
Section 60(2) recognizes the national land policydeveloped by the national government to guide theimplementation of the land holding policies. Section61(1)oftheConstitutionvestsall landinKenyatothepeopleofKenyacollectivelyasanation,ascommunitiesand as individuals and section 61(2) classifies land aspublic,communityorprivate.Section61(1g)recognizesgovernment forests and section 63 (3) says that anyunregistered community land shall be held in trust by county governments on behalf of the communitiesfor which it is held. Section 65(4) empowers theParliamenttoenactrelevantlegislationtofurtherguideland ownership and use in Kenya. The National LandCommission is to manage public land on behalf of the national and county governments and recommendnationallandpolicytothenationalgovernment.
Environment and Natural Resources are provided for in Section69(1)andthestateisexpectedto:• ensure sustainable exploitation, utilisation,
managementandconservationoftheenvironmentand natural resources, and ensure the equitable sharingoftheaccruingbenefits;
• worktoachieveandmaintainatreecoverofatleasttenpercentofthelandareaofKenya;
• protect and enhance intellectual property in, and indigenous knowledge of, biodiversity and thegenetic resources of the communities; encouragepublicparticipationinthemanagement,protectionandconservationoftheenvironment;
• protectgeneticresourcesandbiologicaldiversity;• establish systems of environmental impact
assessment, environmental audit and monitoring of theenvironment;
• eliminateprocessesandactivitiesthatare likelytoendangertheenvironment;and
• utilise the environment and natural resources forthebenefitofthepeopleofKenya.
1.5 SEA Preparation ProcessInitsfirstmeetingon19thJuly2011,usingitsconveningpowertheOfficeofthePrimeMinister(OPM)formedanInter-MinisterialTechnicalCommittee(IMTC)madeupoftwentytworelevantgovernmentministriesandagencies. This was followed by the formation of a core teamcomprising of 11 members from OPM, NEMA, Kenya Wildlife Service (KWS), Kenya Forest Service (KFS), MinistryStateforPlanning,NationalDevelopmentandVision 2030 (MPND & V2030), Ministry of Lands (MOL), Ministry of Agriculture (MOA), Ministry of Water and Irrigation(MOW&I),NatureKenya(NK)andIMARISHANaivasha Board.
From24th–26thJuly2011,thecoreteamofthe IMTCdevelopedastrategicframeworktooverseeplanningfordeltasinKenyastartingwiththeTanaRiverDelta.Theoverall purpose of the strategy is to provide a roadmap andgovernancestructuresthatwouldguidetheKenyanDeltas initiative to undertake General ManagementPlanning that use participatory approaches to identifyactions, define strategies, timelines andmilestones toachievesustainabledevelopmentframeworkforKenya’sdeltas .
1.5.1 Launch of the Tana Delta Planning ProcessIn September 2011, the IMTC convened a high level meeting in Malindi to inform local stakeholders anddiscuss the need for a strategic plan for the Tana River Delta. Sixty five (65) participants took part in themeeting.ThemeetingwashostedbyOPM,whileNEMAand Nature Kenya provided joint Secretariat.
RepresentativesfromkeyKenyangovernmentministriesand agencies attended togetherwith local communityrepresentatives,NGOs,mediaandinternationalexpertsinthefieldsoflanduseanddeltaplanningandSEA.Themeeting includedaworkshopandafieldvisit into theTana River Delta to provide an opportunity to interact and consult with the local people to understand theissuesfirsthand.

TANA RIVER DELTA STRATEGIC ENVIRONMENT ASSESSMENT 20143
The meeting concluded by adopting a CommuniquéwhichconfirmedthelaunchoftheTanaDeltaplanninginitiative.Thisnotedthattheaimoftheinitiativeistoproducealong-termstrategiclanduseplanrepresentinga ‘truly sustainable’ future to the delta, informed byStrategic Environmental Assessment and that the process would take place over the next 18 months, with thesupportofDepartmentforInternationalDevelopment-United Kingdom Aid (DFID-UKAid).
Inafollowupmeetingon27thSeptember2011theIMTCagreed that Ministries of Lands, Planning, Environment andOPMshouldsecondofficerstothesecretariatinordertosupportaninternationalconsultantindevelopingtheSEAandLUPprocessfortheTanaDelta.AnofficerfromtheMinistryof Landswould lead a Landuseplanning(LUP)team,whileonefromMPND&V2030wouldleadtheSEAteam.Thetwoteamswouldcomprisetechnicalofficersworking on theTanaDelta LUP and SEA, andbe advised by an international consultant and theNetherlands Commission for Environmental Assessment
OPM provided office space and furniture for thesecretariat,whileNatureKenyaequippedtheofficewithcomputers,aprinterandotherbasicofficeequipment.The international expert provided technical advice tothe Secretariat. A manual on Tana LUP and SEA wasdeveloped and the terms of reference for the secretariat agreed upon.
During the IMTC site visit in September 2011, the Tana Delta site based PlanningAdvisoryCommittee (TPAC)wasconstituted.TheTPACwasmadeupof21membersof which 19 represent local community interestsincluding pastoralists, fisher folk, farmers, womengroups, development oriented CBOs, conservationgroups, marine fishermen, people with disabilities,among others. Four key government agencies made up the other 4 PAC members and included the District Development Officer, District Livestock Officer,DistrictAgricultureOfficer andDistrict Commissioner.The March 2013 general elections ushered in a newdevolved governance system centered on counties.Consequently the TPAC became greatly expanded (to a membership of 67) to accommodate county government interests. The PAC is convened under the authority of a chair appointed by the County Governments and eachmeetingischairedbyaTPACmemberselectedonrotation.Theroleofthecommitteeistoprovideadviceand feedback on the content of the LUP and SEA based on papers to be presented to it. In this respect, the TPAC mirrorstheworkoftheIMTCatnationallevelwithintheDelta.
1.5.2 Stakeholder consultationsAt the launch of the Tana Delta planning process in September2011,theIMTCheldlauncheventmeetingsat District level (Gamba Guest House) and local launch events at Moa, Dide Waride and Tarasaa. From 1st-3rdFebruary 2012, the IMTC launched the LUP for Tana Delta at divisional level (Kipini, Garsen and Tarasaa)followedbyvillagelevelmeetingsatGatundu,MoaandOzi.InMarch–June2012NatureKenyastaffinTanaDeltaandDistrictLivestockProductionOfficer,District Agricultural Officer and District DevelopmentOfficerconductedmeetingsinallthe106villagesintheDelta to facilitate community members to provide input viaaquestionnairethatwasdevelopedandreviewedbythe LUP and SEA teams. The outcomes of village land use planningmeetings included development of initialVillageLUPmaps,whichfed intotheLUPprocessandwillfurtherinformitsimplementation.
InMarch2012, theSEAworkinggroupheldmeetingsin Kipini, Danisa, Kibusu, Moa, Dide Waride to collect data on issues affecting the communities in TanaDelta for planning purposes. The SEA secretariat held discussionswiththecountycouncilsofTanaRiverandLamu, both recognized as important players in the Tana Delta. This helped clarify the purpose of the entireprocess and defuse any suspicion. The Water Resources ManagementAuthority,TanacatchmentRegionalOffice,wasalsovisitedandimportantinformationobtainedthatinformedtheSEA. IthoweveremergedthattheWaterResourceUsersAssociations (WRUAs)were yet to beestablishedinthelowerdelta.
1.5.3 Independent ReviewIn November 2011, NEMA requested the Netherlands Commission for Environmental Assessment to advise on the Strategic Environmental Assessment of the Land Use Plan, for the Tana Delta in Kenya. The Commission andNEMAagreedtoapplyatwo-stepapproach:firstlythe Commissionwould advise before the start of theLUP/SEA on the overall process and approach of the LUP/SEA. Secondly, the Commission would provideadviceon(i)theprocess,moredetailedbaseduponfieldobservationsanddiscussionswithmembersoftheLUPand SEA team and (ii) on the contents of the SEA and the Land use plan. Copies of theCommission’s commentswere made available through the Deltas Secretariatand published on the Commission’swebsite. On bothoccasions advice received guided the focus and SEA/LUP process on methodology and on the need to centre theLUPonwateravailability inthecatchment.NatureKenya, the international consultant and the DeltasSecretariatrespondedtotheCommission’sadvice.TheCommission has also agreed to review the draft finalLUPandSEAoncompletionofthesetwodocuments.

TANA RIVER DELTA STRATEGIC ENVIRONMENT ASSESSMENT 2014 4
CHAPTER2 Situation Analysis
IntroductionAs a precursor to the drafting of the Tana River Delta SEA, a SEA baseline report was drafted analysing conditions in the river’s catchment in the base year, taken to be 2010. Similarly a LUP baseline report was drafted analysing conditions within the Tana Delta in the base year. This chapter describes baseline conditions and provides a summary of salient facts drawn from the SEA and LUP Baseline reports. It also draws on information collected for the development of scenarios and the accompanying analysis, which is published in the Tana Delta Land Use Plan. The full baseline reports should be consulted for a detailed account of existing conditions in the River Tana Catchment and the Plan Area (the latter comprising the Tana River Delta and the buffer zone).
This Chapter is in five parts. The first (this section) introduces the River Tana Basin Catchment and Tana River Delta. The second and third introduce the key socio-economic and environmental concerns respectively. Part four covers issues relating to biodiversity and the final section summarises the key current issues for the basin and delta, which will be considered further in this SEA.
PART ONE: DESCRIPTION OF THE TANA RIVER BASIN2.1 Geography of the Tana River BasinThe RiverTana catchment fallswithin latitudes 0o 30’North and 2o 30’Southandlongitudes37o00’Eastand41o00’East.Ithasanareaof126,000km2 (equivalent to 21.7%of the land area inKenya) and a populationof over 7 million people (Water Resources Management Authority, 2009).
River Tana provides the main drainage system in the catchment. The mean annual discharge of River Tana is 4,000 million m3. The sources of River Tana are in the highlands of the Aberdares and Mount Kenya (3000 mabovesealevel),andtheriverflowsforabout1000kilometers to its mouth at Kipini into the Indian Ocean.
The catchment comprises of the upper, middle and lowercatchmentareas.Theuppercatchmentcoversanarea of 15,000 km2andextendstoKamburudam,whichstands at around 1,000 m asl. About 70% of Kenya’shydropower is produced in the upper catchment. Themiddle catchment covers an area of 15,700 km2 lying withinaltitudesof1,000and200masl,whiletheareabelow200maslcoveringanareaof95,300km2 makes upthelowercatchment(WaterResourcesManagementAuthority, 2009).
Oncetheriverdescendsbelow200masl, itmeandersthroughafloodplainabout5kminwidthand300kminlength before entering the Tana River Delta at Garsen (Hamerlynck et al, 2010) and ultimately dischargingits silt-rich, muddy waters into the Indian Ocean atUngwana(formerlyFormosa)Bay.TheTanaRiverDeltais located in both Tana River and Lamu Counties and
its floodplain covers an area of over 100km2 (Water Resources Management Authority, 2009). It is situated about 250 km northeast of Mombasa and about 600km southeast of Nairobi. For planning purposes, the core area of the Delta is extended to include the raised terracesontheDelta’seasternandwesternflanksandextends to 2,250km2 in total. In addition, for planningpurposes a buffer zone20 kmwide has been definedaround the delta and this adds a further 4,000 km2 to the area covered by the Tana Delta Land Use Plan (LUP).
2.2.1 ClimateThe climate of the Tana River Basin is governed by seasonal movements of the inter-tropical convergence zone (ITCZ) creating the Southeast and Northeastmonsoonwinds,whichareresponsiblefortheseasonaldistribution of rainfall. Climatic conditions for thecatchment range from humid in the highlands to very
Figure 2.1 River Tana Catchment
Source: Water Resources Management Authority, 2008

TANA RIVER DELTA STRATEGIC ENVIRONMENT ASSESSMENT 20145
arid in the lowlands. Similarly, temperaturesvary from100C to 300C. Mean annual rainfall ranges from 2,400 mm – 200 mm. Rainfall is bimodal. More rain fallsduringthelongrainsseasonofMarch–May,andlesseramounts in the short rains season of October-December (Government of Kenya, 2008).
TheTanaDelta is characterized by low and unreliablerainfall. It receives low and erratic bimodal rainfallthat ishighlyvariable inboth spaceandtime. Inmostcases, rain falls as short high intensity storms that produce considerable runoff and soil erosion.Averagerainfall figures are deceptive in these circumstancesbecause there tends to be a fewyears of rainfallwellabove average whilst the probability of occurrence islow.Mean annual rainfall ranges between 300 – 900mm per annum. The average temperature is 300C and average humidity is 85%. The slightly higher levels of rainfall along the coast support crop production andmangrove forest.Howeverdue to its lowaltitude, thesouth-eastern part of the delta is susceptible to saltyseawaterintrusion,whichaffectsagriculturalactivities(Government of Kenya, 2008).
2.2.2 Land CoverLandcover in theTanacatchment reflects theclimaticrange and varies from alpine type at the top of Mt. Kenya through moorlands, tropical forests, savannah grassland in the middle region to semi-arid lands and coastal mangrove forest. The basin has over 80% of its landunderAridandSemi-AridLandconditions.
Agriculturalproductioninthebasinisvaried,accordingto the agricultural potential. In the high potentialareas, coffee, tea, pyrethrum,wheat and barley; dairy,sheepandpoultryarethemainactivities(JaetzoldandSchimidt, 1983). The medium potential areas supportmaize, sunflower and beans as the major crops withsomepoultry,sheepanddairy;whileinthelowpotentialzones,millet,cotton,tobaccoandsorghumarethemaincrops,togetherwithcattle,goatsandsheep.
The irrigation potential in the catchment is estimatedat 132,000 hectares (1320 km2) with the presentdevelopedandplanned irrigationschemescoveringanarea of 54,676 hectares comprising 30,148 hectares under private schemes and 24,528 hectares managed by various government organizations (Government ofKenya,2008).Differenttypesofirrigationschemesarefoundwithin thecatchmentnamely: small-scalegroupbased schemes (involving horticulture, floricultureand subsistence crops), individual holder schemes (for nurseries of high cost crops such as macadamia and ornamental crops) and public irrigation schemes(managed by government agencies). (Government of Kenya, 2008).
Thecatchmentplaysan important role in thenationaleconomy through provision of electricity. There are many hydro-generation plants constructed on River Tana,withthemainpowerplantslocatedintheSevenForkswithinthemiddlecatchment.Theseaccountfornearly70%ofelectricity in thenationalgrid.Thereareplanstoconstructanother5billioncubicmetremultipurposedamatHighGrandFallstoincreasehydropowercapacity,providewaterforirrigation,domesticuseandsupplytheupcoming Lamu Port.
PART TWO: SOCIO-ECONOMIC CONDITIONS AND LAND USE2.2 Socio-economic Conditions
2.2.1 Population and CommunitiesRiverTanacatchmenthasapopulationofover7millionpeople (Water Resources Management Authority, 2009). ThepopulationoftheDeltaisestimatedtobe102,000(Odhengoetal,2014b).Accordingtothe2009nationalcensus theTanaDeltapopulation isdistributedacross12,457 households giving an average household size of about8persons,with65,000peoplelivingonthedrierterraceareas,35,000peoplelivinginthefloodplainandfewerthan2000peoplelivingonthecoast(Governmentof Kenya, 2010).
Although the SEA concentrates its attention onconditionsintheDelta,itisimportanttonotethattherearemorepeoplelivinginthesectionofthenarrowfloodplain of theTanaRiver lying between theHighGrandFallsDamandtheTanaRiverPrimateNationalReserve.MuchofthislandisveryfertileandreferencetoGoogleEarthmappingshowsthattherearenumerousvillageswithfruitorchardsandareasofcultivationwhichhavereceivedverylittleattentioninanysocio-economicandanalysis of the Tana River Basin.
The Tana River Delta is inhabited by three major communities–Pokomo(44%),Orma(44%)andWardei(8%). Other ethnic groups (including Bajuni, Luo, Luhya, Wataa/Sanye, Boni, Malakote and Munyoyaya and more recently Giriama and Somali) account for the remaining 4%.ThePokomopeoplearesubsistencefarmerswhiletheOrmaandWardeipeoplearepastoralistswhohaveused the Delta for centuries (Government of Kenya, 2010).
2.2.2 SettlementsThe main urban areas in the Plan Area are Garsen, Tarasaa, Witu and Kipini. Nearly 93 % of the people live inruralareasinmorethan100villagesandpracticecropfarming,livestockkeepingandfishing–seeFigure2.2.The settlement patterns have largely been influenced

TANA RIVER DELTA STRATEGIC ENVIRONMENT ASSESSMENT 2014 6
Figure 2.2 Settlement Patterns in the Tana River Delta showing location of villages
Figure 2.3 Settlement patterns in the Tana River Delta by livelihood source
Source: Tana Delta Land Use Plan, 2014Source: Tana Delta Land Use Plan, 2014Villages are mostly located along the main river channel
by River Tana and the socio-cultural practices of thecommunities. Most farming and fishing communitiesreside along RiverTana and thewetlands. Pastoralistsaremainlyfoundinthehinterlandinareaswithwateringpointsandpasture.Inaddition,pastoralistsmigratefromthe Garissa and other northern counties to the TanaRiver Delta during the dry season and return during the rainy season.
The majority of houses in the planning area are temporarystructuresandlessthan1%oftheresidentialhouses are semi-permanent or permanent (Government ofKenya,2010).Pastoralistcommunitiestendtoliveintemporary houses, agriculturalists in semi-permanent or permanenthouses.Therapidgrowthinpopulationandtendencyforpastoraliststogiveuptheirmigratorywayof life inthefaceof increasingcompetitionforgrazinghavecontributed to the formationofmorepermanentand dense settlements. There is encroachment anddegradation of wetlands and other protected areas.There isa realandpotential threat tobiodiversityandalsowidespreadcharcoalburningfordomesticuseandincome.
ThenatureofsettlementsintheDeltahasalsobeenahindrance to the provision of infrastructure - see Figures 2.2 and 2.3. Though clustered, the settlements arelocated in remote areas and are only concentrated along theriverandurbancentres.Atthesametime,pastoralistcommunitiesusuallymovewiththeirlivestockinsearchofpastureandwater.Ithasthereforenotbeenfeasibletorolloutinfrastructureasitwillnotbefullyutilized.
2.2.3 Land TenureThere are three categories of land ownership in theDelta: private, communal and public. Privately held land includes the six community ranches (which inpracticehavesquatterslivingontheminsomeareas).Inrecentyears, there have been proposals for large scale private landallocation in theheartofTanaDelta involvingsixmajor investors (Nunow, 2011). The public land inthe Delta includes Gazetted forests, the beach frontandmarinewaters.The rest of the land is held undercommunalownershipwithrecognitionofindividualtitleto cultivated land. The communal ownership systemdoes not encourage local and external investment. But itprotectstraditionalownership,maintainscommunity

TANA RIVER DELTA STRATEGIC ENVIRONMENT ASSESSMENT 20147
cohesion,allowsspaceforthenaturalenvironmentandshould be respected.
ThelandquestionintheDeltaremainsachallenge.Themajorityof local communitieshaveno landownershipdocuments.Largetractsoflandareownedbyrelativelyfewindividualswhilethemajorityoccupylandwhichtheyclaim is ancestral although it remains un-adjudicated. Due to the tenure insecurity, squatters rarely practicefarming and have resorted to charcoal burning as a means of earning their livelihood. This has resulted in amassive reduction invegetative cover due to fellingof trees. There is also a need to review land leasesgranted to large investors, including foreign companies, inordertosecuretenureforthelocalcommunitiesandresettlementofthesquatters.
The community survey carried out as part of the LUP/SEA process revealed that the following are seen asmajor concerns raised by over half the villages:• Lack of title deeds and confusion over ownership
and rights to theuseof landandwater (raisedbyover half of villages)
• Land-grabbing by both private developers and the public sector and the tendency for major development to occur without adequate consultation and withdisregardfortheownershipandaccessrightsofthecommunities.
2.3 Land Use in the Tana DeltaFigure4preparedaspartoftheLUP/SEAprocessshows“land use classes”.
Figure 2.4 Land Use Classes in the Tana Delta Planning Area
Source: Tana Delta Land Use Plan, 2014

TANA RIVER DELTA STRATEGIC ENVIRONMENT ASSESSMENT 2014 8
Land Use Classes Area Km2 Percentage
Forest 271 12.0
Riverine Forest 323 14.4
Thicket and scrub 400 17.8
Mangrove 84 3.7
Water Areas 18 0.8
Salt ponds 5 0.2
Dunes 103 4.6
Dryland farming 370 16.4
Commercial farming 31 1.4
Urban Areas 14 0.6
Floodplain grassland 508 22.6
Wetland farming 123 5.5
Total 2,250 100
Table 2.1 Areas Occupied by Various Land Use Classes in the Tana Delta Planning Area
Table 2.2 Number of Animals per Household (2010)
Source: Tana Delta Land Use Plan, 2014
Source: Tana Delta Land Use Plan, 2014
2.3.1 LivestockLivestock rearing and management occurs throughout thePlanareawithcattle,goats,sheepandasmallnumberof camels being grazed in open grassland, scrub, thicket andforestmarginsandonagricultural landaftercropshave been harvested. There are no accurate statisticsfor the numbers of animals kept by each household - estimatesareshowninTable2.2.
It is not possible to determine the absolute number of cattleintheDelta,asthisvariesseasonallyandwiththeinwardandoutwardmigrationofherds,butanalysisfortheLUP/SEAindicatesthatinthewetseasontherearearound 220,000 head rising to around 735,000 in the dry season.
Cattle, other livestock and wild herbivores graze allaccessibleareasoftheDeltaandthebufferzone.Theonlyareasthatreceivelittleornograzingincludedenseforest,permanentlyfloodedswamps,mangroveforestsandotherimpenetrablehabitat,amountingtobetween5-10%oftheDelta.Farmingareasreceiveverylowlevelsof grazing unless crops are invaded during droughts or farmers allow grazing to introduce manure to fallowareas. Thicket and scrub are invariably heavily grazed, especiallyinthedryseasonbuttheslowgrowthratesofshrubsandgrasses,duetodryandinfertilesoilsmeansthatthenutritionratesarelow.
The principal grazing areas are found on the wetgrasslandwithinthefloodplains,amountingtobetween70,000 and 100,000 hectares (depending on rainfall variationandtheextentoffloodingfromyeartoyear).
InthedryseasonthelevelofcattlegrazingintheDeltais exceeding the carrying capacity of the environment leading to both environmental damage and conflicts.ThePlanwill need topropose strategies for achievingsustainable levels of grazing. 2.3.2 FarmingFarming practice includes permanent cultivated andfruit growing areas around settlements, small irrigatedareas,temporaryslashandburnforrain-fedcultivation,and areas of flood recession4 farming where land isplantedafter thefloodwatershave receded. Theareacurrently farmed (wet and dry farming) or coveredby thicket and scrub and equivalent to rangeland is estimatedfrommappingsourcestobe89,300hectareswhich represents 39.7% of the total. (In theory partsof thefloodplaingrasslandcouldalsobeconverted totemporaryfarmland,whichwouldraisethepercentageabove 40%). Analysis for the LUP/SEA suggests that the averagedistributionperhouseholdofcultivatedlandis0.6 hectares (1.5 acres).
The population in theTanaDelta is not self-sufficientin food. For much of the year, food relief is provided undertheGovernment’sProtractedReliefandRecoveryOperations/FoodforAssetsprogramme,andespeciallyduring the drought spells it is a common phenomenon.
Animal No. Recorded
Animal/Household
Cattle 211,858 21.3
Sheep 131,154 13.2
Goats 118,676 11.9
Camels 360 0.036
4Flood recession agriculture uses the residual moisture of seasonally flooded lands when the floods recede.

TANA RIVER DELTA STRATEGIC ENVIRONMENT ASSESSMENT 20149
High poverty rates and climate change have been perceived as the underlying causes of food insecurity. The LUPwillneedtoplayakeyroleinensuringfoodsecurityby proposing strategies on sustainable agriculture and diversificationoflivelihoods.
Twoirrigationschemesareoperationalwithinthedelta,namelyTARDA’sintegratedriceproject(200acres/81ha)andtheHewaniandWemasettlementminorirrigationschemes (135 acres/55ha). The TARDA rice project has a chequered history and although production levelsand yields have improved in recent years, the project has suffered in the past from repeated damage anderosionfromflooding,poormanagement,inappropriateapplicationofinputsandpoorlymaintainedmachinery.
Ahighlevelofagriculturalexpansionandintensificationis proposed in the Delta with projects including theMumias Sugar’s Tana Integrated Sugar Project, MatInternational’s irrigation project and TARDA’s ongoingrevival of Tana Delta Irrigation Project (TDIP). This islikely to exert pressure on the land and resources in the Delta due to vegetation clearance, pollution andincrease inwater demand.Theprojectswill also exertpressureonexistinginfrastructure.Thepressuresontheenvironmentwillultimatelyleadtoecosystemdisruptionsandlossofbiodiversity.Inaddition,thetappingofwaterfrom the river for irrigationwillworsen the lowwaterdischarge from the river. A comprehensive strategy that rationalizesnaturalresourcesmanagementshouldbeputplaceintheimplementationoftheagriculturalextensionprojects to avert the likely outcome of environmental degradationandbiodiversityloss.
2.3.3 FishingFishing is an important source of food and protein for manyfamiliesintheDelta.Bajunifishermenfishmainlyincoastalwaters,andtheLuocommunityarethemostactive fisherfolk inside the Delta. The Pokomo alsopracticefishingintheinlandwatersofthedeltabutnotas intensively as the Luo. Fishing takes place in the main river and subsidiary channels and open water bodiesincluding ox-bow lakes (former rivermeanders cut offfromthemainchannel).Inaddition,aquacultureisbeingintroducedinvolvingrearingoffishinbothnaturalandartificiallyconstructedponds. In2007thetotalweightoffishcaughtwas613,003kg(DistrictFisheriesoffice,Tana Delta 2007).
Goodqualitywaterisessentialtomaintainhealthyfishpopulationsintheriverchannelsandox-boxlakeswithintheDelta.Unfortunately, conditionshavedeterioratedoverthelastfourdecadeswiththebuildingofdamsinthe upper catchment of River Tana. In particular, thereductioninseasonalfloodinghasseverelyaffectedfishbreedingsincefishspawninshallowwaters.
Marine fisheries are largely unaffected by inland riverwaterqualityalthoughthedecrease insiltandorganicsediment load may have localised impacts. Changes to inshore hydrology may also affect marine species likeshrimpwhich breed and feed inmangrove swamps intheir juvenile stages.
2.3.4 BeekeepingMuch of the current beekeeping occurs around the riverine area where nectar is more abundant. Thenumber of hives fluctuates from year to year. It isgenerally believed that the Delta has the potential toaccommodate more hives as there is an abundance of suitablefloweringspecies,ensuringcontinuity infloralresourcesforthebeesthroughouttheyear. Predationby honey badgers (ratels) is a constraint.
2.3.5 Natural Resources ProductionThe land use zones from which most raw materialsare harvested are forests, riverine forests, floodplaingrassland and mangroves (extending to 1186 km2), althoughthicketandscrubalsocontributessignificantlytocharcoalandfuelwoodproductionandthisisalreadyputtingpressureontheenvironment.
2.3.6 TourismTheDeltasheltersawidediversityofwildlife,fromraremonkeysintheTanaRiverPrimateNationalReserveandvastflocksofwaterbirdsinthefloodedgrasslandtothehundreds of hippos and crocodiles in the River Tana and avarietyofsavannahwildlifeinranchessuchasNairobiRanch(theprivately-ownedKipiniConservancy).Thesecould become major tourist attractions, as could the76kmofcoastline–pristinewhitebeaches.Tourism isunderperforming (as at 2013-2014), despite its huge potential,largelybecauseofrecentconflictintheregion.There are currently three established hotels and camps within the Tana Delta with a combined bed space ofunder 100, and a number of houses providing rooms for local travellers.
2.3.7 Industry and MiningIndustrialactivitiesareminimalintheDeltaatthepresenttime.ThemainricemillhasrecentlybeenrehabilitatedandismanagedbyTARDAbutisonlyoperatingatabout30%itscapacityduetolowriceproduction.Factoriestoprocess mangoes into juice have been promised several times but never delivered. Mining activities are alsoveryminimal.There is harvestingof sand and sea saltespecially in the southern part of the Delta. There have been proposals for titanium prospecting in the Delta,and recently an oil company carried out a seismic survey for oil and gas.

TANA RIVER DELTA STRATEGIC ENVIRONMENT ASSESSMENT 2014 10
2.4 Economic Base, Jobs, and Livelihoods in the DeltaThe major economic activities in the Tana Delta arebasedon livestockkeepingandfarming,with livestockkeeping contributing about 70% of the incomes ofthehouseholds in theDelta.Theworkforce is52,000.EstimatesofthecurrentnumberofjobsandvaluefromthecurrentlivelihoodactivitiesproducedforthisLUP/SEA are summarised in Table 2.3.
According to a study conducted by Nature Kenya, potentialincomegeneratingactivitiescouldbeextendedto include ecotourism, beekeeping, and tree planting.Household income could also be enhanced through valueadditiontotheexistingproductsofmangoes,rice,andfishing(NatureKenya,2012).
Economic activity No of jobs (FTE) or livelihoods
Value (annual income)
Livestock Open Grazing 5.73 billion Ksh
(Ksh @ 12,000/head) Ranches 5.7 million Ksh Farming 12,409 62 million Ksh Fishing 450-‐700 53.14 million Ksh Beekeeping 29-‐29 million Ksh Natural products 10,000-‐12,000 333-‐416 million Ksh Harvested NTFP 80 million Ksh Materials for construction and repair of houses
100 million Ksh
Charcoal and firewood
153-‐236 million Ksh
Trade commerce and financial services
3,488 74-‐114 million Ksh
Tourism 28,000 USD Industry and mining
50
Table 2.2 Economic Activity in the Delta (2010)
Source: Tana Delta Land Use Plan, 2014
Poverty levels in the Delta are extremely high. About 95% ofthepopulationintheDeltadependsonsubsistencefarming, livestock and use of natural resources for survival,whichisputtingpressureontheenvironment.For example, charcoal burning in forests and logging in themangrove forests forhardwoodhas threatened towipe out the indigenous forests and destroy habitatsandbiodiversity.Thehumanactivities in thewetlandshave also threatened fragile ecosystems in the Delta. Tocounter theeffectsofpovertyon theenvironment,theTanaDeltalanduseplanwillproposestrategiesthat
willallowfordiversificationof livelihoodstoavoid thedependence on rain fed agriculture and pastoralism as theonlysourcesoflivelihoodforthecommunitiesintheDelta.More information about the economic value ofdifferentactivitiesisgivenbelow.
2.4.1 LivestockCattle sales: depending on approaches used, estimatesfor trading output vary from Ksh 228 million to Ksh 1.26 billion. The larger figure may indicate internal tradingwithintheDeltadesignedtoincreasethesizeofherds,and increase ownership even amongst the pooresthouseholds,whilethelowerrepresentstheoff-salesforexportinganimalstooutsidemarkets.
Milk production: sales of milk from 9927 households amounttoaround27,795litresadaywithavalueofKsh834,000 at a farm gate price of 30Ksh per litre.
Sheep and goats: These animals play a vital role in food supply to households in the Delta and surrounding rangelands because they can tolerate drier conditionsthancattleandsurviveonlessproductivevegetation.In2006,atotalof4670sheepand5377goatsweresoldfromGarsenDivision, representingavalueofKsh20-30million.Thisfiguregrosslyundervalues thenumberofsheepandgoatsbarteredwithinthecommunitiesonadaytodaybasiswithoutinvolvingtradersandformalmarkets.
2.4.2 FarmingSubsistencefarmingisgearedentirelytowardsprovidingfood for the households involved, although small amounts of produce are traded or bartered for other provisions within each settlement. The ManagementPlanforArabuko-SokokeForestinKilifiCountyquotedfarmers’ earnings as KSh 10,007 per hectare for cropproductionin2001.Takingtheaverageof1.5acresperhousehold for 9927 households (equalling 14,890 acres /6204 Ha) in the Tana Delta gives an a gross income, at 2001 prices, of KSh 62 million.
2.4.3 FishingBasedontheannualcatchesinrecentyearsitisestimatedthatbetween250-500individualsfishoninlandwatersandcloseto200fishersengage inseafishingclosetoshore.Theoverallvalueoffishlandedin2007wasKSh53.14 million.
2.4.4 Natural Resources ProductionIt is estimated that around 4,700-5,000 full timeequivalent (FTE) jobs are created in harvesting edibleproducts, craft materials and other natural resources.A further540-725 fulltime jobsarecreatedbyhousebuildingandrepair,togetherwith5,000jobsincharcoalmanufactureandfuelwoodcollection.Thetotalnumber

TANA RIVER DELTA STRATEGIC ENVIRONMENT ASSESSMENT 201411
of livelihoods supported by natural resources is therefore estimatedtobeintheregionof10,000-12,000.
2.4.5 Trade, Commerce and Financial Services Trading activities in the Plan area are fairly low sinceaccesstocreditislimited.ThemaincommercialactivitiesareconcentratedinGarsenwithlowerorderservicesinother centres such as Kipini, Ngao and Tarasaa. Formal commercialactivitiesinthePlanareamainlyconsistofsmallscalewholesaleandretailshops.ThesearemainlyconcentratedinGarsentown–themainurbancentre.InformationfromtheDistrictDevelopmentPlan,2008-2012,indicatesthattherewerearound489businessesin 2008. If it is assumed that each employed an average of three workers this would give around 1500 FTEs.However,tradingisnotrestrictedtoformalbusinessesandbarteringformspartofeveryhousehold’seconomicactivities.Onthebasisthattraderepresentsonetenthof each household’s income this equates to 1988 fulltimejobswithintheplanarea.Thecombinedestimatefor livelihoods based on Trade, Commerce and Financial services is therefore 3488 FTEs. The gross trading level for theDelta, based on 19,885 households,would beKsh74million–Ksh114million.
2.4.6 Industry and MiningWith the exception of salt processing, for which anestimated50FTEsareinvolved,thecontributionofthissector to employment and incomes is minimal but has highpotential.ExplorationhasrecentlycommencedforoilandgaswithintheLamuCountysectionoftheTanaDelta.
2.4.7 Infrastructure and Services2.4.7.1 Transport and CommunicationsInfrastructure in the Tana Delta is poor. The only tarmac road that transects the area is the Malindi-Lamu Road. Theaccessroadstothesettlementareasareverypoorhaving been destroyed by floods. The road from themainroadtoNgaoandTarasaaisanall-weatherroad,asis the road from Witu to Kipini.. The former TARDA rice projectareahadaccessroads,whicharetotallybrokendownandinverypoorcondition.Accesstomostvillagesin the area is through paths and 98% of the community indicated that their villages are only accessible by foot throughout the year. The community survey showedthat only 2.8% of households had electricity. Most households use firewood and charcoal for cookingand paraffin for lighting. Telecommunication is mainlythrough mobile telephones as 66% had mobile phones and3.7%ofthepopulationhasaccesstotelevision(TV).Radioreachisrelativelywelldevelopedwithnearlyhalfofthepopulation(45.2%)owningaradioset.
2.4.7.2 Water, Sanitation and WasteRiverTana is themajor source ofwater.A number ofdams have been constructed by the National WaterCorporation to providewater for the pastoralists, andtwowatersupplies (inGarsenandNgao)aremanagedby CoastWater Services Board.There are 95 shallowwells, 10 boreholes and ten water pans serving thecommunities that liveaway from the river (TanaDeltaDDP, 2009). Due to its proximity to the Indian Ocean, groundwatersourcesinmostpartsoftheformerTanaDelta District are saline. Due to flooding and poorsanitationthewaterqualityiscompromised.Over90%ofthepopulationhasnoaccesstocleananddrinkablewater.Generallysanitationispoorwithmajorityofthepopulationhavingnoaccess tobasic sanitary facilitiessuchaspitlatrines.EvenGarsen,themajortown,hasnoseweragesystem.Solidwastedisposalfacilitiesarepooror non-existent and as a result the majority of residents throwtherubbishoutside.
2.4.7.3 HealthGenerally health service provision is poor due to inadequatehealthfacilities,thepoorroadnetworkanda shortage of staff. The former Tana Delta District isservedbyonesub-districthospitalatNgao,twohealthcentres and ten dispensaries. There are also eight private clinicsscatteredinthedistrict.Thedoctor/patientratiois 1:87,201 against the recommended World Health Organization (WHO) standard of 1:5000 while thenurses/patientratiois1:2,642againsttherecommendedWHO standard of 1:3-1:8. There is therefore need to deploymoremedicalstaffinthearea.Source:TanaDeltaDDP, 2008-2012. Voluntary Counselling and Testing(VCT)andfamilyplanningservicesarealsoofferedinthelocal hospitals and through various NGOs in the area.
2.4.7.4 Education LevelTheeducationlevelsintheformerTanaRiverDistrictareverylow.TheDistricthasoneofthehighestpercentagesofpeoplewhohaveneverattendedschoolintheentirecountry. A large percentage of the population in theformer Tana River District (39.3%) has not attendedschool. The lack of education has negatively affectedaccesstoemploymentopportunitiesleadingtogeneralpoverty in the area.The lack of access to educationalopportunities has affected female members of thepopulation more than males with 44.5% of femaleshaving never attended school compared to 34.1% ofmales (Government of Kenya, 2010).
Anotherstudy(MumiasSugarandTarda,2007)showedthatmajorityof thosewhohaveattendedschoolhaveachievedonlyaprimarylevelofeducation(39.4%)withthose completing secondary and tertiary educationbeing 14.4% and 4.4% respectively. This study alsofoundthateducationalqualificationswerewidelyvaried

TANA RIVER DELTA STRATEGIC ENVIRONMENT ASSESSMENT 2014 12
among the ethnic communities in the delta where21% of the Pokomo, 38% of the Orma, and 85% of the Wardeihadneverattendedschool. It isestimatedthatonly33.7%ofthedistrictpopulationisabletoreadandwrite(GovernmentofKenya,2009).
2.4.7.5 SummaryInfrastructure is key in the development of any area. The planning area is under-developed in terms of infrastructure.Theroadnetworkispooraffectingaccessto many areas in the Delta, especially during the rainy season.Lackoforganizedmarketsandmarketamenitieshavehinderedtrading,adverselyaffectingsectorssuchas agriculture.Basic services suchaswater and sewerreticulation are also lacking in the Delta. Provision ofinfrastructure and service in the delta is therefore a key element the LUP must address.
2.5 Development TrendsThemain activities in theDelta are crop farming andanimal keeping in the form of pastoralism. Howeverpressurehasbeenmountingonthelandduetoinfluxofinvestorsintheareaeyeingopportunitiesforcommercialdevelopment of agriculture, mining and trade.
A number of Vision 2030 flagship projects will havegreat impact on River Tana and Tana Delta including the Lamu Port-South Sudan-Ethiopia Transport (LAPSSET) corridor, Tana Delta Irrigation Project (TDIP) and theHighGrandFallsDam.TheLAPSSETprojectwilldrawwater for domestic and industrial use fromRiverTanawhile theconstructionof theLamuportwill stimulatemajoreconomicdevelopmentopportunitiesandresultinamassiveincreaseinpopulationwhichwillexertfurtherpressureontheresourcesintheDelta.TheconstructionofHighGrandFallsDamupstreamforpowergeneration,irrigation, water supply and flood control will alsogreatly impact on the Delta ecosystems and community livelihoods.
Despite the potentially huge impacts of these largeprojects on the Delta, it is hard to understand the detailsduetothelackofavailabilityofinformation.ItisunderstoodthataSEAoftheHighGrandFallsDamwastobecarriedout,butthestatusofthisprocess(whichshould include disclosure of all relevant informationand public consultation) is unclear. An EIA has beenconducted on the proposals for the first three berthsandassociatedinfrastructureforthenewportofLamu.However, in order to understand the full implicationsof the many different facets of this project and planeffectivelyforitsdevelopment,aformalSEAshouldbeundertaken.
2.6 Governance2.6.1 Administrative StructureUnderthenewcountystructure90%oftheTanaRiverDeltafallswithinTanaRiverCountywhiletheremaining10% is administered by Lamu County. The statisticsrelatingtogovernanceandinfrastructurewerecollectedundertheformerDistrictadministrationsandhavenotyetbeenupdated.However,theypresentaclearpictureofcurrentconditions,whichmaychangeunderthenewadministrations.,
TheformerTanaDeltaDistricthadthreeadministrativedivisions: Garsen, Tarasaa and Kipini. The former District headquarterswereinMinjilafromwherealldevelopmentprojects were coordinated. The District DevelopmentCommittee(DDC),chairedbytheDistrictCommissioner,was the clearing house for all development proposals.The sub DDCs at the divisions coordinated their respective development projects andwere chaired byDistrictOfficers.
TheformerTanaDeltaDistricthad9electoralwardsandoneconstituency–Garsen.TheCountyCouncilofTanaRiver,whichwas also in charge ofTanaDelta district,was the only local authority in the district. Under thedevolved system of governance, the number of electoral wards were reduced to 6, namely Kipini East, KipiniWest, Garsen West, Garsen Central, Garsen South and Garsen North.
Therearethreepolicestations,namelyGamba,GarsenandKipiniPolicestations.Policepostsaresixinnumber,which are Tarasaa, Oda, Idsowe, Hurara, Sailon andMnazini/Kibaoni police posts. The nature of crimes reported in the base line reports ranged from pettycrimes to criminal cases. There had been an increase in thenumberofresourceuseconflicts.
To enhance access to judicial services, a courthouse has beenrenovatedinGarsentownandisoperationalasamagistrate’scourt.ItoperatesinGarsenbutismovedtoKipiniorWituonTuesdaysandWednesdaysweekly,thusthe court is mobile. The High Court is located in Malindi. Therearemanycaseswhichhavenotbeendetermined.There is a proposal to establish a High Court in each Countytoenhanceadministrationofjudicialservicesinthe country.
The chiefs and sub-chiefs ensure law and order ismaintained in their respectiveareas.Theyalso resolvelocal disputeswith the help of local elders. There arepeacecommitteeswhichassistindisputeresolutionandpreachingpeaceamongthevariouscommunitieslivingintheTanaDelta.Thesecommitteescompriseeldersfromeach community and leaders of religious groups. This constitutesthealternativedisputeresolutionsystem.

TANA RIVER DELTA STRATEGIC ENVIRONMENT ASSESSMENT 201413
The new constitutional order creates a countygovernmentofTanaRiver.TheexecutiveauthorityoftheCounty government is vested in the elected Governor and theexecutivecommittee.The legislativeauthorityisvested intheCountyAssembly.All functionsexceptsecurity, education and administration of justice havebeen transferred to County governments. It should be noted that more than half of Tana River County is north oftheDelta,awayfromtheshore.
Managing natural resources in the Tana Delta has been a complexaffairduetomanyfactorsincludingweaklegalandinstitutionalframeworksandmultipleandcompetingpolicies, institutions and legislations. The result is anuncoordinated approach to managing resources in the Delta. This is further marred by the overlapping and conflicting mandates of the various institutions.There are inconsistencies and contradictions betweenvariouslawsandpoliciestouchingonnaturalresourcesmanagement.
2.6.2 Gender IssuesA situational analysis undertaken as part of the SEAScoping study showed that women undertake all themajorhouseholdactivities.Amongthepastoralists,menareinvolvedinherdingwhileamongtheagriculturalists,veryfewmenareinvolvedinactualfarmworkyettheyare the oneswho control family resources.Themajorgender issues in the area include: heavyworkload forwomen;exclusionofwomenfromaccessingeconomicassetsduetotraditionalpractices;exclusionofwomenfrom decision-making roles due to cultural practices;earlymarriagesforthegirl-child;andlowliteracylevelsamongwomenandgirlsduetopreferenceforeducatingmale children. Women are excluded from owningimportant economic assets.
2.6.3 Types and Sources of ConflictsThere are various types and levels of conflicts in theDelta.Theyrangefromfamilyconflicts,human-wildlifeconflicts, community conflicts, conflicts betweencommunitiesandTARDAandalsointer-ethnicconflicts.Atthefamilylevel,themajorconflictisbetweenhusbandand wife. Inter-ethnic conflicts have been reportedbetween the Wardei/Orma pastoralists and Pokomofarmers. TARDA has also been accused of failing to pay casuallabourers.Human-wildlifeconflictswerereportedby majority of respondents (86.7%).
ResourceuseconflictshaveintensifiedintheDeltaasaresult of increased pressure on the natural resources due to rapid population increase, climate change, land useconversions,insecurityoflandtenure,etc.Theconflictsmanifestthemselvesintheformofwildlife–humanandhuman – human conflicts. Human – human conflictshave been associated with competition for pasture,
water and farmland. Such conflicts could bemanagedthroughdesignatinggrazingandfarmingzonesaswellas rationalizing livestock numbers against availablepasture.
TanaDeltaisalsohometoadiversevarietyofwildlife.Increased human encroachment of wildlife habitatsfor settlement, grazing and farming have resulted inwildlife – human conflicts occasionally leading to lossof life, livestock anddestructionof crops.Thewildlifecorridors and dispersal areas have been encroached. The LUPwillproposeastrategytotacklethehuman-wildlifeconflicts,e.g.bymappingthewildlifeconservationareasand controlling movement into the areas.
PART THREE: ENVIRONMENTAL CONDITIONS
2.7 Geology and SoilsTanaRiverDelta fallswithintheCoastalPlains,oneofthe three physiographic zones on the Kenyan coast that rises from sea level to 200 m. The Delta has a coastal strip stretching76kmwhichisprotectedbya50mhighsanddune system. The geomorphology of the Coastal Plain is dominated by a series of raised old sea level terraces. Most of the coastal environment and the modern shore configurationfollowsthe0-5mandthe5-15msealevelterrace complexes (Government of Kenya, 2008).
Soils in theTanaRiverDeltaaregenerallyclassifiedasFluvisolsbeingdivided into twosubgroups:eutric andverticFluvisols(JaetzoldandSchmidt,1983).Thesearegenerallyblackcottonsoilswithclay, loamandalluvialdeposits. They have low or moderate fertility in thehinterlandwherethereisnoinfluenceofflooding.Highfertility soils are found along the natural depressionsandalongthefloodplainsofRiverTana.Theirfertilityisduetotheaccumulationofsiltorclaybroughtaboutbyflooding.
In the meander belt (river levee land) as a result of the oldandnewrivercourses,thesoilsareoftenstratified,comprisingofyellowish–brownsandsandclaydepositsthat are rich in Micas. The textures of topsoil range fromsandtoclaywhilethesub-soilisusuallyfirmclay.The rate of infiltration ofwater into such soils varieswithtexture;beingslowinareaswithclaytopsoil,andfastwheresandformstheupperlayer.Suchsoilshavebeen described for the area between Lango la Simbaand Abarfarda River where the topography is flat togently undulating. Generally the soils in the terracesare excessively drainedwhile those in the flood plainof River Tana are imperfectly drained (Government of Kenya, 2008).

TANA RIVER DELTA STRATEGIC ENVIRONMENT ASSESSMENT 2014 14
2.8 Hydrology of the Tana River Basin2.8.1 Physical CharacteristicsRiver Tana is the longest river in Kenya and it drains the largest catchment in the country, extending to 96,000 km2.(Thegeographicalextentoftheadministrativeareais even larger at 132,000 km2, since it includes areas drained by ephemeral streams discharging direct to the IndianOceanandrepresents23%oftheentirecountry).RiverTanaaccountsfor32%ofthetotalriverrunoffinKenya (Kitheka et al, 2002).
The total catchment area of the Tana River Basin occupies 95,918 km2.Forwaterresourcemanagementpurposes it is divided into 3 sub-catchments:• Upper catchment: upstream of Kamburu, 9,349 km2
• Middle catchment: between Kamburu and KoraRapids, 15,873 km2
• Lower catchment: downstream of Kora Rapids,70,696 km2
ThearealyingtothenortheastoftheTanaDelta,whichdrains directly to the Indian Ocean, accounts for an additional34,000km2 (Kitheka et al, 2002).
The upper catchment includes most of the eastern slopes of the Aberdare/Nyandarua Mountains and the southwest/southernslopesofMountKenya (Maingi&Marsh, 2002). River Tana begins as the Sagana on the south east slope of Mount Kenya. It is joined by many other tributaries before it reaches Masinga Dam, the firstofacascadeofdamsandreservoirsthathasbeenbuilt in the Upper Catchment over the past sixty years (theSevenForksCascade).Rainfallvariesbetween2000mmayearon thehighermountainsdownto300mma year in the middle semi-arid reaches and then rises to 600 mm and above along the coastal belt (Maingi & Marsh, 2002).
The middle catchment of the River Tana system includes the combined catchments of the Gitaru, Kindaruma and KiamberedamsandextendsfrombelowMasingaDamto Kora Rapids. This section receives annual rainfallranging between 600 and 800 mm (Government ofKenya, 2008).
AfterGrandFalls,theTanadescendsgraduallythroughrapids underlain by basement complex of gneiss across the river valley. This basement complex is resistant to
Figure 2.5 The River Tana Catchment
Source: J.K. Maingi & S. E. Marsh, 2002

TANA RIVER DELTA STRATEGIC ENVIRONMENT ASSESSMENT 201415
erosion. Kora Rapids form the last part of these rapids afterwhichtheriverenterstheflatsedimentaryplainsoftheLowercatchment.Therapidslieatanelevationof245m asl (Maingi & Marsh, 2002).
The lower catchment includes the area betweenKorarapids and the Delta up to the sea. In this part of the catchment, there are no perennial tributaries. The Rahole RiverfromRaholeNationalReserveistheonlytributaryenteringtheTanafromtheleftbank.Itscatchmenthaslowannualrainfallrangingfrom200to400mm.Ontherightbankthereareseasonalstreamscalledlagaswhichoriginate fromdry areaswith rainfall of less than 400mm (Government of Kenya, 2008).
The flood plain varies in width from 3 to 8 km andspreadswidely, leading towater loss through seepageandevaporation.Mostflowcontributioninthisstretchcomes from upstream sections of the main river;augmentedintherainyseasonsfromtheotherwisedryriver beds of the lagas (Maingi & Marsh, 2002).
2.8.2 Surface Water2.8.2.1 Annual Run OffRiverTanahasaveryvariablepatternofsurfacerunoff,dictated by seasonal weather conditions but alsoperiodicoscillationsinclimate.Inmostyears,peakflowsoccurduringtwoseasons(betweenAprilandMayandbetweenNovemberandDecember).Theseresult fromthe onset of heavy rainfall in the Upper catchment, although localized rainfall in other parts of the Middle andLowercatchmentscanalsocontributetohighflowsinthelowerreaches.
The upper and middle catchments contribute around 4.47billion cubicmetresofwater ayear.Withover2metres of rainfall in a typical year, the Aberdare highlands andMountKenyamakethelargestcontributiontototalwaterflowsinRiverTana,butthesefiguresaredeceptivebecause there is no accurate information on runoff inthe lower catchment, even though this accounts for73.7% of the surface area of the overall basin. Lack of adequate gauging of River Tana belowGarissa is aserious constraint on proper planning of development in the overall Tana River Basin.
2.8.2.2 Average River DischargeTheamountofwaterthatariverdischargesatanygiventimeismeasured incubicmetrespersecond(m3/sec).In an average year, discharge at Garissa ranges from 1000m3/s in thewet season to as little as 20m3/s inthedryseason,withameanannualrateofdischargeofabout 51m3/s (Government of Kenya, 2008). The mean flowissignificantintermsofcalculatingthetotalamountofwaterthatisavailablethroughouttheyear,especiallyunder drought conditions. Of equal importance in
environmental and social terms are the extreme events offloodsanddroughts.
2.8.2.3 Annual FloodingPeak flows commonly occur in River Tana during thetworainyseasonseachyear.Thesefloodeventsfollowastandard‘hydrograph’inwhichthevolumeofwaterintheTanaincreasesrapidlytoapeakwithinafewdaysofthe onset of heavy rain and then declines gradually over several weeks. Highest flood discharges are recordedintheupperandmiddlecatchmentwiththemaximumdischarge of 3568m3/s being achieved at Garissa WRMA National Station RGS 4G01 on 21st November 1961(Maingi & Marsh, 2002).
Thecross-sectionalareaofanyriverchannelisadaptedtoaccommodatearangeofflowconditionsandfloodingoccurswhenwaterlevelsreachthe‘bank-full’stage.Thephenomenonoffloodingisanentirelynaturaleventandplays a most valuable role in spreading silt, increasing soilfertilityandmaintainingfloodplainecosystems,butitisinvariablytreatedasundesirableandasa‘disaster’where human activity and infrastructure is adverselyaffected.However,mostpeoplewholiveintheRiverTanacatchmentareawareofthebenefitsaswellasthreatsfromfloodingandhavedevelopedwaysofcopingwithroutineflooding.Duetothesteepgradients,largefloodflowsintheupperreachesofRiverTanaaffectrelativelysmallareasofland,butinthemiddlereachesfloodwatercan spread out to inundate much larger areas.
It needs to be stressed that detailed analysis of the hydrology in the LowerTana is severely hampered bylack of adequate gauging and incomplete rainfall and flowrecords.TherivergaugeatGarsenreliesonmanualrecording, and there havebeen longperiodswhennogaugereadingswereavailableduetoflooddamage.
From first principles it might be expected that theintensity andmagnitude of a floodwould continue toincrease downstream from the site of the proposedHighGrandFallsDambuttheavailableflowgaugedataproduces contradictory evidence for the lower TanaBasin.Insteadofincreasinginvolumewiththeexpandingcatchment,thesizeofanygivenflooddischargeattheGarissa Gauging Station appears to drop by around50% by the time it reaches Hola. It has been shownthatfloodsobservedatGarissa take roughly24hourstoreachBura(Hughes,1985)andbythetimethefloodreachesthemanualgaugingstationatGarsenthefloodrecords shownoappreciable rise infloodflowsabove200 m3/sec.
Thecommonlyacceptedexplanationforthisreductionin floodflows is that the lowerTanavalley acts like agiant sponge in absorbing the flood water. This area

TANA RIVER DELTA STRATEGIC ENVIRONMENT ASSESSMENT 2014 16
is naturally semi-arid, so that even in the rainy season significantlylessrainfallsthanintheuppercatchment.Inaddition,themainriverchannelbelowGarissabreaksupintonumeroussmallwatercourseswhichmergeintowetlands, swamps andmarshes and this entire regionsoaks up the excess river flow. At its southern end,aboveGarsen, thedispersedwatersof thefloodplaingather in large lakes and then discharge through braided channelswhichcoalescetore-formthemainriverafewkilometres north of Garsen.
It has also been suggested in the Feasibility Study for High Grand Falls Dam that the upper catchment contributesverylittlefloodflowtotheTanaDeltaandthatflooding in theDelta is causedbydischarge fromthelagasonthewesternbankoftheriverbelowHola.
The issueofwhathappens tofloodwater recordedatGarissabutmissingatGarsenwasidentifiedasasubjectfor study in the SEA, together with another criticalquestionabouttheextenttowhichthebroadfloodplainof the middle and lower Tana acts as a reservoir,attenuating(i.e.absorbing)thepeakflowandconvertingthistoextendedperiodsofhighriverflowwhichisthencapableofsupportingsustainedfloodingof largepartsoftheDeltaforweeksonend.
These issues were investigated and the results werereported to a scientific conference on the Tana Riverheld by NEMA and the University of Nairobi in February 2014 (Nelson and Odeny, 2014).
Theprovisionalfindings fromthis reviewconfirmthat,contrary to the view expressed in the High GrandFalls Dam feasibility study, the flow conditions in theTana Delta do mirror very closely those in the upper catchment,asshowninFigure4,Annex1. Inaddition,inspection of the flood alleviation bridges/culvertsundertheGarsen-WituRoadhasconfirmedthatthesevery large structures (typically 40 metres wide and4-6metreshigh) dopass substantialvolumesoffloodwater–asevidencedbyseriousunderminingofoneofthesestructures.OncethefloodwatersextendbeyondthebanksofRiverTanatheyaredispersedoverawideareawhich is effectively dammedby theGarsen-Wituroad embankment. Enormous volumes can be stored upstream of this barrage and released through the culvertsaswellasthemainriverchannel.ConsequentlyariseofonlyafewcentimetresmayrepresentamajorincreaseinfloodvolumewithoutbeingregisteredonthestaffgaugeatGarsen.
2.8.2.4 Exceptional flood eventsExceptional flooding (and drought) occurs periodically,for reasons that are not fully understood but they are linked to cyclical sunspot activity and the reversal of
oceancurrentsinthePacific,knownastheElNinoandLaNinaeffects (Karanja&Mutua,2000).Thiscycleofevents has a recurrence of roughly 7-10 years. Climate modelling predicts that these changes may become more pronounced in the future, leading to increased rainfall (Nakaegawa,2012).
Floodanddroughtconditionsplayacriticalrole intheeconomy and environment of the Tana River Basin and are a major contributor to social issues including poverty andinsecurity.Thismeansthat,inmanyways,theyareassignificantastheannualmeanfiguresthatareusedtodescribethehydrologicalcharacteristicsoftheBasinanditssub-catchments.Themostrecentfloodsoccurredin 2013 during the long rains season and also in 2006/7. However, the El Nino associated floods of 1997/98remain in the memory of residents of Garissa and beyond, because theywere associatedwith extensivedamage to infrastructure and loss of livelihoods.
2.8.2.5 Dry Weather FlowsThemarkedseasonalpatternsof rainfallareseparatedby periods with little or no rain during which riverflows steadily decline. In particularly dry years theflowatGarissamaydroptoaslittleas20cubicmetresper second (M3/sec).Within thedelta area below thePrimate Reserve, this leads to the drying up of many channels,oxbowlakesandwetlandareas.DroughtsarelessprevalentintheDeltathanflooding,buttheycauseextreme hardship and lead to increased social tension andinsecuritywhenpastoralistscompetewithfarmersforaccesstograzingandwater.
2.8.2.6 Changes in Water Availability and River FlowManyreportsrefertothefactthatwateravailability isdecreasingintheTanaRiverBasin.Thissituationarises,notbecauseof adecline in thequantityofwater, butdue to increasing demand.
Increasing water demand: The primary cause of theincreaseindemandforwaterisgrowingpopulationandrelated livelihood needs.
Waterallocation:TheprincipalusesofwaterintheTanaRiver Basin are for hydro-power generation, irrigationandpublicconsumption.Onlyasmallvolumeofwaterused in power generation is transferred outside thebasin. InadditiontomeetingdemandswithintheTanaRiverBasin,water is transferred toother areas e.g. toThiba.
Dam construction:A series of dams (the Seven Forkscascade) was constructed between the 1960’s and1980’s in order to provide for hydro-electric powergeneration and water storage. The first three dams

TANA RIVER DELTA STRATEGIC ENVIRONMENT ASSESSMENT 201417
(Kindaruma, Kamburu and Gitaru) had small reservoirs andwere built primarily to create the necessary headofwater to generate electricity fromdirect river flow.However, the Masinga Dam, completed in 1981, andtheKiambereDamhadmuchlargerstoragecapacities,enablingthemtoactasregulatingreservoirswhichstorewaterforreleaseinthedryseason.Powergeneratedbythis cascade system accounts for more than 60% of the totalelectricityoutputofKenya.FiveadditionalpotentialdamsiteshavebeenidentifiedintheTanaRiverBasin,including the Grand Falls dam on which constructionworkisimminent.
Impacts of upstream storage: Creation of dams in theupperbasinhashadameasurableimpactondownstreamflows in the lowerRiverTana. Ingeneral, constructionofthetworegulatingreservoirshasaugmentedthedryweather,orminimum,flowwhilereducingpeakfloods.FloodsduringthemonthofMayhaveseenareductionof20%sincethedamswerecompletedandthevariabilityofmonthlydischargesinRiverTanahasbeendrasticallyreduced.Vegetationcharacteristicshavebeenaffectedbyareduction intheaveragedurationoffloodevents(from8.2to5.2days). Inadditionthemeanderingrate(rateofmovementof the river channel due to cuttingof meanders) has fallen since the Masinga Dam wasconstructed (Maingi & Marsh, 2002).
Another significant change brought about by theconstructionoftheSevenForksreservoirshasbeenthereduction insediment load in theLowerTanaRiverbyanestimated56%from12milliontonnesayearto6.8milliontonnesayear.Thisdropislikelytohavesignificantlongtermeffectsonthefertilityofthelowerfloodplainswhichnolongerreceiveanannual‘top-dressing’ofsilt.It is reported that loss of sediment has already caused coastal changes at Kipini and Ungwana Bay througherosion of the beaches (Kitheka et al, 2002).
2.8.3 Ground WaterGroundwater conditionsvarywidely according to thebasicgeologicalcharacteristicsofthebasin.Accordingto the Water Resources Management Authority (2009) the aquifer characteristics of theTana River Basin areclassifiedasfollows:
2.8.3.1 Upper Tana Region‘Intergranular’and‘fracture-type’aquifersinthisregiongenerallyproducegoodqualitywaterwithyieldsvaryingbetween5to>30m3/hr.
2.8.3.2 Middle Tana RegionWithin this semi-arid to arid zone, the aquifers are localized and typically poor. This area extends from Tharaka,Kitui,MwingiandpartsofYattaDistricts.
2.9.3.3 The Lower Tana and Coastal BeltThere isextensivegroundwaterstorage inthisaquifer.Dependingongeologicformations,theseaquifershavethe potential to provide the most strategic groundwaterreserves,whichcanbeaccessedthroughsprings,shallowwellsandboreholes.
2.8.4 Water QualityWater quality of the basin is generally declining, due to pointandnon-pointpollution.Themainpointsourcesofpollution inTana include agro-based industries (coffeeandteafactories); livestockbasedindustries (slaughterhouses,milkplantsandtanneries);andsewerageworksinlargetowns.Themainnon-pointsourcesofpollutioninclude pollutants from land degradation due todeforestationanderosion;encroachmentintowetlandsand riparian lands; and poor agricultural and farmingpractices(Emerton,2003).
Quantification of water quality and the extent ofpollutionfromthesesourcesaredifficulttodetermine.This is because information anddata on the status ofwaterqualityisinsufficient.
2.8.4.1 The Upper TanaThis part of the catchment is characterized by catchment destruction, high population, higher number of agro-based factories and urbanization. These contribute toquitesubstantialpollutionofsurfacewaterresourcesbyteafactories,poorsanitationandwildlife intheforest.Groundwaterqualitycanbeadverselyaffectedbyhighfluoridelevels(GovernmentofKenya,2008).
2.8.4.2 The Middle Tana The middle reach experiences aggressive agricultural practice and overstocking, leading to catchmentdegradation and consequent higher erosion. Otherpollution emanates from quarrying activities, sandharvesting and farm chemical wastes. Erosion andsedimenttransportanddepositionaremajorpollutantsinthisreachinadditiontosimilarpollutantsoftheupperTana. Groundwater contains pockets of heavy metalsandfluoride(Emerton,2003).
2.8.4.3 The Lower TanaThis part of the catchment is characterized by waterscarcityintimeandspacewithhighevapo-transpirationrates which places a heavy reliance on groundwaterfor local drinking water supplies. Groundwater faceschallenges of salinity (fluorides and iron) due to thenatureofrockformations.Otherchallengesincludeseawater intrusion, tourism by-products, poor domesticwater disposal and poor sanitation (Government ofKenya, 2008).

TANA RIVER DELTA STRATEGIC ENVIRONMENT ASSESSMENT 2014 18
2.9 Hydrology of the Tana Delta2.9.1 Historic and Current River ChannelsThefloodplainoftheLowerTanaRivergraduallywidensfrom2 kilometres below theTana Primate Reserve toreach its maximum breadth of 60 kilometres behind the coastaldunes. Historically themainriverchannelwasfree to migrate across the whole floodplain, througha continuous process of meandering with occasionalabrupt changes in course, caused by major breaches of the riverbanks intimesofflood (Hamerlyncket al, 2010).
At least four former courses of the Tana can be traced intheresidualwatercoursesandoxbowlakeswhichliewithinthedelta.Theoldestisthoughttobethechannelwhich flowed through Vumbe and Lango la Simba toenter the sea via the Ozi River (Nyunja et al, 2013).
Eachchangeoftherivercoursehasadramaticimpactonlanduse,navigationandthelocationofsettlements,withimportantramificationsfortheresidentpopulationwithintheDelta(Nyunja,et al, 2002).
Inthe1860’s,anavigationchannelwasdugtoconnectBelazoni(alongRiverTana)toKau(ontheOzi)andaftera particularly heavy flooding event at the end of the19thcentury,theriverbrokethroughandthisartificialconnectionwidened and became the principal mouth(Hamerlynck et al, 2010). The original estuary of Mto Tana now only functions during periods of flooding.Untilthelate1980s,freshwaterusedtoflowintotheolddelta through some of the numerous channels but these have since been blocked by small dams constructed by Pokomo farmers for local irrigation of their fields(Bennun and Njoroge, 1999).
Figure 2.6: Historic Channels of the River Tana

TANA RIVER DELTA STRATEGIC ENVIRONMENT ASSESSMENT 201419
Inthe1960’s,anewbreakthroughoccurredwhenRiverTana cut through the protective sand dunes in thecentral area of the delta and created an outlet to the oceanatShekiko.Thispartofthedeltanowconsistsofanetworkoftidalcreeks,withextensivemangrovecover,interspersedwith seasonally flooded grassland dottedwithpalms andacacia. Someof the creekshavebeencutofffromRiverTana,butMatolo, themostwesterncreek,hasstillafunctionalconnectiontothemainrivercourse (Bennun and Njoroge, 1999).
Within the last 30 years, two significant events haveoccurred, which now control the Tana River channelaboveGarsen.Thesewere:1. TheconstructionofthefirststageoftheTanaRice
Irrigation Scheme,which included construction ofnew water intakes and a new channel - the ‘dugriver’,and,
2. Constructionof thenewGarsenRoadBridgeoverthe River Tana, together with the raising of theGarsen-Witu Road on an embankment across the floodplain.
Themain consequence of both activities is that RiverTanacannolongermigratefreelyacrossthefloodplainaboveGarsen.Instead,itisconfinedtoawesterlychannelbytheIdsowebridge.Thishasledtothegradualbuild-upof the riverbedand levees to thepointwhere theriverisalmosttwometresaboveadjacentlandlevels.Amarkedgradientnowexistsfromwesttoeast,betweenthecurrentriverchannel,whichliesataround15masl,tothecourseoftheformerLangolaSimbawhichisat10masl.ThiswasdescribedbyEcosystemsLtdin1983as ahighpotential risk for adisastrousflood, and theconditionshaveworsenedsince.
2.9.2 Significant Flood Events in Tana DeltaThereisclearevidence,basedonlocalknowledge,thatthe frequency of shallow annual floods has declinedsincethesevenforkscascadeschemewasconstructed,andadoubleannualfloodeventisnowrare.However,majorfloodsstilloccur intheDeltaandthefrequencymay be increasing with the onset of climate change.Floods are essential to themaintenanceof livelihoodsintheDeltabuttheyalsocausewidespreaddamageandpose a threat to life of animals and humans.
2.9.3 Irrigation SchemesAlthough deltas are highly dynamic environments it is possible to modify their character by realigning and canalizingrivers.ThehistoryofengineeringworkintheTana Delta contains many examples of schemes that havefailedduetoexceptionalforceoffloodevents.TherecordofdevelopmentwithintheLowerTanaRiverandTana Delta over the last 60 years is a litany of poorly planned engineering and irrigation schemes based on
inadequatedatawith inadequate scientificknowledge,misleadingeconomicevaluations,adisregardforhumanwelfare and management failures and incompetence.Thissituationhastochange.
The first major irrigation schemes were introducedin the Tana River Basin between 1960 and the early1980s. Initially, itwas anticipated that the basin hadapotentialof132,000haforirrigation.However,duetoacombinationofpoordesignandmanagement,andseriousflooddamage,manyoftheschemesfailed.
2.9.4 Water Demand2.9.4.1 IrrigationIn2000,thetotalwaterdemandintheTanaRiverBasinwasestimatedtobe268millionm3peryear,representing6% of the annual flow (Government of Kenya, 2012).However, if all the irrigation schemes constructed by2000hadbeenoperatingtotheirfulldesignpotential,totalwaterabstractionfromRiverTanawouldhavebeenequivalent to about 20% of its annual discharge and this level of development could not have been sustained withtheamountofstorageinthecatchment.
Vision2030,Kenya’slongtermdevelopmentblueprintfor the future, has set a target to increase the area under irrigation and drainage from 140,000ha to 300,000hawithpriority to foodproduction, industrial and foddercrops in the commercial and semi-commercial sectors (Government of Kenya, 2007).
The present irrigation area in the Tana catchment isnominally 64,425ha, which is 45% of the land underirrigationnationally.Itconsistsofbothsmallandlargescaleirrigation.Mostsmallscaleirrigationispractisedinthe upper and middle reaches of the Tana by individual farmersalthoughtherearetwolargeschemes;theMweaIrrigationandlowerTanabasinschemeswhichareunderthecontroloftheNationalIrrigationBoardandTARDA(Government of Kenya, 2012).
The river and its floodplain provide opportunities forcultivationintheLowerTanaBasin,mostlythroughfloodrecessionandlimitedtraditionalirrigation.Somelimitedriver fishing occurs mainly focused on ox-bow lakeswhicharefloodedandreplenishedduringtheseasonalriverfloods.LowerTanairrigationschemesfacedmanymanagementandwatersupplyconstraints in theearly90s but are now being revived. New managementstructuresarebeingputinplaceandrehabilitationisinprogressalthoughmanycommentatorsremaincriticalofthe rate of progress and lack of capacity.
2.9.4.2 HydropowerElectricity generated from hydro-power stationsconstitutesmore than 60%ofKenya’s total electricity
TANA RIVER DELTA STRATEGIC ENVIRONMENT ASSESSMENT 2014 20
suppliesandtheSevenForkscascadedamscollectivelyhavemorethan400MWinstalledcapacity. However,powerproduction isseriouslyaffectedby lowflows inthe dry seasons and the Government is taking urgent action to promote new hydro-power developmentthrough the High Grand Falls (HGF) Project, together with geothermal energy in the Rift Valley and windenergy. Thermal power is also produced in MombasaandNairobi.However, theHGFdamis intendedtobeamulti-purpose projectwhichwill not only provide amassive boost in power, butwill also supply essentialwater supplies toNairobi, theNorth Eastern countiesand the LAPSSET corridor, meet the needs of expanding irrigation,andsafeguardlivelihoods.
2.10 Future Water Supply and Demand2.10.1 Projected Water Availability and DemandAccording to the draft National Water Master Plan,April 2012, renewable surfacewater resources in theRiverTanabasinwereestimatedtobe5,858Mm3/yr in 2010 and are projected to increase to 7,261Mm3/yr by the2030. Similarly, renewablegroundwaterresourceswereestimatedtobe11,671Mm3/yr in 2010 and are projected to decrease to 11,589Mm3/yr by 2030. The demand from surfacewater is estimated to be about801Mm3/yrwhilethatofgroundwaterisestimatedfromboreholeabstractiondataasabout68Mm3/yr.
2.10.2 Planned DevelopmentsAs discussed in section 2.2.6, two of Kenya’s mainflagshipprojects setout inVision2030are located intheTanaRiverBasin;thesearethedevelopmentoftheHighGrandFallsDamandrealizationofthenewLamu(Magogoni) port and LAPSSET corridor infrastructure. Both projects have the capacity to transform Northern Kenya but they also pose grave challenges to existinglivelihoodsandtheenvironmentoftheLowerTanaBasinandDelta.InadditiontotheusesalreadydescribedwaterwillbeneededintheTanaRiverBasinforawiderangeofdomesticandindustrialfunctionsandtomaintaintheintegrity of the Tana River Delta Ramsar site.
2.10.3 Summary of Water IssuesThemainwatersource inTanaDelta isRiverTana. Inthe dry seasons, villageswhich are far from the riverrely on excavating small pits in driedup channels anddepressions. Buteventhiswatersource isdependentonrechargefromthemainriverandfromsurfacefloodsduring the rains (Government of Kenya, 2012).
2.10.4 Water ConsumptionWater is required for crop irrigation, livestock anddomesticconsumption,andnaturalconditionsofwatersupply have deteriorated in the last forty years as a result of impoundments in the Upper Tana Catchment.
ResearchfortheSEAhasshownthatflowsinRiverTanahave historically maintained a minimum monthly mean of 60m3/secondatGarsen (IdsoweBridge),with levelsdropping to 45 or 30m3/secondinonlyafewmonthsinextremedroughtyears.Muchofthiswaterisdistributedthough minor channels across the lower floodplainwhereitsustainswetlandsonwhichlocalcommunitiesdependfortheirlivelihoodsaswellassustainingtherichbiodiversity.
2.10.4.1 Domestic ConsumptionExisting levels ofwater consumption remain very lowintermsofpermanentabstractionsincewastewaterisreturnednaturally to thesystem.Humanconsumptionof water is restricted by the capacity of women andchildren to collect it. If it is assumed that the average abstractionperpersonforallpurposesis20litres(IsolaFigures)(Mati,2006)thisequatestoadailydemandof2.04 million litres (2,040 m3/day). This compareswithaverage consumption per head of 150 litres/day inNairobi.
2.10.4.2 AgricultureMost farming in the Delta relies on rainfall during the wet seasons, receding floodwaters and naturalgroundwater percolation. Consequently it is hard toattributeaprecisevaluetowateruptake.Itisreasonabletoassume,howeverthat inatypical90dayperiodforcropproduction,plantswillabsorbsoilwateratarateof100mmpermonthequatingto0.33m3 per square metre (Emerton, 2003). Cropping takes place on 6,204 ha so theestimatedwaterdemandis227,500m3/day.
2.10.4.3 LivestockThedailywater intakeforcattleinrangelandsis intheregion of 12-20 litres although this is for beef cattleand dairy cows require 50-100 litres when lactating(Emerton, 2003). Daily consumption will be in theregion of 4,240m3/Day(assuming15%aremilkingcows)(Emerton, 2003). This estimate deals only with directwaterconsumption.Theamountofwater takenupbygrass and plants and eaten as forage by livestock and wildherbivoresislikelytobeonacomparableleveltoagricultural cropping (Government of Kenya, 2008).
2.10.4.4 Water and the EnvironmentWater is the source of all lifewithin the Delta and asubstantial amount of thewater reaching theDelta isabsorbed by soils and vegetation or is lost throughevaporation.
TherehasbeenremarkablylittlefieldresearchintothehydrologicalconditionsintheTanaDeltaalthoughthisisnowstartingtoberectified,wherefundsallow,byateamof scientists (Kenweb) coordinated from the NationalMuseum. In the absence of data it has been necessary to

TANA RIVER DELTA STRATEGIC ENVIRONMENT ASSESSMENT 201421
exploretherelationshipbetweenbiodiversityandwatersupplyusingfirstprinciplesandlimitedobservation.
TheDeltaexperiencestwoverydistinctclimaticseasonsbased on rainfall. During the short and long rains most parts of theDelta receive some rainfall in addition torechargeofthefloodplainsoilsbyhighriverlevelsandperiodicflooding.However,insomewetseasonsrainfalland flood levels remain low and both the vegetationandwildlife intheDeltaareseriouslyaffected iftheseconditions are subsequently followed by drought.Following the end of the rains, vegetation growthcontinuesforoneortwomonthsbasedontheuptakeofwaterfromthenaturalsoilreservoirbutsoilmoisturereduces as evapo-transpiration increases in the veryhot dry season. Even in normal dry seasons, the high temperaturesintheDeltaleadtorapidevaporationandwiltingconditionsforgrassandothervegetation.Poorgrowth linked with over-grazing can rapidly removemuch of the surface vegetation leaving bare earthacrosslargepartsofthefloodplainsandintheadjacentterraces.
The amount of water used by grassland and othervegetation can be estimated using the FAO standardforwaterdemand in crops, since the referencedatumis based on trial plots of good quality grass cover as the reference point for evapo-transpiration. In arid landswithin the tropics good quality grass sward typicallytranspiresbetween4-6mmofwaterperm2 per day or 120-180mmpersquaremetrepermonth.Thesefiguresequatetothelosstotheatmosphereofbetween1,200-1,800 m3 per hectare per month.
ThefloodplaingrasslandsoftheDeltacover50,800ha,whilewetlandfarmingareas(convertedfromfloodplaingrassland)occupyafurther12,300ha.Thesetwoareasconstitute the most important farming and livestock
Table 2.4 Evapotranspiration from Floodplain Grassland and Wetland Farming Areas in a Dry Month
Table 2.5 Evapotranspiration from all Areas of the Floodplain in a Dry Month
Source: Tana Delta SEA, 2014
Source: Tana Delta SEA, 2014
grazing areas of the Delta and cover an area of 631 km2. Table 3.4 shows how much water is evaporatedor transpired from this area in a typical dry season month.ThevolumeofwaterlostfromtheDeltatotheatmosphere ranges from the equivalent of 28-42 m3/sec.However, the two land classes included in Table 2.4form only part of the area of the floodplain which isrecharged from the River Tana. To complete the picture it is necessary to add Riverine Forests (32,300 hectares), Mangrove (8,400 ha) and areas of open water (1800ha).Whentheseareaddedtofloodplaingrasslandandwetlandfarmingthetotalareaof thefloodplainwhichis recharged from the river rises to 1,056 km2. Table 2.5 shows the total ratesofevaporationand transpirationrange between 47 and 71 m3/sec in the dry seasons dependingontemperatureandevaporationrates.
Comparison of the mean discharge in the River Tana and meanevapo-transpirationfromthefloodplainshowthattheselieinthesamerange,whichimpliesthatmostofthewaterenteringtheTanaDeltathroughnormalriverflowsisabsorbedandutilisedbythenaturalvegetationandfarmingactivities.ThesecalculationsaresupportedbythereportsfromlocalpeoplethatfreshwaterflowsceaseinthelowerpartsofthemainOzibranchduringthedryseasontobereplacedbythebackflowofbrackishandsalinewaterfromthesea.
In summary, the water uptake by vegetation andevaporation in the floodplain lies between 4 and 6million m3/day, (47-71m3/sec) representingmost ifnotalloftheRiverTanaflowthroughtheDelta.Thisfigurethereforerepresentstheminimumflowthatisrequiredto safeguard the Delta’s rich biodiversity, land usesand cultural heritage and should be adopted as the ‘environmentalreserve’–meaningtheminimumamountofwaterthatshouldflowtotheDelta,regardlessofthedemandsandusesforwaterupstream.
Rate of evapotranspiration m3 per m2 m3/Hectare m3/month/63,100 Ha Flow rate m3 equivalent per day Discharge m3/sec
20mm per month (30 days) 0.12 1,200 126,720,000 4,087,742 47.3
180mm per month (30 days) 0.18 1,800 190,080,000 6,131,613 71.0
Rate of evapotranspiration m3 per m2 m3/Hectare m3/month/63,100 Ha Flow rate m3 equivalent per day Discharge m3/sec
20mm per month (30 days) 0.12 1,200 75,720,000 2,442,581 28.3
180mm per month (30 days) 0.18 1,800 113,580,000 3,663,871 42.4

TANA RIVER DELTA STRATEGIC ENVIRONMENT ASSESSMENT 2014 22
2.10.5 Water SourcesThe main supply to the Tana Delta is provided by the River Tana, augmented by occasional flash floods anddischarges from the ephemeral streams and rivers called Lagas.Groundwaterisexploitedbythelocalpopulation,especially in areas that are remote from the permanent river channels, but all ground water is ultimatelyrechargedfromtheriverandannualflooding.
TheRiverTanadividesbelowIdsoweintotwochannels– the ‘Main’ riverwhichnowtakesonlyabout40%oftheflowandthenewlyestablishedeasternchannel,theMatombaBrook,whichtakesaround60%of theflow.Thevolumeofwaterinthemainriverindrymonthsistoosmalltosustainthe leveloffarmingactivitypreviouslyundertaken (due to saltwater incursion at high tides).Watersupplytothecentralwetlandsisadequateexceptindroughtconditions.
Themanagement ofwater resourceswithin theDeltais very difficult for two reasons. Firstly the flow inthe River Tana is dictated by seasonal variations butalso levels of abstraction upstream; and secondly, thephysical direction of flows to different parts of thedelta is dependent on the prevailing structure of the riverchannelsandanyattemptstoengineeralternativeroutesusingcanalsareliabletobedestroyedbyfloods.
Insimple terms theexistingwaterbalance in theTanaDeltahasalreadydroppedbelowitsnaturalstatewiththeconstructionofupstreamdamsandwaterabstractionpoints.ContinuedmaintenanceofthePrimateReserveand the Tana River Delta Ramsar site, biodiversity, livelihoods and culture is dependent on maintaining an averagemonthlyflowintheRiverTanaatGarsenof30-60m3/second.
2.10.6 Changes in River Morphology and DischargeThe volume of the river has been declining at an alarming rate due to the activities upstream, This has resultedin reducedwater availability for communities and lossof biodiversity. Although the decline in river discharge isprincipallyduetodamconstructionupstream, itcanalsobeattributedtoclimatechange,unsustainableuseofwaterandriseindemandforthewater.Constructionof dykes for the TARDA rice project in the Delta has also resulted to communities in the area being completelydeprivedof a source ofwater and livelihoods.On theother hand, theDelta has been affected by increasedrecurrence of severe floods. Bursting of the banks ofthe Tana has led to destruction of infrastructure andsettlements in theDelta. Infrastructure for theTARDAirrigation project, for instance, was destroyed by the1997ElNiñofloods. Floodinghas also contributed tosiltationofoxbow lakes and riverbeds.The impactof
flooding has been more visible because of increasedsettlements in the floodplains. The changing courseof River Tana has also had undesirable impacts on the communitiesintheDelta,althoughmostrecentchangeshavebeenstimulatedbyhumanintervention.
Thisanalysishasusedthebestavailableinformationtounderstand thehydrologyof the LowerTana, quantifyfuturewaterdemand,andcalculatethe‘environmentalwater reserve’. The initial findings point to the needfordetailed further studies and research. Inparticular,furtherinformationisneededabout:• The possibility of silt discharge from High Grand Falls
Dam–tooffsettheaccumulationofsiltinthedamsandreductioninsiltdepositionintheTanaDelta.
• High Grand Falls Dam SEA - The status of this documentneedstobeidentifiedandfulldiscussionsundertakenwiththeauthors,leadingtothedisclosureofallrelevantinformationandtheprocessofpublicconsultationwhichisafundamentalrequirementofany SEA.
• Levelsofassuranceonflooddischarges-Proposalsto introduce water resource management rules,includingprovisionforthereleaseofartificialfloods,need to be investigated in depth and formalizedthrough appropriate legal procedures.
• Effects of water transfers and off-channel waterdiversions-Allplansfortransferringwateroutsidethe Tana River Catchment need to be subject to full environmental assessment. Given the cumulativenature of the proposals this assessment should be undertakenasanSEAorCumulativeEnvironmentalImpact Assessment.
2.11 Climate ChangeIn the lastfiftyyears,humandevelopment in theTanaRiverBasin, including dam construction and irrigation,hasstartedtoimpactsignificantlyonnaturalprocesses,whilecurrent researchshows thatglobalwarmingandclimate change is likely to accelerate change in the next halfcentury(Nakaegawaet.al, 2012).
Preliminaryresearchonthepotentialimpactofclimatechange indicates increased evapotranspiration andpotentially higher rainfall in the basin. This wouldaccentuate theeffectsoffloodsanddroughts.Furtherresearchwillbeneededtoassessthelikelysignificanceof climate changewithin theTana Basin but an initialexercisewasundertakenaspartoftheSEAtoproducea terrainmodelof theDelta,using the informationonground level heights recorded by Google Earth. Figure 2.7showsthecompletedcontourmapinwhichheightintervals have been extrapolated from over 2,000 point sources to yield 1 metre contours. Figure 2.8 showstheareathat ispotentiallyvulnerabletosea level rise.

TANA RIVER DELTA STRATEGIC ENVIRONMENT ASSESSMENT 201423
Figure 2.7 Manually Plotted O
ne Metre C
ontours for the Tana Delta, O
rtho-corrected and Geo-referenced U
sing ESRI G
IS
So
urce: Tan
a Delta S
EA
, 2014

TANA RIVER DELTA STRATEGIC ENVIRONMENT ASSESSMENT 2014 24
Figure 2.8 Areas Potentially A
ffected by Sea Level R
ise in the Period to 2100
So
urce: Tan
a Delta S
EA
, 2014

TANA RIVER DELTA STRATEGIC ENVIRONMENT ASSESSMENT 201425
Althoughthiszoneextendsfrombelowmeansealevelto 3 m asl, most of the area shaded red lies in the range 0-1masl.Muchof the land is already affectedby saltwaterincursionasaresultoftidalsurgeswhichcarryseawaterupto30kilometresupstreamfromthemouthofthe River Tana.
PART FOUR: BIODIVERSITY
2.12 Biodiversity Characteristics of the Tana River Basin
2.12.1 The Upper Tana BasinThe upper River Tana catchment is a very important biodiversityhotspot.Forexample,MountKenya’supperpartsareprotectedasaNationalParkwhilethe lowerslopes are protected as a Forest reserve. The site is also recognized as an Important Bird Area (IBA), an Endemic BirdArea,aBiosphereReserveandanAllianceforZeroExtinction (AZE) site. Other key Important BirdAreasfound in the upper catchment include the Aberdare Mountains(ForestReserveandAberdareNationalPark),the Kikuyu Escarpment Forests, Kianyaga Valleys and Mukurweini Valleys. The Aberdare Mountains, MountKenya,KikuyuEscarpment forestsandMweaNationalReserve are protected areas.
Biodiversity in the upper catchment is under pressure from a wide range of threats: increasing agriculturalpressure,forestdegradatione.g.fromincreasingdemandforfuelwood,forestfires,lackofresourcestoimplementbiodiversity management plans, uncoordinated resource management strategies (e.g. multiple governmentconservation agencies pursue conflicting sectorpolicies), human-wildlife conflicts, climate change,uncontrolled subsistencehuntinge.g. inMasingadam,damconstruction(GovernmentofKenya,2008).
2.12.2 Biodiversity of the Middle CatchmentThe key biodiversity rich area in this segment of the basin is the 3,200 km2MeruConservationAreawhichis a complex of protected areas along River Tana that includes the adjacent Bisanadi and Mwingi Nationalreserves, the Kora National Park, and Meru NationalPark (Government of Kenya, 2008).
Thetwoparksandthetwonationalreservesconstitutean important conservation area in Kenya which isthe second largest conservation area after the TsavoEast and Tsavo West area and are perhaps one of the remainingtruewildernessareasinKenyaandtheworld(Bennun and Njoroge, 1999). The protected areas hold substantivepopulationsoflargemammals,includingthethreatened African Elephant, cheetah and lions (Bennun and Njoroge, 1999). However Black Rhinoceros and
the introduced White Rhinoceros have virtually been wiped out by poachers (Bennun and Njoroge, 1999)whileGrevy’sZebraonlyremainsinMeruNationalPark(Government of Kenya, 2008). At least 280 bird species have been recorded in the conservation area. MeruNationalPark is designated as an ImportantBirdArea(IBA). This site hosts the globally threatened Hinde’sBabbler and five regionally threatened bird species(BennunandNjoroge,1999).Theareahasarichfloraldiversity. For example some 720 plant species have been recorded inKoraNational Parkwith50of thembeing endemic to the park (Bennun and Njoroge, 1999).
Another biodiversity hotspot in the mid Tana River Basin isArawaleNational Reserve inGarissa,which bordersRiverTanaononeside. ItwassetasidetoprotecttheendangeredHunter’shartebeestorHirolaOthergloballythreatenedspeciesfoundinthereserveincludeGrevy’sZebra,AfricanWildDog,CheetahandAfricanElephant.The reserve also hosts reticulated giraffe, lesser kudu,buffalo, hippos and crocodiles (Bennun and Njoroge,1999).
Biodiversity in the mid Tana Basin is under threat, including from: encroachment by pastoralists, rampant poaching particularly of elephants and rhinos andprobably other wildlife, and human-wildlife conflicts(Outman, 2004).
2.12.3 Biodiversity of the Lower TanaTheTanaRiverDeltaisanImportantBirdArea(IBA);aRamsar Site, a Key Biodiversity Area (KBA) and a Global Biodiversity Hotspot and is also part of the Coastal Forests of Eastern Africa Hotspot.
The natural resources of the Tana Delta include its soils,vegetationandwildlifeonwhichmanyeconomicactivitiesarebased.ArichmosaicofhabitatsmakesuptheDelta, includingriverineforest,oxbow lakes, lakes,swamps, open water, river channels, mangrove andgrassland (See Figure 2.9). All of these habitats depend onthecontinuingflowoftheRiverTana.
In recent decades the number of some larger mammals (Buffalo,Giraffe,WaterbuckandZebra)hasdeclinedduetoincreasingcompetitionovergrazinglandwithlivestock,thespreadofhumansettlementwhichhasintrudedontraditionalmigratory routes (fromTsavo East NationalPark and the North Eastern rangelands to the Delta) and in thecaseofaquaticspecies likeHippopotamusfromthe loss of habitat (See Table 2.6). Other species have actuallyincreasedinnumbersbetween1993-2003butno more recent data is available (Albergel et al, 2012).
ThemosticonicoftheDelta’swildlife–theRedColobusandCrestedMangabeymonkeys–liveindenseriverine

TANA RIVER DELTA STRATEGIC ENVIRONMENT ASSESSMENT 2014 26
forest andarehard to count.Although thepopulationappears to be stable the habitat is under constant threat from tree clearance (Albergel et al, 2012).
Species 1993 1996 2002 Buffalo 8,644 1,884 1,518 Eland 736 78 -‐ Elephant 122 255 239 Grant’s Gazelle 2,325 3,846 3,537 Gerenuk 2,345 3,022 4,356 Giraffe 3,799 1,315 1,218 Hunter’s Hartebeest 407 19 -‐ Lesser Kudu 1,259 883 2,098 Oryx 1,802 2,178 1,019 Ostrich 1,414 1,044 419 Topi 5,679 255 -‐ Warthog 1,666 2,590 2,677 Waterbuck 1,201 608 139 Plains Zebra 2,461 2,355 1,538 Grevy’s Zebra 38 37 -‐
Source: Kenya Wildlife Service
Source: Tana Delta Land Use Plan, 2014
Figure 2.9 Distribution of Vegetation and Land Cover in the Delta (2010)
Table 2.6 Wildlife Population in the Tana Delta
2.12.4 Wildlife CorridorsTana Delta provides vital ecosystem services to a much widerareathanthedelta itself,dueto its retentionofwaterandwetlandsinthedryseasonsandtheavailabilityofgrazingforbothwildanddomesticatedanimals.
Large herbivores have used fixed migratory routesbetweenareas likeTsavoEastNationalParkandotherareasofNorthEastKenyaforcenturies.Themigrationstake place twice a year and although they are on amuch smaller scale than the internationally famousSerengeti/Masai-Maramigration,theyareneverthelessof great importance in preserving elephant and antelope populations across the entire region. Five routes existintothedelta;twofromthenortheastandthreefromthenorthwestandwestandtheirpositionsareshownin Figure 2.10. The same routes are used by pastoralists whenherdingcattlebetweenthedeltaandwetseasongrazing areas (Hamerlynck, 2010).
In addition to the established migratory routes, landlying between separated blocks of riverine forest andotherhabitatswithintheDeltaservesasimilarfunctionin allowingmobile species, like primates and birds, to

TANA RIVER DELTA STRATEGIC ENVIRONMENT ASSESSMENT 201427
travel toand fromdifferent territories.Conversionof theseareas from thicket, scruborgrassland topermanentagricultureincreasestheisolationofremotehabitatsandincreasesthepressureonthesurvivalofrarespecies.
Figure 2.10 Wildlife and Livestock Migration Routes

TANA RIVER DELTA STRATEGIC ENVIRONMENT ASSESSMENT 2014 28
2.12.5 BirdsBirds constitute a very important part of the Deltaecosystem and apart from justifying its status as anImportant Bird Area (IBA) they are also a significantdimensioninthearea’sdesignationasaRamsarsite.Atleast 345 species of birds have been recorded at the site (Bennun and Njoroge, 1999). These include 5 globally threatened and 4 regionally threatened bird species (Table 2.7). More than 22 species of wetland birds
gatherintheDeltainnumberswhichareofinternationalsignificance,andthereareanumberoflargecoloniesofwaterbirdssuchasegrets,heronsandibis(BennunandNjoroge, 1999).
Briefsurveysin2008and2010continuedtorecordlargenumbersofcongregatorywaterbirds;fourgloballyendangeredbirdspecies,twolistedasvulnerableandseven near-threatened.
Water birds found in globally important numbers in the Tana Delta in 1992-‐3 (more than 1% of biogeographic populations): Great White Pelican Pink-‐backed Pelican Cattle Egret Yellow-‐billed Egret Great Egret African Open-‐billed Stork African Spoonbill Greater Flamingo Spur-‐winged Goose White-‐fronted Plover Lesser Sandplover Little Stint Curlew Sandpiper Marsh Sandpiper Sooty Gull Slender-‐billed Gull Gull-‐billed Tern Caspian Tern Lesser Crested Tern Saunders’ Tern Water birds known to nest in Tana Delta: (Oliver Nasirwa, unpublished report, 1993): African Darter Black-‐crowned Night Heron Black Heron Squacco Heron Little Egret Yellow-‐billed Egret Great Egret
Grey Heron Purple Heron African Open-‐billed Stork Sacred Ibis Glossy Ibis African Spoonbill Globally-‐threatened Birds in Delta: (Tana Delta report, June 2008, by Fleur Ng’weno – Nature Kenya) Hooded Vulture (endangered) White-‐backed Vulture (endangered) Rüppell’s Vulture (endangered) Basra Reed Warbler (endangered) Lappet-‐faced Vulture (vulnerable) Madagascar Pratincole (vulnerable) Bateleur (near threatened) Southern Banded Snake Eagle (near threatened) Pallid Harrier (near threatened) Martial Eagle (near threatened) African Skimmer (near threatened Eurasian Roller (near threatened) Malindi Pipit (near threatened) Tana River Cisticola (data deficient) Regionally-‐threatened birds: African Darter Great Egret Saddle-‐billed Stork Scaly Babbler
Table 2.7 Rare and Endangered Birds Found in Tana River Delta
Source: Tana Delta Survey by Oliver Nasirwa, 1992-3, unpublished, and Tana Delta report, June 2008, by Fleur Ng’weno – Nature Kenya

TANA RIVER DELTA STRATEGIC ENVIRONMENT ASSESSMENT 201429
2.12.6 Other Wildlife in the Tana River DeltaOtherwildlifeofconservationconcernintheareaincludethe threatened, range-restricted East African coast subspecies of the Topi on land, and the marine species Dugong dugong (globally categorised as vulnerable but regionally as critically endangered) and turtles nestingon the sandy beaches. The rivers and channels support large numbers of hippo and crocodile. Twenty-twofreshwater fish species are recorded from the lowerTana, including three eels. The mangroves provide vitally important spawning and nursery grounds for manyspeciesoffishandcrustaceans.Theextensivemangroveforests include the only significant stands in Kenya oftheplantHeriterialittoralis(BennunandNjoroge,1999).
Thereare320planttaxaintheLowerTanaRiver;58ofthemtreespecies,ofwhichtwoareconsideredCriticallyEndangeredinaglobalsense.Twentyonepercentoftheplantsareofconservationconcern,andtheareahostsseven plants on the IUCN Red list of threatened species. ThediscoveryofseveraltreesofCassipoureagummifluain2005wasonlythesecondtimethisspecieshasbeenrecorded in coastal Kenya and possibly only the third timeinKenya(Lukeet al, 2005).
Three shark species listed under the Convention onInternationalTradeinEndangeredSpeciesofWildFaunaand Flora (CITES) Appendix 1 have been recorded in the Tana Delta. The sharks enter estuaries occasionally, and their populations are greatly impacted by habitatdegradation (Nyingi et al, 2007). A further two fishspecies in the Delta are Red-listed as data deficient.Three important amphibians include the endemic Tana River caecilian, Boulengerula denhardti and the near-endemic mud-dwelling caecilian Schistometopumgregorii.ReptilesintheDeltaincludethenear-endemicTanawrithing skink Lygosoma tanae and the Ngatanaor mabuya-like writhing skink Lygosoma mabuiiformis(Malonza et al, 2006).
2.12.7 Tana River ForestsTana River Forests are composed of riparian forest patches maintained by undergroundwater from RiverTanainabroadfloodplain,1–6kmwide,thatiscoveredby alluvial sediment deposited during floods (BennunandNjoroge,1999).Thereareabout71distinctforests,ranging insizefrom1–1,100haandcoveringc.3,700ha in total. The forests lie on both banks of River Tana. Ofthe71patches,16(covering1,000ha)fallwithinthe17,100haTanaRiverPrimateNationalReserve(Bennunand Njoroge, 1999).
Tana River Forest patches have been recognized as an Important Bird Area. At least 200 bird species have been recorded in the forest patches and surrounding areas. Notable bird species in the forest patches include the
endangered Basra Reed Warbler and 5 near threatened species including Southern Banded Snake-eagle, Fischer’sTuraco,EastCoastAkalat,Plain-backedSunbirdand Malindi Pipit (Bennun and Njoroge, 1999).
Tana River Forests provide the only remaining habitat for twoendangeredprimates, theTanaRiverRedColobusandtheTanaRiverCrestedMangabey.Thepopulationsof these species have decreased considerably in recent years and both are among the 25 most endangered primates in the world (Butynski and Mwangi, 1995 -cited in Bennun & Njoroge, 1999). Tana River Forests have a high diversity of amphibians and fish. TheLowerTanariverineforestsareunique inKenya,beingremnants of continental forests resembling westernAfricanvegetationcommunities.Upto175woodyplantspecies belonging to 48 families have been recorded in 12 forests patcheswithinTanaRiverNational PrimateReserve (TRNPR) (Medley, 1993 – cited in Bennun &Njoroge.1999).Duetolonggeographicisolationofthisforest community from the rain forests of central Africa (Medley 1992) there are high levels of endemic plant andanimalspecieswithintheforestpatches.Atleast61plantsfoundintheforestsaregloballyornationallyrareand notable species (Bennun and Njoroge, 1999).
2.12.8 Prime HabitatsThestatusandconditionofthenaturalenvironmentintheDeltaisheavilydependentupontheprotectionandenhancement of the many varied habitats which giverise to its biological diversity. In one sense the special qualitiesoftheDeltastemfromtherichnessofallthehabitats.Consequentlythe lossordeteriorationofanycomponentwillinevitablyweakenthewhole.However,someareasmayberegardedasofexceptionalimportancebecause together they sustain the most important fauna andfloraoftheDelta.Theseareas,regardedasprimaryhabitats,areshowninTable2.8.
Habitat Type Area in Km2 Forest 271 Riverine Forest 323 Water 18 Floodplain grassland 508 Mangrove 84 Dunes 103
Migratory Corridors through thicket 100 Total 1036 = 100
Table 2.8 Primary Habitats Making up the Core of the Tana Delta

TANA RIVER DELTA STRATEGIC ENVIRONMENT ASSESSMENT 2014 30
The term “primary habitat” is used to distinguishbetweenthecoreareasandother ‘secondary’habitatsthat are important for individual species but are not the primary reason for the area’s designation as a Ramsarsite. In addition to the specific habitats listed in table2.8,anothercriticalcomponentoftheDelta’biodiversityis the existence of migratory land corridors through the buffer zonewhich are used by bothwild animals andlivestockinordertopassbetweenthecoreoftheDeltaandthewiderrangelands-seeFigure2.10.Ithasbeenassumedinthisassessmentthateachoftheexistingfivecorridors shouldbemaintainedwithaminimumwidthoftwokilometresandalengthof10kilometresthroughthosepartsof the thicket and scrub zone lyingwithinthe Plan Area.
ThecurrentmainconservationchallengesfortheLowerTana Delta are:• Competinglanduses• Lamu Port-South Sudan-Ethiopia Transport
(LAPSSET) corridor• Human-wildlifeconflicts• Encroachmentofhumansettlements• Environmental degradation e.g. destruction of
woodlandandmangroves, selective logging, slash-and-burn agriculture
• Habitatfragmentation:duetoforestdegradationasaresultofvariousactivities.
2.12.9 Ecosystem ServicesEcosystemservicesarethebenefitspeopleobtainfromecosystems. These include:• Provision – the goods or products obtained from
ecosystems,suchasfood,water,timberandfibre• Regulation – the benefits obtained from the
regulationofecosystemprocesses,suchasclimate,flood,disease,wasteandwaterquality
• Culture – the nonmaterial benefits people obtainfromtheregulationofecosystemprocesses,suchasrecreational,aestheticandspiritualbenefits
• Support – the supporting processes such asphotosynthesis and nutrient cycling that are necessaryforproductionofallotherbenefits.
TanaRiverDeltaisprovidingawiderangeofecosystemservices. Hamerlycnck et al(2010)havemadeaninitialclassificationofthese–seethetable2.9.
2.13 Summary of Baseline Characteristics in the Tana DeltaTable 2.10 provides a summary of the baseline characteristics in the Tana Delta which is used forcomparativepurposes in latersectionsof theSEAandtheevaluationofscenariosforfuturedevelopment.

TANA RIVER DELTA STRATEGIC ENVIRONMENT ASSESSMENT 201431
Table 2.9 Ecosystem Services in the Lower Tana
Source: Hamerlynck et al, 2010

TANA RIVER DELTA STRATEGIC ENVIRONMENT ASSESSMENT 2014 32
Component Measure/Unit 2010 Population Thousands 102 Workforce Thousands (51% of population LUP Baseline Report) 52 Urban Area Km2 26.2 Industrial land Hectares 10 Open Grazing Area occupied (Km2) 1,128 Livestock -‐ Maximum number 735,000 Livestock -‐ Minimum number 220,000 Livestock -‐ Average number 477,500 Average value (KSh Billion @ 12,000/head) 5.73 Ranches Area occupied (ha) 9,200 Livestock -‐ Maximum number 480 Livestock -‐ Minimum number 0 Livestock -‐ Average number 480 Average value (KSh million) 3.1 Farming Potential Arable Area (Km2) 1,100 Permanent Cultivation (Area Km2) 6.2 Subsistence (Number of people supported) 102,000 Value of crop production (KSh million) 62 Irrigated land (ha) 385 Labourers (‘000s) 12 Commercial farms (Has) 450 Fishing Number of Kgs/annum 613,003 Value (KSh million) 53,136,500 Bee keeping Number of hives 12,150 Honey (000 Kg) 68-‐96 Value (KSh million) 20-‐29 Natural Products Area required for harvesting ( Km2) 55-‐85 People engaged in NTFP harvesting 4971 Income generated (KSh million) 80 House building using natural materials (KSh million) 100 Employment in house construction (number of jobs) 1165 Charcoal / Firewood (000 tonnes) 153-‐236 Tourism Turnover (Value ‘000 USD) 26 Industry & Mining Area Involved 0 Turnover (Value USD) 0 Water Demand Domestic (m3/day) 2040 Commercial / Industrial (m3/day) 0 Livestock (m3/day) 4,748 Farming (m3/day) 10,548 Environmental Reserve (m3/day) 5.2 million Biodiversity 1,026 Km2 Prime habitats = 100 100
Table 2.10 Baseline Summary
Source: Tana Delta Land Use Plan, 2014

TANA RIVER DELTA STRATEGIC ENVIRONMENT ASSESSMENT 201433
PART FIVE: KEY ISSUES IN THE TANA RIVER DELTA
2.14 IntroductionTheTanaDelta isfacedwithmanychallengesandit istheroleoftheSEAfirsttoidentifytheissuesthatneedtoberesolvedandthentoproviderecommendationsforacomprehensiveplanningstrategythatwillhelptoavoidproblems and maximise opportunities for sustainabledevelopment.The issues identified intheSEAScopingReport includedthetopics listedaspriorities inFigure2.11. The following text discusses the main findingsand Table 2.11 summarises the key issues and possible solutions.
2.14.1 Influx of InvestorsFormorethanhalfacentury,theTanaDeltaandLowerTana River Basin have been perceived as tracts of land withlowlevelsofpopulation,extensivepatchesoffertilesoilssuitableforcultivationandanabundanceofwater.These resources have been promoted for development by successive national governments, beginning duringthe colonial administration, and assisted over thedecadesbyinternationalaidagencies.
Unfortunately the failure of successive schemes, which have beenwell documented, and the changingcircumstances in terms of population, land use andwaterresourceshavenotbeenfactoredintosubsequentdevelopment plans, leading to increased social tensions withintheDeltaandadecliningeconomicbase.
Contrarytotheestablishedview,theTanaDeltahasalarge and rapidly growing population of over 100,000people who are entirely dependent on its naturalresources and the ecosystem services which theseresources provide for their livelihoods. Its soils are not homogeneous but are in fact highly variable in quality, reflecting the constantly changing environment of theDelta where river channels can move in a matter ofweeksandfertilityisgovernedbytheannualspreadingof siltwashed down from the highlands, hundreds ofkilometres away. The third illusion is the assumptionthat the Delta has a surplus of water which can bediverted for other uses apart from sustaining local people and the ecosystem on which they depend. Inpractice,watersuppliestotheDeltahavebeendecliningsincethefivemajordamsintheupperTanacatchmentwere constructed in the period between 1960 and1990. Inadditionto thecritical rolewhichfloodsplayin modifying river channels, spreading silt and sustaining keyhabitats,themoreorlessconstantbaseflowintheRiver Tana throughout the remainder of the year helps to rechargegroundwaterandsustainsoilmoisturecontentinthecorewetlands.
External investors and previous governments have attempted to generatewealth from theDelta throughpoorly conceived, constructed and maintained schemes, including the Bedford biofuels project, a former G4 Industries farming project, and proposals like the allocationoflandtotheQatarGovernmenttogrowfoodforexport,while local initiatives toestablish irrigationschemes for rice production have also been hit bynumerous constraints.
TheSEAhas shown thatmanyof these failures couldhavebeenforeseeniffullyobjectiveEIAsandtechnicalstudies had been performed in advance, and if the politicalandinstitutionalstructureshadbeensufficientlyrobust to ensure that the national interest overrodeprivate interests and individual gain.
2.14.2 Changes in Hydrology and Water UseThe most recent technical feasibility studies for the High GrandFallDamintheUpperTanaBasinhaveconfirmedthattheconceptofestablishingalargeirrigationprojectin the Tana Delta is outdated and that any future irrigation schemes should be developed in locationsthatarenotaffectedbythetwiceyearlyfloodevents.Althoughdamsintheuppercatchmenthaveattenuatedfloodflows,andtheHGFDwillgreatlyaddtoregulationofnaturalflowsthroughouttheyear,majorfloodeventscontinuetooccuronacyclicaltimescaleof5-7years.These floods are so large that they will continue todwarftheimpoundingeffectofman-madebarriers,andwilloverwhelmanydykesunlesstheseareconstructedon such a scale that they destroy the Delta themselves.
The SEA has demonstrated conclusively that, contrary totheestablishedviewthatfloodeventsoriginatingintheUpperandMiddlecatchmenthavelittleornoeffectontheDelta,thelowerRiverTanarespondsinthesamewaytorainfalleventsinthehighlandsastheupperriver.It is also affected by flash flooding from major lagas,whichbringverylargebutunquantifiedvolumesoffloodwaterintotheDelta.
ThenormalflowconditionsintheRiverTanaasitentersthe lower Delta at Garsen (Idsowe Bridge) are above60m3/secondandthisvolumeofwateriscriticaltothesurvival of the Tana Ecosystem and local livelihoods.
PlansforthedevelopmentofwaterresourcesinKenyainevitablyaffect theRiverTanasince it carries70%ofthe country’s surface flow. These proposals includepower generation, the development of large irrigationschemes,provisionofwatertoNairobiandtheLAPSSETcorridorincludingthenewPortofLamu.

TANA RIVER DELTA STRATEGIC ENVIRONMENT ASSESSMENT 2014 34
Table 2.11 Summary of Key Issues in the Tana River Delta
Source: Tana Delta Land Use Plan, 2014
TANA RIVER DELTA STRATEGIC ENVIRONMENT ASSESSMENT 201435
These projects are described as flagship initiatives inVision2030andthegovernmentiscommittedtotheirdevelopmentbutifallthenationalgoalsandobjectivessetoutinthisVisionandtheConstitutionaretobemetit isessential that theschemesaredesigned insuchawaythatthenaturalresources,livelihoodsandpeopleofthe Tana Delta are protected.
2.14.3 Resource Use ConflictsPolitical and social conditions in the Tana Delta havebeen volatile for some decades, reflecting the verydifferent lifestyles,cultureand livelihoodrequirementsofthetwomaingroupsofinhabitantswhicharebasedon sedentary farming and migratory livestock rearing. A combination of circumstances, including populationgrowth,increaseinthesizeoflivestockherds,reducedwater flows, the onset of climate change and newadministrative structures have all played a part increating the conditions within which armed conflictcan flare up. The evidence from the SEA is that the
underlying competition for scarce natural resourcesis certain to increase in the short-term and only the introductionofagreedstandardsfor landuseplanningcan help to minimise disputes.
2.14.4 Increased Human-Wildlife ConflictsForcenturies,elephant,buffaloandotherlargemammalshavefollowedmigratoryroutesfromlocationslikeTsavoEast and the northern rangelands to the core of the Deltatofindwater inthedryseasonandtobreed.Asthehumanpopulationhasgrownthewidthofmigratorycorridorshasbeenreduced,withindividualsettlementsactually being built within the corridors. In addition,landhasbeencordonedbydykes and fences to allowforirrigationofcropslikemaizeandrice,whichattractherbivores in large numbers. With proper management wildlife can be accommodated alongside farming andranching, but it requires detailed knowledgeof animalbehaviourandstrongpolitical commitment todevelopand implement the necessary measures.

TANA RIVER DELTA STRATEGIC ENVIRONMENT ASSESSMENT 2014 36
Key Issue Description Possible Solutions
POPULATION/ SETTLEMENTS -‐ Rapid population growth and increased settlements.
There is encroachment and degradation of wetlands and other protected areas. Biodiversity and natural resources are threatened including from charcoal burning. The nature of settlements in the Delta has also been a hindrance to provision of infrastructure.
A human settlement strategy for the Delta should provide an elaborate settlement pattern for the communities to ease provision of infrastructure.
LAND -‐ Land ownership
The land question in the Delta remains a challenge. The majority of local communities have no land ownership documents. Large tracts of land are owned by relatively few individuals while the majority occupy land which they claim is ancestral although it remains un-‐adjudicated. Due to the tenure insecurity, squatters rarely practice farming and have resulted to charcoal burning as a means of earning their livelihood. This has resulted in a massive reduction in vegetative cover due to felling of trees.
There is a need to adjudicate land and review land leases granted to the foreign companies in order to secure tenure for the local communities and resettlement of squatters.
ECONOMIC BASE -‐ Food insecurity
Food insecurity in the Delta is at an alarmingly high level, with dependence on relief food –especially during the drought spells – a common phenomenon. High poverty rates and climate change have been perceived as the underlying causes of food insecurity.
Propose strategies on sustainable agriculture and diversification of livelihoods to ensure food security.
ECONOMIC BASE -‐ Poverty
Poverty levels in the Delta are extremely high. About 95% of the population in the Delta reside in the rural areas and depend on subsistence farming for survival with barely any surplus produce for the market. Poverty has also forced the communities in the Delta to venture into wetlands and forests in search of alternative sources of livelihoods e.g. charcoal burning.
Propose strategies that will allow for diversification of livelihoods to avoid the dependence on rain fed agriculture and pastoralism as the only source of livelihoods for the communities in the Delta.
ECONOMIC BASE -‐ Unexploited potential
Unexploited potentials in the Delta include tourism, marine resources, improved agricultural production, close proximity to the proposed LAPSSET project and fisheries.
Propose planning strategies to suggest the most viable ways to exploit the untapped potentials in the Delta. Use formal training to equip the youth with the necessary skills.
Table 2.12 Summary of Key Issues and Possible Solutions

TANA RIVER DELTA STRATEGIC ENVIRONMENT ASSESSMENT 201437
INFRASTRUCTURE & SERVICES -‐ Lack of enabling infrastructure and services
Infrastructure is key in the development of any area. The planning area is under-‐developed in terms of infrastructure. The road network is poor, lack of organized markets and market amenities have hindered trading, adversely affecting sectors such as agriculture. Basic services such as water and sewer reticulation are also lacking. Other social amenities such as recreation and leisure are also not available.
An analysis of the population as well as projections need to be done and the infrastructure demand established.
DEVELOPMENT TRENDS -‐ Agriculture expansion and intensification
Agricultural expansion in the Delta (e.g. the contemplated large-‐scale projects) is likely to exert pressure on the land and resources in the Delta due to vegetation clearance, pollution and increase in water demand. This will impact ecosystem services and biodiversity. Pressure on existing infrastructure will also increase.
A comprehensive strategy that rationalizes natural resources management should be put in place in the implementation of the agricultural extension projects to avert the likely outcome of environmental degradation and biodiversity loss.
DEVELOPMENT TRENDS -‐ Impacts of proposed developments on the River Tana and Tana Delta, particularly LAPSSET, Tana Delta Irrigation Project and the High Grand Falls Dam.
The LAPSSET project will draw water for domestic and industrial use from River Tana; construction of Lamu port will stimulate major economic development opportunities resulting in a massive increase in population which will exert further pressure on the resources in the delta. The construction of High Grand Falls Dam upstream for power generation, irrigation, water supply and flood control will also greatly impact on the Delta ecosystems and community livelihoods.
More transparent planning processes for these major projects informed by SEA.
GOVERNANCE -‐ Weak legal and institutional frameworks and multiple and competing policies, institutions and legislations.
The result is an uncoordinated approach to managing resources in the Delta. This is further marred by the overlapping and conflicting mandates of the various institutions.
Review and make recommendations for improving legal and policy coherence and institutional mandates.
Key Issue Description Possible Solutions
POPULATION/ SETTLEMENTS -‐ Rapid population growth and increased settlements.
There is encroachment and degradation of wetlands and other protected areas. Biodiversity and natural resources are threatened including from charcoal burning. The nature of settlements in the Delta has also been a hindrance to provision of infrastructure.
A human settlement strategy for the Delta should provide an elaborate settlement pattern for the communities to ease provision of infrastructure.
LAND -‐ Land ownership
The land question in the Delta remains a challenge. The majority of local communities have no land ownership documents. Large tracts of land are owned by relatively few individuals while the majority occupy land which they claim is ancestral although it remains un-‐adjudicated. Due to the tenure insecurity, squatters rarely practice farming and have resulted to charcoal burning as a means of earning their livelihood. This has resulted in a massive reduction in vegetative cover due to felling of trees.
There is a need to adjudicate land and review land leases granted to the foreign companies in order to secure tenure for the local communities and resettlement of squatters.
ECONOMIC BASE -‐ Food insecurity
Food insecurity in the Delta is at an alarmingly high level, with dependence on relief food –especially during the drought spells – a common phenomenon. High poverty rates and climate change have been perceived as the underlying causes of food insecurity.
Propose strategies on sustainable agriculture and diversification of livelihoods to ensure food security.
ECONOMIC BASE -‐ Poverty
Poverty levels in the Delta are extremely high. About 95% of the population in the Delta reside in the rural areas and depend on subsistence farming for survival with barely any surplus produce for the market. Poverty has also forced the communities in the Delta to venture into wetlands and forests in search of alternative sources of livelihoods e.g. charcoal burning.
Propose strategies that will allow for diversification of livelihoods to avoid the dependence on rain fed agriculture and pastoralism as the only source of livelihoods for the communities in the Delta.
ECONOMIC BASE -‐ Unexploited potential
Unexploited potentials in the Delta include tourism, marine resources, improved agricultural production, close proximity to the proposed LAPSSET project and fisheries.
Propose planning strategies to suggest the most viable ways to exploit the untapped potentials in the Delta. Use formal training to equip the youth with the necessary skills.

TANA RIVER DELTA STRATEGIC ENVIRONMENT ASSESSMENT 2014 38
CONFLICTS -‐ Resource use conflicts
Resource use conflicts have intensified in the Delta as a result of increased pressure on the natural resources due to rapid population increase, climate change, land use conversions, insecurity of land tenure, etc. The conflicts manifest themselves in the form of wildlife – human and human – human conflicts.
Management of human conflicts through designating grazing and farming zones as well as rationalizing livestock numbers against available pasture.
Management of human-‐wildlife conflicts by mapping the wildlife conservation areas and controlling movement into the areas.
CLIMATE CHANGE Preliminary research on the potential impact of climate change indicates increased evapo-‐transpiration and potentially higher rainfall in the basin. This would accentuate the effects of floods and droughts.
Further research is needed to assess the likely significance of climate change within the River Tana Basin.
WATER -‐ Hydrology
Understanding of the hydrology of the Lower Tana Basin is poor.
Ideally plan and implement detailed hydrological studies.
WATER -‐ Future Water Demand
Some of the key developments will generate major demands for water over the next thirty years. It is clear that the combined demands of irrigation linked to the High Grand Falls Dam and water supply for the LAPSSET projects already exceed the available water supply in the River Tana.
Ideally collect further data on other pressing demands for water from the River Tana, including the growth plans for Nairobi and the Rift Valley and study growth patterns to determine what conditions would have to be met to ensure that a sustainable balance can be achieved between water supply and demand.
WATER -‐ Safeguarding the Environmental Reserve
Tana Delta has been designated as a Ramsar site (wetland of international importance) and its sustainable management must be secured. An initial calculation has been made of the environmental reserve needed to protect downstream livelihoods and the ecology of the Delta.
Ideally new studies to confirm the proposed value for the environmental reserve flows in the Lower Tana River.
WATER -‐ Levels of assurance on flood discharges
Upstream developments e.g. the Grand High Falls dam includes proposals to introduce water resource management rules, including provision for the release of artificial floods.
Investigate proposals in depth and formalize discharge requirements through appropriate legal procedures.
Key Issue Description Possible Solutions
POPULATION/ SETTLEMENTS -‐ Rapid population growth and increased settlements.
There is encroachment and degradation of wetlands and other protected areas. Biodiversity and natural resources are threatened including from charcoal burning. The nature of settlements in the Delta has also been a hindrance to provision of infrastructure.
A human settlement strategy for the Delta should provide an elaborate settlement pattern for the communities to ease provision of infrastructure.
LAND -‐ Land ownership
The land question in the Delta remains a challenge. The majority of local communities have no land ownership documents. Large tracts of land are owned by relatively few individuals while the majority occupy land which they claim is ancestral although it remains un-‐adjudicated. Due to the tenure insecurity, squatters rarely practice farming and have resulted to charcoal burning as a means of earning their livelihood. This has resulted in a massive reduction in vegetative cover due to felling of trees.
There is a need to adjudicate land and review land leases granted to the foreign companies in order to secure tenure for the local communities and resettlement of squatters.
ECONOMIC BASE -‐ Food insecurity
Food insecurity in the Delta is at an alarmingly high level, with dependence on relief food –especially during the drought spells – a common phenomenon. High poverty rates and climate change have been perceived as the underlying causes of food insecurity.
Propose strategies on sustainable agriculture and diversification of livelihoods to ensure food security.
ECONOMIC BASE -‐ Poverty
Poverty levels in the Delta are extremely high. About 95% of the population in the Delta reside in the rural areas and depend on subsistence farming for survival with barely any surplus produce for the market. Poverty has also forced the communities in the Delta to venture into wetlands and forests in search of alternative sources of livelihoods e.g. charcoal burning.
Propose strategies that will allow for diversification of livelihoods to avoid the dependence on rain fed agriculture and pastoralism as the only source of livelihoods for the communities in the Delta.
ECONOMIC BASE -‐ Unexploited potential
Unexploited potentials in the Delta include tourism, marine resources, improved agricultural production, close proximity to the proposed LAPSSET project and fisheries.
Propose planning strategies to suggest the most viable ways to exploit the untapped potentials in the Delta. Use formal training to equip the youth with the necessary skills.

TANA RIVER DELTA STRATEGIC ENVIRONMENT ASSESSMENT 201439
Key Issue Description Possible Solutions
POPULATION/ SETTLEMENTS -‐ Rapid population growth and increased settlements.
There is encroachment and degradation of wetlands and other protected areas. Biodiversity and natural resources are threatened including from charcoal burning. The nature of settlements in the Delta has also been a hindrance to provision of infrastructure.
A human settlement strategy for the Delta should provide an elaborate settlement pattern for the communities to ease provision of infrastructure.
LAND -‐ Land ownership
The land question in the Delta remains a challenge. The majority of local communities have no land ownership documents. Large tracts of land are owned by relatively few individuals while the majority occupy land which they claim is ancestral although it remains un-‐adjudicated. Due to the tenure insecurity, squatters rarely practice farming and have resulted to charcoal burning as a means of earning their livelihood. This has resulted in a massive reduction in vegetative cover due to felling of trees.
There is a need to adjudicate land and review land leases granted to the foreign companies in order to secure tenure for the local communities and resettlement of squatters.
ECONOMIC BASE -‐ Food insecurity
Food insecurity in the Delta is at an alarmingly high level, with dependence on relief food –especially during the drought spells – a common phenomenon. High poverty rates and climate change have been perceived as the underlying causes of food insecurity.
Propose strategies on sustainable agriculture and diversification of livelihoods to ensure food security.
ECONOMIC BASE -‐ Poverty
Poverty levels in the Delta are extremely high. About 95% of the population in the Delta reside in the rural areas and depend on subsistence farming for survival with barely any surplus produce for the market. Poverty has also forced the communities in the Delta to venture into wetlands and forests in search of alternative sources of livelihoods e.g. charcoal burning.
Propose strategies that will allow for diversification of livelihoods to avoid the dependence on rain fed agriculture and pastoralism as the only source of livelihoods for the communities in the Delta.
ECONOMIC BASE -‐ Unexploited potential
Unexploited potentials in the Delta include tourism, marine resources, improved agricultural production, close proximity to the proposed LAPSSET project and fisheries.
Propose planning strategies to suggest the most viable ways to exploit the untapped potentials in the Delta. Use formal training to equip the youth with the necessary skills.
WATER -‐ Effects of water transfers and off-‐channel water diversions
Plans to transfer water out of the channel e.g. to Lamu or within the channel e.g. for irrigation will affect the river levels in the Lower Tana.
All plans for transferring water outside the River Tana Catchment need to be subject to full environmental assessment. Given the cumulative nature of the proposals this assessment should be undertaken as an SEA or Cumulative Environmental Impact Assessment.
BIODIVERSITY While it is without doubt that the whole of the Tana catchment is important for biodiversity including the Primate Reserve, Tana River Forests and Tana Delta, there is a lack of detailed information about the precise locations of many of the habitats and species and detailed population information about species. In addition, detailed information about the vital ecosystem services the Delta is providing.
Map and safeguard key biodiversity hotspots within the planning area.

TANA RIVER DELTA STRATEGIC ENVIRONMENT ASSESSMENT 2014 40
CHAPTER3 National And Regional Development Scenarios
IntroductionThe Tana River Delta is located in a part of Kenya that will undergo very significant changes in the next 50 years. These include variations in temperature, rainfall, river flow and biodiversity as a result of global warming but also major changes in the region’s economic and social conditions arising from Government policy and individual and corporate initiatives.
In considering developments over the next 17 years it is possible to build up a picture of change based on specific proposals contained in Vision 2030 and other strategic documents like the National Water Management Plan, 2030. However, the situation beyond 2030 is likely to be much more fluid. This Strategic Environmental Assessment which accompanies the Tana Delta Land Use Plan has examined the likely pattern of change up to 2030 in Part One and subsequent changes to 2050 in Part Two.
PART ONE: NATIONAL SCENARIO 1 - CHANGES TO 2013-20303.1 PopulationKenya’s population is one of the fastest growing inthe world with an average increase of 2.7% (whichis exceeded in the Tana Delta due to both the natural birth rateand inwardmigration).Figure3.1shows theanticipated population growth for the country as awholeto2030.
thewiderTanaDeltaareawillhaverisenfrom200,000toover340,000,while thenumberof residents in theDeltawillhaverisenfrom102,000to175,000.
3.2 LivelihoodsAccording to the Tana Delta Land Use Plan (Odhengo et al,2014b)withoutanychangesincurrentconditionsintheTanaDelta, therisingpopulation, fromboththeexcessofnaturalbirthsoverdeathsandinwardmigration,willreachinexcessof175,000peoplein2030,almosttwo thirds higher than at present. Assuming that thispopulationincreaseisevenlysplitbetweenfarmingandpastoral communities, the 30,000 additional peopleneedingtobefedbyfarmerswouldrequireintheregionof 2,500-5,0005 hectares of farmland by 2030. The same number of people would be dependent on meat anddairy products from livestock rearing, requiring in the region of 50,000 animals6. The grazing area needed to sustainthisnumberofanimalswouldrepresent70,000hectares7ofdrygrassland,oraround20,000haofwetgrassland inthefloodplainwhich is30%oftheentireareaof thecorefloodplains in thedelta,anddoesnottakeintoaccounttheexistinghighlevelsofovergrazingin the dry seasons (Odhengo et al, 2014b).
3.3 Social WelfareExistingeconomicprogrammesunderVision2030arefocused on the development of flagship projects.Thismodel assumes that the increased economic wealthof the nationwill then be able to cross subsidise andfund welfare programmes to help the needy in allareas. Given the current emphasis on using parts of the TanaRiverbasinas the ‘breadbasket’ for thecountry,throughdevelopmentofcommercial irrigation,there is
Fundraiser Results by Salesperson
YEARS POPULATION IN MILLIONS
2010 39
2030 68
2050 97
Column, bar, and pie charts compare values in a single category, such as the number of products sold by each salesperson. Pie charts show each category’s value as a percentage of the whole.
0
25
50
75
100
2010 2030 2050
POPULATION (MILLION)
67.8
96.9
38.5
Figure 3.1 Anticipated Population Growth in Kenya
Source: Tana Delta Land Use Plan, 2014
In the country as a whole, most of the populationincrease is forecast to occur in the urban areas as people move to cities and towns in search of work, betterservices and infrastructure. Nevertheless, certain rural areaswillcontinuetoattractmigrantsandifthecurrentgrowth rate inTana River County continues unabatedover the next 17 years, the number of people living in
5Assuming an average family size of 6 and 0.5-1 hectare per family.6Assuming 10 cattle per household allowing a range from 2-100.7One tropical livestock unit per 7 hectares – dry arid grasslands.

TANA RIVER DELTA STRATEGIC ENVIRONMENT ASSESSMENT 201441
apotentialconflictofinterestinalsoseekingtoupgradethe lives and livelihoods of the rapidly expanding rural populationinthisregionasnotedinsection3.3above.
3.4 Economic ActivityManyofthemostsignificantflagshipprojectsofVision2030 are planned in North Eastern Kenya,within theTana River Basin and land extending to the borders withEthiopiaandSomalia.TheseincludetheLAPSSETprogrammeandlargescaleirrigation.
3.4.1 Lamu Port / Lamu-South Sudan-Ethiopia Transport Corridor Project (LAPSSET)LAPSSET is a transport and infrastructure project that,when complete,will be Kenya’s second strategictransportcorridor(GovernmentofKenya,2012).Kenya’sexisting transport corridor is the Mombasa port andMombasa–UgandaroutethatpassesthroughNairobiandmuchof theNorthernRift.TheLAPSSETcorridorwillinvolvethefollowingcomponents:• A port at Manda Bay• StandardgaugerailwaylinetoJuba(capitalofSouth
Sudan)• UpgradedRoadnetwork• Oil pipelines (Southern Sudan and Ethiopia)• OilrefineryatBargoni• Three Airports• Three resort cities (Lamu, Isiolo and LakeTurkana
shores) (Government of Kenya, 2012)
The project was initially conceived in the 1970’s butupgradingoftheexistingMombasaPortandtransportcorridortookpriority.Theprojectwaslaterrevivedandincluded in Kenya’s Vision 2030. LAPSSET’s cost wasestimated to cost $16billion in 2009 (Government ofKenya,2012).MorerecentestimatesindicatecostsoftheprojectatUS$22-23billionhttp://en.wikipedia.org/wiki/Lamu_Port_and_Lamu-Southern_Sudan-Ethiopia_Transport_Corridor-cite_note-3 (Government of Kenya, 2012).On1April2013,Kenya’sgovernmentannouncedthesettingupofagovernmentagency,theLamuPortSouthern Sudan Transport Development Authority thatwill manage the project on behalf of the Kenyangovernment.ThecostoftheprojectwasputatKSh.2.5trillion($29.24billion).
Workhascommencedondifferentstagesoftheprojectinasomewhatrandommanner.Someelements,liketheIsiolo-Merille projects, began in 2007. At the peak of the project,between2013and2018,itisexpectedthattheKenyangovernmentwill be spendingabout6%of thecountry’sGrossDomesticProductor16%ofitsannualbudget on the project. The project is in turn expected to contributeanadditional3%increaseinKenya’sGDPby2020.
The aim of the project is to cut over-dependence on Kenya’smainportofMombasaaswellasopenupKenya’slargely under-developed northern frontier, throughcreationofasecondtransportcorridor.Inpractice, thedevelopments triggered by the LAPSSET programme willcontinuetoevolveinfuturedecades,extendingwellbeyond 2050.
3.4.2 IrrigationThe second major economic development in the Tana Basin is based on extending the area of land under irrigation.ThethreemainflagshipprogrammesarethereinstatementoftheHolaandBuraIrrigationSchemes,togetherwith the excavation of a 50 kilometre canal.These initiatives are dependent on providing newreservoir storage capacity in the Upper Tana Basin. The third and biggest plan is the Galana/Kulalu Ranch irrigationscheme.InthisprojecttheKenyanGovernmentproposes to irrigate 1 million acres in Galana/Kulalu Ranchforfoodsecurity(OfficeofthePresidency,2014).
3.5 Water DemandRiverTanacontains70%oftheavailableriverwater inKenya(GovernmentofKenya,2012)andwillexperiencerapid development to meet the growing needs ofNairobi, the LAPSSET corridor and Vision 2030 forecasts for irrigation development in the Tana River Basin.Currently Nairobi has a daily demand of 750,000 cubic metres but can only rely on 500,000 cubic metres. This demand is forecast to rise to 2.5million cu m/d in 2030 (Government of Kenya, 2012).
The new townof Lamu Industrial Port is projected tohave a population of over 1million by 2030, creatingdemands for a further 96,000-160,000 m3/day (JPC & BAC/GKA JV, 2011). This supply is required for domesticconsumption,butotherelementsoftheLamudevelopment includingtheport, industryetc.will raisethe total requirement to between185,000– 250,000m3/day (Table 3.1).
IftheforecastdevelopmentofirrigationpotentialintheTana River Basin is realised in accordancewithVision2030,upto3,635millioncubicmetresofwaterayearwouldberequiredforthisusealoneby2030.
Table 3.2 shows the cumulative demand from thesespecific uses and makes no allowance for other usesincludingabstractionofwaterforfarmingintheUpperCatchment.

TANA RIVER DELTA STRATEGIC ENVIRONMENT ASSESSMENT 2014 42
Table 3.1 Water Demand Forecasts for the Lamu Port and LAPSSET Project
Source: JPC & BAC/GKA JV, 2011
Location / Use Million m3/day Billion m3/year
Nairobi 2.0 0.730
Lamu / LAPSSET 0.2 0.073
Irrigation 9.95 3.635
Total Water Demand
12.15 4.438
Table 3.2 Cumulative Water Demand by 2030 in the Tana River Basin
3.5.1 Water SupplyThe current storage capacity in the 5 dams already in operation in the UpperTana Basin, includingMasingaDamwhichholds1.65billionm3, amounts to around 2.2 bcm (Odhengo et al,2012c).ThiswillbegreatlyenlargedbytheconstructionoftheHighGrandFallsDam(GHFD)whichwillhaveastoragecapacityinexcessof5.6billionm3. The feasibility study for HGFD examines the planned rateofgrowthinwaterdemandandconcludesthatallwaterneedsupto2030couldbemetfromtheplannedreservoir.However,usingthesamedataandacceptingthat a key feature of the design for the HGFD is that it shouldbeabletostoresurpluswaterinyearswithaboveaverage rainfall (in the region of 2 billion m3) in order
to generate hydro-power in drought years, this SEAreaches a different conclusion.This is that the rate ofplannedgrowthsubstantiallyexceedsthecapacityoftheproposedwaterresourcedevelopments.Thereasonsforthisconclusionaresetoutbelow.
It is accepted in the Feasibility Study that a total of 0.8 billion m3ofwaterwillneedtobestoredandreleasedannually (in twodischarges of 400millionm3 each) in ordertosimulatethenaturalfloodregimeinthelowerTana. This estimate assumes a flood event of 7 daysduration, which is a minimal requirement and doesnot represent the typical flooding event. In additiontostorageofwater for irrigation,flooddischargesandpowersupply,theengineeringstudiesconfirmtheneedfor minimum daily releases from the HGFD of 10m3/second (865,000 m3/dayinthewetseason)and30m3/second (2.59 million m3/day) in the dry season. Taken over an average year this ‘environmental’ dischargeamounts to 0.8 billion m3 per annum. This again is based onfiguresforminimalflowsinthelowerTanathathavenotbesubjectedtoseriousscientificinvestigationandcannot be confirmed as adequate for the intendedpurpose of protecting the ecosystems of the PrimateReserve and Tana Delta.
On the understanding that 2 billion m3 of the annual storage (35%) isheldbacktocover thepotential forasubsequent drought year, togetherwith 0.8 billionm3

TANA RIVER DELTA STRATEGIC ENVIRONMENT ASSESSMENT 201443
(15%) tomeet the twiceyearly releaseoffloodflows,themaximum amount ofwater available for use fromHGFD for public and commercial water supply andirrigationwillbe5.6billionx50%=2.8billionm3. This islessthan65%oftheforecastwaterdemandby2030shown in table 3.2 and does not account for the factthat a further 0.8 billion m3 (15%) is required to meet minimumenvironmentalflows.
TheinabilityoftheplannedHGFDtosupplyfuturewaterneedsbeyond2030 isacknowledged in theFeasibilityStudy,which includesproposals for raising thedam inordertoincreaseitsstoragecapacityandincreasepowergeneration.Therearealsootherpotentialdamsites intheUpperTanaCatchmentwhichcouldbeaddedtotheexistingcascadeinthelongterm.
It is understood that a financial agreement is beingnegotiatedbetweentheKenyanGovernmentandEximBankofChinaandwork isexpectedtobeginsoononconstruction of the HGFD, which will take around 6years to complete (Odhengo et al, 2012c).
3.5.2 Water BalanceIt is the responsibility of the Ministry of Environment, Water and Natural Resources to balance supply and demandforwater throughout thecountryandwork isin progresson theNationalWaterMasterPlan, 2012.ThefollowingdataistakenfromapresentationmadebyPatrick Oloo, Deputy Director of Water Resources 21st February, 2013.
Climate change will have an effect on Kenya’s waterresources over the coming decades but it is not easy to calculatewhatthenetimpactswillbe.Precipitation(i.e.rainfall) is expected to increase from the current level of 400 billion m3 per annum to 441 billion m3 by 2030 and 471.9 billion m3by2050.However,evaporationisexpected to increase at an even higher rate from 323.5 billion m3 to 361.1 billion m3 in 2030 and 388.3 billion m3 in 2050. The net result is likely to be a slight increase inavailablewaterresourcesof7billionm3. This gain has tobesetagainsttheprojectedrise inpopulationfrom38.5 to 67.8 and 96.9 million in the same period - see Figure 3.2.
The results of these projections show that althoughtherewillbeaslightriseinthetotalamountofsurfaceand ground water resources over the next 40 years,availabilityperheadofpopulationwilldeclinefromthepresent level of around 1,990 m3 per year (2010) to 1187 m3/year in 2030 and 883 m3/year in 2050.
The followingfiguresand tablesshowthe relationshipbetweenthewaterresourcesavailablewithineachofthemaincatchmentsinKenya,anticipatedwaterdemandbycatchmentandthecurrentassumptionsaboutbalancingwaterdemandwithavailablesupply.Itwillbenotedthatthe Tana River Catchment is anticipated to have thelargestdemandforirrigationwaterat5.7billionm3 per annum, although the data suggests that the developed areaofirrigatedlandwillrequire3.6billionm3 per year by 2030.
Figure 3.2 Predicted Water Resources

TANA RIVER DELTA STRATEGIC ENVIRONMENT ASSESSMENT 2014 44
Figure 3.3 Renewable Water Resources by Catchment in 2030
Table 3.3 Water Demand in 2030

TANA RIVER DELTA STRATEGIC ENVIRONMENT ASSESSMENT 201445
Figure 3.4 Water Demand by Catchment in 2030
Table 3.4 Balanced Water Demands in 2030

TANA RIVER DELTA STRATEGIC ENVIRONMENT ASSESSMENT 2014 46
3.6 HydrologyIt has been clearly established through the scoping andbaselinesstudiesfortheTanaDeltathattheentireecosystem,togetherwiththeculture,humanwelfareandlivelihoodsof the102,000peoplewho livewithin theDelta, is inextricablylinkedtotheflowregimeofRiverTana.Whileflooding imposes risks forpeople living inlow-lyingareas, italsobringsnaturalsilt fertilisersandwaterasthelifebloodoftheDelta.Withoutannual(andpreferablytwoseasonannual)floodingtheDeltawilldryup and cease to exist.
ThewayinwhichtheHighGrandFallsDamisconstructedandfilledwillbecriticaltothelifeoftheDelta.Sincethedamhas a capacity to store the total runoffover oneyear from the upper catchment, itwill be essential toensurethatthedamisfilledoveranumberofyearstoavoid the river (and Delta) drying out completely during thefillingperiod.
Once the dam is filled and goes into operation itsprimaryfunctionwillbetoprovidepowerandwaterforirrigation.However, itwillalsoneedtobemanaged insuchawaythatartificialfloodscanbecreatedtwiceayear byopening the sluice gates and allowing enoughwatertoreachandfloodtheTanaDelta.
TheConsultingEngineerswhocarriedouttheFeasibilityStudy for HGFD have made it clear that all of these objectives cannot be satisfied by a single dam sincenormal use for hydro-power generation and irrigationrequires the daily release of large amounts of waterwhichcannotthenbestoredforfloodstimulationunlessaseconddamandreservoirarebuiltdown-stream.Thepurpose of the second dam is to trap the daily releases and re-store the water for alternative uses includingfloodsimulation.
The Consultants have assumed that the initialdevelopment of the High Grand Falls Dam can proceed without impacting on the lower Tana River providingthattheseconddamisbroughtintooperationby2027.However, there have been no technical or scientificstudies to prove that this assumption is correct. Allthe available evidence suggests the opposite, and the feasibilitystudy’sownenvironmentalanalysisconfirmsthattheDeltawillbeseverelyaffectedwithoutproperregulationofnormalandfloodflows.
3.8 BiodiversityIf the predicted developments outlined in previous sections come to reality the prognosis for the futurehealth of the rich natural resources of the Delta are not good, despite thedesignationof the entireDelta as aRamsarsiteofinternationalimportance.
The conversion of land from its natural state (grassland, scrubandwoodland)toagriculturalorintensivegrazingland will reduce the physical area of prime habitat –as is already occurring through the recent destructionofOnkolde Forest. Rare primates and other sensitivespecieswhichseektoavoidthepresenceofmanwillbeconfinedtoareasthatwillultimatelybecometoosmalltosupportviablepopulationsandextinctionwillfollow.The conversion of 30,000 hectares of grassland to provideintensivegrazingtogetherwith10,000hectaresinthefloodplaintosupporttheextra60,000peoplewillaggravate the existing conditions that impoverish thenatural environment.
Lossofnaturalhabitatwillgreatlyreducetheecosystemservices enjoyed by the existing population as grass,reeds, fruits and medicinal plants become less accessible.
PART TWO: NATIONAL SCENARIO 2 - CHANGES FROM 2030 TO 2050Attemptstoforecastpatternsofchangeupto2050arefraughtwithdifficultysincethesechangeswillnotoccurin avacuumbutwill be heavily influenced by popularand institutional reactions to events as they unfold.Nevertheless, it is important to explore the issues since the future of the Tana Delta needs to be considered in perpetuity–notjustfor20or40years.
3.8 PopulationDemographic experts expect the rate of populationgrowthtoslowbeyond2030,aspeoplebecomemorefamiliarwith thebenefitsof familyplanningand risingstandards of living lead to smaller household units in keepingwithother emergingeconomies.Neverthelessofficial forecasts indicatethat thepopulationofKenyais expected to rise from 67.8 million in 2030 to 96.9 million in 2050.
Given planned investment in the LAPSSET corridor, theLamusub-regionwillbeoneofthefastestgrowingpartsof thecountryandat3%growthperannumthepopulationofthewiderTanaDeltaareawouldrisefrom350,000 in 2030 to 614,000 by 2050. The equivalent rise in population in the Delta itself would be from174,000 to over 315,000.
3.9 LivelihoodsTheanalysissetoutinsection4.2.2showsthatby2030at existing population growth rates, 30% of the coredelta(20,000ha)wouldneedtobegivenovertocattlerearing to support only the pastoralist members of the communities. In addition, 2,500-5000 ha would needto be converted to agriculture to support the increasing

TANA RIVER DELTA STRATEGIC ENVIRONMENT ASSESSMENT 201447
farmingpopulation.Between2030and2050,continuedgrowthinpopulationwouldleadtoincreasingpressureonfiniteresourcesofland.ThecapacityoftheDeltatosustain its resident populationwould almost certainlybe reached, if not exceeded, by around 2040 – evenwithoutthe interventionofanyothertypeof landuse(i.e the conversion of land to commercial food and biofuelproduction).
In these circumstances, the only way that the entireincrease in population within the Delta (125,000people)couldbeaccommodatedby2050wouldbebyreducingthecurrentareaofgrazinglandandconvertingthis for intensive food production through communalfarming. The total area of land needing to be brought intoagriculturalproductionwouldbebetween10,000-25,000hectares.Thiswouldhoweverremovethesameamount of land currently used for grazing, leading to the need for yet more conversion in order to feed displaced pastoralist families.
Once the capacity of the Delta to feed its ownpopulationhasbeenexceededtheonlyoptionsforlocalcommunitieswouldbeoutwardmigrationor adoptionofnew lifestyleswith thewageearners ineach familymoving or commuting to Lamu and other industrialcentres.
3.10 Social WelfareTheconditionsoutlinedaboveinrelationtolivelihoodshighlight in stark terms the realities of assumingthat population growth can be allowed to continueindefinitelyintheDelta.Evenwithouttheinterventionofanyexternalformsofdevelopment,competitionforfoodandwateramongstthe inhabitantsoftheDeltawouldreach a crisis point long before 2050, based simply on the number of mouths to be fed. If other factors, like the increasing lossofproductive land fromrisingsea leveland reduction of freshwater to flush salts out of thecoastal soils, are taken into account, it is clear that the socialwelfareofalargesectoroftheDeltapopulationcoulddeterioratefurtherfromitscurrentunsatisfactoryposition.Seriousconflictwouldbecomeunavoidable.
3.11 Economic ActivityThepressuresoutlinedinprecedingsectionshavebeenfaced and are being faced in many other parts of the world and the short term solution lies in promotingindustrialandcommercialactivity,asoccurredinEuropeintheIndustrialRevolutionandhasbeendemonstratedbythe‘tiger’economiesofAsiaandemergingcountrieslike Brazil. However, as the search for places to growfoodwidens(asdemonstratedbytherecentinterestofMiddle East countries like Qatar in acquiring land in the TanaDelta),landwiththehighestpotentialtogrowcrops
willcomeunderincreasingpressureandwillbecomeofever increasing value.
If the economic vision for the new port of Lamu andthe transport corridors to Sudan and Ethiopia comes to fruition,thiswillgeneratehighpotentialfortheimportand export of awide range of commodities includingoil, food, textiles, machinery and other goods. It willalsotransformthecharacterofarelativelyremoteandundeveloped part of the country into an urban and industrialmetropolis.Thisnewcentrewilldemandwater,food and raw materials in competition with the localneeds of the Tana Delta and it is likely that the higher wages and commercial interests of the new citizenswill command greater purchasing power than residentcommunitiesintheDelta.
TheassumptionhasbeenmadeinVision2030,thattheRiverTana system is a largely unutilised resource thatcanbeconvertedthroughlargescaleirrigationprojectstofeedtherestofKenyaandtostrengthenthenationalbalanceof payments.However, to achieve these endsitwillbenecessarytodemonstratethatthechallengesoutlined in the previous paragraphs can be overcome and the livelihoodsof the indigenouspopulationprotectedand enhanced.
Thequestionthereforeneedstobeaskednow–whatlies in the best interests for Kenya and for the Tana Delta inparticular–intermsofthewaytheTanaDelta’slandandwaterresourcesareused?
3.12 Water Resources3.12.1 Water DemandItwillbereadilyapparentthatwaterdemandwillneedtobecurbedastheworld’sresourcesoffreshwaterareincreasingly utilised and this is most likely to happenthroughincreasingefficiencyinwateruseandrecycling.IfpopulationgrowthrespondstoGovernmentpolicyandisbroughtunder controlwithin thenext20years thiscouldhelplimitwaterdemandbutexpectationsintermsofsatisfyinghumanneedsforfood,goodsanitationandacceptable living conditionswill continue to raise theoverallconsumptionpercapita.
DraftpapersontheNationalWaterMasterPlan,2012,showthatwithoutseriousintervention,thepopulationin Kenya may have risen to 96.9 million by 2050. Climate change is expected to lead to increased rainfall and higher rates of evaporationwith the increases inprecipitation being slightly higher than losses throughevaporation. Increased use of ground water may alsoraisewateravailabilityforthecountryasawhole.

TANA RIVER DELTA STRATEGIC ENVIRONMENT ASSESSMENT 2014 48
Inthetimescaleof2050,demandsforfoodproductioncould raise the irrigationdemand in theTanaDelta toclose to itsmaximum potential of 5,702million cubicmetres of water a year. This equates with the totalstoragecapacityoftheHighGrandFallsDamandwouldnecessitate the building of further storage reservoirs in the Upper Tana Catchment. Other major waterconsumers including urban centres like Nairobi and the LAPSSETcorridorwouldinduceadditionaldemands
3.12.2 Water SupplyThe feasibility study for the High Grand Falls Dam considers atimescaleof40years and anticipates thatby2030 itwillbenecessary to raise theheightof theplanneddaminordertomeetcontinuallyrisingenergydemands.Italsoproposestheconstructionoftheseconddamandstoragereservoirtodistributewaterformulti-purposeuse.Referenceismadetotwootherpotentialdam sites in the upper catchment of the Tana River basin that could be developed once the capacity of the HGFD has been exceeded. 3.12.3 Water BalanceAll existing government policies make the case forsustainableuseofnaturalresources,includingwater,inaccordancewiththeConstitution;andyetanydescriptionofthelikelydemandsforwaterandsourcesofsupplyintheRiverTanaBasinmakesitclearthattheseconditionswill not be achieved without radical re-thinking ofboth the development strategies and management and controlofwater resources in the catchment.ThisSEAconcludesthatarealisticwaterbalancemodelneedstobeconstructed for theentire riverbasinwhichcanbeusedtotestalternativelong-termoptionsandformulateamorerealisticsetofnationalgoalsandobjectivesforwaterconservationanduse.
3.12.4 BiodiversityPreservation of the natural environment of the RiverTanacorridor (and theTanaDelta inparticular)will beextremely challenging, given the range of development proposalsthatareunderconsiderationfortheupperandmiddlereachesoftheriver,andthepotentialdiversionof water to service adjacent catchments. Two viewscanbetakenonthechangesthatcouldoccurbetween2030and2050,thefirst,apessimisticforecastandthesecond,amoreoptimisticview.
3.12.4.1 A Declining ResourceAtthepresenttime,nopartofKenyaissparedfromtheattacksonelephantsandrhinosbypoachers intentonsecuring horns and ivory, and this includes the LowerTana Delta where two KWS rangers were killed inshoot-outsclosetoKipiniinJanuary,2014.Overtime,themigratoryroutesbetweentheTanaDeltaandotherwildlife refuges are likely to come under increasing
developmentpressure,while thenaturalgrasslandandforesthabitatswithintheDeltaandTanafloodplainwillsuccumb to conversion to other land uses. This, in turn, will increasehuman–wildlifeconflict.Climatechangeandreductioninriverflowswilladdtoadverseeffectsonwildlife. Despite efforts to protect the Tana Delta,lack of political commitment and resources, combinedwithcontinuing tensionsbetween rival land-users,willultimatelyleadtothelossofthisinternationallyimportantwetlandandthehumanculturesandtraditionsthatareassociatedwithit.
3.12.4.2 An International Success StoryThe commitment and effort shown by the NationalGovernment in developing a land use plan for preservationoftheTanaDeltaanditscommunitieswillbesustainedand intensified in theyearsaheadby theCounty and National Governments. Despite workingthroughaperiodofsignificantlocalandnationaltensions,when many other pressing demands for resourcesexisted, Government has already set new standardsin conservation and in planning for the Tana Delta.Theseeffortswillbetransformedintoarobustlandusestrategy for economic and sustainable development on the ground. Community-led agricultural and ecotourism initiativeswillgeneratethefundstomanagethewildlifehabitats of the Delta, and exploitation of its naturalresources within sustainable limits will continue tosupport itscommunitiesandtheirdistinctive lifestyles.Development in the upper catchmentwill be carefullymanaged and regulated to ensure that good quality water is returned after use to the RiverTana and theenvironmentalreserveismaintained.Overtime,theTanaDeltawillbecomerecognisedasoneoftheinternationalsuccessstoriesintheconservationoftheworld’smostprecioushabitats,meetingtheneedsofitsowncitizenswhile also increasing the stature of Kenya as a globaltourismdestination.
3.13 ConclusionsRegardless of decisions that are made locally to protect andmanagetheTanaDelta,majorchangesintheDelta’senvironmental,socialandeconomicconditionsarelikelytofollowdevelopmentelsewhereintheRiverTanabasinand LAPSSET corridor. Most of these changes to the Delta willbeadverseunlessspecialmeasuresareintroducedtosecuresustainabledevelopmentelsewhereinthewiderregion. The Tana Delta Land Use Plan and SEA provide a modelexampleofhowtoaddresssuchchallenges,butthisapproachwillneedtobereplicatedthroughouttheTanaRiverBasinandinneighbouringCountiesinorderto deliver a sustainable future.

TANA RIVER DELTA STRATEGIC ENVIRONMENT ASSESSMENT 201449

TANA RIVER DELTA STRATEGIC ENVIRONMENT ASSESSMENT 2014 50
PART TWOASSESSMENT OF THE BASELINE (EXISTING SITUATION) AND THREE SCENARIOS

TANA RIVER DELTA STRATEGIC ENVIRONMENT ASSESSMENT 201451
Preamble
Levels of AccuracyScenariosspanningtimehorizonsof20and40yearsmustinevitablybebasedonverywide rangingassumptionsandthereisnosenseinwhichtheycanberegardedasgiving an accurate picture. Instead their purpose is to illustrate likely trends.
Many calculations have been employed in building upeach scenario. These are presented in great detail in the Tana Delta Land Use Plan. In each case the exact figures resulting from the calculation have been used– even though this may appear to give an unrealisticlevel of accuracy. However, rounding and averagingresultswouldhavemade the taskofcross-referencingbetweenthethreescenariosmoredifficultsothereadershouldbearinmindthatallfiguresarenomorethanverygeneralapproximations.
All of the information that has been included in thedescription of the scenarios has been assembled forthespecificpurposeofprojectingfuturechangeintheDelta. This has been done by taking firm informationabouttheDeltawhereverpossibleandextrapolatingto2030 and 2050. The results have also been tested by comparing findings from other published studies, as aformoftriangulation,andhavebeenfoundtobebroadlycompatibleforthepurposeofthisassessment.
While the resulting descriptions are regarded assufficiently accurate to meet the needs of the LandUse Plan and SEA they should not be transposed to other studieswithoutfirst checking thevalidityof theunderlyingassumptions.
IntroductionThis part of the SEA provides an assessment of the existingsituation in theTanaDeltaandconsidershowthe environmental, economic and social conditionsare likely to change under each of the three scenarios described in the land use plan. The assessment has involvedanalysingexistingandfutureconditionsagainstseven variables, or headline indicators, comprising:• Land • Water• Jobs• Value• Nature• Culture• Security
These one word headings above provide shorthanddescriptions for the seven indicators which cover allphysical,social,economicandenvironmentalconditions
in the Tana Delta and the River Tana Basin. A fuller definition is given below. Four of the indicators havetangiblevaluesattached,whiletheremainingthreehavelesseasilyquantifiedvalues.
Tangible (Measurable) ValuesLand–Referstotheamountof landwhich isrequiredfor any given activity together with an indication ofthe extent to which development or other activitiesare likely to change the original or current state of the land;inotherwordsthedegreeoftransformationfromits‘naturalorcurrent’statewhichislikelytooccur.Forexample,conversionofwetgrasslandwhichisgrazedbywild herbivores to a cattle ranchwill have a relativelysmall impact on the range of plant species present (providing grazing pressures and fertiliser / pesticideinputsdonotaltersignificantly)whereasconversionofthesamearea to intensive farmingwill largelydestroythe natural habitat. If a large rice paddy is created some indigenous bird species and reptiles may continueto inhabit the area, because rice is itself a grassland species, but conversion to an industrial crop like sugar canewould cause total transformationwith loss of allbiodiversity.
Land is measured in square kilometres (km2) or hectares (Ha). 100 hectares make 1 square kilometre.
Water–Provides a measure of water demand for thespecific land use or activity in comparison with thenatural state and examines the extent to which thisdemand could be met from available sources.
Water is measured in terms of million cubic metres (Mm3) consumed in a year, or supported by a flow incubic metres per second (m3/sec).
Jobs–Providesashorthandreferencetotwokeyissues.Thefirstistheassessmentofthenumberoffulltimejobs(FTEs)thatwillbecreatedbythenewactivitycomparedwiththeexistingsituation.Thesecondassessmentisameasureoftheextenttowhichexistinglivelihoodsandemployment is affected by the new development. Insomecases,newdevelopmentwillbehighlysustainablein preserving existing livelihoods while creating newemployment opportunities. A good example is eco-tourism.Inothercases,forexampletheintroductionofindustrial cropping, the new development may cancelout existing opportunities for subsistence farming,grazing and natural produce harvesting and the netresult may be no net increase in jobs and livelihoods or even an overall loss in employment.
Jobsandlivelihoodsaremeasuredintermsofafulltimesource of employment over one year (I FTE).
TANA RIVER DELTA STRATEGIC ENVIRONMENT ASSESSMENT 2014 52
Value - TheSEAhasnotattemptedtoundertakeacost-benefitanalysisofindividualactivitiesanddevelopments,since thiswould requiremuch greater certainty aboutthetypesofoperationthatmaybeplannedinthefuturethan currently exists. However, it is important whenweighing up the relative merits of different optionstoprovidesome indicationof the scaleof investment,turnoverorfinancialyieldwhichmightbeexpectedandthishasbeendoneforeachactivity.
Value is measured in terms of the gross capital investment inUSDollarsforaparticularenterprise,orgrossvalueof stock or gross turnover or output in produce in a particularyear.
Less Tangible ValuesEachofthefollowingindicatorsiscoveredbydescriptiveassessments of value:
Nature – This term embraces the natural environment andcurrentconservationvalueofthehabitatsthatmakeup this extraordinarily rich ecosystem. These values are harder to measure than other indicators because more variables are involved in terms of the physical extent of a habitat, its current ‘condition’, its inter-linkageswithother parts of the ecosystem and its sensitivity andvulnerability to different pressures. Within individualhabitats, and often spanning other habitats and
ecosystems, are individual species of plants and animals whichmaybeveryrareandequallysensitivetochange.Consequently,when assessing potential change in theTana Delta it is also necessary to have regard to the dispersal and migration of plants, animals and birdsby land, air andwater, not onlywithin the region butinternationally.
Culture –Socialwell-beingandculturalissuesareboundupwiththewayinwhichcommunitiesseethemselvesand their future prospects. All aspects of daily life including use of land, access towater, livelihoods andemployment and the status of the natural environment are important to a community’s sense of self-respectand status, but other elements, including spiritual values, traditions and beliefs lie at the heart of most humansocieties and need to be respectedwhen consideringfuture change.
Security –TheextenttowhichanactivitysupportsorisinconflictwithotherlanduseactivitiesandwithsocialandculturalnormsisofcriticalimportanceinareasliketheTanaDeltawheretherehasbeenalonghistoryofinter-ethnictensionsoveraccesstolandandwater.Securityis used as a term to capture the overall sense of security in communities and their freedom fromoppression orexternal challenges. It also encompasses the concepts of goodgovernance,lawandorderandpeace.

TANA RIVER DELTA STRATEGIC ENVIRONMENT ASSESSMENT 201453
CHAPTER4 Assessment of Existing Situation
4.1 LandIn order to assist in developing Scenarios, a summary of relevant informationabouttheexistingconditionswascompiled.Table 4.1 and Figure 4.1 shows a simplifiedbreakdownofthemainvegetationandlandcovertypesthatmakeupthePlanAreawhileFigure4.2showsthesame information, together with land use classes, inmore detail. These diagrams illustrate that many needs are met from the same basic resources. The strategic environmentalassessmentofScenariosA,BandCshowsveryclearlythatifonelanduseisallowedtodominateoverothers,thenallwillultimatelysuffer.
Figure 4.2 highlights the importance of tree cover withinthePlanAreawhichextendsfromdenseriverineforest,openwoodlands, thicketsandscrub through tocoastalmangroves.Thesevegetationtypes,whentakentogether,amounttoalmosthalfoftheentirePlanarea.Thefloodplaingrasslandsandareaswhicharenominallyin use for all types of agriculture each take almost a quarterofthetotalarea,withsanddunes,openwaterandurbanareasaccountingforlessthantenpercentofthe total.
In the Tana River Delta land use plan further analysis hasbeenundertakenoftherangeofdifferentlandusesand economic activities considered in Scenarios A, BandCinordertoassesshowdependenttheirsuccessfulexploitationisonthreekeyfactors:• Availability of land•Availabilityofwater• Environmental Quality
IntroductionThis chapter assesses the sustainability of the current situation in the Tana Delta Plan Area (as summarised in Chapter 3) and acts as a ‘baseline’ against which the assessments of Scenarios A, B and C in the following chapters can be compared.
Simplified Vegetation/ Land Cover Area (Km2) Forests, Thickets, Scrub, Mangrove 1,078 Agriculture 524 Floodplain grassland 508 Dunes 103 Water areas, Salt ponds 23 Urban 14 Total 2,250
14 23
103
524
508
1078
Urban Water Areas, Salt ponds Dunes Agriculture Floodplain grassland Forest, Thicket, Scrub, Mangrove
Table 4.1 Simplified Vegetation and Land Cover in the Tana Delta Plan Area
Figure 4.1 Simplified Vegetation /Land Cover Zones with the Plan Area
Source: Tana Delta SEA, 2014
Source: Tana Delta SEA, 2014
The results are shown in Figure 4.3. This analysisshows that availability of land is critical for all formsof agriculture, livestock rearing, natural resource use (including charcoal and fuel wood), nature protectionanddevelopmentofsettlements.Itislessimportantforbeekeeping,fisheries,tourism,industryandcommerce.Access to water is essential for agriculture, livestockrearing,fisheries,settlementsandnatureconservation.Otherusesalsorequirewaterbutitisnotneededinlargequantities.Finally,adifferentsetoflandusesarehighlydependent on high quality environmental conditionsincluding bee keeping, fisheries, natural resourceproduction, tourism and settlements. It is significantthat theone landusewhich isdependentonall threeresources isnatureprotectionandthemaintenanceofbiodiversity.

TANA RIVER DELTA STRATEGIC ENVIRONMENT ASSESSMENT 2014 54
Land Use / Economic Activity
Land Water Environmental Quality
Subsistence Farming Commercial Farming Livestock Rearing Bee Keeping
Fish farming Non Timber Forest Products (NTFP) Use
Charcoal & Fuel Wood Tourism Nature Protection /Use Settlements Industry / Commerce Trading / Marketing
Figure 4.3 Importance of Land, Water and Environmental Quality to Specific Land Uses
Importance of the resource to sustainable development 1 star = low; 5 stars = high
Source: Tana Delta SEA, 2014
Source: Tana Delta SEA, 2014
4.2 WaterFigures 4.4 and 4.5 and Table 4.2 show the existinglevelsofwateruseanddemandwithintheTanaDelta.The largest single use of water is in maintaining thenaturalconditionoftheDeltaandisreferredtoastheenvironmental or ecological reserve. This has been
estimated at 59m3/sec for the areas ofwet grassland,which equates to the mean flow in the River Tana.Historically, the Delta floodplainwas inundated twicea year during the rainy seasons, but the frequency of this typeoffloodinghasdecreasedwithdevelopmentof storage reservoirs in the Upper River Tana Basin.
Figure 4.4 Existing Water Use in the Tana Delta (Excluding the Environmental Reserve)

TANA RIVER DELTA STRATEGIC ENVIRONMENT ASSESSMENT 201455
Consequently, there are extended periods when theTana Delta receives less water than it requires tomaintainthehabitatsandparticularlywetgrasslandsinoptimumcondition.Duringdryseasons,flowsof freshwaterintheRiverTanacandropsolowthatsalinewateriscarriedbyhightidesuptheriverchannelformorethan30 kilometres from the sea (Hamerlynck, 2012). Under these conditions, land used for livestock grazing andfarmingcanbeadverselyaffectedbytheaccumulationof salts in the soil.
4.3 JobsFigure 4.6 andTable 4.4 illustrate the estimate of thecurrentnumberof jobsor livelihoods thatexistwithinthe Tana Delta. The largest component of 12,400 (41.6%) isprovidedbysubsistencefarming,followedby10,600(35.5%)innaturalresourcesharvestingandtherelatedactivitiesofcharcoalmaking, fuelwoodcollectionandhouseconstruction.Otheractivitieswithsignificantjobcreation include cattle herding, trade and commerce.Theestimatedtotalnumberoffulltimejobequivalents(FTEs)of29,827compareswith theproportionof theexistingpopulationfallingwithintheeconomicallyactiveageclasswhichis52,020people.Thissuggeststhattheeffectivelevelofunemploymentis57%.
Figure 4.5 Existing Water Uses in the Tana Delta including the Environmental Reserve
Source: Tana Delta SEA, 2014
Land Use Activities M3/sec Open Grazing 0.49 Ranches/Commercial Grazing 0.00 Subsistence Farming 0.00 Commercial Farming 0.09 Rice Farming 0.00 Intensive Vegetable Farming 0.00 Extensive Vegetable Farming 0.00 Sugar Production 0.00 Fruit Farming 0.00 Fishing 0.00 Beekeeping 0.00 Natural Resources 0.00 Housing 0.00 Charcoal and Fuel Wood 0.00 Oil and Gas 0.00 Heavy Mineral Sands 0.00 Industry and Manufacturing 0.00 Trade, Commerce and Finance 0.00 Construction 0.00 Wholesale and Retail Trade 0.00 Tourism 0.00 Professional Services 0.00 Public Administration 0.00 Nature Conservation 59.01 Urban Development 0.00 Domestic Water Use 0.02 Totals 60.00
Table 4.2 Existing Water Uses in the Tana Delta
Source: Tana Delta SEA, 2014

TANA RIVER DELTA STRATEGIC ENVIRONMENT ASSESSMENT 2014 56
Figure 4.6 Existing Jobs/ Livelihoods within the Tana Delta (2010 Estimate)
Figure 4.7 Value of Land Use Activity in 2010
Source: Tana Delta SEA, 2014
Source: Tana Delta SEA, 2014

TANA RIVER DELTA STRATEGIC ENVIRONMENT ASSESSMENT 201457
4.4 ValueFigure 4.7 andTable 4.3 show the estimatedvalue ofall land use activities in theTanaDelta in 2010. Thegrossvalueisshownas3.7billionKSh,butthisfigureisdeceptiveinthatthemajorelementrepresentsthevalueatmarketratesoftheentirecattlepopulation,althoughless than ten per cent of these animals are traded in any one year. In consequence, the actual value of the local economywillbecloserto1.5billionKSh.
4.5 NatureThecurrentconditionoftheTanaDeltafullyjustifiesitsstatus as a Ramsar site and one of the key hotspots for BiodiversityinKenyaandthewholeoftheEastAfricancoast. This status has been described more fully in theSEABaselineReport andChapter3,TheSituationAnalysis in this report.
Threats to the special character of the Delta stem from reductioninfloodflowsandoverallavailabilityofwaterto maintain floodplain habitats, conversion of land toother uses including, principally, farming, degradationthrough excessive grazing and harvesting of naturalresource materials. These issues are picked up under the assessment of individual scenarios.
4.6 CultureThe biological diversity and richness of the Tana Delta is matched by the cultural identities of the differentethnicgroupswhograzelivestock,farmandcatchfishorharvestnaturalproducewithinitsboundaries.However,thewell-beingandsurvivalofthesedistinctiveculturesisthreatenedbytheincreasingdifficultyofmaintainingsufficient income, food and water from the naturalresourcesoftheDelta inthefaceofrisingpopulation,and pressures on the same resources in the upper sectionsoftheRiverTanaBasin.Animportantquestionfor this SEA is the extent to which maintenance ofindividual culturewill be compatible in the long termwiththeneedfordevelopmentintheDeltatoprovidewaterandfoodsecurity.
4.7 SecurityIssues raised under the heading of culture applywithequalforcetothequestionsofsecurityandthemeasuresthatwill need tobe taken to reduce the existinghighlevelsoftensionthatarisefromtimetotime,particularlywhen competition forwater and land for grazing andagriculturespillsoverintoviolenceandphysicalconflict.
Land Use Activities Existing Open Grazing 1,736 Ranches/Commercial Grazing 2 Subsistence Farming 12,409 Commercial Farming 77 Rice Farming 0 Intensive Vegetable Farming 0 Extensive Vegetable Farming 0 Sugar Production 0 Fruit Farming 0 Fishing 575 Beekeeping 140 Natural Resources 4,971 Housing 633 Charcoal and Fuel Wood 4,971 Oil and Gas 0 Heavy Mineral Sands 0 Industry and Manufacturing 0 Trade, Commerce and Finance 3,488 Construction 0 Wholesale and Retail Trade 600 Tourism 200 Professional Services 5 Public Administration 0 Nature Conservation 20 Urban Development 0 Domestic Water Use 0 Totals 29,827
Table 4.3 Value of Individual Land Use Activities in 2010
Source: Tana Delta SEA, 2014

TANA RIVER DELTA STRATEGIC ENVIRONMENT ASSESSMENT 2014 58
CHAPTER5 Assessment of Scenario A
IntroductionScenario A assumes that there will be continued development of traditional livelihoods within the Tana Delta over the next forty years. This development will need to accommodate continuing growth in population, although the stage will ultimately be reached beyond which the natural resources of the Delta become inadequate to support this local population, let alone any land uses that are intended to serve the wider needs of Kenya.
5.1 Assessing impacts on and Related to Land
5.1.1 IntroductionFigure 5.1 provides a breakdown of the existingdistribution of vegetation and land cover within theDelta plan area.
The predominant uses of these areas are for grazing livestock, subsistence farming and gathering natural resource products. In terms of future development these three typesofusewoulddominate the localeconomyunder a strategy of supporting traditional livelihoods.TherearestrongaspirationswithinthePokomoandOrmacommunitiestoincreasetheirownspecialistactivitiesinfarming and livestock rearing, but as the analysis reveals
Figure 5.1 Existing Vegetation and Land Cover in the Tana Delta
Source: Tana Delta SEA, 2014
below, there arefinite limits to the scope forbringingnew areas of landwhich is currently under-used intoproduction.Livestockrearingisconcentratedonthewetgrasslands of the floodplain,while permanent farmingtakes place close to the main river channels. All areas of theTanaDeltaprovidenaturalmaterialswhiletheareasof thicket and scrub on the terraces are experiencing the highestrateofconversionthroughsquattersettlement.
5.1.2 Population Growth and LandTheimplicationsofpopulationincreasearecrosscutting.Manyoftherequirementsforadditional landrecordedunderdifferenttypesoflanduseactivityaredrivenbypopulationgrowthandtheconsequencesarerecordedundereachactivityinturn.

TANA RIVER DELTA STRATEGIC ENVIRONMENT ASSESSMENT 201459
5.1.3 Livestock and LandThe Tana Delta is already functioning at close to itsnatural capacity in terms of the number of livestock that can be accommodated in the dry seasons. However,in order to test the resilience of the natural ecosystem and establish at what stage a breaking point wouldbe reached, Scenario A assumes that cattle numberswill continue to increase in direct proportion to thenumberofnewpastoralist householdsbeing added tothepopulationintheDeltaeachyear.Onthisbasis,thenumberofresidentcattlerequiredtomaintainthestatusquo in termsof animals per householdwouldhave torise from 211,000 a year (2010) to 357,000 in 2030 and over 645,000 in 2050 (Odhengo et al, 2014b).
Distribution of cattle within the Delta in 2010 wasassumed to be 2.1 cattle per ha in the floodplain(100,000 x 2.1= 210,000). However, this capacitycannot be exceeded without permanent damage tothewet grassland, so any subsequent increasewouldneed to be met in the thicket and scrub of the terraces wherethecarryingcapacityhasbeenassumedtobeoneanimal (cow)tothreehectares (Odhengoet al, 2014b). Iftheentireareaofthethicketandscrublandusezoneweretobegivenovertocattlegrazingthiswouldallowgrazing for 13,333 animals over 40,000 ha indicatingthat the maximum size of the permanent herd in the Delta could not exceed 225,000 head (Odhengo et al, 2014b). It should be noted that use of all areas of thicket andscrubforlivestockrearingwouldhaveasignificantimpact on the existing population in these areaswhocultivatesmallunfencedpatchesofgroundastheirmainlivelihood.Inpractice,muchofthefloodplaingrasslandbecomes waterlogged and unsuitable for cattle (andother livestock) during the rainy seasons, so during these periods permanent herds have to be moved onto the terracesandintotheDeltaBufferZone.
Anyfurtherincreaseinthesizeofthepermanentcattleherd could only be achieved by taking over existingfarmland.Whilethisisclearlyanimpracticaloption,thequestionhasbeenasked“whatwouldbetheeffectofconvertingallareascurrentlyusedforwetlandfarming(12,300 ha) and dryland farming (370,000 ha) back to grassland?” The answer is that this would providesufficient grazing to allow a further 26,000 cattle inwetlandareasand123,000cattleindrylandareastobeadded to the permanent herd giving a total of around 360,000 animals (Odhengo et al, 2014b).
These calculations show that, ignoring all other landuse interests, themaximumsizeofapermanentcattleherd in theDeltawouldbe reachedby2030,but thiswouldbeattheexpenseofdisplacingallexistingusersof thicketandscrub,andwetlandanddrylandfarming
areas; in other words all farmers (more than half thepopulation)wouldlosetheirlivelihoodsandbeforcedtoleave the Delta.
Taking into consideration the parallel needs foradditional land to be allocated for farming and cropproductioninordertofeedtheother50%oftherisingpopulationwhorelyonagricultureratherthanlivestockfor their livelihoods, it is clear that there is noway inwhicheitherallofthethicketandscrub,orindeedanyareasofexistingfarmland,couldbeconvertedtocattlegrazingwithoutcausing:1) Widespread food shortages,2) Massive social unrest.
Theevidenceisclearthatthepermanentcattleherdinthe Tana Delta has already reached its maximum size andeveryeffortshouldnowbemadetodiscourageanyincreaseincattlenumbers.Inthelightofthesefindings,a variant (A1) of Scenario A was introduced whichassumesthatcattlenumberswillremainstatic.
5.1.4 Agriculture and Land5.1.4.1 Subsistence FarmingThe demand for land for cattle rearing is matched byan equally strong demand for land for subsistence and commercialfarming.Undertheexistingsituation,ahighproportionof thepopulation in theTanaDeltadonothave enough food to eat and around 15% are dependent ongovernment foodaid tosupplementwhat theycangrow on their own land (Odhengo et al, 2014b). With eachgeneration,landinprivateownershipissubdividedbetween the children (sons) and the stagehas alreadybeen reached atwhich the average household plot ofland is only 1.5 acres (0.6 ha) (Odhengo et al, 2014b).
Ontheassumption that,with risingpopulation, futurehouseholdswillrequireaminimumof1.5acres(0.6ha),the amount of land under subsistence farming wouldneed to increase from the present level of 62km2 to 104km2 in 2030 and 189km2 in 2050 (Odhengo et al, 2014b).Toputthesefiguresinperspective,thecurrentareas of subsistence farming represents only 2.8% of the Delta. Growth of subsistence farming by 2030wouldleadtothispercentageincreasingto4.6%,andby20508.4%oftheDeltawouldneedtobeconvertedtosubsistence farmland (Odhengo et al, 2014b).
Inordertoprovideforfullself-sufficiencyinfooditwouldbe necessary to allocate 3 acres (1.2 ha) rather than 1.5 acres per household. This would result in increaseddemand for the conversion of land to subsistence farming of 502Km2 (22.3% of the Delta) by 2030 and 909 km2 (40.4% of the Delta) by 2050 (Odhengo et al, 2014b).

TANA RIVER DELTA STRATEGIC ENVIRONMENT ASSESSMENT 2014 60
5.1.4.2 Communal FarmingIndividual subsistence farming forms only a small part of overallagriculturalactivityandlargerareasarecultivatedbyindividualfarmersandcommunitygroupsinthewetland and dry land farming areas. These currently account foranestimated123km2 (5.5 % of the Delta) and 370 km2 (16.4%of theDelta) respectively (Odhengoet al, 2014b). Further expansion of both of these areas can be anticipated under Scenario A. Based on pro-rataincrease with rising population, the area of wet landfarmingwouldincreaseto209km2 by 2030 and 378km2 by2050,while the dry land farmingwould expand to626km2 in 2030 and 1134km2 in 2050.These figuresarebasedonlyon thepro-ratademand thatwouldbegenerated by population growth and do not reflectwhetherthelandisactuallyavailabletomeettheneed,whichisassessedinthesummarybelow(Odhengoet al, 2014b).
5.1.4.3 Commercial FarmingOnly a small area of land in the Delta is farmed commercially by TARDA. The current cropping area is less than 20km2.Thisareawouldnotexpandunderthetraditional livelihoodsapproachexplored inScenarioA(Odhengo et al, 2014b).
5.1.4.4 IrrigationOneofthekeyissuesfortheTanaDeltaishowtomaketheuseofexistingfarmlandmoreproductive.Thiscanbeachievedbyincreasingtheuseoffertiliserandotherinputs, improving crop strains and increasing access to water in thedry seasons. Irrigation constitutesoneofthe ways of increasing food production by improvingyields(provisionoftherequiredadditionalwatercoulddoubleoreventreblemostcropyields)andbyallowingtwo or more crops to be grown each year. There istherefore a strong case for exploring opportunitiesfor appropriately sized local irrigation schemes.UnderScenario A, the present area of irrigated land (385ha) wouldbeincreasedto1000haby2030andtoatotalof2000ha by 2050 (Odhengo et al, 2014b). This amount of landcouldbefoundwithintheareasalreadyaffectedbyprevious infrastructure development.
5.1.4.5 Summary of Agricultural DevelopmentThe cumulative effect of expanding subsistence andcommunalfarmingareasasoutlinedabovewouldresultin 1337 km2 of agricultural land (59.4% of the Delta) by 2030 and 2421 km2 of agricultural land (108% of the Delta) by 2050 (Odhengo et al, 2014b). Previous assessmentshave shown that themaximumcultivablearea of the Delta is unlikely to be more than 1125km2 (50%)oftheDelta(Hamerlynck,2010).Inaddition,30%of the Delta is regularly inundated by flooding and afurther 50% consists of protected areas and gazetted
forests (Hamerlynck, 2010). Consequently, the threshold of agricultural development in terms of available land areawouldbe reachedbefore2030,while thegrowthpredictedto2050wouldbesimplyimpracticableevenifnootherfactorswereinvolvedindecisionsaboutfutureland use. Just as uncontrolled increase in the size of thecattleherdwoulddisplacefarming,souncontrolledexpansion of agriculture would decimate livelihoodsbased on livestock rearing.
ThescaleofthechallengesfacingtheexistingpopulationintheTanaDeltaareverygreatwithoutevenconsideringotherdemandsforlandwhicharegeneratedbyoutsideinterests, including foreign investors, government agencies and private companies. At the core of the issues on land allocation is the fact that land suitablefor grazing is also suitable for some types of farming (although these are limitedbynaturalflooding).Theseareas ofwet grassland also have some of the highestvalues in terms of biodiversity.
Conclusions and Recommendations: In considering the options that are open for managing agriculturalland use the SEA draws a number of conclusions andrecommendations:1. Continued growth in population must have a
finite limitandwithoutanyother intervention it isestimatedthatthesustainablethresholdliesarounda population of 170,000whichwill be reached atcurrentgrowthratesby2030.
2. Ifpopulationgrowthcannotbecontained,outwardmigration will need to be encouraged for thoseresidents who are economically active to growthcentres like the port of Lamu and other parts of theLAPSSETcorridorwhereemploymentmightbeavailable.
3. Anagreedformulaforsharinglandbetweenfarmersand pastoralists needs to be at the heart of the land use strategy in the Delta.
5.1.5 Urban and Rural Development and LandThere is a low level of urbanisation in theDeltawithlessthan5%ofthepopulationcurrentlylivingintowns(Odhengo et al, 2014b). But a fast transformation isunderway;forexampleGarsenisexpandingrapidlyandhas been designated as the second settlement (afterHola) in Tana River County. Witu is also expanding in Lamu County.
Urban Areas: Projections for population growth andhouseholdformationindicatethatthecurrentareathatmaybeclassifiedasurbanwhichamountsto26km2willrise to 45km2 by 2030, and 80km2 in 2050 (Odhengo et al, 2014b).Theareasofgrowtharelikelytobeconcentratedonestablishedcentreswhichalreadyhaveservicesand

TANA RIVER DELTA STRATEGIC ENVIRONMENT ASSESSMENT 201461
infrastructure, namely Garsen, Tarasaa/Ngao, Kipini and Witu.Frominitialinspectionthereshouldbenodifficultyinallocatingsufficientlandineachlocation.Howeveramajorchallengewithalllanduseallocationsarisesfromthe likelihood that squatters may set up permanenthomeswithintheintendedgrowthareaslongbeforethelandisneededforexpandingpopulation.
Conclusion and Recommendation: The SEA concludes thatmuchstrongerregulationandcontrolneedstobeexercised over allocated urban site areas to prevent squattingandunauthoriseddevelopment.
Rural housing: The existing distribution of ruralsettlements in the lower Delta is strongly influencedby the hydrological conditionswhich existed over theprevious 50-100 years (Hamerlynck, 2010). More than 30ofthe106villageswithintheplanareaare locatedalongtheformermaincourseoftheRiverTana,whichhasnowbeendowngraded to a secondary channel asa result of the Matomba Brook diversion opened in the late1980s.Expansionofthesevillageswillundoubtedlyoccurbutthequestionsthatwillneedtobeaddressedasthepopulationgrowsareasfollows:1. How will these villages provide themselves with
sufficient land for subsistence farming given thatthere are existing pressures from the density ofpopulationalongthiscorridor?
2. Are there any practical solutions which could beoffered to supplement the declining flows in theformer main river channel during the dry season whichisaseriouslimitationoncropyields?
3. Howshouldthesevillagesrespondtotherisinglevelsofsalinityinsurroundingfarmlandwhichiscausedbyreductioninfreshwaterflowsandincreasedtidalrangestimulatedbyglobalwarming?
These issues will require detailed research but ifconditionscontinuetobecomebothmorecomplexandmoreextremeitmaybenecessarytoexplorerelocationof some communities. Part of the pressure might berelieved if an active programme was put in place toencouragesomenewlyforminghouseholdstodevelopnew areas rather than physically moving existingsettlements.
Elsewhere in the Lower Tana Delta there are severalisolated communities which have been created inseasonally flooded grassland. These settlements willusually have been formed as temporary shelter whilegrazing livestock but have become semi-permanent (Nyunja, 2013).
Conclusion andRecommendation:There are clear andjustifiedreasonswhysettlementshavealreadyemergedinisolatedareasofthefloodplain.However,asageneral
principle, formation of new isolated settlements inareasofhighfloodriskshouldbeactivelydiscouraged.Thisrecommendationismadepartiallyonthegroundsof health and safety, partially to protect the viabilityof other land uses including biodiversity but also in recognition that supporting isolated settlements withinfrastructure and services is very much more expensive thandevelopingthosevillageswhicharealreadyclosetothemainroadnetwork.
Village location has been greatly influenced by pastflooding events and more than half of all villages inthe Delta have been relocated at least once in their history.Itwouldbedesirableforallnewsettlementstobe locatedonhighergroundwithintheterraceswhichfringetheTanaDelta,providingeconomicactivitiesandlivelihoods can be developed and enhanced.
5.1.6 Fishing and LandTodate,pressuresonlanduseandaccesstolandwithintheDeltahavenothadamajor impacton freshwaterfisheries. However, diversion and storage of waterin the Upper River Tana Basin has severely affectedriverflowsandtherechargeofnaturaloxbowlakes.Infuture, uncontrolled migration of people encouragedby LAPSSET and other developments, including the erroneous assumption that there is ‘free land’ at thecoast, could all reduce the availability of suitable areas forfishing.
There are very rich fisheries in the Bay of Ungwana(Formosa) and these are exploited to a limited extent byfishermenfromKipini.Howeveramajorconstraintisthe lack of any harbour facility at the mouth of the River Tana,theverydynamicenvironmentintheestuarywherehigh tides and storms are increasingly causing coastalerosion;andthechallengesoftakingsmallcrafttoseathrough the surf zonewhich is often rough especiallyduring themonsoon season.Commercial fishingboatscurrentlystopatarockyisletwelloffshore.
Conclusion and Recommendation: A land use policy/planning statement should be developed to protect existingfishingareasandtoencouragethedevelopmentoffishpondsor artificial lakes.Finding theappropriatelandshouldnotbeasignificantconstraintprovidingitiscarried out before 2020.
5.1.7 Beekeeping and LandThereisnoprobleminfindinglandonwhichtoestablishbeehivesatpresentandtherearemajoropportunitiestoextendtheareasinwhichbeekeepingispracticed.
Conclusion and Recommendation: The continuedproductivity and health of bees will be dependenton maintaining suitable forage crops including nectar
TANA RIVER DELTA STRATEGIC ENVIRONMENT ASSESSMENT 2014 62
bearing trees and leguminous crops and protectingforest areas fromdamaging activities likeover-grazingandcharcoalproduction.
5.1.8 Natural Resources and LandThe natural resources of Tana Delta are already under pressurefrom landtransformation, includingreductionin the total area of forest, thicket and scrub from burning and felling to create additional farmland and fromincreased grazing.
The existing situation analysis suggests that an areaof between 55-85 km2 of scrub/thicket, forest and woodland is required in order to produce the currentamount of charcoal and fuelwood sustainably. Withrisingpopulation this levelwould increase tobetween96-150km2 by 2030 and to 174-271km2 by 2050. (Odhengo et al, 2014b).
Giventhatexistingproductionlevelsarealreadyleadingtosignificantdeteriorationinthequalityandconditionof all woodlands and wooded habitats within theDelta, it is clear that the situation would deterioratevery significantly by 2030. Continuation of the trendto 2050 would undoubtedly destroy most of theseimportanthabitats.Inpracticeapointwouldbereachedwherethelossofbiomasswouldmakeitimpossibletosustain production levels.This point could be reachedwithinonetotwodecades.Howeverevenifproductionlevels started to decline the opportunity for natural regeneration of wooded habitats could have beenseriouslyweakenedby lossofseedbearingplants,soilqualitydeterioration,soilerosion,etc.
5.1.9 Trade, Commerce, Finance and LandLand is not an issue in relation to these economicactivitiesatpresent.
5.1.10 Tourism and LandLandisnotanissueatpresentbutthiswouldchangeovertheplanperiodunderScenarioA.Significantpopulationgrowthwillleadtoexpansionintheareasofcultivation,extensionof grazing land and increasedproductionofnatural resources (principally fuelwood), resulting inincreased pressures on remaining habitats and loss of biodiversity.Under these conditions the prospects forexpanding tourism based on the Delta’s exceptionalenvironment would be very limited. However, lookedatinamoreoptimisticlightandassumingthataproperbalancecanbestruckbetweentheneedsofagriculture,livestockandnaturalresourceuse,theDeltawouldofferanexcellentopportunityforpromotingecotourism.ThisoptionisexploredseparatelyinScenarioC(theHybrid).
Conclusion and Recommendation: Ecotourism has considerable potential to create new livelihoods andemploymentandshouldbeactivelypromotedundertheTana Delta Land Use Plan.
5.1.11 Industry, Mining and LandSalt recovery takes place in a small area of the Tana Deltaandthereareotherareaswhereseawatercouldbe evaporated to provide salt although this wouldinevitablyhaveimplicationsforotherlandusesandthestatusofmangroveandothersensitivemarinehabitatinthe coastal zone.
Conclusion and Recommendation: The SEA considers thattheexistingsaltextractionworkscanbemanagedwithin theecosystembut any increase in surfaceareashould be considered very carefully and should only be authorisedafterafullenvironmentalimpactassessmenthasconfirmedthatitseconomicvaluewouldoutweighanyadverseenvironmentaleffects.
5.1.12 Biodiversity and LandAnalysisofcompetinglandusepressuresshowsthattheexceptionalrichnessofbiodiversityintheDeltaismostat risk from:• conversion of wet grassland to food production
areas,• conversion of thicket and scrub to dry land (rain fed)
agriculture,• excessive grazing,• loss of forest, mangrove and other key woodland
habitats through conversion and unsustainable naturalresourceharvesting,
• adeclineinoverallwatersupplytotheTanaDelta,bothintermsoftheextentanddurationoffloodingand increased stresses created during the dry seasons.
If the sequence of events outlined for other land use activitiesbecomesarealityitisclearthattheDeltawilllose a significant proportionof its primary habitats by2030anditisarguablethatatsomepointbetween2030and 2050 itwould no longerwarrant its status as aninternationallyimportantwetland.Table5.1summariseswherethemainimpactsarelikelytooccurifpopulationgrowthandlandconversionandtransformationremainuncontrolled.
Thetableshowsonlythe likelyeffectsofuncontrolledagriculturalexpansion,which includesthe lossofmostexistingforestareas(downto18%ofcurrentcover),thereductioninfloodplaingrasslandtohalfitscurrentsizeand the virtual total loss of areas of thicket and scrub on the terraces.

TANA RIVER DELTA STRATEGIC ENVIRONMENT ASSESSMENT 201463
Equally significant would be the pressures fromincreased grazing and foraging for natural resources on the remaining habitats.
5.2 Assessing Impacts on and Related to Water5.2.1 IntroductionAlleconomicandlanduseactivitiesgenerateaneedforwater somewhereor have impacts onwater, land andlivelihoods, but in strategic terms the focus needs to be placed on the main demand generators. In Tana Delta, 5 out of the 14 land use categories dominate the issue of waterdemand;theseare:• growthinpopulation,• livestock rearing,• agriculture,• irrigation,and,• biodiversity.
See Figures 5.2 and 6.3 and Table 5.2
Table 5.1 Potential Impacts from Expansion of Agriculture and Urban Areas on Important Habitats by 2030 and 2050
Source: Tana Delta SEA, 2014
Table 5.2 Scenario A- Daily Water Consumption in M3/day for Main Land Uses
Source: Tana Delta SEA, 2014

TANA RIVER DELTA STRATEGIC ENVIRONMENT ASSESSMENT 2014 64
Figure 5.2 Daily Water Demand for Main Land Use Activities
Figure 5.3 Water Demand for Land Use Activities (excluding Nature Conservation)
Source: Tana Delta SEA, 2014
Source: Tana Delta SEA, 2014

TANA RIVER DELTA STRATEGIC ENVIRONMENT ASSESSMENT 201465
5.2.2 Population and WaterUnder Scenario A opportunities to improve watersuppliestoisolatedcommunitieswouldberestrictedbythe low levelofeconomicactivityand lackof fundingfor infrastructure.With rising population, competitionforwaterwouldincrease.Traditionalsourcesofwaterinthedryseasons,includingwellsdugindryriverchannelsand depressions,would be exposed to higher risks ofcontamination and pollution from both animal andhumanwastes.Urbanareaswouldbe less exposed torisksofwaterpollutionthanruralcommunities.
5.2.3 Livestock and WaterLivestockarenotoneofthelargestconsumersofwater,but the need for animals to be herded to drinking points onadailybasishasbecomeoneofthemostcontentiousissuesdividingthepastoralistandfarmingcommunities.Thisisbecausecattle,goatsandsheepinvariablystrayfrom the drove roads and are attracted to the richervegetationandcropswithinfarmingareas,thuscausingdamage to standing crops. This is probably the single most important cause of conflicts within the delta,coupledwithcompetitionforland.
Asasecondaryconsideration,aconstantsupplyofriverwaterisrequiredtomaintainthewetgrasslandsofthefloodplain, especially in the dry seasons. Reductionsinriverflowhaveadirect impactontheavailabilityofwatertosustaingrasslandandleadtopoorerandslowergrowth rates which has a direct impact on foragingcattle.
5.2.4 Agriculture and WaterAt thepresenttime theamountofwater takenupbysubsistence farming within the Tana Delta does notrepresentasignificantburdenonthedryseasonRiverTanaflows,(representinglessthan0.5%totaldischarge)since individual farmers rely on rain or recession conditions to feed their crops andwater availability isgovernedprincipallybylocationandsoiltype.However,the significant increase in farmland anticipated underScenarioAwouldleadtohigherdemandsovertheplanperiod.
5.2.5 Irrigation and WaterAt thepresenttime, irrigation in theTanaDelta takesplace at a very small scale (around 350ha) split evenly betweentheTARDAriceprojectandirrigationschemeruncommunallybyHewanivillage(Emerton,2003).Theamountofwaterusedisestimatedtobe<10%ofwaterusedforagriculturalpurposesandisofnosignificancein terms of River flows. However, it should be notedthat the infrastructure constructed by TARDA in 1980s wasintendedtoserviceamuchlargerareaandmostofthislandislyingidlefollowingthecollapseofthedykesandinfillingbynaturalerosionofdrainageandirrigation
canals. Under Scenario A it is assumed that only that part oftheirrigationschemelyingtothewestoftheGarsen-Wituroadwouldbebroughtbackintofullirrigation.
5.2.6 Urban and Rural Development and WaterSignificantgrowthinurbanareasisanticipatedandthiswill leadto increasedwaterconsumptionfordomesticandcommercialuses.However,intheoverallcontextofwaterdemand,urbanuseswouldnotput a significantstrain on the available supplies.
5.2.7 Fishing and WaterUnderScenarioAitisenvisagedthatfreshwaterfisherieswillbeexpandedatamodestrateovertheplanperiodwithyields increasing from394 tonnes to500 tonnesin 2030 and 750 tonnes in 2050, almost a doubling in productionovertheplanperiod.
Conclusion and Recommendation: For these conditionsto be realised there would need to be a significantimprovement in low river flows, brought about by theconstruction of a regulating reservoir in the middlereachesoftheRiverTana(inadditiontotheHighGrandFalls Dam). Without this development it is most unlikely thatfishoutputcouldbeincreasedwithintheDelta.
5.2.8 Beekeeping and WaterWater is vital in the maintenance of bee colonies because largequantitiesofwaterarecarriedtothehiveinorderto dilute honey for feeding to larvae and for use in cooling the colony through fanning. However, the amount ofwaterrequiredisinsignificantinrelationtoriverflows.If,however,longperiodsofdroughtoccur,bees’abilitytoforageandtofindwaterisgreatlyreduced.Theflowofnectarisdirectlyrelatedtofloweringperiodsoftrees,whicharetheprincipalsourceofhoney,andthevolumeofnectarisdependentonwateruptakeandtemperature.Indroughtconditions,nectarflowscease.Consequently,honeyproductiondoesdependonmaintenanceofthenatural habitat and good ecosystem health.
5.2.9 Natural Resources and WaterMaintenance of a healthy ecosystem and individual habitatslikeforests,swampsandmangroves,isessentialtoproductivemanagementanduseofgrassandreedsfor thatching, lianas for rope making, poles for housing construction and a wide variety of foodstuffs andmedicines.Thehealthof thesehabitatswill be almostentirelydependentonacontinuingreliableflowofriverwater,themanagementofgrazingpressuresandcontrolof land conversion to other uses. Unless populationgrowthisbroughtundercontrolduringtheplanperiodit ishighly likely that theseconditionswill notbemetandthescopeforutilisingnaturalresourceswilldeclinerapidly as the habitats themselves are degraded or lost.

TANA RIVER DELTA STRATEGIC ENVIRONMENT ASSESSMENT 2014 66
Conclusion and Recommendation: Every settlementshould be encouraged to develop its own plan forconservation and management of the habitats onwhichitreliesforrawmaterialswithinanover-archingmanagement plan for the Ramsar site.
5.2.10 Trade, Commerce and Finance and WaterAt the present time, the provision ofwater in plasticbottlesandsachetsisnotasignificanteconomicactivityalthough the development plan indicates 300 individuals are engaged in selling water (Government of Kenya,2008). This is potentially very significant for futuredevelopment, but only if income levels are raised as a resultofeconomicstimuli.UnderScenarioAitisunlikelythattheseconditionswillbemet.
5.2.11 Tourism and WaterCurrent levels of tourism activity have no impact onwaterresourcesalthoughaccesstocleanwaterisvitallyimportant increatingtourismresources.TheconditionoftheRiverTanaandhabitatswithintheTanaDelta isalso crucial to the future development of eco-tourism.
5.2.12 Industry and Mining and WaterThe principal industrial activity in the Delta at themoment is saltmining in the south-west.The processinvolves channelling saline water into large holdingpondsfromwhichthewaterisevaporatedleavingsalt.Thesourceofwaterisfromthesearatherthanlandandthe scaleof currentoperations isnot thought tohaveany significant impact. However, salt mining is a veryintrusive process, especially when the infrastructureis first developed, and management of inflowing andwastewatercanpresentmanychallenges.
5.2.13 Biodiversity and WaterThe most significant impacts on biodiversity underScenarioAwould result from the reduction in area ofprimehabitats(seeTable5.3).Ifconditionsareexaminedin2050(36yearsfromnow)lessthan20%offorestsandonlyathirdofriverineforestwouldremain.Floodplaingrasslandswouldbereducedtoonlyhalf theircurrentareaandsomeareasofMangroveforestwouldbelost.
Key Habitats Ha (2010) Ha (2050) % remaining Forest 27,100 5,000 18 Riverine forest 32,300 12,300 38 Mangrove 8,400 7,400 88 Floodplain grassland 50,800 25,300 50
WithintheDelta,lossofhabitatwouldfollowexpansionof livestock grazing and subsistence agriculture and these uses would not, in themselves, directly affecttheamountofwaterreachingtheremainingfloodplainhabitats.However,intheabsenceofapositivestrategyandeconomic case forprotecting thewater resourcesoftheDelta,itishighlylikelythatmorewaterwouldbediverted from the River Tana upstream of the Tana Delta for other uses, resulting in the continued reduction inriver flows in the dry season. The combined result ofreducedwaterflowandhabitatareawouldresultintheeffectivedestructionoftheDeltaecosystem.
5.3 Assessing Impacts on and Related to Livelihoods/Jobs5.3.1 IntroductionInthissection,theSEAexploresthepotential fornewjob or livelihood creation togetherwith any reductionorlossofemploymentwhichmightbenecessitatedbyparticulartypesofdevelopment.Itneedstobestatedatthe outset that formal employment levels in the Delta are ataverylowlevelandmostpeoplewhoarewithintheeconomically active age group obtain their livelihoodsthrough subsistence farming, livestock herding, and the gathering of natural products. Less than 5% of the population receive formal payment or salaries. TheLUPbaselinereportstates that51%of thepopulation(52,020) constitute ‘the section that can engage inmeaningfulproductiveeconomicactivities’.
Since scenario A is based on building up the local economy by relying on traditional land use activitiesit can be anticipated that the growth of employmentopportunities would be concentrated in subsistencefarming, livestock rearing, natural resource harvesting,beekeeping and fishing. In theory, livelihoodsemployment could rise from its present level to 51,000 in 2030 and 93,000 in 2050 (see Table 5.4 and Figure 5.4).However,thecumulativeadverseeffectsidentifiedas a result of land conversion, population growth andcompetition between grazing and farming interestswould almost certainly prevent these levels frombeingattainedand theTanaDeltawould remainasaneconomically depressed and poverty stricken area.
Table 5.3 Loss of Habitat between 2010 and 2050 under Scenario A
Source: Tana Delta Land Use Plan, 2014

TANA RIVER DELTA STRATEGIC ENVIRONMENT ASSESSMENT 201467
Land Use Activities 2030 2050 Open Grazing 2,934 5,299 Ranches/Commercial Grazing 160 320 Subsistence Farming 20,913 37,861 Commercial Farming 200 400 Rice Farming 0 0 Intensive Vegetable Farming 0 0 Extensive Vegetable Farming 0 0 Sugar Production 0 0 Fruit Farming 0 0 Fishing 1,000 1,366 Beekeeping 480 7,200 Natural Resources 8,365 15,144 Housing 1,518 3,370 Charcoal and Fuel Wood 8,365 15,144 Oil and Gas 0 0 Heavy Mineral Sands 0 0 Industry and Manufacturing 0 0 Trade, Commerce and Finance 5,870 5,870 Construction 250 250 Wholesale and Retail Trade 600 600 Tourism 400 400 Professional Services 10 10 Public Administration -‐ -‐ Nature Conservation 20 Urban Development 0 0 Domestic Water Use 0 0 TOTALS 51,085 93,254
Figure 5.4 Increase in Livelihoods (Jobs) under Scenario A
Table 5.4 Jobs/Livelihoods under Scenario A 5.3.2 Population and EmploymentGrowthofpopulationfromitspresentlevelof102,000to315,000by2050wouldgiveatotalof89,000peoplecapable of gainful employment by 2030 and 161,000 by 2050 (Odhengo et al, 2014b). The assumption inScenario A has been that such employment wouldbe derived from expansion of traditional livelihoodpractices, for example, harvesting building materials,producing charcoal, cultivating subsistence crops andherding animals (Odhengo et al, 2014b).
Asshownabove, the lawofdiminishingreturnswouldapply in all of these sectors and it is apparent that the Delta could not provide the level of employment and livelihoodstomaintainevenexistingstandardsofliving,let alone lead to any improvement. The net consequence will be an increase in the already unacceptably highlevels of poverty and all the associated issues of poor health,education,andmorale.
Conclusion and recommendation: The SEA’s mainconclusion isthata ‘businessasusual’approach isnotsustainable andurgent attentionneeds tobe given tonewformsofemploymentandlivelihood.
ScenarioAhasbeenassembledbylinkingexistinglevelsofemploymentandlanduseactivitytorisingpopulation.In consequence it assumes that for all activities thenumber of jobs and livelihoods would increase on apro-rata basis. Therefore, for example, if the number of livestock increased from 477,000 to 515,000 in 2030

TANA RIVER DELTA STRATEGIC ENVIRONMENT ASSESSMENT 2014 68
and 831,000 in 2050, the equivalent rise in fulltimeemploymentofherderswouldbe to2,934and5,299.Thesamesituationwouldariseinrelationtolivelihoodscreated in subsistence farming based on 2 FTEs per household/1.5 acres.
Inpractice,allofthelanduseactivitieswouldexperienceincreased competition between the sectors and thepoint would be reached at which further expansionof resource-based livelihoods became impossible. As discussed under the heading of population and land,at this stage therewouldbevery strongpressures foroutwardmigrationaspeopleintheeconomicallyactiveage groups are forced to find alternatives outside theDelta.
5.4 Value5.4.1 IntroductionTheinformationonthepotentialturnoverandoutputsofthedifferentlandusecategoriespresentedinChapter16 of the LUP has been aggregated and is presented belowinTable5.5andFigure5.5.
BasedonthecalculationsunderpinningScenarioAthetotal production under traditional livelihoods in theDelta is valued at 0.5 billion KSh and thiswould riseto close to 1 billion by 2030 (Odhengo et al, 2014b). Projecting the value of activities in the Tana Delta inScenarioAbecomesincreasinglydifficultbeyond2030becausemostoftheactivitieswouldbecompetingfor
Activity 2010 2030 2050 Grazing 228 390 705 Farming 62 104 189 Fishing 53 65 89 Honey 19 72 180 Charcoal/Fuelwood 195 396.5 714 Natural Resources -‐ Building Materials 130 313 695 Tourism 2.2 4.25 6.38 Total 528 985 2,578
Figure 5.5 Gross Value of Land Use Activities under Scenario A
the same areas of land and itwould be impractical topursueallofthem.It isclearthatcompetingpressureswill grow exponentially over the next 20 years andthatthetensionswhichthiswillcreateiftherewasnoresolution of priorities or agreement on the directionof future economic activitywould inevitably lead to acollapse of the Tana Delta economy.
5.5 Nature Conservation and Biodiversity5.5.1 Population GrowthRisingpopulationwouldbeoneoftheprincipalfactorsleadingtoadeteriorationofexistinghabitats,increasedcompetition for land and increased disturbance ofwildlife.
5.5.2 Livestock IncreaseThe number of Tropical Livestock Units that can be supportedwithinthecoreareasoftheDeltaiscurrentlyinexcessof2perhectarebutoutsidethewetlandareas
Table 5.5 Value of Different Activities (In Million Ksh.)
Source: Tana Delta Land Use Plan, 2014

TANA RIVER DELTA STRATEGIC ENVIRONMENT ASSESSMENT 201469
thestockingratefallssignificantly.ThecurrentnumberofTLU’sintheDeltaisaround240,000(seeTable5.6)andbasedoncalculations insection3.2.3.1thiscouldtheoretically rise to 400,000 in 2030 and 730,000 in2050 (Odhengo et al, 2014b).
Table5.6indicatesthatthecurrentstockingdensitiesareclose to the carrying capacity of the Delta and if further increasesweretooccurthiswouldonlybefeasibleifthenumberofwildherbivoresdeclined,orotherhabitats(i.e.woodlandorpermanentfarmingareas)wereconvertedto grazing. To meet the projected demand for livestock, the entire Delta areawould have to be converted tograzingby2030,withdramaticimpactsonbiodiversityand other forms of human livelihood.
5.5.3 Farming and Nature ConservationTheissuesrelatingtofarmingandnatureconservationhave already been reviewed in section andTable 6.1.Up to 70% of existing thicket and scrub would becleared by 2030 and converted to dryland farming and effectively all thicket and scrubwould be removedby2050, eliminating the existing wildlife corridors. Theconversion of floodplain grassland towetland farmingwouldcausea20%reductioninareaby2030anda50%reductionby2050.Thesamestorywouldapplytothereductionofriverineforestandother forestsalthoughthis would result from overgrazing and increasedharvestingof non-timber forest products (Odhengoet al, 2014b).
Basedontheprojectionsquotedabove,thebiodiversityindexwouldfalltointermsofavailablehabitat.Wildlifewould be significantly affected through reduction infeeding areas, increased completion with livestock,human-wildlife conflict and overall disturbance of thehabitats.
Table 5.6 Prediction of Tropical Livestock Units in 2030 and 2050, and Equivalent Areas at Different Stocking Densities
5.5.4 Beekeeping and Nature ConservationBeekeeping representsoneof themost efficientwaysof developing small businesses based entirely onharvesting a natural product.TheTanaDelta is averyrich resource in terms of the extent of habitat suitable for beekeeping and the practice can be extended atlow cost. There are no adverse environmental effectsfrom promoting beekeeping providing that any plansforartificial increase inthenumberofstocksdoesnotinvolveimportingqueenbeesofthewrongprovenance.
5.5.5 Natural Resources and Nature ConservationSustainablewiseuseshouldbeoneoftheprincipalaimsunder Scenario A. If thewoodlands are not managedsustainably therewill be inadequate resources for thefuture.Thedescriptions inScenarioAmakeclearhowimportant and valuable these resources are, providing vital ecosystem services such as building materials and food for the local communities. The analysis showsthat these are very cost-effective ways of providingessentialgoodsandserviceswhichwouldbemuchmoreexpensiveusingartificialmaterialslikezincsheetingforroofsandconcreteblockworkforwallsinsteadofpalm,reed and grass. However, external pressures on thenatural resources and unsustainably high levels of use are more likely to occur under Scenario A in the absence ofanypoliciesforprovidingalternativelivelihoodsandemployment.
5.6 CultureFrom first principles, the development of Scenario Ashould be strongly supported by the farming, pastoral and fishing communities because it favours supportfor these traditional forms of livelihood. In practice,however, failure to control growth of population andinwardmigration to the Deltawould quickly result inincreasing competition between the different groups
Source: Tana Delta Land Use Plan, 2014

TANA RIVER DELTA STRATEGIC ENVIRONMENT ASSESSMENT 2014 70
fordiminishingresourcesoflandandwater.This,inturnwouldmakeitmuchhardertomaintainopenranchingofcattle,thecultivationoffloodrecessionagricultureandfishinginrivers,lakesandthesea.
5.7 Security5.7.1 IntroductionThewayinwhichtheLUPanditsimplementationbringtogetherthereconciliationofconflictingobjectivesforeachareaoflanduseactivityisoneofthemostcriticalcomponents of the LUP/SEA. It is clear that if each landuseactivityispursuedinisolationthiswillleadtoincreasedcompetitionandheightenedtensionbetweencommunitiesintheTanaDeltaandbetweenresidentsofthe Delta and external interests. The issue of governance is crosscutting but this section identifies some of theissueswhichareparticularlypertinentforeachlandusecategory in turn.
5.7.2 PopulationThequestionofhowmanychildrenafamilyshouldhaveisaverypersonalissue.Ifahusbandandwifedecidetohave say seven children and are unable to feed, clothe and educate their family that is their choice, despite the fact that they have to bring up their family in abject poverty. Similarly if parents decide to limit the number of childrentotwoorthreesothattheycanaffordtogivethem good food and clothing and pay for school fees that is also their choice, although for many families in theTanaDeltathisisnotanoption.
The SEA takes the position that these are entirelymattersforindividualsbutatthesametimeitstressesthe importance of explaining how individual choicesaffect theentirecommunity. Ifeveryhousehold in theTana Delta decided to have no more than 3 children, a scenario based on traditional livelihoodswould looktotallydifferentfromoneinwhichthecurrentaverageof5children iscontinued into the future.ThepresentscenarioshowsbeyondalldoubtthatthereisnofuturefortheTanaDeltacommunities, theirwayof life, theirlivelihoods, if the current average of five children perhouseholdcontinues.
Insomesocietiesandcountriespopulationgrowthrateshave declined so much that the opposite concerns exist –wherewillthefuturebreadwinnerscomefrom?Whowill support theelderly in theiroldage?Clearly in theTana Delta there is a need for a serious debate about thebalancewhichneedstobestruckbetweenthetwoextremes.
Conclusion and Recommendation: The SEA advocates an approachwhich sees amodest increase in populationwithout exhausting the area’s natural resources. This
option provides the best opportunity for giving allchildrenapropereducation,banishingpovertyfromtheDeltaandcreatingapromisingfutureforall.Howmightthis be achieved? The government has adopted clearpoliciesonpopulationandtherearemanyorganisationsthat can assist in practicalmeasures.There should bea section in the LUP which refers specifically to theneedforgoodadviceandpracticalassistanceinfamilyplanning.
5.7.3 LivestockEstimates for futurenumbersof livestock in theDeltaarebasedontheassumptionthatpastoralistswillwantto keep the same number, or an increased number, of cattleperhousehold.There isalreadyawidevariationinthenumbersofcattleownedbyeachhouseholdwithmanybeingunabletoaffordmorethanafewanimals.Asaresult,therehasbeenasignificanttrendtowardsmixedfarming amongst theOrma community, inwhich cropfarminghasplayedasbigaroleaslivestockinsupportinglivelihoods.Ifthenumberofcattleperhouseholdweretodecline thiswouldhavevery important implicationsfor the continuation of existing traditional practice. Itwouldresult infewercattleintheDeltaandincreasedopportunitiesforimprovedgrazing,betternutritionandhigherliveweightsallofwhichwouldleadtoincreasedvalue and a higher economic return.
Conclusion and Recommendation: If livestock numbers are to be managed within the sustainable carryingcapacity of the Delta it will be essential to limit thenumber of animals that are imported from other regions during the dry season and a critical issue for the LUPwillbethedevelopmentofrecommendationsandadviceon a management system and governance system for managing livestock numbers. This must include the principles of payment for grazing rights for any non-residents pastoralists and proper allocation of grazingareas to individual communities.There should also bespeedy resolution of the complex land tenure issuesaffectingcommunallygrazedareaswherepastinjusticeshave led to land being appropriated by agencies or individuals.Thesearematterswhichshouldbereferredto the national Land Commission and theMinister ofLands at the earliest opportunity.
5.7.4 AgricultureScenarioA indicates thata substantial amountof landwillneedtobeallocatedfor individualhouseholdsuseif the present minimum level of 1.5ha per household is to be provided for future households which aregrowing at the rate of c400 peryear.At this rate theneed to allocate in excess of 40 km2 is likely to generate significanttensionbetweenexistingusersandthenewcommunities.Theissueisoftendescribedasachallengebetween Pokomo farmers and Orma pastoralists but

TANA RIVER DELTA STRATEGIC ENVIRONMENT ASSESSMENT 201471
the issue is increasingly blurred by the increase in mixed farming being practiced by both ethnic groups.ConsequentlydecisionsontheappropriateallocationoflandforfarmingwillaffectallresidentsoftheDelta.Thisissue is complicated by the fact that only certain areas aresuitableforcropfarming.Theseareasrequirefertilesoils, good drainage, exclusion from heavy flooding,accessibilitytotheroadnetworkandavailablewaterinthe dry seasons.
Conclusion and Recommendation: The main areas which should be considered for crop farming lie onthe upper terraces or highland outside the core of the floodplain.Suchareasarecurrentlybeingexploitedbyincomingmigrantswhooftenholddifferentvaluesfromthe traditional farming and pastoralist communities.ConsequentlytheprocessoflandallocationwillrequireverysensitivemanagementbytheCountyGovernments.The SEA recommends that a clear policy is established withtransparentrulesandguidancetoallmembersofsocietytoensurethatthepasthistoryofillegalallocationand land grabbing is eliminated.
5.7.5 IrrigationThepasthistoryofirrigationdevelopmentinthelowerTana River Basin and in the Delta in particular hasseriously prejudiced attitudes towards commercialschemesbutatthesametimesmallgroupsoffarmersandcommunitieshaveshownthatsuccessfulprivatelyor communally managed irrigation can significantlyenhancecropyields.TheSEAconsidersthatthequestionofirrigationrepresentsoneofthebiggestchallengesforsustainablelandmanagementwithintheDelta.Alloftheevidence points clearly to the inadvisability of seeking to develop large-scale irrigation in units over 1000ha.There is also an overriding need to assess the total demand and availability ofwater to support all formsof land use including irrigation.The scale of irrigationconsideredinScenarioAlieswellwithinthecapacityofthesystembutanysignificantincreasewouldbelikelytocause fundamental problems for the Delta.
Conclusion: Regardless of the measures that are taken to managethescaleofirrigationintheTanaDeltaamorefundamental issue arises from development projects that arebeing consideredelsewhere in theRiverTanabasin and in adjacent catchment areas including: • WaterdiversionstoNairobiandothersettlements• Irrigationschemes• ThewaterrequiredtosupporttheLAPSSETcorridor
(see Chapter 4).
5.7.6 Urban and Rural DevelopmentThereisastronginternationaltrendtowardsurbanisationand this is particularly pronounced on the African
continentwheremorethan50%ofthepopulationwillbelivingintownsandcitiesby20358. In the Delta a number of factors could encourage expansion of the urban areas overthenext40years.Thiswillincludeadesiretomoveawayfromareasofhighfloodriskandtakeadvantageof better infrastructure and services including roads,publicwatersupplyandsanitation,andalsotheaccessto health clinics and schools. Another characteristicof urbanisation is the tendency for traditional typesof housing and communal living to change from very dispersed settlement patterns to more concentratedhousinglayouts.Inmakingprovisionforgrowthofurbanareasitwillbeimportanttorespecttraditionandculturalrequirementsbutatthesametimetoprovidethelandand facilities for new forms of development.The LUPshould set out guidance on road layouts, size of housing plotsandthestandardsofservicesthatwillberequired.
5.7.7 FishingCommunities that are heavily involved in freshwaterfishingareheavilydependentonthewayinwhichsourcewaters are managed or mismanaged. An importantgovernanceissueishowtoensurethatsufficientwateris allowed to flow or is directed to existing lakes, likeMoa and Bilisa. At the coast opportunities exist forenlarging the marine fisheries industry, principally byimproving fish processing and marketing with betterfreezing facilities and transport.However, the difficultcoastal conditions, includingerosionof sandbars, andrough sea conditions during the monsoons, make thedevelopment of a permanent harbour a challenging task andthisoptionhasbeendiscountedunderScenarioA.
5.7.8 Natural ResourcesThere are a lot of significant issues relating togovernance, peace and security in relation to naturalresourceextraction.Therearestillcasesofillegalbushmeat harvesting in theTanaDelta, including poachingof hippo and regular capture of dik-dik. Unauthorised removaloftimberfromprotectedareasalsotakesplace.
Conclusion and Recommendation: While protected areas are managed and policed by Kenya Wildlife Service, achieving a proper balance between regulation andprohibitionontheonehandandsustainableharvestingon the other is an important requirement. Scenario A shows clearly with rising population and lack ofalternativestocharcoal,firewoodandbuildingmateriallike poles, the Tana Delta’s woodland resources willcome under ever-increasing pressure. As part of the LUP itwill beappropriate to lookatalternatives tonaturalresources including the possibility of establishing tree plantationsoutsidethemainprotectedareas.
8http://esa.un.org/unup/pdf/WUP2011_Highlights.pdf

TANA RIVER DELTA STRATEGIC ENVIRONMENT ASSESSMENT 2014 72
CHAPTER6 Assessment of Scenario B
IntroductionScenario B sets out a range of potential commercial development options for the Plan area. These have been assembled without considering whether they are compatible with each other, or with other objectives of the land use plan such as the wise use of resources and environmental sustainability. It is the purpose of this section of the SEA to consider how practical the individual land uses are against this wider set of objectives.
6.1 Assessing impacts on and Related to LandThestartingpointfortheassessmentistheamountofland that each form of development requires and the implications that this has for other land uses. Figure6.1 shows graphically those activitieswhich have thegreatest demands on land (red).
6.1.1 Population and LandScenario B assumes the same expansion model for population as ScenarioAwhich allows 3% compoundgrowth per annum. This is below the current level of3.5%intheTanaandLamucountyareas,andmaywell
be exceeded. Scenario B acknowledges that it wouldnotbepracticaltoaimtofeedtheincreasingpopulationby subsistence farming. Instead it explores the scope for promoting cattle ranching on a commercial scaletogether with communal, commercial and industrialfarming and the promotion of the manufacturing andindustrial sectors.
6.1.2 Livestock and LandScenario B proposes that instead of allowing the sizeof the permanent cattle herd in the Delta to expand,withseriousconsequences in termsof thequalityandhealth of the animals and unacceptable competitionwith other land uses (principally farming and wildlifeconservation),emphasisshouldbeplacedonimprovingquality and value. To this end it is proposed that 250 km2 of permanent grazing should be established and managed for fattening cattle purchased fromsurrounding pastoralists (Odhengo et al, 2014b). This permanentholdingareawouldbeformedpartlywithinthe floodplain (12,500 ha) and partly on drier terraceland (12,500ha)which is currently coveredby thicketand scrub. 20,000 cattle would be reared within theholdingareaeachyear.Remainingareasofwetgrassland(383km2) and thicket and scrub (275 km2)wouldsupporta further 104,000 cattle on an open grazing system(Odhengo et al, 2014b). Reduction in the size of thepermanent herd from over 200,000 to around 125,000 would require the agreement of all pastoralists andwould require very extensive consultation before theproposals could be introduced.
6.1.3 Agriculture and LandIn order to accommodate the expansion in resident population an increase in the area of permanentcultivationforsubsistencefarmingisrequired.ScenarioB proposes that all farming households should have accessto1.5acres(0.6ha)fortheirownuse.Thiswouldresult in an increase in the current area of 62km2 (2010) to 105km2 by 2030 and 189km2 by 2050 (Odhengo et al, 2014b). This expansion would need to be met byconversion of existingwet grassland in the floodplainor thicket and scrub on the terraces. In practice bothcategories would be affected due to the dispersednatureofthesettlementsintheDelta.
Population Livestock Agriculture Irrigation Fishing Beekeeping Natural Resource Harvesting Mining and Quarrying Manufacturing and Industry Construction Transport Trade, Commerce and Finance Wholesale and Retail Tourism Professional Services Public Administration Nature Conservation Urban Development
Figure 6.1 Land Demand for Different Activities
TANA RIVER DELTA STRATEGIC ENVIRONMENT ASSESSMENT 201473
Inadditiontoanexpansion inthesubsistencefarmingareas the scenario also proposes substantial increasein areas used for communal and commercial farming. A wide range of crop types is considered includingintensive vegetable production, extensive vegetables,rice,sugarcaneandfruitgrowing.ScenarioBassumesa total increase of 207.5 km2 by 2030 rising to 415 km2 by 2050 (Odhengo et al, 2014b).This landwould alsoneedtobeconvertedfromexistingwetgrasslandinthefloodplainandthicketandscrubontheterraces.Itcouldonly be created at the expense of displacing grazing considered previously under Livestock – section 7.2.2above.
Thecombinationofsubsistencefarmlandandcommunaland commercial farmland would amount to 604 km2 by 2050, or 27% of the entire Plan area. This wouldapproximatetothepotentialmaximumforlandsuitableforcultivation(Odhengoet al, 2014b).
From a strategic viewpoint, the use of land for cropproductionforfoodwouldhaveprecedenceovermeator milk production because yields are substantiallyhigher per hectare in terms of the numbers of people whocouldbefed.Bothcropandmeat/milkproductionarepreferabletoindustrialcropsintermsoftheDelta’sand the country’s requirements for food security.Nevertheless, the scale of conversion of natural habitats envisaged under this scenario would have seriousimplications for nature conservation and biodiversityvaluesasnotedundersection6.6.Itwouldalsorepresenta significant imbalance in the allocation of resourcesbetweenpastoralistsandfarmers.
6.1.4 Irrigation and LandOneofthemainwaysofraisingproductivityoffarmland(andgrazing for livestock) is to introducewaterduringperiodsofsoilmoisturedeficitsandplantstress,whichoccurs during the dry seasons. It has therefore been assumed that all major cropping activities and fruitproductionwouldbesupportedbydripfeedirrigation.This constitutes a relatively low water demand bycomparison with gravity fed or pivot irrigation whichis practised in the case of rice and sugar cane. Theimplicationsofintroducingirrigationarediscussedunderthesectiononwater.
6.1.5 Fishing and LandScenario B introduces the ambitious plan of creatingtwofishfarmsforeveryoneofthe106villages intheDeltaby2050.Each farmwouldconsistoffivepondswithanaveragesizeof500m2.However,despitetheirsignificanceasapotentialfoodsource,thetotalareaofallfishfarmswouldonlyamountto53hectares(0.5km2) or less than 0.03% of the Plan area (Odhengo et al, 2014b). Consequently, fish farming would have verylittleimpactintermsoflanddemand.
Opportunitiestoimproveaccesstothecoastalfisherieswould require a feasibility study to assesswhether ornotaharbourcouldbeconstructedonthetidalsectionof the River Tana inland from the estuary mouth and thecostsandbenefitsofprovidingappropriatefishingvessels and gear for deep-water marine fishing. Thisstudywouldneedtoconsidertheplanneddevelopmentofadedicatedfishingharbour in conjunctionwith theLamuportdevelopment. Inpractical terms it couldbedifficulttojustifytwomarinefisheriesonly40kmapart.
6.1.6 Beekeeping and LandBeekeeping is another activity with considerablepotentialforexpansionwhichcouldbeachievedwithoutrequiringanysignificantareaofland.Hivescaneasilybeaccommodatedwithinsubsistencefarminglandwithoutaffectingnormalcropping,orinforests,scrubandthicketand other natural habitats.
6.1.7 Natural Resources and LandIn recognition of the demands likely to be made onthicket,scrubandwetgrasslandbylivestockrearingandfarming,ScenarioBanticipatesthatexpansioninnaturalresource harvesting would only continue until 2030.Thereafteritwouldbenecessaryforlocalcommunitiesto adopt modern building techniques (concrete, blocks, plasterandmetalsheetingortilesinplaceofgrass,reeds,polesandpalmleaves).Inaddition,amajorreductionincharcoalandfuelwoodwouldnecessitatedevelopmentof alternative technologies, including solar poweredlightingandcookingandtheuseofwindenergy.
6.1.8 Mining and Quarrying and Land
6.1.1.1 Mineral SandsThe development of mineral sands which are knownto exist along the coastlinewould havevery dramaticeffects on the topography of the sand dunes whichforman important lineofcoastaldefenceagainsttidalsurgesandstormsandprotectthefreshwaterwithintheDelta.Itwouldbenecessaryfordetailedexplorationtotakeplacebeforeitcouldbesaidwithconfidencethatheavy minerals were present in sufficient quantitiesand concentrations to justify the expense of mining.However,giventhe inevitable levelofdisturbanceandadverseeffectsthatminingwouldhaveonthiscoreareaoftheRamsarsiteitishighlyquestionablewhethersuchexplorationshouldbeauthorisedinthefirstplace.
Conclusion and Recommendation: The SEA concludes that in the light of the level of damage and interference thatsurfacesandminingwouldhaveon thecoreareaoftheDelta,thereshouldbethestrongestpresumptionagainstauthorisationofsuchactivities.

TANA RIVER DELTA STRATEGIC ENVIRONMENT ASSESSMENT 2014 74
6.1.1.2 Oil and GasOil and gas extraction are also potentially disruptiveand environmentally damaging but once the necessary boreholeshavebeendrilled,wellheadcaps,pumpsandpipelineinstallationscanusuallybesitedandalignedtoavoid prime habitats. There are very important factors that need to be assessed before permission can be granted, including the need to avoid disturbance to birds andotheranimalsfromnoiseandtemporarygasflaringandthedevelopmentofplanstodealwithallpotentialemergencies. For the reasons outlined above there can benocertaintythatpermitswillbegrantedforparticularoperations.On the other hand, exploration should beauthorisedwherethisislikelytoleadtoagreaterlevelofunderstandingofthepotentialforoilandgasextractioninTanaRiverandLamucounties.
6.1.9 Manufacturing and Industry and LandThearguments fordevelopingnewmanufacturingandindustrial activities thatwill add value to the existingnatural resources of the Tana Delta in sustainable ways are strongly supported by the SEA since this islikelytobeoneofthemosteffectivewaysofprovidingemployment and retaining economic value in the local economy. Suitable land exists for the development of industrial estates close to the existing main centresin theDelta and this can be releasedwithout causingsignificant disruption or the need to relocate existingsettlements.On the other hand, construction of plantandprocessingworksinareasremotefromtheexistingroad network should be avoided wherever possible,due to the increased costs involved, the high levels of disturbance likely to be caused to the fragile habitats of theTanaDeltaandhighrisksofdisruptingthenaturalhydrology of the area.
6.1.10 Construction and LandProposals for development will need to be assessedon their merits, and these assessments should take into consideration the construction impacts, includingsourcesofrawmaterials; forexampleforbuildingnewroads.
6.1.11 Transport and LandUseofroadsandwaterfortransportdonothavedirecteffects on land, and the availability of land is not aconstraint on future development.
6.1.12 Trade, Commerce and Finance and LandTheseactivitiestakeplaceprincipallywithinurbanareasandothersettlementsanddonotraisedirect issues interms of land use. It should be noted, however, thatfinancefordevelopmentisofcrucialimportancetothelong term sustainability of the Tana Delta. The baseline studies for this SEA have highlighted a number of exampleswherenational institutionsand international
aidpartnersmadedecisionstoproceedwithlargescaleinvestmentswithinthefloodplain,despiteclearevidenceprovided by other donor aided programmes that there were severe technical, environmental, social and localeconomic constraints.
Conclusion and Recommendation:Anyfinancialproposalsfor large scale development in the Tana Delta should be accompanied by exhaustive environmental, social andcost-benefitassessments.
6.1.13 Wholesale and Retail and LandAllwholesaleandretailactivitiesshouldbeconductedwithin urban centres of the new planned industrialestatesintheinterestsofachievingmaximumefficiencyin the use of land and infrastructure.
6.1.14 Tourism and LandRelatively small areas of land are needed forestablishment of leisure and tourist camps and other touristfacilitiesanditisunlikelythatbuildingfootprintswill require more than one or two square kilometresovertheentireplanperiod.However,muchlargerareasneedtobeprotectedandmaintainedingoodconditionin order to create the right ambience for high income generatingformsoftourism.
6.1.15 Professional Services, Public Administration and LandThis area of economic activity is linkedwith provisionof government services, like schools, health clinics, and veterinary services. As the overall economy in the Tana Delta improves, the opportunity for strengthening all areasofpublicsupportwillgrow.Asubstantialnumberofnewjobswillbecreatedintheprocessbutthelanduse implications form part of the expansion of urbanareaswheremostofthesejobswillbelocated.
6.1.16 Biodiversity and LandScenario B places strong emphasis on capitalising on the economic value of nature conservation linkedwith eco-tourism, but in practical terms the amountof land needed for physical development is very small. Consequentlythepromotionofnatureconservationhasverylittledirectimpactonuseofland.Ontheotherhand,conservation depends on preserving as much of thenatural habitat in the Tana Delta as possible and under an intensive programme of commercial development biodiversity would come under severe pressure.Particularlydamagingoperations includeconversionofwet grassland to farmland, and extensive irrigation ofindustrial crops like sugar.
6.1.17 Urban Development and LandGrowthofpopulationandsignificanteconomicprogresswithin theDeltawill result in strong demand for new

TANA RIVER DELTA STRATEGIC ENVIRONMENT ASSESSMENT 201475
housing, urban infrastructure and services and land forwarehousing and factory development. Scenario Banticipatesanincreaseddemandof676haforhousingby2030andafurther839haby2050.Additionallandfor industry amounts to 120 ha by 2050, giving a total increase of 16 km2.
Figure 6.2 Overall Water Balance following Development of Agricultural Crops in 2030 and 2050
Figure 6.3 Relative Demand of Agricultural and Industrial Crops (Sugar Cane) in m3/sec
6.2 Impacts on and Related to WaterAsdiscussedunder theexisting situation,mostof thewater reaching the Tana Delta enters the floodplainthrough channels from the River Tana and is absorbed byvegetationortransferredtotheatmospherethroughevapotranspiration.InordertosupportanyofthemajoragriculturalandirrigationdevelopmentsproposedunderScenarioB itwould be necessary to build a balancingwater storageand regulating reservoirbelow theHighGrandFallsDamtoaugmentthenormalflowintheriver.
Source: Tana Delta SEA, 2014
Source: Tana Delta SEA, 2014

TANA RIVER DELTA STRATEGIC ENVIRONMENT ASSESSMENT 2014 76
Figures6.2and6.3showhowthewaterbalancewouldbe affected within the Delta if the major agriculturalprojectsweretobepromotedassetoutinScenarioB.Themostpronouncedeffectwouldstemfromcreationof a 20,000 ha (200km2)sugarplantationwhichwoulddirectly remove 20% of the core floodplain habitats,resulting in a reduction in water demand for natureconservation from 59.1 m3/sec to around 47 m3/sec through direct displacement of grassland by sugar cane. At the same time however, the overallwater demandwouldriseby7m3/sec by 2050, due to the higher rates ofwater uptake by sugar cane comparedwith naturalgrassland (Odhengo et al, 2014b).
6.2.1 Sugarcane Water RequirementsTable6.1 indicatesthat10,000haofsugarcanewouldrequire at least 250 million m3ofwaterayearby2030,and if the areawere increased to 20,000 ha by 2050thiswoulddemand500millionm3ayear.Toputthesefiguresinperspective,theannualflowintheTanaRiver–includingallfloods–isbetween5billionand7billionm3.Thedevelopmentofa20,000ha sugarplantationin the Delta (or elsewhere upstream)would thereforerequirebetween7-10%of theentireflow in theTanaRiver (Odhengo et al, 2014b).
Table 6.1 Annual Water Demand for Crops Grown in the Tana Delta under Scenario B
Source: Tana Delta Land Use Plan, 2014

TANA RIVER DELTA STRATEGIC ENVIRONMENT ASSESSMENT 201477
6.2.2 Other Water DemandsBycomparisonwithsugarcane,thenextmostdemandingcropwouldberice,witharequirementforupto2.2m3/sec or 70 million m3 of water per year (Odhengo et al, 2014b). However, unlike sugar which is growncontinuously, rice only requires substantial amountsofwaterwhen it is initially planted,much ofwhich isprovided by natural rainfall.
Other crops which have a significant water demandwould includevegetableproductionand fruitgrowing.Livestockgrazinganddomesticconsumptionwouldalsoadd towaterdemand, but the cumulativeeffectof alloftheseactivitieswouldonlyamountto4.65m3/sec or 100 million m3/year,oronefifthoftheconsumptionbysugarcane (Odhengo et al, 2014b).
6.3 Impacts on and Related to Jobs and LivelihoodsFigure6.4andTable6.2showthelikelydistributionofjobs and livelihoods to be created under Scenario B.
6.3.1 Agriculture
6.3.1.1 Subsistence FarmingThe most significant area of job creationwould arisefromapolicyofencouraginghomeproductionoffood.If the strategy of allocating 3 acres (1.25 ha) to eachfarming household was adopted, this would raise thenumber of gainfully employed people to around 21,000
Figure 6.4 Number of Jobs/Livelihoods Created under Scenario B
in 2030 and37,000 in 2050 representing24%of the‘economicallyactive’class in thesetwotimescalesand30-33%ofalljobscreatedwithintheDelta(Odhengoet al, 2014b).
6.4.1.2 Sugar ProductionThe second largest category of new jobs would beprovided by a sugarcane plantation and factory.Provisional estimates suggest that one full timeequivalent(FTE)jobwouldbecreatedfromeachhectareof cane, indicating a labour force of 10,000 could berequiredby2030,risingto20,000in2050.Inaddition,substantial employment would be generated in theprocessing factory (800 jobs) and in transport of rawcane and processed sugar (around 500 jobs) (Odhengo et al, 2014b).
The promise of work and regular wages and otherpotential benefits as part of an overall employmentpackage could be very attractive to some residentswithinanarealiketheDeltawhichhasvirtuallynoformalemploymentandhighlevelsofpoverty.However,thesebenefitswouldneedtobebalancedagainstthelossoflivelihoodsandforcedrelocationof localcommunities,withanestimated25,000-30,000peoplerequiringtoberesettledinordertoclearthelandforsugarproduction(Odhengo et al, 2014b).

TANA RIVER DELTA STRATEGIC ENVIRONMENT ASSESSMENT 2014 78
Table 6.2 Distribution of Livelihoods under Scenario B (FTE)
6.4.1.3 Intensive Vegetable and Fruit ProductionThe Delta also offers excellent potential for raisingvegetables and fruit commercially, with two or threegrowingseasonsayearforvegetablecrops.Employmentin both these sectors is high -four times greater, at 4FTEs per hectare, than sugar, rice or other extensive crops (Odhengo et al, 2014b). In the models chosen underScenarioBonlyrelativelysmallareasoflandhavebeen allocated to these land uses, given the amount of land required to establish sugar cane production.However,theoptionsareexploredlaterinScenarioCofdevelopingvegetablesandfruitasalternativestosugarcane.
6.3.2 Beekeeping, Fish Rearing and Natural Resource Harvesting, including Charcoal and Fuel WoodTheseactivitieshavebeengroupedtogethersincetheyall depend on utilising the existing resources of theDelta.Around20,000livelihoodswouldcontinuetobesupportedbythesetraditionalactivitiesin2030,andupto 23,000 livelihoods in 2050, although loss of natural habitat as a result of agricultural expansion wouldseverely restrictgrowth in thesesectorsbeyond2030(Odhengo et al, 2014b).
Source: Tana Delta Land Use Plan, 2014

TANA RIVER DELTA STRATEGIC ENVIRONMENT ASSESSMENT 201479
6.3.3 SummaryThe total number of jobs created in 2030 under Scenario B would be in the region of 71,000, although 5,000existing livelihoodswould be displaced, by conversionofwetgrasslandtosugarcane.By2050,upto116,000jobs could be created - with displacement of around10,000 livelihoods (Odhengo et al, 2014b).
6.4 ValueFigure6.5showstherangeoflanduseactivitieswithameasureoftheirrepespectiveeconomicvalue.Itshouldbe noted that the basis onwhich ‘value’ is calculatedvarieswith the different commodities and so a directcomparison is not possible. For example, the value of livestock represents the gross value of all stock, includinganimalsthatarekeptwithintheherdandareneitherpurchasedor sold.Estimatesof cropvaluearebasedonannualsales,whilesugarisassessedintermsofthepriceofsugarpertonneafterprocessing,ratherthan the value of the standing crop. Nevertheless the relativefigures of these commodities are indicativeofoverall economic value.
6.4.1 Agriculture
6.4.1.1 Sugar ProductionSugar has potentially the highest value of all cropsthat could be produced in the Delta. Its value is based as much on its industrial as its nutritional uses. As aglobally traded commodity, price is heavily influencedby international trading agreements and most of the
Figure 6.5 Gross Value of Land Use Activities under Scenario B (Including Sugar)
financial benefit in production would be transferredoutsidetheDelta,apart fromwagesandpayments forlocalservices.Thepotentialvalueofsugartothe localcommunitywouldbeincreasedifahigherproportionofthetotalcropweretobeproducedbycontractfarmersbutthisisgenerallyalessefficientandthereforemorecostlywayofprovidingtherawmaterial.
Assessment of overall economic value for any given commodity needs to be based on more than the price and return on investment to individual companies and shareholders.Italsoneedstoreflectthesumofbenefitsprovidedtotheregioninwhichproductiontakesplaceanddeliveryofgovernmentpriorities.Asafoodsource,sugarhasa lowernutritionalvalue in thefightagainstpoverty and malnutrition than other staple crops likerice, maize and vegetables.
6.4.1.2 Other CropsIf sugar is excluded from the list of crops considered under Scenario B, as shown in Figure 7.6, rice andvegetable growing both appear to offer considerablepotential for creating good economic returns in theTana Delta, although the areas allocated to these crops inScenarioBwerenotoptimised.Whilesugarisshownas providing 10 billion KSh in 2030, the combined value of rice and vegetables would be 3.6 billion KSh. Theequivalentfiguresfor2050wouldbe19.5billionKShforsugar and 8 billion KSh for vegetables and rice (Odhengo et al, 2014b).

TANA RIVER DELTA STRATEGIC ENVIRONMENT ASSESSMENT 2014 80
Figure 6.6 Gross Value of Land Use Activities under Scenario B (Excluding Sugar)
6.4.2 LivestockAs previously noted, the overall value of livestock in the TanaDelta exceeds 2 billion KSh, although this figureissubstantiallyhigherthanthevalueofstocktradedinthe marketplace each year. Nevertheless if a commercial cattle rearing schemewere introduced along the linesof the model proposed in Scenario B the sale of up to 20,000 prime animals a year could generate 0.3 billion KSh (Odhengo et al, 2014b).
6.4.3 Other Land Use ActivitiesOtherlanduseactivitiesmakingavaluablecontributiontothelocaleconomyunderScenarioBby2050wouldinclude salt production (250 million KSh), fishing (89million KSh), house building (1,730 million KSh), trade and commerce (288 million KSh), natural resource harvesting (including charcoal and fuelwood)(956million KSh), beekeeping (90 million KSh) and tourism (60 million KSh) (Odhengo et al, 2014b).
6.5 Impacts on and Related to Nature and BiodiversityScenarioBhighlights theopportunities for developingeco-tourism based on the natural resources of the Tana Delta.Theseincludedevelopingtrailsandboardwalksinkeyforesthabitats,creatingawater-basedtrailthroughthewetlandsandestablishinganumberofeco-lodges.However,theprimaryobjectivebehindestablishmentoftheTanaDeltaasaRamsarSiteistoensureconservationandsustainableuseofitsoutstandingecosystemwhichis important for international conservation of wildlifeandparticularlymigratorybirds.
AnumberoftheproposedlanduseactivitiesoutlinedinScenarioBarecompatiblewiththeseconservationandsustainableuseobjectives.Theareaof theTanaDeltaislargeenoughtoaccommodateresidentcommunities,traditional livelihoods, agriculture, tourism, fishing andotherformsofsustainabledevelopment.Byadoptingatieredapproachwithanouterbufferzone,commercialand industrial areas aroundmajor settlements, and aninner corewhere nature conservation and compatibleuses predominate, the Delta is capable of meeting awiderangeofdifferentneeds,includingacontributiontonationalfoodsecurity.Therearehowever,certainusesandactivitiesthatarenotcompatiblewiththeoverridingobjectives of the Constitution, Ramsar designation,or the Government’s policies for water conservation,wetlandconservation,wildlifeprotectionandprotectedareas. These uses include:• Extensive surface mining which would destroy
surface habitats,• Industrial crop production which would demand
largevolumesofwateranddestroysurfacehabitats,• Any land use which would displace existing
communitiesandrequiremajorresettlement,duetotheindirectimpactsthatthiswouldhaveonnatureconservationinterests.
Conclusion and Recommendations: From the analysis of the development options considered under ScenarioB it is clear that large scale heavy mineral extractionwould run counter theprimarypolicies andobjectivesforconservationoftheDeltaandthisoptionshouldbeexcluded from the Land Use Plan and future land use strategy.
Source: Tana Delta Land Use Plan, 2014

TANA RIVER DELTA STRATEGIC ENVIRONMENT ASSESSMENT 201481
It is also clear that the conversion of large areas of naturalhabitat,includingwetgrasslandinthefloodplainforindustrialcroppingofsugarcane,wouldbeextremelydamaging to the hydrology, ecology and livelihoods in the core area of the Delta.
Althoughsugarcaneproductionhasbeenconsideredinthe past, circumstances have radically altered since plans were initially drawn up in the 1980’s. These changeshavebeenparticularlymarkedinthelastfiveyearssincean incomplete Environmental Impact Assessmentwassubmittedwhichisnolongervalid.Thechangeswhichhave taken place include:• Radical realignment of the main channel of the Tana
Riverthroughthelowerfloodplain,whichalterstheassumptionsonwhichearlierplanswerebased,
• Greater knowledge about the hydrological regimeof theRiverTanaand theneed toconservewaterthroughout the River Tana basin,
• Increased scientific knowledge on the rarity ofindividual species of animals and plants in the Tana Delta,
• Substantial increase in the local population andthenumbersofpeoplewhowouldbe affectedbydevelopment,
• FormalacknowledgementbytheCourtsofthelegalrightsof localcommunitiesandoftheneedforallplanstobesubjecttodetailedconsultationamongstthecommunitiespriortoapproval,
• The development of alternative livelihood anddevelopmentstrategieswhichofferbetter returns,economically, socially and environmentally than the former out-dated plan.
6.6 CultureThe Constitution celebrates Kenya’s cultural diversityandaffirmstherightsofallpeopletolivetheirownlives.It also emphasises the responsibilities that individuals,communitiesandthegovernmenthavetoprotectthesevalues. In the Tana Delta many traditional values andlivelihoods are stillmaintainedby farmers, pastoralistsandfishersbutthesespecialqualitiesareunderpressurefrom competition for scarce land, water and naturalresources.
The SEA shows very starkly that major changes willoccur within the Tana Delta over the next 36 yearsas a result of both internal and external forces. Some of thesechangeswill requirea special effort from thecommunities themselves to adapt to new livelihoodsand lifestyles.
Conclusion and Recommendation: One of the most important challenges is for both pastoralists and farmers toagreeonastrategyforsharingthefiniteresourcesofthe Delta and the analysis of Scenario B points to the needtolimitboththeamountoflandwhichisconvertedfromwet grassland to agriculture and the size of thecattleherds (andother livestock) thatgrazewithin theDelta. These issues are addressed in more detail under Scenario C, which seeks to strike a balance betweena strategy based on traditional livelihoods set out inScenario A and the commercially-oriented approach set out in this Scenario.
6.7 SecurityInrecentyears,long-standingtensionsbetweendifferentsectorsofthecommunitiesintheTanaDeltahaveledtoclashes and it cannotbe a coincidence that theworstabuseshaveoccurredaroundthetimeofnationalandlocal elections. However, the underlying causes ofresource competition remain and in future, the riskofconflictwillgrowunlessthereisabetterunderstandingof theways inwhich communities can live andworktogether for the common good.
Unfortunately, previous administrations, governmentagencies and private companies have sometimesignored the rights of communities. Many families inthe Tana Delta experienced the trauma of being forced outoftheirtraditionalhomesinordertomakewayforirrigationprojectsdesignedinthe1960’s,70’sand80’sthat subsequently failed. This recent history has created alegacyofanti-governmentsentimentswhichrunsdeepin localconsciousness.Thecommunityrepresentativesattending meetings of the Tana Planning AdvisoryCommittee(TPAC)aspartoftheLUP/SEAprocess,andnumerousvillagersparticipatinginvillageconsultationshavestatedinunequivocaltermsthattheywillfightfortheirrightstodecidetheirownfutures.
Conclusion: The process of planning is not something thatcanbeimposedonunwillingparticipants,andthesuccess of the land use strategy, policy statements and regulationswhich are recommended through the LUPandthisSEAwilldependlargelyonthesupportthatisgiventothembyeveryonewholivesandworkswithinthe Tana Delta.

TANA RIVER DELTA STRATEGIC ENVIRONMENT ASSESSMENT 2014 82
CHAPTER7 Assessment of Scenario C
IntroductionScenario C is already a product of the SEA since it draws together those activities and elements which are most likely to offer a long term sustainable future for the Tana Delta. The Scenario starts with an important section on the process of developing a land use strategy in which four options are discussed. These are:• Business as usual• Self-sufficiency• Community-led enterprise, and• Public/private partnershipsThe arguments against ‘business as usual’ are clearly stated in Volume 2 of the Tana Delta land use plan from which the following quotation is taken. Business as usual represents ‘continued appropriation of land which is technically in public ownership as individual developers seek ways of promoting their own vested interests....leaving existing users angry and frustrated and leading to greater insecurity, tensions and conflict’ (Odhengo et al, 2014b).
Unfortunately, some national and international companies and agencies still regard themselves as having a freedom to operate above the law and it will require the adoption of the Tana Delta land use plan by the two county governments and the Ministry of Lands on behalf of the National Government to ensure that order is finally brought to decision-making processes in the Delta.
The SEA supports the conclusions drawn in the Tana Delta land use plan (LUP) that future development should be based on a combination of self-sufficiency, community-led enterprise and public/private partnership but it also stresses the need for bold leadership by the County Governments to ensure that the right mix is achieved. If the natural resources and outstanding environment of the Tana Delta are to be preserved for the future it is imperative that ways are found of creating new jobs and livelihoods in sustainable economic activities. These should include radical changes in the management of livestock within the Tana Delta and surrounding areas and the promotion of community based farming enterprises, supported by carefully selected private partners.
7.1 Impacts on and Related to LandThe basic concept of allocating 650 km2 of land for livestock grazing and a similar amount (650 km2) to permanentagriculturalproduction is supportedby theSEA, subject to a caveat that detailed surveys should beundertakentoestablishexactlywhichareasof landaresuitableforthetwoprimarypurposes.Forexample,simply drawing a line on amap between two villageswill not resolve complex questions of land rights orensure that the soils and hydrology are suitable for the proposed end use.
Research undertaken for the SEA and LUP as part of the detailedvillagesurveyprovedhowdifficultitistodefinephysicallimitswithout:a)fullengagementofcommunityleaders and b) detailed recording of locations using aglobalpositioningsystem(GPS).
The task of producing accurate maps of all parts of the Delta at a scale suitable for determining detailed land uses(i.e.notlargerthan1:50,000)is likelytotaketwoyears, assuming that the necessary funding is in place.
Themappingprocessalsoneedstoincludepreparationof an accurate digital terrain model to replace the hand-
generated model created in the course of the SEA. This model needs to record ground levels to an accuracy of+/-0.5metres, so that landandwatermanagementcan be developed in parallel. The SEA has highlighted findingsfromotherinternationalstudieswhichconfirmthatpartsofthelowerdeltaarevulnerabletosealevelriseoverthenext50-100yearsandbetterknowledgeofthepotentiallyaffectedareaswillbeimportant.
7.1.1 Livestock and Land
7.1.1.1 Open GrazingThe concept of managing the number of cattle thatare allowed to graze in the Plan area, by registeringtheir owners and obtaining an annual statement ofthe numbers each individual intends to keep withinthe Delta, is easy to set out on paper but would beimpractical on the groundwithout the full agreementandcooperationofowners.Nevertheless, governmentveterinary services are fully familiarwith the need tomonitor livestock movements and to guard against thespreadoftransmissiblediseasessothefirstcriticalstepwillbe toget theagreementofallowners to theprinciples.

TANA RIVER DELTA STRATEGIC ENVIRONMENT ASSESSMENT 201483
7.1.1.2 Commercial GrazingReduction in thenumbersof cattlegrazed in thecorearea of the Delta is in the long term interest of all pastoralists, as well as achieving overall benefits forother land uses including farming, tourism and nature conservation. Precisely how this is done, however,is likely to be a matter of considerable debate. Thecommercial model set out in Scenario B in Volume 2 of the LUP could provide a very effective way ofcontrolling cattle numbers, improving quality of stockand providing higher levels of income. This would,however, necessitate agreement on the areas chosenasfatteningandholdingareas,theestablishmentofanoverallmanagementstructurewhichwouldberuninatotallyhonestandtransparentmannerandthecreationof the necessary infrastructure including a state-of-the-art abattoir, cold stores, refrigerated transportertrucks and marketing agreements in major cities. Thedevelopment of a commercial undertaking of this nature wouldrequireboththelocalknowledgeandexpertiseofcattlebreedersintheDeltaandthespecialistbusinessskills of commercial business entrepreneurs.
7.1.2 Agriculture and LandAkeyobjectiveunderScenarioCistoallocatesufficientlandforhouseholdstobecomeself-sufficient.However,continued growth of population will make it difficultif not impossible to provide every household with 3acres (1.25ha) and thepointwillbe reachedwhere itwouldbepreferabletocreatelargercommunalfarmingenterpriseswhichcanbemanagedmoreefficientlyandeconomically and can generate a surplus of food for sale.Theseissuesarediscussedindetailundersection5.8.1 in Volume 2 (Scenario C) of the Land Use Plan. The assumptionhasbeenmadethatthemaximumallocationof land that should be contemplated for subsistence agriculturewouldbe25,000ha.
Communal and commercial farming is proposed on 3000 ha(forrice)whichequateswiththeareadevelopedbyTARDAtothewestoftheGambasettlement.Thisareashouldbehandedbacktolocalfarmingenterprises,withTARDA providing a service role in provision of watersupplies, machinery and farm inputs, rather than as manager of a state enterprise.
AmajorinitiativeunderScenarioCwouldbethecreationof up to 80 communal farms, each covering 50 ha (4000 ha in total), to be managed along commercial lines to producefoodforlocalconsumptionandfor‘export’tomarkets in Mombasa and Nairobi.
7.1.3 Nature Conservation, Tourism and LandThe third dominant land use, in addition to livestockandagriculture,wouldbearangeofactivitiesbasedonutilising natural resources of the Tana Delta including
its biodiversity and tourism potential. A core area ofhabitats including riverine forest, forests in general, mangrove, and wet grassland in the floodplain wouldcontinuetoserviceawiderangeoffunctions,includingmaterials for house building, food, medicinal plants, honeyandlivestockgrazing. Inaddition,establishmentof nature conservancies to support tourism and strengthen communities would become importantincome-generatingsourcesofnewemployment.
7.1.4 Fisheries and LandThedevelopmentof freshwaterfisheries, envisaged inScenario B, would be continued and extended underScenarioCsincethisisabenignuseoflandwhichcanprovidesignificantincomeaswellasanimportantsourceof food and protein.
7.1.5 Urban Development and LandAn important component of the land use plan and strategyfortheTanaDeltashouldbethepreparationofseparate community development plans for each of the recognisedsettlements.ThestandpointoftheSEAisthatthis represents a significant challenge, because somesettlementshavebeenestablishedwithinthelastthirtyyearsinlocationschosenbecausetheywerethoughttobefreefromtheriskofflooding,orwereinisolatedandremote locationswhere conflictwith other land userswould be reduced. These are all very logical reasons,butunfortunately it isverydifficult toprovide isolatedsettlementswith roads, electricity and sanitation, andthesmallnumberofresidentsseldomjustifiesthecostsofsettingupschools,clinicsandotherpublicservices.
Conclusion and recommendation: The SEA stronglyrecommendsthatahierarchyofsettlementsisapprovedundertheLUPwhereprioritywillbegiventoprovisionofpublicservices.Thesesettlementsshouldincludeasthefirsttier:- Garsen- Witu- Tarasaa- Kipini
Asecondarytierofsettlementsshouldbeidentifiedbasedon detailed surveys undertaken in the next 2-3 years. In developing the listof settlements tobeearmarked forfuture development, careful consideration should begiventothefollowingcriteria:• Is there sufficient adjacent land to allow for
expansion of economic land uses including commercialfarming?
• Is the settlement located in an areawhich is safefromregularflooding?
• Isthesettlementeasilyaccessiblefrommainroadsandservices?
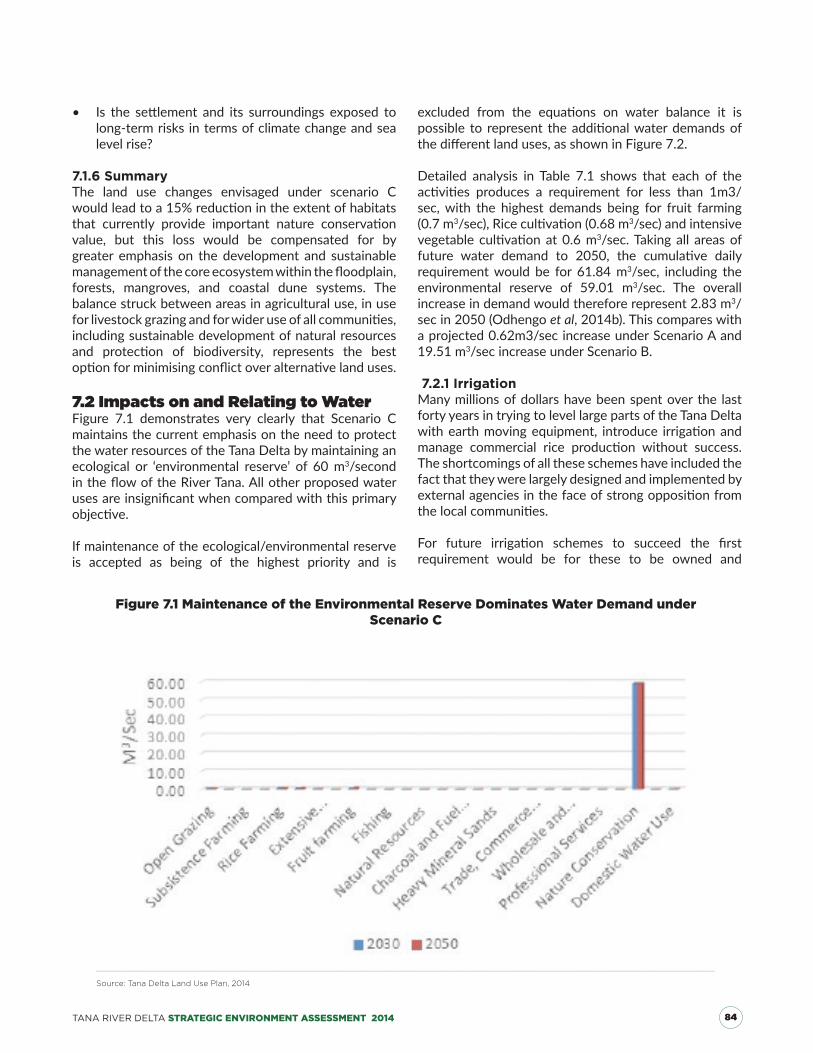
TANA RIVER DELTA STRATEGIC ENVIRONMENT ASSESSMENT 2014 84
• Is the settlement and its surroundings exposed tolong-term risks in terms of climate change and sea levelrise?
7.1.6 SummaryThe land use changes envisaged under scenario C wouldleadtoa15%reductionintheextentofhabitatsthat currently provide important nature conservationvalue, but this loss would be compensated for bygreater emphasis on the development and sustainable managementofthecoreecosystemwithinthefloodplain,forests, mangroves, and coastal dune systems. The balancestruckbetweenareasinagriculturaluse,inuseforlivestockgrazingandforwideruseofallcommunities,including sustainable development of natural resources and protection of biodiversity, represents the bestoptionforminimisingconflictoveralternativelanduses.
7.2 Impacts on and Relating to WaterFigure 7.1 demonstrates very clearly that Scenario C maintains the current emphasis on the need to protect thewaterresourcesoftheTanaDeltabymaintaininganecological or ‘environmental reserve’ of 60m3/second intheflowoftheRiverTana.Allotherproposedwaterusesareinsignificantwhencomparedwiththisprimaryobjective.
If maintenance of the ecological/environmental reserve is accepted as being of the highest priority and is
Figure 7.1 Maintenance of the Environmental Reserve Dominates Water Demand under Scenario C
excluded from the equations on water balance it ispossible to represent theadditionalwaterdemandsofthedifferentlanduses,asshowninFigure7.2.
Detailed analysis in Table 7.1 shows that each of theactivities produces a requirement for less than 1m3/sec,with the highest demands being for fruit farming(0.7 m3/sec),Ricecultivation(0.68m3/sec) and intensive vegetable cultivationat0.6m3/sec. Taking all areas of future water demand to 2050, the cumulative dailyrequirementwould be for 61.84m3/sec, including the environmental reserve of 59.01 m3/sec. The overall increaseindemandwouldthereforerepresent2.83m3/sec in 2050 (Odhengo et al,2014b).Thiscompareswitha projected 0.62m3/sec increase under Scenario A and 19.51 m3/sec increase under Scenario B.
7.2.1 IrrigationMany millions of dollars have been spent over the last forty years in trying to level large parts of the Tana Delta withearthmovingequipment, introduce irrigationandmanage commercial rice production without success.The shortcomings of all these schemes have included the factthattheywerelargelydesignedandimplementedbyexternalagenciesinthefaceofstrongoppositionfromthelocalcommunities.
For future irrigation schemes to succeed the firstrequirement would be for these to be owned and
Source: Tana Delta Land Use Plan, 2014

TANA RIVER DELTA STRATEGIC ENVIRONMENT ASSESSMENT 201485
Figure 7.2 Water Demand under Scenario C Excluding the Environmental Reserve
promotedbythecommunitiesthemselvesinpartnership,whereappropriate,withrelevantbusinessandtechnicalexperts.
A key issue for all irrigation schemes is the need todetermineareliablesourceofwater.AttemptstodiverttheRiverTanaandprovideweirsandsluiceshaveoftenfailed because the river has subsequently adopted a new meander pattern after flooding. The consultantengineersworkingontheFeasibilityStudyfortheHighGrand Falls Dam have stressed the constraints involved intryingtoconstructnewirrigationschemeswithintheLowerTanaDelta,other than refurbishing theexistingIntegrated Rice Project (Odhengo et al, 2012c).
OneoptionthatisbeingwidelyexploredintheMiddleTanaBasinistodivertpartoftheriverflowintocanalsor pipelines from a barrage constructed upstream of Garissaandthentochannelthiswaterontorelativelyflatplateaus of land lying outside the Tana River catchment. Unfortunately, these options would all result in thepermanentdiversionofwaterawayfromtheTana,withdisastrousconsequencesforwaterusersinthesectionsof the Tana basin from Hola to the sea.
If large scale irrigation schemes are to be developedusingwaterfromtheRiverTanaafundamentalprincipleshould be that the diverted water is returned afteruse to themainchannel.There is scope foradditionalirrigationtobeprovidedintheuppersectionoftheTanaDelta between the Primate Reserve and the Garsen-Wituroad,andtherearealsoopportunitiesforcreatingsmallerirrigationschemesinthelowerTanaDeltausingpumps to abstractwater from the river. Before theseschemes can be developed, however, it is essential
that thenecessary storage reservoir isbuiltbelow theHigh Grand Falls Dam, and full hydrological studies are conductedintheUpperandLowerDelta.
7.3 Impacts on and Related to Jobs and livelihoodsThelargestnumberofemploymentopportunitiestobecreatedunderScenarioClieinincreasedself-sufficiencyfor individual farmers. If the amount of land indicated in section 8.2 (up to a total of 25,000 ha by 2050) isallocated to individual farmers thiswould provide theequivalent of 60,000 full time jobs. This approach isrequired in order to meet the anticipated continuedrise in population, without which malnutrition andseverefoodshortageswill increase.However,thetypeofemploymentis limitedtosubsistencefarmingwhichinvolves heavy manual labour and would do little toadjustthegenderimbalancesincemostfarmingactivityiscarriedoutbywomen.
The solution to providinghigher employmentmust liein adding value to local produce through processing, manufacturing and trading and every effort shouldbe focused on creating marketing cooperatives forpackagingandtransportingfoodstuffstomajornationalmarkets. These ideas are incorporated in Scenario C by developing four industrial sites and promoting factorydevelopment for fruit, vegetable and meat processing. Figure 7.3 reveals that up to 10,000 jobs could be created by 2030 and 16,000 jobs by 2050 in trade, commerce, finance, industry andmanufacturing.A further 15,000jobs would be created in communal and commercialfarming by 2030, rising to over 26,000 jobs by 2050 (Odhengoetal,2014b).Thesepredictionsofincreasedemployment in specialised farming and fruit growing
Source: Tana Delta Land Use Plan, 2014

TANA RIVER DELTA STRATEGIC ENVIRONMENT ASSESSMENT 2014 86
Table 7.1 Water Demand of Different Activities
arehighlysignificantbecausethenumberofjobswouldmore than match those created in a local sugar industry. Furthermore,jobsinvegetableandfruitfarmingwouldprovide greater opportunity for local skills development and the creation of individual business enterprisesthan reliance on a monoculture crop under centralised management.
Table7.2showsthattakenacrossalleconomicsectorsthe number of jobs created under Scenario C wouldexceedthoseprovidedbyScenariosAandBwith85,000FTEs created by 2030 and 130,000 FTEs by 2050. The current population forecast of 315,000 people in the
Delta by 2050 is unacceptably high in terms of the demandsthiswouldmakeonlandandwaterresources,but a population of 250,000 could be supported bythenumberof jobscreatedunderScenarioCwith fullemploymentforalleconomicallyactivemembersofthecommunity.
7.4 Impacts on and Related to ValueTable 7.3 shows the value of different activities. Theassessment of alternative crops undertaken as partof ScenarioB reveals thatvegetable production couldbe one of the main economic activities in the Tana
Source: Tana Delta Land Use Plan, 2014

TANA RIVER DELTA STRATEGIC ENVIRONMENT ASSESSMENT 201487
Delta,providing that thenecessary transportationandmarketingfacilitiesaredevelopedintandemwithfoodproduction.TherangeofcropsthatcanbegrownintheDeltaisverywideandthis,combinedwithopportunitiesfor growing three crops a year, provides majoropportunities.SomeenterprisingfarmersfromboththePokomo and Orma communities are already growingtomatoes and other vegetables on a commercial scale in thelowerDelta.
Inordertomakethissectorasuccessitwillbenecessaryto set up a chain of national outlets for the produce,which would be transported in refrigerated containertrucksdirectlytomarketsin10-15hours.Concentrationon high value produce like peppers, tomatoes, and other salad vegetables could generate turnover in excess of 3.5billionKShayearby2030.Withtheadditionofriceand fruit production the gross turnover in agriculturalproduce from communal and commercial farming enterprises could reach 3.8 billion KSh a year by 2030 and 6 billion KSh by 2050.
AmajorcontributiontothelocaleconomyoftheDeltawouldcomefromnewproductsandjobscreatedthroughdevelopment of food processing and manufacturing. Projection of the potential for value added economicactivity is very difficult given the timescales anduncertainties of how markets will develop over thirtyyears or more but taking a range of conservativeestimatesthetotalvalueisexpectedtolieintherangeof4-9billionKShperannumwithanassumedvalueof5
Figure 7.3 Job Creation under Scenario C by 2030 and 2050
billion KSh by 2050 in order to complete the analysis for Figure 7.4 and table 7.3.
AsshowninTable7.2,othersectorsofthelocaleconomywouldadd2.75billionKSh(cattlerearing)and1.3billionKSh (Natural Resources, house-building, charcoal and fuelwood)in2030.By2050,thecontributionfromcattlerearingwouldremainconstantatKSh2.75billion.Thevalue of natural resource harvesting, house-building,charcoalandfuelwoodwouldalsoremainstaticatKSh1.3billionin2050,butalternativetechnologiesincludingsolarpoweranduseofnewbuildingmaterialswouldadda further KSh 1.3 billion.
7.5 Impacts on and Relating to NatureScenario C places a strong emphasis on developing both subsistence and commercial agriculture and manufacturingandindustry.InconsequencetherewillbepressuresonnaturalresourcesintheDelta,particularlyintermsofconversionofwetgrasslandtofarmingareas.These pressureswill need to bemanaged carefully byintroducing localsettlementdevelopmentactionplans,and an overall management plan for the core area of theRamsarsiteinordertopreventrandomgrowthanddevelopmentwhichcouldfragmenttheecosystemandcausedisproportionatedamagetoprecioushabitats.Atthesametime,however,thechoiceoffarmingsystemsand crops would introduce relatively low increases indemand forwater and the overall use ofwater in theDeltawouldincreasebyonly4%by2050.
Source: Tana Delta Land Use Plan, 2014

TANA RIVER DELTA STRATEGIC ENVIRONMENT ASSESSMENT 2014 88
Table 7.2 Jobs by Activity (FTE)
Introduction of cattle management schemes anda reduction in the size of the permanent numberof livestock would have major benefits for natureconservation, with improvement in the condition ofthe remainingareasofwetgrassland.Thiswouldbothenhance natural resource products and create ideal conditionsforthedevelopmentofeco-tourism.
Areas of scrub and thicket close to the floodplain areknown to be of particular value for some species ofsmallbirdswhichareendemic to the regionandmoreresearch is needed to establish the extent of their breeding zone. The areas of thicket and scrub on the upper terraceswould come under increasing pressure
forlandconversionanditwouldbeessentialtodevelopand maintain wildlife migratory corridors which couldalso be used as droving routes for cattle, linking thecoreDeltawiththeouterrangelands.Ultimately,areasclosetothemainroadswouldlosemuchoftheirnatureconservationvalue,butthis isthepredominanthabitattype throughout most of North East Kenya so the consequenceswouldnotbetoosevere.
ImportantchangesarelikelytooccurinthelowerTanaDeltainthosepartsofthefloodplainthatlieatorbelowexistingsealevel.Currentprojectionsofglobalwarminginclude the possibility that mean sea level could rise along the Kenyan coast by 0.25 metres by mid-century and 0.5
Source: Tana Delta Land Use Plan, 2014
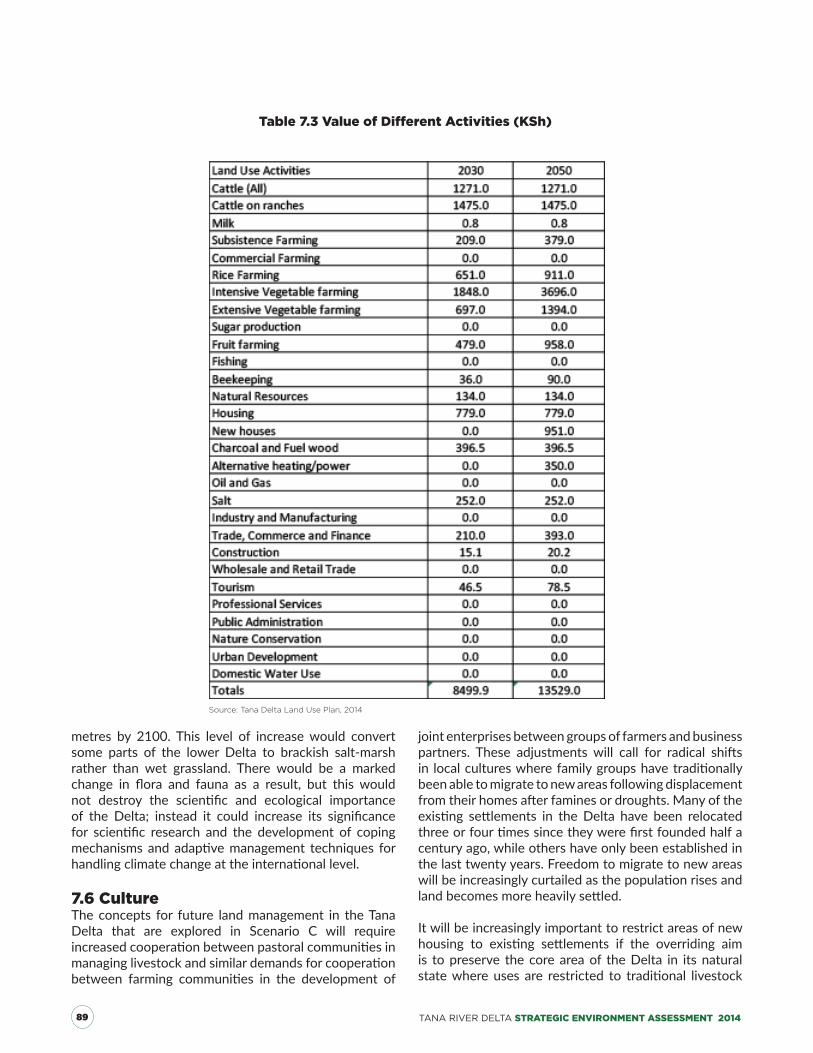
TANA RIVER DELTA STRATEGIC ENVIRONMENT ASSESSMENT 201489
Table 7.3 Value of Different Activities (KSh)
metres by 2100. This level of increasewould convertsome parts of the lower Delta to brackish salt-marshrather than wet grassland. There would be a markedchange in flora and fauna as a result, but this wouldnot destroy the scientific and ecological importanceof the Delta; instead it could increase its significancefor scientific research and the development of copingmechanismsandadaptivemanagement techniques forhandlingclimatechangeattheinternationallevel.
7.6 CultureThe concepts for future land management in the Tana Delta that are explored in Scenario C will requireincreasedcooperationbetweenpastoralcommunitiesinmanaginglivestockandsimilardemandsforcooperationbetween farming communities in the development of
jointenterprisesbetweengroupsoffarmersandbusinesspartners. These adjustments will call for radical shiftsin localcultureswherefamilygroupshavetraditionallybeenabletomigratetonewareasfollowingdisplacementfromtheirhomesafterfaminesordroughts.Manyoftheexisting settlements in theDelta have been relocatedthreeorfourtimessincetheywerefirstfoundedhalfacenturyago,whileothershaveonlybeenestablishedinthelasttwentyyears.Freedomtomigratetonewareaswillbeincreasinglycurtailedasthepopulationrisesandlandbecomesmoreheavilysettled.
Itwillbeincreasinglyimportanttorestrictareasofnewhousing to existing settlements if the overriding aimis to preserve the core area of the Delta in its natural statewhereuses are restricted to traditional livestock
Source: Tana Delta Land Use Plan, 2014

TANA RIVER DELTA STRATEGIC ENVIRONMENT ASSESSMENT 2014 90
Figure 7.4: Gross Value of Economic Activities in 2030 and 2050 under Scenario C
grazing,farmingandtheharvestingofnaturalproduce.If isolated settlementswereallowed toproliferate thiswould increase competition for land and water andultimatelydestroy theexistingpatternsof landuseonwhichindividualpastoralist,farming,fishingandnaturalresourceharvestingculturesarebased.
7.7 SecurityThe process of reducing current tensions in the Tana Deltaoverlandandwaterresourceswillnotbeachievedovernight.Insteaditwillneedtofollowaseriesofsteps.Thefirstobjectiveshouldbetointroducetheconceptsofsharingresources,whichunderpinsalloftheanalysisset out in this SEA. There needs to be a common understanding between pastoralists and farmers thatbothgroupshavelegitimaterightstosharetheresourcesoftheDeltaandanacceptanceofthebasisonwhichthisdivisionwillbemade.ThisistheprincipleofrestrictingcattlerearingandfarmingtodiscreteareasintheDelta.
Ifthisfundamentalprinciplecanbeagreed,asarticulatedin Scenario C and the preferred land use strategy, then
thenextstepwillbetodemarcateactualareasontheground. Historically, enormous levels of distrust have been built up amongst local people because of the opaque and, in some cases, devious techniques used by both government and private investors to mark the boundariesofdisputedownerships.UnderthenewapproachsetoutintheTanaDeltaLUP,theprocessofdemarcatingsettlementboundariesandrelated landusemanagementareaswillbecarriedoutjointly by the County Councils, village elders and the communityatlarge,withtheinvolvementofgovernmentagencieslikeKWSandKFSwhereappropriate.
In addition to physical survey and identification ofland parcel boundaries, a parallel process of resolving historicalinjusticesoverlandallocationandrationalisingland holdings will be required involving the NationalLand Commission, the Courts and government at both NationalandLocallevel.ThefinalresolutionofconflictintheTanaDeltawillonlycomeaboutwhenallpeopleaccept that their grievances have been treated fairly and future land grabbing becomes an impossibility.
Source: Tana Delta Land Use Plan, 2014

TANA RIVER DELTA STRATEGIC ENVIRONMENT ASSESSMENT 201491
CHAPTER8 Summary of Findings on the Existing Situation and Three Scenarios
IntroductionThe preceding four chapters have analysed the likely impacts and outcomes of the existing baseline and potential scenarios on a topic by topic basis, using seven key indicators of change. In this chapter, the findings are brought together by comparing the performance of the baseline and three scenarios against each other, using the following key indicators:1. Demand for land for the principal land uses and economic activities envisaged in the Tana Delta,2. Water requirements for the principal land uses and economic activities, 3. Job creation and impacts on livelihoods arising from (1),4. Economic value of the planned land uses and activities.5. Social Impacts6. Impact on Biodiversity
8.1 Demand for LandThe assessment of land requirements for each type of economic activity is relatively straightforward, butinterpretingthecumulativeeffectofdifferentdemandson the finite resources within the Delta is morecomplicated.
First, there isgreatvariation in termsofexactlywhichparts of the Delta might be developed for particularuses;forexample,anewcommercialvegetablesfarm.
Second,asonetypeoflanduseactivityexpandsitwillhave inevitable consequences for others by forcing them to occupy smaller areas;where twomajor uses are indirect competition, as in the case of livestock grazingand farming, the outcome may be very uncertain.
Third, many land uses can be carried out simultaneously on the same area of land; at one level of productionthese uses may be sustainable (nature conservation,natural resource harvesting and limited grazing inforests) but if competition increases, productivity willfallandultimatelytheresourceitselfwillbedestroyed.
These variables have been assessed in general terms in examining the effects of different scenarios and someinitial conclusions are drawnbelow. Itmust be noted,however, that theseareonly indicativeandcannotberelied upon to predict the future of the Delta.
Tables 8.1 and 8.2 show the amount of land neededto support specific economic activities in their ownright,withoutanyconsiderationofthepracticalitiesofmeetingtheseneedsin2030and2050.Thecumulativefigures generated through this process are greatly inexcessofthelandareaintheTanaDelta,indicatingthatmajor compromises and trade-offs would be neededbetweenthedifferentinterests.
The information in Table 8.1 and Table 8.2 has beenused to construct representative changes in the basiclandusetypeswithintheDeltaPlanAreaasshowninTables 8.3 and 8.4 and Figures 8.1 and 8.2. Scenario A, continuationoftraditional livelihoods,hasthegreatestimpact in land demand, due to assumed expansion in the number of livestock. Scenario B causes the greatest changesfromnaturalhabitatstocommercialcultivation,whileScenarioClargelymaintainsthestatusquo.

TANA RIVER DELTA STRATEGIC ENVIRONMENT ASSESSMENT 2014 92
Table 8.1 Demand for Land by Different Economic Activities; All Scenarios in 2030
Source: Tana Delta SEA, 2014

TANA RIVER DELTA STRATEGIC ENVIRONMENT ASSESSMENT 201493
Table 8.2 Demand for Land by Different Economic Activities; All Scenarios in 2050
Source: Tana Delta Land Use Plan, 2014

TANA RIVER DELTA STRATEGIC ENVIRONMENT ASSESSMENT 2014 94
Figure 8.1 Gross Demand for Land for Scenarios A, B & C in 2030 Compared with the Existing Situation in 2010
Table 8.3 Gross Demand for Land for Scenarios A, B & C in 2030 Compared with the Existing Situation in 2010
Source: Tana Delta SEA, 2014
Note: 1= Existing; 2 = Scenario A; 3 = Scenario B; 4 = Scenario C

TANA RIVER DELTA STRATEGIC ENVIRONMENT ASSESSMENT 201495
Figure 8.2 Gross Demand for Land for Scenarios A, B & C in 2050 Compared with the Existing Situation
Table 8.4 Gross Demand for Land for Scenarios A, B & C in 2050 Compared with the Existing Situation in 2010
Source: Tana Delta SEA, 2014
Source: Tana Delta SEA, 2014

TANA RIVER DELTA STRATEGIC ENVIRONMENT ASSESSMENT 2014 96
8.1.1 CommentaryUnderScenarioA(2)continuedexpansioninthenumberof livestock leads to increasing damage to accessible naturalhabitatsandareductioninfarmingareas.Forestsand areas of dry farmland are reduced to degraded thicketandscrubcover.Thecoreareaofthefloodplainremains intact but its biodiversity is greatly reduced through over-grazing. Population growth cannot besustained and the Tana Delta becomes ungovernable as rivalcommunitiesclashcontinuously.
Under Scenario B (3) the creation of 235 squarekilometres of commercial farming and irrigated industrial cropping of sugarcane destroys the heart of thefloodplain,reducingtheremainingwetgrasslandstoless than half their present extent. Subsistence farming is driven into the drier areas and results in conversion of thicket and scrub to dryland farming. The scale of land use change causes massive social disruption, 30,000–40,000 inhabitantshave tobe resettledonmarginalland or relocated on new irrigated areas far removedfrom the Tana Delta. The degree of social readjustment required under this scenario is unlikely to be achieved without massive conflict and the destruction of theDelta environment.
Scenario C (4) requires a high degree of compromise between farming and pastoral communities in orderto maintain the present extent of the floodplain wetgrasslands and expand commercial and communal farming by cultivating and irrigating areas of currentthicket and scrub. It also requires major emphasis on
creatingneweconomicactivitiesthroughvalueadditionand industrial development. It offers a way forwardwhich would avoid conflict and benefit all sectors ofsociety, while also greatly increasing food productionandachievingfoodsecurityfortheDeltaandprotectingitsbiodiversityandtourismpotential.
8.2 Water RequirementsThe annual water demand of the three scenarios(expressed as the equivalent of m3/sec) is shown inTable 8.5 and Figure 8.3. Individual demands for the differenteconomicactivities included ineachscenarioareshownintables9.6and9.7.TherelativedifferencebetweenthethreescenariosispartiallymaskedinFigure9.3bythefactthatallscenariosutilisethefullcapacityof the River Tana to support existing livelihoods,economicactivitiesandtheecosystem.TheinformationisthereforepresentedinadifferentformatinFigure9.4,by excluding the current baseline demand of 60m3/sec.
The analysis shows clearly that both scenarios A andC make only a small increase in demand for water(with increasesof1.3%and3%respectivelyby2050).However,developmentofa largeirrigationschemeforsugarproductionandothercommodities inScenarioBwould lead toa32% increaseof19.51M3/secabovetheexistinglevels,whichwouldnotbeenvironmentallysustainable,evenifincreasedstoragewereprovidedinthe upper River Tana (sincemost of the storedwaterwouldbe lostthroughevaporationandseepage inthemiddle River Tana catchment).
Table 8.5 Demand for Water in M3/Sec for Each Scenario in 2010, 2030 and 2050
Source: Tana Delta SEA, 2014

TANA RIVER DELTA STRATEGIC ENVIRONMENT ASSESSMENT 201497
Figure 8.4 Increase in Water Demand over the Base Rate of 60m3/sec
Figure 8.3 Demand for Water in M3/Sec for Each Scenario in 2010, 2030 and 2050
Source: Tana Delta SEA, 2014
Source: Tana Delta SEA, 2014
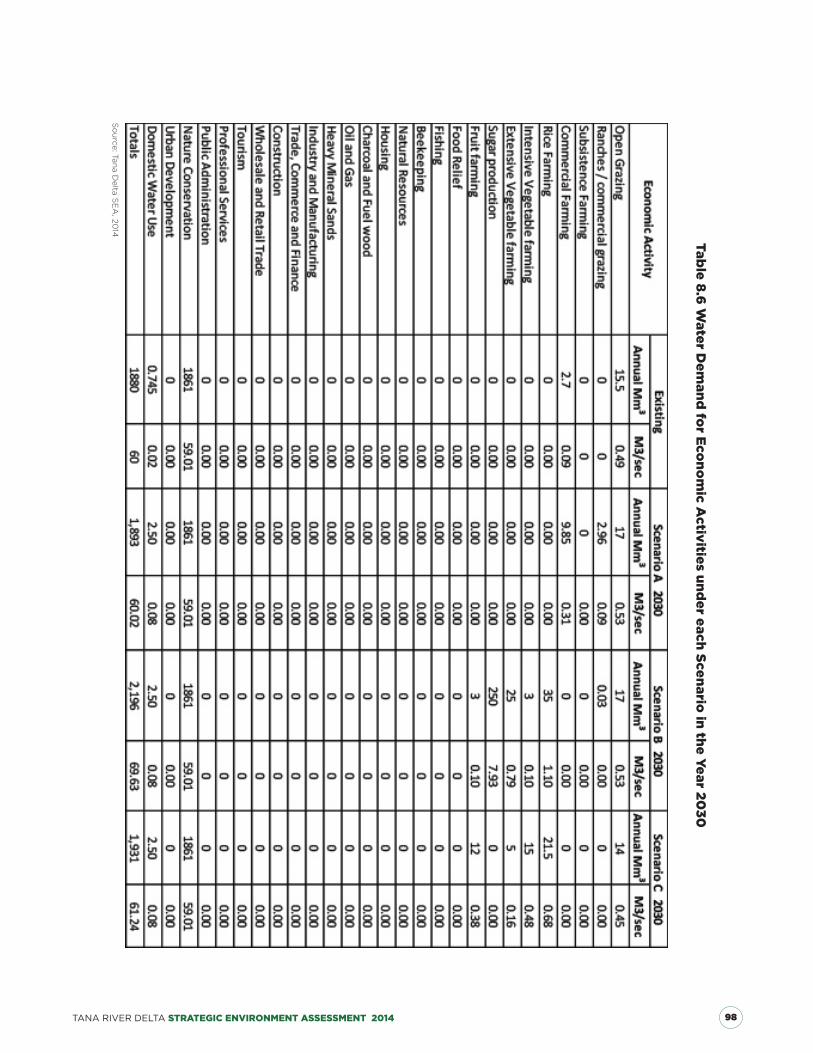
TANA RIVER DELTA STRATEGIC ENVIRONMENT ASSESSMENT 2014 98
Table 8.6 Water D
emand for Econom
ic Activities under each Scenario in the Year 20
30
So
urce: Tan
a Delta S
EA
, 2014

TANA RIVER DELTA STRATEGIC ENVIRONMENT ASSESSMENT 201499
Table 8.7 Water Demand for Economic Activities under each Scenario in the Year 2050
Source: Tana Delta SEA, 2014
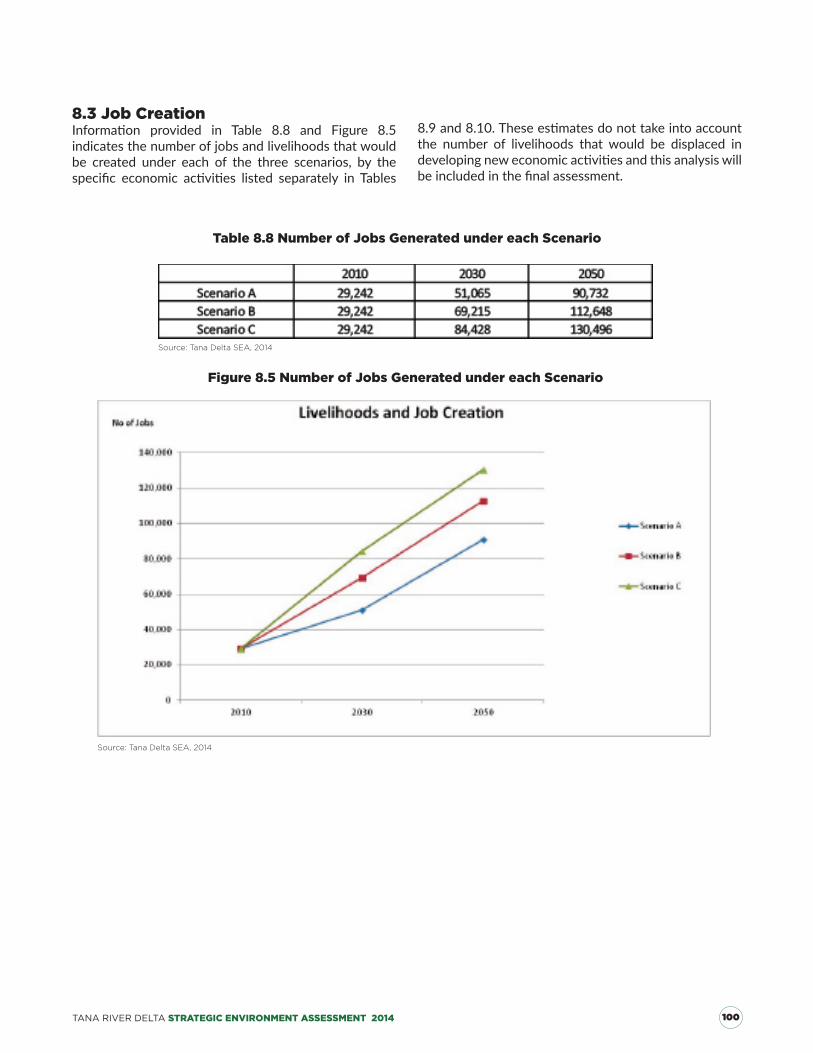
TANA RIVER DELTA STRATEGIC ENVIRONMENT ASSESSMENT 2014 100
8.3 Job CreationInformation provided in Table 8.8 and Figure 8.5indicatesthenumberofjobsandlivelihoodsthatwouldbe created under each of the three scenarios, by the specific economic activities listed separately in Tables
Figure 8.5 Number of Jobs Generated under each Scenario
Table 8.8 Number of Jobs Generated under each Scenario
8.9and8.10.Theseestimatesdonottakeintoaccountthe number of livelihoods that would be displaced indevelopingneweconomicactivitiesandthisanalysiswillbeincludedinthefinalassessment.
Source: Tana Delta SEA, 2014
Source: Tana Delta SEA, 2014

TANA RIVER DELTA STRATEGIC ENVIRONMENT ASSESSMENT 2014101
Table 8.10 Jobs and Livelihoods Created by Economic Activity by 2050
Table 8.9 Jobs and Livelihoods Created by Economic Activity by 2030
Source: Tana Delta SEA, 2014
Source: Tana Delta SEA, 2014

TANA RIVER DELTA STRATEGIC ENVIRONMENT ASSESSMENT 2014 102
8.4 Economic ValueThe relative economic value of the three scenarios isshowninTable8.11andFigure8.6.Thesearebasedonthegrossadditionofthevalueofallpotentialdevelopmentsexaminedundereachscenariowithoutconsideringthepracticalities of physically accommodating them all inthePlanarea.The full rangeofvalues isbrokendownbyactivityinthetimeframesof2030and2050inTable8.12 and 8.13.
In the case of Scenario A the main economic value is generated by assuming that the size of the permanent cattleherdcouldbeincreasedtomatchtheaspirationsofpastoraliststoowntheirownherds.Thisiscompletelyimpractical because an area two and a half times the
sizeoftheDeltawouldbeneededtoprovidesufficientgrazing.
In the case of Scenario B, the accumulated value arises fromthefactthatalargenumberofcompetinglandusesareincluded(includedirrigatedriceandsugarinadditionto expansion of subsistence and community farming). There is insufficient landorwater toaccommodateallof these potential uses and the social and biophysicalconsequences would be disastrous, resulting inuncontrollableinstabilityandconflictwithinafewyears.
OnlyScenarioCapproachesarealisticallocationoflanduses that could be accommodatedwithin the physicaland socio-economic constraints of the Delta.
Figure 8.6 Notional Economic Value Assessed in KSh Million for the Three Scenarios
Table 8.11 Notional Economic Value Assessed in KSh Million for the Three Scenarios
Source: Tana Delta SEA, 2014
Source: Tana Delta SEA, 2014

TANA RIVER DELTA STRATEGIC ENVIRONMENT ASSESSMENT 2014103
Table 8.12 Full Range of Economic Activities Considered in the Three Scenarios in the Year 2030
Source: Tana Delta SEA, 2014

TANA RIVER DELTA STRATEGIC ENVIRONMENT ASSESSMENT 2014 104
Table 8.13 Full Range of Economic Activities Considered in the Three Scenarios in the Year 2050
Source: Tana Delta SEA, 2014

TANA RIVER DELTA STRATEGIC ENVIRONMENT ASSESSMENT 2014105
8.5 Adjustments to the Economic Values of the Three ScenariosIn order to adjust Scenarios A and B to represent a more realisticpictureofeconomicdevelopment,amodificationorvariantofScenarioA(A1)wasproducedwhichlimitsthe number of cattle to the existing carrying capacityof the Delta. In addition, Scenario B1 was producedtorepresentamaximumlevelofirrigationpotentialbyexcludingsugarproduction(whichhasthehighestwaterdemandandcausesmaximumdisruptiontoexistinglanduses, livelihoods and biodiversity).
The consequences of these adjustments are shown intable9.14andfigure9.7.
The net result of the adjustments described above is to bring the economic value of the three scenarios more closelyintolinewitharangefromKSh7.2to15.6Billion.ScenarioArelyingontraditionallivelihoodswouldhaveavalueroughlyhalfthatoftheothertwo.However,thedifference between Scenarios B and Cwould only be15% (2 billion KSh).
The net result of the adjustments described above is to bring the economic value of the three scenarios more closelyintolinewitharangefromKSh7.2to15.6Billion.ScenarioArelyingontraditionallivelihoodswouldhaveavalueroughlyhalfthatoftheothertwo.However,thedifference between Scenarios B and Cwould only be15% (2 billion KSh).
Figure 8.7 Addition of Scenarios A1 and B1 Showing Notional Economic Value Assessed in KSh Million
Table 8.14 Addition of Scenarios A1 and B1 Showing Notional Economic Value Assessed in KSh Million
Source: Tana Delta SEA, 2014
Source: Tana Delta SEA, 2014

TANA RIVER DELTA STRATEGIC ENVIRONMENT ASSESSMENT 2014 106
8.6 Social and Cultural ImpactsCurrentsocialconditionsintheTanaDeltaareadverselyaffectedbyhighlevelsofpoverty,lowlevelsofliteracyandlackofopportunitytoimprovewelfareandlivelihoods.Eachofthethreescenarioswouldofferinitialscopeforimprovementoverthecurrentconditionsbutpressuresandconflictswouldincreasewithrisingpopulation.
InthecaseofScenarioA,tensionsbetweenthefarmingand pastoral communities would be exacerbated bycontinuing growth and competition between theseprincipal land uses as grazing activities encroachedmoreheavily intoexistingfarmingareas,whilefarmingpracticeswereextendedinturnintotraditionalgrazingareas. In the absence of any significant new incomesources the scope for tackling poverty and addressing welfareandeducationalconstraintswouldbeverymuchrestricted.
ScenarioBwouldprovidemuchgreateropportunityforraisingindividualincomelevelsandstimulatingthelocaleconomy but at the same time development of largecommercial or industrial farming projectswould causemassive disruption to existing communities’ lifestylesand sources of livelihood based on livestock rearing and naturalresourceharvesting.Thechangesinlanduseandenforced resettlement of large numbers of people (inexcessof20,000individuals)wouldcausebitterdisputesand, given the recent clashes in the Tana Delta, it is hard toenvisagehowthechangescouldbemanagedwithoutserious threats of violence.
Scenario C is designed to reduce the levels of both social and cultural impacts by setting out potentialdevelopmentprogrammes tobenefit all sectorsof theexistingcommunitiesincludingcattlebreeders,farmersandfishers.Sincetheareasoflandinvolvedarefinite,asignificantdegreeofcompromisewillbecalledforfromallpartiesanditwilltaketimetobuildtrustinthenew
administrations (the CountyGovernments) and ensurethat all interests are treated fairly. Nevertheless, if the proposedlandusestrategywhichisbasedonScenarioC is promotedvigorously, substantial improvements ineconomicconditionsshouldbeachievedwithinthefirstpart of the plan period and this should help to reduce the currentfrictionsbetweendifferentlandusers.
8.7 Biodiversity ImpactsTheTanaDeltaisofinternationalimportance,primarilybecauseofitswetlandhabitats,althoughthesearenotcurrently in ideal condition. Reduction in river flows,increased drought and rising sea level have contributed to somedeterioration,togetherwithincreaseddisturbanceandcompetitionoverresources.
In theory, Scenario A would create more sustainableformsoflanduseinthelongterm,butinpractice,verydifferentresultsarelikelyasthegrowingpopulationseeksto exploit the same basic resources and competitionintensifiesbetweenfarmingandlivestockrearing.
ScenarioBwouldhaveadramaticimpactonbiodiversitybydestroyingthecoreareaoffloodplaingrasslandinarelativelyshorttime(lessthan20years).Lossofprimewoodland habitat and the conversion of thicket andscrubtofarmlandwouldleaveverylittleofthecurrentRamsar site area intact.
ScenarioCwouldseeincreasingpressuresonsomeareasof the Delta from commercial grazing and communal and/or private sector farming projects, but the scenario is designed to retain the core area of the Delta intact and to offer significant opportunities to manage thisarea through community based programmes in order to stimulatenatureconservationandcreatemajortourismopportunities.Thisscenario isregardedasofferingthebest long term solution to wise use and sustainabledevelopment in the Delta.

TANA RIVER DELTA STRATEGIC ENVIRONMENT ASSESSMENT 2014107
CHAPTER9 Conclusions and Recommendations
IntroductionThis final chapter is divided into two parts. Part One discusses the principal findings of the SEA in relation to the wider issues affecting the whole of the River Tana basin, while Part Two examines the actions that are needed specifically within the Tana Delta.
PART ONE
This part of the final chapter on conclusions andrecommendations considers the macro-economicdevelopment trends that are likely to have significanteffects on the future economy, environment, socialwelfareof communitiesandenvironmentof the lowerRiverTanaBasinandtheTanaDeltainparticular.
9.1 Economic Development InitiativesTwo typesof regional development initiativehave thepotentialtomakemajorchangestotheeconomy,socialwelfareandenvironment,notjustoftheRiverTanabasinbut to the country of Kenya as awhole.The first areinitiativesthatareplannedaspartofmanagednationaldevelopment programmes, currently represented by Vision2030;thesecondareinitiativesthatemergeinamorespontaneousformfromthepoliticalaspirationsofsuccessiveadministrationsduringtheirperiodsinoffice.
9.1.1 Vision 2030Vision 2030 proposes extensive development in the River Tana Basin including the bulk of the country’sfutureirrigationschemes,thegenerationofhydro-powerandwatersupplytogrowingindustrial,commercialandresidentialusersthroughoutthenortheast.Theseareallimportantandworthwhileobjectivesbut,unfortunately,a seriousweakness in the formulation ofVision 2030during the period 2000-2010 was the absence ofany form of SEA or equivalent strategic assessment of the likely adverse aswell as positive effects of thedevelopment strategies on social and environmental conditions.
It is recommended that:SEA 1 A comprehensive assessment should be undertaken to establish what the cumulative impactsof individual developments is likely to be on each other and on the social, local economic and environmental conditions of areas downstream of the planned HighGrand Falls Reservoir.
SEA2 A water balance model should be preparedby Water Resources Management Authority for the lower River Tana basin which incorporates existingandfuturedemandandbuildsinrealisticestimatesforthe environmental reserve that is needed in the river floodplainbetweentheHighGrandFallsReservoirsiteand theTanaDelta.Aminimumriverflowof60cubicmetres per second at Garsen is needed to maintain the natural ecosystem of the Tana Delta and the ecological services it provides.
9.1.2 Individual InitiativesGovernments are inclined to launch large scale agricultural projects covering hundreds of thousands ofhectaresasawayofdemonstratingcommitmenttoimpoverishedareaswithoutinvestigatingallofthecriticalissues that can ensure success, including the availability ofwater,existenceofmarkets,meansoftransportandtraining of management and labour. Examples have includedthelaunchofthenewPortofLamuforwhichanEIAwasprovidedforonlythefirst3of33plannedberths. Another recent project has involved the launch of a 440,000 ha agricultural project on the Galana/Kulalu ranchwhich straddles the Athi and Tana Rivercatchmentsbutforwhichthere isnopublicstatementon the likelyenvironmental effects. Finally, oneof theprojectsthatwillhavethegreatestimpactonthemiddleand lower reaches of the River Tana Basin, the HighGrand Falls Dam, is reported to be accompanied by a Strategic Environmental Assessment but this document is not publicly available.
It is recommended that:SEA 3 All government projects in the Tana River Basin involving more than 10,000 Hectares of land should be subjected to an independent strategic environmental assessment before a decision is made to confirm theproject.
SEA 4 A study should be undertaken to assess the importanceofcommunitieslivinginthemiddlesectionoftheRiverTanaBasin(betweenHighGrandFallsDamand the Primate Reserve).
The Tana River Basin

TANA RIVER DELTA STRATEGIC ENVIRONMENT ASSESSMENT 2014 108
PART TWO
This study should assess the current and futurewaterdemand in these communities and the likely impactsof the High Grand Falls Dam upon them and on further downstreamusers.
Recommendations:SEA 5 Charcoal burning and firewood collectionthreatens to destroy areas of forest and other important habitatswithintheTanaDeltaandoptionsforpromotingalternativetechnologiesshouldbeexploredforcookingandprovisionofpowerinruralhomes.
SEA 6 Residents in the Tana Delta should be encouraged tomovetosettlementsthatcanbeservicedeasilyfromthe existing road network and which lie outside thefloodplain.Thismeasureisnecessaryinordertoreducecostsofprovidingservicestoremotesettlementsandtoimprovecontrolsoverfloodrisk.
SEA 7 The tendency for temporary camps used by herdsmen in isolated parts of the Delta to be converted into permanent villages should be discouraged through the planning process. This measure is necessary in order toreducedpressureonthemostsensitivepartsofthefloodplainforbiodiversityandnatureconservationandtominimisethenumberofpeoplewholiveinareasthatareexposedtomaximumfloodrisk.
SEA 8 The National Land Commission should treatthe Tana Delta as a special case for urgently addressing thequestionsoflandownershipandtheissuingoftitledeedstoresidentsand localcommunities.ThebiggestchallengetosecurityintheDeltaisthelackoftitledeeds
The Tana River Delta
for local residents and the historic practices wherebyland has been distributed by the government to public agencies or private investors without observing legalrequirements for consultation and prior notification.Inwardmigration into theDelta on landwithout legalownershipisalsoasourceofconflictandenvironmentaldegradation.
SEA 9 The Land Use Plan should introduce an upper threshold on the number of livestock to be kept withintheTanaDeltaintheinterestsofprotectingthefloodplain grasslands and preventing future conflictsovercompetinglanduse.The number of cattle that are driven into the Deltaduring each dry season is already above the natural carrying capacity of the grasslands, and the pressure is increasing year on year. SEA 10 No irrigated cropping of sugarcane should be undertakenintheTanaRiverDelta.TheSEAhasshownthatthistypeofirrigationwillconsumeanunacceptableamountofwater,thusdeprivingotherlandusessuchasfarming,ranchingandnatureconservation.
SEA 11 Factories for value addition to local produceneedtobeactivelypromoted.Thesetoincludeamodernslaughterhousetoofftakeexcesscattleandafruitjuiceprocessing plant to process existing and future fruitcrops.
SEA 12 The Land Use Plan should place high priority on raising the standard of living for the majority of people whoare living in theDeltabyproposing strategiesonsustainableagricultureanddiversificationoflivelihoods.It is unacceptable that a high percentage (70%) of the populationarelivinginpovertywithintheDeltaand15-20% regularly receive food aid from the Government.

TANA RIVER DELTA STRATEGIC ENVIRONMENT ASSESSMENT 2014109
Aklilu, Y., Irungu, P. and Reda, A. (2002). An Audit oftheLivestockMarketingStatus inKenya,Ethiopia andSudan. Vol 1 Pan African Programme for the Control of Epizootics
Allen, R., Pereira, L., Raes, D. and Smith, M. (1988). Introduction to Evapotranspiration. CropEvapotranspiration - Guidelines for computing cropwaterrequirements.FAOIrrigationanddrainagepaper56. Food and Agriculture Organization of the UnitedNations (FAO), Rome http://www.fao.org/docrep/x0490e/x0490e04.htm
Arasio, R.L. (2003). Participatory Assessment andAnalysis of LivestockMarkets, off take andMarketingConstraints in Loima Division, Turkana District, Kenya. Thesis Report, MSc Veterinary Epidemiology and Economics. University of Nairobi
Archondo-Callao, R. (2000). Roads Works Costs per Km. ApresentationpreparedusingextractsfromWorldBankReports
Ardjosoediro I. and Neven D. (2008). The Kenya Capture Fisheries Value Chain: The AMAP-FSKG Value Chain Finance Case Study. Micro report no. 122. USAID
Awiti,A.(2013).Kenya:WaterUseWillDefineCountyDevelopment. The Star. Posted on 19th March 2013
Barnes, C., Ensminger, J., and O’Keefe, P. Ed. (1984).Energy Environment and Development in Africa 6. Wood Energy andHouseholds: Perspectives on Rural Kenya.The Beijer Institute andThe Scandinavian Institute ofAfricanStudies,Sweden
Bekure,S.,deLeeuw,P.N.Grandin,B.E.andNeate,P.J. H. (eds). (1991). Maasai herding: An analysis of the livestock production system of Maasai pastoralists ineastern Kajiado District, Kenya. ILCA Systems Study 4. InternationalLivestockCentre forAfrica,AddisAbaba.pp 172 http://www.fao.org/wairdocs/ilri/x5552e/x5552e00.htm
Bennun, L. and Njoroge, P. (1999). Important Bird Areas in Kenya. East Africa Natural History Society.
Biovision Foundation for Ecological Development(2012).LeatherProduction.Postedon20thJune2012www.infonet-biovision.org/print/ct/594/products
Chapin, F.S., Diaz, S., Howden, M., Puigdefábregas,J. and Smith, M.S. (1995). Rangelands in a Changing Climate:Impacts,Adaptations,andMitigation.Impacts,
Adaptations and Mitigation of Climate Change:Scientific-TechnicalAnalysesAssessmentofImpactsandAdaptationOptions.PartII(2):134-157
Chinese Tanneries in Africa. PHISS Company http://www.phiss.com/
Citizens Network for Foreign Affairs (2012). FodderFarmingIncreasesHousehold’sIncomethroughUSAID/KDLDPInitiatives.Postedon20thAugust2012http://www.cnfa.org/resource/fodder-farming-increases-households-income-through-usaidkdldp-initiatives/
Cousins, J. A., Sadler, J. P. and Evans, J. (2008). Exploring theRoleofPrivateWildlifeRanchingasaConservationToolinSouthAfrica:StakeholderPerspectives.Ecologyand Society 13(2): 43. http://www.ecologyandsociety.org/vol13/iss2/art43/
CreamerMedia (2013).ExtractionofTitaniumSand inKenyatoStart.Postedon17thSeptember2013http://www.miningweekly.com/article/extraction-of-titanium-sand-in-kenya-to-start-2013-09-17
DailyNation (2013).TheHighGrandFallsDam.Articleposted on 1st July 2013
de Padua, D. (1988). The Rice Business. Rice Post-harvest e-mailConferenceDraftSummary.V.1.2.TheFoodandAgriculture Organization of the United Nations (FAO)http://www.fao.org/docrep/x5427e/x5427e0i.htm
der Kooij, P. and Voermans, E.L. (2013). Integrated Water Resources Management in the Tana Delta, Kenya
Doig A. (2007). Solar Photovoltaic (PV) Energy-Appropedia:Thesustainabilitywiki.AnarticlebasedonaTechnical Brief by PracticalActionwww.appropedia.org/Solar_Photovoltaic_(PV)_Energy
DominionFarms(2011).LifeoutoftheYalaswamp
Eiseltová, M., Pokorný, J., Hesslerová, P. and Ripl,W.Evapotranspiration – A Driving Force in LandscapeSustainability 14: 307-327
Emerton, L. (2003). Tana River, Kenya: IntegratingDownstream Values into Hydropower Planning. CaseStudies in Wetland Valuation No. 6. In IUCN (Ed),IntegratingWetland EconomicValues into River BasinManagement. Colombo: Water and Nature Initiativeand Ecosystems and Department for InternationalDevelopment. http://cmsdata.iucn.org/downloads/casestudy06tana.pdf
REFERENCES

TANA RIVER DELTA STRATEGIC ENVIRONMENT ASSESSMENT 2014 110
Fairtrade Foundation (2010). Home Grown KenyaLimited. Vegetable and Flower Producer, Kenyahttp://server-e9-11.hosting.imerja.com/producers/vegetables/homegrown_kenya.aspx
Famine Early Warning Network System (2011).LivelihoodsZoning“Plus”ActivityinKenya
FAO (2004). International Year of Rice 2004. Rice isLife. A Fact Sheet on Rice by The Food and Agriculture Organizationof theUnitedNations (FAO)http://www.fao.org/rice2004/en/f-sheet/factsheet1.pdf
Ferreira,S.(2012).TheClintonsinHaiti:CananIndustrialPark Save the Country? Posted on 25thAugust 2012http://world.time.com/2012/10/25/the-clintons-in-haiti-can-an-industrial-park-save-the-country/
Fielding,R., Boak,R. andJowett,A. (2012).ReviewofSustainable Building Materials and Design. Lessons to DateandRecommendations.BuilditInternational
Fisher and Sons (2013). Extraction Technologies forMedicinal and Aromatic Plants: Fisher Builds AmwayBotanical Plant in Quincy. Posted on 11th July 2013. www.fishersons.com/about-us/news/5-news/86-fisher-builds-amway-botanical-plant-in-quincy.html
Fitzgibbon, C. (2012). Economics of Resilience Study – Kenya Country Report https://www.gov.uk/government/uploads/system/uploads/attachment_data/file/228500/TEERR_Kenya_Background_Report.pdf
Food and Agricultural Organization of the UnitedNations (2009).ValueChainAnalysis.ACaseStudyofMangoes in Kenya
GovernmentofKenya(2012).Kenya’sLAPSSETCorridorMangoProductionInvestmentOpportunity.MinistryofAgriculture
Frenken, K. (2005). Irrigation in Africa in figures.AQUASTAT Survey 2005. FAO Water Report No 29. FoodandAgricultureOrganizationoftheUnitedNations(FAO), Rome
Gachuiri, C., Lukuyu, M., Lusweti C. andMwendia, S.(2012).FeedingDairyCattle inEastAfrica.EastAfricaDairy Development Project
Gari, A. (2013). Kenya: Tana Delta Leaders Want IrrigationProjectStopped.TheStar.Postedon6thMay2013 http://m.allafrica.com/stories/201305060280.html/
Gichuhi, F. (2012). Kenya: Nairobians Hunt for Office Space in the City’s Outskirts. The Star. Articleposted on 1st August 2012 http://allafrica.com/stories/201208020537.html
Godsmark, R. (2010). The South African Forestry and ForestProductsIndustry2009.Apresentationcompiledby Forestry South Africa
Government of Kenya (1974). National DevelopmentPlan 1974-1979. Government Printers, Nairobi
Government of Kenya (2007). Kenya Vision 2030 popularversion.http://www.vision2030.go.ke/cms/vds/Popular_Version.pdf
Government of Kenya (2008). Tana River District Environment Action Plan 2009-2013. NationalEnvironment Management Authority
Government of Kenya (2009). State of the Coast Report. TowardsIntegratedManagementofCoastalandMarineResourcesinKenya.NationalEnvironmentManagementAuthority (NEMA), Nairobi. pp 88
Government of Kenya (2010). 2009Kenya PopulationandHousingCensusVol1A.KenyaNationalBureauofStatistics,Nairobi.
Government of Kenya (2010). Environmental and Social ManagementFramework&IndigenousPeople’sPlanningFrameworkforTheKenyaCoastalDevelopmentProject.KenyaMarineandFisheriesResearchInstitute
Government of Kenya (2010). REDD Readiness PreparationProposalKenya.Annexes.29thApril2010Draft.KenyaForestService
Government of Kenya (2011). Arid Lands Early Warning Bulletin.TanaRiverDistrict.DroughtMonitoringBulletin,February 2011. Ministry of State for Development of Northern Kenya and other Arid Lands Arid Lands Resource Management Project II
Government of Kenya (2011). The 2011/12 Short Rains Season Assessment Report. A Collaborative report ofthe Kenya Food Security Steering Group.
GovernmentofKenya (2012).KenyaFacts andfigures2012.KenyaNationalBureauofStatistics
GovernmentofKenya(2012).Kenya’sLAPSSETCorridor.Livestock Investment Opportunity
REFERENCES

TANA RIVER DELTA STRATEGIC ENVIRONMENT ASSESSMENT 2014111
Government of Kenya (2012). Master Plan for the Conservation and Sustainable Management of WaterCatchment Areas in Kenya
Government of Kenya (2012). Tana River County. DroughtmonitoringandEarlyWarningBulletin,October2012.NationalDroughtManagementAuthority
Government of Kenya (2012). The County Governments Act 2012
Government of Kenya (2012). The Translation ofDevolved Governments Act 2012
Government of Kenya (2012). Water Resources Management Authority Strategic Plan 2012-2017
GovernmentofKenya (2013).Draft IntegratedCoastalZone Management Policy. Ministry of Environment,Water and Natural Resources
Government of Kenya (2013). Leading Economic Indicators.KenyaNationalBureauofStatistics
GovernmentofKenya(2013).NationalClimateChangeActionPlan2013-2017.Vision2030
Government of Kenya (2013). Second Medium Term Plan, 2013 – 2017 Transforming Kenya: Pathway toDevolution, Socio-economic Development, Equityand National Unity. Kenya Vision 2030, Ministry ofDevolutionandPlanning
Government of Kenya (2013). Tana River County. Drought monitoring and EarlyWarning Bulletin, June2013.NationalDroughtManagementAuthority
Government of Kenya (2013). Tana River County. Drought monitoring and Early Warning Bulletin, May2013.NationalDroughtManagementAuthority
Government of South Africa (2011). NationalDevelopment Plan. Chapter 6. An Integrated and InclusiveRuralEconomy.pp194-216.NationalPlanningCommission
Haan, C., Steinfeld, H., Blackburn, H. (2007). Livestock & the environment: Finding a balance. Report of a Study bytheCommissionof theEuropeanCommunities, theWorld Bank and the governments of Denmark, France, Germany, The Netherlands, United Kingdom and The United States of America.
Habitat for Humanity International (2010). CountryProfile:Kenya.HabitatforHumanityInternational
Hacker,S.(2014).StepbyStep:SupportingIncremental14 Building through Housing Microfinance. Shelterreport2014.HabitatforHumanityInternational.
Hamerlynck, O., Nyunja J., Luke, Q., Nyingi, D., Lebrun, D.andDuvail,S.(2010).Thecommunalforestwetland,rangeland and agricultural landscape mosaics of the lowerTana,Kenya:Asocio-ecologicalentity inperil. InBelair,C.,Ichikawa,K.,Wong,B.Y.L.andMulongoy,K.J.(Eds), Sustainable use of biological diversity in socio-ecological production landscapes, background to theSatoyama Initiative for the benefit of biodiversity andhumanwell-being,pp.54-62.ConventiononBiologicalDiversity Technical Series No. 52. Montreal: Secretariat oftheConventiononBiologicalDiversity.
Hamerlynck, O., Luke, Q., Nyange, T.M., Duvail, S. and Leauthaud, C., (2012). Range Extension, Imminent ThreatsandConservationOptionsforTwoEndangeredPrimates: The Tana River Red Colobus Procolobus rufomitratus rufomitratus (Peters, 1879) and the Tana River Mangabey Cercocebus galeritus (Peters, 1879) in the Lower Tana Floodplain and Delta, Kenya. AfricanPrimates 7 (2): 211-217
Herrmann, R., Grote,U., Brüntrup, M.(2013). Household Welfare Outcomes of Large-Scale Agricultural Investments: Insights From Sugarcane OutgrowerSchemes and Estate Employment in Malawi. Paperprepared for presentation at the Annual World BankConference on Land and Poverty. The World Bank - Washington DC, April 8-11, 2013
IBF International Consulting (2011). StrengtheningFisheries Management in ACP Countries. Final Technical report
Ikiara, M. (2009). Trade in Environmental Goods & Services Solar Energy in Kenya. A paper presented at the World Trade Organization Workshop, Geneva,Switzerland23–25September,2009
IndustrialParksDevelopmentAuthority(2004).Investingin the Future of Afghanistan
InformationsheetonRamsarWetlands.TanaRiverDeltaRamsar Site. Designation date: 7th September 2012.Ramsar site no. 2082
IntegratedRegionalInformationNetworks(2007).KenyaAgriculture v Livestock Africa – News and Analysis.Kenya– IrrigationProjectCouldLead toConflictwithPastoralists. Posted on 11th July 2013
REFERENCES

TANA RIVER DELTA STRATEGIC ENVIRONMENT ASSESSMENT 2014 112
International Federation of Red Cross and Red CrossCresentSocieties(2013).EmergencyAppealOperationUpdate Kenya: Complex Emergency (Floods, Drought andCivilUnrest)http://www.ifrc.org/docs/appeals/12/MDRKE02301.pdf
Irmak,S.Evapotranspiration.SoilandWaterResourcesEngineering;AgriculturalWaterManagement;IrrigationEngineering; Microclimate vs. Surface Interactions;Water use Efficiency of variousAgro-ecosystems; andEnvironmental Biophysics
Irungu,P.(2000).CattleKeepingPracticesoftheOrmaPeople. A Household Survey in Tana River District, Kenya
ISRIC(1983).ReportontheJointKenyan-DutchReviewand Evaluation of the Lower Tana Village IrrigationProgramme Kenya. International Soil Reference andInformationCentre
Jaetzold, R. and Schmidt H. (1983). Farm management handbook for Kenya. Vol. IIB. Ministry of Agriculture, Nairobi.
Jason, C. (2005). Sugarcane Production and theEnvironment. A presentation made during the BetterSugarMeetingheldon24thand25thJune2005,Tateand Lyle Headquarters, London
Kadere,T.T.,Oniang`o,R.K.,KutimaP.M.andNjoroge,S.M. (2009). Production, Marketing and EconomicImportance of Mnazi and Other Coconut-based Products in Kenya. Research Journal of Agriculture and Biological Sciences,5(5):815-822.INSInetPublication
Kamara,A.,McCarthy,N.andKirk,M.(2001).TheEffectof Environmental Variability on Livestock and Land-Use Management: The Borana Plateau, Southern Ethiopia. Environment and Production Technology Division(EPTD) Discussion Paper No. 75
Karanja, F.K. (2006). CropwatModelAnalysis of CropWater Use in Six Districts in Kenya. CEEPA discussion paper no. 35, ISBN 1-920160-35-3, Center for Environmental Economics and Policy in Africa, University of Pretoria.
Kenya Electricity Generating Company. Hydro PowerStations. Masinga Power Station http://www.kengen.co.ke/index.php?page=business&subpage=hydro&id=6
KenyaStateofAffairs.TheYalaSwamp.www.state-of-affairs.org/category/kenya/
Kitheka, J.U., Mavuti, K.M., Nthenge, P. and Obiero,M.(2014). The Dynamics of the Turbidity Maximum zone in a Tropical Sabaki Estuary in Kenya. J. Environ. Sci. Water Resourc. 3(4): 086-103.
Kiuluku, P.K. (2008). The Skins, Hides and Leather Sector. A term paper on The Global Value Chain
Leauthaud, C., Duvail, S., Belaud, G., Moussa, R., Grunberger, O. and Albergel, J. (2012). Floods and Wetlands: Combining a Water-Balance Model and Remote-Sensing Technique to Characterize Hydrological Processes of Ecological Importance in the Tana River Delta (Kenya). Hydrology and Earth System Sciences Discussions. Discussion Paper No. 9: 11267–11318CopernicusPublications,Göttingen
Leauthauda, C., Duvail, S., Hamerlynck, O., Paul, J., Cochet, H., Nyunja, J., Albergel, J. and Grunberger, O. (2013). Floods and Livelihoods: The Impact of Changing Water Resources on Wetland Agro-ecological Production Systems in the Tana River Delta, Kenya.GlobalEnvironmentalChange23(1):252–263
Lewis,M. (2013).SweetNothings.TheHumanCostofaBritishSugarGiantAvoidingTaxesinSouthernAfrica.ActionAid-UK,Chard
Livezey, J. and Foreman, L. (2004). Characteristicsand Production Costs of U.S. Rice Farms. StatisticalBulletinNumber974-7.AnElectronicReportfromtheEconomic Research Service. United States Department of Agriculture
Luke, Q., Hatfield, R. and Cunneyworth, P. (2005).RehabilitationoftheTanaDeltaIrrigationProjectKenya.An Environmental Assessment. A report compiled for Critical Ecosystem Partnership Fund http://www.cepf.net/Documents/Final.TDIP_Environmental_Assessment.pdf
Lungren,C.,Sommerlatte,M.andMlingwa,C. (2000).Policy Guidelines for Game Farming and Game Ranching in Tanzania. Government of Tanzania
MAFAP (2013). Improving Price Incentives for CattleProducers in Kenya. Monitoring African Food and Agricultural Policies (MAFAP) Policy Brief no. 10.
REFERENCES

TANA RIVER DELTA STRATEGIC ENVIRONMENT ASSESSMENT 2014113
Maia, J., Giordano, T., Kelder, N., Bardien, G., Bodibe, M.,DuPlooy,P.,Jafta,X.,Jarvis,D.,Kruger-Cloete,E.,Kuhn, G., Lepelle, R., Makaulule. L., Mosoma, K., Neoh, S.,Netshitomboni,N.,Ngozo,T.,Swanepoel,J. (2011).Green Jobs: An Estimate of the Direct EmploymentPotential of a Greening South African Economy.Industrial Development Corporation, DevelopmentBank of Southern Africa, Trade and Industrial Policy Strategies
Maingi J. K., and Marsh S. E. (2002). Quantifyinghydrologic impacts following dam construction alongthe Tana River, Kenya. Journal of Arid Environments 50: 53-79. doi:10.1006/jare.2000.0860 http://www.units.miamioh.edu/geography/wp-content/uploads/quantifying-hydrologic-impacts.pdf
Malimbwi,R.E.andZahabu,E.TheAnalysisofSustainableCharcoalProductionSystemsinTanzania9:229-259
Maritz, J. (2012). ThreeWays to Boost Job Creationin Africa through Agriculture. Article posted on 12thOctober 2012 www.howwemadeitinafrica.com/three-ways-to-boost-job-creation-in-africa-through-agriculture/21133/
Mati,B.M.,Muchiri,J.M.,Njenga,K.,PenningdeVries,F., Merrey, D. J. (2005). Assessing Water Availability under Pastoral Livestock Systems in Drought-prone Isiolo District, Kenya. Working Paper 106. Colombo, Sri Lanka: International Water Management Institute(IWMI).
Mbugua, D. (2000). Forest Outlook studies in Africa. CountryOutlookpaper-Kenyaftp://ftp.fao.org/docrep/fao/003/AB569E/AB569E00.pdf
Mbuvi, M. T. E. (2004). Eastern Africa Regional Programme Office Eastern Africa Coastal EcoregionProgramme.ConsultantReport forTrade (onfloraandFauna)IssueswithintheCoastalForests
McDermott,J.J.,Staal,S.J.,Freeman,H.A.,Herrero,M.andVandeSteegJ.A. (2010)SustainingIntensificationof Smallholder Livestock Systems in the Tropics. Journal on Livestock Science. doi:10.1016/j.livsci.2010.02.014
Memedović, O. (2012). Conference Report. Europeand Central Asia Regional Conference on Industrial Parks.17th -18th April 2012 Baku, Azerbaijan
Mercer,B., Finighan,J., Sembres,T. and Schaefer, J. (2011). Wood fuels and forests in tropical Africa. Protectingand Restoring Forest Carbon in Tropical Africa: A Guide to Donors and Funders. Forests Philanthropy ActionNetwork.6:200-237
Monga, C. (2011). Cluster-Based Industrial Parks A PracticalFrameworkforAction.PolicyResearchWorkingPaper 5900. The World Bank Africa Region Structural TransformationUnitandDevelopmentEconomicsVicePresidency
Monica,K.,Ngatia,J.,Ng’oriareng,P.C.,Simanto,O.andOduor, N.Available Charcoal ProductionTechnologiesin Kenya. For Sustainable charcoal production in theDrylands of Kenya
Moolman, S. (2013). Construction imminent atTorminmineral sands mine - Mining Weekly. Posted on 15th March 2013 http://www.miningweekly.com/article/construction-imminent-at-tormin-mineral-sands-mine-2013-03-15
Moore, P. (2006). IndicativeBuildingCosts. ECHarris.Cost Research Department
Turner&Townsend (2012). InternationalConstructionCost Survey 2012 http://www.turnerandtownsend.com/construction-cost-2012/_16803.html
Mugo,F.andOng,C.(2006).LessonsofEasternAfrica’sUnsustainable Charcoal Trade. ICRAF Working Paper no. 20. World Agroforestry Centre. Nairobi, Kenya.
Mugo,F.andOng,C.(2006).LessonsofEasternAfrica’sUnsustainable Charcoal Trade. ICRAF Working Paper no. 20. Nairobi, Kenya. World Agroforestry Centre.
Multilateral Investment Guarantee Agency(2006). Snapshot Africa Kenya. Benchmarking FDI Competitiveness.WorldBankGroup,Washington,DC
Munguti,S. (2013).TanaRiverOilandGasexplorationhasofficiallystarted.Anemailsenton13thAugust2013
Mwakio,P. (2013). Farming inTanaDeltaSlowlypicksup after clashes. National News. The Standard. 29thOctober 2013. pp22
Nature Kenya (2008a). Brief on Tana River biodiversity. http://www.tanariverdelta.org/1076-DSY/version/default/part/AttachmentData/data/Tana%20Delta%20Biodiversity.pdf
REFERENCES

TANA RIVER DELTA STRATEGIC ENVIRONMENT ASSESSMENT 2014 114
Ndegwa, G. (2010). Woodfuel Value Chains in KenyaandRwanda:EconomicAnalysisoftheMarketOrientedWoodfuel Sector. MSc Thesis report. Institute forTechnology and Resources Management in the Tropics and Subtropics (ITT). Cologne University of Applied Sciences
Nekesa, P. and Meso, B. (1997). Traditional AfricanVegetables in Kenya: Production, Marketing andUtilization in Guarino, L., (Ed) Traditional AfricanVegetables. Promoting the conservation and use ofunderutilized and neglected crops. 16. Proceedings oftheIPGRIInternationalWorkshoponGeneticResourcesof Traditional Vegetables in Africa: Conservation andUse, 29-31 August 1995, ICRAF-HQ, Nairobi, Kenya. Institute of Plant Genetics and Crop Plant Research,Gatersleben/International Plant Genetic ResourcesInstitute,Rome,Italy.
Nelson P., and Odeny D. (2014). Topography and hydrology of the Tana Delta. A paper presented at the Tana River County International Scientific conference.25-27 February 2014.
Niekert, L. Ed. (2011). About South Africa. Agriculture-SouthAfricanGovernmentInformation.PocketGuidetoSouthAfrica2011/2012.GovernmentCommunicationandInformationSystem
Nunow A. A. (2011). The dynamics of land dealsin the Tana Delta, Kenya. A paper presented at the InternantionalConferenceinLandGrabbing.6–8April2011. Organised by the Land Deals Politics Initiative(LDPI) in collaboration with the Journal of PeasantStudies. file:///C:/Users/HP/Downloads/Abdirizak%20Arale%20Nunow.pdf
Ocholla, G.O., Bunyasi, M.M., Asoka, G.W., Ongere P. O.,Mbugua,H.K.,Mbuthi,P.,Mbiti,S.,Wendo,H.K.andKamau, P.K. (2013). Environmental Issues and Socio-economic Problems Emanating from Salt Mining inKenya;ACaseStudyofMagariniDistrict. InternationalJournalofHumanitiesandSocialScience3(3):213-223
OdhengoP.,MatikuP.,WaweruP.,GudaD.,KinaraT.,KathikeS.,MmyamweziE.,MungutiS.,NelsonP., andKoyier G. (2014b). Tana River Delta Land Use Plan.
Odhengo P. Matiku P., Nyangena J., Wahome K.,OpaaB.,MungutiS.,KoyierG.,NelsonP.,MnyamweziE., and Misati P. (2012a). Tana River Delta StrategicEnvironmental Assessment Scoping Report. Published by the Ministry of Lands, Physical Planning Department.
Odhengo, P. Matiku, P., Nyangena, J., Wahome, K.,Opaa,B.,Munguti,S.,Koyier,G.,Nelson,P.,Mnyamwezi,E., Misati, P. (2012c). Tana River Delta StrategicEnvironmental Assessment Baseline Report. Nairobi: Ministry of Lands, Physical Planning Department
Oduor, N.M., Ngugi, W. and Gathui, T. (2012). Sustainable Tree Management for Charcoal Production AcaciaSpecies in Kenya. An Acacia Pocketbook prepared by PracticalActionConsultingEastAfrica
Oei, P. (2005). Small-scale Mushroom Cultivation.Oyster, Shiitake and Wood ear mushrooms. Agromisa Foundation and Technical Centre for Agricultural andRuralCooperation(CTA)
Office of the Presidency (2004). Presidential StrategicCommunications Unit (PSCU). Galana-Kulalu projectmust succeed, President Kenyatta says. http://www.president.go.ke/galana-kulalu-project-must-succeed-president-kenyatta-says/
OfficeofthePrimeMinister.MinutesofInterMinisterialTechnical Committee Meeting with KENWEB on theStrategic Environmental Assessment and Land Use Plan for the Tana River Delta. 14th January 2013
Ofori,J.K.,Dankwa,H.R.,Brummett,R.andAbban,E.K.(2009). Producing Tilapia in Small Cage in West Africa. World Fish Center Technical Manual No. 1952. The World Fish Center, Penang, Malaysia. pp.16
Okatch, F.O. (2012).Devolved Government Statutes That Guide the Workings of County Governments in Kenya. A presentationpreparedfortheCountyGovernment
Oloo, P. (2013). Progress of the Development of the National Water Master Plan 2030. A presentationprepared for the 7th Annual Water Sector Conference held on 20th to 21st February 2013 in Nairobi
Oloo,R.D.A.(2011).Fishfarmingasameansofboostingthe economy of Kisumu County, Kenya. Thesis report. MScInvestmentPromotionandEconomicDevelopment.Edinburgh Napier University
Muraguri, P. and Gioto,V. (2014). Tana River County Short Rains 2013-14 Assessment Report. 3rd-7th February, 2014
Onyango, C.M. Imungi, J.K. Mose, L.O. Harbinson, J. and Kooten,O.(2009).FeasibilityofCommercialProductionof Amaranth Leaf Vegetable by Small-scale Farmers in Kenya. African Crop Science Conference Proceedings 9:767-772 African Crop Science Society
REFERENCES

TANA RIVER DELTA STRATEGIC ENVIRONMENT ASSESSMENT 2014115
PastureNetworkforEasternandSouthernAfrica(1988).ProductivityofBeefSteersUnderRangelandConditionsin a Semi-Arid Area of Kenya. African Forage Plant GeneticResources,EvaluationofForageGermplasmandExtensiveLivestockProductionSystems.ProceedingsoftheThirdWorkshopheldattheInternationalConferenceCentre, Arusha, Tanzania. 27th -30th April 1987. ILCA, AddisAbaba.http://www.fao.org/wairdocs/ilri/x5491e/x5491e0u.htm
Pound, B. and Phiri, A. (2010). Longitudinal Impact AssessmentStudyofSugarProducersinMalawi.NaturalResourcesInstitute,UniversityofGreenwich
Wiedenfeld, B., Enciso, J., Fipps, G., and Robinson, J. (2004). Irrigation of Sugarcane in Texas. AgriculturalCommunications,TheTexasA&MUniversitySystem
Ramsar Resolution VII. 14 (2002). New Guidelinesfor Management Planning for Ramsar Sites and Other Wetlands.Wetlands:water,life,andculture.8thMeetingof the Conference of the Contracting Parties to theConventiononWetlands
Republic of Tanzania (2016). Mainstreaming Sustainable Forest Management in the Miombo woodlands ofWestern Tanzania. Project funded by Global Environment Facility/UnitedNationsDevelopmentProgramme
Russi, D., ten Brink P., Farmer, A., Badura T., Coates, D.,Förster,J.,Kumar,R. andDavidson,N. (2013).TheEconomics of Ecosystems and Biodiversity for Water and Wetlands. Institute for EuropeanEnvironmental Policy(IEEP), London and Brussels: Ramsar Secretariat, Gland.
Sambrook, C.B. (2003). Labour Constraints and the Impact of HIV/Aids on Rural Livelihoods in Bondo and Busia Districts Western Kenya. Labour Saving Technologies andPractices for Farming andHouseholdActivities inEasternandSouthernAfrica.AworkingdocumentoftheInternationalFundforAgriculturalDevelopment(IFAD)andtheFoodandAgricultureOrganization(FAO)oftheUnitedNations
Schneiderat, U. (2011). Communal Rangelands in Northern and Central Namibia. The Grazing and BrowsingResourcesandtheirUsers.ThesisReport.MScAgriculture, Justus Liebig University Giessen
Shean,M. (2012). Stagnating Rice Production EnsuresContinuedNeedforImports.Postedon19thMarch2012http://www.pecad.fas.usda.gov/highlights/2012/03/Indonesia_rice_Mar2012/
State Government of New South Wales (2011).
Report 5 - Inner North Sub-region. Employment Lands Development Program 2010 Sub-regional Reports. Department of Planning Lands Building, Sidney
State Government of West Bengal (2011). Economic Review 2011-12 http://www.bengalchamber.com/economics/west-bengal-statistics-2011-2012.pdf
StatisticsSouthAfrica(2007).TourismSatelliteAccounts.Country experience in the compilation of TourismSatellite Accounts. Discussion Document- D0405.4 StatisticsSouthAfrica,Pretoria
Sugar Industry Authority of Jamaica (2000). An OverviewoftheSugarIndustryofJamaicaDepartmentof Agriculture, Forestry and Fisheries. Sugar Profile.South Africa http://www.nda.agric.za/docs/FactSheet/Sugar06.pdf
Suri, T., Tschirley, D., Irungu, C. Gitau, R. and Kariuki, D. (2009). Rural Incomes, Inequality and Poverty Dynamics in Kenya.Tegemeo Institute ofAgricultural Policy andDevelopment, Nairobi
Suttie,J.M.,Reynolds,S.G.andBatello,C.(Eds)(2005).GrasslandsoftheWorld.PlantProductionandProtectionSeriesNo.34.FoodandAgricultureOrganizationoftheUnitedNations(FAO),Rome
Tana and Athi River Development Authority (2013). TanaDeltaIrrigationProject.Postedon28thJune2013http://www.tarda.co.ke/projects/tana-delta-irrigation-project/
TanaDeltaRenewedClashes.TanaDeltaMultiAgencyPreliminary report. 4th January 2013. Participants inreportconsolidation:KenyaRedCrossSociety,NationalDrought Management Authority, MSF International,United Nations Office for the Coordination ofHumanitarian Affairs, United Nations Children’s Fund,United NationsWorld Food Programme and CatholicRelief Services
The Charcoal project (2009). Can –or should- thecharcoaltradeberegulated?Postedon11thDecember2009
The McIlvaine Company. Food Industry http://www.mcilvainecompany.com/genericapplications/water/food.htm
The Oakland Institute (2011). Understanding LandInvestmentDeals inAfrica.TheMythofJobCreation.Land Deal Brief
REFERENCES

TANA RIVER DELTA STRATEGIC ENVIRONMENT ASSESSMENT 2014 116
The Sentinel Project for Genocide Prevention(2013). Tana Delta Field Survey Report http://www.thesentinelproject.org/wp-content/uploads/2013/06/Tana-Delta-Field-Report-May-2013.pdf
Trade Fair Foundation (2011). South African CitrusProject. http://server-e9-11.hosting.imerja.com/producers/citrus/south_african_citrus_project_2.aspx
Tyler,R.M.andMinnitt,R.C.A.(2004).AReviewofSub-SaharanHeavyMineralSandDeposits.ImplicationsforNew Projects in Southern Africa. The Journal of TheSouthAfricanInstituteofMiningandMetallurgypp89-99
U.S. Geological Survey (2013). Mineral Commodity Summaries 2013: U.S. Geological Survey, pp 134-135
UN-HABITAT (2011). Affordable Land and Housingin Africa. Adequate Housing Series Volume 3.United NationsHumanSettlementProgramme,Nairobi
UnitedNations(2008).InternationalStandardIndustrialClassification of all Economic Activities. Statisticalpapers,SeriesMNo.4/Rev.4UnitedNations,NewYork
United Nations Economic Commission for Africa(2013). Sustainable Tourism Master Plan for the Inter-Governmental Authority on Development (IGAD) Region 2013-2023
UnitedStatesCensusBureau(2012).The2012StatisticalAbstract
USAID-Kenya(2006).KenyaHorticulturalDevelopmentProgram.MarketingNews-November/December2006.United States Agency for International Development(USAID)-Kenya.
Uwazi (2010). It’s Our Water Too. Bringing GreaterEquity in Access to Water in Kenya. A brief produced by TheUwaziInfoshop,Twaweza,Nairobi
Valk,Y.(2008).QuickscanofthedairyandmeatsectorsinKenya.IssuesandOpportunities.ReportpreparedonrequestoftheOfficeoftheCounsellorforAgriculture,Nature and Food Quality of the Royal Netherlands Embassy in Nairobi
Vegetable Enterprise Guideline. Ministry of Agriculture, Botswana http://www.moa.gov.bw/downloads/30478_Veg_Inn_IMP.pdf
REFERENCESVieira, T. (2013). Very Dismal Performance at all Sugar Estates in 2012 but especially at Skeldon Flagship. Posted on 22nd March 2013 http://www.stabroeknews.com/2013/opinion/letters/03/22/very-dismal-performance-at-all-sugar-estates-in-2012-but-especially-at-skeldon-flagship/
Waggoner, P.E. (2009). Forest Inventories. Discrepancies andUncertainties.ResourcesfortheFuture.http://www.rff.org/RFF/Documents/RFF-DP-09-29.pdf
Wambua, J. (2013).MangoOrchards.ABetterOptionfor theYoung Investor.MFarmKenya.Postedon29thJanuary 2013 http://mfarm.co.ke/blog/post/mango-orchards-a-better-option-for-the-young-investor
Wekesa L., Muturi G., Mulatya, J., Esilaba, A.O., Keya, G.A. and Ihure, S. (2012). Economic Viability of Melia Volkensii (Gurkii) Production on Smallholdings inDrylands of Kenya. International Research Journal ofAgricultural Science and Soil Science 2(8): 364-369 http://www.interesjournals.org/IRJAS
Wikipedia (2014). S.B. Foot Tanning Company. Last updated on 6th January 2014 http://en.wikipedia.org/wiki/S._B._Foot_Tanning_Company
Wikipedia.EconomyofSouthAfrica.http://en.wikipedia.org/wiki/Economy_of_South_Africa
Williams, C. A., and Albertson J. D. (2004). Soil moisture controlsoncanopy-scalewaterandcarbonfluxesinanAfrican savanna, Water Resources Research Volume 40, W09302, doi:10.1029/2004WR003208.
World Resources Institute; Department of ResourceSurveys and Remote Sensing, Ministry of Environment and NaturalResources,Kenya;CentralBureauofStatistics,MinistryofPlanningandNationalDevelopment,Kenya;and International Livestock Research Institute (2007).Nature’sBenefitsinKenya,AnAtlasofEcosystemsandHuman Well-Being. Chapter 4: Food. World Resources Institute.Washington,DCandNairobi
WWF International (2000). Code of Conduct forArctic Tourists. World Wide Fund for Nature (WWF)InternationalArcticProgramme

TANA RIVER DELTA STRATEGIC ENVIRONMENT ASSESSMENT 2014117
ANNEX 1Review of Data on the River Tana Flows and Discharge in the Lower Catchment
INTRODUCTIONThe most recent analysis of hydrological information for the River Tana is contained in the Feasibility Study Re-port for the High Grand Falls Dam (HGFD) prepared by a consortium led by Egis Bceom International1, (2011). The HGFD report and technical annexes on Climate and Hydrology make it clear that there is a serious lack of data about water resource conditions in the Lower Tana. Despite this lack of data the studies reach some important conclusions whose validity is examined in this paper. For clarity, all references to the technical studies are identified as HGFD findings, while observations in this report are noted as coming from the SEA.
FLOOD FLOWSA large part of the Feasibility Study is taken up with investigation of flood events, since these contribute the greatest amount of water for potential storage in the proposed High Grand Falls Dam. The HGFD findings and conclusions are summarised in a Summary Report, from which the following extract (Box 1) is taken.
This SEA review fully supports the basic statements in the HGFD (Box 1 above) about the lack of adequate data (1) and the need for an integrated assessment of conditions in the Lower Tana (v). However, the SEA considers that observations (ii) and (iii) conflict with
BOX 1 FLOOD ANALYSIS (HGFD)The study also considered the main past floods, main source of floods and their propagation, flood frequency analysis, effects of artificial floods release from existing dams, and the expected impact of HGF on flooding. The main conclusions were:1. Flows at Grand Falls contribute floods mainly only up to Garissa. Below Garissa, it is impossible to determine
the actual flood flow from tributaries downstream of Grand Falls and upstream of Garissa, due to lack of data.2. Most of the flood flow from the upper catchments is lost due to evaporation, flooding and seepage
downstream of Grand Falls, and only a little amount reaches the Tana Delta.3. The HGF dam will have negligible effect on the control of natural floods in the delta, as existing dams in the
upper catchment already perform this function. Moreover, as seen in (ii) above, the source of most of the flood flow in the delta lies downstream of HGF dam.
4. The dam will be designed to release artificial floods twice a year, thereby regulating the flood downstream of Garissa.
5. However, before the optimum artificial flood is defined, comprehensive information is required on the environmental and socio-economic factors at play downstream of HGF. Therefore, an integrated and overall assessment of these factors must be done before dam construction begins.
empirical and anecdotal evidence from the Delta. The HGFD findings are also contradicted by the output of a new water balance and hydrological modelling study for the lower delta (Leauthaud et al. 2013).
The HGFD Consultants’ conclusions that outflows from the Upper Catchment of the River Tana do not contribute to any significant extent to floods in the Tana Delta are based on studies of the flood hydrographs which show very large and acute peaks for upstream locations (Masinga; Grand Falls), intermediate flood flows for Garissa and virtually a flat curve for Garsen. (See examples in Box 2 of figures extracted from Annex A to the HGFD Main Report).
The flood events described in the HGFD Feasibility Study typically have a duration of one to two months, and the analysis presented in that study focuses entirely on these events. There is very little discussion of what conditions are like during the remaining months of the year. However, the appendices to Annex A (HGFD) do include annual summary tables of mean monthly discharge at various points in the Tana Basin.
This data on mean monthly flows (at the Masinga dam, HGFD site, and Garissa, Hola and Garsen gauges) has been processed for the SEA and shows that the
1High Grand Falls Multi-Purpose Development Project; Feasibility Study, February 2011
Pre-publication draft of a paper presented to the Scientific Conference on the Tana River held in Mombasa in February 2014.

TANA RIVER DELTA STRATEGIC ENVIRONMENT ASSESSMENT 2014 118
variability in flow conditions at Garsen responds in a remarkably similar fashion to the upstream gauging stations, although with a much subdued amplitude (See Figures 1 and 2 below). Figure 1 below shows annual plots for the six successive years at Garsen between 1959 and 1965, while Figure 2 shows the same information for the later period of 1990-95.
October to December 1961
March to May 1990
November to December 1997 (El Nino Event)
January to March 1998 (El Nino Event)
Figures 1 and 2 are based on data for two separate periods for which an almost complete data set is available for the Garsen river gauge. These are the years 1959-65 and 1990-95. The first set of records covers a period of 72 months and has only 3 missing months which can be extrapolated. The second set of records has 5 missing months out of a total of 72 months.
BOX 2: EXTRACTS OF FLOOD HYDROGRAPHS FROM ANNEX A - CLIMATE AND HYDROLOGY (HGFD FEASIBILITY STUDY)

TANA RIVER DELTA STRATEGIC ENVIRONMENT ASSESSMENT 2014119
Figure 1: Mean Monthly Discharge in M3/sec at Garsen (1959 - 1965)
Figure 2: Mean Monthly Discharge in M3/sec at Garsen (1988 - 1993)
Figure 3: Mean Monthly Discharge in M3/sec at Garsen in 1960-65 and 1985-1993
Conveniently, the first period (1959-65) predates the impact of upstream dams (which were only built between 1966 and 1988) while the second follows completion of the Masinga Dam.
The periods for which data are available are too short to allow a statistical comparison to be made, but the graphs support the well-established view that there is less variability in the flood flows at Garsen following construction of the upper cascade of dams, especially in the pattern of releases in the lower limb of the hydrographs for the short rains in April and May. There are also no flood events above 180 m3/sec at this time of year compared with three which exceeded this value in the 1959-65 period. In general, the variability in monthly mean flows is less pronounced during the second period than the first, as would be expected as a result of river regulation.
In Figure 3, mean monthly flows are aggregated to produce an average flow at Garsen for each month during the two time periods. Flows during the long rains (December – February) are a little higher in the earlier period (59-65) than in the later period (90-95) indicating, perhaps, that dam construction had the effect of reducing flood runoff during the main flood events. On the other hand, all other months see a reduction in discharge.
The mean monthly flows at Garsen have been plotted as a continuous record for the two periods (see Figure 3) which highlights the twin annual flood events for the years in question and indicates that there are marked changes in the flow regime of the River Tana as it enters the lower delta over the course of the year. This fluctuation may not be as pronounced as the pattern which occurs upstream but when the same data is added for the High Grand Falls and Garissa gauges (see Figure 4) there is a remarkably close fit in terms of the falling limb of the hydrograph in the months of June-October with a fairly narrow band of lower discharge rates from 60-150 M3/sec. It is also apparent that flow conditions at Garsen respond to the onset of rainy seasons roughly one month behind the upper river.

TANA RIVER DELTA STRATEGIC ENVIRONMENT ASSESSMENT 2014 120
Figure 4: Comparison of Mean Monthly Discharge (M3/Sec) at Garsen and Upstream Sites for seven years of continuous records (1959-1965)
Figure 5: Data for Mean Monthly Discharge Presented on Logarithmic Scale
Use of a logarithmic scale in Figure 5 focuses attention on the ‘normal’ discharge rates in the range of 45-145 m3/sec and reduces the dominance of peak flood flows. It highlights the fact that the base flow in the River Tana at the four gauging points remains remarkably consistent, except in flood events.
The key observation that can be made from the information presented above is that the flow conditions at Garsen vary considerably throughout the year and are clearly responding to upstream conditions, which is largely generated by the main river flow since added discharge from lagas entering the flood plain below Garissa only occurs during the short and long rains.
In order to explain this phenomenon it is hypothesised that flood flows in the upper catchment, above the Grand Falls, are transported rapidly, as in-channel flow, with very little to impede progress other than the dams themselves which only serve to impound water in the early stages of a flood. Once the dams are full, the full flood spills over and continues downstream.
Below the Grand Falls rapids, the river morphology changes from a torrent tract to a wide floodplain with extensive marshes and wetlands. Consequently the effects of the flood are attenuated as water spreads over the entire corridor which is 6-8 kilometres wide. This moderates the peak flow, while water continues to move towards the sea in the form of both surface and sub-surface flow. The result is that by the time water reaches the Garsen Gauge at Idsowe Bridge, the flow pattern has been attenuated but there is still marked periods of peak and low flows which lag up to a month behind the upstream regime.
ENVIRONMENTAL FLOWSUnderstanding environmental flows or the ‘environmental reserve’ is critical to future planning of water resources in the Tana Basin and especially the safeguarding of the Tana Delta. Work undertaken to date by engineers and scientists working on the feasibility studies for the High Grand Falls Dam has focused on the amount of water needed in a river channel to sustain aquatic life as presented in Box 2.
BOX 2 ENVIRONMENTAL FLOWSThe consultants also considered the need to ensure that HGF dam would ensure that environmental flow in the River Tana is maintained. This is the minimum flow required to maintain life for aquatic and terrestrial species in the lower catchment, as well as for the conservation of livelihoods in general. This requires a complete environmental and social study of the lower catchment, which was not done as, it was not in the framework of the feasibility study and in any case, there did not exist adequate data to undertake an analysis of that scope.It was therefore not possible to estimate the environmental flow for the Tana Delta. Using water balance simulations and by considering the 95% exceedence flow, the consultants estimated the environmental flow between Grand Falls and the delta as 10 – 30m3/s. However, the actual value can only be determined once river losses and existing water abstractions from the lower catchment are known.The problem with estimation is that there lies the possibility of both under-estimating or over-estimating river losses and environmental flows. The first scenario would mean that there is less water for irrigation and water supply, thereby affecting development and livelihoods. Over-estimation would mean that there is more water for water supply, power generation and downstream development.

TANA RIVER DELTA STRATEGIC ENVIRONMENT ASSESSMENT 2014121
The approach outlined in Box 2 is valid where most of the water flow occurs within the river channel and water only spreads across the flood plain during peak river flows. However, research for the SEA has shown that flows in the Tana River have historically maintained a minimum monthly mean of 60m3/second at Garsen (Idsowe Bridge), with levels dropping to 45 or 30m3/second in only a few months in extreme drought years.
Once the river reaches its divide between the former main channel and the Matomba Brook the bulk of the discharge (perhaps 60%) is diverted into the eastern arm where it is dispersed through a myriad of small brooks and channels, often less than half a metre in depth and a few metres wide. These channels spread out in depressions to form marshes, swamps and very shallow lakes with only a few centimetres of standing water. The entire delta area is therefore acting as a part of the hydrological system and during dry seasons it is the dispersal of water across the entire floodplain which maintains high soil moisture levels and supports the delta ecosystem.
A rapid assessment has been made of the effects of evapotranspiration rates of 100 mm /m2 per month from 90,000 ha of wet grassland in tropical conditions, with temperatures remaining above 250 centigrade and clear skies. This suggests that the gross water demand for vegetation in the delta during a drought of 4-6 months duration, is the equivalent of a river discharge rate of 35 m3/sec. This figure makes no allowance for other water uses including livestock, human consumption, navigation, agriculture or the development of local irrigation schemes.
CONCLUSIONThe conclusion drawn from this preliminary assessment is that the suggested environmental reserve flow of 10-30m3/sec is a serious underestimate of the delta’s existing needs and, with continuing population growth and the aim of restoring the delta’s biodiversity to an acceptable standard, the minimum flow in the River Tana at Garsen (Idsowe Bridge) should be set at the mean rate of 60m3/sec.
15 November 2013