Embed Size (px)
Citation preview

Tamping Planning in Railway Maintenance Improvement Potential for Optram as Decision Support
Master of Science Thesis in the Master’s Programme Geo and Water Engineering
SOFIA LANDER & JOHAN PETERSSON
Department of Civil and Environmental Engineering
Division of GeoEngineering
Road and Traffic Group
CHALMERS UNIVERSITY OF TECHNOLOGY
Göteborg, Sweden 2012
Master’s Thesis 2012:63


MASTER’S THESIS 2012:63
Tamping Planning in Railway Maintenance Improvement Potential for Optram as Decision Support
Master of Science Thesis in the Master’s Programme Geo and Water Engineering
SOFIA LANDER & JOHAN PETERSSON
Department of Civil and Environmental Engineering
Division of GeoEngineering
Road and Traffic Group
CHALMERS UNIVERSITY OF TECHNOLOGY
Göteborg, Sweden 2012

Tamping Planning in Railway Maintenance
Improvement Potential for Optram as Decision Support
Master of Science Thesis in the Master’s Programme Geo and Water Engineering
SOFIA LANDER & JOHAN PETERSSON
© SOFIA LANDER & JOHAN PETERSSON, 2012
Examensarbete / Institutionen för bygg- och miljöteknik,
Chalmers tekniska högskola 2012:63
Department of Civil and Environmental Engineering
Division of GeoEngineering
Road and Traffic Group
Chalmers University of Technology
SE-412 96 Göteborg
Sweden
Telephone: + 46 (0)31-772 1000
Cover:
New railroad section north of Göteborg where tamping work is in progress.
Department of Civil and Environmental Engineering
Göteborg, Sweden 2012

CHALMERS, Civil and Environmental Engineering, Master’s Thesis 2012:63 I
Tamping Planning in Railway Maintenance
Improvement Potential for Optram as Decision Support
Master of Science Thesis in the Master’s Programme Geo and Water Engineering
SOFIA LANDER & JOHAN PETERSSON Department of Civil and Environmental Engineering
Division of GeoEngineering
Road and Traffic Group
Chalmers University of Technology
ABSTRACT
Optram is a computer software for evaluation of track geometry quality data, used
as a decision support in planning and follow-up of tamping maintenance for Swedish
railways. The software was introduced at the Swedish Transport Administration year
2009 but has not reached the intended number of users. The purpose with this thesis is
to suggest how Optram can be improved as a decision support in the tamping mainte-
nance process. Interviews have been held with maintenance planners to receive their
impressions of Optram and identify problems in the process. The result has indicated
that the transition from previous analogue evaluation of track geometry quality to
digital evaluation with Optram is a threshold for maintenance planners. Further, a
desire for an advising function in Optram is expressed. Identified problems in the
process are e.g. lack of long-term tamping strategy and difficulties to acquire track
possession time. Concluding recommendation for this thesis is to develop two new
functions in Optram; a Tamping Recommendation Model suggesting tamping sections
for short-term planning based on a target Q-value or a given budget, and a Track Ge-
ometry Quality Degradation Model predicting the long-term effects of different tamp-
ing strategies.
Key words: Optram, Tamping Maintenance, Track Geometry Quality, Q-value

CHALMERS, Civil and Environmental Engineering, Master’s Thesis 2012:63 II

CHALMERS, Civil and Environmental Engineering, Master’s Thesis 2012:63 III
Tamping Planning in Railway Maintenance
Improvement Potential for Optram as Decision Support
Master of Science Thesis in the Master’s Programme Geo and Water Engineering
SOFIA LANDER & JOHAN PETERSSON Department of Civil and Environmental Engineering
Division of GeoEngineering
Road and Traffic Group
Chalmers University of Technology
ABSTRACT IN SWEDISH
Optram är en programvara för utvärdering av spårlägesdata och används som be-
slutsstöd för planering och uppföljning av spårriktning på svenska järnvägar. Pro-
grammet introducerades på Trafikverket år 2009 men har inte använts i planerad ut-
sträckning. Syftet med detta examensarbete är att föreslå hur Optram kan förbättras
som beslutsstöd i spårriktningsprocessen. Intervjuer har genomförts med underhålls-
planerare för att sammanställa deras intryck av Optram och kartlägga problem i spår-
riktningsprocessen. Resultatet har visat att övergången från tidigare analoga mätdata
till Optram uppfattas som en tröskel för en del underhållsplanerare. Dessutom har en
önskan om en rådgivande funktion i Optram uttryckts. De problem som identifierats i
spårriktningsprocessen är bl.a. bristande långsiktig strategi samt begränsad tillgång på
banarbetstider. Avslutningsvis har två konceptuella modeller utvecklats; en beräk-
ningsmodell som rekommenderar spårriktningssträckor utifrån ett önskat Q-värde
eller en given budget, samt en prognosmodell som beräknar förväntad spårlägesned-
brytning för att visa långsiktiga effekter av olika spårriktningsstrategier.
Nyckelord: Optram, spårriktning, spårlägeskvalitet, Q-värde

CHALMERS, Civil and Environmental Engineering, Master’s Thesis 2012:63 IV

CHALMERS, Civil and Environmental Engineering, Master’s Thesis 2012:63 V
Table of contents
ABSTRACT I
ABSTRACT IN SWEDISH III
TABLE OF CONTENTS V
PREFACE VIII
NOTATIONS IX
ABBREVIATIONS X
1 INTRODUCTION 1
1.1 Background 1
1.2 Purpose and goal 1
1.3 Research questions 1
1.4 Delimitations 1
2 METHODOLOGY 3
2.1 Literature study 3
2.2 Study visits 4
2.3 Interviews 4
2.4 Evaluation of results 5
2.5 Exemplification of problem solutions 5
3 THEORY 7
3.1 Railroad track 7
3.1.1 Track components and geometry 7 3.1.2 Track irregularities 9 3.1.3 Consequences of track irregularities 9
3.2 Railway tamping 11 3.2.1 What is tamping? 11
3.2.2 Different types of tamping machines 12 3.2.3 Tamping in practise 13
3.3 Measuring method and evaluation of track irregularities 14 3.3.1 Measuring track geometry quality 14 3.3.2 Digital evaluation with Optram 17 3.3.3 Analogue evaluation with PDF-diagram and lists 20
3.4 Tamping in a maintenance contract 20
3.4.1 Project delivery method 21 3.4.2 Preventive and corrective maintenance 21
3.5 Tamping maintenance process 22 3.5.1 Planning 23 3.5.2 Follow-up 24

CHALMERS, Civil and Environmental Engineering, Master’s Thesis 2012:63 VI
4 RESULTS 25
4.1 Improvement potential in the tamping process 25 4.1.1 Lack of long-term strategy 25 4.1.2 Low margin in tenders 26
4.1.3 Limitations with mean Q-value 26 4.1.4 Difficulties to acquire possession time 27 4.1.5 Lack of follow-up methods 28
4.2 Present state description of Optram 28 4.2.1 Optram’s current usability 28
4.2.2 Education possibilities 29
4.3 Desired functions in Optram 29
5 DISCUSSION AND ANALYSIS 31
5.1 Improvement potential in the tamping process 31 5.1.1 Lack of long-term strategy 31 5.1.2 Low margins in tender 32
5.1.3 Limitations with mean Q-value 32 5.1.4 Difficulties to acquire possession time 32 5.1.5 Lack of follow-up methods 33
5.2 Evaluation of Optram’s present state 34 5.2.1 Optram’s current usability 34
5.2.2 Education possibilities 34
5.3 Desired functions in Optram 34
6 RECOMMENDATION OF NEW FUNCTIONS IN OPTRAM 36
6.1 Tamping Recommendation Model 36
6.2 TGQ Degradation Model 38
6.3 Examples of how to increase the usability in Optram 40
7 REFLECTION 43
7.1 Recommendation of further studies 44
8 CONCLUSION 45
9 REFERENCES 46
APPENDIX I
APPENDIX II
APPENDIX III
APPENDIX IV

CHALMERS, Civil and Environmental Engineering, Master’s Thesis 2012:63 VII

CHALMERS, Civil and Environmental Engineering, Master’s Thesis 2012:63 VIII
Preface
This study has been conducted as a literature and interview study in order to contrib-
ute to the development of the software Optram. The thesis work has been carried out
from January 2012 to June 2012 at the Department of Civil and Environmental Engi-
neering, Division of GeoEngineering, Chalmers University of Technology, Sweden
and at the Swedish Transport Administration, Göteborg.
Tomas Johansson has been supervising at the Swedish Transport Administration and
the examiner has been Gunnar Lannér, Chalmers.
First of all, we would like to thank our supervisor Tomas Johansson for his support
during the thesis work and to Simon Gripner, Dan Cedergårdh and Jack Hansen for
their commitment and support with technical questions. Further, we would also like to
thank our interview persons for sharing their time and perspectives and to the Division
of Maintenance at the Swedish Transport Administration for interesting discussions
and pleasant coffee-breaks.
We would also like to thank our opponents Gustav Sandqvist and Rasmus Sundberg
for their support during the thesis work. At last, we would like to thank our examiner
Gunnar Lannér for his encouragement and valuable advice.
Göteborg, June 2012
Sofia Lander & Johan Petersson

CHALMERS, Civil and Environmental Engineering, Master’s Thesis 2012:63 IX
Notations
This section will translate some relevant railway technical terms, abbreviations and
definitions that are used within the Swedish transport administration and in this thesis.
English Swedish
Alignment Sidoläge
Cant Rälsförhöjning
C-fault list C-felslista
Condition-based maintenance Tillståndsbaserat underhålll
Corrective maintenance Avhjälpande underhåll
Isolated defects Punktfel
Link Bandel
Longitudinal level Höjdläge
Performance-based contract Funktionsentreprenad
Possession time Banarbetstid
Pre-determined maintenance Förutbestämt underhåll
Preventive maintenance Förebyggande underhåll
Maintenance manager Banförvaltare
Quality list Kvalitetslista
Sun kink Solkurva
Swedish Transport Administration Trafikverket
Tamping Spårriktning
Track gauge Spårvidd
Track geometry quality Spårlägeskvalitet
Track geometry quality diagram Spårlägesdiagram
Traditional contract Utförandeentreprenad
Twist Skevning
Valuation diagram Värderingsdiagram

CHALMERS, Civil and Environmental Engineering, Master’s Thesis 2012:63 X
Abbreviations
Abbreviation English translation Swedish definition
BAP Railroad work plan Banarbetsplan
BESSY System for inspection Besiktningssystem
BIS Information system for track compo-
nents
Baninformationssystem
BUP Railroad usage plan Banutnyttjandeplan
BVF Standard of the Swedish Transport Ad-
ministration
Föreskrift
BVH Manual of the Swedish Transport Ad-
ministration
Handbok
TGQ Track geometry quality Spårläge

CHALMERS, Civil and Environmental Engineering, Master’s Thesis 2012:63 1
1 Introduction
This chapter will give an introduction to the thesis, starting with a background to the
subject, followed by purpose and goal. Thereafter will research questions be presented
to further clarify the goals and finally will the delimitations be declared.
1.1 Background
Rail transport is an essential part of a sustainable transport system in Sweden today.
Passenger traffic connects regions to each other, which enables larger labour markets
and enriches people´s mobility with public transports. The market for freight rail
transport is increasing and competing with road transport; one freight train can take
the same load of goods as 30 long-distance lorries (Näringsdepartementet, 2011).
There is an ongoing debate in media today about the current status of railway mainte-
nance due to problems with delayed trains, especially during the last couple of hard
winters. There are several components in the railway that affect the present state qual-
ity of a railroad. One important component is to maintain a good track geometry qual-
ity; that the track is straight on straight lines and curved where it should be curved.
Minor track irregularities can induce vibrations in trains and thereby reduce the com-
fort and increase wear on other track components. More severe irregularities can in-
duce sun kinks and cause derailment. Railway tamping is a maintenance operation
performed to restore track irregularities by correcting the track geometry.
Track geometry is monitored using advanced measuring equipment to ensure that
maintenance operations are taken at the correct time. Data from the measurements can
be displayed and analyzed in the software Optram, acting as support for decision mak-
ing regarding tamping operations since year 2009. Despite its high potential compared
to the previous analogue system, the method of using Optram has not yet had a full
impact in the organisation of the Swedish Transport Administration and its contrac-
tors. For this reason the Swedish Transport Administration has an interest in develop-
ing this tool to make it more useful.
1.2 Purpose and goal
The purpose with this thesis is to develop the software Optram as a decision support
in the railway tamping maintenance process. The goal is to analyse Optram’s im-
provement potential for the process and suggest new improvements.
1.3 Research questions
Following research questions have been answered in this thesis:
1. How can the current usability in Optram be improved?
2. In which parts of the tamping maintenance process does Optram have a poten-
tial to improve the process?
3. What type of new functions in Optram could be used to improve these parts?
1.4 Delimitations
The selection of issues that are studied to determine Optram’s improvement potential
will not cover all areas in the maintenance process that can be improved, but it will
point out some selected areas that are discussed in the interviews. Further, the thesis

CHALMERS, Civil and Environmental Engineering, Master’s Thesis 2012:63 2
will not consider any other maintenance operations that are normally conducted in the
same contract.
The thesis will focus on preventive maintenance measures, however; corrective main-
tenance will be discussed in the relation to how it affects preventive measures. The
physical limitations are that only welded tracks on railway lines will be considered i.e.
no switches or crossings will be considered.
There is an ongoing development of functions in Optram. Since these functions are
not available in the current state, they have not been taken into account in this report.

CHALMERS, Civil and Environmental Engineering, Master’s Thesis 2012:63 3
2 Methodology
This chapter will describe the methodology that has been applied during the thesis
work. The first section will describe the literature that is used in the theory chapter,
followed by a description of the study visits and interviews that has been performed.
Finally, the two last sections will describe how the discussion and exemplification of
new functions has been conducted.
As described in the introduction, the aim of this thesis is to improve the decision sup-
port regarding planning of railway tamping maintenance. The focus has been to iden-
tify problems in the process and suggest an improvement strategy to develop the soft-
ware Optram.
The work with the thesis has been subdivided into the four following objectives,
which will be referred to in the text in this chapter:
(1) Study and mapping of the tamping maintenance process
(2) Identification of issues in the tamping maintenance process and desire for new
functions in Optram
(3) Categorisation and analysis of identified issues
(4) Exemplification of how the issues can be solved or reduced
A literature study has been a large part of this thesis, providing a theory base for the
process formulation and report writing. The data collection has consisted of a qualita-
tive interview study on different themes, the result within these themes have later
been analysed to put focus on problem structures. Examples of possible ways to solve
the problems have been presented and concluding recommendations regarding the
future development of Optram have been formulated as the final parts of this thesis.
2.1 Literature study
A literature study has been conducted to fulfil Objective (1) and facilitate the readers
as well as the authors with necessary knowledge of basic railway theory. The descrip-
tion of the railway track has been written for readers that are not accustomed with the
technical terminology of railroad engineering and is followed by a section describing
the nature of track irregularities. Both these sections are based on texts by Andersson
& Berg, Corshammar and Esveld.
The next section describes tamping maintenance and track irregularities, and is based
on literature by the authors mentioned above, along with the standards, manuals and
other internal documents of the Swedish Transport Administration. The section that
describes the software Optram is mainly based on interviews with Simon Gripner and
Jan Spännar, both engineers within the Optram management group, together with in-
ternal documents produced by the Swedish Transport Administration concerning Op-
tram. The authors have also been introduced to the Optram system.
Description of different contract types and the tamping maintenance process as a
whole have been performed in order to understand how Optram is used in reality.
Contracts and documentation from the procurement process have been studied to fa-
cilitate the writing of this section. Interviews with supervisor Tomas Johansson, Main-
tenance Engineer at the Swedish Transport Administration, have also been used.
Mapping of the tamping maintenance process was found necessary to formulate the
context in which the software Optram is used. Available literature is describing the
tamping procedure itself while the control documents of the Swedish Transport Ad-

CHALMERS, Civil and Environmental Engineering, Master’s Thesis 2012:63 4
ministration are describing the regulations and goals with tamping, but no complete
description of the planning process has been available.
2.2 Study visits
Three study visits have been conducted during the work with this thesis, aiming to
increase the authors’ knowledge of the tamping maintenance process. They have con-
sisted of a track irregularity inspection of an isolated defect, a track measurement with
the STRIX-car and a visit to a tamping operation on new-built track. The study visits
have been planned in cooperation with Jack Hansen, Maintenance Manager at the
Swedish Transport Administration. Documentation from these study visits has been
important while writing the theory section and for Objective (1) and (2).
2.3 Interviews
The interviews have been structured to aid in the fulfilment of Objective (2). The in-
terview methodology has been of qualitative nature, meaning that the aim of the inter-
views has been rather to identify qualities, positive or negative, within the studied
subject rather than measuring in what quantitative extent each of these qualities are
applicable. The interview and interview analysis methodology has been developed in
accordance with Ryen and Torhell (Ryen, o.a., 2004).
Structure of the interview
The interviews have been conducted as semi-structured conversational interviews. An
interview manuscript with on beforehand formulated questions, has been used to en-
sure that certain question themes are covered, but the interviewees have also been
given the opportunity to talk freely within these themes. Spontaneous questions have
also been put to help the interviewees elaborate around the subjects. Six question
themes have been formulated as following:
- General opinion on the field of tamping
- Formulation of goals in contract and regulating documents
- Method for evaluation of measurements
- Planning of tamping
- Execution of tamping
- Methods for follow-up
The question themes have been chosen so that the interviewees could describe prob-
lems in the whole process of tamping maintenance from their perspective, as well as
specific problems when using Optram and their own thoughts on solutions. The ques-
tion themes have been put in a logical order, starting with simple questions with easily
accessible answers for the interviewees and continuing with increasingly specific
questions.
The questions for the interview manuscript are available in Appendix 0.
Selection of interview group
The selection of interviewees has been performed in consultation with supervisor
Tomas Johansson. All interviewees are in a role that connects them closely to the
tamping maintenance process. The intention was to select a group with a large re-
gional spread, covering both the roles of contractor and client i.e. the Swedish Trans-
port Administration. All interviewees have been associated with certain maintenance
contracts for one or several rail links and the goal has been to obtain a group repre-
senting different types of rail routes in terms of track standard and type of traffic.

CHALMERS, Civil and Environmental Engineering, Master’s Thesis 2012:63 5
Six interviews have been performed with five maintenance managers from the Swed-
ish Transport Administration and one manager from an arbitrary contractor, see Table
2.1. The interviews have been conducted anonymous in order to have an outspoken
discussion. The interviewee will therefore only be referred as the interviewee or with
the title. Each interview session has taken approximately one to one-and-a half hour
and the interviews have been recorded and transcribed. Some of the interviews have
been carried out via video conference or telephone interview.
Table 2.1 Overview of the interviewees’ role, region, type of contract and the type of traffic on the persons links for which they are responsible for. The abbreviation ‘STA’ refers to the Swedish Transport Administration.
Role Region Contract type Type of traffic
Maintenance manager, STA West Traditional Light goods/passenger
Maintenance manager, STA West Performance-based Heavy goods/passenger
Maintenance manager, STA East Performance-based Heavy passenger
Maintenance manager, STA North Traditional Light goods
Maintenance manager, STA North Performance-based Heavy goods
Project leader, Contractor East Performance-based Heavy passenger
Presentation of interview result
The interview result is presented in Chapter 4. Due to the extent and complexity of the
full interview result, only selected issues are presented and further discussed in the
report. The order in the chapter is not following the interview chronology, they are
sorted by the selected issues. The transcribed material has been sorted out of irrele-
vant information and comments, so that the interview result has become more concen-
trated. In this process, a certain amount of interpretation has been necessary. The re-
sults will present the identified issues in Objective (2).
2.4 Evaluation of results
The interview analysis has been conducted with the focus of answering to the fulfil-
ment of Objective (3). All standpoints presented in the interview result has been dis-
cussed, evaluated and associated to each other to create a context. The focus has been
to select issues that could be improved by developing new functions in Optram. In this
way, the issues in the tamping maintenance process, which are judged as most impor-
tant have been highlighted and sorted out. These issues have also been discussed in
terms of where in the process they are raised and what effects they have.
2.5 Exemplification of problem solutions
The final part of this thesis has been to present examples of how new functions in
Optram could contribute to eliminate or reduce the identified problems, answering to
the last objective, Objective (4). The section is also a support for the following con-

CHALMERS, Civil and Environmental Engineering, Master’s Thesis 2012:63 6
clusions. Attempts have been made to suggest improvements both targeting direct
problems for Optram users and indirect problems that arise in the tamping mainte-
nance process. The examples of problem solutions have been developed by the au-
thors based on the actual problems, which are stated in the discussion in Chapter 5.
This section shall not be seen as the way the problems should be solved but rather
how they could be solved.

CHALMERS, Civil and Environmental Engineering, Master’s Thesis 2012:63 7
3 Theory
This chapter will give the reader a theoretical background to the results. The first sec-
tion will describe the basics of track geometry and define track irregularities. Thereaf-
ter will the tamping operation be explained and exemplified. The following section
will describe the measuring method for track irregularities and how this is evaluated,
both analogue and with digital format Optram. Finally, the last section will describe
how tamping is administrated within different maintenance contract and in the plan-
ning process.
3.1 Railroad track
It is essential to understand how the railway is constructed and designed in order to
understand how track geometry quality can vary over a distance. This section will
explain the basic parts of a railroad track construction and its geometry.
3.1.1 Track components and geometry
There are different kinds of railway constructions, ranging from simple structures
with wood sleepers and jointed rails to ballast-free tracks with welded rails
(Banverket, 1995). The railway is composed of different parts with different func-
tions, as displayed in the cross section below, Figure 3.1. Starting from the top, the
different parts are described in the following section. (Andersson, o.a., 2001).
.
The rails are made of I-shaped steel bars on which the rail vehicle wheels are running.
Rail sections of lengths up to 400 m are welded together to form a smooth rail with
good travelling comfort. Sleepers form the support for the rails, transferring the load
from the vehicles into the ballast. The sleepers are normally constructed of concrete,
but wood sleepers occur on old track sections, in tunnels and on bridges. The spacing
between the sleepers is normally 0.65 m.
Furthermore, the ballast bed is anchoring the track, preventing lateral and longitudinal
movements as well as creating bearing capacity for the track. There are strict require-
ments on the characteristics of the ballast regarding hardness, grain shape and grain
distribution to ensure that the desired function is achieved. Apart from being stable,
Figure 3.1 Schematic picture of the components in a railway track (UIC, 2010).

CHALMERS, Civil and Environmental Engineering, Master’s Thesis 2012:63 8
the ballast bed must also have elasticity and good drainage capacity to lead off rain
water. It also has to ensure ability of adjustment. Finally, the sub-ballast is the primal
track foundation, preventing vertical movements and its thickness depends on the un-
derlying subgrade. To avoid movements in the subgrade due to frost heave the sub-
ballast also has an isolating function and the thickness is therefore depending on in
what climate zone the track is situated.
Track geometry is composed by straight lines and curves with different radius de-
pending on the maximum speed on the track, this is regulated in the guidelines of the
Swedish Transport Administration. Between a straight line and a curve is a transition
curve where the radius is varying, from infinite at the connection to the straight sec-
tion to equal of the curve at the curve connection, see Figure 3.2. On Swedish railway
lines the curves can have a radius of 500 - 20 000 m (Andersson, o.a., 2001). To com-
pensate for radial acceleration forces in the curved sections a cant is added on the
outer rail in the track cross section, see Figure 3.2. Since the acceleration force is de-
pending on the speed with which the train travels through the curve, each curve has a
design speed. Nevertheless it is possible to travel with different speeds through the
curve, the result will be a residual acceleration force experienced by the passen-
ger/goods and uneven wear on the rails.
Figure 3.2 Above: The different geometric elements of the railway track. Below: A sleeper with cant in a curve, the left rail is the outer rail in the curve. The cant is denoted as h (Andersson, o.a., 2001).
The transition between straight track and track with cant constitutes of a ramp placed
in the transition curve on the outer rail. In the ramp, the cant is increasing with certain
steepness depending on the length of the ramp and target value of cant; this steepness
is referred to as twist. The twist accelerates the rail vehicle into a rotation and there-
fore the rail is subject to large forces from the rail vehicle wheels (Andersson, o.a.,
2001).

CHALMERS, Civil and Environmental Engineering, Master’s Thesis 2012:63 9
3.1.2 Track irregularities
Deviations from the projected track geometry exceeding tolerated levels are defined
as track irregularities (Corshammar, 2008), see Figure 3.3. The projected or nominal
track geometry is the planned geometry of the railway track, referring both to
horizontal-plane geometry and vertical alignment in the cross-section.
Figure 3.3 Illustration of track irregularities. The dashed and dotted line indicates the nominal track geometry (Corshammar, 2008).
For a newly built track the tolerances for track irregularities are very low, only a cou-
ple of millimetres. As the trains start running on the track larger deviations will arise,
horizontally due to track movements and vertically due to crushing of the ballast
Track irregularities are important to maintain regularly, as the irregularities can be too
difficult and expensive to restore if they have become too extensive, in which case a
larger reinvestment measure is necessary rather than simple maintenance (Banverket,
1997).
3.1.3 Consequences of track irregularities
Track irregularities can be classified into different groups depending on their exten-
sion in length and type of irregularity.
The shortest irregularities, as referred to in the standards of the Swedish Transport
Administration, are the isolated defects (Banverket, 1997). An isolated defect is a sin-
gle point value where the track deviation norms are exceeded and can concern cant,
twist or track gauge. Isolated defects induce dynamic forces in the vehicle, which can

CHALMERS, Civil and Environmental Engineering, Master’s Thesis 2012:63 10
cause comfort problems for passengers. Further, the repeated passage of trains over an
isolated defect can cause local extreme wear on the track, resulting in fatigue of rails,
fastenings and sleepers and eventually causing fractures on the rails and thereby a
great risk of derailment. Due to the nature of the isolated defects they are often subject
of corrective maintenance.
Short wave irregularities are defined as irregularities with a wave length of 1-25 m,
here alignment and longitudinal level are sorted. The consequences of short wave ir-
regularities are similar to those of the isolated defects however; they rather create vi-
brations of a couple of seconds than inducing dynamic forces.
Long wave irregularities are defined as irregularities with a wave length exceeding 25
m (Banverket, 1997). These types of irregularities mainly cause problems at high
speeds, creating swaying movements of the wagons which can cause nausea for pas-
sengers. Moreover, long wave irregularities can be difficult to detect with the acceler-
ometers that are used as measuring equipment.
Track irregularities can increase the risk of sun kinks, which is a phenomenon when
the track gets buckled. This is caused by length expansions in the track due to a tem-
perature change. Welded track has no margins to expand, which induces large forces
in the sleepers at high temperatures and when the horizontal forces are too large the
track will buckle and cause a sun kink, see an example of this event in Figure 3.4.
When trains are crossing isolated defects, caused by track irregularities, it will induce
large forces to the track, which can trigger sun kinks. Sun kinks are serious events that
can cause derailment (Trafikverket, 2010).
Figure 3.4 Illustration of a sun kink.
There are several advantages with minimizing track irregularities. By limiting the
forces that affect tracks due to isolated defects, the wear of several track components
is reduced and the operation safety is increased for the railway. This will have positive
long-term effects and increases the track’s life-span1. It will also affect the comfort for
passenger trains due to disturbing vibrations.
1 Dan Cedergårdh, Track Engineer, Swedish Transport Administration. Interview 2012-04-27

CHALMERS, Civil and Environmental Engineering, Master’s Thesis 2012:63 11
3.2 Railway tamping
Railway tamping maintenance is conducted to restore track irregularities and is the
most common form of track maintenance (Esveld, 2001). The following section will
describe the process of railway tamping, different tamping vehicles and how tamping
is conducted today in Sweden.
3.2.1 What is tamping?
Tamping can be explained as compaction of the ballast in the railway track to increase
the supportive effect from the ballast on the sides of and under the sleepers. The tamp-
ing vehicle has a tamping tool that consists of claws of picks that are inserted in the
ballast on each side of the sleeper after which the picks are vibrated, creating small
movements in the ballast bed which adjusts the position of the individual aggregates
to reduce cavities, see Figure 3.5. The other vital part of the tamping machine is the
lining tool, consisting of a gripping device with steel rolls tracking the rail. As the
tamping tool creates vibrations in the ballast bed, the lining tools adjust the position of
the rails, by which the whole track is straightened. Tracking wheels are collecting
geometric information to the on-board measuring system, which are controlling the
gripping devices pulling the rails so that the correct horizontal and vertical position is
restored (Esveld, 2001).
Figure 3.5 Above: Principal sketch of tamping action. The tamping tool stops over a sleeper after which the picks are pressed down in the ballast, vibrated and squeezed around the sleeper. Be-low: The current position of the sleeper is adjusted horizontally and vertically so the correct posi-tion in the cross section is established
The control system of the tamping machine commonly uses a three- or four-point
measuring system for identifying the geometry (Esveld, 2001). The machines can
have both mechanical and digital systems. Using the relation between measuring
points, consisting of earlier mentioned tracking wheels, horizontal and vertical devia-
tions from a line intersecting the points are identified. The effectiveness of this prac-
tice is depending on the length of the tamping vehicle measuring basis. The greater

CHALMERS, Civil and Environmental Engineering, Master’s Thesis 2012:63 12
the distance between the measuring points, the better the accuracy. Figure 3.6 below
illustrates the lining principle which can be described as smoothening, as the irregu-
larities are evened out in relation to the existing geometry.
Figure 3.6 Illustration of how the tamping vehicle smoothens out irregularities. A Theurer 07-32,
commonly used tamping vehicle, has a measuring basis of a = 4 m and b = 11 m (Esveld, 2001).
The lining principle of smoothening is not equally efficient when it comes to track
irregularities with larger deviations from the projected geometry. As a result of many
subsequent smoothing tamping actions, the railway track can be centimetres out of
position on longer sections (Corshammar, 2006).
To avoid this problem, coordinate controlled railway tamping can be conducted, either
restoring the track to its projected line or creating an adapted optimal geometry from
the existing one. Another type of tamping is facilitated by laser measurements from a
probe vehicle driving in front of the tamping vehicle, creating a longer measuring
basis for the vehicle (Esveld, 2001).
3.2.2 Different types of tamping machines
Though most tamping machines operate in a way similar to the one described above,
there are some differences. Tamping machines can be subdivided depending on their
progression speed which is mainly affected by how many “claws” the machine is
equipped with and thereby how many sleepers can be tamped simultaneously. In the
table belowTable 3.1, a few examples of tamping machines are listed with corre-
sponding working speeds and the picture in Figure 3.7 shows an example of a tamping
machine.

CHALMERS, Civil and Environmental Engineering, Master’s Thesis 2012:63 13
Table 3.1 Examples of different tamping machines with corresponding work speeds. Edited: (Matisa, 2012) (Esveld, 2001).
Model Type Maximum working speed
Matisa B20-75 Single sleeper, intermittent 500 m/h
Matisa B45D Double sleeper, intermittent 1200 m/h
Plasser & Theurer 09-32 CSM Double sleeper, continuous 1600 m/h
Plasser & Theurer 09-3X Triple sleeper, continuous 2200 m/h
Further, the machines can be divided depending on whether they are continuous ac-
tion tamping machines or intermittent action tamping machines. A machine operating
intermittently is tamping a group of sleepers, moving along for a couple of meters and
then stopping to perform tamping on the next group of sleepers, resulting in an irregu-
lar running pattern which can be a problem of the working environment for the ma-
chine operators. The continuous action tamping machine on the other hand is
equipped with a tamping trolley under the machine itself, so the trolley can move in-
termittently while the machine itself has a constant speed.
Figure 3.7 Tamping vehicle in operation between Göteborg and Trollhättan. The vehicle is a Matisa B40D with double sleeper tamping tools and intermittent working pattern.
There are also special tamping machines for switches and crossings, equipped with
displaceable tamping claws to enable movement of the tamping tools to the exact
point to be tamped, as normal tamping machines can only operate on line sections.
For minor irregularities tamping can also be performed by tractors and excavators
equipped with tamping tools (Esveld, 2001).
3.2.3 Tamping in practise
Tamping in Sweden has to be carried out according to the rules and limit values for-
mulated in the regulations of the Swedish Transport Administration. Most relevant of
these regulations is the standard BVF 587.02, stating the limit values for residual ir-
regularities after executed tamping.

CHALMERS, Civil and Environmental Engineering, Master’s Thesis 2012:63 14
According to Hansen2, different documents provide valuable information for the
tamping crew during operation. The list of ordered tamping units is essential and
gives information of at what length section to start and stop tamping. It is ordered by
the tamping planner, who in some contracts is the maintenance manager of the Swed-
ish Transport Administration while in other cases is an employee of the contractor.
What further is important is a valid time plan for the planned working shift, where the
operators can see planned passages for other trains and by this enable for the crew to
move the tamping machine in sufficient time to an off-branching side track. A curva-
ture card is yet another document giving valuable information. The curvature card is a
simplified map of the railway route, stating start and end points for different geomet-
rical elements. Due to the fact that the tamping machine is bound to the track and only
can move forward or back, such a kind of simplified map is in most cases sufficient.
When the tamping order is executed this shall be reported through the information
system BIS, along with information on deviations from the original order. This is
done to make the information available for follow-up and planning of new tamping
measures (Banverket, 2004).
3.3 Measuring method and evaluation of track irregularities
In order to keep a safe track geometry quality on the railway it is important to perform
continuously measurements. Track geometry quality can be measured manually (un-
loaded) e.g. during maintenance work or with an automated track recording car
(loaded), which will be in focus in this section. The measuring results are presented
graphically and in a list format. This information is used to identify critical parts of a
railway link and to evaluate what type of measure that should be taken e.g. if it is
critical deviations that requires immediate measure or if it can be adjusted during the
next planned maintenance work. This is used as a basis for the long-term preventive
maintenance plan and to control its effect. The rules and restrictions for controlling
track geometry quality are stated in BVF 587.02 (Banverket, 1997).
3.3.1 Measuring track geometry quality
Track geometry quality measurements are performed continuously during the year
and the recommended intervals are to measure about five times per year. There are
two types of recording cars that are used to measure track geometry quality in Sweden
today, in total one STRIX car and three IMV100 cars. The STRIX car is the most ad-
vanced and will be further described.
The STRIX-car is originally a café wagon RB5 from 1940 that was rebuilt 1973 to
measure overhead lines. In 1998 it was rebuilt again and equipped with a more ad-
vanced measuring system that is still used today, see Figure 3.8. This system is based
on an accelerometer and optical instruments that measure the deviations of longitudi-
nal level. Further, alignment for each rail is measured from the wagon’s wheel to a
reference point. The system registers data four times per meter. The STRIX-car also
measures the rail profile and overhead line. In the back of the car there is a video re-
corder that runs continuously and films the surroundings e.g. to see stations and vege-
tation (Banverket, 1997).
2 Jack Hansen, Project leader, Swedish Transport Administration. Interview 2012-03-27

CHALMERS, Civil and Environmental Engineering, Master’s Thesis 2012:63 15
Figure 3.8 Pictures of the recording car STRIX. The picture to the right shows the measuring equipment.
The outcomes from STRIX-measurements regarding track geometry quality are used
in a system to generate numerical characteristics of the track. There are several types
of errors that affect the track geometry quality and these parameters are used to iden-
tify both isolated defects and combined errors. Signals from the recording car are
sorted with a filter with different wavelengths and then presented as characteristics
that describe the track geometry quality (Banverket, 1997).
Longitudinal level deviations can affect a train in two different ways. If one rail is
higher than the other it will generate a rotating movement in the wagon and if the
heights deviations are equal for both rails it will generate a rolling movement in the
wagon’s direction. These error modes are described by the short-wave longitudinal
level of right and left rail and by the mean value of both rails as long-wave longitudi-
nal level. The cant is calculated with a gyroscope in the recording car that measures
the angle between the ground and wagon. This value is differentiated to give the twist
over 3 or 6 m basis (Banverket, 1997).
Isolated defects are categorized in terms of class A-, B- and C-faults. Class A-faults
describes the allowed limits for a new build track and the limits in class B should be a
limit for when measures should be taken. Class C-faults are serious events that can
cause derailment and should be fixed as soon as possible and depending on serious-
ness speed reduction or total stop for trains should be considered. The limits for A, B
and C-faults depends on a track’s quality class. These are denoted as K0, K1,
K2,...,K5 and refer to the highest allowed speed on the track, where K0 is allows the
highest speeds. It is optimal that deviations never reach class B in the first case (Ban-
verket, 1997). An example of the limits for longitudinal levels is illustrated in Figure
3.9, the red circle marks the C-fault limits for short wave alignment deviations e.g.
deviations larger than 5 mm for a K0 quality class is classified as a C-fault.

CHALMERS, Civil and Environmental Engineering, Master’s Thesis 2012:63 16
Figure 3.9 Extract from the BVF587.02 standard. The circled column is stating the limit value for
track irregularities in mm, denoted as C-faults.
The track geometry quality over a longer distance can be described numerically with a
quality coefficient, Q-value. It is based on standard deviations for alignment and in-
teraction between longitudinal level and cant. Standard deviation is a common way of
describing track irregularities in Europe and it describes how the deviations over a
certain distance. The standard deviations are calculated continuously over a distance
of 200 m. The Q-value is calculated by using the following equation (Banverket,
1997):
Where: Q Q-value [-]
σH Mean standard deviation for longitudinal level
σs Mean standard deviation for interaction
σHgr Comfort limits for for σH
σSgr Comfort limits for for σS
The interval for Q used in practise is set to 0<Q<120 but it has a theoretically maxi-
mum of 150. A high Q-value indicates a good quality of the track. Notice that inter-
acted deviation, σs has a larger impact on the Q-value than the longitudinal level σH.
Recommended Q-values depends on the quality class of a track and is shown together
with a predicted degradation in Table 3.2 Recommended Q-value depending on qual-
ity class and predicted degradation (Q/year). Table 3.2.

CHALMERS, Civil and Environmental Engineering, Master’s Thesis 2012:63 17
Table 3.2 Recommended Q-value depending on quality class and predicted degradation (Q/year). (Banverket, 2004)
Quality class Recommended Q-value Predicted degradation (Q/year)
K0 80 4-8
K1 80 4-8
K2 75 3-6
K3 75 3-6
K4 75 2-4
K5 75 2-4
Results from the recording car are currently presented in digital and analogue format.
The analogue version contains a track geometry quality diagram, here denoted as
TGQ diagram, with a graphical illustration of the deviations and three documents:
valuation diagram, C-fault list and a quality list. TGQ-diagram is also presented in a
digital version, in the software Optram.
3.3.2 Digital evaluation with Optram
The Optram software has been in use at Swedish Transport Administration and former
Banverket since 2009 and was delivered as an advanced tool for analysis of track and
overhead line measurements. It is provided by Bentley Systems and is also used by
the American Railway Company Amtrak. Optram is supposed to replace analogue
evaluation of measurements printed as PDF-files. In the following section the meas-
urements and tools used for planning of tamping will be described. The section is
based on interviews with Gripner and Spännar3.
Track irregularities can be complex, not always depending on deviations in one of the
measured values but rather on the synergy of multiple deviations. Because of this, the
Optram standard interface comprises multiple views simultaneously, to enable identi-
fication of irregularities in continuous data and discrete track elements.
The basic function of Optram is to show measured data parameters and how they are
related to the standards documented in BVF 587.02. Track irregularities are plotted in
relation to a centre line describing the nominal track geometry. The y-axis describes
the magnitude of the irregularities and the x-axis states the position of each irregular-
ity (km + m), see Figure 3.10.
Measurements are available for the entire Swedish railway net and can be displayed
by selection of rail link and length section. For example, a rail section close to Al-
ingsås can be found by choosing link 622, km 412 + 400 m. The navigation bar is
displayed in Figure 3.10, area (a.). From the current view, navigation along the x-axis
is performed using the arrow buttons in the tool field. Zooming buttons, placed left of
navigation arrows, can be used to adjust the scale of the x- or y-axis. Area (b) in Fig-
ure 3.10 illustrates facility data from BIS with information about e.g. were stations,
crossings and insulation joints are positioned. Some of the data displayed is relatively
3 Interview with Simon Gripner 2012-02-27 and Jan Spännar 2012-02-28. Engineers within the Optram
management group, Swedish Transport Administration

CHALMERS, Civil and Environmental Engineering, Master’s Thesis 2012:63 18
raw while other data is calculated. An example of calculated data is the Q-value of the
track, which is important interpret the complex data supplied from the measurements,
see Figure 3.10, and curve (c.).
The track irregularities are effects of horizontal and vertical deviations of the track
which is the most basic data displayed in the Optram user interface. The horizontal
and vertical deviations are showed as two sets of curves, each set containing three
curves, see Figure 3.10, curves (d.) and (g.) respectively. Each set comprises dis-
placement of the right rail, left rail and a mean value of both.
Uneven changes in horizontal and vertical position can cause twist. The twist of the
track is displayed in Figure 3.10, curve (e.). Curves and transition curves are more
sensitive to twist irregularities than straight sections and therefore it is of great impor-
tance to connect the twist irregularities to the track geometry. Curves (f.) in the same
figure shows cant and curvature.
Information on the track gauge is important for maintaining a safe track, since devia-
tions can cause derailment. Track gauge irregularities can be caused by displacement
of the rail on the sleeper but also by wear on the rail. Figure 3.10 curve (h.) shows the
track gauge.
Apart from measurements regarding the track, earlier performed maintenance opera-
tions is also important information for maintenance planning. Certain sections have to
be tamped more often than others and in some sections tamping has marginal effect to
the state of the track. In the view “Spårriktning” (Tamping), the date and extension of
earlier tamping measures are displayed, see Figure 3.10, curve (i.).

CHALMERS, Civil and Environmental Engineering, Master’s Thesis 2012:63 19
Figure 3.10 The Optram user interface with default settings.

CHALMERS, Civil and Environmental Engineering, Master’s Thesis 2012:63 20
For most railway links, measurements are performed several times a year. As a result
of this, multiple measurements for each link are accessible and can be displayed one
at a time or layered on top of each other in the Optram view window. By comparing
several measurements, degradation trends can be shown as well as effectiveness of
maintenance measures. Figure 3.11 below shows the degradation trend in form of Q-
value.
Figure 3.11 The trend analysis view setting, exemplified on Q-value. Measurements from August 2010 (red), June 2011 (green) and December 2011 (blue) are displayed. In the view above previ-ous tamping measures are displayed and denoted with the date.
3.3.3 Analogue evaluation with PDF-diagram and lists
Analogue evaluation documents in PDF-format are sent to the Swedish Transport
Administration and if necessary to the contractor. These documents consist of two
diagrams; one track geometry quality diagram and one valuation diagram. Further,
two documents in list form, quality list and C-fault list are included. The track geome-
try quality diagram is the original layout that the Optram view is based on and the
illustrations are similar, see Appendix II. However, the track geometry quality dia-
gram does not provide Q-value or information about previous tamping or detailed
facility information (Banverket, 1997).
The valuation diagram shows graphically the standard deviations for longitudinal
level, alignment and combined errors. It also illustrates the curvature, Q-value, B- and
C-faults, track gauge errors and other information about the time for measurements
and distances measured, see Appendix III. The quality list is a summary of the meas-
urements in table form. It presents the amount of B- and C-faults and track errors, per
kilometre together with standard deviations and declaration of the mean Q-value be-
tween stations and for the whole link, see Appendix IV. Finally, the C-fault list con-
tains length position of all isolated defects that are classified as C-deviations and de-
railment-urgent faults and are marked with bold text. This document is useful for
planning corrective maintenance (Banverket, 1997).
3.4 Tamping in a maintenance contract
Tamping is normally conducted as a part of larger railway maintenance contract that
also covers other areas for example change of sleepers or replacement of rails. The
procurement is set up by a national board and is normally limited geographically by
different corridors. Since the Swedish Transport Administration was developed, the

CHALMERS, Civil and Environmental Engineering, Master’s Thesis 2012:63 21
relationship between contractor and client has changed from a regulated market to an
open market with defined roles. Swedish Transport Administration has set up a goal
for the maintenance business to develop and define the role as client even more and
one part of this is evaluating the project delivery methods.
3.4.1 Project delivery method
Railway maintenance is normally performed in one of the following two different
project delivery methods: traditional contract and performance-based contract. The
main difference is that a traditional contract normally offers specific unit prices while
a performance-based contract is based on maintaining a function.
In traditional contracts, the client has full responsibility for designing the maintenance
operations and presents a work description on which the contractor can give a price
for each unit in the tender. The design part can be supported by external consultants
and should follow AMA, a reference system for the building industry. A technical
description is a basis for the construction design and defines which materials and
methods that should be used by the contractor.
The client’s role in a performance-based contract is smaller and allows more creativ-
ity for the contractor to plan their work. An inspection is made before the contract
starts by the contractor to evaluate the present standard and function of a link or facil-
ity. The contractor will then give a tender with a price for maintaining the same qual-
ity of this link or facility by the end of the contract and at annual controls. This means
that the contractor should include both preventive and corrective maintenance costs in
their tender.
There is a long-term goal at the Swedish Transport Administration to convert all
maintenance contracts into performance-based ones. The purpose is to use the con-
tractor’s knowledge and experience and leave over the responsibility for planning
operations. By letting the contractor plan resources in a more free way it could lead to
a more cost efficient work. Today, the performance-based contracts are used for about
half of the railway maintenance contracts in Sweden4.
3.4.2 Preventive and corrective maintenance
For railway maintenance, the contract is divided in two main subjects, operation and
maintenance, see Figure 3.12. Operation involves services to support the object’s eve-
ryday function like snow clearing and leaves clean-up, while maintenance are meas-
ures that should retain or restore an object in order to maximize its lifetime. Mainte-
nance is sub divided into preventive and corrective maintenance, where corrective
maintenance involves measures against functional errors that should be fixed immedi-
ately or within a week. Preventive maintenance, on the other hand, is performed in
order to decrease the probability for damage or degradation of an object. The preven-
tive in turn is sub-divided into condition-based and pre-determined maintenance.
Condition-based maintenance involves control of the actual state and measures for the
object while pre-determined maintenance is conducted at certain fixed time intervals
without a preceded inspection (Banverket, 2009).
4 Tomas Johansson, Maintenance Engineer, Swedish Administration. Interview 2012-03-23

CHALMERS, Civil and Environmental Engineering, Master’s Thesis 2012:63 22
Figure 3.12 Overview of the objects in a maintenance contract. Edited (Banverket, 2009)
Tamping is performed as both preventive and corrective maintenance. In a perform-
ance-based contract the preventive part can be both condition-based and pre-
determined. Examples of corrective maintenance are measures against isolated defects
that could be C-faults, detected by a recording car. Preventive maintenance are on
beforehand planned operations conducted in continuous intervals, e.g. tamping during
workweeks. The function demand regarding tamping is based on maintaining an aver-
age Q-value on a certain link or between stations. For example, if a link has an aver-
age Q-value of 75 when the contract starts, the contractor takes the economical re-
sponsibility for maintaining this value until the contract has ended. If the client wants
to raise the Q-value at one part of the link then this can be managed as an additional
part. It is up to the contractor to plan its own work and choose methods to maintain
the function and the contractor is responsible for both corrective and preventive main-
tenance5.
Fines and bonus can be used as an incitement for the contractor keep a good track
quality and follow the functional demands. However, a good preventive maintenance
plan will minimize corrective measures, which is an expensive and time-consuming
work for a contractor in a performance-based contract (Johansson, 2012).
3.5 Tamping maintenance process
The tamping maintenance process could be illustrated as planning, maintenance,
measurements and follow-up components see Figure 3.14. This section will describe
how the planning and follow-up is regulated and conducted.
5Tomas Johansson, Maintenance Engineer, Swedish Administration. Interview 2012-03-23

CHALMERS, Civil and Environmental Engineering, Master’s Thesis 2012:63 23
Figure 3.13 Illustration of how the tamping maintenance process could be visualized.
However, the planning and follow-up phases of tamping maintenance are not strictly
regulated by the Swedish Transport Administration, only the goals that should be
achieved in this process. As a result of this, there can be differences in the process,
depending on what region the rail link is located and how the process is regulated in
the maintenance contract.
3.5.1 Planning
Planning of tamping maintenance is conducted by the client in a traditional contract
and by the contractor in a performance-based contract, although the principles should
coincide. Corrective tamping maintenance is special cases were the demand is set by
regulations in the standards. If the recording car reports a C-fault or a fault with risk
for derailment measures has to be taken immediately. On the other hand, preventive
tamping should be planned on before-hand. There are mainly two aspects to consider
in the planning; evaluation of measurements and applying for possession time i.e. to
acquire time for maintenance in the link’s time-table.
The method and results of track geometry measurements are described in Section 3.3
and the evaluation is regulated with recommendations in the manuals and standards,
stated by the Swedish Transport Administration. However, the interpretation of these
results can be arbitrary depending on the maintenance engineer and his experience of
evaluating TGQ-diagrams. The process of prognosticating tamping effects is not
clearly regulated in the manuals. There is only one guiding formulation in the tamping
manual, saying that “Before a final decision is taken regarding tamping, an assess-
ment has to be made whether tamping alone is a sufficient measure.” (Banverket,
2004).
Availability of possession time and tamping machines is necessary to consider in the
planning process of tamping. Possession time can be reserved in the time-table with
two different systems, BAP and BUP, abbreviations freely translated as “railroad
work plan” and “railroad usage plan”. The former of the two is decided further ahead,
18 months before planned maintenance operation, while the latter is a tool for filling
in available hours, set 8 weeks before the planned maintenance operation. This means
that if the possession time can be reserved in BAP it will enable longer disposable
time for maintenance operations, while time reserved in BUP more likely generate
shorter disposable times and only enables short-term planning operations. The possi-
bility to reserve tamping machines is highly depending on the length of the planning
horizon, so whether the tamping is planned in BAP or BUP will have impact also on
tamping machine availability6.
6 Tomas Johansson, Maintenance Engineer, Swedish Administration. Interview 2012-03-23

CHALMERS, Civil and Environmental Engineering, Master’s Thesis 2012:63 24
Available budget is another factor that will affect the amount of tamping kilometres
that can be conducted.
3.5.2 Follow-up
The guidance provided for follow-up routines after tamping is given in the following
extract from the Swedish Transport Administration manual; ”It is important to verify
[…] whether expected results are reached […] and to gain knowledge on if, and in
that case when, recurring irregularities may arise. The immediate results of per-
formed tamping can be followed up by mechanized track monitoring, conducted di-
rectly in relation to the tamping.” (Banverket, 2004).
There are no other clear routines formulated in the manual of how follow-up should
be conducted to evaluate the effect on the track geometry quality. However, there are
economical follow-up after a performed tamping operation. In traditional contracts, it
is common to evaluate a performed operation at the next measurement with the re-
cording car. It is then possible to see the effect in a TGQ-diagram e.g. by evaluating
the Q-value or by comparing the quality lists. Performance-based contracts, on the
other hand, have clear regulations stated in the contract i.e. to maintain a certain Q-
value for a link or between stations. This is controlled annually and in the end of the
contract.

CHALMERS, Civil and Environmental Engineering, Master’s Thesis 2012:63 25
4 Results
This chapter will present results from the interviews. The first section will describe
the selected issues that Optram has a potential to improve, within the tamping mainte-
nance process. The second section will describe opinions about Optram’s current us-
ability and finally, the third section will present desires of new functions that has been
expressed during the interviews. Since the interviews are conducted anonymously
there will not be any references to the interviewed persons in this text. Some quota-
tions are inserted in the text to exemplify the context however; these will only be re-
ferred with interviewee’s title.
4.1 Improvement potential in the tamping process
The general opinion about the present tamping process is positive among the inter-
view persons. Most of them claim that they are satisfied with the track geometry qual-
ity with respect to the given circumstances on their respective link. However, there is
a potential for improvements.
4.1.1 Lack of long-term strategy
There is a broad consensus among the interviewees that a long-term strategy is neces-
sary for planning tamping operations. Only working with corrective tamping will re-
sult in losing control of the track quality as failures arise in a too quick pace. Some
interviewees state that they are not familiar with a specific long-term strategy for
planning tamping operations. In a discussion on the knowledge about steering docu-
ments there are some interviewees that claim they are not that versed with the context
in BVF and BVH as they should be. However, most of the interviewees can describe
the times during a year when they conduct tamping, whether it is a corrective or pre-
ventive tamping operation and what measurements that should be analysed to plan
these operations. One interview person e.g. claims that the strategy used is the one
that is stated in the contract i.e. to maintain a mean Q-value.
“Well, the strategy is probably just that the contractor should fulfil the
demands in form of Q-value in the contract. I don’t think we have any
other strategy.”- Maintenance manager within the Swedish Transport
Administration
Another person describes that they do not have a special strategy for operating tamp-
ing but that there is an ongoing discussion about tamping whole links at continuous
intervals e.g. every third year. An alternative could be to tamp e.g. a third of the link
every year instead. This issue will be further discussed in Section 4.1.4 .
There have been discussions about coordinating different maintenance measures and
the efficiency of each measure. One interviewee states that there are problems with
coordination of maintenance operations. This person describes that when tamping is
conducted it is often preferable to perform other maintenance operations before, for
example exchange of sleepers as this results in a new demand for tamping. Further, it
is described that they have workweeks where different kind of maintenance operations
is performed, such as replacement of rails or change of switches.
When questioned regarding the effectiveness of tamping some interviewees are of the
opinion that tamping sometimes is performed at places where it has limited effect
since the actual problem is something else. The opportunity to suggest alternative and
sometimes more extensive measures is varying, depending on what costs are associ-

CHALMERS, Civil and Environmental Engineering, Master’s Thesis 2012:63 26
ated and the importance of the rail link. One of the interviewees claims that there are
insufficient tools for analysing whether tamping will be effective or not.
4.1.2 Low margin in tenders
Railway tamping is not considered to be a very profitable business for a contractor. It
has been discussed that the contractor has small margins in their budget, which makes
them vulnerable for varying material costs since the contracts times are five years
long. One interviewee claims that contractors from abroad have been surprised by low
tenders here in Sweden.
Another interviewee points out that the profit becomes low for contractors if they do
not manage to prioritize preventive measures in performance-based contracts. One of
the economical incitements in this type of contract is to conduct preventive mainte-
nance in order to minimize costs for corrective measures, which are expensive. It is
crucial for the client to be strict on these economical questions e.g. not paying for cor-
rective maintenance in order to maintain the power of this incitement. This is claimed
to be a threshold for transitions from traditional to performance-based contracts – both
for the client and the contractor.
“If we could describe our facility better and point out which problems
we want to solve, then I think we could have better possibilities to in-
crease the Q-value” - Maintenance manager within the Swedish Trans-
port Administration
The responsibility for planning tamping sections alternates depending on the contract
form. Some of the interviewees are of the opinion that this division is not always fol-
lowed, that the Swedish Transport Administration sometimes suggest a plan for tamp-
ing even though it lies under the responsibility of the contractor. According to the
interviewee, this might undermine the division of responsibility in the contract. The
reason that the agreed division is not followed can sometimes be that the contractor
feels in need of help to identify sections for tamping or that the maintenance manager
of the Swedish Transport Administration wants to ensure that tamping is carried out at
the correct places.
4.1.3 Limitations with mean Q-value
There have been discussions about the use of Q-value in contracts. One issue is the
distance over which the Q-value is calculated. Some contract uses a mean value for
the whole link. This has lead to that section with a low Q-value can be compensated
with a similar length section with a high Q-value. Since it is the mean Q-value that is
the condition in the contract, the contractor does not have to take measures for the
low-quality section.
Due to this issue, one interviewee asks for more control to conduct preventive tamp-
ing maintenance in the contract and claims that maintaining an average Q-value with
these conditions may inhibit preventive maintenance. The goal is to maintain a good
track geometry quality, not just a good mean Q-value. However, another interviewee
explains that they have now divided the link, over which the mean Q-value is based
on, into smaller sections. In this way, sections with a low mean Q-value will be easier
to detect and set a functional demand for.
“Honestly, let’s say if you have a demand on Q-value of 90 on a link,
then the contractor don’t want to have a Q-value of 100. Of course, you
want to be as close to 90 as possible.“ – Maintenance manager within
the Swedish Transport Administration

CHALMERS, Civil and Environmental Engineering, Master’s Thesis 2012:63 27
“When we had a Q-value over a link, it could be so bad that some dis-
tances were really bad but the contractor still managed to hold the func-
tion by the mean value for the whole link.” – Maintenance manager
within the Swedish Transport Administration
Another issue that has been discussed is that the mean Q-value in the contract is based
on an arbitrary judgement of the latest years’ mean values. One interviewee asks the
question why this particular limit is chosen and why it is not higher. The person dis-
cusses the possibility to have a demand in the performance-based contract to tamp a
certain length every year to ensure a better standard and quality. Further, this person
discusses that the Q-value is a good tool to describe the function demand in perform-
ance-based contracts. However, this is not per automatic the best method for keeping
a high track geometry quality in the long run, to a low cost.
4.1.4 Difficulties to acquire possession time
A critical parameter for planning tamping is to acquire possession time. This issue is
also pointed out by most of the interview persons as the main limiting factor concern-
ing efficiency in the whole tamping process. The main concern is to get consistent
possession times to get a high efficiency during one shift. One person claims that the
possession time can vary between an half an hour as worst, and seven hours in the
best case. The person also claims that the average efficiency for a shift is roughly
about two hours running time with respect to start and end time. The time it takes to
get a machine started on track and ready to tamp is estimated to 15-20 minutes for
each possession time and about the same time to finish a work, i.e. getting the ma-
chine away from track.
The concept of continuous tamping is discussed during the interviews, by which is
meant to perform tamping uninterrupted on longer sections instead of tamping several
short sections. For example, 25% of the total track length could be tamped every four
years, meaning that the whole link would be tamped with a return time of four years.
Most of the interviewees are appealed by this concept, one of them stating that this
would result in better economy and a better quality of the track. Another of them also
thinks that continuous tamping would result in a possibility to extend the time inter-
vals between tamping measures. Some of the interviewees approve of the concept but
also stress that some sections would have to be tamped every year independently of
continuous tamping.
Planning time in BUP and BAP differs between the contracts. One line is a single-
track and requires total stop in traffic and the contractor normally applies for this in
the long-term planning system, BAP. However, some interviewee claims that their
applications are often turned down and instead they are offered shorter times that are
similar to the times they would be offered if they would apply in BUP from the be-
ginning. This is a problem for the contractor since they also have to book machines
from another booking system a certain time in advance and these two systems should
coincide. Another interview person claims that the tamping possession times are often
down-prioritized due to e.g. extra trains. This person also describes that the contractor
normally apply for possession time in BUP to be able to plan other types of mainte-
nance work in conjunction with tamping.
Another problem regarding BAP-planning stated by one of the interviewees is the
forward planning. Since track geometry quality change in time and is normally
planned on basis of previous measurements within some weeks before the tamping

CHALMERS, Civil and Environmental Engineering, Master’s Thesis 2012:63 28
action, it is difficult to evaluate which distances that should be tamped within the next
1,5 years. The availability of possession times depends on several parameters, e.g. it is
more difficult on heavy trafficked lines compared low-traffic and it also depends on if
it is a single- or a double track.
“We can not specify the projects, since we do not know exactly what
maintenance operations are necessary in 1,5 years.” - Maintenance
manager within the Swedish Transport Administration
4.1.5 Lack of follow-up methods
As stated in Section 4.1.1, none of the interviewee describes a clear strategy for
evaluating tamping operations regarding the planning or the results but some of them
can describe the measurements that are used to follow-up the contract. Regarding
qualitative follow-up, one of the interviewees describes how the measurements that
are performed in the autumn are normally used to evaluate if the contractor has ful-
filled the goals regarding the Q-value. This evaluation is later presented at a meeting
with the contractor and client.
“No, I cannot say that we have followed up how a single tamping opera-
tion actually improves the Q-value... No we have never looked at it in
that way”- Maintenance manager within the Swedish Transport Admini-
stration
One interviewee claims that the follow-up method is only performed in an economical
point of view, ensuring that the ordered tamping sections have been delivered, but that
no analysis is performed on whether the desired effects are achieved. Another inter-
viewee expresses confidence that Optram will offer a simple method for follow-up,
but has not yet the knowledge of how this follow-up is performed.
4.2 Present state description of Optram
This section will describe some obstacles in Optram that have been expressed by the
interviewed persons regarding usability and the educational possibilities that have
been offered the interviewed persons.
4.2.1 Optram’s current usability
Usability for software can be defined as “Extent to which a product can be used by
specified users to achieve specified goals” (International standard, 1998). This can be
measured with parameters that describe effectiveness, efficiency and satisfaction.
A common explanation why the interview persons do not use Optram is because of
lack of knowledge and experience from the program. The users are accustomed to the
old system and describe the transition as a threshold. One PDF-user with some ex-
perience of Optram prefers PDF in the present situation since no settings have to be
performed; it is just ready to use. One of the interviewees states that the data pre-
sented in Optram is too complex for a new user to understand. The result of this can
be that the user is reluctant to use Optram and rather lets someone with more experi-
ence perform the task.
“Well, those analogue diagrams are more complete. It is more work in
Optram to adjust the settings to the way I want it. There (in the analogue
diagrams) you will get the right scales and everything at once.” – Main-
tenance manager from a contractor

CHALMERS, Civil and Environmental Engineering, Master’s Thesis 2012:63 29
One interviewee has experienced problems with print settings. The person claims that
there are too many steps to get the same format and scale as for the analogue dia-
grams, which they are most familiar with. Further on, the more functions you add to
the diagram the more difficult it is to make a good printout. Another comment is that
the colours in Optram are too sharp and glitzy.
Some of the interviewees are asking for functions in Optram that are already avail-
able. An example of this is the trend analysis function, which can be used to identify
sections with great changes. Some of those asking for the available functions are
aware that they already exist but are calling for simpler functions.
4.2.2 Education possibilities
On the question whether the interview persons has been given education for Optram,
there are some uncertain answers. Some claim that they have been offered education
but then cancelled and other claims that they have been informed about Optram when
it was released but then nothing has happened. Another person is still waiting for edu-
cation and that Optram should be “ready to use” and a third person has been to an
introduction course but claims that their contractor has not been given any courses but
has learned some functions on their own. A more aggressive promotion for Optram i
requested and one interviewee questioned the strategy to release a program while it
was not complete and still had several bugs. This first impression of an unfinished
program makes the users wait to use it until it is finished.
“I’ve got some information about this (Optram), three years ago that
this project had started and that is the only information I’ve got. So, I
have opened the program myself and tried to use it.”- Maintenance
manager within the Swedish Transport Administration
One interviewee says that it is important that the maintenance managers at Swedish
Transport Administration and the contractors are given an adequate education before
the analogue system is shut down. It is also crucial to support the contractor so that
they have someone to call in case they have problems with Optram.
4.3 Desired functions in Optram
The hopes for Optram to be a useful tool for planning tamping actions in the future
are high. Planning tamping sections is a time-consuming operation and the biggest
hope among the interview persons is that Optram should be able to suggest such a
plan by itself. This section will describe some desired functions and visions for Op-
tram that has been expressed during the interviews.
The most common hope for Optram has been that it can recommend the user which
sections that should be tamped on a line by just pressing a button on the keyboard.
Denmark has for example developed a system for analysing track geometry quality
measurements from a recording car that can give suggestions of were tamping should
be conducted.
It is not so easy to decide which sections that should be tamped. Or, I
mean, it is easy to pick out sections, but the question is what is best for
the track geometry quality? - Maintenance manager within the Swedish
Transport Administration
Other suggestions are that Optram should describe the demand of tamping in the same
way as BIS works; there you can get pre-defined reports by choosing a certain link.
Further, there is a desire to see a continuous degradation rate of Q-value. This is de-

CHALMERS, Civil and Environmental Engineering, Master’s Thesis 2012:63 30
scribed to be useful for long-term planning but also to evaluate what effects single
tamping operations could has for the track geometry quality.
There have been discussions about asking Optram pre-defined questions about which
operations that should be conducted to increase the Q-value with for example five
units over a certain link. The program should then give a proposal about where tamp-
ing should be performed to manage this and also give rough cost estimations. This
type of function could be time-saving instead of going through kilometre by kilometre
manually and the cost estimation can give a quick hint about the price level of such
operations.
“It would be interesting to choose a link or section and ask Optram what
measures that should be done to e.g. reach Q-value 90 if I have 85 to-
day.” - Maintenance manager within the Swedish Transport Administra-
tion
Another suggestion is the other way around, that Optram should suggest tamping op-
erations based on a certain amount of budget. It should then make a proposal based on
a given budget, which is often a situation in the reality, about how this money can be
spent in the most cost-efficient way. It will then give suggestions for the most priori-
tized sections.

CHALMERS, Civil and Environmental Engineering, Master’s Thesis 2012:63 31
5 Discussion and analysis
This chapter will analyse and discuss the results from the previous chapter. The analy-
sis is conducted by comparing the interviewees’ answers and discusses how the se-
lected issues could be improved with suggestions of new functions in Optram. The
sections are in the similar chronology as the results.
5.1 Improvement potential in the tamping process
Some issues in the tamping process that could be improved by developing Optram
have been brought up in the results. These issues are further evaluated and are dis-
cussed in this section.
5.1.1 Lack of long-term strategy
On the question about what strategy the interview persons have in their contracts there
is no one that clearly has pointed that there is a clear strategy for planning tamping
operations. However, on other questions about how tamping is performed there have
been clear descriptions given e.g. about how and when preventive and corrective
maintenance is performed and the planning of it. In the handbook BVF 825.20, chap-
ter 4 “Strategy for tamping of tracks and switches” there is a descriptive but general
strategy stated with recommendations for planning, criteria for tamping and follow-
up. However, it is possible that these persons have an own strategy kept in mind,
based on these recommendations, but it is unclear how they correlate. This question is
also related to the discussion about how well the client and contractor read BVF and
BVH documents. Since some of the interview persons have claimed that they are not
as versed as they could be in these documents, it is unclear whether the recommended
strategy is applied in reality.
A common discussion about tamping strategy in general has been weather to tamp
short sections where the track geometry is locally bad or to tamp longer connective
sections e.g. in continuous intervals. These possibilities are varying after traffic and
depend on more circumstances than setting a certain strategy but still, there does not
seem to be a clear pointed out strategy for all regions. Another circumstance is which
type of contract that is applied. The strategy in a traditional contract should be man-
aged by the client but in a performance-based contract it is more up to the contractor
to set his own strategy for planning and tamping. However, this should be based on
what strategy the client wants to achieve and can be challenging to formulate in a per-
formance-based contract. In any case, is not obvious for any of the interview persons
what strategy is, or should be, applied for tamping maintenance.
The quality of a long-term strategy is dependent on the knowledge of track geometry
quality degradation and what effects tamping operations will give. This knowledge
could help to optimise tamping operations and make it easier to coordinate with other
maintenance operations. There is no analysis tool in the current situation that can be
used for this purpose in the maintenance managers’ and contractors’ daily work. This
makes it difficult to define long-term strategies. However, this is a potential area that
could be improved by developing a tool in Optram that can make a prognosis of the
track geometry quality degradation and tamping effects. This tool is further exempli-
fied in Section 6.2.
CHALMERS, Civil and Environmental Engineering, Master’s Thesis 2012:63 32
5.1.2 Low margins in tender
Changing from a traditional contract to performance-based contract is a challenge for
both client and contractor. The contractor has a larger uncertainty in the tender. From
setting unit prices on given objects to calculate costs for preventive and corrective
maintenance based on the current track geometry quality.
It is difficult to analyse the contractor’s profitability without any insight in their
budget. Basing this argument on discussions with clients will not guarantee objectiv-
ity of the interviewees. The contractor has an interest in giving a picture that their
profit is low in this business in order to raise the tenders. This could have an effect on
the client’s view and it is also in his interest to say that the margins are small in order
to get more capital for the next year’s budget. However, the threshold that is described
when entering a performance-based contract is crucial to overcome and this may be
one the reason why the profit is considered as too low for the contractor. It should also
be kept in mind that tamping is one part of a maintenance contract and it is possible
that some parts in a contract are more profitable than others.
It is crucial for contracts that spans over a long time to have the possibility to make
long-term plans in order to calculate a tender. Estimations of how the track geometry
quality will change over time and what effect tamping will have, are essential parame-
ters to evaluate the tamping demand. The relationship between preventive and correc-
tive maintenance would be valuable to visualise with a scenario tool in order to in-
crease the effects.
5.1.3 Limitations with mean Q-value
The Q-value is a useful tool to describe the function in a performance based contract
since it is easy to measure and control. Normally, there is a measurement conducted
before and after a tamping operation and it is therefore easy to compare the result and
see the effect. Calculating a mean Q-value over a link could be useful for a rough
quality estimation to compare links with each other or to get an idea about the budget.
However, it is too blunt to be the basis for a contract. It is more appropriate to divide
the link into smaller sections in order to get more control and detect quality disperses.
It is important to discuss the effects of basing performance-based contracts on a spe-
cific mean Q-value. It should preferably not be the only parameter that is evaluated
since there are other parameters that can describe track geometry quality. Developing
a prognosis tool in Optram could make it possible to find other types of parameters
that can describe track geometry quality, in addition to the Q-value.
It is crucial for track geometry quality to set an appropriate Q-value limit that should
be maintained. This requires knowledge about track geometry quality degradation and
the effect of tamping measures in order to find an optimal limit.
5.1.4 Difficulties to acquire possession time
Allocation of resources that is necessary to perform tamping, is generally a question
for the contractor, independent of whether the contract is performance-based or tradi-
tional. The reservation of possession time in BAP or BUP is however closely linked to
the Swedish Transport Administration, where the planning of BAP and BUP is per-
formed. In short, the system for reservation of possession time becomes an area where
the performance of the contractor is depending on the decisions of the Swedish Trans-
port Administration.

CHALMERS, Civil and Environmental Engineering, Master’s Thesis 2012:63 33
In the result from the interviews it is stated that insufficient priority is given to track
maintenance, instead more trains are inserted in the time table. This is of course the
perspective of persons responsible for the quality of the track; a person within a train
transport company might say that too much time is reserved for track maintenance.
On the other hand, track maintenance is unarguably necessary and if it is not carried
out in a proper way it will result in other types of problems for train transport compa-
nies, e.g. speed limitations and possible suspension of track sections.
The main problem identified within the interview result is that there have been cases
where the contractors experience that they are trying to reserve possession time long
in advance but are denied due to priorities within the Swedish Transport Administra-
tion and thereby are prevented to achieve a long term plan.
It is also possible that the contractors have given an insufficient motivation in the ap-
plication for why the desired possession time is needed. If performed tamping opera-
tions are not resulting in a fulfilled Q-value goal, the issue about lack of possession
time can be brought up by the contractor as a way of putting the blame on the client.
The process of applying for possession time and what is required of the application
has to be clear so that there is a higher predictability in whether the contractors will
have their applications approved or denied.
The lack of long term planning may also be a factor complicating the acquisition of
possession time. By formulating a strategy in a more clear way further attention may
be given as a spin-off effect to the importance of possession time in enabling efficient
tamping maintenance.
5.1.5 Lack of follow-up methods
A selection of the regulations formulated regarding follow-up has been presented in
the theory section and even though the regulations are not entirely clear the result of
the interviews shows that follow-up is made, although the methods vary between the
interviewees.
One clear pattern has been that the change of the Q-value produced by tamping is fol-
lowed up in a greater extent on rail links where the contract documents formulate
clear goals regarding q-value. This normally occurred in a performance based contract
but also in some of the traditional contracts. The quality follow-up in the remaining
contracts seem to be a bit more arbitrary, even though it can be argued that follow-up
is even more necessary there as the client in those contracts normally is responsible
for planning tamping sections and therefore will benefit from the experience gained
from follow-up.
In the theory section the quality list is described as a possible tool for evaluation,
however none of the interviewees refer to this tool when they were asked about meth-
ods for qualitative follow-up. The quality list shows the average Q-value over each
kilometre and over longer inter-station sections. It is not possible to see how the Q-
value has increased over the tamped sections, only how the tamping sections together
have contributed to a better Q-value. This becomes a problem when communicating
the effectiveness of the conducted tamping and might be a reason why the quality list
is not used.
A more structured quality follow-up could have the benefit that the relation between
tamping cost, amount of tamping operations and actual quality improvement would be
more visualized. This relation can in turn be a useful tool for planning new tamping
sections and identifying long-term tamping demand.

CHALMERS, Civil and Environmental Engineering, Master’s Thesis 2012:63 34
5.2 Evaluation of Optram’s present state
The description of current usability of Optram points out interesting comments, which
will be further discussed in this section.
5.2.1 Optram’s current usability
The result of this study has shown that few of the assumed Optram users actually use
Optram. Most of them prefer having measurement data presented in PDF-form. Even
though the interview group is a very small part of the whole potential Optram user
group, it is still notable that Optram is so sparsely used. Acceptance can be a problem
with introduction of new systems and tools. If the tool is not accepted by the intended
users, there is a risk that it will not be used as long as other more accepted tools are
available.
The comments regarding Optram presented in the result are describing the software as
complicated that requires several manual settings, which make it inefficient and pre-
senting a user interface which is not making the users confident. An often discussed
term regarding how well software is performing what it is intended to is user friendli-
ness, or usability as it is denoted in a broader research context.
When evaluating the comments in the context of usability, it cannot be excluded that
usability problems are contributing to the limited use of Optram. However, as few of
the interviewees actually use Optram at all, it is not certain that usability is the main
problem. Many of the remarks on Optram use have covered other shortcomings. It
could also be question of attitude problems, were the transition from analogue to digi-
tal systems requires changes in the daily routines.
Two general and reoccurring remarks are that Optram has a too complex level of de-
tail and that it requires previous experience of the user. Optram has been introduced as
an expert analysis tool, why high detail level is an important feature, but in the context
of budget planning and contract formulation there might be a need for a simpler tool,
easy to understand also for someone not being an expert on track geometry quality.
Some examples of how this usability could be improved are declared in Section 6.3.
5.2.2 Education possibilities
Among the reasons why the interviewees are not using Optram, a common explana-
tion is lack of education. According to the interviewees, they have been offered edu-
cation but not in a sufficient extent. The support given to contractors in the form of
education and error support is also stated as too limited. At the same time, some of the
interviewees have stated that education has been available but they have turned down
the given offers. It can be discussed who is to blame that insufficient education has
been given to many of the users, but the problem that the intended users lack the nec-
essary knowledge regarding Optram remains. When it comes to education, the amount
of education is not the only thing that matters but also the educational method.
5.3 Desired functions in Optram
The suggestions from the interviews have mainly concerned introducing an advising
tool in Optram, helping the tamping planners either to achieve a given Q-value with
minimum resources or achieving a maximum Q-value with given budget. It would be
possible to create a tool combining the two advising functions, see the example de-
scribed in Chapter 6. The analysis of where to perform tamping to achieve the best
CHALMERS, Civil and Environmental Engineering, Master’s Thesis 2012:63 35
result is time demanding and complex. An advising tool would simplify this analysis.
Ideally, there should be enough time available to enable this analysis, but obstacles
such as e.g. delayed delivery of measurement results or sudden changes in available
budget, possession time or machines can imply that a less thorough analysis has to be
made.
However, there is a risk with making these evaluations simpler and making them too
simple. Optram’s graphical view contains a large amount of data that can be over-
whelming, but this data is basically raw, which minimizes margins of error. Advanced
calculation programs that gives a specific output from a so called a “black box” with
hidden calculations, gives the less-experienced user no chance to understand what
happens with input data. Since the consequences from a bad track geometry quality
can be serious, it is important to analyse such system from a safety view and control it
with a parallel system in the beginning.
When looking at the composition of problems in the tamping maintenance process, as
described earlier in this section, many of the problems seem associated to lack of
long-term planning, directly or indirectly. Introducing a tool for prognostication of
changes in track geometry quality would help for development and evaluation of a
long-term plan. Positive effects of better long-term planning could also be improved
follow-up and acquisition of better possession times. It is nevertheless important to
point out that developing a tool for track geometry quality prognosis will not alone be
sufficient to improve long-term planning. The tool will only have the ability to esti-
mate whether a certain goal will be fulfilled or not, it is up to the organisation of the
Swedish Transport Administration to formulate the goals and enabling their fulfilment
by providing a realistic budget.
Several interview persons have described the obstacles with going from analogue sys-
tem to Optram as many small thresholds. The layout is different and several settings
have to be changed before it is ready to use. This might be an issue only for the be-
ginners how are not familiar with the program and lacks education. However, these
obstacles could be fixed with small measures, which can have a large effect on usabil-
ity, especially for the beginners. Many small obstacles can disturb the overall impres-
sion and be large together and the first sight of software’s layout is important in an
introduction phase to a new program.

CHALMERS, Civil and Environmental Engineering, Master’s Thesis 2012:63 36
6 Recommendation of new functions in Optram
This chapter will present how the identified potential areas for improvement could be
developed in Optram. The examples have been developed by the authors with the in-
tention that they should be possible to internalize in the Optram software. The statis-
tical data needed for the example functions is to a majority already available in Op-
tram, so the question is more about presentation. Common for all functions is that the
focus should be on usability and creating simple tools that can develop Optram as a
decision support.
6.1 Tamping Recommendation Model
There is a desire for a function that can give recommendations for sections where
tamping is needed. The input example data e.g. about cost estimations in this section
is based on estimations from an experienced Maintenance Manager7.
Recommended user group
The user group for this function depends on the function’s accuracy. For planning
certain tamping sections it is important to deliver high quality information about the
planned sections to the manager of the tamping machine. This requires control and
comparison of the function with current analysis methods to ensure that the quality is
enough for this purpose. However, even with less accuracy, this function can antici-
pate were it is most likely that tamping will be required and give a rough estimation
on what costs that can be expected. This can be a valuable tool for long-term planning
and as a decision support to budget managers. The economical input in the second
function can be used to estimate which sections that should be prioritized if an extra
amount of money is given to the budget.
This example function, Tamping Recommendation Model, could be managed with
two different alternatives that could be formulated as the following questions:
Alternative 1
Which sections for a certain position (input) is under a chosen Q-value (input) and
what will the cost be for tamping these sections?
- E.g. the total distance for the chosen link with 60<Q<80 is 6 000 m, which is
17% of the total length of the investigated line. The recommended tamping
positions are 432+400 to 435+000, etcetera and are prioritized after their mean
Q-value. The estimated costs for this is 290 000 SEK and the mean Q-value
for the whole link is estimated to increase from 75 to 85.
Alternative 2
Which sections for a certain position (input) should be prioritized to tamp for a certain
budget (input)?
- E.g. a budget of 100 000 SEK can be used to tamp 1 250 m, which is 4% of
the investigated link. The recommended sections that should be prioritized are
432+400-433+000, etcetera and the mean Q-value is estimated to increase
from 75 to 79 after measures.
7 Jack Hansen, Project leader, Swedish Transport Administration. Interview 2012-03-27

CHALMERS, Civil and Environmental Engineering, Master’s Thesis 2012:63 37
The output will show recommended tamping sections with length and an intern priori-
tizing list based on mean Q-value for the selected section. Moreover, the total length
is declared with a current mean Q-value and estimated change after conducting the
recommendations sections. Estimation of costs can be based on a default average
tamping price per meter that can be adjusted by the user. The default settings are that
tamping costs 40 SEK/m and that costs for establishment are 50 000 per link. The
increase in Q-value units after a conducted tamping operation can also be changed as
an option. The standard value is set to +10 units per taming. An illustration of the
functions is showed in Figure 6.1.
Figure 6.1 Illustration of how the Tamping Recommendation Model could be managed. There are two input alternatives. The orange boxes require an input of Q-value intervals that should be tamped and the blue box alternative requires an input of available budget. Recommended tamp-ing sections are prioritized and denoted before the position. As an option, it is possible to adjust unit price and establishment costs. Mean Q-value is denoted as Qm.
Limitations with the model
Conducting tamping on the recommended sections with e.g. Q<80 does not per auto-
matic mean that the quality will rise to Q>80. The assumption is that a tamping meas-
ure will increase the Q-value with 10 units but this value can vary in reality. It is diffi-
cult to estimate the effect of a tamping measure and a further analysis, based on statis-
tical data, is necessary to ensure a high accuracy.
Sections with a very low Q-value might require other type of maintenance measures.
That is why a lower limit for the Q-value is set as an option, to sort out these sections
e.g. sections with a Q-value below 60 should be noted with a warning sign. This mod-
el should be used for the line in a link i.e. no switches or crossings are considered due
to its complexity. However, recommended sections by the model could require other
types of measures than tamping e.g. if the track is worn or if an insulated bar should
be replaced.

CHALMERS, Civil and Environmental Engineering, Master’s Thesis 2012:63 38
Tamping costs will vary depending on how long the recommended sections are and
possession time on the link. It could be possible to set a limit for shortest recommend-
ed section that should be suggested and instead recommend another type of measure
e.g. with a tractor. The price could also be adjusted for different length intervals e.g.
the price for a section length larger than 2 000 m could be lower than for a lengths
between 500-1 000 m. This is however, not always regulated by the client in contracts
either.
6.2 TGQ Degradation Model
Long-term planning of larger tamping operations require that the track can be left
without tamping for a couple of years, so it is of great importance that the tamping
planners can be certain that the rail link will meet the target quality level for a couple
of years without performing further tamping operations in the meantime. This certain-
ty is difficult to establish with the tools presently available, which is the reason why a
Track Geometry Quality (TGQ) Degradation Model could improve the decision sup-
port for tamping.
Recommended user group
The TGQ Degradation Model is intended to help maintenance managers and contrac-
tors in their long-term planning of tamping, here the model will aid in optimizing the
available resources. By enabling improved long-term planning the acquisition of pos-
session time will also be simplified, possibly resulting in longer connective possession
time and reduced cost for maintenance.
Further, the TGQ Degradation Model can aid the client in the formulation of tradi-
tional contracts. By simulating the consequences of different amounts of tamping op-
eration resources, a suitable level of tamping operations can be set in the contract. The
TGQ Degradation Model can also improve performance based contracts, by giving
the contractor an improved possibility to analyze the future tamping demand and
thereby reducing the risk of the contractor.
The example below, along with Figure 6.2, shows how this model could work.
Step 1
What is the present state of the rail link (input) in terms of Q-value and Q-value de-
gradation rate?
- The investigated rail link has a total length of roughly 35 km and the present
mean Q-value (Qm) over each 100 m section is calculated and sorted into five
intervals, in this case below Q-value 60, 60-70, 70-80, 80-90 and above Q-
value 90. The intervals are plotted in a graph and the mean Q-value over the
whole rail link is also calculated.
- The Q-value degradation rate is calculated as a mean over the same 100 m sec-
tions, after which the sections are sorted into degradation rate intervals, in this
example is chosen 0-8 Q/year as normal value (See Table 3.2) and >8 Q/year
as increased degradation rate.
- By evaluation of the present Q-value and the corresponding Q-value degrada-
tion rate for each of the 100 m sections, a general scenario can be formulated
on how the total mean Q-value over the rail link will develop over the next
few years.

CHALMERS, Civil and Environmental Engineering, Master’s Thesis 2012:63 39
Step 2
Based on the general scenario of the rail link and given the target mean Q-value (in-
put), what consequences will the chosen amount of tamping for this year have for the
mean Q-value over the rail link during the next two years?
- If the worst 10% of the rail link is tamped this year, the mean Q-value will be
sufficient in the end of the year (81) but will require additional tamping opera-
tions next year.
- If the worst 20% of the rail link is tamped this year, the mean Q-value will be
sufficient in the end of the year (83) but the value of 2013 will still not be suf-
ficient with certainty (79), further tamping will be required the next year.
- If the worst 35% of the rail link is tamped this year, the mean Q-value will be
sufficient both this year (86) and during 2013 (82), allowing that no tamping
operations are conducted the following year and focus can instead be put on
planning a larger tamping operation in two years.
Figure 6.2 Illustration of how the TGQ Degradation Model could function. The model is used in two steps, first for analysis of Q-value distribution and Q-value degradation and secondly for estimation of consequences for tamping operations. The amount of tamping performed for the present year can be adjusted iteratively until the desired prognosis is achieved.
Step 1 of the TGQ degradation model can further be used to make a prognosis of the
Q-value development if no tamping is performed.
Limitations with the model
Creating an accurate model for track geometry quality degradation is very complex.
Factors such as geotechnics, facility age and track geometry will create a characteris-
tic for each rail link, so the statistical data used must originate from the rail link in
question. Moreover, the accumulated load can have an impact on the rate of degrada-
tion. Therefore it is important that the model is developed to also take traffic data and
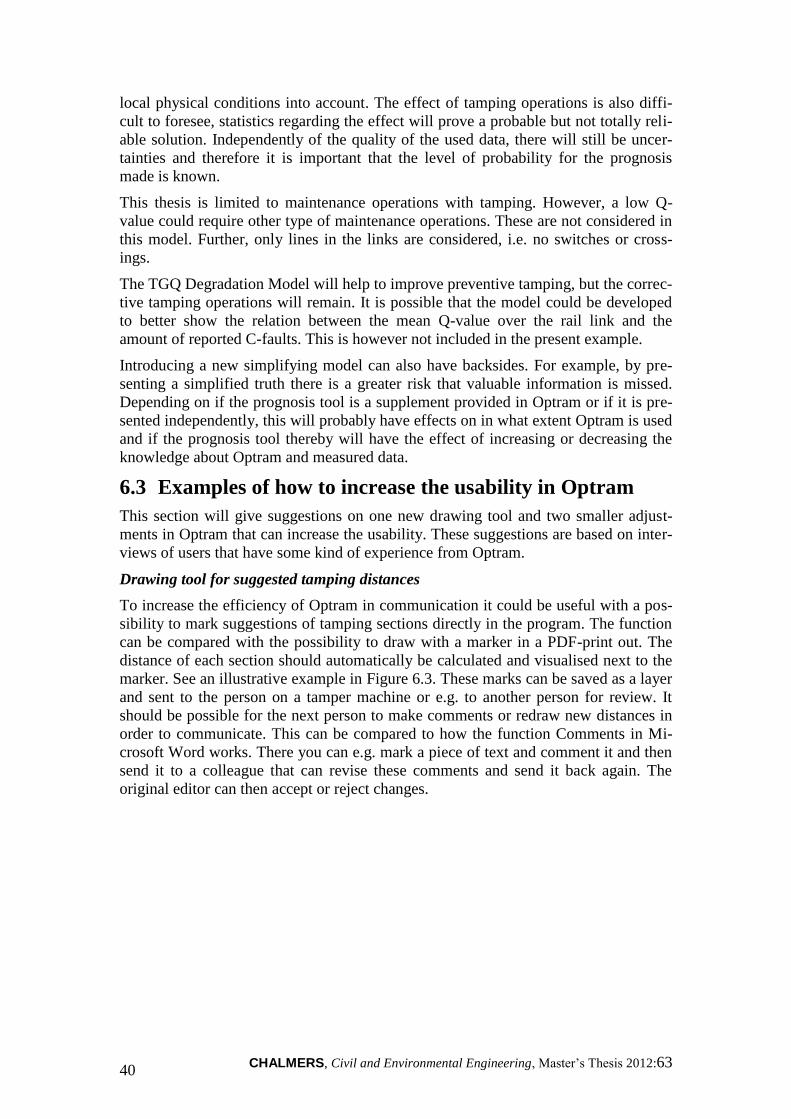
CHALMERS, Civil and Environmental Engineering, Master’s Thesis 2012:63 40
local physical conditions into account. The effect of tamping operations is also diffi-
cult to foresee, statistics regarding the effect will prove a probable but not totally reli-
able solution. Independently of the quality of the used data, there will still be uncer-
tainties and therefore it is important that the level of probability for the prognosis
made is known.
This thesis is limited to maintenance operations with tamping. However, a low Q-
value could require other type of maintenance operations. These are not considered in
this model. Further, only lines in the links are considered, i.e. no switches or cross-
ings.
The TGQ Degradation Model will help to improve preventive tamping, but the correc-
tive tamping operations will remain. It is possible that the model could be developed
to better show the relation between the mean Q-value over the rail link and the
amount of reported C-faults. This is however not included in the present example.
Introducing a new simplifying model can also have backsides. For example, by pre-
senting a simplified truth there is a greater risk that valuable information is missed.
Depending on if the prognosis tool is a supplement provided in Optram or if it is pre-
sented independently, this will probably have effects on in what extent Optram is used
and if the prognosis tool thereby will have the effect of increasing or decreasing the
knowledge about Optram and measured data.
6.3 Examples of how to increase the usability in Optram
This section will give suggestions on one new drawing tool and two smaller adjust-
ments in Optram that can increase the usability. These suggestions are based on inter-
views of users that have some kind of experience from Optram.
Drawing tool for suggested tamping distances
To increase the efficiency of Optram in communication it could be useful with a pos-
sibility to mark suggestions of tamping sections directly in the program. The function
can be compared with the possibility to draw with a marker in a PDF-print out. The
distance of each section should automatically be calculated and visualised next to the
marker. See an illustrative example in Figure 6.3. These marks can be saved as a layer
and sent to the person on a tamper machine or e.g. to another person for review. It
should be possible for the next person to make comments or redraw new distances in
order to communicate. This can be compared to how the function Comments in Mi-
crosoft Word works. There you can e.g. mark a piece of text and comment it and then
send it to a colleague that can revise these comments and send it back again. The
original editor can then accept or reject changes.

CHALMERS, Civil and Environmental Engineering, Master’s Thesis 2012:63 41
Figure 6.3 Illustration of how a drawing tool can be managed in Optram. Persons can communicate with comments and mark with a drawing tool, ther suggestion of tamping measures.
The input data from the drawing tool could be exported to Excel with information
about the link and the recommended tamping distances with their lengths. An addi-
tional “check-box” could be added in a column next to the tamping sections. When
tamping is performed, the box will be checked and these sections could be exported
directly to BIS.
This function could simplify communication with the project leader and the tamping
machine manager.
Change default scale to 1:5000
The default scale in Optram is 1:19500, which is smaller than in the analogue TGQ-
diagram that is 1:5000. It is difficult to distinguish specific data and make some kind
of evaluation with this setting. A typical user that evaluates the track geometry quality
and plan tamping will have to enlarge the scale to make it useful. It would therefore
be recommended to change the default scale in Optram to the same scale as in the
analogue diagrams, which is 1:5000.

CHALMERS, Civil and Environmental Engineering, Master’s Thesis 2012:63 42
Simplify print settings for additional functions
Default print settings for the scale in Optram are the same as the scale for the current
opened window. The tricky part is when additional functions are inserted into e.g. C-
faults, since they will appear alone on a separate page. This could be edited by the
user itself be replacing functions and adding a new position scale and rearrange all
functions in a desired way. However, this could be simplified by setting a few differ-
ent suggestions of functions that are arranged in a printer-friendly way that will fit on
one page or automatically add the positions to this separate page.

CHALMERS, Civil and Environmental Engineering, Master’s Thesis 2012:63 43
7 Reflection
The goal with this thesis has been analyse Optram’s improvement potential for the
tamping maintenance process and to suggest new improvements with purpose to im-
prove the decision support. This chapter will discuss whether this goal has been
reached and how methodology and delimitations have affected the outcomes of the
thesis.
The methodology has mainly consisted of a literature study and qualitative interviews,
which have been the basis to understand the tamping maintenance process. The Swed-
ish Transport Administration is a large organisation with a lot of experience and
knowledge within the personnel. Several steps within the tamping process are based
on this experience but have not been clearly documented in an accessible way. The
working process of this thesis has therefore put more effort and time than expected to
get the picture of how tamping is carried out today. Qualitative interviews have been a
good method for this purpose as they have given both the opportunity to collect a re-
sult and to improve the authors’ knowledge so that the interview manuscript could be
refined during the interview process. One limitation with the chosen interview meth-
odology is that few persons have been interviewed. This could be have been comple-
mented by more interviews or some type of questionnaire with a larger interview
group.
The uncertainty within the thesis could be discussed due to this limited numbers of
interviewed persons. By choosing interviewees with a geographical dispersion, ex-
perience from different contractors and coming from both traditional and perform-
ance-based contracts, it has been attempted to achieve a more broad perspective. The
regional differences were expected to be larger than they actually were. Six interviews
have been considered to be enough material for the results. However, five of these
persons were from the Swedish Transport Administration and one was a contractor. It
would have been interesting to perform one or two additional interviews with a con-
tractor. This could have influenced on the results but since performance-based con-
tracts have not been in use for so long time, there is limited experience of Optram
among the contractors.
In the presentation of the result and the discussion chapters, a number of issues have
been selected from the interview result for further study. This selection was based on
the occurrence of the issues in the interview result as well as a judgement by the au-
thors. It is possible that there are other issues equally important for the development
of Optram that has not been identified in the thesis work. A larger interview group or
better knowledge on beforehand from the authors might have reduced this risk. How-
ever, a great number of issues were sorted away to make the interview result manage-
able. Further important issues would have required an extended study and might not
have been practicable within this thesis.
The exemplifying suggestions for new functions in Optram are based on inputs from
the interviews, supported with the writer’s creativity. These are realistic suggestions
that could be used as a draft for further development. However, it is important to keep
in mind that this type of examples are simplified and that there are many other influ-
encing factors in reality, which should be taken into account while working with these
tools. New functions should be analysed in a usability perspective in order to create a
function for both client and contractor. It is a challenge to make these mathematical
functions in Optram usable for persons without expertise knowledge.
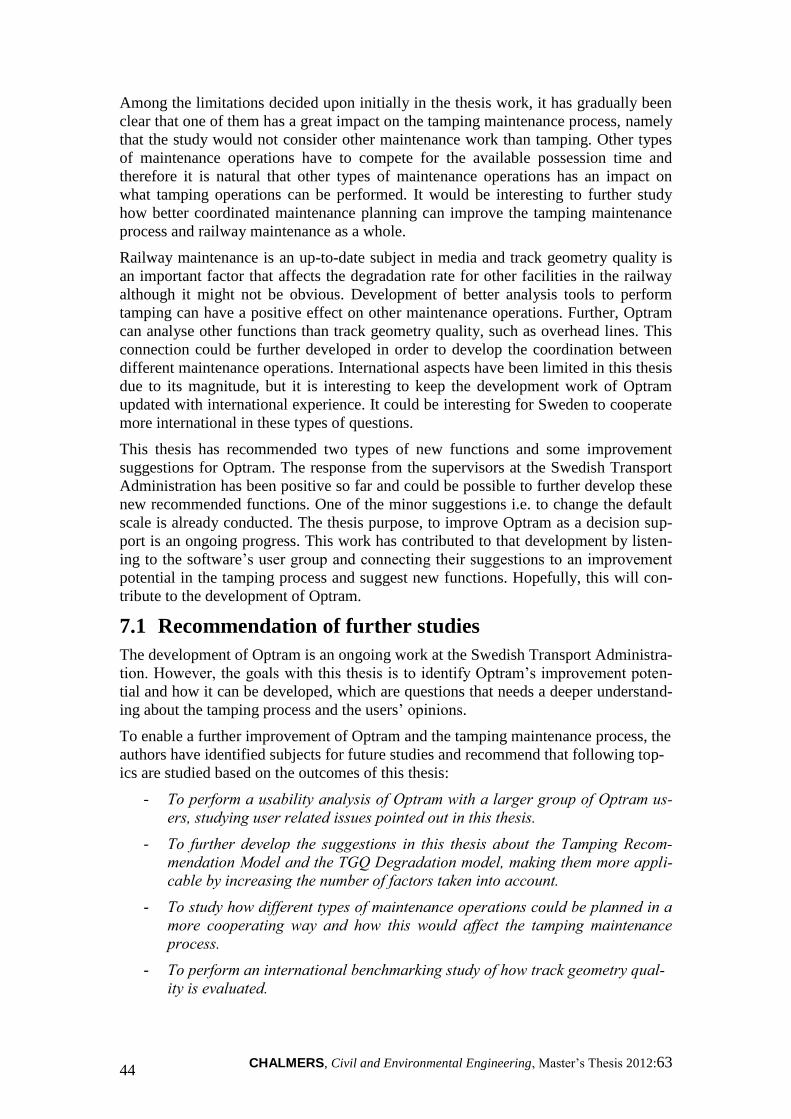
CHALMERS, Civil and Environmental Engineering, Master’s Thesis 2012:63 44
Among the limitations decided upon initially in the thesis work, it has gradually been
clear that one of them has a great impact on the tamping maintenance process, namely
that the study would not consider other maintenance work than tamping. Other types
of maintenance operations have to compete for the available possession time and
therefore it is natural that other types of maintenance operations has an impact on
what tamping operations can be performed. It would be interesting to further study
how better coordinated maintenance planning can improve the tamping maintenance
process and railway maintenance as a whole.
Railway maintenance is an up-to-date subject in media and track geometry quality is
an important factor that affects the degradation rate for other facilities in the railway
although it might not be obvious. Development of better analysis tools to perform
tamping can have a positive effect on other maintenance operations. Further, Optram
can analyse other functions than track geometry quality, such as overhead lines. This
connection could be further developed in order to develop the coordination between
different maintenance operations. International aspects have been limited in this thesis
due to its magnitude, but it is interesting to keep the development work of Optram
updated with international experience. It could be interesting for Sweden to cooperate
more international in these types of questions.
This thesis has recommended two types of new functions and some improvement
suggestions for Optram. The response from the supervisors at the Swedish Transport
Administration has been positive so far and could be possible to further develop these
new recommended functions. One of the minor suggestions i.e. to change the default
scale is already conducted. The thesis purpose, to improve Optram as a decision sup-
port is an ongoing progress. This work has contributed to that development by listen-
ing to the software’s user group and connecting their suggestions to an improvement
potential in the tamping process and suggest new functions. Hopefully, this will con-
tribute to the development of Optram.
7.1 Recommendation of further studies
The development of Optram is an ongoing work at the Swedish Transport Administra-
tion. However, the goals with this thesis is to identify Optram’s improvement poten-
tial and how it can be developed, which are questions that needs a deeper understand-
ing about the tamping process and the users’ opinions.
To enable a further improvement of Optram and the tamping maintenance process, the
authors have identified subjects for future studies and recommend that following top-
ics are studied based on the outcomes of this thesis:
- To perform a usability analysis of Optram with a larger group of Optram us-
ers, studying user related issues pointed out in this thesis.
- To further develop the suggestions in this thesis about the Tamping Recom-
mendation Model and the TGQ Degradation model, making them more appli-
cable by increasing the number of factors taken into account.
- To study how different types of maintenance operations could be planned in a
more cooperating way and how this would affect the tamping maintenance
process.
- To perform an international benchmarking study of how track geometry qual-
ity is evaluated.
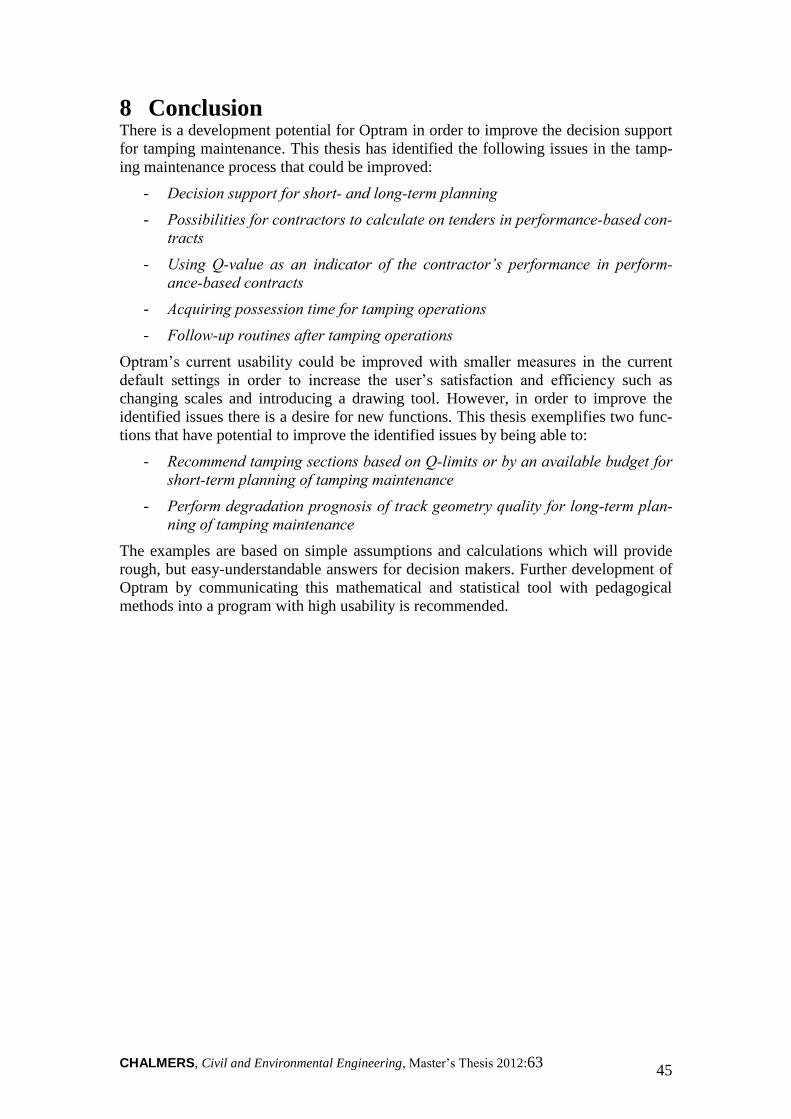
CHALMERS, Civil and Environmental Engineering, Master’s Thesis 2012:63 45
8 Conclusion There is a development potential for Optram in order to improve the decision support
for tamping maintenance. This thesis has identified the following issues in the tamp-
ing maintenance process that could be improved:
- Decision support for short- and long-term planning
- Possibilities for contractors to calculate on tenders in performance-based con-
tracts
- Using Q-value as an indicator of the contractor’s performance in perform-
ance-based contracts
- Acquiring possession time for tamping operations
- Follow-up routines after tamping operations
Optram’s current usability could be improved with smaller measures in the current
default settings in order to increase the user’s satisfaction and efficiency such as
changing scales and introducing a drawing tool. However, in order to improve the
identified issues there is a desire for new functions. This thesis exemplifies two func-
tions that have potential to improve the identified issues by being able to:
- Recommend tamping sections based on Q-limits or by an available budget for
short-term planning of tamping maintenance
- Perform degradation prognosis of track geometry quality for long-term plan-
ning of tamping maintenance
The examples are based on simple assumptions and calculations which will provide
rough, but easy-understandable answers for decision makers. Further development of
Optram by communicating this mathematical and statistical tool with pedagogical
methods into a program with high usability is recommended.

CHALMERS, Civil and Environmental Engineering, Master’s Thesis 2012:63 46
9 References
Andersson, Evert and Berg, Mats. 2001. Järnvägssystem och spårfordon. Del 1:
Järnvägssystem. Stockholm : Järnvägsgruppen KTH, 2001.
Banverket. 1997. BVF 587.02 Spårlägeskontroll och kvalitetsnormer. : Banverket,
1997.
—. 1995. BVF586.10 Skarvfritt spår. s.l. : Banverket, 1995.
—. 2004. BVH 825.20 Riktning av spår och spårväxlar. : Banverket, 2004.
—. 2009. EB Botniabanan. EB Drift och underhåll av järnvägsanläggning
Botniabanan. : Banverket.
—. 2009. Entreprenadbeskrivning - Avseende drift och underhåll av
järnvägsanläggning: Botniabanan.. : Banverket, 2009.
Corshammar, Pelle. 2006. Perfect Track. Lund : 2006.
—. 2008. Perfekt Spårgeometri: Framtidens spår. Lund : 2008.
Esveld, Coenraad. 2001. Modern Railway Track. Zaltbommel : MRT-Productions,
2001.
International standard. 1998. Ergonomic requirements for office work with visual
display terminals - Part 11 Guidance on usability.: International standard, 1998. ISO
9241-11.
Matisa. 2012. MATISA Matériel Industriel S.A. MATISA Matériel Industriel S.A. -
Tampers. [Online] 2012. [Cited: 24 April 2012.]
http://matisa.com/matisa_ang/matisa_b45.html.
Näringsdepartementet. 2011. Järnväg. Regeringskansliet . [Online] Oktober 2011.
[Cited: 02 05 2012.] http://www.regeringen.se.
Ryen, Anne and Torhell, Sven-Erik. 2004. Kvalitativ intervju: från vetenskapsteori
till fältstudier. Malmö : Liber Ekonomi, 2004. ISBN 9147072784.
Trafikverket. 2011. Intranät. Trafikverket. [Online] 11 28, 2011. [Cited: 03 20,
2012.] intranat.trafikverket.local.
—. 2010. Solkurvor - en allvarlig störning.: Trafikverket, 2010.
UIC. 2010. Monitoring Track Condition.: International Union of Railways, 2010.
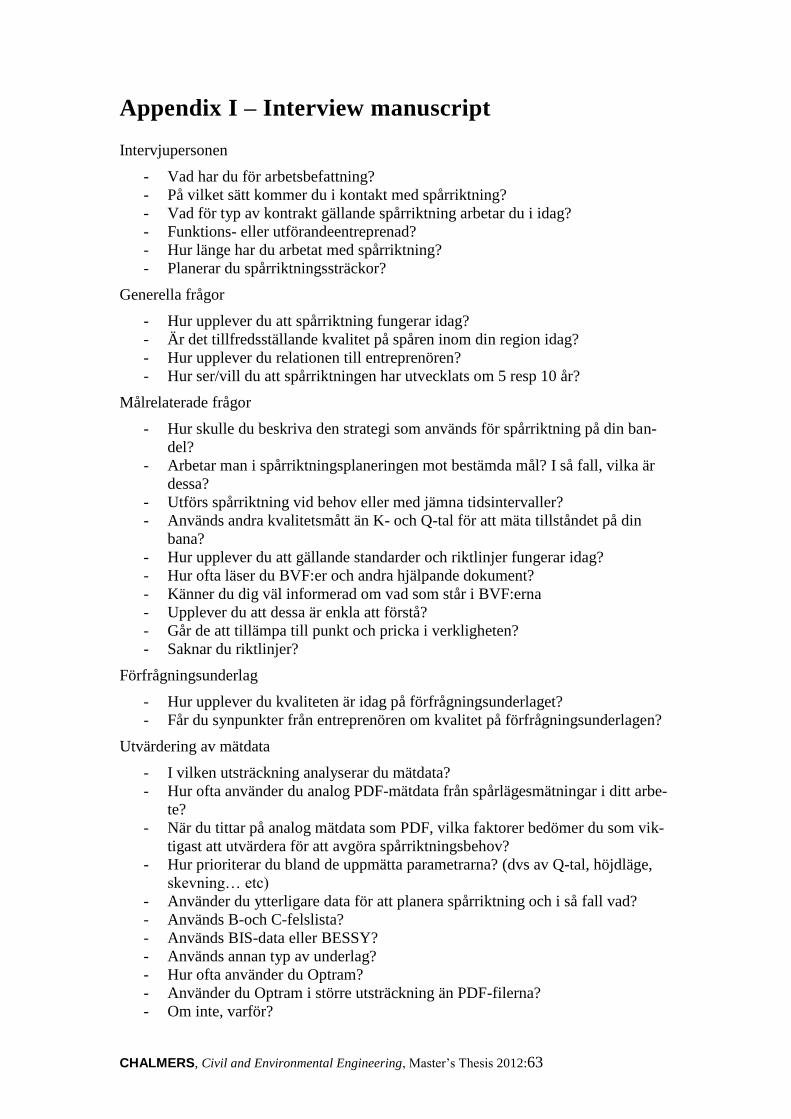
CHALMERS, Civil and Environmental Engineering, Master’s Thesis 2012:63
Appendix I – Interview manuscript
Intervjupersonen
- Vad har du för arbetsbefattning?
- På vilket sätt kommer du i kontakt med spårriktning?
- Vad för typ av kontrakt gällande spårriktning arbetar du i idag?
- Funktions- eller utförandeentreprenad?
- Hur länge har du arbetat med spårriktning?
- Planerar du spårriktningssträckor?
Generella frågor
- Hur upplever du att spårriktning fungerar idag?
- Är det tillfredsställande kvalitet på spåren inom din region idag?
- Hur upplever du relationen till entreprenören?
- Hur ser/vill du att spårriktningen har utvecklats om 5 resp 10 år?
Målrelaterade frågor
- Hur skulle du beskriva den strategi som används för spårriktning på din ban-
del?
- Arbetar man i spårriktningsplaneringen mot bestämda mål? I så fall, vilka är
dessa?
- Utförs spårriktning vid behov eller med jämna tidsintervaller?
- Används andra kvalitetsmått än K- och Q-tal för att mäta tillståndet på din
bana?
- Hur upplever du att gällande standarder och riktlinjer fungerar idag?
- Hur ofta läser du BVF:er och andra hjälpande dokument?
- Känner du dig väl informerad om vad som står i BVF:erna
- Upplever du att dessa är enkla att förstå?
- Går de att tillämpa till punkt och pricka i verkligheten?
- Saknar du riktlinjer?
Förfrågningsunderlag
- Hur upplever du kvaliteten är idag på förfrågningsunderlaget?
- Får du synpunkter från entreprenören om kvalitet på förfrågningsunderlagen?
Utvärdering av mätdata
- I vilken utsträckning analyserar du mätdata?
- Hur ofta använder du analog PDF-mätdata från spårlägesmätningar i ditt arbe-
te?
- När du tittar på analog mätdata som PDF, vilka faktorer bedömer du som vik-
tigast att utvärdera för att avgöra spårriktningsbehov?
- Hur prioriterar du bland de uppmätta parametrarna? (dvs av Q-tal, höjdläge,
skevning… etc)
- Använder du ytterligare data för att planera spårriktning och i så fall vad?
- Används B-och C-felslista?
- Används BIS-data eller BESSY?
- Används annan typ av underlag?
- Hur ofta använder du Optram?
- Använder du Optram i större utsträckning än PDF-filerna?
- Om inte, varför?

CHALMERS, Civil and Environmental Engineering, Master’s Thesis 2012:63
- När du tittar på mätdata i Optram, vilka faktorer bedömer du som viktigast att
utvärdera för att avgöra spårriktningsbehov?
- Vilka funktioner använder du i Optram?
- Använder du inställningsfiler?
- Sparar du egna inställningsfiler?
- Vilka ytterligare funktioner önskar du i Optram?
- Vart vänder du dig om du behöver hjälp med Optram?
Planering av åtgärder
- I vilken utsträckning är du med och tar beslut om vilka sträckor som ska spår-
riktas?
- Är det så det är tänkt att fungera enligt kontrakt?
- Om inte, görs någon form av ekonomisk kompensation för förändringen?
- Upplever du att det finns begränsningar, tidsmässiga eller ekonomiska, som
avgör hur stor del av spårlägesfelen som kan åtgärdas?
- Skulle ni spårrikta längre sammanhängande sträckor om det fanns utrymme
för det?
- Använder du någon värderingsmetod för att avgöra om en punktfel ligger
inom tillräcklig närhet till en planerad åtgärd för att inkludera den?
- Upplever du denna avvägning som vanligt förekommande?
- Upplever du att det finns riktlinjer att följa?
Utförande
- I vilken utsträckning upplever du att alternativa åtgärder används för att av-
hjälpa återkommande fel? Exempelvis slipersbyte, rälbyte, byte av växlar och
plankorsningar, byte av trummor eller ballastrening?
- Finns det ett behov av att utveckla denna arbetsmetodik?
- Om det inte utförs, beror det på ekonomiska faktorer eller beror det på till-
gängliga tider?
- Vilken kapacitet har de spårriktningsmaskiner som används på din bandel?
- Är det önskvärt att använda maskiner med högre kapacitet?
- Varför/Varför inte?
- Hur upplever du att effektiviteten spårmeter per timme respektive effektiva
timmar per skift är vid spårriktning?
- Hur tror du att denna effektivitet kan förbättras?
Banarbetstid i spår
- Hur fungerar det att få tider för spårriktning?
- Planeras banarbetstider i BAP eller BUP?
Uppföljning
- Hur besiktigas spårriktning/spårlägesstatus på banan?
- Hur upplever du att kvaliteten är på besiktningen?
- Händer det att spårriktningsåtgärder inte ger något resultat? Vad beror detta
på?
- Kontrollmäts era sträckor med mätvagn efter utför spårriktning?
- Finns det någon rekommendation att detta/när detta ska utföras?
- Utförs någon analys/uppföljning av resultatet av planering av spårriktning (ut-
över besiktningen)?
- … av resultatet efter spårriktning?
- Vilka verktyg skulle du önska för att göra utföra en sådan uppföljning?

CHALMERS, Civil and Environmental Engineering, Master’s Thesis 2012:63
Appendix II –Example of TGQ diagram as PDF

CHALMERS, Civil and Environmental Engineering, Master’s Thesis 2012:63
Appendix III – Example of Valuation diagram

CHALMERS, Civil and Environmental Engineering, Master’s Thesis 2012:63
Appendix IV – Example of Quality list