Embed Size (px)
Citation preview

Cold Load Pick-up
EVERT AGNEHOLM
Department of Electric Power Engineering
CHALMERS UNIVERSITY OF TECHNOLOGY
G�teborg Sweden 1999
Cold Load Pick-up
by
EVERT AGNEHOLM
Technical Report No. 354
Submitted to the School of Electrical and Computer Engineering,Chalmers University of Technology,
in partial fulfilment of the requirements
for the degree of
Doctor of Philosophy
Department of Electric Power Engineering
Chalmers University of Technology
G�teborg, Sweden
February 1999

Cold Load Pick-up
Evert Agneholm
G�teborg 1999
ISBN 91-7197-756-2
ISSN 0346-718X
Doktorsavhandlingar vid
Chalmers tekniska h�gskola
Ny serie Nr. 1466
Abstract
The load behaviour of the industrial and residential sector followingdifferent types of outages is dealt with in this dissertation. Data on thepower consumption after these outages have been used for derivingmodels of the cold load pick-up.
In the industrial sector the investigation covers a variety of branchesand special attention has been given to plants having a high degree ofelectric energy consumption. Data of the power consumption afterplanned and forced outages have been collected and descriptions overtypical restarting procedures and common restoration problems havebeen summarized. Due to the fact that the production can not startimmediately after voltage is restored, the power consumption from theindustrial sector will be lower after an outage as compared with the predisturbance condition. The time it takes to enter a normal productionagain varies considerably and may take minutes or up to days forsensitive processing industries.
When studying the residential sector, individual load objects,individual houses and residential areas have been investigated bylaboratory and Þeld measurements. The reason for this is to get a betterunderstanding of how different load objects and electric heating behaveafter an outage. This knowledge is then used when analysingmeasurements of the cold load pick-up in residential areas. Themeasurements clearly indicate that the cold load pick-up for residentialload has the opposite behaviour as compared with industrial loadwhich means that it is (much) higher after an outage and then decreasesto its normal level after a time.
As residential load often is used in schemes of rotating loadcurtailment, simulations of such a scheme have been performed. Theresults show that it is important to tune this scheme properly in order toachieve the desired operation.
Keywords:
Blackout, cold load pick-up, Þeld measurements, loadmodelling, power system restoration.
List of Publications
A Agneholm E., Daalder J.,
Cold Load Pick-up for IndividualLoad Objects
, 33
rd
Universities Power Engineering Conference,September 8-10, 1998, Edinburgh, United Kingdom. Proceed-ings Vol. 1, pp. 53-56.
B Agneholm E., Daalder J.,
The Load Behaviour of ElectricHeating following a Disturbance
, submitted to IEE Proceed-ings-Generation, Transmission and Distribution.
C Agneholm E., Daalder J.
Cold Load Pick-up of ResidentialLoad
, submitted to IEE Proceedings-Generation, Transmissionand Distribution.
D Agneholm E., Daalder J.,
Load Recovery in the Pulp andPaper Industry following a Disturbance
, submitted to IEEETransactions on Power Delivery.
E Agneholm E., Daalder J.,
Load Recovery in Different Indus-tries following an Outage
, submitted to IEEE Transactions onPower Delivery.
Preface
The work presented in this thesis has been carried out at theDepartment of Electric Power Engineering at Chalmers University ofTechnology. The research has been funded through the Elforsk Elektraprogram which is jointly Þnanced by the Swedish National Board forIndustrial and Technical Development (NUTEK) and the powercompanies in Sweden. The Þnancial support is gratefullyacknowledged. Travelling money for joining conferences and courseshave been supported by Chalmers anslag f�r forskarstuderandes resor,Letterstedska resestipendiefonden, Adlerbertska forskningsfonden andClas Adelsk�lds minnesfond.
I would like to thank Professor Bertil Stenborg, Dag Holmberg andKenneth Walve who initiated the licentiate project which was the startof my Ph. D studies a couple of years ago. When Bertil retiredProfessor Jaap Daalder succeeded as my supervisor. I wish to expressmy deepest gratitude to you Jaap for supervising this work, forvaluable comments, fruitful discussions and for persistently revisingthe manuscript.
Members of the reference group have been Tesfai Embaie, HansFendin, Hans Elmvik and Jan Djurstr�m. Thank you all for fruitfuldiscussions and valuable comments.
The work presented is highly related to Þeld measurements. I wouldlike to thank all the industries and power companies which havesupplied me with data; the families which have given me theopportunity to perform measurements in their houses; and VattenfallRegionn�t AB, G�teborg Energi N�t AB, Lerum Energi AB andGullsp�ng N�t AB for the cooperation received in performing Þeldmeasurements in residential areas.
Finally I would like to thank all the colleagues at the department ofElectric Power Engineering. It has been a privilege to work with youall.

-10
Contents
Contents
Chapter 1 Introduction
A.1 Background 1
A.2 Motivation 2
A.3 Outline of the thesis 3
Chapter 2 Power System Restoration
B.1 Restoration strategies 5
B.2 Restoration problems 6
B.3 Social and economical consequences 10
B.4 Cold load pick-up 12
Chapter 3 Summary of Publications
C.1 Paper A, Cold Load Pick-up for Individual Load Objects 19
C.2 Paper B, The Load Behaviour of Electric Heating following a Disturbance 20
C.3 Paper C, Cold Load Pick-up of Residential Load 22
C.4 Paper D, Load Recovery in the Pulp and Paper Industry following a Disturbance 23
C.5 Paper E, Load Recovery in Different Industries following an Outage 24
Chapter 4 Conclusions
Chapter 5 Future Work
References
Paper A Cold Load Pick-up for Individual Load Objects
Abstract 37
A.1 Introduction 37
A.2 Refrigerators and Freezers 38
A.3 Air Conditioners 43
A.4 Lighting 44
A.4.1 Mercury Lamps 44A.4.2 High Pressure Sodium Lamps 45A.4.3 Low Pressure Sodium Lamps 46A.4.4 Fluorescent Lamps 46
A.5 Other Household Equipment 47
A.6 Field Test 48
A.7 Conclusions 49
A.8 Acknowledgements 49
A.9 References 50
Paper B The Load Behaviour of Electric Heating following a Disturbance
Abstract 51
Keywords 51
B.1 Introduction 51
B.2 Electric Heating 52
B.2.1 Electric Boilers 54B.2.2 Electric Radiators 59B.2.3 Heat Pumps 62B.2.4 Aggregation 65
B.3 Residential Areas 68
B.4 Modelling 70
B.5 Conclusions 73
B.6 Acknowledgements 74
B.7 References 74
B.8 Biographies 76
Paper C Cold Load Pick-up of Residential Load
Abstract 77
Keywords 77
C.1 Introduction 77
C.2 Field Measurements 79
C.3 Modelling 85
C.4 Rotating Load Curtailment 87
C.5 Conclusions 89
C.6 Acknowledgement 90
C.7 References 90
Paper D Load Recovery in the Pulp and Paper Industry following a Disturbance
Abstract 93
Keywords 93
D.1 Introduction 93
D.2 Description of a Pulp and Paper Industry 94
D.3 Outages 97
D.3.1 Planned Outage 97D.3.2 Forced outage 101D.3.3 Modelling 104D.3.4 Problems Related to Disturbances 105
D.4 Economical Consequences 105
D.5 Disconnection of Load as an Alternative to Gas Turbines 108
D.6 Conclusions 109
D.7 Acknowledgements 109
D.8 References 109
D.9 Biographies 110
Paper E Load Recovery in Different Industries following an Outage
Abstract 111
Keywords 111
E.1 Introduction 111
E.2 Cold load pick-up 113
E.2.1 Food industry 113E.2.2 Timber and wood industry 115E.2.3 Mining industry 116E.2.4 Iron and steel industry 118E.2.5 Chemical industry 120E.2.6 Engineering industry 123E.2.7 Other industries 124
E.3 Modelling 125
E.4 Conclusions 127
E.5 Acknowledgements 128
E.6 References 128
E.7 Biographies 129
1
Chapter 1 Introduction
1.1 Background
The work reported here is a continuation of a licentiate thesis whichwas presented in 1996 [1]. The project started in 1993 and deals withthe restoration of a power system after a partial or a total blackout. Thethesis gives an overview of the Swedish electric power systemincluding frequency control, available reactive resources and automaticequipment installed in the system and used for saving the system insevere situations. Alternatives of restoring a power system after ablackout are treated and a description of the last two Swedish blackoutsexperienced is included.
After a major breakdown it is possible to start the restoration process ifassistance from neighbouring areas by tie lines is available, part(s) ofthe system have succeeded in establishing island operation or if thereare stations with blackstart capability. The licentiate thesis gives adescription of different island operation tests and a blackstart testperformed in Sweden some years ago.
Two main problems associated with the restoration of a power systemare the voltage and frequency control. The voltage control includes theenergizing of long transmission lines and the reactive capabilityavailable as generators, reactive resources in reactors, capacitors,SVC:s etc. The frequency control is associated with the system inertia,turbine governors and their control systems and the frequencydependency of loads [1, 2]. The power consumption of a load that hasbeen disconnected for a time is not the same when it is reconnected.For industrial load it was demonstrated that the power consumption islower after a disturbance as compared to the pre contingency situation.It then increases to a stationary level after some minutes or even days.Residential load, however, seemed to have a power consumption thatwas higher after an outage.
By using a power system simulator [1, 3] simulations were performedin order to study the frequency response and voltage behaviour in theSwedish power system. As can be expected when a large load isconnected the frequency declines slower when there is a large systeminertia. The simulations also demonstrate that the frequency in the
2
system was substantially affected by the chosen operating mode of thehydro turbine governors (different settings for proportional regulation,permanent droop and time constants).
For shunt reactors a hunting phenomenon was sometimes observedafter energizing long unloaded transmission lines [1, 4], see 2.2. Asalmost all shunt reactors in the Swedish system had the same settingsof time delays and voltage levels for automatic connection anddisconnection the hunting phenomenon may diffuse into the systemand incorporate several reactors. By altering the settings it was shownthat the hunting phenomenon could be eliminated or reduced.
An important conclusion of the Þrst part of the study was the obviouslack of data/analysis on the load recovery after a disturbance. It wastherefore decided to make a further study of cold load pick-up.
1.2 Motivation
A major breakdown of a power system is a contingency that is rare butnevertheless occurs. In order to reduce the economical and socialconsequences for the population and the power suppliers it is importantto restore power as fast and as secure as possible. One of the factorswhich then must be taken into account is the cold load pick-up.Connection of a load that is several times the rated power gives a largerfrequency drop, may give an overloading of lines and transformers andin some cases a situation where the system load demand is higher thanthe system production capacity. Overloading of lines and transformersmay also appear after forced and planned outages which almost dailyare performed at various places in the power system.
Cold load pick-up is also of interest in power systems which use ascheme of rotating load curtailment in case of lack of power or in caseof limited transmission capacity in the system. If such a scheme is usedit is a prerequisite to understand load behaviour in order to be able totune the scheme properly. A bad tuning or no tuning at all may give anovershoot in the power consumption which can result in a breakdownor severe consequences for the power system.
Some industries, especially processing industries, consume muchelectricity and therefore it is interesting to study their behaviour afteroutages. The interest in industrial load behaviour has increased during
3
the last years due to the deregulation of the electricity market whichhas taken place in several countries.
1.3 Outline of the thesis
This thesis consists of a summarizing part followed by a number ofpapers either published or submitted for publication. The summarizingpart describes the background and motivation of the project in chapter1. Chapter 2 gives a short introduction to the area of power systemrestoration, analyses the phenomenon of cold load pick-up andsummarizes the literature in this area. Chapter 3 presents an overviewof the papers presented in chapter A-E, including results andcomments. In chapter 4 general conclusions are given and in chapter 5suggestions for future work are proposed. At the end of thesummarizing part the references of the Þrst Þve chapter are listed.

4
5
Chapter 2 Power System Restoration
A major breakdown of a power system is a contingency which seldomoccurs. Following such an outage it is important to restore the powersystem as fast, smooth and secure as it is possible in order to limit theeconomical and social consequences. To be able to do this it isnecessary to have a good knowledge of how a power system operatesduring a restoration phase, i.e. a good understanding of the restorationplan, of the active and reactive power resources and of the loadbehaviour in order to be able to keep the voltage and frequency withinacceptable limits.
The literature covers a variety of aspects in the area of power systemrestoration and especially the IEEE power system restoration group hasproduced a number of interesting papers [5-16]. Topics are therestoration process [6, 10, 17-19], restoration strategies [6, 17-23],voltage and frequency control [6, 8, 15, 21, 24], blackstarting ofstations [5, 18, 20], restart of cold and hot units [6, 7, 9, 10, 14], islandoperation [1, 6, 22, 23], planning and training for power systemrestoration [10, 12, 13, 16-18, 20, 23], load behaviour [15, 20, 22, 25-37], expert systems [10, 13, 38] and a variety of problems associatedwith the restoration [7, 10, 11, 14, 18, 23, 39].
2.1 Restoration strategies
The literature deals with two major strategies for power systemrestoration following a blackout: the build-up strategy and the build-down strategy [6, 17-20, 22]. These different approaches are useddepending on factors as the size of the interrupted area, the possibilityto receive assistance from interconnecting systems, the amount ofblackstart capability in the system and the type of production in thesystem.
The build-up strategy is most commonly used. It is usually selected forpredominantly thermal systems and often applied when a system hasexperienced a total blackout and when it is not possible to receiveassistance through tie lines from neighbouring systems. After anassessment of the system status has been made the restoration processstarts simultaneously in several different subsystems. At least one unitwith blackstart capability must be available in each subsystem and
6
units equipped with frequency and voltage regulation must be present.It is also beneÞcial if there is a balance between the productioncapacity and the consumption in the area. After blackstarting a unitemergency power is supplied to the stations without blackstartcapability in order to make it possible for these units to start up and beconnected to the system. Loads are then connected and new units arestarted. As a next step the subsystems are synchronized. When most ofthe subsystems are synchronized and there is enough absorbingreactive capacity in the system the breakers of the tie lines to theneighbouring systems can be closed.
The build-down strategy is mostly used in small systems without longhigh voltage lines, in hydro based systems with good reactiveabsorbing capacity and for systems which have a concentration of theload in one area. The strategy may also be used when there is a partialblackout or when power can be supplied through tie lines fromneighbouring areas. After that an assessment of the status of circuitbreakers and the power plant conditions has been made, plants withblackstart capability are started. Lines to other stations are thenconnected and more units are started. The Þrst priority in the build-down strategy is to reenergize the bulk power network. In contrast tothe build-up strategy most of the load is reconnected after a large partof the transmission system is restored. In Sweden the build-downstrategy is used in case of a blackout.
2.2 Restoration problems
As the power systems of today are extremely seldom exposed to adisturbance this is a problem in itself since the personnel in controlcentres and production units have little or no experience at all inhandling a system blackout [12]. During the restoration there are manyabnormal situations that must be dealt with and equipment may operatein an unexpected way and cause problems [11, 17]. In those Swedishstations equipped with blackstart capability there is often a dieselgenerator which initially starts and supplies emergency power to therest of the station [1]. If there is something wrong with this dieselgenerator such as no diesel, badly adjusted relays etc. the entirerestoration may be delayed substantially.
When the main unit is started, lines to other stations are to be energizedand new units are started up. When energizing lines it is important to
7
make sure that there is enough reactive resources in the system in orderto be able to consume the reactive production from the lightly loadedtransmission lines. For that purpose (capacity in) generators, Static VarCompensators or shunt reactors are necessary. The risk for over-voltage can also be reduced by disconnecting shunt capacitors,connecting loads with a lagging power factor, by increasing thecirculating currents and reactive losses in parallel transformers,avoiding the energizing of parallel lines and by having a low voltage ontransmission lines [7, 8, 15, 17, 23].
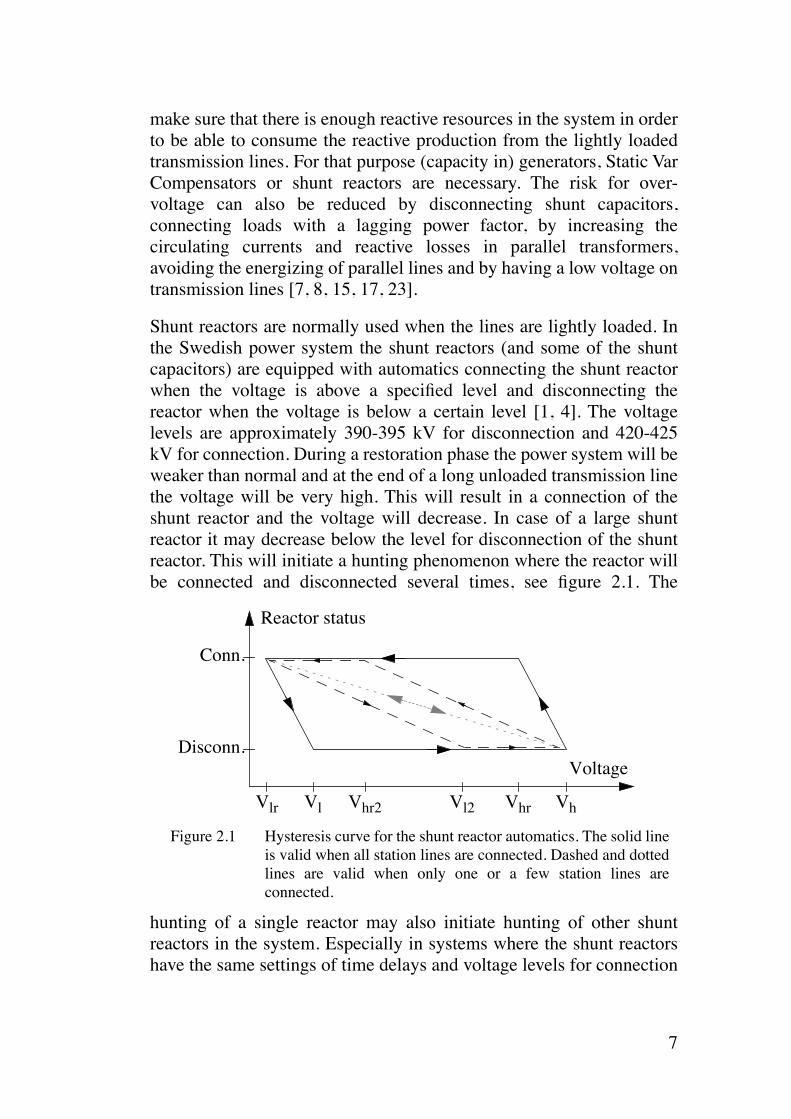
Shunt reactors are normally used when the lines are lightly loaded. Inthe Swedish power system the shunt reactors (and some of the shuntcapacitors) are equipped with automatics connecting the shunt reactorwhen the voltage is above a speciÞed level and disconnecting thereactor when the voltage is below a certain level [1, 4]. The voltagelevels are approximately 390-395 kV for disconnection and 420-425kV for connection. During a restoration phase the power system will beweaker than normal and at the end of a long unloaded transmission linethe voltage will be very high. This will result in a connection of theshunt reactor and the voltage will decrease. In case of a large shuntreactor it may decrease below the level for disconnection of the shuntreactor. This will initiate a hunting phenomenon where the reactor willbe connected and disconnected several times, see Þgure 2.1. The
hunting of a single reactor may also initiate hunting of other shuntreactors in the system. Especially in systems where the shunt reactorshave the same settings of time delays and voltage levels for connection
VhVhrVhr2Vlr Vl Vl2
Reactor status
Voltage
Conn.
Disconn.
Figure 2.1 Hysteresis curve for the shunt reactor automatics. The solid lineis valid when all station lines are connected. Dashed and dottedlines are valid when only one or a few station lines areconnected.
8
and disconnection this may cause severe problems. In the USA theserelays are therefore deactivated until the system is restored.
During restoration a sustained over-voltage will increase the problemsof switching transients and harmonic resonance [8, 16, 17, 21, 23].Harmonics are caused by transformer saturation and for some networkconÞgurations resonance will occur (unloaded transformers and lowsystem short-circuit level) leading to damaging over voltages. Therecould be substantial phase angle differences across line circuit-breakersand closing of such circuit-breakers may damage equipment and mayinitiate an instability in the system [11, 16, 17].
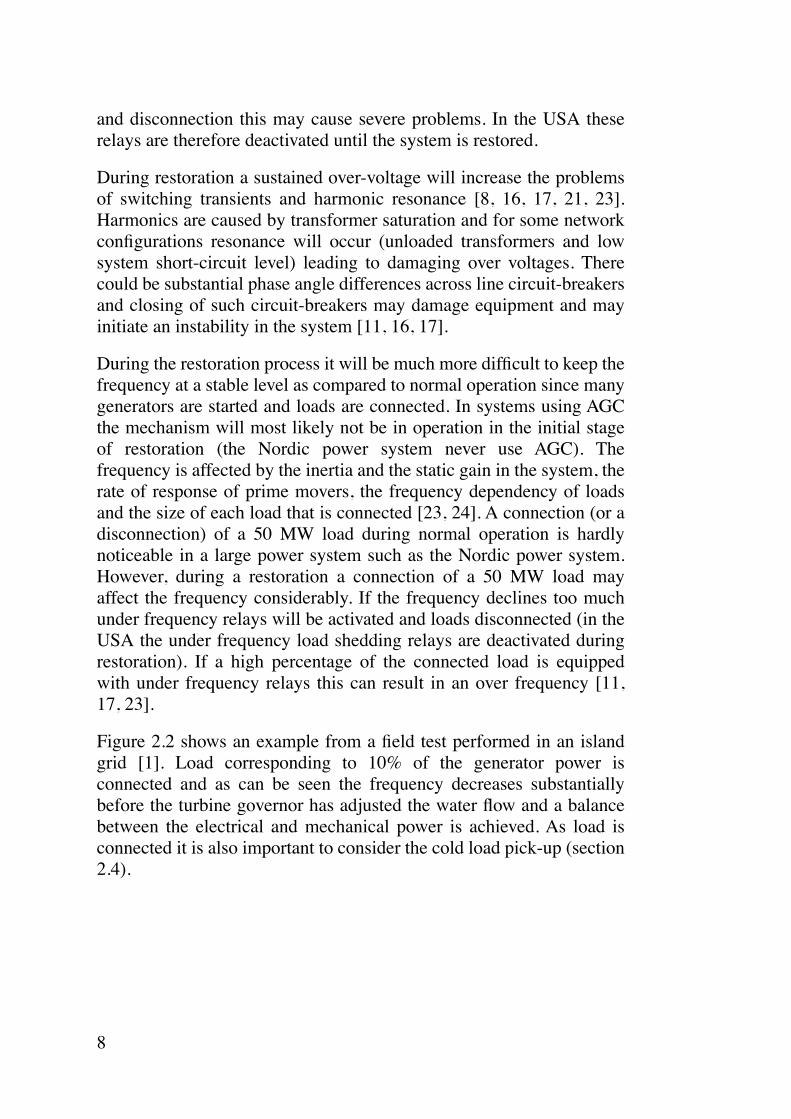
During the restoration process it will be much more difÞcult to keep thefrequency at a stable level as compared to normal operation since manygenerators are started and loads are connected. In systems using AGCthe mechanism will most likely not be in operation in the initial stageof restoration (the Nordic power system never use AGC). Thefrequency is affected by the inertia and the static gain in the system, therate of response of prime movers, the frequency dependency of loadsand the size of each load that is connected [23, 24]. A connection (or adisconnection) of a 50 MW load during normal operation is hardlynoticeable in a large power system such as the Nordic power system.However, during a restoration a connection of a 50 MW load mayaffect the frequency considerably. If the frequency declines too muchunder frequency relays will be activated and loads disconnected (in theUSA the under frequency load shedding relays are deactivated duringrestoration). If a high percentage of the connected load is equippedwith under frequency relays this can result in an over frequency [11,17, 23].
Figure 2.2 shows an example from a Þeld test performed in an islandgrid [1]. Load corresponding to 10% of the generator power isconnected and as can be seen the frequency decreases substantiallybefore the turbine governor has adjusted the water ßow and a balancebetween the electrical and mechanical power is achieved. As load isconnected it is also important to consider the cold load pick-up (section2.4).
9
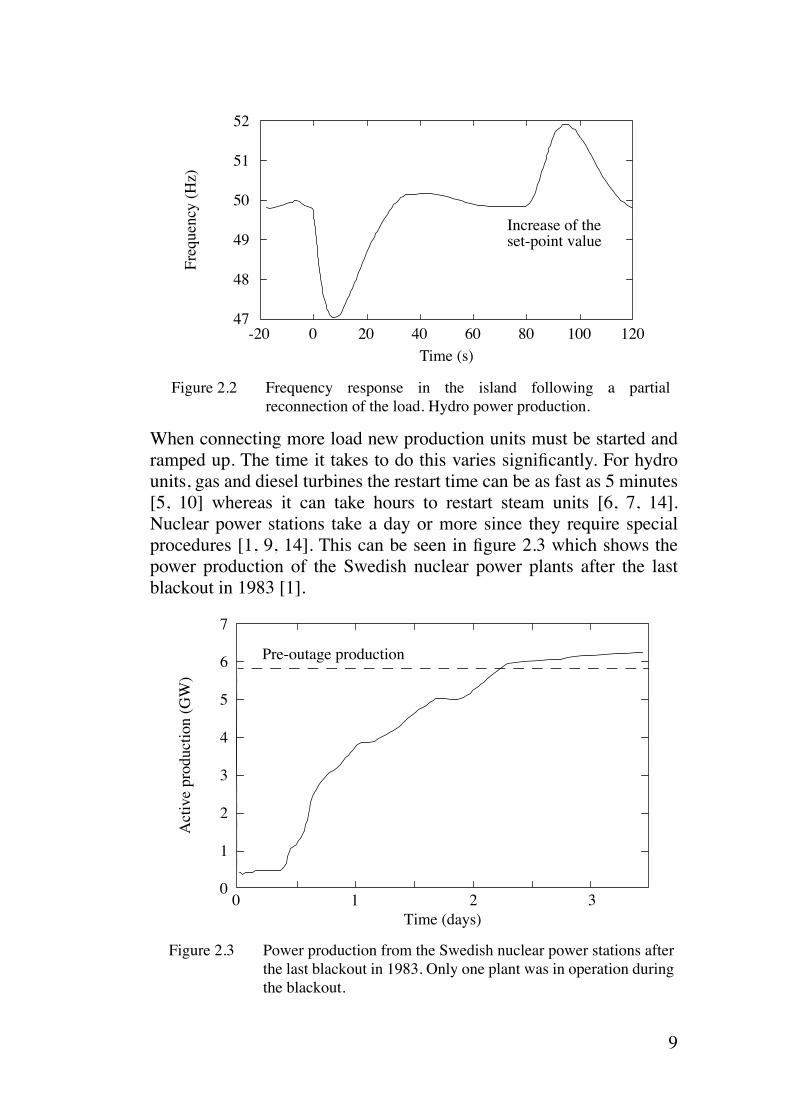
When connecting more load new production units must be started andramped up. The time it takes to do this varies signiÞcantly. For hydrounits, gas and diesel turbines the restart time can be as fast as 5 minutes[5, 10] whereas it can take hours to restart steam units [6, 7, 14].Nuclear power stations take a day or more since they require specialprocedures [1, 9, 14]. This can be seen in Þgure 2.3 which shows thepower production of the Swedish nuclear power plants after the lastblackout in 1983 [1].
0 20 40 60 80-20Time (s)
10047
50
48
49
51
52
Freq
uenc
y (H
z)
120
Increase of theset-point value
Figure 2.2 Frequency response in the island following a partialreconnection of the load. Hydro power production.
0 1 2 3
1
2
3
4
5
6
7
Time (days)
Act
ive
prod
uctio
n (G
W)
Pre-outage production
0
Figure 2.3 Power production from the Swedish nuclear power stations afterthe last blackout in 1983. Only one plant was in operation duringthe blackout.
10
During the restoration it is important for operators to know the systemstatus. There is, however, a risk that the computer systems in thecontrol centres will be overloaded with data due to generator, line andtransformer tripping, low voltages, under frequency and under voltageload shedding and other relay actions [14, 17]. Access to a specialmode or a special computer system which only takes the most relevantdata into account and thereby gives the operator the possibility to getan overview of the system status will signiÞcantly increase the successof a restoration.
2.3 Social and economical consequences
In case of a blackout there are substantial economical and socialconsequences. The industries will suffer from loss of production duringthe outage time and the time it takes for the restart. In processingindustries the restart time is very long and even after a short outage itmay take hours or days before the production is back to normal and aproper quality of the product is achieved [1, 48].
Nowadays most of the work in ofÞces is carried out by usingcomputers. During an outage many people may have problem to Þnduseful tasks when they do not have access to the computer. Data mayalso be lost due to the disturbance and restarting the computer systemsafter an outage may require some extra work.
Shops and stores operate on the assumption of access to electric power.When power is lost the customers have to be evacuated from the shopsand stores and since elevators, escalators and lighting do not functionthis may be rather complicated. Refrigerating will not function and ifthe duration is long there is a risk that food is spoiled.
Farms are mostly situated on the countryside and supplied byelectricity via overhead lines. Therefore disturbances in the powersupply are more common for a farmer as compared to a customer in acity. Many farmers have some sort of backup power which can be usedduring these contingencies but for those farmers that do not have anybackup power there might be a problem with the air conditioning, thewater supply or the milking of the cows.
Table 2.1 shows the result of an interruption cost study performed inSweden in 1994 [40]. In [41-43] similar investigations can be foundfrom other countries. It can be seen that the interruption cost increases
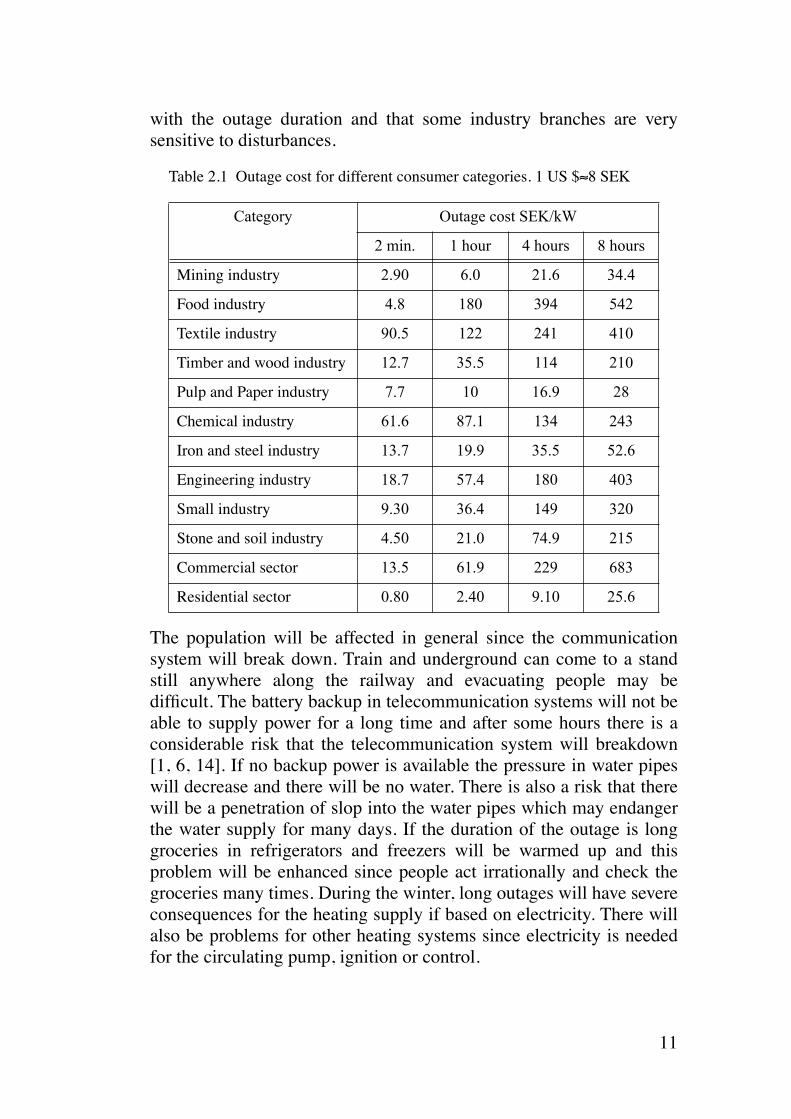
11
with the outage duration and that some industry branches are verysensitive to disturbances.
Table 2.1 Outage cost for different consumer categories. 1 US $
»
8 SEK
The population will be affected in general since the communicationsystem will break down. Train and underground can come to a standstill anywhere along the railway and evacuating people may bedifÞcult. The battery backup in telecommunication systems will not beable to supply power for a long time and after some hours there is aconsiderable risk that the telecommunication system will breakdown[1, 6, 14]. If no backup power is available the pressure in water pipeswill decrease and there will be no water. There is also a risk that therewill be a penetration of slop into the water pipes which may endangerthe water supply for many days. If the duration of the outage is longgroceries in refrigerators and freezers will be warmed up and thisproblem will be enhanced since people act irrationally and check thegroceries many times. During the winter, long outages will have severeconsequences for the heating supply if based on electricity. There willalso be problems for other heating systems since electricity is neededfor the circulating pump, ignition or control.
Category Outage cost SEK/kW
2 min. 1 hour 4 hours 8 hours
Mining industry
2.90 6.0 21.6 34.4
Food industry
4.8 180 394 542
Textile industry
90.5 122 241 410
Timber and wood industry
12.7 35.5 114 210
Pulp and Paper industry
7.7 10 16.9 28
Chemical industry
61.6 87.1 134 243
Iron and steel industry
13.7 19.9 35.5 52.6
Engineering industry
18.7 57.4 180 403
Small industry
9.30 36.4 149 320
Stone and soil industry
4.50 21.0 74.9 215
Commercial sector
13.5 61.9 229 683
Residential sector
0.80 2.40 9.10 25.6
12
2.4 Cold load pick-up
Cold load pick-up is not a new phenomenon. Already in the 1940Õs and1950Õs power companies experienced problems when reclosing circuitbreakers [32-34]. The problems were analysed and the conclusion wasthat when power is restored several household appliances will berestarted and since some of them are motors there will be high startingcurrents. The solution was to use relays with very inversecharacteristics and in some cases sectionalize the system and restoresome of the feeders and then wait a time before the others arereconnected.
In the literature of cold load pick-up some authors divide thephenomenon in the following four phases [28, 29, 34]
¥ Inrush currents to cold lamp Þlaments and to distributiontransformers. The duration is some cycles and the peak can be up to 10times the pre-disturbance level.
¥ Motor starting currents. The duration is about 1 second and the peakcurrent can be 6 times the normal value.
¥ Motor accelerating currents. Duration about 15 seconds.
¥ In the Þnal phase all inrush currents have died out but due to the lossof diversity among thermostatically controlled loads the powerconsumption is still above its pre-outage level. Duration is typicallyabout an hour but after an extended outage during cold weather it maytake several hours before the heating system returns to normal cycling.
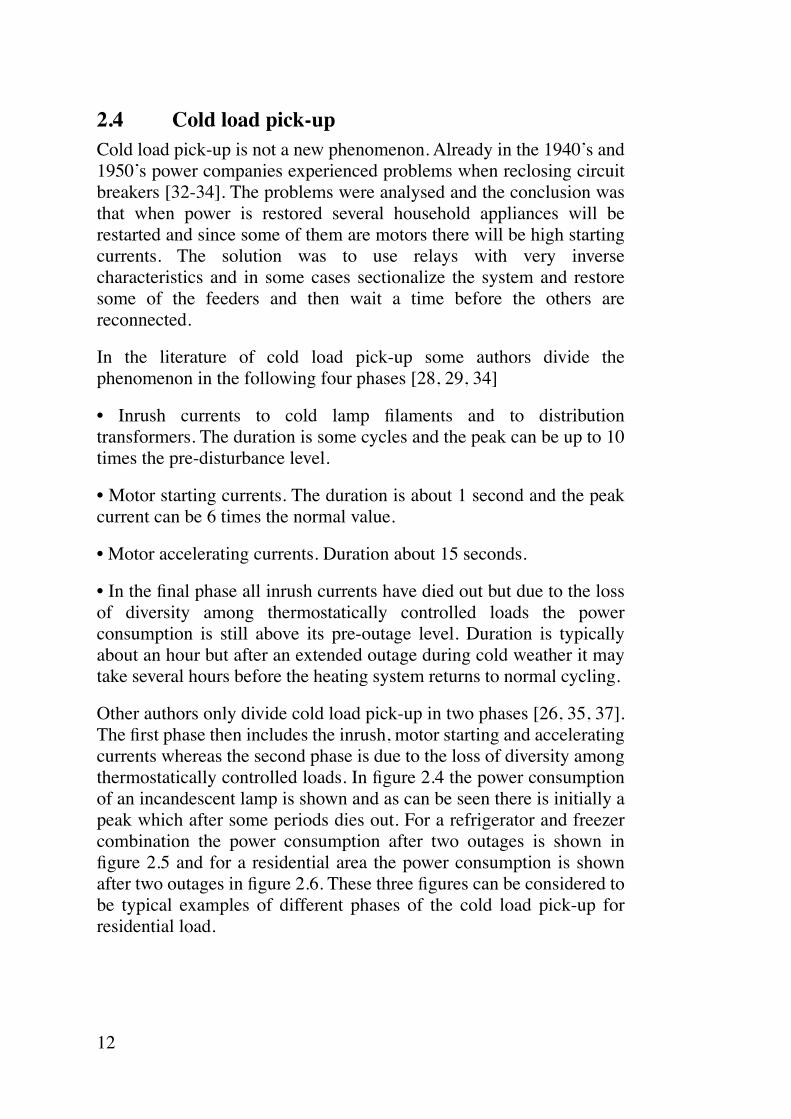
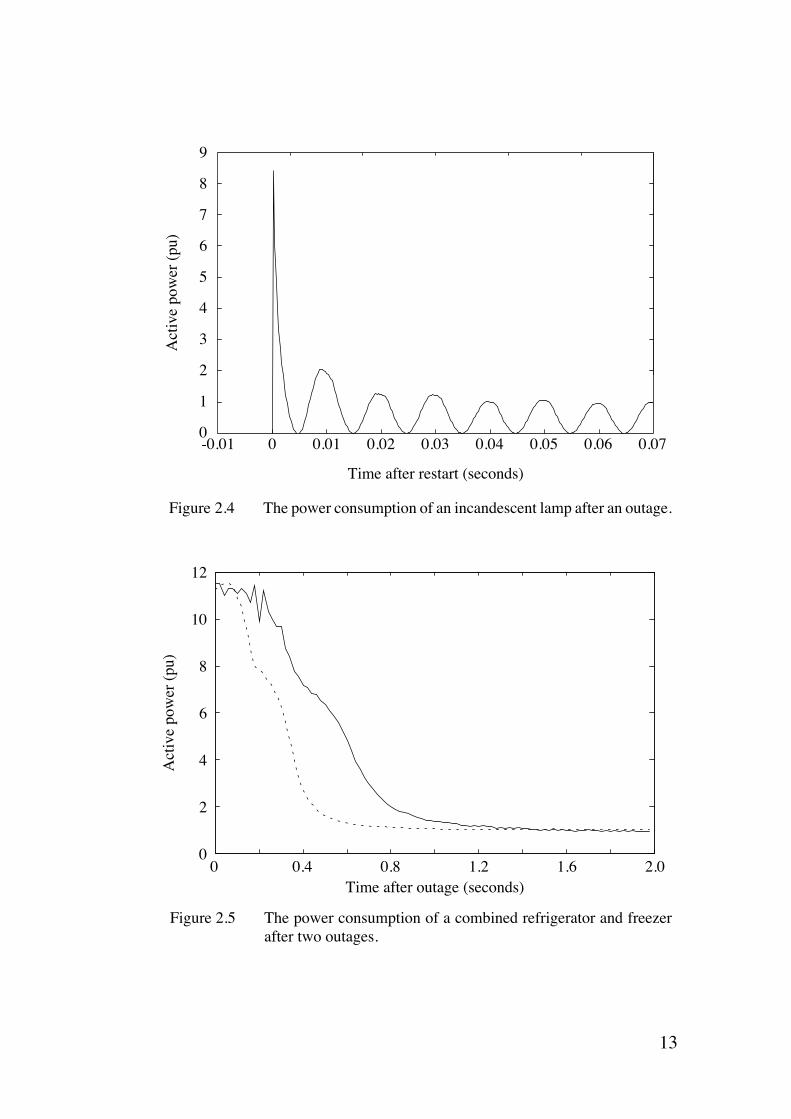
Other authors only divide cold load pick-up in two phases [26, 35, 37].The Þrst phase then includes the inrush, motor starting and acceleratingcurrents whereas the second phase is due to the loss of diversity amongthermostatically controlled loads. In Þgure 2.4 the power consumptionof an incandescent lamp is shown and as can be seen there is initially apeak which after some periods dies out. For a refrigerator and freezercombination the power consumption after two outages is shown inÞgure 2.5 and for a residential area the power consumption is shownafter two outages in Þgure 2.6. These three Þgures can be considered tobe typical examples of different phases of the cold load pick-up forresidential load.
13
0
1
2
3
4
5
6
7
8
9
0 0.01 0.02 0.03 0.04 0.05 0.06 0.07-0.01
Time after restart (seconds)
Act
ive
pow
er (
pu)
Figure 2.4 The power consumption of an incandescent lamp after an outage.
0 0.4 0.8 1.2 1.6 2.00
2
4
6
8
10
12
Time after outage (seconds)
Act
ive
pow
er (
pu)
Figure 2.5 The power consumption of a combined refrigerator and freezerafter two outages.
14
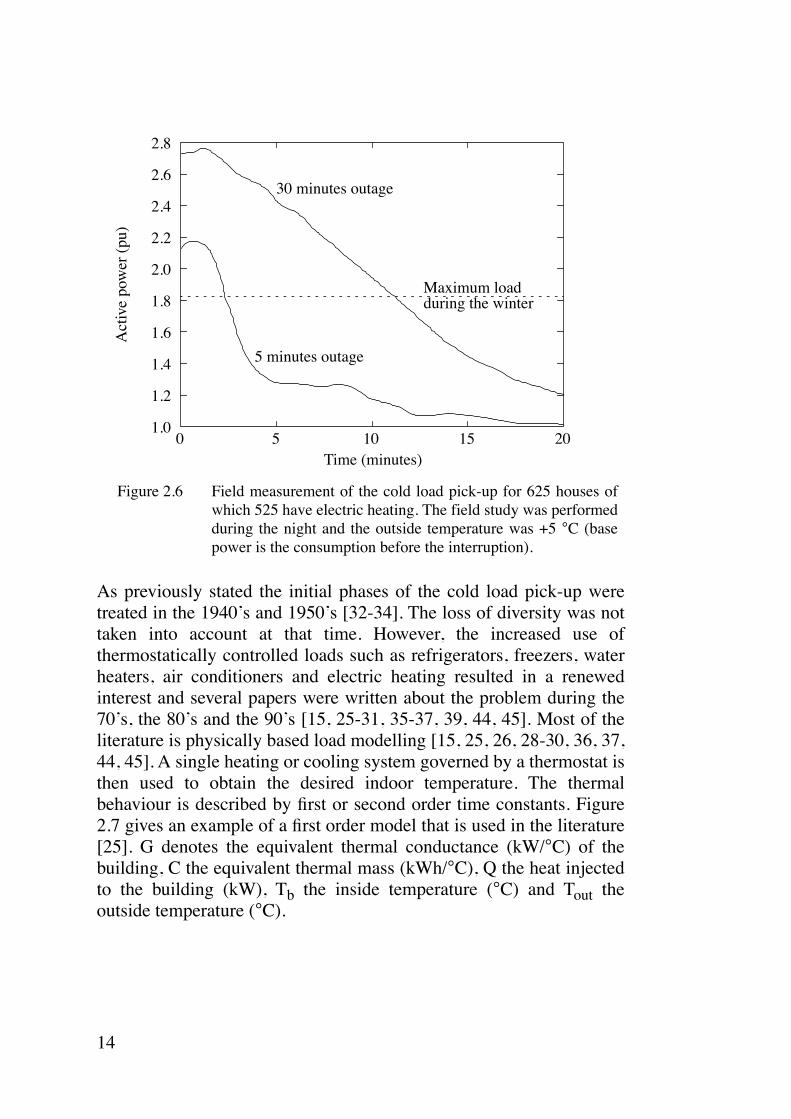
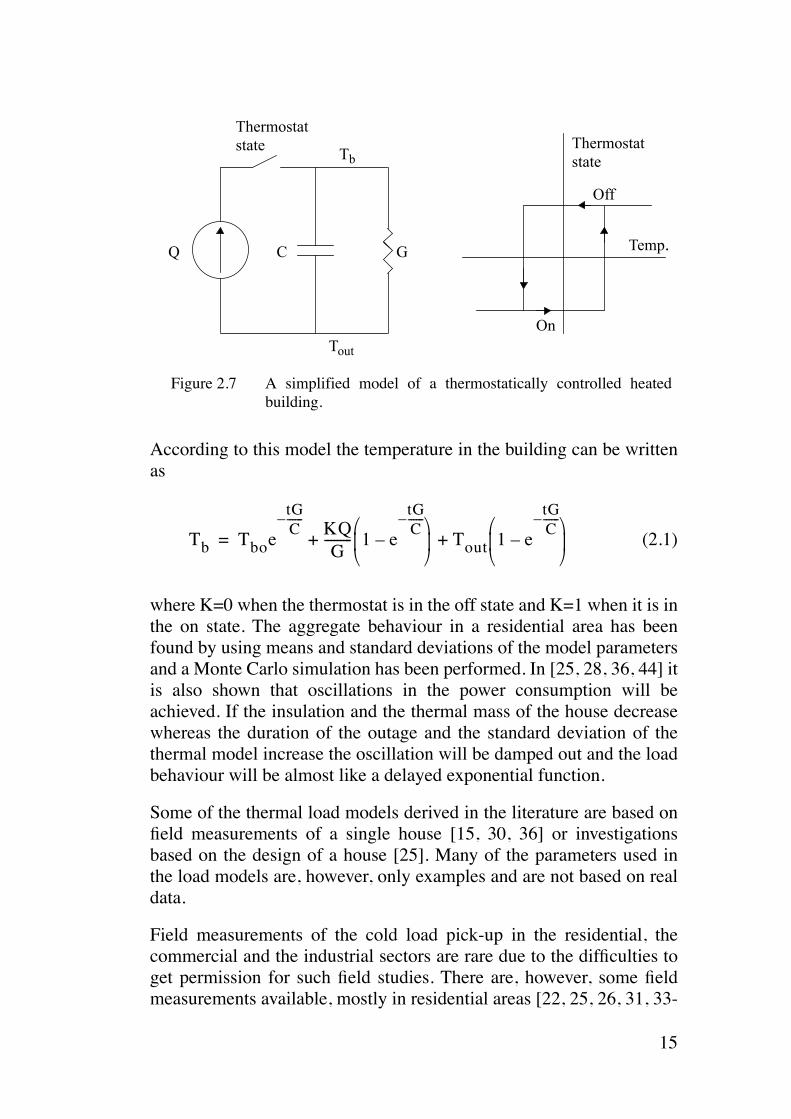
As previously stated the initial phases of the cold load pick-up weretreated in the 1940Õs and 1950Õs [32-34]. The loss of diversity was nottaken into account at that time. However, the increased use ofthermostatically controlled loads such as refrigerators, freezers, waterheaters, air conditioners and electric heating resulted in a renewedinterest and several papers were written about the problem during the70Õs, the 80Õs and the 90Õs [15, 25-31, 35-37, 39, 44, 45]. Most of theliterature is physically based load modelling [15, 25, 26, 28-30, 36, 37,44, 45]. A single heating or cooling system governed by a thermostat isthen used to obtain the desired indoor temperature. The thermalbehaviour is described by Þrst or second order time constants. Figure2.7 gives an example of a Þrst order model that is used in the literature[25]. G denotes the equivalent thermal conductance (kW/
°
C) of thebuilding, C the equivalent thermal mass (kWh/
°
C), Q the heat injectedto the building (kW), T
b
the inside temperature (
°
C) and T
out
theoutside temperature (
°
C).
2.8
2.6
2.4
2.2
2.0
1.8
1.6
1.4
1.2
1.00 5 10 15 20
Time (minutes)
Act
ive
pow
er (
pu)
30 minutes outage
5 minutes outage
Maximum load during the winter
Figure 2.6 Field measurement of the cold load pick-up for 625 houses ofwhich 525 have electric heating. The field study was performedduring the night and the outside temperature was +5 °C (basepower is the consumption before the interruption).
15
According to this model the temperature in the building can be writtenas
(2.1)
where K=0 when the thermostat is in the off state and K=1 when it is inthe on state. The aggregate behaviour in a residential area has beenfound by using means and standard deviations of the model parametersand a Monte Carlo simulation has been performed. In [25, 28, 36, 44] itis also shown that oscillations in the power consumption will beachieved. If the insulation and the thermal mass of the house decreasewhereas the duration of the outage and the standard deviation of thethermal model increase the oscillation will be damped out and the loadbehaviour will be almost like a delayed exponential function.
Some of the thermal load models derived in the literature are based onÞeld measurements of a single house [15, 30, 36] or investigationsbased on the design of a house [25]. Many of the parameters used inthe load models are, however, only examples and are not based on realdata.
Field measurements of the cold load pick-up in the residential, thecommercial and the industrial sectors are rare due to the difÞculties toget permission for such Þeld studies. There are, however, some Þeldmeasurements available, mostly in residential areas [22, 25, 26, 31, 33-
Temp.
Thermostat
Off
On
Thermostat
Tout
Q C G
Tb statestate
Figure 2.7 A simplified model of a thermostatically controlled heatedbuilding.
Tb Tboe
tGC------Ð
KQG
--------- 1 e
tGC------Ð
Ðè øç ÷æ ö
Tout 1 e
tGC------Ð
Ðè øç ÷æ ö
+ +=
16
35, 45, 46]. Often the resolution is low (based on 15 minutes averagevalues of the electric energy consumption) [25, 26] or in some casesthe power consumption is only presented for some minutes after theoutage [22, 31, 33, 34, 46]. Almost all measurements on residentialload show the same behaviour. Initially after an outage the powerconsumption will be higher or much higher as compared with the pre-outage level. In some cases it will stay on this high level for a time andthen decreases to its stationary level. This is in agreement with many ofthe results obtained when using physically based load modelling.
In [28, 29] the physically based load has been used as a way ofmodelling the load behaviour in an analytical way and the load canthen be described by the equation
(2.2)
where S
U
is the undiversiÞed load, S
D
the diversiÞed load,
a
the rate ofdecay for the exponential part, T the time at which the exponentialfunction starts and u(t) and u(t-T) Heaviside step unit functions. In [28]and in several other papers different parameter values are used in orderto study the aggregate behaviour. There is, however, a lack inpresentation of ÓtypicalÓ parameter values for ÓtypicalÓ residentialareas.
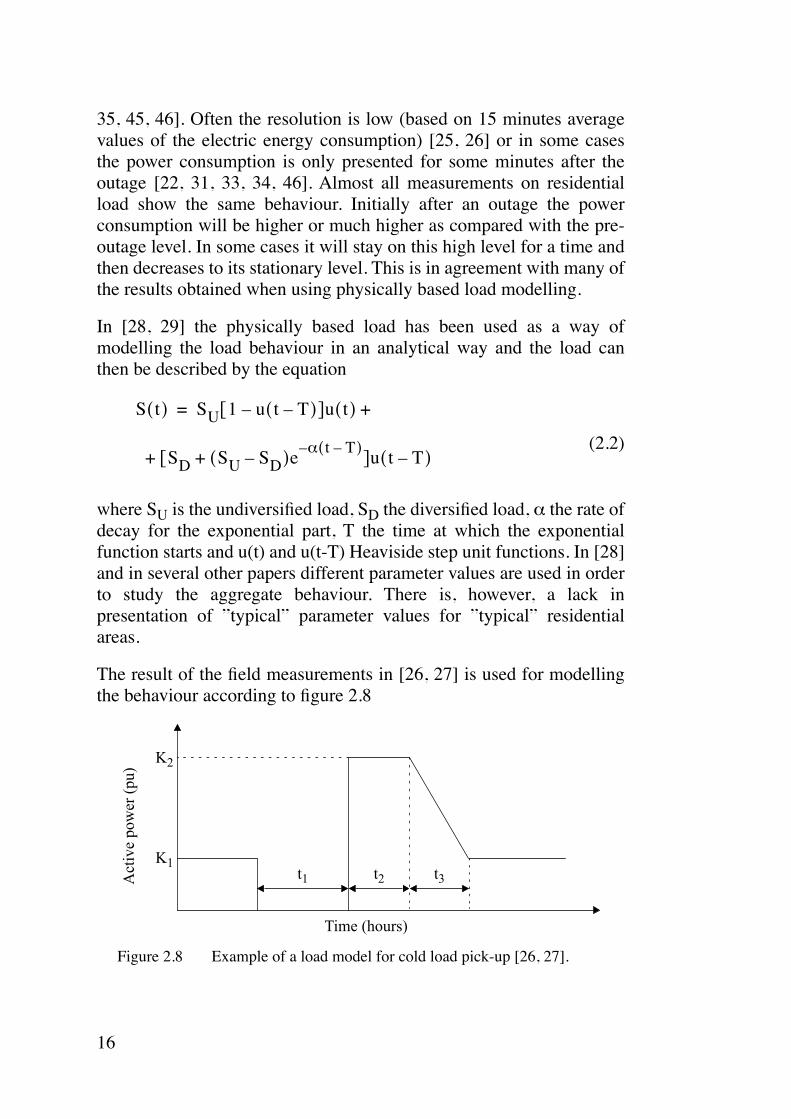
The result of the Þeld measurements in [26, 27] is used for modellingthe behaviour according to Þgure 2.8
S t( ) SU 1 u t TÐ( )Ð[ ]u t( ) +=
SD SU SDÐ( )ea t TÐ( )Ð
+[ ]u t TÐ( ) +
t1 t2 t3K1
K2
Act
ive
pow
er (
pu)
Time (hours)
Figure 2.8 Example of a load model for cold load pick-up [26, 27].
17
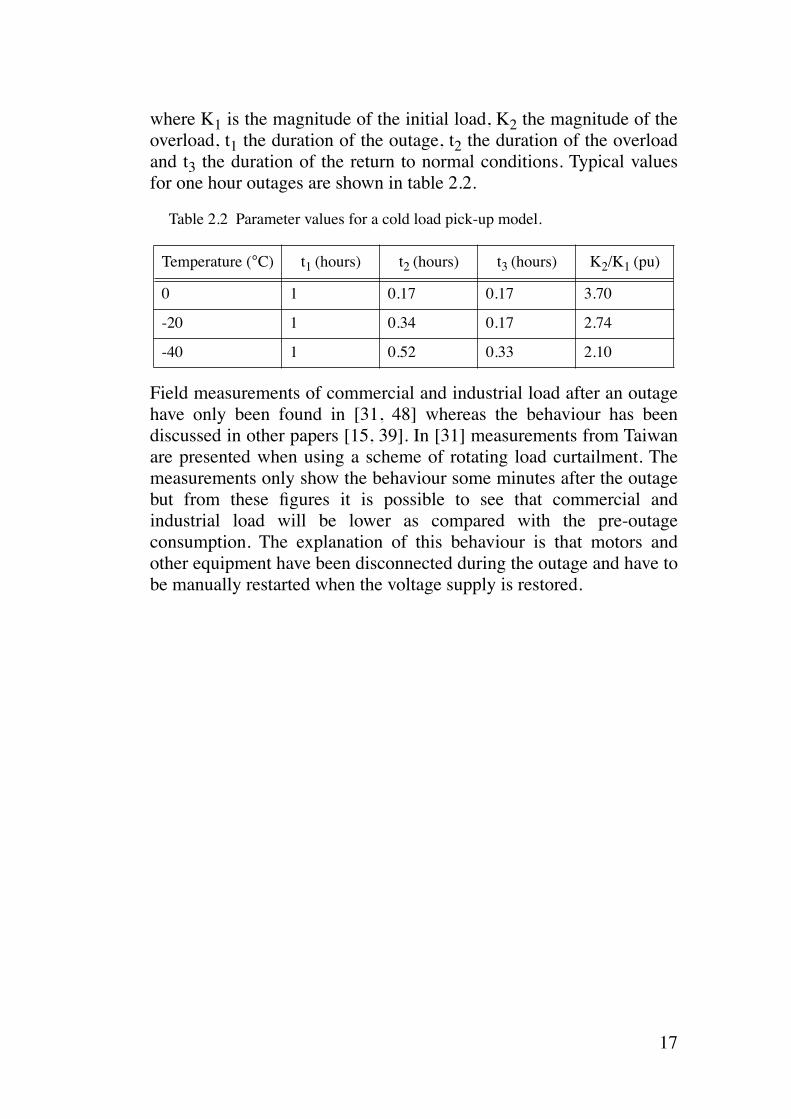
where K
1
is the magnitude of the initial load, K
2
the magnitude of theoverload, t
1
the duration of the outage, t
2
the duration of the overloadand t
3
the duration of the return to normal conditions. Typical valuesfor one hour outages are shown in table 2.2.
Table 2.2 Parameter values for a cold load pick-up model.
Field measurements of commercial and industrial load after an outagehave only been found in [31, 48] whereas the behaviour has beendiscussed in other papers [15, 39]. In [31] measurements from Taiwanare presented when using a scheme of rotating load curtailment. Themeasurements only show the behaviour some minutes after the outagebut from these Þgures it is possible to see that commercial andindustrial load will be lower as compared with the pre-outageconsumption. The explanation of this behaviour is that motors andother equipment have been disconnected during the outage and have tobe manually restarted when the voltage supply is restored.
Temperature (
°
C) t
1
(hours) t
2
(hours) t
3
(hours) K2/K1 (pu)
0 1 0.17 0.17 3.70
-20 1 0.34 0.17 2.74
-40 1 0.52 0.33 2.10

18
19
Chapter 3 Summary of Publications
This Ph. D thesis covers the work performed during the Ph. D study. Intotal 12 journal and conference papers [2-4, 47-50, A-E] together witha licentiate thesis [1] have been written. In this thesis Þve papers on thecold load pick-up are presented [A-E]. These papers can be divided inthe two groups residential load and industrial load.
The residential load is treated in three papers where the Þrst paperdeals with the cold load pick-up of individual load objects [A], thesecond one with electric heating [B] and the third paper presentsmeasurements on residential load areas [C]. Industrial load and itsbehaviour after forced and planned outages is dealt with in two paperswhere the Þrst one describes pulp and paper industries [D] and thesecond one analyses other industrial branches [E]. The analysis in theÞve papers is based on measured data either received from powersuppliers, industries or collected by own laboratory and Þeldmeasurements. The data have then been adapted to represent thedynamic characteristics of the load after an outage. The modelparameters are derived using standard (least square) curve Þttingmethods.
3.1 Paper A, Cold Load Pick-up for Individual LoadObjects
This paper presents laboratory measurements of the cold load pick-upfor individual load objects. Loads such as refrigerators, freezers, airconditioners, different types of lighting and other household equipmenthave been investigated. In order to study the effect of the duration of adisturbance the outage time has been varied. It is shown that streetlighting and lighting in warehouses, industries and ofÞces, wheremercury lamps, high pressure sodium lamps and ßuorescent lamps areused, will have a lower power consumption after an outage ascompared with the rated power. For ßuorescent lighting more than 90%of the rated power consumption returns almost immediately when thevoltage supply is restored and the remaining part after some additionalminutes. For mercury and high pressure sodium lamps 30-60% of thepower consumption returns instantaneously whereas it will take someadditional minutes before a stationary level is achieved. For these typesof lamps one observes that the illumination improves the Þrst minutes
20
after the power is restored and this is related to the warming up and thepressure increase of the vapour in the lamps which also has an effect ofthe power consumption.
When studying a large group of cooling equipment such asrefrigerators, freezers and air conditioners during normal operation thesame fraction of equipment will be in the on state and consumingpower. During an outage, however, the temperature inside a coolingequipment will rise and this means that after an outage a larger part orall of the equipment in an area will be in the on state. This is one of thereasons why the power consumption for this load category is higherafter an outage as compared with the pre-outage consumption. Anotherreason is related to the physical behaviour of the cooling equipment. Ahigh temperature inside the cooling equipment will give a higherdensity of the vapour that is ßowing into the compressor. As thecompressor compresses a constant volume the mass ßow will increaseand consequently also the power consumption. When the temperaturedecreases after a time the power consumption declines. If the durationof the outage is prolonged the load peak and the time it takes for theload to attain a normal level will increase. For a group of refrigeratorsand freezers it is shown that the power consumption can be modelledwith a decreasing exponential function.
For other types of household equipment such as stoves, ovens,washing, drying and dishing machines, radios, TV:s, computers etc. itis more difÞcult to predict the load behaviour after an outage as thepsychological behaviour of people may have a substantial effect ontheir operation.
3.2 Paper B, The Load Behaviour of Electric Heatingfollowing a Disturbance
In some countries a considerable part of the power consumption isrelated to electric heating. The heating can be electric boilers, electricradiators or heat pumps. In this paper measurements of the cold loadpick-up have been performed on several houses where the powersupply has been switched off during different time periods. Theinßuence of the outdoor temperature has also been studied since themeasurements have been performed during various times of the year.
21
An electric boiler heats up water which then is transported in pipes toradiators in the rooms. An electric boiler also supplies hot tap water ina house. Usually a boiler consists of several electric elements which areconnected and disconnected by a temperature sensor. After a longoutage several or all of the heating elements will be connected and thismeans that the power consumption will be higher or much higher ascompared to the pre-outage situation. The increase in powerconsumption and the time it takes before a stationary level is achievedare strongly dependent on the outdoor temperature and the outageduration. A longer outage and a lower outdoor temperature willincrease the peak load and its duration. If the load peak is related torated power it will be reduced with a decreasing outdoor temperatureas the rated power rises with a decreased outdoor temperature.
Another way of heating a house is by using electric radiators. Aradiator usually consists of a heating element encased in an envelope.In most cases each radiator is equipped with a thermostat controllingthe local temperature and having a cycling period of some minutes.During the measurements performed it has been shown that most of theelectric radiators will be in the on state after an outage. This is alsovalid after relatively short disturbances (30 minutes) and duringrelatively high outdoor temperature (<+10
°
C). The time to reachnormal power consumption is (as for electric boilers) stronglydependent on the outage duration and the outdoor temperature.
A large group of heat pumps in a residential area will be diversiÞedduring normal operation which means that the power consumption ofthis group will be rather constant. After a disturbance, however, all oralmost all of them will be in the on state. The phenomenon of loss ofdiversity will stand for most of the load peak for this group. In thesame way as for cooling equipment the physical behaviour of theequipment will affect the power consumption. This effect varies fordifferent brands but mostly the power consumption starts on a highlevel and then decreases to a minimum in some minutes. For somebrands the power consumption then starts to increase again and thiscontinues until the set point value of the temperature is reached an theheat pump is switched off.
Based on the measurements performed in different houses anaggregation of different electric heating systems has been made. Theaggregation was made for different outage durations and outdoortemperatures. The result shows that after an outage it is possible tomodel the cold load pick-up for electric heating with an initial constant
22
level for some minutes followed by an exponential decrease down tothe stationary level.
3.3 Paper C, Cold Load Pick-up of Residential Load
In this paper the cold load pick-up of residential load is investigated.Together with power suppliers in the southwestern part of Swedenmeasurements have been performed in residential areas. Most of theoutages were during the night and the outage time was between half anhour to more than Þve hours. Since the outages were made duringvarious times of the year also the impact of the outdoor temperature onthe cold load pick-up could be studied. An analysis of the load peakand its duration after an outage was made. The load peak and itsrelation to rated power (CLPUn factor) and to maximum powerexperienced during the year (CLPUm factor) was investigated. Theload peak after the disturbance will also lead to a recovery of some ofthe energy that was lost during the outage and this has also beenanalysed. It is shown that the CLPUn factor increases with an increasedoutdoor temperature whereas the CLPUm factor decreases with anincreased outdoor temperature. The time it takes for the load to obtaina stationary level is dependent on the outage duration and the outdoortemperature. An increased outage duration and a decreased outdoortemperature will both increase the recovery time. Also the recovery ofenergy is affected by the duration and temperature. A higherpercentage of the lost energy will be recovered if the duration of theoutage is short and the outdoor temperature is high.
Based on the data obtained a load model has been developed. The sameload model as previously has been proposed for electric heating wasderived, i.e. initially it starts with a constant level for some minutes andthen it decreases exponentially to a stationary level. This load modeltogether with suitable parameters have then been used for simulating asystem where a scheme of rotating load curtailment is used. Thesimulations show that it is necessary to tune such a scheme accuratelyin order to make it work properly. If load is disconnected a short perioda larger part of the lost energy will be recovered. This means that moreloads must be disconnected at the same time in order to achieve thedesired reduction of the total load. If loads are disconnected for alonger period of time the recovered energy will decrease but on theother hand the load peak will increase and this means that there is anincreasing risk of overloading lines and transformers. If small loads (on
23
10 kV level) are used and the rotation is uniformly spread out in timethe problem with a load peak will only be valid in the distributionnetwork. However, if each rotation step includes fewer but larger loadsthe problem with a load peak will also be valid in the transmissionsystem.
3.4 Paper D, Load Recovery in the Pulp and PaperIndustry following a Disturbance
Pulp and paper industries are interesting to study from a power systempoint of view. The plants are characterised by a high electricityconsumption and in Sweden there are plants consuming up to 300 MW.Pulp production can either be a mechanical or a chemical production.The chemical production generates much waste products such as barksand lyes including lignin. The waste products are burnt in furnacesproducing steam which in its turn is used during the pulp and paperproduction. As the steam production is higher than the consumptionmany industries also produce electricity with generators fed by backpressure-turbines.
In this paper measurements of the power consumption after plannedand forced outages are presented. The data were obtained from manyindustries in Sweden. Restarting after a planned outage takes a verylong time. In a chemical based pulp industry the most critical process isto start the recovery boilers which stand for most of the steamproduction. First the boilers have to be slowly pre-heated before blackliqour can be added to the process. The production can then start in asmall scale and increases after some time. The restart usually takesmore than a day but it can take several days before the production isstable and a proper product quality is achieved. The restart time isdependent on whether it is a short planned outage due to a publicholiday or if it is a more extensive overhaul taking one or two weeks.
Many industries have the possibility to run parts of their load in islandoperation. A disturbance in the power supply of such a plant maytherefore result either in a total shutdown of the industry or a situationwhere parts of the load together with the generator(s) succeeds inestablishing island operation. The restart of the production following adisturbance varies considerably for these two alternatives. If thechange over to island operation is successful it can take half a day to
24
restart whereas it can take a day or more to restart if the entire plant isshutdown.
The power consumption after planned outages has been modelled as alinear increase up to the stationary level. For forced outages a smallpart of the load returns fast whereas the main part of the powerconsumption returns after several hours. In that case the powerconsumption is modelled as an exponential increase having two timeconstants.
This paper also presents a formula for estimating the outage cost. Theformula takes the restart time, outage time and the time it takes to reacha proper product quality into account. An example from an industryconsuming 90 MW shows that an outage of half an hour will result in atotal economic loss of about 4 MSEK.
The investigation of the pulp and paper industry shows that parts of aproduction plant can be shutdown almost instantaneously without anymajor consequences for the operation of the plant. This is due to thebuffers stocks which are available between different production stagesand enables a continued production. Instead of only having gasturbines for the national disturbance power reserve an alternativewould be to partly disconnect loads in pulp and paper industries. Sucha system could be cost effective for the company responsible for thenational disturbance power reserve but also interesting for pulp andpaper industries since they will be economically compensated for thediscomfort of such a measure.
3.5 Paper E, Load Recovery in Different Industriesfollowing an Outage
This paper deals with the load behaviour after planned and forcedoutages in many industrial branches. By cooperation with industriesand power companies measurements of the load behaviour afteroutages have been collected. It is shown that the restart procedure aftera disturbance will vary considerably for various industry branches. Forthe engineering industry, sawmills or other small industries the restartafter an outage is usually in the order of an hour. For other industriessuch as reÞneries and chemical base industries the restart time isusually days.
25
Generally the restart after a planned interruption takes a longer time ascompared with the restart after a forced outage. In the same way as forpulp and paper industries the power consumption after a plannedinterruption may be modelled as a linear increase up to the stationarylevel. After a forced outage the load behaviour has been modelled as anexponential increase.
For some types of industries the outage time is very important. In themining industry an outage longer than half an hour may lead to severeproblems since the mine and its equipment will be ßooded. In the ironand steel industry an outage of a foundry plant lasting 1-2 hours mayhave catastrophic consequences as the material will solidify in thefurnace. In that case the furnace has to be rebuilt which can take weeksor months. In the chemical industry a long outage may also causeproblems. Different gases and liquids get crystallized and this isespecially a problem during the winter.

26
27
Chapter 4 Conclusions
This thesis have investigated the dynamic behaviour of different typesof load used in the residential and industrial sectors following outages.It has then developed mathematical models for such loads, verifyingthe models against actual Þeld measurements. In the past most powersystem dynamic studies have been limited to the use of prime movermodels and normal load characteristics. This research certainly hasdemonstrated that to be realistic, the dynamic behaviour of loadsshould also be considered during these studies.
For all the industries the power consumption will be lower or muchlower after an outage. It has been shown that after an outage it will takea long time (several hours or days) for processing industries, such aspulp and paper industries, chemical base industries and reÞneries torestart. Other branches such as engineering industries, sawmills andsmall industries recover much faster (usually within an hour).
Residential load has the opposite behaviour as compared withindustrial load, i.e after an outage the load is (much) higher than priorto the disturbance and then decreases to its stationary level.Thermostatically controlled loads such as refrigerators, freezers, airconditioners, electric boilers, electric radiators and heat pumps willloose their diversity after an extended outage and all, or almost all ofthem, will be in the on state when power is restored. This is the majorreason of the load increase after an outage but the physical behaviourof cooling equipment will result in an additional load increase.
The results obtained for cooling equipment can be used when studyingsystems containing much air conditioning load or areas in developingcountries where a large part of the load can be related to refrigeratorsand freezers.
In order to compare measurements performed in different areas andduring various outdoor temperatures and outage durations data havebeen analysed in different ways. The load peak after the outage and itsrelation to either the rated power (CLPUn factor) or the maximumpower experienced during the year (CLPUm factor) has beeninvestigated together with the recovery of energy.
The CLPUm factor is a good indicator of the actual powerconsumption and can be used when investigating the risk foroverloading in a distribution system. The derived residential load
28
models show that the load decreases exponentially. The risk ofoverloading can then be reduced by sectionalizing the station andconnect load in stages, waiting some minutes each time more load isconnected.
The CLPUn factor, the recovered energy and the derived industrial andresidential load models are of interest when studying the cold loadpick-up from the transmission point of view. They can therefore beused when formulating restoration guidelines and when tuning ascheme of rotating load curtailment. Using a scheme of rotating loadcurtailment incorporating residential load will, however, beproblematic as it may lead to an overloading of distribution lines andtransformers or in some cases an overloading of the entire powersystem. If residential load should be used in this scheme it is thereforeessential that the personnel have a good knowledge of the cold loadpick-up. Another alternative which eliminates this problem is to useindustrial load.
Due to the deregulation of the electricity market it is likely in the futurethat (more) agreements between power suppliers and customers aremade which give the power suppliers the possibility to disconnect loadwhen the production capacity is reached or when it is costly to producethe peak power. This may also incorporate the possibility to disconnectload as an alternative to having gas turbines for the disturbance powerreserve.
29
Chapter 5 Future Work
This thesis has investigated the cold load pick-up based on laboratoryand Þeld measurements. However, there is still a need for moremeasurements on residential load during low outdoor temperatures andespecially for commercial load which has not been investigated here.With the increase in number an accuracy of load measurements itshould be possible in future to develop more accurate load models. Asmany industries now have installed or are planning to install their ownmeasuring equipment it will also be easier to collect data with a highresolution from these industries in the future.
In the present work the economic loss due to an outage is onlyinvestigated for the pulp and paper industries. However, it is importantthat similar work also is performed for other industrial branches andthe residential and commercial sector. An important issue is to costjustify continuity of service, e.g., the trade off between controlled loadcurtailments and providing generation reserve. Or to cost justify theadditional investment and expenditures required to reduce the durationof power system restoration.
The initial title of the project ÓDevelopment of Criteria and Strategiesfor Network Rebuilding following a major DisturbanceÓ still involvesmany challenges. Investigations on where and how island operationcan be run and suggestions and guidelines of how this can beaccomplished and improved is an area that needs more consideration,both by more Þeld studies and also by more theoretical analysis.Investigations on island operation should preferably include industrieswith in-house generation.
The restoration process involves many unusual situations that must behandled by the personnel in control centres. As they in most cases havelittle or no experience of such work it is important that they aresufÞciently trained for such situations. This can be done in role playsand/or by using simulators.

30
31
References
[1] Agneholm E., The Restoration Process following a major Breakdown in aPower System, Licentiate thesis, Technical Report No. 230L, ChalmersUniversity of Technology, Sweden 1996.
[2] Agneholm E., le Dous G., Daalder J., The Frequency Dependence ofAggregate MW Loads, International Power Engineering Conference, May22-24, 1997, Singapore, Proceedings Vol. 1, pp. 414-419.
[3] Agneholm, E., le Dous G., Johansson S., Education and Training byComputational and Laboratory Methods, International Power EngineeringConference, May 22-24, 1997, Singapore, Proceedings Vol. 2, pp. 889-894.
[4] Agneholm, E., Daalder J. E., Shunt Reactor Behaviour during PowerSystem Restoration, International Symposium on Modern Electric PowerSystems, September 26-27, 1996, Wroclaw, Poland, Proceedings pp. 154-161.
[5] IEEE Committee Report, Adibi M. M., Milaniscz D. P., Volkmann T. L.,Remote Cranking of Steam Electric Stations, IEEE Transactions on PowerSystems, Vol. 11, No. 3, August 1996, pp. 1613-1618.
[6] IEEE Committee Report, Adibi M., Clelland P., Fink L., Happ H., KafkaR., Raine J., Scheurer D., Trefny F., Power System Restoration - A TaskForce Report, IEEE Transaction on Power Systems, Vol. PWRS-2, No. 2,May 1987, pp. 271-277.
[7] IEEE Committee Report, Adibi M. M., Borkoski J. N., Kafka R. J., PowerSystem Restoration - The Second Task Force Report, IEEE Transaction onPower Systems, Vol. PWRS-2, No. 4, November 1987, pp. 927-933.
[8] IEEE Committee Report, Adibi M. M., Alexander R. W., Avramovic B.,Overvoltage Control During Restoration, IEEE Transactions on PowerSystems, Vol. 7, No. 4, November 1992, pp. 1464-1470.
[9] IEEE Committee Report, Adibi M. M., Adamski G., Jenkins R., Gill P.,Nuclear Plant Requirements during Power System Restoration, IEEETransactions on Power Systems, Vol. 10, No. 3, August 1995, pp. 1486-1491.
32
[10] IEEE Committee Report, Adibi M. M., Kafka R. J., Milanicz D. P., ExpertSystem Requirements for Power System Restoration, IEEE Transactionson Power Systems, Vol. 9, No. 3 August 1994, pp. 1592-1600.
[11] IEEE Committee Report, Adibi M. M., Milanicz D. P., Protective SystemIssues during Restoration, IEEE Transaction on Power Systems, Vol. 10,No. 3, August 1995, pp. 1492-1497.
[12] IEEE Committee Report, Adibi M. M. et al., Bulk Power SystemRestoration Training Techniques, IEEE Transaction on Power Systems,Vol. 8, No. 1, February 1993, pp. 191-197.
[13] IEEE Committee Report, Adibi M. M., Fink L. H., Giri J., Kirschen D. S.,Shahidehpour S. M., Zaborszky J., New Approaches in Power SystemRestoration, IEEE Transaction on Power Systems, Vol. 7, No. 4,November 1992, pp. 1428-1434.
[14] IEEE Committee Report, Adibi M. M., Fink L. H., Andrews C. J.,Arsanjani F., Lanier M. W., Miller J. M., Volkmann T. A., Wrubel J.,Special Considerations in Power System Restoration, IEEE Transactionson Power Systems, Vol. 7, No. 4, November 1992, pp. 1419-1427.
[15] IEEE Committee Report, Special Consideration in Power SystemRestoration - The Second Working Group Report, paper 93 WM 202-2,presented at IEEE 1993 WPM, Columbos, Ohio, January 31-February 5,1993.
[16] IEEE Committee Report, Adibi M. M., Borkoski J. N., Kafka R. J.,Analytical Tool Requirements for Power System Restoration, IEEETransactions on Power Systems, Vol. 9, No. 3, August 1994, pp. 1582-1591.
[17] Adibi M. M., Fink L. H., Power System Restoration Planning, IEEETransaction on Power Systems, Vol. 9, No. 1, February 1994, pp. 22-28.
[18] CIGRE TF 38.02.02, Modelling and Simulation of Black Start andRestoration of Electric Power Systems, Electra No. 147, April 1993, pp.21-42.
[19] Ancona J. J., A Framework for Power System Restoration following aMajor Power Failure, IEEE Transaction on Power Systems, Vol. 10, No.3, August 1995, pp. 1480-1485.
33
[20] Delfino B., Denegri G. B., Bonini E. C., Marconato R., Scarpellini P.,Black-start and Restoration of a Part of the Italian HV Network: Modellingand Simulation of a Field Test, IEEE Transactions on Power Systems, Vol.11, No. 3, August 1996, pp. 1371-1379.
[21] Morin G., Service Restoration following a Major Failure on the Hydro-Quebec Power System, IEEE Transaction on Power Delivery, Vol.PWRD-2, No. 2, April 1987, pp. 454-462.
[22] Selosse P., Testud G., Nicolas J., Martin M., Strategy of 400 kV RegionalFrameworks to Restore the French Network after a Blackout, CIGREReport 39-104, Paris, France, August 30-September 5, 1998.
[23] Adibi M. M., Kafka R. J., Power System Restoration Issues, IEEEComputer Applications in Power, April 1991, pp. 19-24.
[24] Adibi M. M., Borkoski J. N., Kafka R. J., Volkmann T. L., FrequencyResponse of Prime Movers during Restoration, PE-412-PWRS-0-06-1998,recommended and approved for publication in the IEEE Transactions onPower Systems.
[25] Nehrir M. H., Dolan P. S., Gerez V., Jameson W. J., Development andValidation of a Physically-Based Computer Model for Predicting WinterElectric Heating Loads, IEEE Transactions on Power Systems, Vol. 10,No. 1, February 1995, pp. 266-272.
[26] Wilde R. L., Effects of Cold Load Pickup at the Distribution SubstationTransformer, IEEE Transactions on Power Apparatus and Systems, Vol.PAS-104, No. 3, March 1985, pp. 704-710.
[27] Aubin J., Bergeron R., Morin R., Distribution Transformer OverloadingCapability under Cold-Load Pickup Conditions, IEEE Transactions onPower Delivery, Vol. 5, No. 4, November 1990, pp. 1883-1891.
[28] Ucak C., Restoration of Distribution Systems following ExtendedOutages, Ph. D. thesis, Kansas State University, USA, 1994.
[29] Lang W. W., Cold Load Pick Up: The Electrical Space HeatingComponent, Ph. D. thesis, University of Missouri-Rolla, USA, 1980.
[30] McDonald J. E., Bruning A. M., Mahieu W. R., Cold Load Pickup, IEEETransactions on Power Apparatus and Systems, Vol. PAS-98, No. 4,July/August 1979, pp. 1384-1386.
34
[31] Leou R. C., Gaing Z. L., Lu C. N., Chang B. S., Cheng C. L., DistributionSystem Feeder Cold Load Pickup Model, Electric Power SystemsResearch, Vol. 36, 1996, pp. 163-168.
[32] Ramsauer O., A New Approach to Cold Load Restoration, ElectricalWorld, October 6, 1952, pp. 101-103.
[33] Audlin L. J., Pratt M. H., McConnel A. J., New Relay Assures FeederResumption After Outage Part 2, Electrical World, September 24, 1949,pp. 95-98.
[34] Hartay C. E., Couy C. J., Diversity a New Problem in Feeder Pickup,Electric Light and Power, October 1952, pp. 142-146.
[35] Mirza O. H., Usage of CLPU Curve to Deal with the Cold Load PickupProblem, IEEE Transactions on Power Delivery, Vol. 12, No. 2, April1997, pp. 660-667.
[36] Ihara S., Schweppe F. C., Physically Based Modelling of Cold LoadPickup, IEEE Transactions on Power Apparatus and Systems, Vol. PAS-100, No. 9, September 1981, 4142-4150.
[37] Mortensen R. E., Haggerty K. P., Dynamics of Heating and CoolingLoads: Models, Simulation, and Actual Utility Data, IEEE Transactions onPower Systems, Vol. 5, No. 1, February 1990, pp. 243-249.
[38] CIGRE TF 38.06.04, A Survey of Expert Systems for Power SystemRestoration, Electra No. 150, October 1993, pp. 87-105.
[39] IEEE Committee Report, Strang W. M. et al., Distribution Line ProtectionPractices, Industry Survey Results, IEEE Power System RelayingCommittee Report, IEEE Transactions on Power Delivery, Vol. 10, No. 1,January 1995, pp. 176-186.
[40] Avbrottskostnader f�r elkunder, Svenska elverksf�reningen 1994 (InSwedish).
[41] Willis K. G., Garrod G. D., Electricity Supply Reliability, Energy Policy,Vol. 25, No. 1, 1997, pp. 97-103.
[42] Sullivan M. L., Vardell T., Johnson M., Power Interruption Costs toIndustrial and Commercial Consumers of Electricty, IEEE Transaction onIndustry Applications, Vol. 33, No. 6, November/December 1997, pp.1448-1457.
35
[43] Wacker G., Tollefson G., Billinton R., A Canadian Cost of InterruptionStudy, IEEE/NTUA Athens Power Tech. Conference: Planning, Operationand Control of TodayÕs Electric Power Systems, Athens, Greece,September 5-8, 1993, pp. 861-865.
[44] Chong C-Y, Statistical Synthesis of Physically Based Load Models withApplications to Cold Load Pickup, IEEE Transaction on Power Apparatusand Systems, Vol. PAS-103, No. 7, July 1984, pp. 1621-1628.
[45] Law J., Elliott L., Minford D., Storms M., Measured and Predicted ColdLoad Pick Up and Feeder Parameter Determination Using the HarmonicModel Algorithm, IEEE Transaction on Power Systems, Vol. 10, No. 4,November 1994, pp. 1756-1763.
[46] Mariani E., Mastroianni F., Romano V., Field Experiences inReenergization of Electrical Networks from Thermal and Hydro Units,IEEE Transactions on Apparatus and Systems, Vol. PAS-103, No. 7, July1984, pp. 1707-1713.
[47] Agneholm E., Daalder J., Cold Load Pick-Up, International PowerEngineering Conference, May 22-24, 1997, Singapore, Proceedings Vol.1, pp. 403-408.
[48] Agneholm, E., Daalder J. E., Cold Load Pick-up for Different Types ofIndustries, International Symposium on Modern Electric Power Systems,September 26-27, 1996, Wroclaw, Poland, Proceedings pp. 148-153.
[49] Agneholm E., Daalder J. E., Fendin H., Ingelsson B., Restoration of theSwedish Bulk Power Transmission System following a major Disturbance.International Symposium on Electric Power Engineering, Stockholm,Sweden, 1995, Proceedings Information and Control Systems, pp. 240-245.
[50] Agneholm E., Daalder J., Cold Load Pick-up after an Outage, accepted forpresentation at the 13th Power System Computation Conference,PSCCÕ99, Trondheim, Norway, June 28-July 2nd, 1999.