Embed Size (px)
Citation preview
PRO
CE
ED
ING
STA
LL
TIM
BE
RSFIR
EE
CO
LO
GY
CO
NFE
RE
NC
E
No.23
2007
TALLTIMBERSFIREECOLOGYCONFERENCE
PROCEEDINGS23rd
FireinGrassland&ShrublandEcosystems
EditedbyRonaldE.MastersandKristaE.M.Galley
TallTimbersResearchStationTallahassee,Florida,USA
ACKNOWLEDGMENTS
A great deal of time, expense, and yes, even blood,sweat, and tears goes into organizing and running asuccessful conference. A conference is never completeuntil the ink is dry and the proceedings are finally inhand or on-screen as the case may be. We acknowl-edge the fantastic support and assistance that made yetanother Tall Timbers Fire Ecology Conference a suc-cessful endeavor. First and foremost, special thanks goto Kaye Gainey and Lisa Baggett, Administrative As-sistants, Tall Timbers Research Station, who workedon all aspects of the conference from initial organi-zation, arrangements, to assistance on-site, organizingthe poster session, and sending out papers for review.We also thank Rose Rodriguez, Information ResourcesManager, Tall Timbers Research Station, who guidedWeb site development, published materials, and coor-dinated arrangements with conference site personnel.We gratefully acknowledge the steering committeemembers who helped with organizing program topicsand session content and the outstanding field trip. Theyincluded Bob Hamilton, The Nature Conservancy;Drs. Dave Engle, Terry Bidwell, Sam Fuhlendorf, andJohn Weir of Oklahoma State University’s RangelandEcology and Management Program; and Melanie Mill-er with the USDI Bureau of Land Management. BobHamilton deserves special credit and thanks for hisorganizational efforts on the field trip and for sharingthe wonders of the Tallgrass Prairie Preserve with con-ference participants.
We thank the team that worked behind the sceneswith audiovisual and lights: Eric Staller, Tom Ostertag,and Dr. Kevin Robertson, all of Tall Timbers ResearchStation. We also appreciate our moderators who keptthings up-tempo and moving smoothly between pre-sentations and sessions. They included Dr. Terry Bid-
well; Dr. Brian Oswald, Stephen F. Austin University;Dr. Kevin Robertson; Melanie Miller; Dr. Neil Sugi-hara, USDA Forest Service; and Doug Cram, NewMexico State University.
We give special thanks to our Plenary Speakers, Dr.Winston Trollope, University of Fort Hare, South Af-rica; Dr. Tom Bragg, University of Nebraska; and Dr.Charles Kay, Utah State University; and to our Ban-quet Speaker, Dr. Carlton Britton, Texas Tech Univer-sity. The Seventh E.V. Komarek, Sr. Fire Ecology Lec-turer, Dr. Trollope, made a wonderful presentation ty-ing together an important piece of Tall Timbers historywith the development of fire ecology in Africa. Weappreciate the contributions of our plenary speakers—Dr. Bragg, for his thoughtful talk on contrasts and sim-ilarities of grasslands on two continents; and Dr. Kay,for his compelling perspective on the influence of ab-original fire on North American ecosystems. We alsothank Dr. Britton, our banquet speaker, who paid elo-quent tribute to one of the great fire ecologists of alltime, Dr. Henry Wright.
The 23rd Tall Timbers Fire Ecology Conference Or-ganizing Committee gratefully acknowledges the sup-port of our many sponsors: Tall Timbers Research Sta-tion; Joint Fire Science Program; The Nature Conser-vancy; Rangeland Ecology and Management Program,Oklahoma State University; Southeast Fire EcologyPartnership; USDI Bureau of Land Management;USDI National Park Service; U.S. Fish and WildlifeService; USDA Forest Service; The Association forFire Ecology; National Interagency Prescribed FireTraining Center; Oklahoma Chapter, Society for RangeManagement; and Society for Range Management.
REM, KEMG

Proceedings of theInvasive Species Workshop:
The Role of Fire in the Control andSpread of Invasive Species
Fire Conference 2000: The First National Congresson Fire Ecology, Prevention, and Management
November 27–December 1, 2000San Diego, California
Sponsored by:The Association for Fire Ecology
Joint Fire Science ProgramTall Timbers Research Station
The Nature ConservancyInternational Association of Wildland Fire
In cooperation with University Extension,University of California, Davis
RECOMMENDED CITATION FORMATS
Entire volume:
R.E. Masters and K.E.M. Galley (eds.). 2007. Proceedings ofthe 23rd Tall Timbers Fire Ecology Conference: Fire inGrassland and Shrubland Ecosystems. Tall TimbersResearch Station, Tallahassee, Florida, USA.
Individual papers:
Trollope, W.S.W. 2007. Fire—a key factor in the ecology andmanagement of African grasslands and savannas. Pages2–14 in R.E. Masters and K.E.M. Galley (eds.).Proceedings of the 23rd Tall Timbers Fire EcologyConference: Fire in Grassland and ShrublandEcosystems. Tall Timbers Research Station, Tallahassee,Florida, USA.
ISSN 0082-1527
NOTICE TO READERS:
To find a comprehensive on-line author–title–subject index to the Twenty-third Tall Timbers Fire Ecology Conference Proceedings, please visit theTall Timbers website at www.talltimbers.org. The index is part of the TallTimbers E.V. Komarek Fire Ecology Database, which is linked to thehome page. There is no charge to access the database. All 23 Tall TimbersFire Ecology Conference Proceedings, fully indexed and with abstracts,are included in the database.
Published by:Tall Timbers Research Station13093 Henry Beadel DriveTallahassee, FL 32312, USAwww.talltimbers.org
� 2007, Tall Timbers Research, Inc.Printed by Allen Press, Inc.
Lawrence, Kansas, USA
FIRE IN GRASSLAND & SHRUBLAND ECOSYSTEMSAn International Symposium
17–20 October 2005Bartlesville, Oklahoma, USA
Sponsors
Joint Fire Science Program
National Park Service
USDA Forest Service
The Association for Fire Ecology
Society for Range Management
Oklahoma Section of theSociety for Range Management
The Nature Conservancy
USDI Bureau of Land Management
US Fish & Wildlife Service
National InteragencyPrescribed Fire Training Center
Southeast Fire Ecology Partnership
Oklahoma State UniversityDivision of Agricultural Sciences
& Natural Resources
PREFACE
Ronald E. MastersTall Timbers Research Station, 13093 Henry Beadel Drive, Tallahassee, FL 32312, USA
Tall Timbers’ Fire Ecology Conferences were begunin 1962 by Tall Timbers Research Station to providean international forum for discussion of research andresearch needs in the area of fire ecology and topromote the use of fire as a management tool. Earlyon, these conferences provided the synergy needed topromote recognition of fire’s natural role in theenvironment. Indeed, the early conferences providedthe focal point for an emerging new field—fireecology. Winston Trollope’s paper in theseproceedings confirms this. Prior to the convening ofthese conferences, very few papers were published onfire. Scientists and managers were often ostracized ifthe topic of fire was broached in a positive light. Thetimes, ‘‘they have changed’’—a recent Google searchon the Internet pulled up 366,000 hits on ‘‘fireecology.’’ Yet the vast majority of the urban publicstill fails to see the essential role of fire in theenvironment.
On a periodic basis, conference themes havefocused on fire in specific ecosystems where researchhas brought new knowledge to light and where openscientific discourse would help refine research andmanagement direction and thought. At other times,they have incited paradigm shifts. The proceedings ofthese conferences are unique in that they are peer-reviewed. This 23rd conference continues the long-standing tradition begun by Ed and Roy Komarek.
The objectives of the 23rd Tall Timbers Fire EcologyConference were to focus on the ecology of fire ingrasslands and shrublands and on grassland–woodland
complexes, which are some of the most rapidlydeclining systems globally. These systems developedunder the interactive influence of fire and grazing andbrowsing animals—a fact often lost to or ignored byplant ecologists. Large native herbivores are gone fromthe landscapes of North America; some would arguethat domesticated species can fill a surrogate role. Thesteering committee members have had numerousrunning discussions over the past decade about howvarious grazing niches interacted with fire alongenvironmental gradients and at the landscape level. Asgrassland species of wildlife have declined, it hasbecome increasingly clear that the interactive influenceof these forms of natural disturbance is essential toperpetuate a number of habitat-specialist grasslandspecies. Because many of these ideas were being testedon The Nature Conservancy’s Tallgrass PrairiePreserve in Northeast Oklahoma, this location came tothe forefront as an ideal venue for the 23rd Conference.This conference specifically highlights new researchregarding native grazing and patch-burninginteractions. Another conference goal was to increasethe awareness of current invasive plant problems inthese systems and how fire may be used in controlefforts. As always, a major objective of theseconferences was to facilitate interaction betweenscientists and land managers to the end of applicationof research-based knowledge on fire-managed workinglandscapes. There were 37 oral and 19 posterpresentations during the conference, and 166participants from 27 states and 7 countries.
CONTENTSAcknowledgments . . . . . . . . . . . . . . . . . . . . . . . . . . . . . . . . . . . . . . . . . . . . . . . . . . . . . . . . . . . . . . . . . . . . . . . . . . . . . ix
Preface . . . . . . . . . . . . . . . . . . . . . . . . . . . . . . . . . . . . . . . . . . . . . . . . . . . . . . . . . . . . . . . . . . . . . . . . . . . . . . . . . . . . . . . xRonald E. Masters
Seventh E.V. Komarek, Sr. Fire Ecology Lecturer: Winston S.W. Trollope . . . . . . . . . . . . . . . . . . . . . . . . . . . . 1Ronald E. Masters
Fire—A Key Factor in the Ecology and Management of African Grasslands and Savannas . . . . . . . . . . . . . 2Winston S.W. Trollope
A Contrast in Similarities: Fire and Plant Diversity in Grasslands of North America and WesternAustralia [abstract] . . . . . . . . . . . . . . . . . . . . . . . . . . . . . . . . . . . . . . . . . . . . . . . . . . . . . . . . . . . . . . . . . . . . . . . . . . . . . 15
Thomas B. Bragg
Are Lightning Fires Unnatural? A Comparison of Aboriginal and Lightning Ignition Rates in the UnitedStates . . . . . . . . . . . . . . . . . . . . . . . . . . . . . . . . . . . . . . . . . . . . . . . . . . . . . . . . . . . . . . . . . . . . . . . . . . . . . . . . . . . . . . . . 16
Charles E. Kay
Native American Fire Patterns in Yosemite Valley: A Cross-Disciplinary Study . . . . . . . . . . . . . . . . . . . . . . . 29Linn Gassaway
The Historic Fire Regime on the Edge of the Prairie: A Case Study from the Cross Timbers ofOklahoma . . . . . . . . . . . . . . . . . . . . . . . . . . . . . . . . . . . . . . . . . . . . . . . . . . . . . . . . . . . . . . . . . . . . . . . . . . . . . . . . . . . . . 40
Stacy L. Clark, Stephen W. Hallgren, David M. Engle, and David W. Stahle
Landscape Characteristics of Sagebrush-Steppe/Juniper Woodland Mosaics under Various ModeledPrescribed Fire Regimes . . . . . . . . . . . . . . . . . . . . . . . . . . . . . . . . . . . . . . . . . . . . . . . . . . . . . . . . . . . . . . . . . . . . . . . . 50
Stephen C. Bunting, Eva K. Strand, and James L. Kingery
Fire in Oak Woodlands: A General Land Office Perspective [abstract] . . . . . . . . . . . . . . . . . . . . . . . . . . . . . . . 58Tom Foti, David H. Jurney, and Tamara Hocut
Effects of Fire on Vegetation Dynamics in Tallgrass Prairie: 30 Years of Research at the Konza PrairieBiological Station [abstract] . . . . . . . . . . . . . . . . . . . . . . . . . . . . . . . . . . . . . . . . . . . . . . . . . . . . . . . . . . . . . . . . . . . . . 59
David C. Hartnett
Fire-Induced Changes in Soil Nitrogen and Carbon Dynamics in Tallgrass Prairie [abstract] . . . . . . . . . . . . 60John M. Blair, Loretta C. Johnson, and Alan K. Knapp
First-Year Response to Summer Fire and Post-Fire Grazing Effects in Northern Mixed Prairie [abstract] 61Jessica L. Rose, Lance T. Vermeire, and David B. Wester
Effects of Seasonal Fires on the Temporal Stability of Herbaceous Production in a Mesquite-EncroachedGrassland [abstract] . . . . . . . . . . . . . . . . . . . . . . . . . . . . . . . . . . . . . . . . . . . . . . . . . . . . . . . . . . . . . . . . . . . . . . . . . . . . 62
Michael J. Castellano and R. James Ansley
Effects of Summer Fires on Woody, Succulent, and Graminoid Vegetation in Southern Mixed-PrairieEcosystems: A Review . . . . . . . . . . . . . . . . . . . . . . . . . . . . . . . . . . . . . . . . . . . . . . . . . . . . . . . . . . . . . . . . . . . . . . . . . 63
R. James Ansley and Michael J. Castellano
Effects of Dormant-Season Fire at Three Different Fire Frequencies in Shortgrass Steppe of the SouthernGreat Plains [abstract] . . . . . . . . . . . . . . . . . . . . . . . . . . . . . . . . . . . . . . . . . . . . . . . . . . . . . . . . . . . . . . . . . . . . . . . . . . 71
Paulette L. Ford and Carleton S. White
Fire Ecology of Woody Plant Populations in Ungrazed Tallgrass Prairie: Effects of Season of Fire onDemography, Abundance, and Regeneration [abstract] . . . . . . . . . . . . . . . . . . . . . . . . . . . . . . . . . . . . . . . . . . . . . . 72
Kristy M. Hajny, David Hartnett, Gail Wilson, Ben Vanderweide, and Krysta Hougen
Restoring Barrens Shrublands: Decreasing Fire Hazard and Improving Rare Plant Habitat . . . . . . . . . . . . . . 73William A. Patterson III and Gretel L. Clarke
Prescribed Burning Reduces Competition and Improves Germination of Two Rare Plants in Washington[abstract] . . . . . . . . . . . . . . . . . . . . . . . . . . . . . . . . . . . . . . . . . . . . . . . . . . . . . . . . . . . . . . . . . . . . . . . . . . . . . . . . . . . . . 83
Richy J. Harrod and Charles B. Halpern
Using Models to Assess Fire Regime Conditions and Develop Restoration Strategies in GrasslandSystems at Landscape and Global Scales [abstract] . . . . . . . . . . . . . . . . . . . . . . . . . . . . . . . . . . . . . . . . . . . . . . . . 84
Ayn J. Shlisky, S. Hickey, and T.B. Bragg
Assessing Multiple Processes, Including Fire, for a Regional Assessment of Grasslands and ShrublandsBased On NRCS Ecological Sites Framework [abstract] . . . . . . . . . . . . . . . . . . . . . . . . . . . . . . . . . . . . . . . . . . . . 85
Joanna Bate, Steven Yanoff, Patrick McCarthy, and Anne Bradley
Fire and Resource Availability Influence Carbon and Water Relations of the C3 Shrub RoughleafDogwood in a Mesic Grassland . . . . . . . . . . . . . . . . . . . . . . . . . . . . . . . . . . . . . . . . . . . . . . . . . . . . . . . . . . . . . . . . . 86
Jana L. Heisler, Alan K. Knapp, and J.M. Briggs
Impact of Fire on Soil Resource Patterns in a Northern California Montane Ecosystem . . . . . . . . . . . . . . . . 94Jessica R. Miesel, Carl N. Skinner, and Ralph E.J. Boerner
Response of Four Lake Wales Ridge Sandhill Species to Reintroduction of Prescribed Fire with andwithout Mechanical Pre-Treatment [abstract] . . . . . . . . . . . . . . . . . . . . . . . . . . . . . . . . . . . . . . . . . . . . . . . . . . . . . . 103
Carl W. Weekley, Eric S. Menges, and Marcia A. Rickey
Effects of Mechanical Treatments and Fire on Litter Reduction in Florida Scrub and Sandhill . . . . . . . . . . 104Marcia A. Rickey, Eric S. Menges, and Carl W. Weekley
A Comparison of Native versus Old-Field Vegetation in Upland Pinelands Managed With Frequent Fire,South Georgia, USA . . . . . . . . . . . . . . . . . . . . . . . . . . . . . . . . . . . . . . . . . . . . . . . . . . . . . . . . . . . . . . . . . . . . . . . . . . . 109
Thomas E. Ostertag and Kevin M. Robertson
Effects of Prescribed Burning Frequency on Avian Communities in Longleaf Pine Forests in WesternLouisiana . . . . . . . . . . . . . . . . . . . . . . . . . . . . . . . . . . . . . . . . . . . . . . . . . . . . . . . . . . . . . . . . . . . . . . . . . . . . . . . . . . . . . 121
R. Montague Whiting, Jr., Michael S. Fountain, and Kenneth J. Laterza
Characterizing Mechanical and Prescribed Fire Treatments Following Clear-Cutting of Jack Pine andShort-Term Treatment Effects on Insect Communities . . . . . . . . . . . . . . . . . . . . . . . . . . . . . . . . . . . . . . . . . . . . . . 129
Ryan D. DeSantis and Andrew J. Storer
An Ecosystem Approach to Determining Effects of Prescribed Fire on Southwestern Borderlands OakSavannas: A Baseline Study . . . . . . . . . . . . . . . . . . . . . . . . . . . . . . . . . . . . . . . . . . . . . . . . . . . . . . . . . . . . . . . . . . . . 140
Gerald J. Gottfried, Daniel G. Neary, and Peter F. Ffolliott
Vegetation Responses to Seeding and Fertilization Treatments after Wildfire in North-Central WashingtonState [abstract] . . . . . . . . . . . . . . . . . . . . . . . . . . . . . . . . . . . . . . . . . . . . . . . . . . . . . . . . . . . . . . . . . . . . . . . . . . . . . . . . 147
David W. Peterson
Management Challenges and Opportunities Related to Prairie Grouse; A Pictorial Overview [abstract] . . . 148Steve K. Sherrod
Lekking and Nesting Response of the Greater Prairie-Chicken to Burning of Tallgrass Prairie . . . . . . . . . . . 149Michael A. Patten, Eyal Shochat, Donald H. Wolfe, and Steve K. Sherrod
Fire Effects on Lesser Prairie-Chicken Habitat [abstract] . . . . . . . . . . . . . . . . . . . . . . . . . . . . . . . . . . . . . . . . . . . 156Terrence G. Bidwell and Chad S. Boyd
Restoring the Fire–Grazing Interaction for Grassland Conservation and Management [abstract] . . . . . . . . . . 157Samuel D. Fuhlendorf and David M. Engle
Patch Burning as a Heterogeneity Approach to Rangeland Management . . . . . . . . . . . . . . . . . . . . . . . . . . . . . . 158Jay D. Kerby, David M. Engle, Samuel D. Fuhlendorf, David L. Nofziger, and Terrence G. Bidwell
Restoring Heterogeneity on the Tallgrass Prairie Preserve: Applying the Fire–Grazing InteractionModel . . . . . . . . . . . . . . . . . . . . . . . . . . . . . . . . . . . . . . . . . . . . . . . . . . . . . . . . . . . . . . . . . . . . . . . . . . . . . . . . . . . . . . . . 163
Robert G. Hamilton
Comparison of BEHAVE: Fire Behavior Prediction and Fuel Modeling System Predictions withObserved Fire Behavior Varying by Season and Frequency . . . . . . . . . . . . . . . . . . . . . . . . . . . . . . . . . . . . . . . . . 170
Jeffrey C. Sparks, Ronald E. Masters, David M. Engle, George A. Bukenhofer, and Mark E. Payton
Effects of Land Use on Fuel Characteristics and Fire Behavior in Pinelands of Southwest Georgia . . . . . . 181Kevin M. Robertson and Thomas E. Ostertag
Spatial Variation of Fire Effects within a Juniperus–Quercus Savanna [abstract] . . . . . . . . . . . . . . . . . . . . . . . 192Dirac Twidwell, Sam Fuhlendorf, Dave Engle, and Butch Taylor
The Effect of Thinning and Aspect on Fire Behavior in the Missouri Ozarks of the Central HardwoodRegion . . . . . . . . . . . . . . . . . . . . . . . . . . . . . . . . . . . . . . . . . . . . . . . . . . . . . . . . . . . . . . . . . . . . . . . . . . . . . . . . . . . . . . . 193
Jeremy Kolaks, Bruce E. Cutter, Edward F. Loewenstein, George W. Hartman, and John M. Kabrick
Testing Mutch’s Hypothesis in Southeast Queensland: Plant Flammability Revisited [abstract] . . . . . . . . . . 202Cuong Tran, Clyde Wild, and Tatia Zubrinich
Fuel Bed Characteristics and Fire Behavior in Catbrier Shrublands . . . . . . . . . . . . . . . . . . . . . . . . . . . . . . . . . . 203Michael C. Ohman, William A. Patterson III, and Julie A. Richburg
Fire Behavior Aspects Associated With Linear Disturbances in Alberta, Canada . . . . . . . . . . . . . . . . . . . . . . . 210Greg Baxter
Quantifying Fire Behavior versus Societal Benefits of Southern California Shrublands and Grasslands . . . 214Christopher A. Dicus and Maurica A. Zimmerman
Comparison of Live Fuel Moisture Sampling Methods for Big Sagebrush in Utah [abstract] . . . . . . . . . . . . 221Annie Brown, Philip N. Omi, and Jolie Pollet
Monitoring Fire Effects in Grasslands on National Park Units of the Northern Great Plains [abstract] . . . . 222Andy Thorstenson and Cody L. Wienk
Analysis of Fuel Variability within the Rocky Mountain Region: Integration of Field Data, GeospatialInformation, and Spatial Statistics [abstract] . . . . . . . . . . . . . . . . . . . . . . . . . . . . . . . . . . . . . . . . . . . . . . . . . . . . . . . 223
Mohammed A. Kalkhan and Karl E. Brown
New Tools for Assessing Landscape Scale of Vegetation and Wildfire Hazards: A Case Study from theRocky Mountain Regions [abstract] . . . . . . . . . . . . . . . . . . . . . . . . . . . . . . . . . . . . . . . . . . . . . . . . . . . . . . . . . . . . . . 224
Mohammed A. Kalkhan
Ecological Diversity in Chaparral Following Prescribed Fire and Mastication Treatments [abstract] . . . . . . 225Jennifer Potts and Scott Stephens
Fire Effects on the Structure of Woody Vegetation of Cerrado Denso, a Savanna-Like Vegetation ofCentral Brazil [abstract] . . . . . . . . . . . . . . . . . . . . . . . . . . . . . . . . . . . . . . . . . . . . . . . . . . . . . . . . . . . . . . . . . . . . . . . . 226
Margarete Naomi Sato, Heloısa Sinatora Miranda, and Philip J. Riggan
Nonnative Invasive Plants and Fire: Literature Reviews and Knowledge Gaps [abstract] . . . . . . . . . . . . . . . . 227Gregory T. Munger, Kris Zouhar, and Jane Kapler Smith
Modifying National Park Service Fire Effects Sampling Protocols to Meet the Needs of the Fire Ecology,Inventory and Monitoring, and Exotic Plant Management Programs [abstract] . . . . . . . . . . . . . . . . . . . . . . . . . 228
Cody L. Wienk, Amy J. Symstad, Andy Thorstenson, Dan Licht, and Chad W. Prosser
The Puu Anahulu Wildfire Management Study: Development of Roadside Fuels Reduction Techniquesfor Leeward Hawai‘i [abstract] . . . . . . . . . . . . . . . . . . . . . . . . . . . . . . . . . . . . . . . . . . . . . . . . . . . . . . . . . . . . . . . . . . 229
J. Michael Castillo, Miles Nakahara, David Weise, Robert Vihnanek, Gayland Enriques, AmandaMcAdams, Lawrence Ford, Rod Moraga, Bruce Babb, Mark Thorne, Edith Nonner, and DanielleFrohlich
Effects of Cattle Grazing, Glyphosate, and Prescribed Burning on Fountaingrass Fuel Loading inHawai‘i . . . . . . . . . . . . . . . . . . . . . . . . . . . . . . . . . . . . . . . . . . . . . . . . . . . . . . . . . . . . . . . . . . . . . . . . . . . . . . . . . . . . . . . 230
J. Michael Castillo, Gayland Enriques, Miles Nakahara, David Weise, Lawrence Ford, Rodrigo Mor-aga, and Robert Vihnanek
Use of Prescribed Fire and Cattle Grazing to Control Guineagrass . . . . . . . . . . . . . . . . . . . . . . . . . . . . . . . . . . . 240Luis Enrique Ramirez-Yanez, J. Alfonso Ortega-S., Leonard A. Brennan, and George A. Rasmussen
The Response of Old World Bluestem to Mid- and Late-Summer Fire in Two Grassland Ecoregions inCentral Texas . . . . . . . . . . . . . . . . . . . . . . . . . . . . . . . . . . . . . . . . . . . . . . . . . . . . . . . . . . . . . . . . . . . . . . . . . . . . . . . . . 246
Mark T. Simmons, Steve Windhager, Paula Power, Jason Lott, Robert K. Lyons, and Carl Schwope
The Rehabilitation of Native Vegetation Communities in an Urban Shrubland Setting: The Role ofControlled Fire Regimes [abstract] . . . . . . . . . . . . . . . . . . . . . . . . . . . . . . . . . . . . . . . . . . . . . . . . . . . . . . . . . . . . . . . 251
Ian Batterley
Relationships between Fire, Soil Water, and Invasion of Semiarid Shrubland by an Exotic Forb[abstract] . . . . . . . . . . . . . . . . . . . . . . . . . . . . . . . . . . . . . . . . . . . . . . . . . . . . . . . . . . . . . . . . . . . . . . . . . . . . . . . . . . . . . 252
Matthew Germino, Judson Hill, Jonathan Horton, and Steven Seefeldt
Fire Learning Network in the Arkansas Blackland Ecosystem [abstract] . . . . . . . . . . . . . . . . . . . . . . . . . . . . . . 253Maria Melnechuk, McRee Anderson, and Mark Clark
Southern Fire Portal: An Internet-Based Portal for Fire Science and Management in the Southern Region[abstract] . . . . . . . . . . . . . . . . . . . . . . . . . . . . . . . . . . . . . . . . . . . . . . . . . . . . . . . . . . . . . . . . . . . . . . . . . . . . . . . . . . . . . 254
Penelope Morgan, Cynthia Fowler, Deborah Kennard, J. Kevin Hiers, Ronald E. Masters, JenniferPollack, Greg Gollberg, and Ann M. Bruce
Southeast Fire Ecology Partnership [abstract] . . . . . . . . . . . . . . . . . . . . . . . . . . . . . . . . . . . . . . . . . . . . . . . . . . . . . 255Caroline L. Noble, Bruce Davenport, David Brownlie, Paula Seamon, Ronald E. Masters, and KevinRobertson
Got Trust? Nationwide Survey Results Concerning Public Trust in Government Fuels and FireManagement, and Preferences Regarding Fuels Reduction Methods [abstract] . . . . . . . . . . . . . . . . . . . . . . . . . 256
Sandra Rideout-Hanzak, J.M. Bowker, Siew-Hoon Lim, H. Ken Cordell, Gary T. Green, CassandraY. Johnson, and Carter J. Betz
Conference Participants . . . . . . . . . . . . . . . . . . . . . . . . . . . . . . . . . . . . . . . . . . . . . . . . . . . . . . . . . . . . . . . . . . . . . . . . . 257
List of Reviewers . . . . . . . . . . . . . . . . . . . . . . . . . . . . . . . . . . . . . . . . . . . . . . . . . . . . . . . . . . . . . . . . . . . . . . . . . . . . . . 261
Tall Timbers Research StationFire Ecology Conference Proceedings Publications
The following is a list of Timber Timbers Fire Ecology Conference Proceedings offered for sale. Postage andhandling must be added to all purchases. Bulk rates are available for purchasing 10 or more of the same title.Tall Timbers members receive a 10% discount on the publication price. Florida sales tax of 7.5% is duefrom Florida residents and institutions, unless a tax-exempt certificate is held.
Please visit the Tall Timbers Research Station website at www.talltimbers.org
Quantityordered
Order# Title Price
Totalprice
FC23 Proceedings 23rd Tall Timbers Fire Ecology Conference. Fire in Grassland & ShrublandEcosystems. Ronald E. Masters and Krista E.M. Galley, Editors. 2007. 261 p.
$30.00
FC22 Proceedings 22nd Tall Timbers Fire Ecology Conference. Fire in Temperate, Boreal, andMontane Ecosystems. R. Todd Engstrom, Krista E.M. Galley, and William J. de Groot, Editors.2004. 333 p.
$25.00
FC21 Proceedings 21st Tall Timbers Fire Ecology Conference. Fire and Forest Ecology: InnovativeSilviculture & Vegetation Management. W. Keith Moser and Cynthia F. Moser, Editors. 2000.225 p.
$25.00
FC20 Proceedings 20th Tall Timbers Fire Ecology Conference. Fire in Ecosystem Management:Shifting the Paradigm from Suppression to Prescription. Teresa L. Pruden and Leonard A. Bren-nan, Editors. 1998. 459 p.
$30.00
FC19 Proceedings 19th Tall Timbers Fire Ecology Conference. Fire in Wetlands: A ManagementPerspective. Susan I. Cerulean and R. Todd Engstrom, Editors. 1995. 175 p.
$20.00
FC18 Proceedings 18th Tall Timbers Fire Ecology Conference. The Longleaf Pine Ecosystem: Ecol-ogy, Restoration and Management. Sharon M. Hermann, Editor. 1993. 418 p.
$20.00
FC17 Proceedings 17th Tall Timbers Fire Ecology Conference. High-intensity Fire in Wildlands:Management Challenges and Options. Sharon M. Hermann, Editor. 1991. 435 p.
$15.00
FC16 Proceedings 16th Tall Timbers Ecology and Management Conference. The Role of the Plan-tation in Southern Agriculture. E.V. Komarek, Sr., Conference Chairman. 1979. 206 p.
$15.00
FCIdx Index to the Proceedings of the Tall Timbers Fire Ecology Conferences, Numbers 1–15,1962–1976. William C. Fischer. Reprint of USDA Forest Service General Technical Report INT-87. 140 p.
$5.00
FC15 Proceedings 15th Tall Timbers Fire Ecology Conference. Pacific Northwest. E.V. Komarek,Sr., General Chairman. 1974. 279 p.
$15.00
FC14 Proceedings 14th Tall Timbers Fire Ecology Conference. Fire and Land Management Sym-posium. E.V. Komarek, Sr., General Chairman. 1974. 675 p. [photocopy]
$15.00
FC13 Proceedings 13th Tall Timbers Fire Ecology Conference. A Quest for Ecological Understand-ing. E.V. Komarek, Sr., Conference Chairman. 1973. 521 p.
$15.00
FC12 Proceedings 12th Tall Timbers Fire Ecology Conference. A Quest for Ecological Understand-ing. E.V. Komarek, Sr., Conference Chairman. 1972. 492 p.
$15.00
FC11 Proceedings 11th Tall Timbers Fire Ecology Conference. Fire in Africa. E.V. Komarek, Sr.,Conference Chairman. 1971. 516 p.
$15.00
FC10 Proceedings 10th Tall Timbers Fire Ecology Conference. A Quest for Ecological Understand-ing. E.V. Komarek, Sr., Conference Chairman. 1970. 336 p. [photocopy]
$15.00
FC9 Proceedings 9th Tall Timbers Fire Ecology Conference. E.V. Komarek, Sr., Conference Chair-man. 1969. 292 p. [photocopy]
$15.00
FC8 Proceedings 8th Tall Timbers Fire Ecology Conference. E.V. Komarek, Sr., Conference Chair-man. 1968. 283 p.
$15.00
FC7 Proceedings 7th Tall Timbers Fire Ecology Conference. E.V. Komarek, Sr., Conference Chair-man. 1967. 258 p.
$15.00
FC6 Proceedings 6th Tall Timbers Fire Ecology Conference. E.V. Komarek, Sr., Conference Chair-man. 1967. 212 p.
$15.00
FC5 Proceedings 5th Tall Timbers Fire Ecology Conference. E.V. Komarek, Sr., Conference Chair-man. 1966. 208 p.
$15.00
FC4 Proceedings 4th Tall Timbers Fire Ecology Conference. E.V. Komarek, Sr., Conference Chair-man. 1965. 279 p.
$15.00
FC3 Proceedings 3rd Tall Timbers Fire Ecology Conference. E.V. Komarek, Sr., Conference Chair-man. 1964. 187 p.
$15.00
FC2 Proceedings 2nd Tall Timbers Fire Ecology Conference. E.V. Komarek, Sr., Conference Chair-man. 1963. 192 p.
$15.00
FC1 Proceedings 1st Tall Timbers Fire Ecology Conference. E.V. Komarek, Sr., Conference Chair-man. 1962. 186 p. [photocopy]
$15.00
We encourage customers to photocopy this form or print it from www.talltimbers.org

1
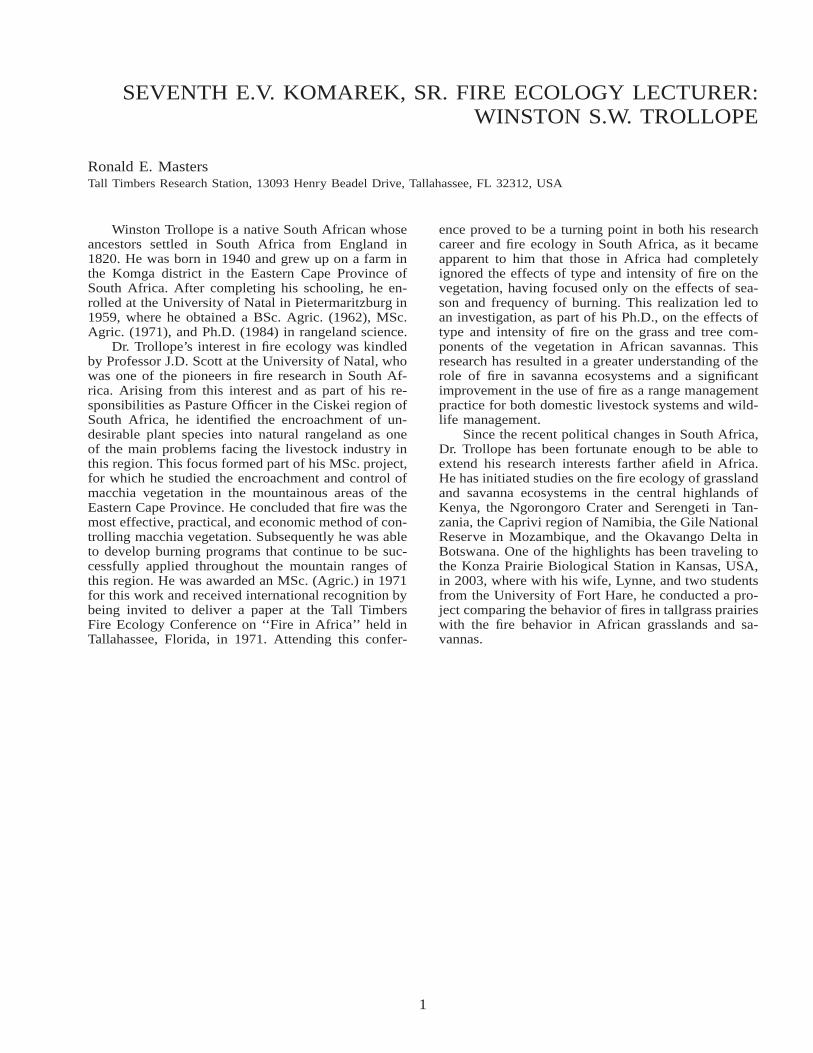
SEVENTH E.V. KOMAREK, SR. FIRE ECOLOGY LECTURER:WINSTON S.W. TROLLOPE
Ronald E. MastersTall Timbers Research Station, 13093 Henry Beadel Drive, Tallahassee, FL 32312, USA
Winston Trollope is a native South African whoseancestors settled in South Africa from England in1820. He was born in 1940 and grew up on a farm inthe Komga district in the Eastern Cape Province ofSouth Africa. After completing his schooling, he en-rolled at the University of Natal in Pietermaritzburg in1959, where he obtained a BSc. Agric. (1962), MSc.Agric. (1971), and Ph.D. (1984) in rangeland science.
Dr. Trollope’s interest in fire ecology was kindledby Professor J.D. Scott at the University of Natal, whowas one of the pioneers in fire research in South Af-rica. Arising from this interest and as part of his re-sponsibilities as Pasture Officer in the Ciskei region ofSouth Africa, he identified the encroachment of un-desirable plant species into natural rangeland as oneof the main problems facing the livestock industry inthis region. This focus formed part of his MSc. project,for which he studied the encroachment and control ofmacchia vegetation in the mountainous areas of theEastern Cape Province. He concluded that fire was themost effective, practical, and economic method of con-trolling macchia vegetation. Subsequently he was ableto develop burning programs that continue to be suc-cessfully applied throughout the mountain ranges ofthis region. He was awarded an MSc. (Agric.) in 1971for this work and received international recognition bybeing invited to deliver a paper at the Tall TimbersFire Ecology Conference on ‘‘Fire in Africa’’ held inTallahassee, Florida, in 1971. Attending this confer-
ence proved to be a turning point in both his researchcareer and fire ecology in South Africa, as it becameapparent to him that those in Africa had completelyignored the effects of type and intensity of fire on thevegetation, having focused only on the effects of sea-son and frequency of burning. This realization led toan investigation, as part of his Ph.D., on the effects oftype and intensity of fire on the grass and tree com-ponents of the vegetation in African savannas. Thisresearch has resulted in a greater understanding of therole of fire in savanna ecosystems and a significantimprovement in the use of fire as a range managementpractice for both domestic livestock systems and wild-life management.
Since the recent political changes in South Africa,Dr. Trollope has been fortunate enough to be able toextend his research interests farther afield in Africa.He has initiated studies on the fire ecology of grasslandand savanna ecosystems in the central highlands ofKenya, the Ngorongoro Crater and Serengeti in Tan-zania, the Caprivi region of Namibia, the Gile NationalReserve in Mozambique, and the Okavango Delta inBotswana. One of the highlights has been traveling tothe Konza Prairie Biological Station in Kansas, USA,in 2003, where with his wife, Lynne, and two studentsfrom the University of Fort Hare, he conducted a pro-ject comparing the behavior of fires in tallgrass prairieswith the fire behavior in African grasslands and sa-vannas.
2
SEVENTH E.V. KOMAREK, SR. MEMORIALFIRE ECOLOGY LECTURE
FIRE—A KEY FACTOR IN THE ECOLOGY ANDMANAGEMENT OF AFRICAN GRASSLANDS AND SAVANNAS
Winston S.W. Trollope1
University of Fort Hare, Private Bag X1314, Alice 5700, South Africa
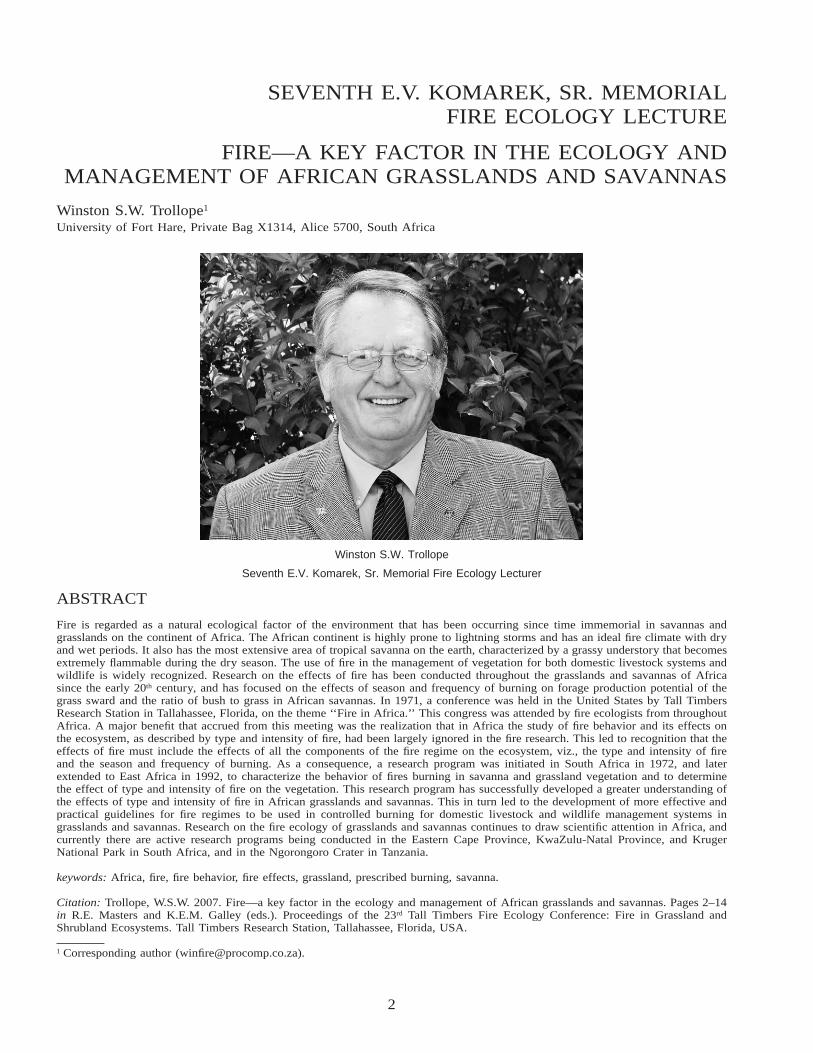
Winston S.W. Trollope
Seventh E.V. Komarek, Sr. Memorial Fire Ecology Lecturer
ABSTRACT
Fire is regarded as a natural ecological factor of the environment that has been occurring since time immemorial in savannas andgrasslands on the continent of Africa. The African continent is highly prone to lightning storms and has an ideal fire climate with dryand wet periods. It also has the most extensive area of tropical savanna on the earth, characterized by a grassy understory that becomesextremely flammable during the dry season. The use of fire in the management of vegetation for both domestic livestock systems andwildlife is widely recognized. Research on the effects of fire has been conducted throughout the grasslands and savannas of Africasince the early 20th century, and has focused on the effects of season and frequency of burning on forage production potential of thegrass sward and the ratio of bush to grass in African savannas. In 1971, a conference was held in the United States by Tall TimbersResearch Station in Tallahassee, Florida, on the theme ‘‘Fire in Africa.’’ This congress was attended by fire ecologists from throughoutAfrica. A major benefit that accrued from this meeting was the realization that in Africa the study of fire behavior and its effects onthe ecosystem, as described by type and intensity of fire, had been largely ignored in the fire research. This led to recognition that theeffects of fire must include the effects of all the components of the fire regime on the ecosystem, viz., the type and intensity of fireand the season and frequency of burning. As a consequence, a research program was initiated in South Africa in 1972, and laterextended to East Africa in 1992, to characterize the behavior of fires burning in savanna and grassland vegetation and to determinethe effect of type and intensity of fire on the vegetation. This research program has successfully developed a greater understanding ofthe effects of type and intensity of fire in African grasslands and savannas. This in turn led to the development of more effective andpractical guidelines for fire regimes to be used in controlled burning for domestic livestock and wildlife management systems ingrasslands and savannas. Research on the fire ecology of grasslands and savannas continues to draw scientific attention in Africa, andcurrently there are active research programs being conducted in the Eastern Cape Province, KwaZulu-Natal Province, and KrugerNational Park in South Africa, and in the Ngorongoro Crater in Tanzania.
keywords: Africa, fire, fire behavior, fire effects, grassland, prescribed burning, savanna.
Citation: Trollope, W.S.W. 2007. Fire—a key factor in the ecology and management of African grasslands and savannas. Pages 2–14in R.E. Masters and K.E.M. Galley (eds.). Proceedings of the 23rd Tall Timbers Fire Ecology Conference: Fire in Grassland andShrubland Ecosystems. Tall Timbers Research Station, Tallahassee, Florida, USA.
1 Corresponding author ([email protected]).
3FIRE IN AFRICAN GRASSLANDS AND SAVANNAS
INTRODUCTION
Fire is regarded as a natural ecological factor ofthe environment in Africa that has been occurringsince time immemorial. It is estimated that human be-ings have used fire for more than 1 million y, and inAfrica has extended grasslands and savannas at theexpense of evergreen forests (Bond and van Wilgen1996). The continent of Africa is highly prone to light-ning storms and has an ideal fire climate comprisingdry and wet periods. It also has the most extensivearea of tropical savanna on the earth, characterized bya grassy understory that becomes extremely flammableduring the dry season (Komarek 1971). The use of firein the management of vegetation for both domesticlivestock systems and wildlife management is widelyrecognized. Research on the effects of fire has beenconducted throughout the grassland and savanna areasof Africa since the early 20th century (West 1965) andfocused on the effects of season and frequency ofburning on forage production potential of the grasssward and the ratio of bush to grass in African savan-nas. However, in 1971 a conference was convened byTall Timbers Research Station in Tallahassee, Florida,with the theme ‘‘Fire in Africa.’’ This congress wasattended by fire ecologists from throughout Africa. Amajor benefit that accrued from this meeting was therealization that in Africa the study of fire behavior andits effects on the ecosystem, as described by type andintensity of fire, had been largely ignored up until thattime. This was a turning point in research on the fireecology of African grasslands and savannas and led tothe further recognition that the effects of fire must in-clude the effects of all the components of the fire re-gime on the ecosystem, viz., the type and intensity offire and the season and frequency of burning. As aresult, a research program was initiated in South Africain 1972 (Trollope 1978, Trollope and Potgieter 1985),and later extended to East Africa in 1992 (Trollopeand Trollope 1999), to characterize fire behavior insavanna and grassland vegetation and to determine theeffect of type and intensity of fire on vegetation. Thisresearch program has successfully developed a greaterunderstanding of the influence of fire type and inten-sity in African grasslands and savannas (Trollope1984, Trollope and Tainton 1986, Trollope and Trol-lope 1999, de Ronde et al. 2004). This led to the de-velopment of more effective and practical guidelinesfor fire regimes to be used in controlled burning fordomestic livestock and wildlife management systemsin grassland and savanna areas. Research on the fireecology of grasslands and savannas continues to enjoyscientific attention in Africa, and currently the authoris associated with active research programs in EasternCape Province, KwaZulu-Natal Province, and KrugerNational Park in South Africa, and in the NgorongoroCrater in Tanzania.
This paper presents an overview of the beneficialand significant effects that the 11th Tall Timbers FireEcology Conference (Tallahassee, Florida; 22–23April 1971) has had on a greater understanding of theeffects and use of fire in African grasslands and sa-
vannas. It is also a tribute to the vision and foresightthat E.V. Komarek, Sr. had into the ecology of fire-dependent ecosystems and his willingness and passionto share his knowledge with society in general and inparticular with communities reliant on the ecologicalwell-being of African grasslands and savannas.
FIRE BEHAVIORThe effect of fire on natural ecosystems involves
the response of living organisms to the release of heatenergy through the combustion of plant material. Themanner in which and the factors that influence releaseof heat energy involve the study of fire behavior. Firebehavior is defined as the release of heat energy duringcombustion as described by fire intensity, rate ofspread of the fire front, flame characteristics, and otherrelated phenomena (Trollope 1981). In Africa there isa serious deficiency of knowledge concerning fire be-havior, and limited efforts have been made to quantifythe factors that influence fire behavior. Also, no atten-tion has been paid to the dynamics of heat energy re-lease and its subsequent effect on the ecosystem. Ba-sically, the effect of fire on plants depends upon theamount of heat energy released, rate of release, andvertical level at which heat energy is released. Thedetermination of such relationships helps clarify manyof the apparently inexplicable effects of fire often citedin the literature. The following fire behavior parame-ters have been developed and identified that quantita-tively describe fire behavior and its effects on savannaand grassland vegetation.
Available Heat Energy
The total amount of heat energy contained per unitmass of fuel is called the heat of combustion, but notall this total potential heat energy is released during afire because some heat energy remains in unburnedplant material. The net heat energy released during afire is called the heat yield. Heat yield was determinedfor fine grass fuels in savannas in the Eastern CapeProvince, South Africa, and values of 16,890 and17,781 kJ/kg were obtained for grass fuels burning ashead- and backfires, respectively (Trollope 1983).These heat yields are similar to heat yields quoted andused in the United States and Australia (Albini 1976,Luke and McArthur 1978) and were subsequently usedfor estimating available heat energy in all fire behaviorstudies conducted in southern and East Africa. In prac-tice, the available heat energy is estimated as the plantfuel load available for combustion during a fire and isexpressed in kilograms per hectare or per square meter.
Rate of Heat Energy Release
Fire intensity refers to the rate at which heat en-ergy is released during a fire and is defined as therelease of heat energy per unit time per unit length offire front (kJ s�1 m�1; Byram 1959). Numerically, fireintensity is the product of the available heat energy,the rate of spread of the fire front, and the mass offuel consumed, which can be expressed as the equation
4 TROLLOPE
Table 1. The range of conditions under which controlled burnswere applied in the Eastern Cape Province and Kruger NationalPark, South Africa (Trollope 1983, Trollope and Potgieter 1985).Copyright � 2002 Millpress Science Publishers. From ForestFire Research & Wildland Fire Safety, by W.S.W. Trollope, L.A.Trollope, and D.C. Hartnett, ‘‘Fire behaviour a key factor in Af-rican grasslands and savannas.’’ Reprinted by permission ofMillpress Science Publishers and the authors.
Variable Mean Min. Max.
Fuel load (kg/ha) 3,847 1,152 10,500Fuel moisture (%) 32.1 7.5 68.8Air temperature (�C) 23.8 14.3 35.8Relative humidity (%) 36.6 4.2 82Wind speed (m/s) 2.6 0.3 6.7Fire intensity (kJ s�1 m�1) 2,566 136 12,912
Table 2. Effects of fuel load, fuel moisture, relative humidity,and wind speed on fire intensity (n � 200).
Independentvariable
Transfor-mation
Coefficientof determi-
nation(R 2)
Effect(%) Significance
Fuel load x 0.427 42.7 P � 0.01Fuel moisture �x 0.574 14.7 P � 0.01Relative humidity x 2 0.584 1.0 P � 0.02Wind speed 1/x 0.600 1.6 P � 0.02Total 60.0
I � Hwr,
where I � fire intensity (kJ s�1 m�1), H � heat yield(kJ/kg), w � mass of fuel consumed (kg/m2), and r �rate of spread of the fire front (m/s).
Albini (1976) stated that Byram’s description anddefinition of fire intensity has proved to be very usefulin fire behavior studies and quotes van Wagner (1973),who found that fire intensity was significantly corre-lated with the height of lethal scorching of coniferoustree crowns. Research in the Eastern Cape Provinceand Kruger National Park, South Africa, supports thisview, as fire intensity had a highly significant positiveeffect on the top-kill of stems and branches of treesand shrubs in these two areas (Trollope and Tainton1986, Trollope 1999).
Vertical Distribution of Heat Energy
A reliable indicator of the vertical distribution ofheat energy released during a fire is the perpendicularheight of the flames from ground level, i.e., flameheight. Research in the Eastern Cape Province hasshown that flame height has a significantly positiveeffect on the top-kill of stems and branches of trees atincreasing height levels (Trollope 1983).
Factors Influencing Fire Behavior
Subsequent research showed that fire intensity andflame height were significantly correlated and both hadsignificant effects on vegetation. Research also showedthat fire intensity can best be used for describing thegeneral behavior of fires and their effects on vegeta-tion; consequently, this parameter was focused on inmodeling the behavior of fires and their effects on veg-etation. Factors influencing fire behavior were inves-tigated in terms of those variables that need to be con-sidered when applying controlled burns as a rangemanagement practice: fuel load, fuel moisture, relativehumidity, air temperature, wind speed, and slope(Brown and Davis 1973, Luke and McArthur 1978,Cheney 1981, Leigh and Noble 1981, Shea et al. 1981,Wright and Bailey 1982). The effect of these variableson fire intensity were investigated in the Eastern CapeProvince and Kruger National Park (Trollope 1978,Trollope 1983, Trollope and Potgieter 1985), where
235 controlled burns were applied to areas rangingfrom 0.2 to 7 ha. The range of conditions under whichthe controlled burns were applied is presented in Ta-ble 1.
The influence of these environmental variables onfire behavior was determined by multiple regressionanalysis of data recorded during controlled burnswhere fuel load, fuel moisture, relative humidity, andwind speed were independent variables and were re-gressed against fire intensity as the dependent variable.Air temperature was not included in the analysis be-cause of correlation with relative humidity, thereby notfulfilling the criteria of independence. The effect ofslope was not considered because all burns were ap-plied to relatively flat terrain.
All the independent variables had a statisticallysignificant effect and accounted for 60% of the vari-ation in fire intensity (Table 2). Fuel load and fuelmoisture influenced fire intensity to the greatest extent,whereas relative humidity and wind speed had a sig-nificant but far smaller effect. The resulting multipleregression equation for predicting fire intensity is
FI � 2,729 � 0.8684x1 � 530�x2 � 0.1907x23
� 596(1/x4),
where FI � fire intensity (kJ s�1 m�1), x1 � fuel load(kg/ha), x2 � fuel moisture (%), x3 � relative humidity(%), and x4 � wind speed (m/s). The regression equa-tion is based on the following statistics: number ofcases � 200, multiple correlation coefficient (R) �0.775 (P � 0.01), and coefficient of determination (R2)� 0.600.
The model was tested with independent fire be-havior data and found to be highly significant (r �0.749, df � 33, P � 0.01) and accounted for 56% ofthe variation in fire intensity. By normal statisticalstandards, this coefficient of determination is ratherlow, and generally regression equations are used forpredictive purposes only when the coefficient of de-termination accounts for at least 95% of the variationin the dependent variable. However, experience gainedduring this research suggests that it is virtually impos-sible to attain these levels of precision when modelingsuch a complex and inherently variable phenomenonas fire behavior; subsequent experience with this mod-el showed that it provided adequate precision for for-mulating practical guidelines for controlled burning ingrasslands and savannas both in southern and East Af-rica.
5FIRE IN AFRICAN GRASSLANDS AND SAVANNAS
FIRE EFFECTSFire ecology refers to the response of the biotic
and abiotic components of an ecosystem to a fire re-gime. This would include type and intensity of fire andseason and frequency of burning (Trollope et al. 1990).Following the 11th Tall Timbers Fire Ecology Congressin 1971, a research program was initiated in SouthAfrica in 1972 to determine the effect of all the com-ponents of the fire regime on vegetation, i.e., effectsof type and intensity of fire and season and frequencyof burn. Unfortunately, a similar research program wasnot known to be initiated elsewhere in Africa until1992. An overview follows of known effects of thefire regime on grass and bush vegetation in Africangrasslands and savannas, based largely on the resultsof this research program.
Type of Fire
The most common types of fire in grassland andsavanna areas are surface fires (Trollope 1983) burningeither as head- or backfires. Crown fires do occur insavannas, but only under extreme conditions. Gener-ally under these conditions they occur as passivecrown fires characterized by the ‘‘torching’’ of indi-vidual trees rather than as active crown fires that aresustained by more abundant and continuous aerial fu-els. Thus, type of fire determines the vertical level atwhich heat energy is released in relation to the locationof meristematic tissues.
Trollope (1978) investigated the effects of surfacefires, occurring as either head- or backfires, on thegrass sward in the arid savannas of the Eastern Cape.The results showed that backfires significantly (P �0.01) depressed regrowth of grass in comparison toheadfires because a critical threshold temperature ofapproximately 95�C was maintained for 20 s longerduring backfires than during headfires. Also, more heatwas released at ground level during backfires com-pared to during headfires; therefore, shoot apices ofthe grasses were more adversely affected by backfires.
Bush (i.e., woody, shrubby vegetation) is very sen-sitive to various types of fires because of differencesin the vertical distribution of heat energy release. Fieldobservations in Kruger National Park and in EasternCape Province indicate that crown and surface head-fires cause the highest amount of top-kill of stems andbranches compared to that of backfires. Unfortunately,there are only limited quantitative data to support theseobservations. Research results were obtained from aburning trial at the University of Fort Hare in the FalseThornveld of the Eastern Cape (arid savanna), wherea field-scale burn was applied to a 62-ha area to con-trol bush encroachment. The majority of the trial areawas ignited as a headfire, and results showed that thephytomass of bush was reduced by 75% in the areaburned as a headfire compared to 42% in the areaburned as a backfire. This happened because the flameheight of headfires can be up to 3 times greater thanthat of backfires, resulting in higher temperatures be-ing generated above ground level (Trollope 1978).Therefore, the aboveground growing points of these
plants, located in the canopies of trees and shrubs, aresubjected to greater heat loads and resultant damageduring headfires than during backfires. Similar resultswere obtained in the Scattered Tree Grassland (Aca-cia–Themeda [Edwards and Bogdan 1951]) range typein the Kenya central highlands where the effects ofhead- and backfires on the top-kill of savanna treesand shrubs bush were investigated (see figure 3 inTrollope et al. 2002).
Head- and backfires had significantly different ef-fects on top-kill of trees and shrubs, with headfiresgenerally causing a greater top-kill than backfires (seefigure 3 in Trollope et al. 2002). Initially both typesof fires resulted in a high top-kill of stems and branch-es when the bush was short, but as trees and shrubsincreased in height, backfires caused a lower top-killcompared to that of headfires. This trend became morepronounced with trees �2 m in height. Headfires gen-erate greater flame heights than backfires; therefore,fire-susceptible growing points of taller trees andshrubs are above the flaming zone of combustion dur-ing backfires compared to during headfires.
Fire Intensity
The effect of fire intensity on the recovery of thegrass sward after burning was investigated in arid sa-vannas of the Eastern Cape Province. After a series offires ranging in intensity from 925 to 3,326 kJ s�1 m�1
(cool to extremely intense fires), no differences weredetected in the recovery of the grass sward at the endof the first or second growing seasons after the burns(Trollope and Tainton 1986). Therefore, fire intensityhas little influence on the recovery of the grass swardafter a burn. This is a logical result because otherwiseintense fires would not favor development and main-tenance of grasslands.
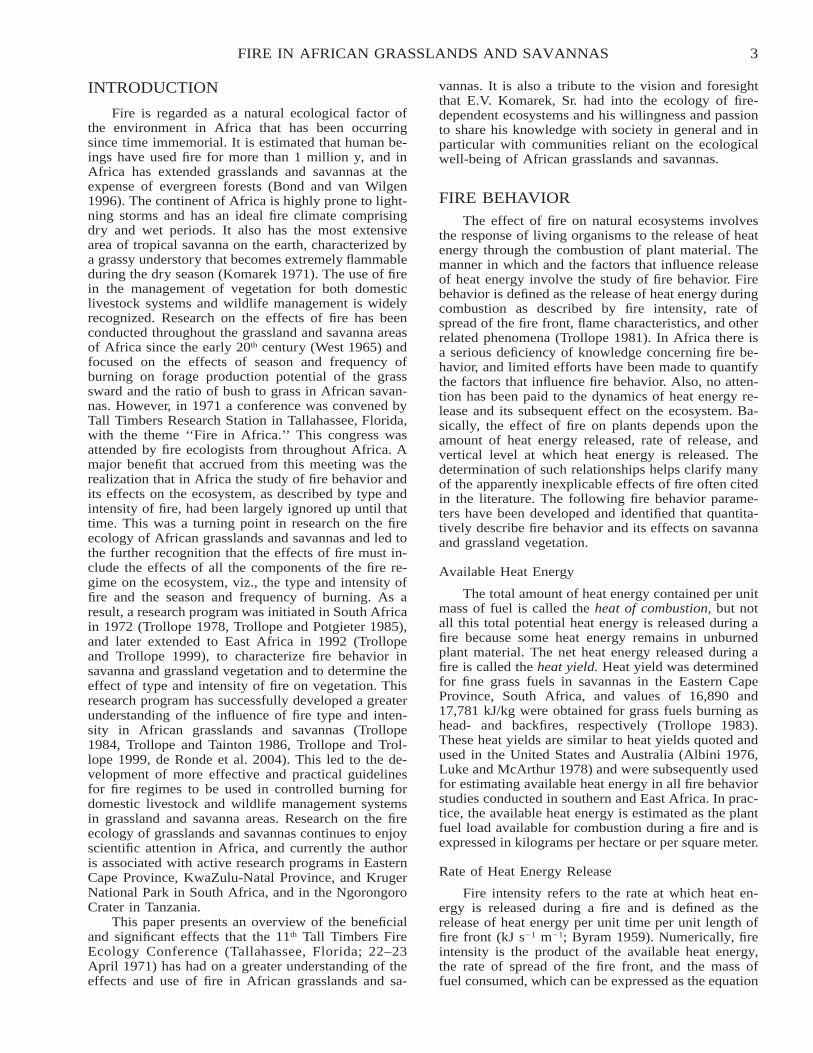
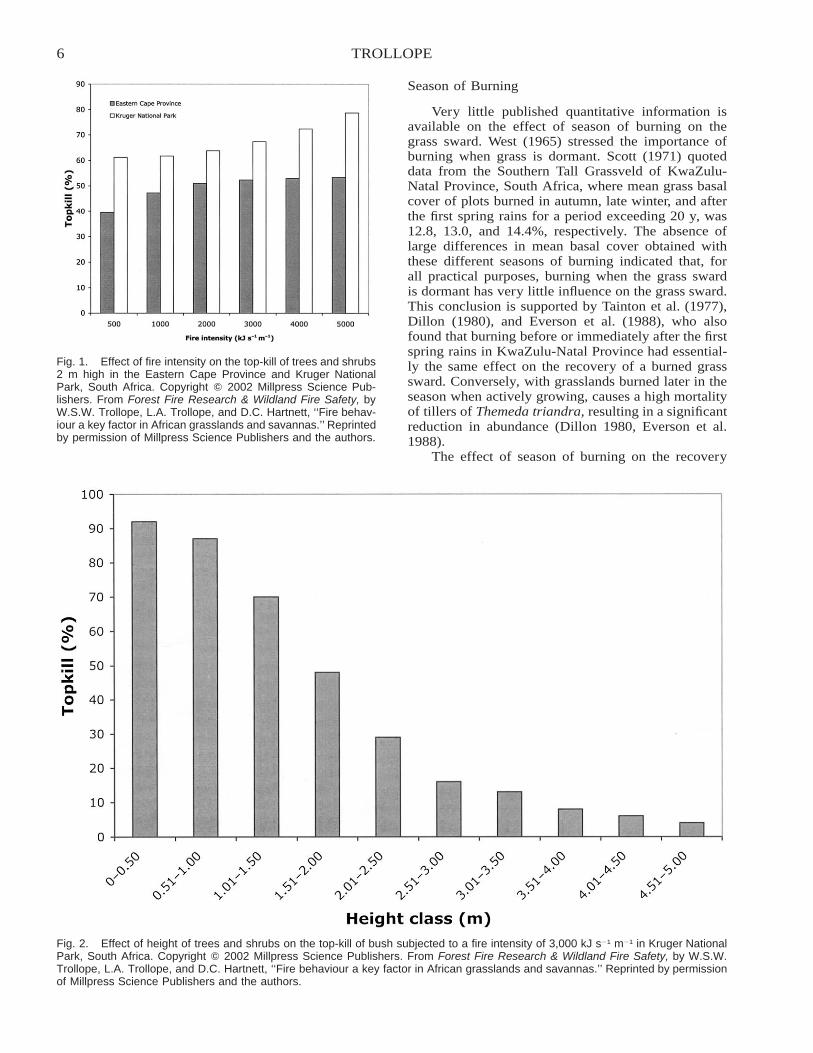
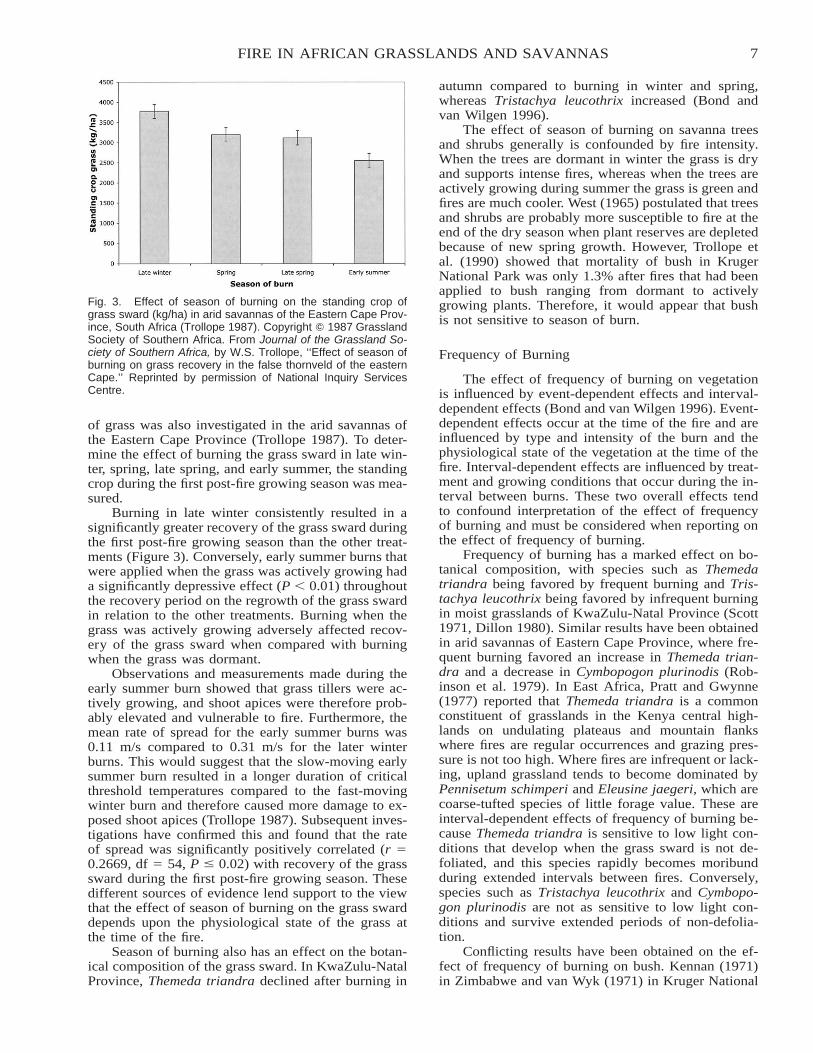
The effect of fire intensity on trees and shrubs hasbeen studied in arid savannas in Eastern Cape Province(Trollope and Tainton 1986) and Kruger National Park(Trollope et al. 1990). Plant mortality and total top-kill of stems and branches of bush at different heightswas determined. Bush is very resistant to fire alone;in the Eastern Cape Province, the mortality of treesand shrubs after a high-intensity fire of 3,875 kJ s�1
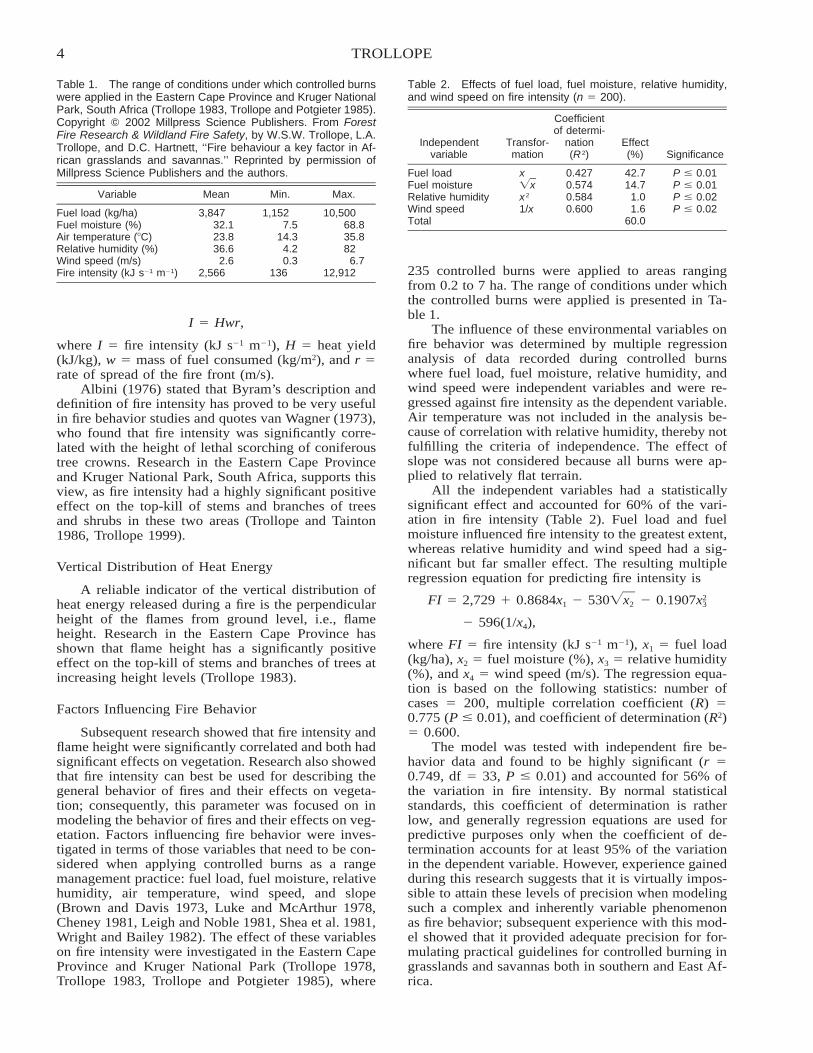
m�1 was only 9.3%. In Kruger National Park, the av-erage mortality of 14 of the most common bush spe-cies subjected to fires ranging in intensity from 110 to6,704 kJ s�1 m�1 (n � 43) was only 1.3%. In bothareas, the majority of the trees that suffered a top-killof stems and branches coppiced from the collar regionof the stem (Figure 1). A significantly greater top-killof bush with increasing fire intensities was noted.However, the bush became more resistant to fire as theheight of the trees and shrubs increased (Figure 2).Similar responses were reported in arid savannas ofEastern Cape Province (Trollope and Tainton 1986)and in the Scattered Tree Grassland (Acacia–Themedasavanna) in the Kenya central highlands (Trollope andTrollope 1999).
6 TROLLOPE
Fig. 1. Effect of fire intensity on the top-kill of trees and shrubs2 m high in the Eastern Cape Province and Kruger NationalPark, South Africa. Copyright � 2002 Millpress Science Pub-lishers. From Forest Fire Research & Wildland Fire Safety, byW.S.W. Trollope, L.A. Trollope, and D.C. Hartnett, ‘‘Fire behav-iour a key factor in African grasslands and savannas.’’ Reprintedby permission of Millpress Science Publishers and the authors.
Fig. 2. Effect of height of trees and shrubs on the top-kill of bush subjected to a fire intensity of 3,000 kJ s�1 m�1 in Kruger NationalPark, South Africa. Copyright � 2002 Millpress Science Publishers. From Forest Fire Research & Wildland Fire Safety, by W.S.W.Trollope, L.A. Trollope, and D.C. Hartnett, ‘‘Fire behaviour a key factor in African grasslands and savannas.’’ Reprinted by permissionof Millpress Science Publishers and the authors.
Season of Burning
Very little published quantitative information isavailable on the effect of season of burning on thegrass sward. West (1965) stressed the importance ofburning when grass is dormant. Scott (1971) quoteddata from the Southern Tall Grassveld of KwaZulu-Natal Province, South Africa, where mean grass basalcover of plots burned in autumn, late winter, and afterthe first spring rains for a period exceeding 20 y, was12.8, 13.0, and 14.4%, respectively. The absence oflarge differences in mean basal cover obtained withthese different seasons of burning indicated that, forall practical purposes, burning when the grass swardis dormant has very little influence on the grass sward.This conclusion is supported by Tainton et al. (1977),Dillon (1980), and Everson et al. (1988), who alsofound that burning before or immediately after the firstspring rains in KwaZulu-Natal Province had essential-ly the same effect on the recovery of a burned grasssward. Conversely, with grasslands burned later in theseason when actively growing, causes a high mortalityof tillers of Themeda triandra, resulting in a significantreduction in abundance (Dillon 1980, Everson et al.1988).
The effect of season of burning on the recovery
7FIRE IN AFRICAN GRASSLANDS AND SAVANNAS
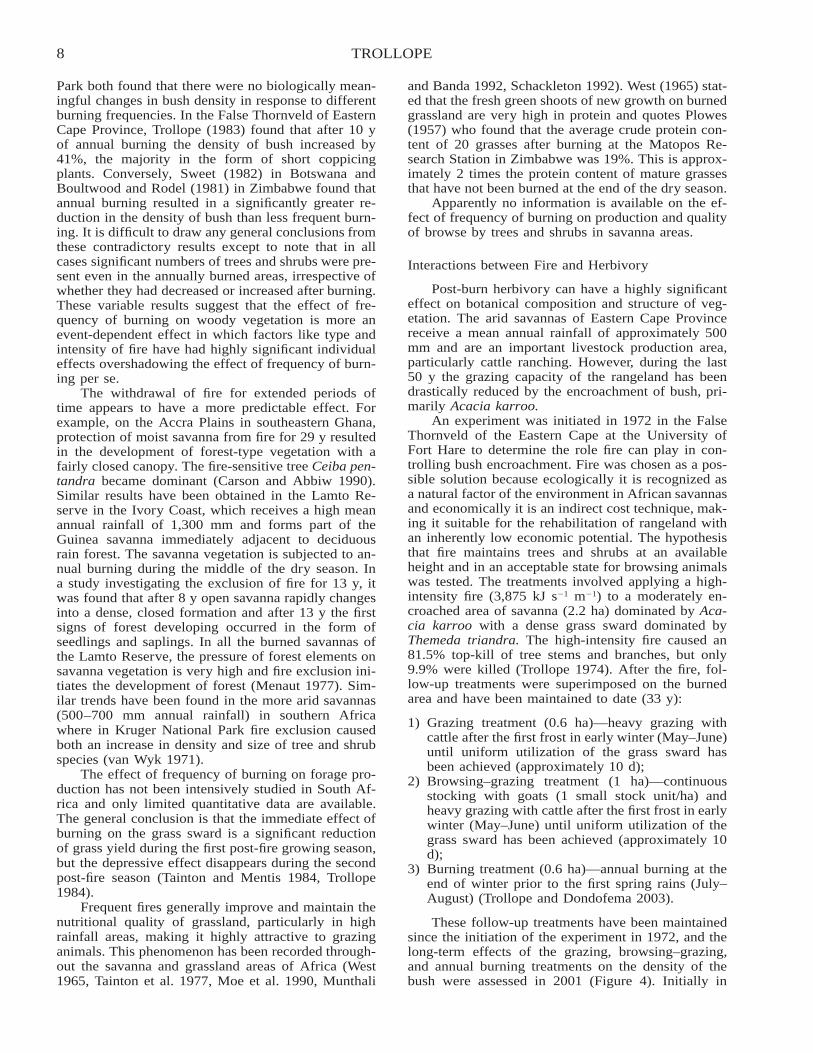
Fig. 3. Effect of season of burning on the standing crop ofgrass sward (kg/ha) in arid savannas of the Eastern Cape Prov-ince, South Africa (Trollope 1987). Copyright � 1987 GrasslandSociety of Southern Africa. From Journal of the Grassland So-ciety of Southern Africa, by W.S. Trollope, ‘‘Effect of season ofburning on grass recovery in the false thornveld of the easternCape.’’ Reprinted by permission of National Inquiry ServicesCentre.
of grass was also investigated in the arid savannas ofthe Eastern Cape Province (Trollope 1987). To deter-mine the effect of burning the grass sward in late win-ter, spring, late spring, and early summer, the standingcrop during the first post-fire growing season was mea-sured.
Burning in late winter consistently resulted in asignificantly greater recovery of the grass sward duringthe first post-fire growing season than the other treat-ments (Figure 3). Conversely, early summer burns thatwere applied when the grass was actively growing hada significantly depressive effect (P � 0.01) throughoutthe recovery period on the regrowth of the grass swardin relation to the other treatments. Burning when thegrass was actively growing adversely affected recov-ery of the grass sward when compared with burningwhen the grass was dormant.
Observations and measurements made during theearly summer burn showed that grass tillers were ac-tively growing, and shoot apices were therefore prob-ably elevated and vulnerable to fire. Furthermore, themean rate of spread for the early summer burns was0.11 m/s compared to 0.31 m/s for the later winterburns. This would suggest that the slow-moving earlysummer burn resulted in a longer duration of criticalthreshold temperatures compared to the fast-movingwinter burn and therefore caused more damage to ex-posed shoot apices (Trollope 1987). Subsequent inves-tigations have confirmed this and found that the rateof spread was significantly positively correlated (r �0.2669, df � 54, P � 0.02) with recovery of the grasssward during the first post-fire growing season. Thesedifferent sources of evidence lend support to the viewthat the effect of season of burning on the grass swarddepends upon the physiological state of the grass atthe time of the fire.
Season of burning also has an effect on the botan-ical composition of the grass sward. In KwaZulu-NatalProvince, Themeda triandra declined after burning in
autumn compared to burning in winter and spring,whereas Tristachya leucothrix increased (Bond andvan Wilgen 1996).
The effect of season of burning on savanna treesand shrubs generally is confounded by fire intensity.When the trees are dormant in winter the grass is dryand supports intense fires, whereas when the trees areactively growing during summer the grass is green andfires are much cooler. West (1965) postulated that treesand shrubs are probably more susceptible to fire at theend of the dry season when plant reserves are depletedbecause of new spring growth. However, Trollope etal. (1990) showed that mortality of bush in KrugerNational Park was only 1.3% after fires that had beenapplied to bush ranging from dormant to activelygrowing plants. Therefore, it would appear that bushis not sensitive to season of burn.
Frequency of Burning
The effect of frequency of burning on vegetationis influenced by event-dependent effects and interval-dependent effects (Bond and van Wilgen 1996). Event-dependent effects occur at the time of the fire and areinfluenced by type and intensity of the burn and thephysiological state of the vegetation at the time of thefire. Interval-dependent effects are influenced by treat-ment and growing conditions that occur during the in-terval between burns. These two overall effects tendto confound interpretation of the effect of frequencyof burning and must be considered when reporting onthe effect of frequency of burning.
Frequency of burning has a marked effect on bo-tanical composition, with species such as Themedatriandra being favored by frequent burning and Tris-tachya leucothrix being favored by infrequent burningin moist grasslands of KwaZulu-Natal Province (Scott1971, Dillon 1980). Similar results have been obtainedin arid savannas of Eastern Cape Province, where fre-quent burning favored an increase in Themeda trian-dra and a decrease in Cymbopogon plurinodis (Rob-inson et al. 1979). In East Africa, Pratt and Gwynne(1977) reported that Themeda triandra is a commonconstituent of grasslands in the Kenya central high-lands on undulating plateaus and mountain flankswhere fires are regular occurrences and grazing pres-sure is not too high. Where fires are infrequent or lack-ing, upland grassland tends to become dominated byPennisetum schimperi and Eleusine jaegeri, which arecoarse-tufted species of little forage value. These areinterval-dependent effects of frequency of burning be-cause Themeda triandra is sensitive to low light con-ditions that develop when the grass sward is not de-foliated, and this species rapidly becomes moribundduring extended intervals between fires. Conversely,species such as Tristachya leucothrix and Cymbopo-gon plurinodis are not as sensitive to low light con-ditions and survive extended periods of non-defolia-tion.
Conflicting results have been obtained on the ef-fect of frequency of burning on bush. Kennan (1971)in Zimbabwe and van Wyk (1971) in Kruger National
8 TROLLOPE
Park both found that there were no biologically mean-ingful changes in bush density in response to differentburning frequencies. In the False Thornveld of EasternCape Province, Trollope (1983) found that after 10 yof annual burning the density of bush increased by41%, the majority in the form of short coppicingplants. Conversely, Sweet (1982) in Botswana andBoultwood and Rodel (1981) in Zimbabwe found thatannual burning resulted in a significantly greater re-duction in the density of bush than less frequent burn-ing. It is difficult to draw any general conclusions fromthese contradictory results except to note that in allcases significant numbers of trees and shrubs were pre-sent even in the annually burned areas, irrespective ofwhether they had decreased or increased after burning.These variable results suggest that the effect of fre-quency of burning on woody vegetation is more anevent-dependent effect in which factors like type andintensity of fire have had highly significant individualeffects overshadowing the effect of frequency of burn-ing per se.
The withdrawal of fire for extended periods oftime appears to have a more predictable effect. Forexample, on the Accra Plains in southeastern Ghana,protection of moist savanna from fire for 29 y resultedin the development of forest-type vegetation with afairly closed canopy. The fire-sensitive tree Ceiba pen-tandra became dominant (Carson and Abbiw 1990).Similar results have been obtained in the Lamto Re-serve in the Ivory Coast, which receives a high meanannual rainfall of 1,300 mm and forms part of theGuinea savanna immediately adjacent to deciduousrain forest. The savanna vegetation is subjected to an-nual burning during the middle of the dry season. Ina study investigating the exclusion of fire for 13 y, itwas found that after 8 y open savanna rapidly changesinto a dense, closed formation and after 13 y the firstsigns of forest developing occurred in the form ofseedlings and saplings. In all the burned savannas ofthe Lamto Reserve, the pressure of forest elements onsavanna vegetation is very high and fire exclusion ini-tiates the development of forest (Menaut 1977). Sim-ilar trends have been found in the more arid savannas(500–700 mm annual rainfall) in southern Africawhere in Kruger National Park fire exclusion causedboth an increase in density and size of tree and shrubspecies (van Wyk 1971).
The effect of frequency of burning on forage pro-duction has not been intensively studied in South Af-rica and only limited quantitative data are available.The general conclusion is that the immediate effect ofburning on the grass sward is a significant reductionof grass yield during the first post-fire growing season,but the depressive effect disappears during the secondpost-fire season (Tainton and Mentis 1984, Trollope1984).
Frequent fires generally improve and maintain thenutritional quality of grassland, particularly in highrainfall areas, making it highly attractive to grazinganimals. This phenomenon has been recorded through-out the savanna and grassland areas of Africa (West1965, Tainton et al. 1977, Moe et al. 1990, Munthali
and Banda 1992, Schackleton 1992). West (1965) stat-ed that the fresh green shoots of new growth on burnedgrassland are very high in protein and quotes Plowes(1957) who found that the average crude protein con-tent of 20 grasses after burning at the Matopos Re-search Station in Zimbabwe was 19%. This is approx-imately 2 times the protein content of mature grassesthat have not been burned at the end of the dry season.
Apparently no information is available on the ef-fect of frequency of burning on production and qualityof browse by trees and shrubs in savanna areas.
Interactions between Fire and Herbivory
Post-burn herbivory can have a highly significanteffect on botanical composition and structure of veg-etation. The arid savannas of Eastern Cape Provincereceive a mean annual rainfall of approximately 500mm and are an important livestock production area,particularly cattle ranching. However, during the last50 y the grazing capacity of the rangeland has beendrastically reduced by the encroachment of bush, pri-marily Acacia karroo.
An experiment was initiated in 1972 in the FalseThornveld of the Eastern Cape at the University ofFort Hare to determine the role fire can play in con-trolling bush encroachment. Fire was chosen as a pos-sible solution because ecologically it is recognized asa natural factor of the environment in African savannasand economically it is an indirect cost technique, mak-ing it suitable for the rehabilitation of rangeland withan inherently low economic potential. The hypothesisthat fire maintains trees and shrubs at an availableheight and in an acceptable state for browsing animalswas tested. The treatments involved applying a high-intensity fire (3,875 kJ s�1 m�1) to a moderately en-croached area of savanna (2.2 ha) dominated by Aca-cia karroo with a dense grass sward dominated byThemeda triandra. The high-intensity fire caused an81.5% top-kill of tree stems and branches, but only9.9% were killed (Trollope 1974). After the fire, fol-low-up treatments were superimposed on the burnedarea and have been maintained to date (33 y):
1) Grazing treatment (0.6 ha)—heavy grazing withcattle after the first frost in early winter (May–June)until uniform utilization of the grass sward hasbeen achieved (approximately 10 d);
2) Browsing–grazing treatment (1 ha)—continuousstocking with goats (1 small stock unit/ha) andheavy grazing with cattle after the first frost in earlywinter (May–June) until uniform utilization of thegrass sward has been achieved (approximately 10d);
3) Burning treatment (0.6 ha)—annual burning at theend of winter prior to the first spring rains (July–August) (Trollope and Dondofema 2003).
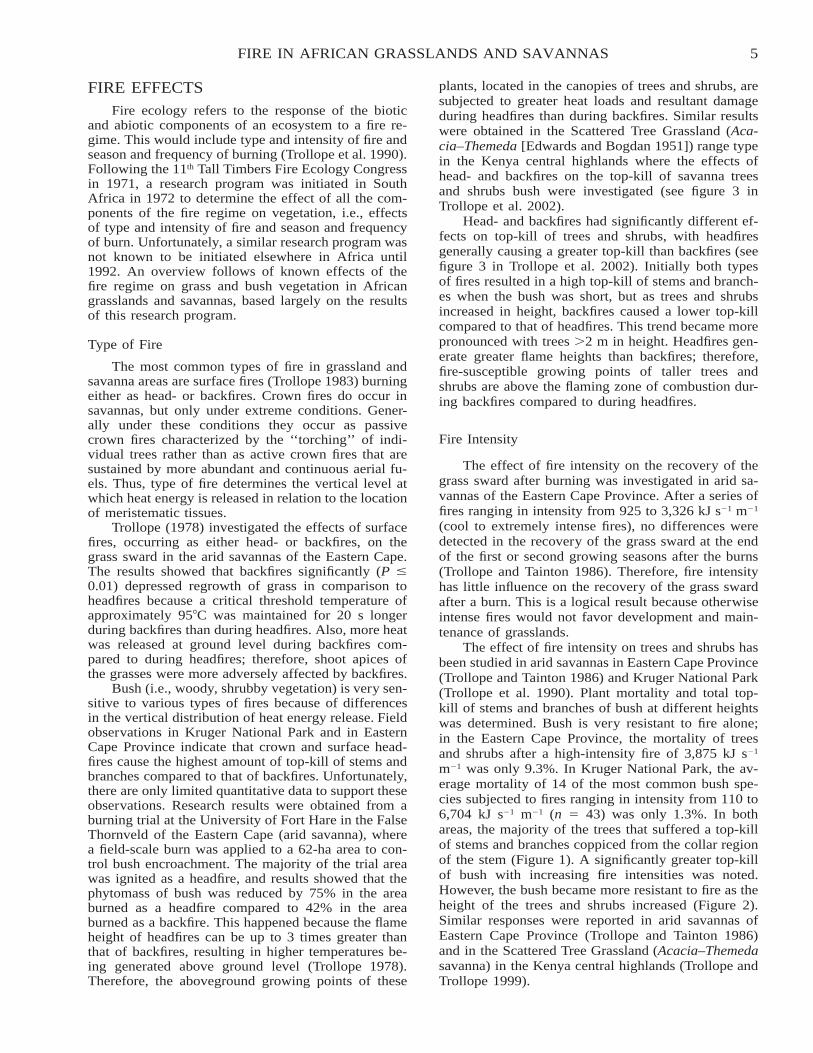
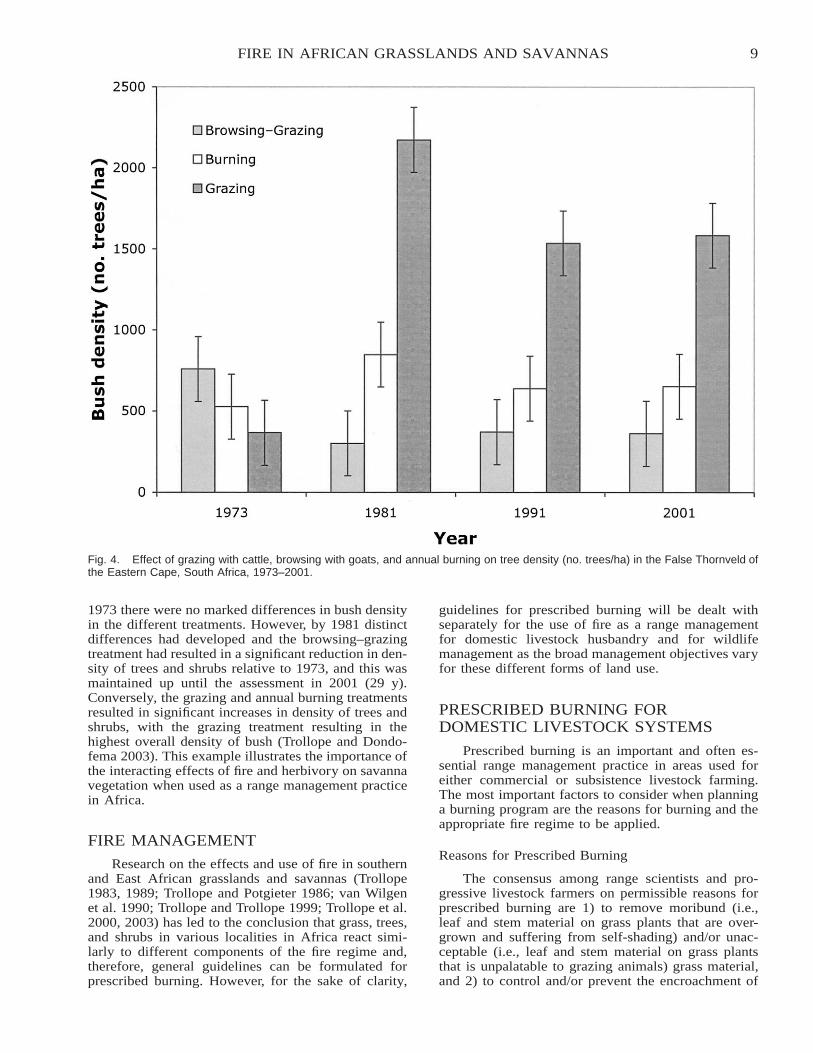
These follow-up treatments have been maintainedsince the initiation of the experiment in 1972, and thelong-term effects of the grazing, browsing–grazing,and annual burning treatments on the density of thebush were assessed in 2001 (Figure 4). Initially in
9FIRE IN AFRICAN GRASSLANDS AND SAVANNAS
Fig. 4. Effect of grazing with cattle, browsing with goats, and annual burning on tree density (no. trees/ha) in the False Thornveld ofthe Eastern Cape, South Africa, 1973–2001.
1973 there were no marked differences in bush densityin the different treatments. However, by 1981 distinctdifferences had developed and the browsing–grazingtreatment had resulted in a significant reduction in den-sity of trees and shrubs relative to 1973, and this wasmaintained up until the assessment in 2001 (29 y).Conversely, the grazing and annual burning treatmentsresulted in significant increases in density of trees andshrubs, with the grazing treatment resulting in thehighest overall density of bush (Trollope and Dondo-fema 2003). This example illustrates the importance ofthe interacting effects of fire and herbivory on savannavegetation when used as a range management practicein Africa.
FIRE MANAGEMENT
Research on the effects and use of fire in southernand East African grasslands and savannas (Trollope1983, 1989; Trollope and Potgieter 1986; van Wilgenet al. 1990; Trollope and Trollope 1999; Trollope et al.2000, 2003) has led to the conclusion that grass, trees,and shrubs in various localities in Africa react simi-larly to different components of the fire regime and,therefore, general guidelines can be formulated forprescribed burning. However, for the sake of clarity,
guidelines for prescribed burning will be dealt withseparately for the use of fire as a range managementfor domestic livestock husbandry and for wildlifemanagement as the broad management objectives varyfor these different forms of land use.
PRESCRIBED BURNING FORDOMESTIC LIVESTOCK SYSTEMS
Prescribed burning is an important and often es-sential range management practice in areas used foreither commercial or subsistence livestock farming.The most important factors to consider when planninga burning program are the reasons for burning and theappropriate fire regime to be applied.
Reasons for Prescribed Burning
The consensus among range scientists and pro-gressive livestock farmers on permissible reasons forprescribed burning are 1) to remove moribund (i.e.,leaf and stem material on grass plants that are over-grown and suffering from self-shading) and/or unac-ceptable (i.e., leaf and stem material on grass plantsthat is unpalatable to grazing animals) grass material,and 2) to control and/or prevent the encroachment of
10 TROLLOPE
undesirable plants (Trollope 1989). These basic rea-sons for burning grassland and savanna vegetation inAfrica are equally applicable to commercial or subsis-tence livestock farming.
An often quoted reason for burning rangeland isto stimulate an out-of-season ‘‘green bite.’’ This is of-ten done during summer, late autumn, or late winter toprovide green nutritious regrowth for grazing by live-stock. This practice is unacceptable because 1) it re-duces vigor of the grass sward, 2) it reduces basal andcanopy cover of the grass sward, 3) it increases runoffof rainwater, and 4) it can result in accelerated soilerosion. This malpractice cannot be sufficiently con-demned as it has been responsible for drastic deterio-ration in range condition over extensive areas of south-ern Africa, and unfortunate examples are evident atnumerous sites in the eastern mountain grasslands ofSouth Africa.
It has been suggested that fire can also be used tocontrol ticks that cause tick-borne diseases in live-stock, but this reason is generally discounted becauseticks persist in areas that are frequently burned. How-ever, Stampa (1959), in a study of the Karoo paralysistick (Ixodes rubicundus) in the Karroid MerxmuelleraMountain Veld in South Africa, has shown that thisparasite can be successfully controlled by altering themicroclimate at the soil level and thereby creating anunfavorable habitat for this organism, resulting in itsdisappearance. Similar evidence has been obtained byTrollope et al. (2003) in the Ngorongoro Crater andSerengeti grasslands in Tanzania, where controlledburning by nomadic Masai pastoralists has resulted ina significantly lower incidence of ticks where thispractice is applied. This latter finding has resulted inthe reintroduction of prescribed burning in the Ngo-rongoro Crater, with beneficial results.
Finally it was shown that frequent fires favor theabundance of the productive and palatable grass spe-cies Themeda triandra in southern African grasslands(Scott 1971, Dillon 1980, Forbes and Trollope 1991).This raises the possibility of using fire to improverange condition by increasing the abundance of valu-able forage species like Themeda triandra. Followingappropriate research on the response of key forage spe-cies to fire, forage condition improvement could beconsidered as a valid reason for burning rangeland inthe future.
Ecological Criteria for Prescribed Burning
The necessity for burning rangeland depends uponits ecological status and physical condition. Generallythe condition of the grass sward determines whetherrangeland should be considered for burning. This com-ponent reflects the ecological status of the ecosystemand the presence of or its ability to produce adequategrass fuel to carry and support a fire. Quantitativetechniques have been developed in southern and EastAfrica to assess condition of the grass sward in relationto the need for prescribed burning (Trollope and Pot-gieter 1986, Hardy et al. 1999, Trollope and Trollope1999, Trollope et al. 2000). The condition of the grass
sward must be determined in terms of its botanicalcomposition, ecological status, and basal cover, andinvolves classifying different grass species into differ-ent ecological categories according to their responseto a grazing gradient, from high to low grazing inten-sities:
1) Decreaser species: Grass and herbaceous speciesthat decrease when rangeland is under- or over-grazed;
2) Increaser I species: Grass and herbaceous speciesthat increase when rangeland is under- or selective-ly grazed;
3) Increaser II species: Grass and herbaceous speciesthat increase when rangeland is overgrazed.
Prescribed burning should not be applied if thegrass sward is in a pioneer condition dominated byIncreaser II grass species caused by overgrazing. Burn-ing is generally not recommended when rangeland isin this condition in order to enable it to develop to amore productive stage dominated by Decreaser grassspecies. Conversely, when the grass sward is in anundergrazed condition dominated by Increaser I spe-cies, it needs to be burned to increase the fire-adaptedand more productive Decreaser grass species. Finally,prescribed burning is necessary when the grass swardhas become overgrown and moribund as a result ofexcessive self-shading. These conditions develop whenthe standing crop of grass is generally �4,000 kg/haand can be estimated with the Disc Pasture Meter de-veloped by Bransby and Tainton (1977).
The criteria used for deciding whether to burn tocontrol or prevent the encroachment of undesirableplants are the same criteria describing the condition ofthe grass sward. However, grass fuel loads required forprescribed burning for this reason may differ depend-ing on the encroaching plant species.
Fire Regime
In this discussion, the fire regime to be used inprescribed burning refers to the type and intensity offire and the season and frequency of burning.
Type of Fire
It is recommended that fires burning with the windeither as surface headfires in grassland or a combina-tion of surface headfires and crown fires in tree andshrub vegetation be used in prescribed burning be-cause they cause least damage to the grass sward butcan cause maximum damage to woody vegetation ifrequired (Trollope 1999).
Fire Intensity
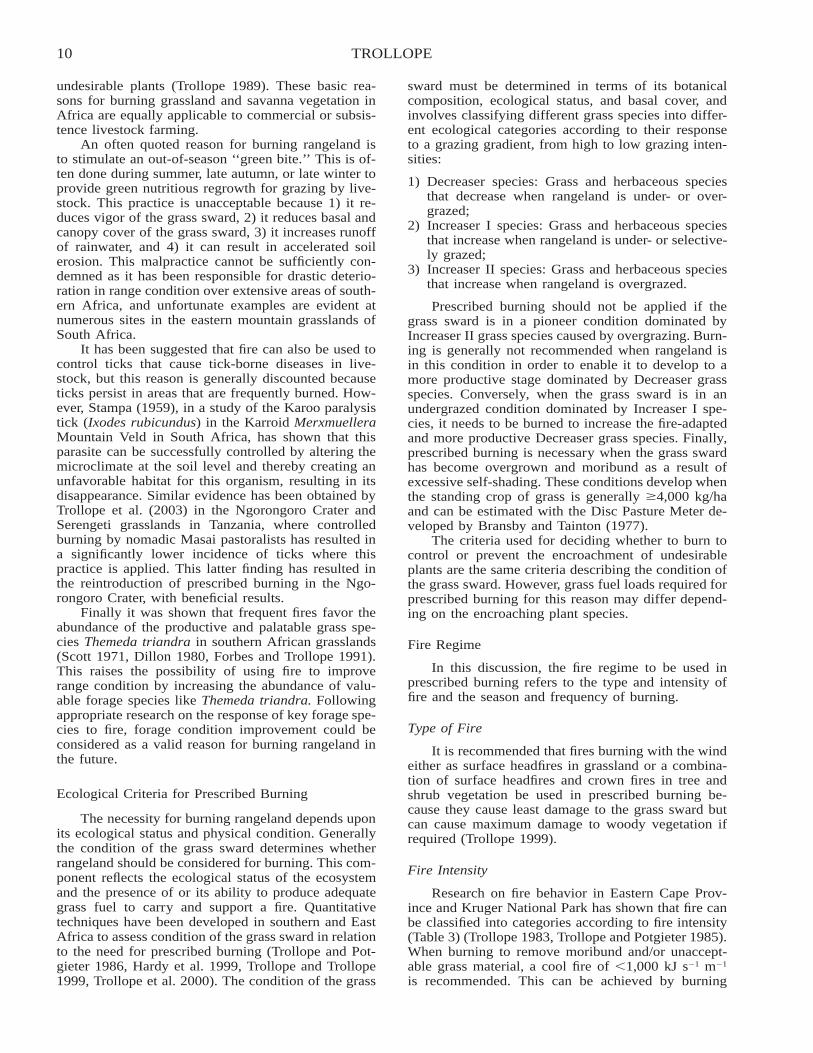
Research on fire behavior in Eastern Cape Prov-ince and Kruger National Park has shown that fire canbe classified into categories according to fire intensity(Table 3) (Trollope 1983, Trollope and Potgieter 1985).When burning to remove moribund and/or unaccept-able grass material, a cool fire of �1,000 kJ s�1 m�1
is recommended. This can be achieved by burning
11FIRE IN AFRICAN GRASSLANDS AND SAVANNAS
Table 3. Fire classification according to fire intensity.
Fire intensity (kJ s�1 m�1) Description
�500 Very cool501–1,000 Cool
1,001–2,000 Moderately hot2,001–3,000 Hot
�3,000 Extremely hot
when the air temperature is �20�C and the relativehumidity is �50%. When burning to control undesir-able plants like encroaching bush, a hot fire of �2,000kJ s�1 m�1 is necessary. This can be achieved whenthe grass fuel load is �4,000 kg/ha, the air temperatureis �25�C, and the relative humidity is �30%. A hotfire will cause a significant top-kill of stems andbranches of bush species up to a height of 3 m. In allcases, the wind speed should not exceed 20 km/h.
Season of Burning
Research in southern Africa has clearly indicatedthat damage to the grass sward is minimized if burningis applied when the grass is dormant. Therefore, it isrecommended that when burning to remove moribundand/or unacceptable grass material, burning shouldpreferably be applied after the first rains of �13 mmat the commencement of the growing season, i.e.,when grass is still dormant and fire hazard is low. Con-versely, when burning to control encroaching plants,burning should be applied before the first rains of thegrowing season, i.e., when grass is very dry and dor-mant to ensure a high-intensity fire. The actual timeof the year when prescribed burning will be applied inAfrica depends on the latitude and rainfall pattern ofthe region.
Frequency of Burning
When burning to remove moribund and/or unac-ceptable grass material, frequency of burning will de-pend upon the rate of accumulation of excess grasslitter (Trollope 1999). Field experience indicates thatlitter accumulation should not exceed 4,000 kg/ha and,therefore, frequency of burning should be based on therate at which this phytomass of grass material accu-mulates. This approach has the advantage that the fre-quency of burning is related to the stocking rate ofgrazers and to the amount of rainfall the area receives.Generally in high rainfall areas (�700 mm/y) this willdictate a frequency of burning every 2–4 y. In morearid areas, the frequency will be much lower and, infact, the threshold of a grass fuel load �4,000 kg/hawill generally exclude fire in these regions, particularlywhere condition of the rangeland is degraded and ex-cessive grass fuel loads never accumulate.
Post-Fire Range Management
When burning to remove moribund and/or unac-ceptable grass material, grazing should be applied assoon as possible after the burn to take advantage ofthe highly nutritious regrowth of grass. It is unclear
whether rotational or continuous grazing should be ap-plied after fire. However, there is complete consensusamong rangeland scientists on the necessity of apply-ing a rotational resting system when prescribed burn-ing is used (Zacharias 1994, Kirkman 2002). This in-volves withdrawing a portion of the rangeland fromgrazing for an extended period of at least 1 growingseason or longer (6–12 mo) to maintain the vigor ofgrasses and enable seed production to occur for plantrecruitment. The rest period is applied during the sea-son prior to the prescribed burn. In terms of rotationalgrazing after a burn, great success has been obtainedwith the ‘‘open camp system’’ developed in KwaZulu-Natal. Grazing camps are permanently establishedfenced areas or paddocks on a commercial livestockranch, i.e., the rangeland on a livestock ranch is sub-divided into grazing camps that are grazed on a rota-tional basis. This system involves burning a camp andgrazing it as soon as possible after the fire, after whichthe livestock are moved rotationally to other campsuntil such time as the burned camp is ready to begrazed again. Burned rangeland is thus maintained ina palatable and nutritious condition for as long as pos-sible after the burn to the benefit of livestock. Thesame procedure is then followed in subsequent years.This system presupposes the availability of adequatecamps to apply this form of grazing management. Inareas where there are few grazing camps available,emphasis must be given to applying a rotational restingsystem. Where there are no camps, such as in com-munal grazing areas like the Transkei in South Africa,sufficiently large areas need to be burned to avoidoverutilizing the burned area. This practice will alsode facto result in a resting treatment being applied tothe unburned area, which is initially less attractive tograzing animals.
PRESCRIBED BURNING FOR WILDLIFEMANAGEMENT
Prescribed burning is recognized as an importantmanagement practice for wildlife management in Af-rican grassland and savanna ecosystems and is regard-ed as a natural factor of the environment essential forthe ecological well-being of both biotic and abioticcomponents (Trollope 1990, Thomson 1992, Bothma1996). However, a wide diversity of views prevails onthe most appropriate burning system to use in wildlifeareas, ranging from so-called ‘‘natural’’ burning sys-tems based entirely on lightning as the ignition sourceto actively applied burning systems based on range-land condition.
Fire management systems are most developed insouthern Africa. The different burning systems usedare the lightning burning system, the range conditionburning system, the patch mosaic burning system, andthe integrated fire management system. Personal ex-perience in southern and East African grasslands andsavannas has led to the conclusion that the range con-dition burning system is a practical and efficient burn-
12 TROLLOPE
ing system to use in wildlife areas and is strongly rec-ommended.
Range Condition Burning System
The range condition burning system was devel-oped from a fire research program that was initiated inEastern Cape Province in 1968 and later extended toKruger National Park in 1982 and to East Africa in1992 (Trollope 1971, Trollope and Potgieter 1985,Trollope and Trollope 1999). It is based on empiricalresults and is appropriate for use in wildlife areas be-cause it provides a practical means of improving andmaintaining species and habitat diversity of naturalgrassland and savanna ecosystems (Trollope 1971,Trollope et al. 1995). It can be used to remove mori-bund and/or unacceptable grass material, to create ormaintain an optimum relationship between herbaceousand woody vegetation, if necessary, and to encouragewildlife to move to less preferred areas in order tominimize the overutilization of preferred areas. Thebasic philosophy of the range condition burning sys-tem is that the use of fire to achieve specific manage-ment objectives must be based on the condition of thevegetation and its known response to different com-ponents of the fire regime. Similar ecological criteria,as used for prescribed burning for domestic livestocksystems, are also used to select areas for burning. Thissystem also allows for all wildfires initiated by un-planned ignition sources, such as lightning or othercauses, to burn freely if the grass sward is dominatedby Decreaser and/or Increaser I grass species and is ina moribund and unpalatable condition. The effect offire on grassland and savanna vegetation is similar ir-respective of the source of ignition when burned underthe same weather conditions. Finally, limits must beset on the extent of area to be burned at any one timeas a precaution against inadequate forage being avail-able for herbivorous wildlife. It is therefore recom-mended that not �50% of a given area be burned inmoist grassland and savanna ecosystems (�700 mmrainfall/y) and not �33% in arid (�500 mm rainfall/y) grassland and savanna ecosystems.
The designated areas to be burned can be ignitedeither as point ignitions or as perimeter ignitions in-volving ‘‘block burning.’’ Point ignitions are used todevelop a mosaic of different types of fires in responseto changes in wind direction, air temperature, and rel-ative humidity during the burning period. The ensuingfire mosaic will ensure a range of fire effects, whichare intended to maximize habitat diversity both ingrassland and woody components of the vegetation.The use of point ignitions is best suited to large con-servation areas generally �20,000 ha (Brockett et al.2001), where intensive range management is not a crit-ical requirement. The intensity of prescribed burns willvary according to the objectives for burning similar todomestic livestock systems. Regarding season of burn-ing it is recommended that prescribed burns be appliedwhen the grass sward is dormant, but the ‘‘burningwindow’’ can extend over the entire dry season andthe actual timing of fires may be varied according to
objectives for burning. When burning to remove mor-ibund grass material, prescribed burns can be appliedat any time during the dormant season. When burningto reduce the density and size of trees and shrubs, firesshould be applied when grass fuel is at its lowest mois-ture content in order to ensure a high-intensity fire.Finally, the guidelines used for controlling the fre-quency of burning in domestic livestock systems alsoapply to prescribed burning for wildlife management.
Post-Fire Range Management
Grazing after burning in wildlife areas is difficultto control. In order to prevent overgrazing, it is im-portant to ensure that the burned area exceeds theshort-term forage requirements of grazing animals thatare attracted to the highly palatable and nutritious re-growth that develops after a burn (Trollope 1992). An-other strategy that has been successful in southern Af-rica is to apply a series of patch burns at regular in-tervals throughout the duration of the burning windowduring the dormant season. This attracts grazing ani-mals to successively burned areas, thereby spreadingthe impact of grazing over the entire burned area andavoiding the detrimental effects of heavy continuousgrazing in any one area (Brockett et al. 2001).
GENERAL DISCUSSION ANDCONCLUSIONS
An important feature of this overview of the fireecology of African grasslands and savannas is the de-pendence of prescribed burning on a knowledge of firebehavior and fire effects. An attempt has been madeto quantify primary factors affecting fire behavior interms of rate of spread, fire intensity, and flame heightof surface headfires. The influence of various factorscontributing to fire intensity in African grasslands andsavannas has also been quantified. Significant progresshas been made with determining the effects of typeand intensity of fires on the grass sward and tree andshrub vegetation in African grass and savanna ecosys-tems. This research has enabled formulating effectiveand practical guidelines for fire as a range managementpractice for domestic livestock production and wildlifemanagement. However, research conducted to developthe fire intensity model and to determine the effects oftype and intensity of fires on herbaceous and woodyvegetation has been largely limited to savanna areasof the Eastern Cape Province and Kruger NationalPark. This emphasizes the need to extend similar fireecological studies to other African grassland and sa-vanna areas. The greatest limiting factors to conduct-ing fire ecology studies are to find suitable study siteswhere landowners and users are prepared to sacrificeforage supplies that are normally used for sustainingeither domestic livestock or wildlife populations. Inaddition, applying controlled experimental fires is dan-gerous, requiring well-developed managerial skills andsuitable firefighting equipment to contain fires, all ofwhich are not readily available over much of the Af-rican continent. Finally, competent fire ecologists are
13FIRE IN AFRICAN GRASSLANDS AND SAVANNAS
a rare commodity, not only in Africa but in the world,further limiting the implementation of a comprehen-sive fire research program elsewhere in Africa. Themost successful attempt to test these results elsewherein Africa has been to conduct fire behavior and fireeffect trials in the Kenya central highlands. These trialslead to the conclusion that the behavior and effect ofsurface fires in East African grasslands and savannaswere similar to that in southern African grasslands andsavannas (Trollope and Trollope 1999).
Another successful attempt was to compare the be-havior of fires in African grasslands and savannas withfires occurring in tallgrass prairies on the Konza Prai-rie Biological Station at Kansas State University in theUnited States. This involved recording the behavior of45 surface headfires and 24 surface backfires appliedas controlled burns to catchment units on Konza. Adetailed analysis of the fire behavior data led to theconclusion that the overall behavior of surface head-fires in tallgrass prairies at Konza was similar to thatin grasslands and savanna ecosystems in South Africa(Trollope et al. 2004). These two independent data setsfrom similar types of vegetation, but in widely sepa-rated grassland and savanna areas on the earth, providea measure of scientific support for research results thathave been obtained on fire behavior and to an extenton fire effects in southern African grasslands and sa-vannas. Nevertheless, it is strongly recommended thatas much further research as possible be conducted inother African grassland and savanna ecosystems. Thiswill contribute to a greater understanding of the fireecology of these ecosystems, thereby leading to im-proved range management for both domestic livestockproduction and wildlife management on the Africancontinent.
LITERATURE CITED
Albini, F.A. 1976. Estimating wildfire behavior and effects. Gen-eral Technical Report INT-30, U.S. Department of Agricul-ture, Forest Service, Intermountain Forest and Range Ex-periment Station, Ogden, UT.
Bond, W.J., and B.W. van Wilgen. 1996. Fire and plants. Chap-man & Hall, London, United Kingdom.
Bothma, J. du P. 1996. Game ranch management. Van SchaikPublishers, Pretoria, South Africa.
Boultwood, J.N., and M.G. Rodel. 1981. Effects of stocking rateand burning frequency on Brachystegia/Julbernardia veldin Zimbabwe. Proceedings of the Grassland Society ofSouthern Africa 16:111–115.
Bransby, D.I., and N.M. Tainton. 1977. The disc pasture meter:possible applications in grazing management. Proceedingsof the Grassland Society of Southern Africa 12:115–118.
Brockett, B.H., H.C. Biggs, and B.W. van Wilgen. 2001. A patchmosaic burning system for conservation areas in southernAfrican savannas. International Journal of Wildland Fire 10:169–183.
Brown, A.A., and K.P. Davis. 1973. Forest fire: control and use.Second edition. McGraw-Hill, New York.
Byram, G.M. 1959. Combustion of forest fuels. Pages 61–89 inK.P. Davis (ed.). Forest fire: control and use. McGraw-Hill,New York.
Carson, W.P., and D.K. Abbiw. 1990. The vegetation of a fireprotection site on the northern Accra Plains, Ghana. AfricanJournal of Ecology 28:143–146.
Cheney, N.P. 1981. Fire behaviour. Pages 151–175 in A.M. Gill,R.H. Groves, and I.R. Noble (eds.). Fire and the Australianbiota. Australian Academy of Science, Canberra, Australia.
de Ronde, C., W.S. Trollope, C.L. Parr, B. Brockett, and C.J.Geldenhuys. 2004. Fire effects on fauna and flora. Pages60–87 in J.G. Goldammer and C. de Ronde (eds.). Wildlandfire management handbook for sub-Saharan Africa. GlobalFire Monitoring Center, Freiburg, Germany.
Dillon, R.F. 1980. Some effects of fire in the tall grassveld ofNatal. M.Sc. Thesis, University of Natal, Pietermaritzburg,South Africa.
Edwards, D.C., and A.V. Bogdan. 1951. Important grasslandplants of Kenya. Sir Isaac Pitman & Sons, London, UnitedKingdom.
Everson, T.M., C.S. Everson, H.M. Dicks, and A.G. Poulter.1988. Curing rates in the grass sward of the highland sour-veld in the Natal Drakensberg. Southern African ForestryJournal 145:1–8.
Forbes, R.G., and W.S.W. Trollope. 1991. Veld management inthe rural areas of Ciskei. Journal of the Grassland Societyof Southern Africa 8:147–152.
Hardy, M.B., C.R. Hurt, and O.J. Bosch. 1999. Veld conditionassessment—grassveld. Pages 194–216 in N.M. Tainton(ed.). Veld management in South Africa. University of Na-tal Press, Pietermaritzburg, South Africa.
Kennan, T.C. 1971. The effects of fire on two vegetation typesof Matopos. Proceedings of the Tall Timbers Fire EcologyConference 11:53–98.
Kirkman, K.P. 2002. The influence of various types and fre-quencies of rest on the production and condition of sourveldgrazed by sheep or cattle. 1. Proportional species compo-sition. African Journal of Range and Forage Science 19:55–62.
Komarek, E.V. Sr. 1971. Lightning and fire ecology in Africa.Proceedings of the Tall Timbers Fire Ecology Conference11:473–511.
Leigh, J.H., and J.C. Noble. 1981. The role of fire in the man-agement of rangelands in Australia. Pages 471–495 in A.M.Gill, R.H. Groves, and I.R. Noble (eds.). Fire and the Aus-tralian biota. Australian Academy of Science, Canberra,Australia.
Luke, R.H., and A.G. McArthur. 1978. Bush fires in Australia.Australian Government Publishing Service, Canberra, Aus-tralia.
Menaut, J.C. 1977. Evolution of plots protected from fire since13 years in a Guinea savanna of Ivory Coast. Pages 543–558 in Actas del IV Simposium Internacional de EcologıaTropical, tomo II. Instituto Nacional de Cultura, Panama,Republica de Panama.
Moe, S.R., P. Wegge, and E.B. Kapela. 1990. The influence ofman-made fires on large wild herbivores in Lake Burungiarea in northern Tanzania. African Journal of Ecology 28:35–43.
Munthali, S.M., and H.M. Banda. 1992. Distribution and abun-dance of the common ungulates of Nyika National Park,Malawi. African Journal of Ecology 30:203–212.
Plowes, D.C.H. 1957. The seasonal variation of crude protein intwenty grasses at Matopos, Southern Rhodesia, and relatedobservations. Rhodesia Agricultural Journal 54:33–55.
Pratt, D.J., and M.D. Gwynne. 1977. Rangeland managementand ecology in East Africa. Hodder & Stoughton, London,United Kingdom.
Robinson, E.T., G.E. Gibbs-Russel, W.S. Trollope, and B.H.Downing. 1979. Assessment of short term burning treat-ments on the herb layer of False Thornveld of the EasternCape. Proceedings of the Grassland Society of Southern Af-rica 14:79–83.
Schackleton, C.M. 1992. Area and species selection by wild un-gulates in coastal sour grasslands of Mkambati Game Re-serve, Transkei, southern Africa. African Journal of Ecol-ogy 30:189–202.
14 TROLLOPE
Scott, J.D. 1971. Veld burning in Natal. Proceedings of the TallTimbers Fire Ecology Conference 11:33–51.
Shea, S.R., G.B. Peet, and N.P. Cheney. 1981. The role of firein forest management. Pages 443–470 in A.M. Gill, R.H.Groves, and I.R. Noble (eds.). Fire and the Australian biota.Australian Academy of Science, Canberra, Australia.
Stampa, S. 1959. Tick paralysis in the Karoo areas of SouthAfrica. Onderstepoort Journal of Veterinary Research 28:2.
Sweet, R.J. 1982. Bush control with fire in Acacia nigrescens/Combretum piculatum savanna in Botswana. Proceedings ofthe Grassland Society of Southern Africa 17:25–28.
Tainton, N.M., R.H. Groves, and R. Nash. 1977. Time of mow-ing and burning veld: short term effects on production andtiller development. Proceedings of the Grassland Society ofSouthern Africa 12:59–64.
Tainton, N.M., and M.T. Mentis. 1984. Fire in grassland. Pages115–197 in P. de V. Booysen and N.M. Tainton (eds.). Eco-logical effects of fire in South African ecosystems. Ecolog-ical Studies 48. Springer-Verlag, Berlin, Germany.
Thomson, R. 1992. The wildlife game. Nyala Wildlife Publica-tions Trust, Westville, South Africa.
Trollope, W.S. 1971. Fire as a method of eradicating macchiavegetation in the Amatola Mountains of South Africa—ex-periment and field scale results. Proceedings of the TallTimbers Fire Ecology Conference 11:99–120.
Trollope, W.S. 1974. Role of fire in preventing bush encroach-ment in the eastern Cape. Proceedings of the Grassland So-ciety of Southern Africa 9:67–72.
Trollope, W.S. 1978. Fire behaviour—a preliminary study. Pro-ceedings of the Grassland Society of Southern Africa 13:123–128.
Trollope, W.S. 1981. Recommended terms, definitions and unitsto be used in fire ecology in Southern Africa. Proceedingsof the Grassland Society of Southern Africa 16:107–109.
Trollope, W.S. 1983. Control of bush encroachment with fire inthe arid savannas of southeastern Africa. Ph.D. Dissertation,University of Natal, Pietermaritzburg, South Africa.
Trollope, W.S. 1984. Fire in savanna. Pages 151–175 in P. de V.Booysen and N.M. Tainton (eds.). Ecological effects of firein South African ecosystems Ecological Studies 48. Spring-er-Verlag, Berlin, Germany.
Trollope, W.S. 1987. Effect of season of burning on grass re-covery in the false thornveld of the eastern Cape. Journalof the Grassland Society of Southern Africa 4:74–77.
Trollope, W.S. 1989. Veld burning as a management practice inlivestock production. Pages 67–73 in J.E. Danckwerts andW.R. Teague (eds.). Veld management in the eastern Cape.Government Printer, Pretoria, South Africa.
Trollope, W.S. 1990. Veld management with specific referenceto game ranching in the grassland and savanna areas ofSouth Africa. Koedoe 33:77–86.
Trollope, W.S. 1992. Veld management in grassland and savannaareas. Pages 45–55 in F.P. van Oudtshoorn (ed.). Guide tograsses of South Africa. Briza Publications, Pretoria, SouthAfrica.
Trollope, W.S. 1999. Veld burning in different vegetation types:savanna. Pages 236–242 in N.M. Tainton (ed.). Veld man-agement in South Africa. University of Natal Press, Pieter-maritzburg, South Africa.
Trollope, W.S., H. Biggs, A.L. Potgieter, and N. Zambatis. 1995.A structured versus a wilderness approach to burning in theKruger National Park in South Africa. Pages 574–575 inN.E. West (ed.). Rangelands in a sustainable biosphere. Pro-ceedings of the 5th International Rangelands Congress. So-ciety for Range Management, Denver, CO.
Trollope, W.S., and F. Dondofema. 2003. Role of fire, continuousbrowsing and grazing in controlling bush encroachment inthe arid savannas of the Eastern Cape Province in South
Africa. Pages 408–411 in N. Allsopp, A.R. Palmer, S.J.Milton, G.I.H. Kerley, K.P. Kirkman, R. Hurt, and C. Brown(eds.). Rangelands in the new millennium. Proceedings ofthe 7th International Rangeland Conference, Durban, SouthAfrica.
Trollope, W.S., R. Fyumagwa, and L.A. Trollope. 2003. Rela-tionship between range condition and the incidence of ticksin the Ngorongoro Crater, Tanzania. Pages 531–533 in N.Allsopp, A.R. Palmer, S.J. Milton, G.I.H. Kerley, K.P. Kirk-man, R. Hurt, and C. Brown (eds.). Rangelands in the newmillennium. Proceedings of the 7th International RangelandConference, Durban, South Africa.
Trollope, W.S., D.C. Hartnett, L.A. Trollope, F. Dondofema, andD.H. Brown. 2004. Comparison of fire behaviour in theKonza tall grass prairie in Kansas, USA, with fire behaviourin South African grassland and savanna ecosystems. Finalreport. Department of Livestock and Pasture Science, Uni-versity of Fort Hare, Alice, South Africa.
Trollope, W.S., C.H. Hines, and L.A. Trollope. 2000. Simplifiedtechniques for assessing range condition in the East Capriviregion of Namibia. Directorate of Forestry, Namibia–Fin-land Forestry Programme, Windhoek, Namibia.
Trollope, W.S., and A.L. Potgieter. 1985. Fire behaviour in theKruger National Park. Journal of the Grassland Society ofSouthern Africa 2:17–22.
Trollope, W.S., and A.L. Potgieter. 1986. Estimating grass fuelloads with a disc pasture meter in the Kruger National Park.Journal of the Grassland Society of Southern Africa 3:148–152.
Trollope, W.S., A.L. Potgieter, and N. Zambatis. 1990. Charac-terization of fire behaviour in the Kruger National Park.National Parks Board, Kruger National Park, Skukuza,South Africa.
Trollope, W.S., and N.M. Tainton. 1986. Effect of fire intensityon the grass and bush components of the Eastern Capethornveld. Journal of the Grassland Society of Southern Af-rica 2:27–32.
Trollope, W.S., and L.A. Trollope. 1999. Report on the assess-ment of range condition and the fire ecology of the savannavegetation on the Lewa Wildlife Conservancy in Kenya—1998. Department of Livestock and Pasture Science, Uni-versity of Fort Hare, Alice, South Africa.
Trollope, W.S.W., L.A. Trollope, and D.C. Hartnett. 2002. Firebehaviour a key factor in African grasslands and savannas.In D.X. Viegas (ed.). Forest fire research & wildland firesafety. Millpress Science Publishers, Rotterdam, Nether-lands.
van Wagner, C.E. 1973. Height of crown scorch in forest fires.Canadian Journal of Forest Research 3:373–378.
van Wilgen, B.W., C.S. Everson, and W.S. Trollope. 1990. Firemanagement in southern Africa: some examples of currentobjectives, practices and problems. Pages 179–215 in J.G.Goldammer (ed.). Fire in the tropical biota—ecosystem pro-cesses and global challenges. Ecological Studies 84. Spring-er-Verlag, Berlin, Germany.
van Wyk, P. 1971. Veld burning in the Kruger National Park—an interim report of some aspects of research. Proceedingsof the Tall Timbers Fire Ecology Conference 11:9–31.
West, O. 1965. Fire in vegetation and its use in pasture man-agement with special reference to tropical and sub-tropicalAfrica. Mimeographed Publication No. 1, CommonwealthBureau of Pastures and Field Crops, Hurley, United King-dom.
Wright, H.A., and A.W. Bailey. 1982. Fire ecology: UnitedStates and southern Canada. John Wiley & Sons, New York.
Zacharias, P.J. 1994. The fire/grazing interaction on Dohne Sour-veld. Ph.D. Dissertation, University of Natal, Pietermaritz-burg, South Africa.
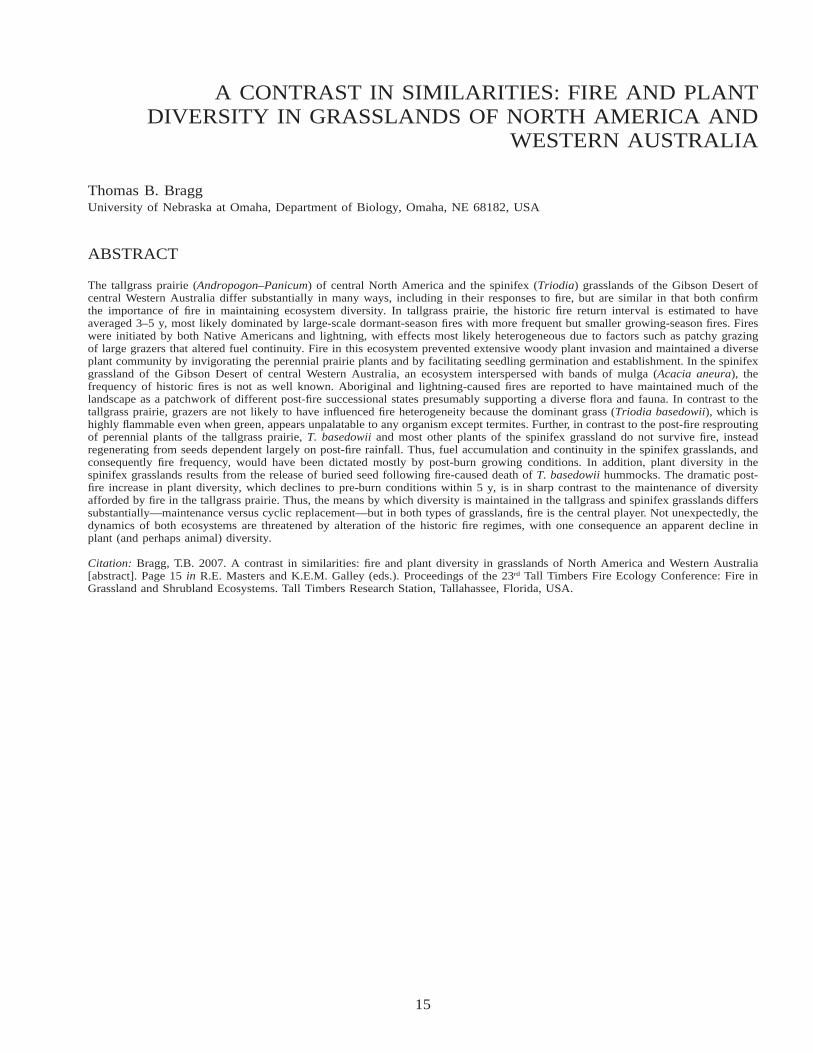
15
A CONTRAST IN SIMILARITIES: FIRE AND PLANTDIVERSITY IN GRASSLANDS OF NORTH AMERICA AND
WESTERN AUSTRALIA
Thomas B. BraggUniversity of Nebraska at Omaha, Department of Biology, Omaha, NE 68182, USA
ABSTRACT
The tallgrass prairie (Andropogon–Panicum) of central North America and the spinifex (Triodia) grasslands of the Gibson Desert ofcentral Western Australia differ substantially in many ways, including in their responses to fire, but are similar in that both confirmthe importance of fire in maintaining ecosystem diversity. In tallgrass prairie, the historic fire return interval is estimated to haveaveraged 3–5 y, most likely dominated by large-scale dormant-season fires with more frequent but smaller growing-season fires. Fireswere initiated by both Native Americans and lightning, with effects most likely heterogeneous due to factors such as patchy grazingof large grazers that altered fuel continuity. Fire in this ecosystem prevented extensive woody plant invasion and maintained a diverseplant community by invigorating the perennial prairie plants and by facilitating seedling germination and establishment. In the spinifexgrassland of the Gibson Desert of central Western Australia, an ecosystem interspersed with bands of mulga (Acacia aneura), thefrequency of historic fires is not as well known. Aboriginal and lightning-caused fires are reported to have maintained much of thelandscape as a patchwork of different post-fire successional states presumably supporting a diverse flora and fauna. In contrast to thetallgrass prairie, grazers are not likely to have influenced fire heterogeneity because the dominant grass (Triodia basedowii), which ishighly flammable even when green, appears unpalatable to any organism except termites. Further, in contrast to the post-fire resproutingof perennial plants of the tallgrass prairie, T. basedowii and most other plants of the spinifex grassland do not survive fire, insteadregenerating from seeds dependent largely on post-fire rainfall. Thus, fuel accumulation and continuity in the spinifex grasslands, andconsequently fire frequency, would have been dictated mostly by post-burn growing conditions. In addition, plant diversity in thespinifex grasslands results from the release of buried seed following fire-caused death of T. basedowii hummocks. The dramatic post-fire increase in plant diversity, which declines to pre-burn conditions within 5 y, is in sharp contrast to the maintenance of diversityafforded by fire in the tallgrass prairie. Thus, the means by which diversity is maintained in the tallgrass and spinifex grasslands differssubstantially—maintenance versus cyclic replacement—but in both types of grasslands, fire is the central player. Not unexpectedly, thedynamics of both ecosystems are threatened by alteration of the historic fire regimes, with one consequence an apparent decline inplant (and perhaps animal) diversity.
Citation: Bragg, T.B. 2007. A contrast in similarities: fire and plant diversity in grasslands of North America and Western Australia[abstract]. Page 15 in R.E. Masters and K.E.M. Galley (eds.). Proceedings of the 23rd Tall Timbers Fire Ecology Conference: Fire inGrassland and Shrubland Ecosystems. Tall Timbers Research Station, Tallahassee, Florida, USA.
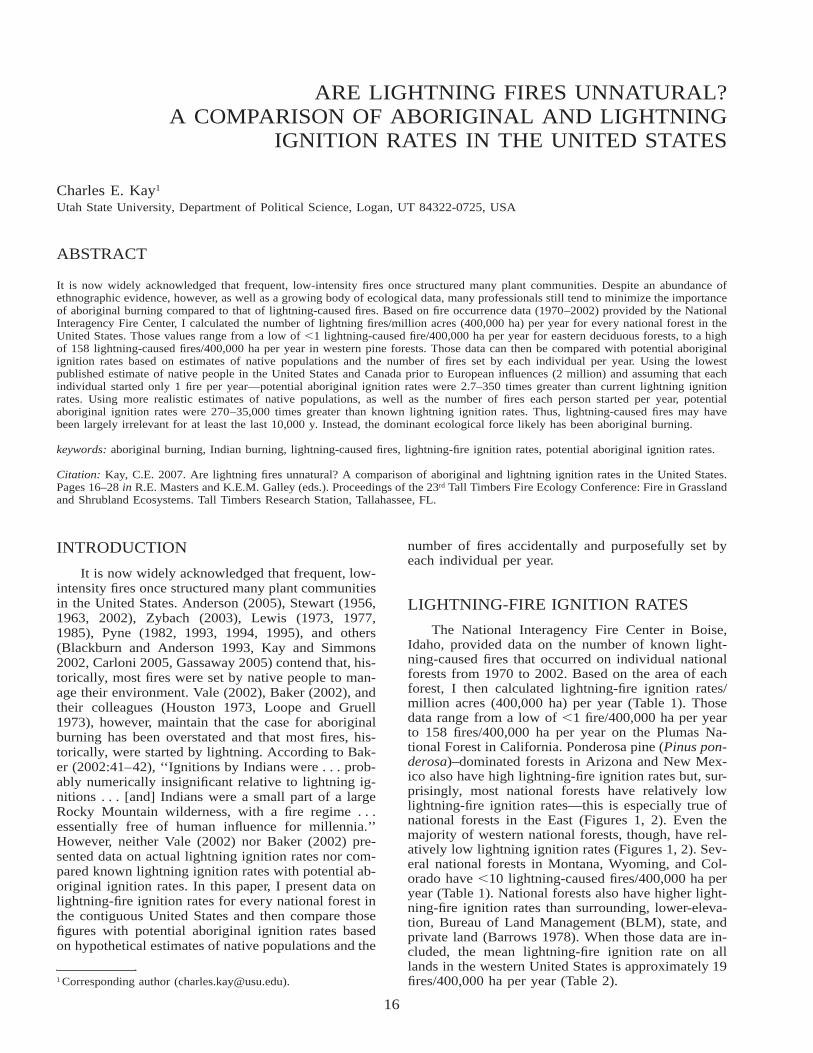
16
ARE LIGHTNING FIRES UNNATURAL?A COMPARISON OF ABORIGINAL AND LIGHTNING
IGNITION RATES IN THE UNITED STATES
Charles E. Kay1
Utah State University, Department of Political Science, Logan, UT 84322-0725, USA
ABSTRACT
It is now widely acknowledged that frequent, low-intensity fires once structured many plant communities. Despite an abundance ofethnographic evidence, however, as well as a growing body of ecological data, many professionals still tend to minimize the importanceof aboriginal burning compared to that of lightning-caused fires. Based on fire occurrence data (1970–2002) provided by the NationalInteragency Fire Center, I calculated the number of lightning fires/million acres (400,000 ha) per year for every national forest in theUnited States. Those values range from a low of �1 lightning-caused fire/400,000 ha per year for eastern deciduous forests, to a highof 158 lightning-caused fires/400,000 ha per year in western pine forests. Those data can then be compared with potential aboriginalignition rates based on estimates of native populations and the number of fires set by each individual per year. Using the lowestpublished estimate of native people in the United States and Canada prior to European influences (2 million) and assuming that eachindividual started only 1 fire per year—potential aboriginal ignition rates were 2.7–350 times greater than current lightning ignitionrates. Using more realistic estimates of native populations, as well as the number of fires each person started per year, potentialaboriginal ignition rates were 270–35,000 times greater than known lightning ignition rates. Thus, lightning-caused fires may havebeen largely irrelevant for at least the last 10,000 y. Instead, the dominant ecological force likely has been aboriginal burning.
keywords: aboriginal burning, Indian burning, lightning-caused fires, lightning-fire ignition rates, potential aboriginal ignition rates.
Citation: Kay, C.E. 2007. Are lightning fires unnatural? A comparison of aboriginal and lightning ignition rates in the United States.Pages 16–28 in R.E. Masters and K.E.M. Galley (eds.). Proceedings of the 23rd Tall Timbers Fire Ecology Conference: Fire in Grasslandand Shrubland Ecosystems. Tall Timbers Research Station, Tallahassee, FL.
INTRODUCTION
It is now widely acknowledged that frequent, low-intensity fires once structured many plant communitiesin the United States. Anderson (2005), Stewart (1956,1963, 2002), Zybach (2003), Lewis (1973, 1977,1985), Pyne (1982, 1993, 1994, 1995), and others(Blackburn and Anderson 1993, Kay and Simmons2002, Carloni 2005, Gassaway 2005) contend that, his-torically, most fires were set by native people to man-age their environment. Vale (2002), Baker (2002), andtheir colleagues (Houston 1973, Loope and Gruell1973), however, maintain that the case for aboriginalburning has been overstated and that most fires, his-torically, were started by lightning. According to Bak-er (2002:41–42), ‘‘Ignitions by Indians were . . . prob-ably numerically insignificant relative to lightning ig-nitions . . . [and] Indians were a small part of a largeRocky Mountain wilderness, with a fire regime . . .essentially free of human influence for millennia.’’However, neither Vale (2002) nor Baker (2002) pre-sented data on actual lightning ignition rates nor com-pared known lightning ignition rates with potential ab-original ignition rates. In this paper, I present data onlightning-fire ignition rates for every national forest inthe contiguous United States and then compare thosefigures with potential aboriginal ignition rates basedon hypothetical estimates of native populations and the
1 Corresponding author ([email protected]).
number of fires accidentally and purposefully set byeach individual per year.
LIGHTNING-FIRE IGNITION RATES
The National Interagency Fire Center in Boise,Idaho, provided data on the number of known light-ning-caused fires that occurred on individual nationalforests from 1970 to 2002. Based on the area of eachforest, I then calculated lightning-fire ignition rates/million acres (400,000 ha) per year (Table 1). Thosedata range from a low of �1 fire/400,000 ha per yearto 158 fires/400,000 ha per year on the Plumas Na-tional Forest in California. Ponderosa pine (Pinus pon-derosa)–dominated forests in Arizona and New Mex-ico also have high lightning-fire ignition rates but, sur-prisingly, most national forests have relatively lowlightning-fire ignition rates—this is especially true ofnational forests in the East (Figures 1, 2). Even themajority of western national forests, though, have rel-atively low lightning ignition rates (Figures 1, 2). Sev-eral national forests in Montana, Wyoming, and Col-orado have �10 lightning-caused fires/400,000 ha peryear (Table 1). National forests also have higher light-ning-fire ignition rates than surrounding, lower-eleva-tion, Bureau of Land Management (BLM), state, andprivate land (Barrows 1978). When those data are in-cluded, the mean lightning-fire ignition rate on alllands in the western United States is approximately 19fires/400,000 ha per year (Table 2).
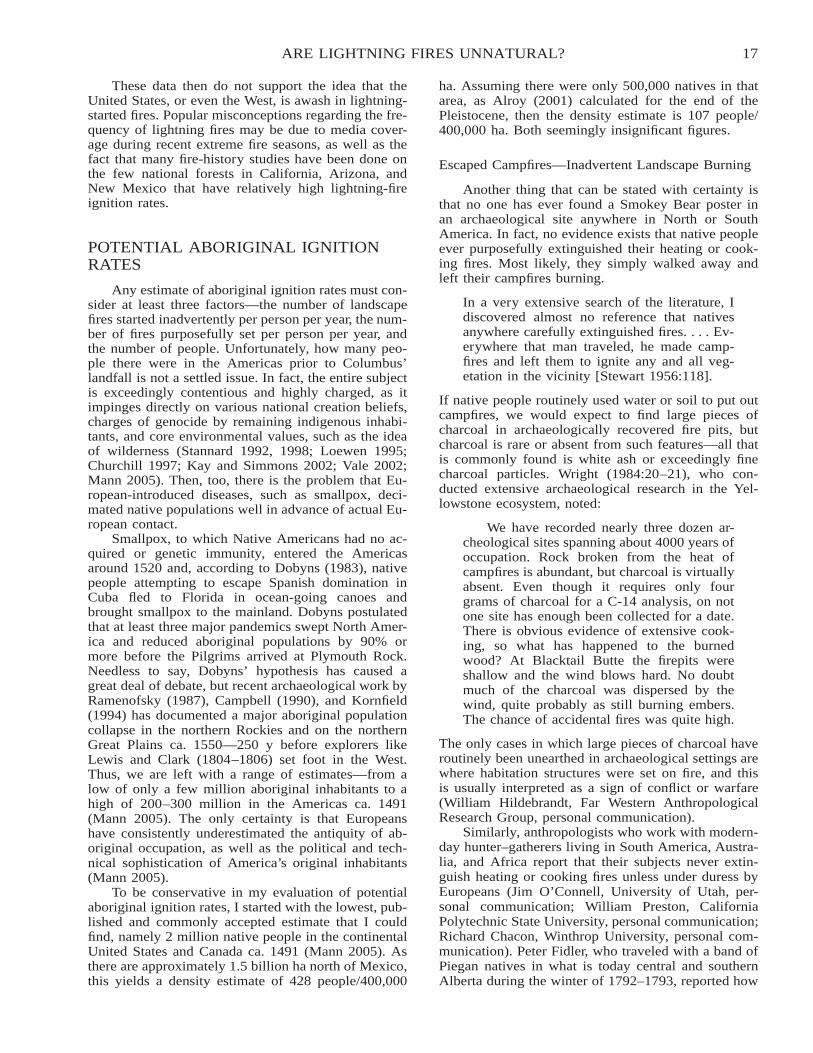
17ARE LIGHTNING FIRES UNNATURAL?
These data then do not support the idea that theUnited States, or even the West, is awash in lightning-started fires. Popular misconceptions regarding the fre-quency of lightning fires may be due to media cover-age during recent extreme fire seasons, as well as thefact that many fire-history studies have been done onthe few national forests in California, Arizona, andNew Mexico that have relatively high lightning-fireignition rates.
POTENTIAL ABORIGINAL IGNITIONRATES
Any estimate of aboriginal ignition rates must con-sider at least three factors—the number of landscapefires started inadvertently per person per year, the num-ber of fires purposefully set per person per year, andthe number of people. Unfortunately, how many peo-ple there were in the Americas prior to Columbus’landfall is not a settled issue. In fact, the entire subjectis exceedingly contentious and highly charged, as itimpinges directly on various national creation beliefs,charges of genocide by remaining indigenous inhabi-tants, and core environmental values, such as the ideaof wilderness (Stannard 1992, 1998; Loewen 1995;Churchill 1997; Kay and Simmons 2002; Vale 2002;Mann 2005). Then, too, there is the problem that Eu-ropean-introduced diseases, such as smallpox, deci-mated native populations well in advance of actual Eu-ropean contact.
Smallpox, to which Native Americans had no ac-quired or genetic immunity, entered the Americasaround 1520 and, according to Dobyns (1983), nativepeople attempting to escape Spanish domination inCuba fled to Florida in ocean-going canoes andbrought smallpox to the mainland. Dobyns postulatedthat at least three major pandemics swept North Amer-ica and reduced aboriginal populations by 90% ormore before the Pilgrims arrived at Plymouth Rock.Needless to say, Dobyns’ hypothesis has caused agreat deal of debate, but recent archaeological work byRamenofsky (1987), Campbell (1990), and Kornfield(1994) has documented a major aboriginal populationcollapse in the northern Rockies and on the northernGreat Plains ca. 1550—250 y before explorers likeLewis and Clark (1804–1806) set foot in the West.Thus, we are left with a range of estimates—from alow of only a few million aboriginal inhabitants to ahigh of 200–300 million in the Americas ca. 1491(Mann 2005). The only certainty is that Europeanshave consistently underestimated the antiquity of ab-original occupation, as well as the political and tech-nical sophistication of America’s original inhabitants(Mann 2005).
To be conservative in my evaluation of potentialaboriginal ignition rates, I started with the lowest, pub-lished and commonly accepted estimate that I couldfind, namely 2 million native people in the continentalUnited States and Canada ca. 1491 (Mann 2005). Asthere are approximately 1.5 billion ha north of Mexico,this yields a density estimate of 428 people/400,000
ha. Assuming there were only 500,000 natives in thatarea, as Alroy (2001) calculated for the end of thePleistocene, then the density estimate is 107 people/400,000 ha. Both seemingly insignificant figures.
Escaped Campfires—Inadvertent Landscape Burning
Another thing that can be stated with certainty isthat no one has ever found a Smokey Bear poster inan archaeological site anywhere in North or SouthAmerica. In fact, no evidence exists that native peopleever purposefully extinguished their heating or cook-ing fires. Most likely, they simply walked away andleft their campfires burning.
In a very extensive search of the literature, Idiscovered almost no reference that nativesanywhere carefully extinguished fires. . . . Ev-erywhere that man traveled, he made camp-fires and left them to ignite any and all veg-etation in the vicinity [Stewart 1956:118].
If native people routinely used water or soil to put outcampfires, we would expect to find large pieces ofcharcoal in archaeologically recovered fire pits, butcharcoal is rare or absent from such features—all thatis commonly found is white ash or exceedingly finecharcoal particles. Wright (1984:20–21), who con-ducted extensive archaeological research in the Yel-lowstone ecosystem, noted:
We have recorded nearly three dozen ar-cheological sites spanning about 4000 years ofoccupation. Rock broken from the heat ofcampfires is abundant, but charcoal is virtuallyabsent. Even though it requires only fourgrams of charcoal for a C-14 analysis, on notone site has enough been collected for a date.There is obvious evidence of extensive cook-ing, so what has happened to the burnedwood? At Blacktail Butte the firepits wereshallow and the wind blows hard. No doubtmuch of the charcoal was dispersed by thewind, quite probably as still burning embers.The chance of accidental fires was quite high.
The only cases in which large pieces of charcoal haveroutinely been unearthed in archaeological settings arewhere habitation structures were set on fire, and thisis usually interpreted as a sign of conflict or warfare(William Hildebrandt, Far Western AnthropologicalResearch Group, personal communication).
Similarly, anthropologists who work with modern-day hunter–gatherers living in South America, Austra-lia, and Africa report that their subjects never extin-guish heating or cooking fires unless under duress byEuropeans (Jim O’Connell, University of Utah, per-sonal communication; William Preston, CaliforniaPolytechnic State University, personal communication;Richard Chacon, Winthrop University, personal com-munication). Peter Fidler, who traveled with a band ofPiegan natives in what is today central and southernAlberta during the winter of 1792–1793, reported how
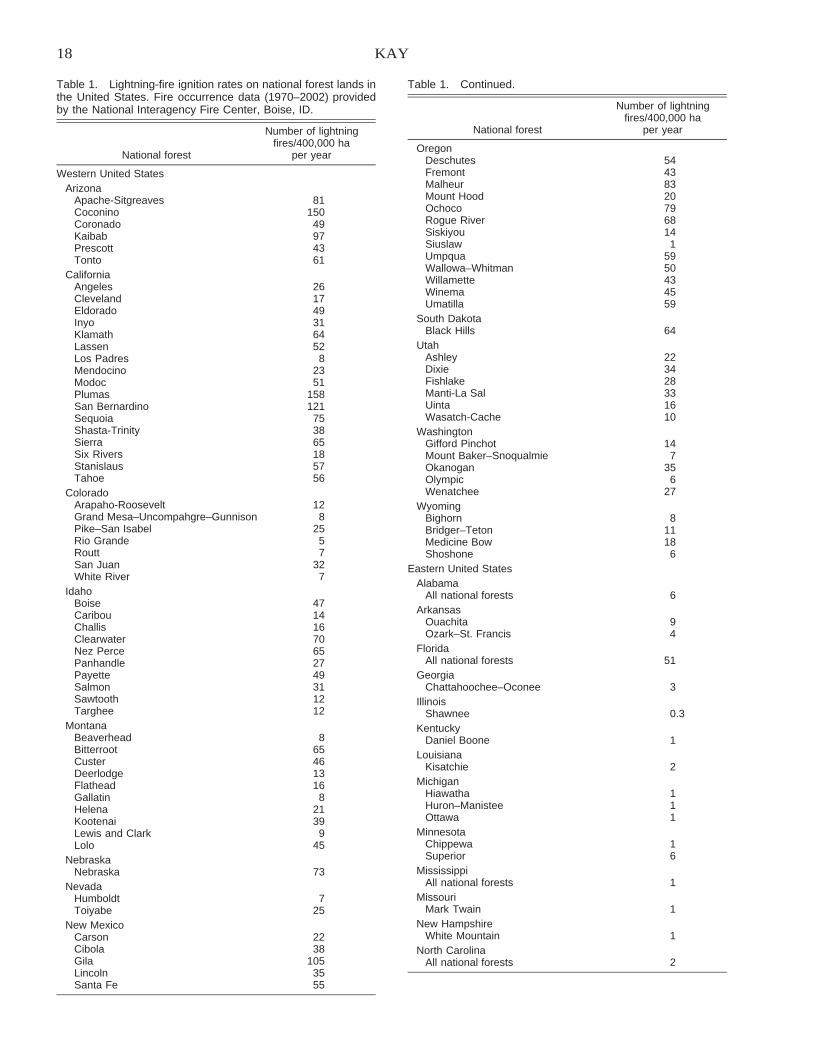
18 KAY
Table 1. Lightning-fire ignition rates on national forest lands inthe United States. Fire occurrence data (1970–2002) providedby the National Interagency Fire Center, Boise, ID.
National forest
Number of lightningfires/400,000 ha
per year
Western United StatesArizona
Apache-Sitgreaves 81Coconino 150Coronado 49Kaibab 97Prescott 43Tonto 61
CaliforniaAngeles 26Cleveland 17Eldorado 49Inyo 31Klamath 64Lassen 52Los Padres 8Mendocino 23Modoc 51Plumas 158San Bernardino 121Sequoia 75Shasta-Trinity 38Sierra 65Six Rivers 18Stanislaus 57Tahoe 56
ColoradoArapaho-Roosevelt 12Grand Mesa–Uncompahgre–Gunnison 8Pike–San Isabel 25Rio Grande 5Routt 7San Juan 32White River 7
IdahoBoise 47Caribou 14Challis 16Clearwater 70Nez Perce 65Panhandle 27Payette 49Salmon 31Sawtooth 12Targhee 12
MontanaBeaverhead 8Bitterroot 65Custer 46Deerlodge 13Flathead 16Gallatin 8Helena 21Kootenai 39Lewis and Clark 9Lolo 45
NebraskaNebraska 73
NevadaHumboldt 7Toiyabe 25
New MexicoCarson 22Cibola 38Gila 105Lincoln 35Santa Fe 55
Table 1. Continued.
National forest
Number of lightningfires/400,000 ha
per year
OregonDeschutes 54Fremont 43Malheur 83Mount Hood 20Ochoco 79Rogue River 68Siskiyou 14Siuslaw 1Umpqua 59Wallowa–Whitman 50Willamette 43Winema 45Umatilla 59
South DakotaBlack Hills 64
UtahAshley 22Dixie 34Fishlake 28Manti-La Sal 33Uinta 16Wasatch-Cache 10
WashingtonGifford Pinchot 14Mount Baker–Snoqualmie 7Okanogan 35Olympic 6Wenatchee 27
WyomingBighorn 8Bridger–Teton 11Medicine Bow 18Shoshone 6
Eastern United StatesAlabama
All national forests 6Arkansas
Ouachita 9Ozark–St. Francis 4
FloridaAll national forests 51
GeorgiaChattahoochee–Oconee 3
IllinoisShawnee 0.3
KentuckyDaniel Boone 1
LouisianaKisatchie 2
MichiganHiawatha 1Huron–Manistee 1Ottawa 1
MinnesotaChippewa 1Superior 6
MississippiAll national forests 1
MissouriMark Twain 1
New HampshireWhite Mountain 1
North CarolinaAll national forests 2
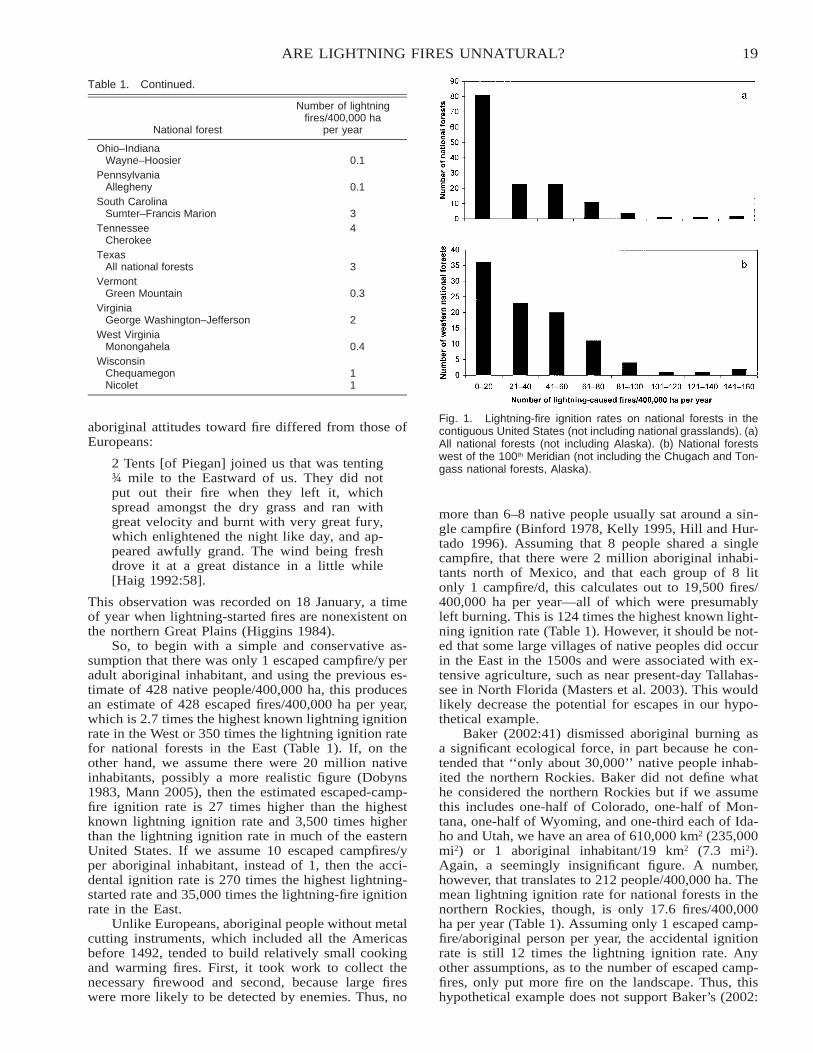
19ARE LIGHTNING FIRES UNNATURAL?
Table 1. Continued.
National forest
Number of lightningfires/400,000 ha
per year
Ohio–IndianaWayne–Hoosier 0.1
PennsylvaniaAllegheny 0.1
South CarolinaSumter–Francis Marion 3
TennesseeCherokee
4
TexasAll national forests 3
VermontGreen Mountain 0.3
VirginiaGeorge Washington–Jefferson 2
West VirginiaMonongahela 0.4
WisconsinChequamegon 1Nicolet 1
Fig. 1. Lightning-fire ignition rates on national forests in thecontiguous United States (not including national grasslands). (a)All national forests (not including Alaska). (b) National forestswest of the 100th Meridian (not including the Chugach and Ton-gass national forests, Alaska).
aboriginal attitudes toward fire differed from those ofEuropeans:
2 Tents [of Piegan] joined us that was tenting¾ mile to the Eastward of us. They did notput out their fire when they left it, whichspread amongst the dry grass and ran withgreat velocity and burnt with very great fury,which enlightened the night like day, and ap-peared awfully grand. The wind being freshdrove it at a great distance in a little while[Haig 1992:58].
This observation was recorded on 18 January, a timeof year when lightning-started fires are nonexistent onthe northern Great Plains (Higgins 1984).
So, to begin with a simple and conservative as-sumption that there was only 1 escaped campfire/y peradult aboriginal inhabitant, and using the previous es-timate of 428 native people/400,000 ha, this producesan estimate of 428 escaped fires/400,000 ha per year,which is 2.7 times the highest known lightning ignitionrate in the West or 350 times the lightning ignition ratefor national forests in the East (Table 1). If, on theother hand, we assume there were 20 million nativeinhabitants, possibly a more realistic figure (Dobyns1983, Mann 2005), then the estimated escaped-camp-fire ignition rate is 27 times higher than the highestknown lightning ignition rate and 3,500 times higherthan the lightning ignition rate in much of the easternUnited States. If we assume 10 escaped campfires/yper aboriginal inhabitant, instead of 1, then the acci-dental ignition rate is 270 times the highest lightning-started rate and 35,000 times the lightning-fire ignitionrate in the East.
Unlike Europeans, aboriginal people without metalcutting instruments, which included all the Americasbefore 1492, tended to build relatively small cookingand warming fires. First, it took work to collect thenecessary firewood and second, because large fireswere more likely to be detected by enemies. Thus, no
more than 6–8 native people usually sat around a sin-gle campfire (Binford 1978, Kelly 1995, Hill and Hur-tado 1996). Assuming that 8 people shared a singlecampfire, that there were 2 million aboriginal inhabi-tants north of Mexico, and that each group of 8 litonly 1 campfire/d, this calculates out to 19,500 fires/400,000 ha per year—all of which were presumablyleft burning. This is 124 times the highest known light-ning ignition rate (Table 1). However, it should be not-ed that some large villages of native peoples did occurin the East in the 1500s and were associated with ex-tensive agriculture, such as near present-day Tallahas-see in North Florida (Masters et al. 2003). This wouldlikely decrease the potential for escapes in our hypo-thetical example.
Baker (2002:41) dismissed aboriginal burning asa significant ecological force, in part because he con-tended that ‘‘only about 30,000’’ native people inhab-ited the northern Rockies. Baker did not define whathe considered the northern Rockies but if we assumethis includes one-half of Colorado, one-half of Mon-tana, one-half of Wyoming, and one-third each of Ida-ho and Utah, we have an area of 610,000 km2 (235,000mi2) or 1 aboriginal inhabitant/19 km2 (7.3 mi2).Again, a seemingly insignificant figure. A number,however, that translates to 212 people/400,000 ha. Themean lightning ignition rate for national forests in thenorthern Rockies, though, is only 17.6 fires/400,000ha per year (Table 1). Assuming only 1 escaped camp-fire/aboriginal person per year, the accidental ignitionrate is still 12 times the lightning ignition rate. Anyother assumptions, as to the number of escaped camp-fires, only put more fire on the landscape. Thus, thishypothetical example does not support Baker’s (2002:
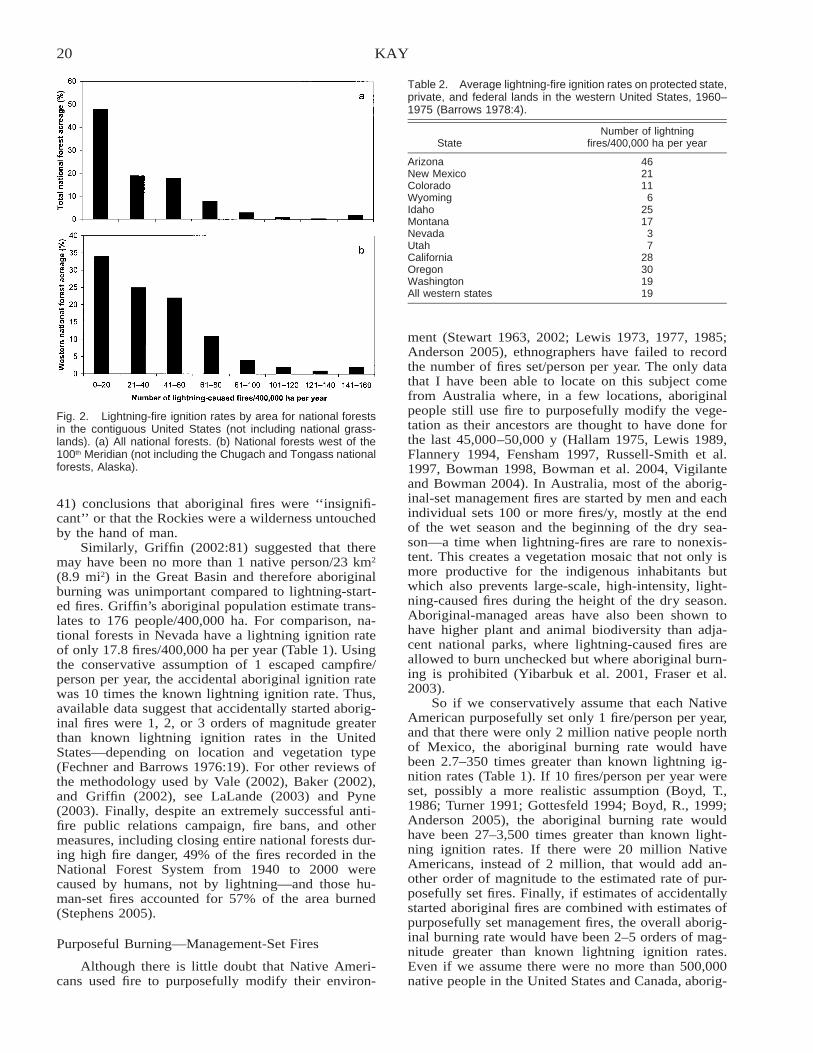
20 KAY
Fig. 2. Lightning-fire ignition rates by area for national forestsin the contiguous United States (not including national grass-lands). (a) All national forests. (b) National forests west of the100th Meridian (not including the Chugach and Tongass nationalforests, Alaska).
Table 2. Average lightning-fire ignition rates on protected state,private, and federal lands in the western United States, 1960–1975 (Barrows 1978:4).
StateNumber of lightning
fires/400,000 ha per year
Arizona 46New Mexico 21Colorado 11Wyoming 6Idaho 25Montana 17Nevada 3Utah 7California 28Oregon 30Washington 19All western states 19
41) conclusions that aboriginal fires were ‘‘insignifi-cant’’ or that the Rockies were a wilderness untouchedby the hand of man.
Similarly, Griffin (2002:81) suggested that theremay have been no more than 1 native person/23 km2
(8.9 mi2) in the Great Basin and therefore aboriginalburning was unimportant compared to lightning-start-ed fires. Griffin’s aboriginal population estimate trans-lates to 176 people/400,000 ha. For comparison, na-tional forests in Nevada have a lightning ignition rateof only 17.8 fires/400,000 ha per year (Table 1). Usingthe conservative assumption of 1 escaped campfire/person per year, the accidental aboriginal ignition ratewas 10 times the known lightning ignition rate. Thus,available data suggest that accidentally started aborig-inal fires were 1, 2, or 3 orders of magnitude greaterthan known lightning ignition rates in the UnitedStates—depending on location and vegetation type(Fechner and Barrows 1976:19). For other reviews ofthe methodology used by Vale (2002), Baker (2002),and Griffin (2002), see LaLande (2003) and Pyne(2003). Finally, despite an extremely successful anti-fire public relations campaign, fire bans, and othermeasures, including closing entire national forests dur-ing high fire danger, 49% of the fires recorded in theNational Forest System from 1940 to 2000 werecaused by humans, not by lightning—and those hu-man-set fires accounted for 57% of the area burned(Stephens 2005).
Purposeful Burning—Management-Set Fires
Although there is little doubt that Native Ameri-cans used fire to purposefully modify their environ-
ment (Stewart 1963, 2002; Lewis 1973, 1977, 1985;Anderson 2005), ethnographers have failed to recordthe number of fires set/person per year. The only datathat I have been able to locate on this subject comefrom Australia where, in a few locations, aboriginalpeople still use fire to purposefully modify the vege-tation as their ancestors are thought to have done forthe last 45,000–50,000 y (Hallam 1975, Lewis 1989,Flannery 1994, Fensham 1997, Russell-Smith et al.1997, Bowman 1998, Bowman et al. 2004, Vigilanteand Bowman 2004). In Australia, most of the aborig-inal-set management fires are started by men and eachindividual sets 100 or more fires/y, mostly at the endof the wet season and the beginning of the dry sea-son—a time when lightning-fires are rare to nonexis-tent. This creates a vegetation mosaic that not only ismore productive for the indigenous inhabitants butwhich also prevents large-scale, high-intensity, light-ning-caused fires during the height of the dry season.Aboriginal-managed areas have also been shown tohave higher plant and animal biodiversity than adja-cent national parks, where lightning-caused fires areallowed to burn unchecked but where aboriginal burn-ing is prohibited (Yibarbuk et al. 2001, Fraser et al.2003).
So if we conservatively assume that each NativeAmerican purposefully set only 1 fire/person per year,and that there were only 2 million native people northof Mexico, the aboriginal burning rate would havebeen 2.7–350 times greater than known lightning ig-nition rates (Table 1). If 10 fires/person per year wereset, possibly a more realistic assumption (Boyd, T.,1986; Turner 1991; Gottesfeld 1994; Boyd, R., 1999;Anderson 2005), the aboriginal burning rate wouldhave been 27–3,500 times greater than known light-ning ignition rates. If there were 20 million NativeAmericans, instead of 2 million, that would add an-other order of magnitude to the estimated rate of pur-posefully set fires. Finally, if estimates of accidentallystarted aboriginal fires are combined with estimates ofpurposefully set management fires, the overall aborig-inal burning rate would have been 2–5 orders of mag-nitude greater than known lightning ignition rates.Even if we assume there were no more than 500,000native people in the United States and Canada, aborig-
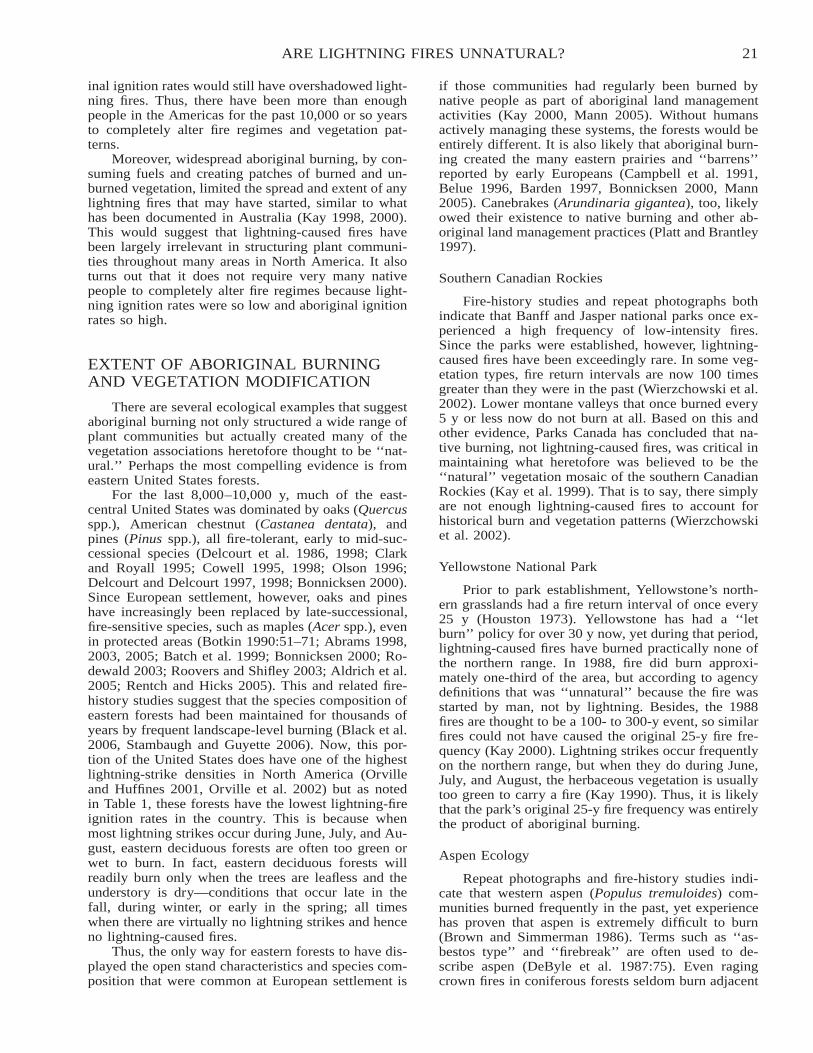
21ARE LIGHTNING FIRES UNNATURAL?
inal ignition rates would still have overshadowed light-ning fires. Thus, there have been more than enoughpeople in the Americas for the past 10,000 or so yearsto completely alter fire regimes and vegetation pat-terns.
Moreover, widespread aboriginal burning, by con-suming fuels and creating patches of burned and un-burned vegetation, limited the spread and extent of anylightning fires that may have started, similar to whathas been documented in Australia (Kay 1998, 2000).This would suggest that lightning-caused fires havebeen largely irrelevant in structuring plant communi-ties throughout many areas in North America. It alsoturns out that it does not require very many nativepeople to completely alter fire regimes because light-ning ignition rates were so low and aboriginal ignitionrates so high.
EXTENT OF ABORIGINAL BURNINGAND VEGETATION MODIFICATION
There are several ecological examples that suggestaboriginal burning not only structured a wide range ofplant communities but actually created many of thevegetation associations heretofore thought to be ‘‘nat-ural.’’ Perhaps the most compelling evidence is fromeastern United States forests.
For the last 8,000–10,000 y, much of the east-central United States was dominated by oaks (Quercusspp.), American chestnut (Castanea dentata), andpines (Pinus spp.), all fire-tolerant, early to mid-suc-cessional species (Delcourt et al. 1986, 1998; Clarkand Royall 1995; Cowell 1995, 1998; Olson 1996;Delcourt and Delcourt 1997, 1998; Bonnicksen 2000).Since European settlement, however, oaks and pineshave increasingly been replaced by late-successional,fire-sensitive species, such as maples (Acer spp.), evenin protected areas (Botkin 1990:51–71; Abrams 1998,2003, 2005; Batch et al. 1999; Bonnicksen 2000; Ro-dewald 2003; Roovers and Shifley 2003; Aldrich et al.2005; Rentch and Hicks 2005). This and related fire-history studies suggest that the species composition ofeastern forests had been maintained for thousands ofyears by frequent landscape-level burning (Black et al.2006, Stambaugh and Guyette 2006). Now, this por-tion of the United States does have one of the highestlightning-strike densities in North America (Orvilleand Huffines 2001, Orville et al. 2002) but as notedin Table 1, these forests have the lowest lightning-fireignition rates in the country. This is because whenmost lightning strikes occur during June, July, and Au-gust, eastern deciduous forests are often too green orwet to burn. In fact, eastern deciduous forests willreadily burn only when the trees are leafless and theunderstory is dry—conditions that occur late in thefall, during winter, or early in the spring; all timeswhen there are virtually no lightning strikes and henceno lightning-caused fires.
Thus, the only way for eastern forests to have dis-played the open stand characteristics and species com-position that were common at European settlement is
if those communities had regularly been burned bynative people as part of aboriginal land managementactivities (Kay 2000, Mann 2005). Without humansactively managing these systems, the forests would beentirely different. It is also likely that aboriginal burn-ing created the many eastern prairies and ‘‘barrens’’reported by early Europeans (Campbell et al. 1991,Belue 1996, Barden 1997, Bonnicksen 2000, Mann2005). Canebrakes (Arundinaria gigantea), too, likelyowed their existence to native burning and other ab-original land management practices (Platt and Brantley1997).
Southern Canadian Rockies
Fire-history studies and repeat photographs bothindicate that Banff and Jasper national parks once ex-perienced a high frequency of low-intensity fires.Since the parks were established, however, lightning-caused fires have been exceedingly rare. In some veg-etation types, fire return intervals are now 100 timesgreater than they were in the past (Wierzchowski et al.2002). Lower montane valleys that once burned every5 y or less now do not burn at all. Based on this andother evidence, Parks Canada has concluded that na-tive burning, not lightning-caused fires, was critical inmaintaining what heretofore was believed to be the‘‘natural’’ vegetation mosaic of the southern CanadianRockies (Kay et al. 1999). That is to say, there simplyare not enough lightning-caused fires to account forhistorical burn and vegetation patterns (Wierzchowskiet al. 2002).
Yellowstone National Park
Prior to park establishment, Yellowstone’s north-ern grasslands had a fire return interval of once every25 y (Houston 1973). Yellowstone has had a ‘‘letburn’’ policy for over 30 y now, yet during that period,lightning-caused fires have burned practically none ofthe northern range. In 1988, fire did burn approxi-mately one-third of the area, but according to agencydefinitions that was ‘‘unnatural’’ because the fire wasstarted by man, not by lightning. Besides, the 1988fires are thought to be a 100- to 300-y event, so similarfires could not have caused the original 25-y fire fre-quency (Kay 2000). Lightning strikes occur frequentlyon the northern range, but when they do during June,July, and August, the herbaceous vegetation is usuallytoo green to carry a fire (Kay 1990). Thus, it is likelythat the park’s original 25-y fire frequency was entirelythe product of aboriginal burning.
Aspen Ecology
Repeat photographs and fire-history studies indi-cate that western aspen (Populus tremuloides) com-munities burned frequently in the past, yet experiencehas proven that aspen is extremely difficult to burn(Brown and Simmerman 1986). Terms such as ‘‘as-bestos type’’ and ‘‘firebreak’’ are often used to de-scribe aspen (DeByle et al. 1987:75). Even ragingcrown fires in coniferous forests seldom burn adjacent
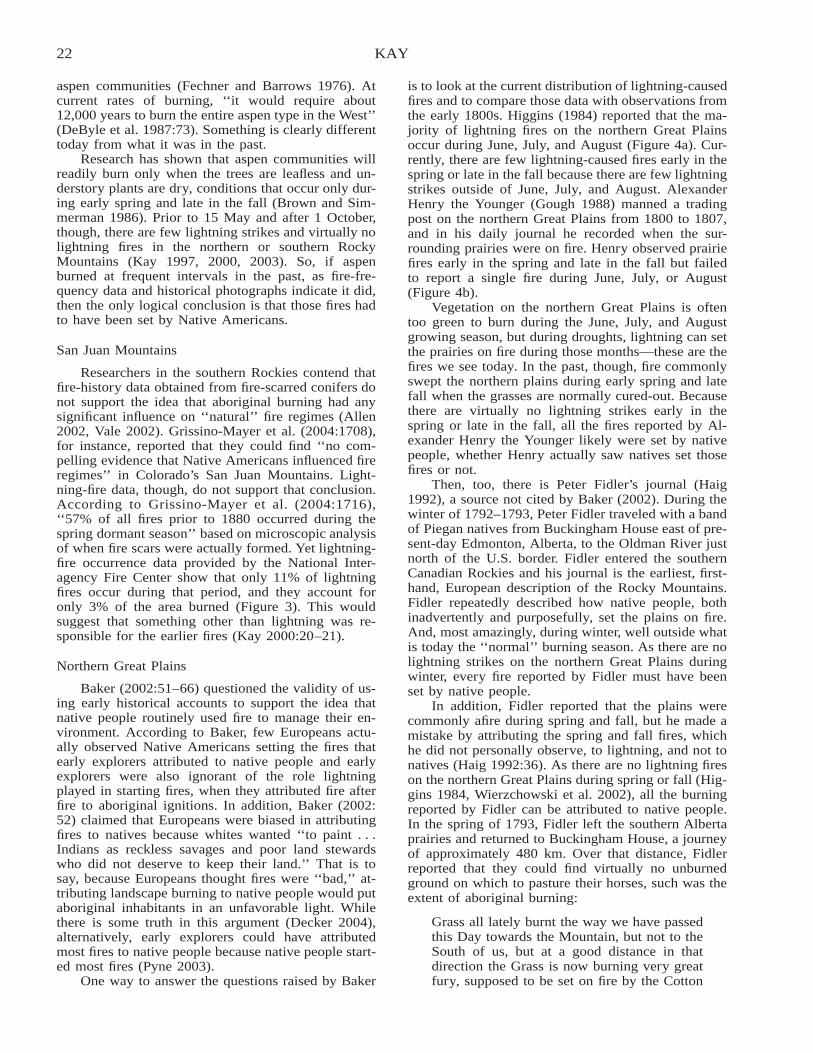
22 KAY
aspen communities (Fechner and Barrows 1976). Atcurrent rates of burning, ‘‘it would require about12,000 years to burn the entire aspen type in the West’’(DeByle et al. 1987:73). Something is clearly differenttoday from what it was in the past.
Research has shown that aspen communities willreadily burn only when the trees are leafless and un-derstory plants are dry, conditions that occur only dur-ing early spring and late in the fall (Brown and Sim-merman 1986). Prior to 15 May and after 1 October,though, there are few lightning strikes and virtually nolightning fires in the northern or southern RockyMountains (Kay 1997, 2000, 2003). So, if aspenburned at frequent intervals in the past, as fire-fre-quency data and historical photographs indicate it did,then the only logical conclusion is that those fires hadto have been set by Native Americans.
San Juan Mountains
Researchers in the southern Rockies contend thatfire-history data obtained from fire-scarred conifers donot support the idea that aboriginal burning had anysignificant influence on ‘‘natural’’ fire regimes (Allen2002, Vale 2002). Grissino-Mayer et al. (2004:1708),for instance, reported that they could find ‘‘no com-pelling evidence that Native Americans influenced fireregimes’’ in Colorado’s San Juan Mountains. Light-ning-fire data, though, do not support that conclusion.According to Grissino-Mayer et al. (2004:1716),‘‘57% of all fires prior to 1880 occurred during thespring dormant season’’ based on microscopic analysisof when fire scars were actually formed. Yet lightning-fire occurrence data provided by the National Inter-agency Fire Center show that only 11% of lightningfires occur during that period, and they account foronly 3% of the area burned (Figure 3). This wouldsuggest that something other than lightning was re-sponsible for the earlier fires (Kay 2000:20–21).
Northern Great Plains
Baker (2002:51–66) questioned the validity of us-ing early historical accounts to support the idea thatnative people routinely used fire to manage their en-vironment. According to Baker, few Europeans actu-ally observed Native Americans setting the fires thatearly explorers attributed to native people and earlyexplorers were also ignorant of the role lightningplayed in starting fires, when they attributed fire afterfire to aboriginal ignitions. In addition, Baker (2002:52) claimed that Europeans were biased in attributingfires to natives because whites wanted ‘‘to paint . . .Indians as reckless savages and poor land stewardswho did not deserve to keep their land.’’ That is tosay, because Europeans thought fires were ‘‘bad,’’ at-tributing landscape burning to native people would putaboriginal inhabitants in an unfavorable light. Whilethere is some truth in this argument (Decker 2004),alternatively, early explorers could have attributedmost fires to native people because native people start-ed most fires (Pyne 2003).
One way to answer the questions raised by Baker
is to look at the current distribution of lightning-causedfires and to compare those data with observations fromthe early 1800s. Higgins (1984) reported that the ma-jority of lightning fires on the northern Great Plainsoccur during June, July, and August (Figure 4a). Cur-rently, there are few lightning-caused fires early in thespring or late in the fall because there are few lightningstrikes outside of June, July, and August. AlexanderHenry the Younger (Gough 1988) manned a tradingpost on the northern Great Plains from 1800 to 1807,and in his daily journal he recorded when the sur-rounding prairies were on fire. Henry observed prairiefires early in the spring and late in the fall but failedto report a single fire during June, July, or August(Figure 4b).
Vegetation on the northern Great Plains is oftentoo green to burn during the June, July, and Augustgrowing season, but during droughts, lightning can setthe prairies on fire during those months—these are thefires we see today. In the past, though, fire commonlyswept the northern plains during early spring and latefall when the grasses are normally cured-out. Becausethere are virtually no lightning strikes early in thespring or late in the fall, all the fires reported by Al-exander Henry the Younger likely were set by nativepeople, whether Henry actually saw natives set thosefires or not.
Then, too, there is Peter Fidler’s journal (Haig1992), a source not cited by Baker (2002). During thewinter of 1792–1793, Peter Fidler traveled with a bandof Piegan natives from Buckingham House east of pre-sent-day Edmonton, Alberta, to the Oldman River justnorth of the U.S. border. Fidler entered the southernCanadian Rockies and his journal is the earliest, first-hand, European description of the Rocky Mountains.Fidler repeatedly described how native people, bothinadvertently and purposefully, set the plains on fire.And, most amazingly, during winter, well outside whatis today the ‘‘normal’’ burning season. As there are nolightning strikes on the northern Great Plains duringwinter, every fire reported by Fidler must have beenset by native people.
In addition, Fidler reported that the plains werecommonly afire during spring and fall, but he made amistake by attributing the spring and fall fires, whichhe did not personally observe, to lightning, and not tonatives (Haig 1992:36). As there are no lightning fireson the northern Great Plains during spring or fall (Hig-gins 1984, Wierzchowski et al. 2002), all the burningreported by Fidler can be attributed to native people.In the spring of 1793, Fidler left the southern Albertaprairies and returned to Buckingham House, a journeyof approximately 480 km. Over that distance, Fidlerreported that they could find virtually no unburnedground on which to pasture their horses, such was theextent of aboriginal burning:
Grass all lately burnt the way we have passedthis Day towards the Mountain, but not to theSouth of us, but at a good distance in thatdirection the Grass is now burning very greatfury, supposed to be set on fire by the Cotton
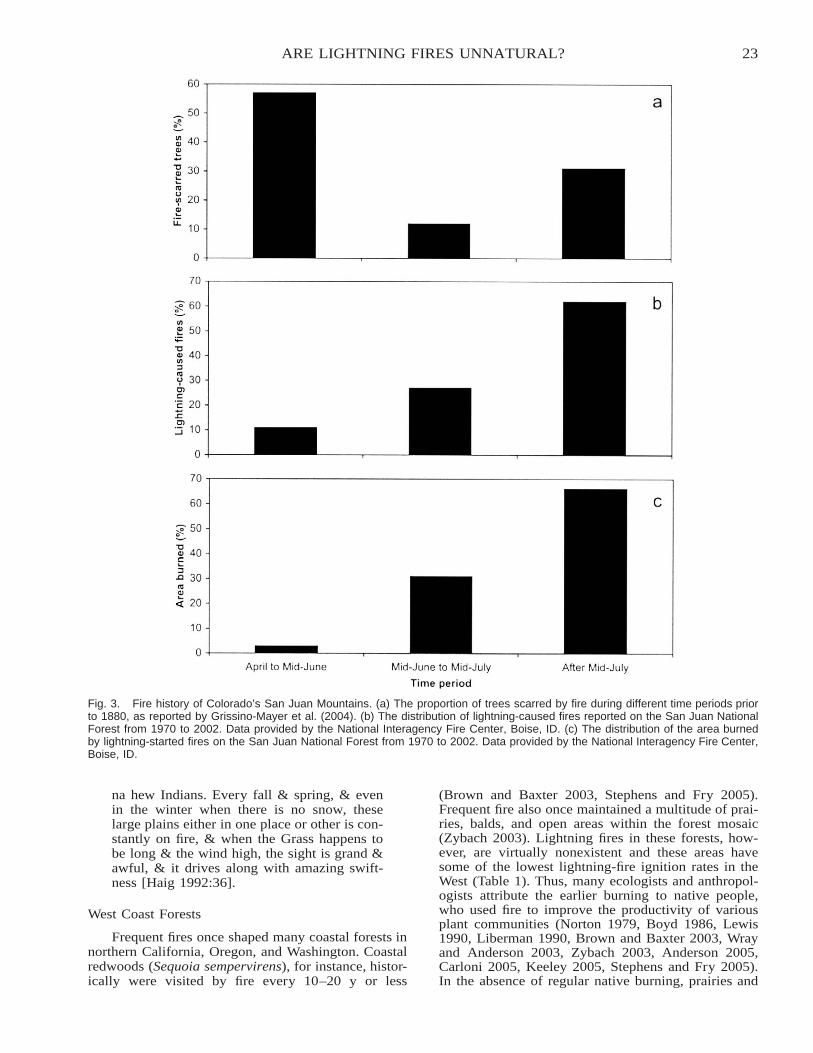
23ARE LIGHTNING FIRES UNNATURAL?
Fig. 3. Fire history of Colorado’s San Juan Mountains. (a) The proportion of trees scarred by fire during different time periods priorto 1880, as reported by Grissino-Mayer et al. (2004). (b) The distribution of lightning-caused fires reported on the San Juan NationalForest from 1970 to 2002. Data provided by the National Interagency Fire Center, Boise, ID. (c) The distribution of the area burnedby lightning-started fires on the San Juan National Forest from 1970 to 2002. Data provided by the National Interagency Fire Center,Boise, ID.
na hew Indians. Every fall & spring, & evenin the winter when there is no snow, theselarge plains either in one place or other is con-stantly on fire, & when the Grass happens tobe long & the wind high, the sight is grand &awful, & it drives along with amazing swift-ness [Haig 1992:36].
West Coast Forests
Frequent fires once shaped many coastal forests innorthern California, Oregon, and Washington. Coastalredwoods (Sequoia sempervirens), for instance, histor-ically were visited by fire every 10–20 y or less
(Brown and Baxter 2003, Stephens and Fry 2005).Frequent fire also once maintained a multitude of prai-ries, balds, and open areas within the forest mosaic(Zybach 2003). Lightning fires in these forests, how-ever, are virtually nonexistent and these areas havesome of the lowest lightning-fire ignition rates in theWest (Table 1). Thus, many ecologists and anthropol-ogists attribute the earlier burning to native people,who used fire to improve the productivity of variousplant communities (Norton 1979, Boyd 1986, Lewis1990, Liberman 1990, Brown and Baxter 2003, Wrayand Anderson 2003, Zybach 2003, Anderson 2005,Carloni 2005, Keeley 2005, Stephens and Fry 2005).In the absence of regular native burning, prairies and
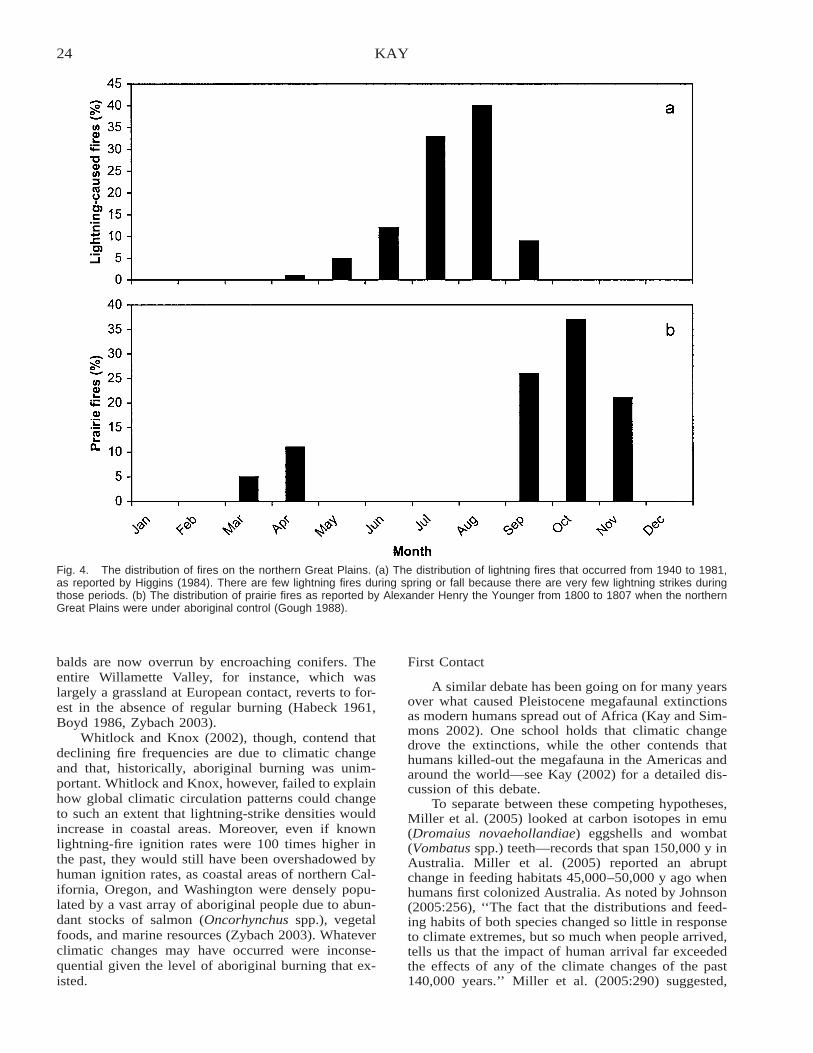
24 KAY
Fig. 4. The distribution of fires on the northern Great Plains. (a) The distribution of lightning fires that occurred from 1940 to 1981,as reported by Higgins (1984). There are few lightning fires during spring or fall because there are very few lightning strikes duringthose periods. (b) The distribution of prairie fires as reported by Alexander Henry the Younger from 1800 to 1807 when the northernGreat Plains were under aboriginal control (Gough 1988).
balds are now overrun by encroaching conifers. Theentire Willamette Valley, for instance, which waslargely a grassland at European contact, reverts to for-est in the absence of regular burning (Habeck 1961,Boyd 1986, Zybach 2003).
Whitlock and Knox (2002), though, contend thatdeclining fire frequencies are due to climatic changeand that, historically, aboriginal burning was unim-portant. Whitlock and Knox, however, failed to explainhow global climatic circulation patterns could changeto such an extent that lightning-strike densities wouldincrease in coastal areas. Moreover, even if knownlightning-fire ignition rates were 100 times higher inthe past, they would still have been overshadowed byhuman ignition rates, as coastal areas of northern Cal-ifornia, Oregon, and Washington were densely popu-lated by a vast array of aboriginal people due to abun-dant stocks of salmon (Oncorhynchus spp.), vegetalfoods, and marine resources (Zybach 2003). Whateverclimatic changes may have occurred were inconse-quential given the level of aboriginal burning that ex-isted.
First Contact
A similar debate has been going on for many yearsover what caused Pleistocene megafaunal extinctionsas modern humans spread out of Africa (Kay and Sim-mons 2002). One school holds that climatic changedrove the extinctions, while the other contends thathumans killed-out the megafauna in the Americas andaround the world—see Kay (2002) for a detailed dis-cussion of this debate.
To separate between these competing hypotheses,Miller et al. (2005) looked at carbon isotopes in emu(Dromaius novaehollandiae) eggshells and wombat(Vombatus spp.) teeth—records that span 150,000 y inAustralia. Miller et al. (2005) reported an abruptchange in feeding habitats 45,000–50,000 y ago whenhumans first colonized Australia. As noted by Johnson(2005:256), ‘‘The fact that the distributions and feed-ing habits of both species changed so little in responseto climate extremes, but so much when people arrived,tells us that the impact of human arrival far exceededthe effects of any of the climate changes of the past140,000 years.’’ Miller et al. (2005:290) suggested,
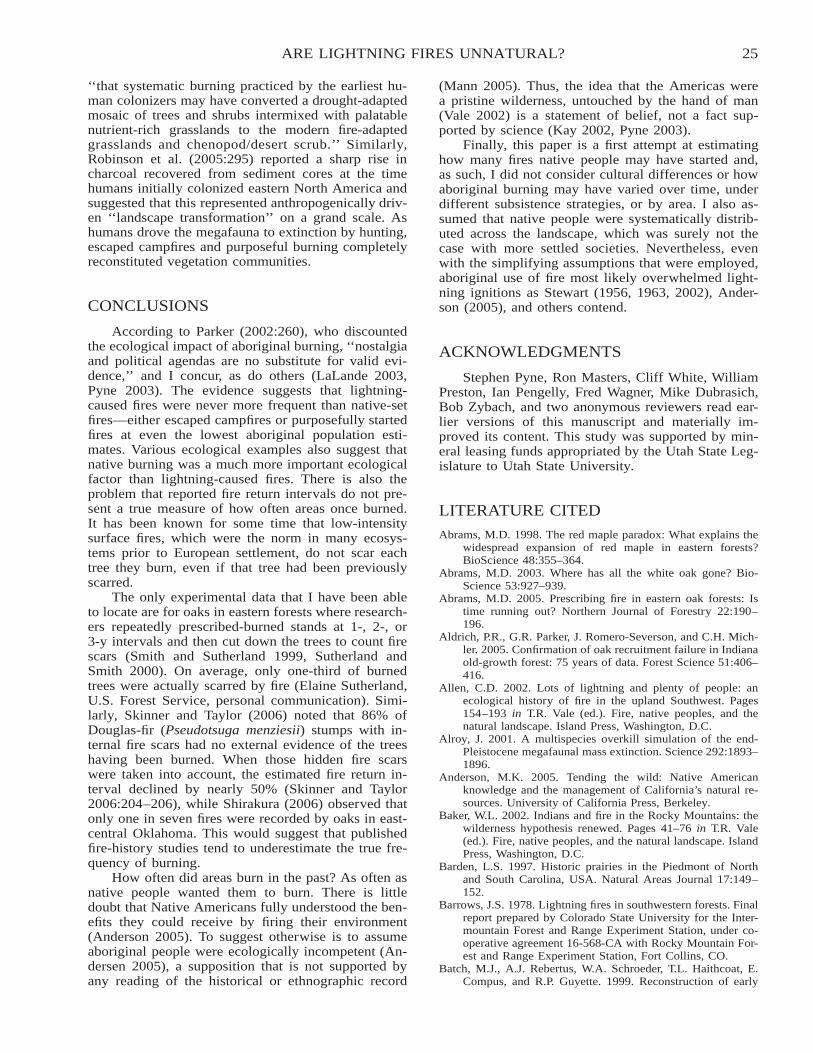
25ARE LIGHTNING FIRES UNNATURAL?
‘‘that systematic burning practiced by the earliest hu-man colonizers may have converted a drought-adaptedmosaic of trees and shrubs intermixed with palatablenutrient-rich grasslands to the modern fire-adaptedgrasslands and chenopod/desert scrub.’’ Similarly,Robinson et al. (2005:295) reported a sharp rise incharcoal recovered from sediment cores at the timehumans initially colonized eastern North America andsuggested that this represented anthropogenically driv-en ‘‘landscape transformation’’ on a grand scale. Ashumans drove the megafauna to extinction by hunting,escaped campfires and purposeful burning completelyreconstituted vegetation communities.
CONCLUSIONS
According to Parker (2002:260), who discountedthe ecological impact of aboriginal burning, ‘‘nostalgiaand political agendas are no substitute for valid evi-dence,’’ and I concur, as do others (LaLande 2003,Pyne 2003). The evidence suggests that lightning-caused fires were never more frequent than native-setfires—either escaped campfires or purposefully startedfires at even the lowest aboriginal population esti-mates. Various ecological examples also suggest thatnative burning was a much more important ecologicalfactor than lightning-caused fires. There is also theproblem that reported fire return intervals do not pre-sent a true measure of how often areas once burned.It has been known for some time that low-intensitysurface fires, which were the norm in many ecosys-tems prior to European settlement, do not scar eachtree they burn, even if that tree had been previouslyscarred.
The only experimental data that I have been ableto locate are for oaks in eastern forests where research-ers repeatedly prescribed-burned stands at 1-, 2-, or3-y intervals and then cut down the trees to count firescars (Smith and Sutherland 1999, Sutherland andSmith 2000). On average, only one-third of burnedtrees were actually scarred by fire (Elaine Sutherland,U.S. Forest Service, personal communication). Simi-larly, Skinner and Taylor (2006) noted that 86% ofDouglas-fir (Pseudotsuga menziesii) stumps with in-ternal fire scars had no external evidence of the treeshaving been burned. When those hidden fire scarswere taken into account, the estimated fire return in-terval declined by nearly 50% (Skinner and Taylor2006:204–206), while Shirakura (2006) observed thatonly one in seven fires were recorded by oaks in east-central Oklahoma. This would suggest that publishedfire-history studies tend to underestimate the true fre-quency of burning.
How often did areas burn in the past? As often asnative people wanted them to burn. There is littledoubt that Native Americans fully understood the ben-efits they could receive by firing their environment(Anderson 2005). To suggest otherwise is to assumeaboriginal people were ecologically incompetent (An-dersen 2005), a supposition that is not supported byany reading of the historical or ethnographic record
(Mann 2005). Thus, the idea that the Americas werea pristine wilderness, untouched by the hand of man(Vale 2002) is a statement of belief, not a fact sup-ported by science (Kay 2002, Pyne 2003).
Finally, this paper is a first attempt at estimatinghow many fires native people may have started and,as such, I did not consider cultural differences or howaboriginal burning may have varied over time, underdifferent subsistence strategies, or by area. I also as-sumed that native people were systematically distrib-uted across the landscape, which was surely not thecase with more settled societies. Nevertheless, evenwith the simplifying assumptions that were employed,aboriginal use of fire most likely overwhelmed light-ning ignitions as Stewart (1956, 1963, 2002), Ander-son (2005), and others contend.
ACKNOWLEDGMENTS
Stephen Pyne, Ron Masters, Cliff White, WilliamPreston, Ian Pengelly, Fred Wagner, Mike Dubrasich,Bob Zybach, and two anonymous reviewers read ear-lier versions of this manuscript and materially im-proved its content. This study was supported by min-eral leasing funds appropriated by the Utah State Leg-islature to Utah State University.
LITERATURE CITED
Abrams, M.D. 1998. The red maple paradox: What explains thewidespread expansion of red maple in eastern forests?BioScience 48:355–364.
Abrams, M.D. 2003. Where has all the white oak gone? Bio-Science 53:927–939.
Abrams, M.D. 2005. Prescribing fire in eastern oak forests: Istime running out? Northern Journal of Forestry 22:190–196.
Aldrich, P.R., G.R. Parker, J. Romero-Severson, and C.H. Mich-ler. 2005. Confirmation of oak recruitment failure in Indianaold-growth forest: 75 years of data. Forest Science 51:406–416.
Allen, C.D. 2002. Lots of lightning and plenty of people: anecological history of fire in the upland Southwest. Pages154–193 in T.R. Vale (ed.). Fire, native peoples, and thenatural landscape. Island Press, Washington, D.C.
Alroy, J. 2001. A multispecies overkill simulation of the end-Pleistocene megafaunal mass extinction. Science 292:1893–1896.
Anderson, M.K. 2005. Tending the wild: Native Americanknowledge and the management of California’s natural re-sources. University of California Press, Berkeley.
Baker, W.L. 2002. Indians and fire in the Rocky Mountains: thewilderness hypothesis renewed. Pages 41–76 in T.R. Vale(ed.). Fire, native peoples, and the natural landscape. IslandPress, Washington, D.C.
Barden, L.S. 1997. Historic prairies in the Piedmont of Northand South Carolina, USA. Natural Areas Journal 17:149–152.
Barrows, J.S. 1978. Lightning fires in southwestern forests. Finalreport prepared by Colorado State University for the Inter-mountain Forest and Range Experiment Station, under co-operative agreement 16-568-CA with Rocky Mountain For-est and Range Experiment Station, Fort Collins, CO.
Batch, M.J., A.J. Rebertus, W.A. Schroeder, T.L. Haithcoat, E.Compus, and R.P. Guyette. 1999. Reconstruction of early
26 KAY
nineteenth-century vegetation and fire regimes in the Mis-souri Ozarks. Journal of Biogeography 26:397–412.
Belue, T.F. 1996. The long hunt: death of the buffalo east of theMississippi. Stackpole Books, Mechanicsburg, PA.
Binford, L.R. 1978. Nunamiut ethnoarchaeology. AcademicPress, New York.
Black, B.A., C.M. Ruffner, and M.D. Abrams. 2006. NativeAmerican influences on the forest composition of the Al-legheny Plateau, northwest Pennsylvania. Canadian Journalof Forest Research 36:1266–1275.
Blackburn, T.C., and K. Anderson (eds.). 1993. Before the wil-derness: environmental management by native Californians.Ballena Press, Menlo Park, CA.
Bonnicksen, T.M. 2000. America’s ancient forests: from the IceAge to the Age of Discovery. John Wiley and Sons, NewYork.
Botkin, D.B. 1990. Discordant harmonies: a new ecology for thetwenty-first century. Oxford University Press, New York.
Bowman, D.M.J.S. 1998. The impact of aboriginal landscapeburning on the Australian biota. New Phytologist 140:385–410.
Bowman, D.M.J.S., A. Walsh, and L.D. Prior. 2004. Landscapeanalysis of aboriginal fire management in central ArnhemLand, north Australia. Journal of Biogeography 31:207–223.
Boyd, R. (ed.). 1999. Indians, fire and the land in the PacificNorthwest. Oregon State University Press, Corvallis.
Boyd, T. 1986. Strategies of Indian burning in the WillametteValley. Canadian Journal of Anthropology 5:65–86.
Brown, J.K., and D.G. Simmerman. 1986. Appraisal of fuels andflammability in western aspen: a prescribed fire guide. Gen-eral Technical Report INT-205, U.S. Department of Agri-culture, Forest Service, Intermountain Research Station,Ogden, UT.
Brown, P.M., and W.T. Baxter. 2003. Fire history in coast red-wood forests of the Mendocino coast, California. NorthwestScience 77:147–158.
Campbell, J.J.N., D.D. Taylor, M.E. Mealey, and A.C. Risk.1991. Floristic and historical evidence of fire-maintained,grassy pine–oak barrens before settlement in southeasternKentucky. Pages 359–375 in S.C. Nodvin and T.A. Waldrop(eds.). Fire and the environment: ecological and culturalperspectives. General Technical Report SE-69, U.S. De-partment of Agriculture, Forest Service, Southeastern ForestExperiment Station, Asheville, NC.
Campbell, S.K. 1990. Post Columbian cultural history in north-ern Columbia Plateau A.D. 1500–1900. Garland Publishing,New York.
Carloni, K.R. 2005. The ecological legacy of Indian burningpractices in southwestern Oregon. Ph.D. Dissertation,Oregon State University, Corvallis.
Churchill, W. 1997. A little matter of genocide: holocaust anddenial in the Americas 1492 to the present. City LightsBooks, San Francisco, CA.
Clark, J.S., and P.D. Royall. 1995. Transformation of a northernhardwood by aboriginal (Iroquois) fire: charcoal evidencefrom Crawford Lake, Ontario, Canada. Holocene 5:1–9.
Cowell, C.M. 1995. Presettlement Piedmont forests: patterns ofcomposition and disturbance in central Georgia. Annals ofthe Association of American Geographers 85:65–83.
Cowell, C.M. 1998. Historical change in vegetation and distur-bance on the Georgia Piedmont. American Midland Natu-ralist 140:78–89.
DeByle, N.V., C.D. Bevins, and W.C. Fisher. 1987. Wildfire oc-currence in aspen in the interior western United States.Western Journal of Applied Forestry 2:73–76.
Decker, P.R. 2004. The Utes must go! American expansion andthe removal of a people. Fulcrum Publishing, Golden, CO.
Delcourt, H.R., and P.A. Delcourt. 1997. Pre-Columbian NativeAmerican use of fire on southern Appalachian landscapes.Conservation Biology 11:1010–1014.
Delcourt, P.A., and H.R. Delcourt. 1998. The influence of pre-
historic human-set fires on oak–chestnut forests in thesouthern Appalachians. Castanea 63:337–345.
Delcourt, P.A., H.R. Delcourt, P.A. Cridlesbaugh, and J. Chap-man. 1986. Holocene ethnobotanical and paleological re-cord of human impact on vegetation in the Little TennesseeRiver Valley, Tennessee. Quaternary Research 25:330–349.
Delcourt, P.A., H.R. Delcourt, C.R. Ison, W.E. Sharp, and K.J.Gremillion. 1998. Prehistoric human use of fire, the easternagricultural complex, and Appalachian oak–chestnut forest:paleoecology of Cliff Palace Pond, Kentucky. AmericanAntiquity 63:263–278.
Dobyns, H.F. 1983. Their numbers become thinned: NativeAmerican population dynamics in eastern North America.University of Tennessee Press, Knoxville.
Fechner, G.H., and J.S. Barrows. 1976. Aspen stands as wildfirefuelbreaks. Eisenhower Consortium Bulletin 4, U.S. De-partment of Agriculture, Forest Service, Rocky MountainForest and Range Experiment Station, Fort Collins, CO.
Fensham, R.J. 1997. Aboriginal fire regimes in Queensland,Australia: analysis of the explorers’ record. Journal of Bio-geography 24:11–22.
Flannery, T.F. 1994. The future eaters: an ecological history ofthe Australian islands and people. Reed Books, Chatswood,NSW, Australia.
Fraser, F., V. Lawson, S. Morrison, P. Christophersen, S. Mc-Greggor, and M. Rawlinson. 2003. Fire management for thedeclining partridge pigeon, Kakadu National Park. Ecolog-ical Management and Restoration 4:94–102.
Gassaway, L. 2005. HUJPU-ST: spatial and temporal patterns ofanthropogenic fire in Yosemite Valley. M.S. Thesis, SanFrancisco State University, San Francisco, CA.
Gottesfeld, L.M.J. 1994. Aboriginal burning for vegetative man-agement in northwest British Columbia. Human Ecology22:171–188.
Gough, B.M. (ed.). 1988. The journal of Alexander Henry TheYounger 1799–1814. Volume I: Red River and the journeyto the Missouri. The Champlain Society, Toronto, ON, Can-ada.
Griffin, D. 2002. Prehistoric human impacts on fire regimes andvegetation in the northern Intermountain West. Pages 77–100 in T.R. Vale (ed.). Fire, native peoples, and the naturallandscape. Island Press, Washington, D.C.
Grissino-Mayer, H.D., W.H. Romme, M.L. Floyd, and D.D. Han-na. 2004. Climatic and human influences on fire regimes ofthe southern San Juan Mountains, Colorado, USA. Ecology85:1708–1724.
Habeck, J.R. 1961. The original vegetation of the mid-Willam-ette Valley, Oregon. Northwest Science 35:65–77.
Haig, B. (ed.). 1992. A look at Peter Fidler’s journal: journal ofa journey overland from Buckingham House to the RockyMountains in 1792–1793. Historical Research Centre, Leth-bridge, AB, Canada.
Hallam, S.J. 1975. Fire and hearth. Australian Institute of Ab-original Studies, Canberra, ACT, Australia.
Higgins, K.F. 1984. Lightning fires in grasslands in North Dakotaand in pine–savanna lands in nearby South Dakota andMontana. Journal of Range Management 37:100–103.
Hill, K., and A.M. Hurtado. 1996. Ache life history: the ecologyand demography of a foraging people. Aldine De Gruyter,New York.
Houston, D.B. 1973. Wildfires in northern Yellowstone NationalPark. Ecology 54:1111–1117.
Johnson, C.N. 2005. The remaking of Australia’s ecology. Sci-ence 309:255–256.
Kay, C.E. 1990. Yellowstone’s northern elk herd: a critical eval-uation of the ‘‘natural regulation’’ paradigm. Ph.D. Disser-tation, Utah State University, Logan.
Kay, C.E. 1997. Is aspen doomed? Journal of Forestry 95(5):4–11.
Kay, C.E. 1998. Are ecosystems structured from the top-downor bottom-up? A new look at an old debate. Wildlife So-ciety Bulletin 26:484–498.
27ARE LIGHTNING FIRES UNNATURAL?
Kay, C.E. 2000. Native burning in western North America: im-plications for hardwood management. Pages 19–27 in D.A.Yaussy (ed.). Proceedings: workshop on fire, people, andthe central hardwood landscape. General Technical ReportNE-274, U.S. Department of Agriculture, Forest Service,Northeastern Forest Experiment Station, Newtown Square,PA.
Kay, C.E. 2002. False gods, ecological myths, and biologicalreality. Pages 238–261 in C.E. Kay and R.T. Simmons(eds.). Wilderness and political ecology: aboriginal influ-ences and the original state of nature. University of UtahPress, Salt Lake City.
Kay, C.E. 2003. Long-term vegetation change on Utah’s Fish-lake National Forest: a study in repeat-photography. U.S.Department of Agriculture, Forest Service, and Utah StateUniversity Extension. U.S. Government Printing Office2003-53-084/42159, Logan, UT.
Kay, C.E., and R.T. Simmons (eds.). 2002. Wilderness and po-litical ecology: aboriginal influences and the original stateof nature. University of Utah Press, Salt Lake City.
Kay, C.E., C.A. White, I.R. Pengelly, and B. Patton. 1999. Long-term ecosystem states and processes in Banff National Parkand the central Canadian Rockies. Parks Canada OccasionalPaper 9, Environment Canada, Ottawa, ON, Canada.
Keeley, J.E. 2005. Fire history of the San Francisco East Bayregion and implications for landscape pattern. InternationalJournal of Wildland Fire 14:285–296.
Kelly, R.L. 1995. The foraging spectrum: diversity in hunter–gatherer lifeways. Smithsonian Institution Press, Washing-ton, D.C.
Kornfield, M. 1994. Pull of the hills: affluent foragers of thewestern Black Hills. Ph.D. Dissertation, University of Mas-sachusetts, Amherst.
LaLande, J. 2003. Native Americans and fire. Pacific HistoricalReview 72:617–622.
Lewis, H.T. 1973. Patterns of Indian burning in California: ecol-ogy and ethno-history. Anthropological Papers 1. BallenaPress, Ramona, CA.
Lewis, H.T. 1977. Maskuta: the ecology of Indian fires in north-ern Alberta. Western Canadian Journal of Anthropology 7:15–52.
Lewis, H.T. 1985. Why Indians burned: specific versus generalreasons. Pages 75–80 in J.E. Lotan, B.M. Kilgore, W.C.Fischer, and R.W. Mutch (eds.). Proceedings—symposiumand workshop on wilderness fire. General Technical ReportINT-182, U.S. Department of Agriculture, Forest Service,Intermountain Forest and Range Experiment Station, Og-den, UT.
Lewis, H.T. 1989. Ecological and technological knowledge offire: aborigines versus park rangers in northern Australia.American Anthropologist 91:940–961.
Lewis, H.T. 1990. Reconstructing patterns of Indian burning insouthwestern Oregon. Pages 80–84 in N. Hannon and R.Olmo (eds.). Living with the land: the Indians of south-western Oregon. Southern Oregon Historical Society, Med-ford.
Liberman, K. 1990. The native environment: contemporary per-spectives of southwestern Oregon’s Native Americans. Pag-es 85–93 in N. Hannon and R. Olmo (eds.). Living with theland: the Indians of southwest Oregon. Southern OregonHistorical Society, Medford.
Loewen, J.W. 1995. Lies my teacher told me: everything yourAmerican history textbook got wrong. Simon and Schuster,New York.
Loope, L.L., and G.E. Gruell. 1973. The ecological role of firein the Jackson Hole area, northwestern Wyoming. Quater-nary Research 3:425–443.
Mann, C.C. 2005. 1491: new revelations of the Americas beforeColumbus. Alfred A. Knopf, New York.
Masters, R.E., K. Robertson, B. Palmer, J. Cox, K. McGorty, L.Green, and C. Ambrose. 2003. Red Hills forest stewardship
guide. Miscellaneous Publication 12, Tall Timbers ResearchStation, Tallahassee, FL.
Miller, G.H., M.L. Fogel, J.W. Magee, M.K. Gagan, S.J. Clarke,and B.J. Johnson. 2005. Ecosystems collapse in PleistoceneAustralia and a human role in megafaunal extinction. Sci-ence 309:287–290.
Norton, H.H. 1979. The association between anthropogenic prai-ries and important food plants in western Washington.Northwest Anthropological Research Notes 13:175–200.
Olson, S.D. 1996. The historical occurrence of fire in the centralhardwoods, with emphasis on southcentral Indiana. NaturalAreas Journal 16:248–256.
Orville, R.E., and G.R. Huffines. 2001. Cloud-to-ground light-ning in the United States: NLDN results in the first decade,1989–1998. Monthly Weather Review 129:1179–1193.
Orville, R.E., G.R. Huffines, W.R. Burrows, R.L. Holle, andK.L. Cummins. 2002. The North American Lightning De-tection Network (NALDN)—first results: 1998–2000.Monthly Weather Review 130:2098–2109.
Parker, A.J. 2002. Fire in Sierra Nevada forests: evaluating theecological impact of burning by Native Americans. Pages233–267 in T.R. Vale (ed.). Fire, native peoples, and thenatural landscape. Island Press, Washington, D.C.
Platt, S.G., and C.G. Brantley. 1997. Canebrakes: an ecologicaland historical perspective. Castanea 62:8–21.
Pyne, S. 2003. Book review: Fire, native peoples, and the naturallandscape. Restoration Ecology 11:257–259.
Pyne, S.J. 1982. Fire in America: a cultural history of wildlandand rural fire. Princeton University Press, Princeton, NJ.
Pyne, S.J. 1993. Keeper of the flame: a survey of anthropogenicfire. Pages 245–266 in P.J. Crutzen and J.G. Goldammer(eds.). Fire in the environment: its ecological, climatic, andatmospheric chemical importance. John Wiley and Sons,New York.
Pyne, S.J. 1994. Maintaining focus: an introduction to anthro-pogenic fire. Chemosphere 29:889–911.
Pyne, S.J. 1995. Vestal fires and virgin lands: a reburn. Pages15–21 in J.K. Brown, R.W. Mutch, C.W. Spoon, and R.H.Wakimoto (eds.). Proceedings: symposium on fire in wil-derness and park management. General Technical ReportINT-320, U.S. Department of Agriculture, Forest Service,Intermountain Research Station, Ogden, UT.
Ramenofsky, A.F. 1987. Vectors of death: the archaeology ofEuropean contact. University of New Mexico Press, Albu-querque.
Rentch, J.S., and R.R. Hicks. 2005. Changes in presettlementforest composition for five areas in the central hardwoodforest, 1784–1990. Natural Areas Journal 25:228–238.
Robinson, G.S., L.P. Burney, and D.A. Burney. 2005. Landscapepaleoecology and megafauna extinction in southeasternNew York State. Ecological Monographs 75:295–315.
Rodewald, A.D. 2003. Decline of oak forests and implicationsof forest wildlife conservation. Natural Areas Journal 23:368–371.
Roovers, L.M., and S.R. Shifley. 2003. Composition, structure,and tree reproduction at White Pine Hollow, Iowa, USA: aremnant old-growth forest. Natural Areas Journal 23:238–246.
Russell-Smith, J., D. Lucas, M. Gapindi, B. Gunbunuka, N. Ka-pirigi, G. Namingum, K. Lucas, P. Giuliani, and G. Chal-oupka. 1997. Aboriginal resource utilization and fire man-agement practice in western Arnhem Land, monsoonalnorthern Australia: notes for prehistory, lessons for the fu-ture. Human Ecology 25:159–195.
Shirakura, F. 2006. Tornado damage and fire history in the crosstimbers of the Tallgrass Prairie Preserve, Oklahoma. M.S.Thesis, Oklahoma State University, Stillwater.
Skinner, C.N., and A.H. Taylor. 2006. Southern Cascades biore-gion. Pages 195–224 in N.G. Sugihara, J.W. van Wagten-donk, K.E. Shaffer, J. Fites-Kaufman, and A.E. Thode(eds.). Fire in California’s ecosystems. University of Cali-fornia Press, Berkeley.
28 KAY
Smith, K.T., and E.K. Sutherland. 1999. Fire-scar formation andcompartmentalization in oak. Canadian Journal of ForestResearch 29:166–171.
Stambaugh, M.C., and R.P. Guyette. 2006. Fire regime of anOzark wilderness area, Arkansas. American Midland Nat-uralist 156:237–251.
Stannard, D.E. 1992. American holocaust. Oxford UniversityPress, New York.
Stannard, D.E. 1998. Uniqueness as denial: the politics of geno-cide scholarship. Pages 163–208 in A.S. Rosenbaum (ed.).Is the Holocaust unique? Westview Press, Boulder, CO.
Stephens, S.L. 2005. Forest fire causes and extent on UnitedStates Forest Service lands. International Journal of Wild-land Fire 14:213–222.
Stephens, S.L., and D.L. Fry. 2005. Fire history in coast red-wood stands in the northeastern Santa Cruz Mountains, Cal-ifornia. Fire Ecology 1:2–19.
Stewart, O.C. 1956. Fire as the first great force employed byman. Pages 115–133 in W.L. Thomas (ed.). Man’s role inchanging the face of the earth. University of Chicago Press,Chicago, IL.
Stewart, O.C. 1963. Barriers to understanding the influence ofthe use of fire by aborigines on vegetation. Proceedings ofTall Timbers Fire Ecology Conference 2:117–126.
Stewart, O.C. 2002. Forgotten fires: Native Americans and thetransient wilderness. H.T. Lewis and M.K. Anderson (eds.).University of Oklahoma Press, Norman.
Sutherland, E.K., and K.T. Smith. 2000. Resistance is not futile:the response of hardwoods to fire-caused wounding. Pages111–115 in D.A. Yaussy (ed.). Proceedings: workshop onfire, people, and the central hardwood landscape. GeneralTechnical Report NE-274, U.S. Department of Agriculture,
Forest Service, Northeastern Forest Experiment Station,Newtown Square, PA.
Turner, N.J. 1991. Burning mountain sides for better crops: ab-original landscape burning in British Columbia. Archaeol-ogy in Montana 32:57–73.
Vale, T.R. (ed.). 2002. Fire, native peoples, and the natural land-scape. Island Press, Washington, D.C.
Vigilante, T., and D.M.J.S. Bowman. 2004. The effects of firehistory on the structure and floristic composition of woodyvegetation around Kalumburu, North Kimberley: a land-scape-scale natural experiment. Australian Journal of Bot-any 52:381–404.
Whitlock, C., and M.A. Knox. 2002. Prehistoric burning in thePacific Northwest: human versus climatic influences. Pages195–231 in R.T. Vale (ed.). Fire, native peoples, and thenatural landscape. Island Press, Washington, D.C.
Wierzchowski, J., M. Heathcott, and M.D. Flannigan. 2002.Lightning and lightning fire, central cordillera, Canada. In-ternational Journal of Wildland Fire 11:41–51.
Wray, J., and M.K. Anderson. 2003. Restoring Indian-set firesto prairie ecosystems on the Olympic Peninsula. EcologicalRestoration 21:296–301.
Wright, G.A. 1984. People of the high country: Jackson Holebefore the settlers. Peter Lang, New York.
Yibarbuk, D., P.J. Whitehead, J. Russell-Smith, D. Jackson, C.Godjuwa, A. Fisher, P. Cooke, D. Choquenot, and D.M.J.S.Bowman. 2001. Fire ecology and aboriginal land manage-ment in central Arnhem Land, northern Australia: a tradi-tion of ecosystem management. Journal of Biogeography28:325–343.
Zybach, B. 2003. The Great Fires: Indian burning and cata-strophic forest fire patterns of the Oregon Coast Range,1491–1951. Ph.D. Dissertation, Oregon State University,Corvallis.
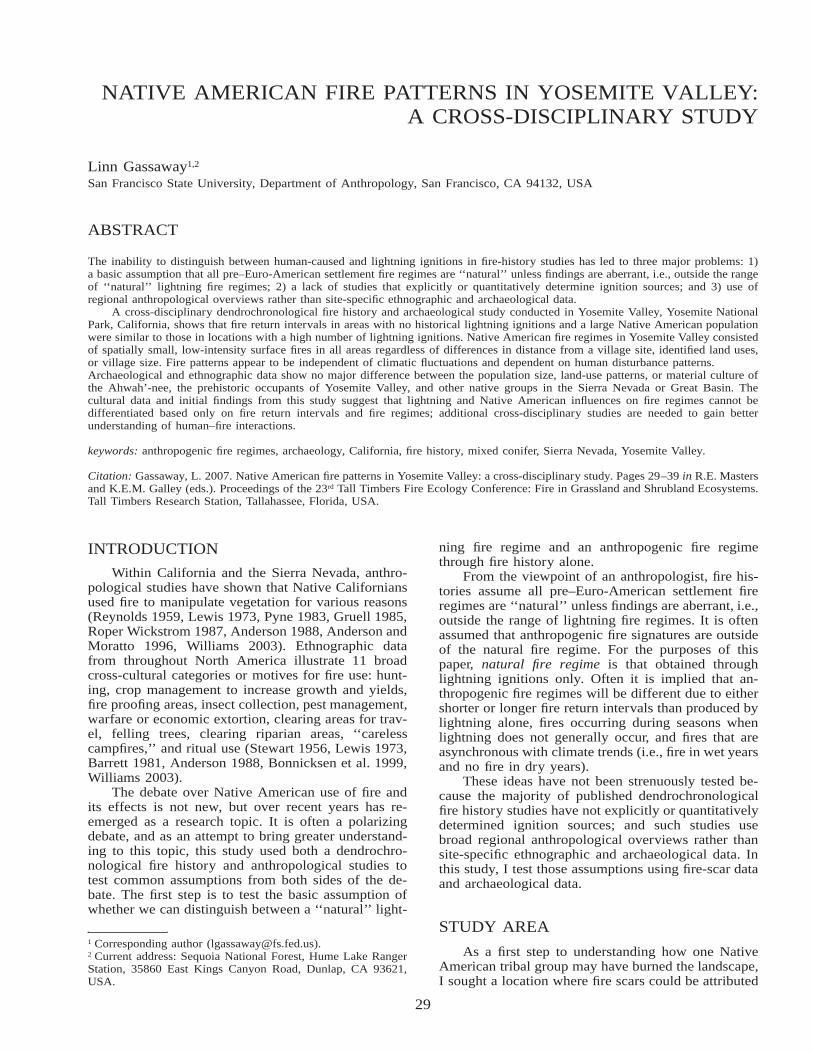
29
NATIVE AMERICAN FIRE PATTERNS IN YOSEMITE VALLEY:A CROSS-DISCIPLINARY STUDY
Linn Gassaway1,2
San Francisco State University, Department of Anthropology, San Francisco, CA 94132, USA
ABSTRACT
The inability to distinguish between human-caused and lightning ignitions in fire-history studies has led to three major problems: 1)a basic assumption that all pre–Euro-American settlement fire regimes are ‘‘natural’’ unless findings are aberrant, i.e., outside the rangeof ‘‘natural’’ lightning fire regimes; 2) a lack of studies that explicitly or quantitatively determine ignition sources; and 3) use ofregional anthropological overviews rather than site-specific ethnographic and archaeological data.
A cross-disciplinary dendrochronological fire history and archaeological study conducted in Yosemite Valley, Yosemite NationalPark, California, shows that fire return intervals in areas with no historical lightning ignitions and a large Native American populationwere similar to those in locations with a high number of lightning ignitions. Native American fire regimes in Yosemite Valley consistedof spatially small, low-intensity surface fires in all areas regardless of differences in distance from a village site, identified land uses,or village size. Fire patterns appear to be independent of climatic fluctuations and dependent on human disturbance patterns.Archaeological and ethnographic data show no major difference between the population size, land-use patterns, or material culture ofthe Ahwah’-nee, the prehistoric occupants of Yosemite Valley, and other native groups in the Sierra Nevada or Great Basin. Thecultural data and initial findings from this study suggest that lightning and Native American influences on fire regimes cannot bedifferentiated based only on fire return intervals and fire regimes; additional cross-disciplinary studies are needed to gain betterunderstanding of human–fire interactions.
keywords: anthropogenic fire regimes, archaeology, California, fire history, mixed conifer, Sierra Nevada, Yosemite Valley.
Citation: Gassaway, L. 2007. Native American fire patterns in Yosemite Valley: a cross-disciplinary study. Pages 29–39 in R.E. Mastersand K.E.M. Galley (eds.). Proceedings of the 23rd Tall Timbers Fire Ecology Conference: Fire in Grassland and Shrubland Ecosystems.Tall Timbers Research Station, Tallahassee, Florida, USA.
INTRODUCTION
Within California and the Sierra Nevada, anthro-pological studies have shown that Native Californiansused fire to manipulate vegetation for various reasons(Reynolds 1959, Lewis 1973, Pyne 1983, Gruell 1985,Roper Wickstrom 1987, Anderson 1988, Anderson andMoratto 1996, Williams 2003). Ethnographic datafrom throughout North America illustrate 11 broadcross-cultural categories or motives for fire use: hunt-ing, crop management to increase growth and yields,fire proofing areas, insect collection, pest management,warfare or economic extortion, clearing areas for trav-el, felling trees, clearing riparian areas, ‘‘carelesscampfires,’’ and ritual use (Stewart 1956, Lewis 1973,Barrett 1981, Anderson 1988, Bonnicksen et al. 1999,Williams 2003).
The debate over Native American use of fire andits effects is not new, but over recent years has re-emerged as a research topic. It is often a polarizingdebate, and as an attempt to bring greater understand-ing to this topic, this study used both a dendrochro-nological fire history and anthropological studies totest common assumptions from both sides of the de-bate. The first step is to test the basic assumption ofwhether we can distinguish between a ‘‘natural’’ light-
1 Corresponding author ([email protected]).2 Current address: Sequoia National Forest, Hume Lake RangerStation, 35860 East Kings Canyon Road, Dunlap, CA 93621,USA.
ning fire regime and an anthropogenic fire regimethrough fire history alone.
From the viewpoint of an anthropologist, fire his-tories assume all pre–Euro-American settlement fireregimes are ‘‘natural’’ unless findings are aberrant, i.e.,outside the range of lightning fire regimes. It is oftenassumed that anthropogenic fire signatures are outsideof the natural fire regime. For the purposes of thispaper, natural fire regime is that obtained throughlightning ignitions only. Often it is implied that an-thropogenic fire regimes will be different due to eithershorter or longer fire return intervals than produced bylightning alone, fires occurring during seasons whenlightning does not generally occur, and fires that areasynchronous with climate trends (i.e., fire in wet yearsand no fire in dry years).
These ideas have not been strenuously tested be-cause the majority of published dendrochronologicalfire history studies have not explicitly or quantitativelydetermined ignition sources; and such studies usebroad regional anthropological overviews rather thansite-specific ethnographic and archaeological data. Inthis study, I test those assumptions using fire-scar dataand archaeological data.
STUDY AREA
As a first step to understanding how one NativeAmerican tribal group may have burned the landscape,I sought a location where fire scars could be attributed
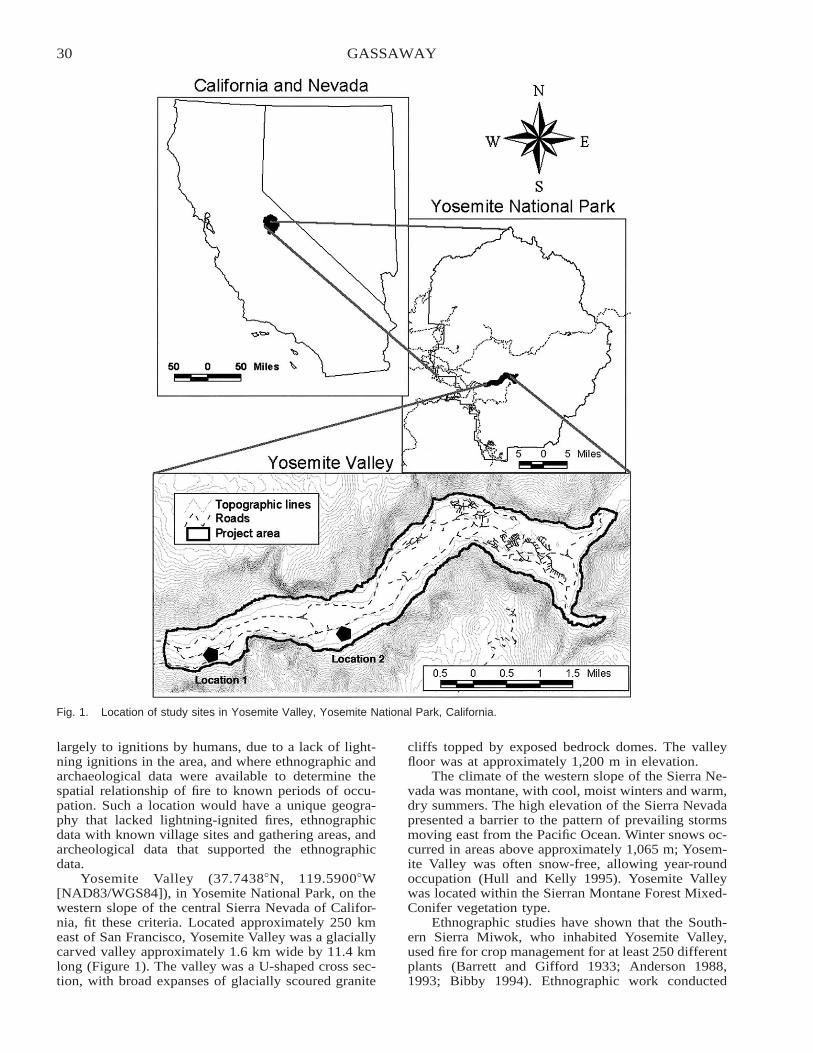
30 GASSAWAY
Fig. 1. Location of study sites in Yosemite Valley, Yosemite National Park, California.
largely to ignitions by humans, due to a lack of light-ning ignitions in the area, and where ethnographic andarchaeological data were available to determine thespatial relationship of fire to known periods of occu-pation. Such a location would have a unique geogra-phy that lacked lightning-ignited fires, ethnographicdata with known village sites and gathering areas, andarcheological data that supported the ethnographicdata.
Yosemite Valley (37.7438�N, 119.5900�W[NAD83/WGS84]), in Yosemite National Park, on thewestern slope of the central Sierra Nevada of Califor-nia, fit these criteria. Located approximately 250 kmeast of San Francisco, Yosemite Valley was a glaciallycarved valley approximately 1.6 km wide by 11.4 kmlong (Figure 1). The valley was a U-shaped cross sec-tion, with broad expanses of glacially scoured granite
cliffs topped by exposed bedrock domes. The valleyfloor was at approximately 1,200 m in elevation.
The climate of the western slope of the Sierra Ne-vada was montane, with cool, moist winters and warm,dry summers. The high elevation of the Sierra Nevadapresented a barrier to the pattern of prevailing stormsmoving east from the Pacific Ocean. Winter snows oc-curred in areas above approximately 1,065 m; Yosem-ite Valley was often snow-free, allowing year-roundoccupation (Hull and Kelly 1995). Yosemite Valleywas located within the Sierran Montane Forest Mixed-Conifer vegetation type.
Ethnographic studies have shown that the South-ern Sierra Miwok, who inhabited Yosemite Valley,used fire for crop management for at least 250 differentplants (Barrett and Gifford 1933; Anderson 1988,1993; Bibby 1994). Ethnographic work conducted
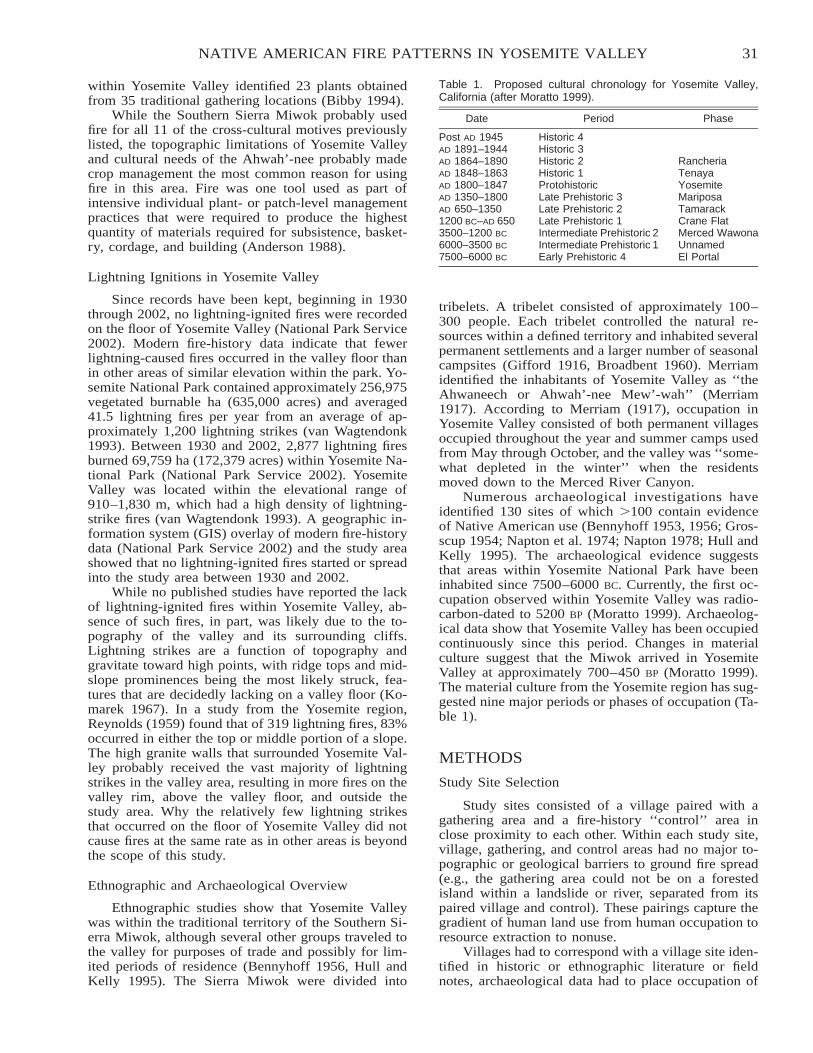
31NATIVE AMERICAN FIRE PATTERNS IN YOSEMITE VALLEY
Table 1. Proposed cultural chronology for Yosemite Valley,California (after Moratto 1999).
Date Period Phase
Post AD 1945 Historic 4AD 1891–1944 Historic 3AD 1864–1890 Historic 2 RancheriaAD 1848–1863 Historic 1 TenayaAD 1800–1847 Protohistoric YosemiteAD 1350–1800 Late Prehistoric 3 MariposaAD 650–1350 Late Prehistoric 2 Tamarack1200 BC–AD 650 Late Prehistoric 1 Crane Flat3500–1200 BC Intermediate Prehistoric 2 Merced Wawona6000–3500 BC Intermediate Prehistoric 1 Unnamed7500–6000 BC Early Prehistoric 4 El Portal
within Yosemite Valley identified 23 plants obtainedfrom 35 traditional gathering locations (Bibby 1994).
While the Southern Sierra Miwok probably usedfire for all 11 of the cross-cultural motives previouslylisted, the topographic limitations of Yosemite Valleyand cultural needs of the Ahwah’-nee probably madecrop management the most common reason for usingfire in this area. Fire was one tool used as part ofintensive individual plant- or patch-level managementpractices that were required to produce the highestquantity of materials required for subsistence, basket-ry, cordage, and building (Anderson 1988).
Lightning Ignitions in Yosemite Valley
Since records have been kept, beginning in 1930through 2002, no lightning-ignited fires were recordedon the floor of Yosemite Valley (National Park Service2002). Modern fire-history data indicate that fewerlightning-caused fires occurred in the valley floor thanin other areas of similar elevation within the park. Yo-semite National Park contained approximately 256,975vegetated burnable ha (635,000 acres) and averaged41.5 lightning fires per year from an average of ap-proximately 1,200 lightning strikes (van Wagtendonk1993). Between 1930 and 2002, 2,877 lightning firesburned 69,759 ha (172,379 acres) within Yosemite Na-tional Park (National Park Service 2002). YosemiteValley was located within the elevational range of910–1,830 m, which had a high density of lightning-strike fires (van Wagtendonk 1993). A geographic in-formation system (GIS) overlay of modern fire-historydata (National Park Service 2002) and the study areashowed that no lightning-ignited fires started or spreadinto the study area between 1930 and 2002.
While no published studies have reported the lackof lightning-ignited fires within Yosemite Valley, ab-sence of such fires, in part, was likely due to the to-pography of the valley and its surrounding cliffs.Lightning strikes are a function of topography andgravitate toward high points, with ridge tops and mid-slope prominences being the most likely struck, fea-tures that are decidedly lacking on a valley floor (Ko-marek 1967). In a study from the Yosemite region,Reynolds (1959) found that of 319 lightning fires, 83%occurred in either the top or middle portion of a slope.The high granite walls that surrounded Yosemite Val-ley probably received the vast majority of lightningstrikes in the valley area, resulting in more fires on thevalley rim, above the valley floor, and outside thestudy area. Why the relatively few lightning strikesthat occurred on the floor of Yosemite Valley did notcause fires at the same rate as in other areas is beyondthe scope of this study.
Ethnographic and Archaeological Overview
Ethnographic studies show that Yosemite Valleywas within the traditional territory of the Southern Si-erra Miwok, although several other groups traveled tothe valley for purposes of trade and possibly for lim-ited periods of residence (Bennyhoff 1956, Hull andKelly 1995). The Sierra Miwok were divided into
tribelets. A tribelet consisted of approximately 100–300 people. Each tribelet controlled the natural re-sources within a defined territory and inhabited severalpermanent settlements and a larger number of seasonalcampsites (Gifford 1916, Broadbent 1960). Merriamidentified the inhabitants of Yosemite Valley as ‘‘theAhwaneech or Ahwah’-nee Mew’-wah’’ (Merriam1917). According to Merriam (1917), occupation inYosemite Valley consisted of both permanent villagesoccupied throughout the year and summer camps usedfrom May through October, and the valley was ‘‘some-what depleted in the winter’’ when the residentsmoved down to the Merced River Canyon.
Numerous archaeological investigations haveidentified 130 sites of which �100 contain evidenceof Native American use (Bennyhoff 1953, 1956; Gros-scup 1954; Napton et al. 1974; Napton 1978; Hull andKelly 1995). The archaeological evidence suggeststhat areas within Yosemite National Park have beeninhabited since 7500–6000 BC. Currently, the first oc-cupation observed within Yosemite Valley was radio-carbon-dated to 5200 BP (Moratto 1999). Archaeolog-ical data show that Yosemite Valley has been occupiedcontinuously since this period. Changes in materialculture suggest that the Miwok arrived in YosemiteValley at approximately 700–450 BP (Moratto 1999).The material culture from the Yosemite region has sug-gested nine major periods or phases of occupation (Ta-ble 1).
METHODS
Study Site Selection
Study sites consisted of a village paired with agathering area and a fire-history ‘‘control’’ area inclose proximity to each other. Within each study site,village, gathering, and control areas had no major to-pographic or geological barriers to ground fire spread(e.g., the gathering area could not be on a forestedisland within a landslide or river, separated from itspaired village and control). These pairings capture thegradient of human land use from human occupation toresource extraction to nonuse.
Villages had to correspond with a village site iden-tified in historic or ethnographic literature or fieldnotes, archaeological data had to place occupation of
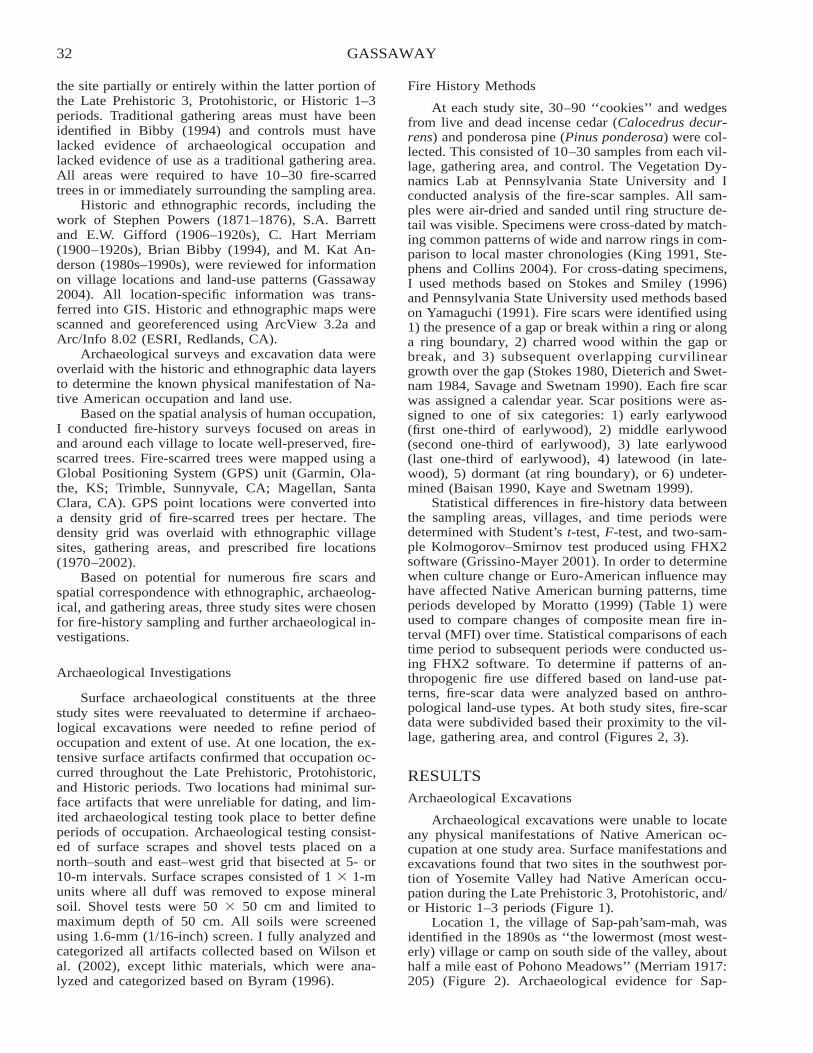
32 GASSAWAY
the site partially or entirely within the latter portion ofthe Late Prehistoric 3, Protohistoric, or Historic 1–3periods. Traditional gathering areas must have beenidentified in Bibby (1994) and controls must havelacked evidence of archaeological occupation andlacked evidence of use as a traditional gathering area.All areas were required to have 10–30 fire-scarredtrees in or immediately surrounding the sampling area.
Historic and ethnographic records, including thework of Stephen Powers (1871–1876), S.A. Barrettand E.W. Gifford (1906–1920s), C. Hart Merriam(1900–1920s), Brian Bibby (1994), and M. Kat An-derson (1980s–1990s), were reviewed for informationon village locations and land-use patterns (Gassaway2004). All location-specific information was trans-ferred into GIS. Historic and ethnographic maps werescanned and georeferenced using ArcView 3.2a andArc/Info 8.02 (ESRI, Redlands, CA).
Archaeological surveys and excavation data wereoverlaid with the historic and ethnographic data layersto determine the known physical manifestation of Na-tive American occupation and land use.
Based on the spatial analysis of human occupation,I conducted fire-history surveys focused on areas inand around each village to locate well-preserved, fire-scarred trees. Fire-scarred trees were mapped using aGlobal Positioning System (GPS) unit (Garmin, Ola-the, KS; Trimble, Sunnyvale, CA; Magellan, SantaClara, CA). GPS point locations were converted intoa density grid of fire-scarred trees per hectare. Thedensity grid was overlaid with ethnographic villagesites, gathering areas, and prescribed fire locations(1970–2002).
Based on potential for numerous fire scars andspatial correspondence with ethnographic, archaeolog-ical, and gathering areas, three study sites were chosenfor fire-history sampling and further archaeological in-vestigations.
Archaeological Investigations
Surface archaeological constituents at the threestudy sites were reevaluated to determine if archaeo-logical excavations were needed to refine period ofoccupation and extent of use. At one location, the ex-tensive surface artifacts confirmed that occupation oc-curred throughout the Late Prehistoric, Protohistoric,and Historic periods. Two locations had minimal sur-face artifacts that were unreliable for dating, and lim-ited archaeological testing took place to better defineperiods of occupation. Archaeological testing consist-ed of surface scrapes and shovel tests placed on anorth–south and east–west grid that bisected at 5- or10-m intervals. Surface scrapes consisted of 1 � 1-munits where all duff was removed to expose mineralsoil. Shovel tests were 50 � 50 cm and limited tomaximum depth of 50 cm. All soils were screenedusing 1.6-mm (1/16-inch) screen. I fully analyzed andcategorized all artifacts collected based on Wilson etal. (2002), except lithic materials, which were ana-lyzed and categorized based on Byram (1996).
Fire History Methods
At each study site, 30–90 ‘‘cookies’’ and wedgesfrom live and dead incense cedar (Calocedrus decur-rens) and ponderosa pine (Pinus ponderosa) were col-lected. This consisted of 10–30 samples from each vil-lage, gathering area, and control. The Vegetation Dy-namics Lab at Pennsylvania State University and Iconducted analysis of the fire-scar samples. All sam-ples were air-dried and sanded until ring structure de-tail was visible. Specimens were cross-dated by match-ing common patterns of wide and narrow rings in com-parison to local master chronologies (King 1991, Ste-phens and Collins 2004). For cross-dating specimens,I used methods based on Stokes and Smiley (1996)and Pennsylvania State University used methods basedon Yamaguchi (1991). Fire scars were identified using1) the presence of a gap or break within a ring or alonga ring boundary, 2) charred wood within the gap orbreak, and 3) subsequent overlapping curvilineargrowth over the gap (Stokes 1980, Dieterich and Swet-nam 1984, Savage and Swetnam 1990). Each fire scarwas assigned a calendar year. Scar positions were as-signed to one of six categories: 1) early earlywood(first one-third of earlywood), 2) middle earlywood(second one-third of earlywood), 3) late earlywood(last one-third of earlywood), 4) latewood (in late-wood), 5) dormant (at ring boundary), or 6) undeter-mined (Baisan 1990, Kaye and Swetnam 1999).
Statistical differences in fire-history data betweenthe sampling areas, villages, and time periods weredetermined with Student’s t-test, F-test, and two-sam-ple Kolmogorov–Smirnov test produced using FHX2software (Grissino-Mayer 2001). In order to determinewhen culture change or Euro-American influence mayhave affected Native American burning patterns, timeperiods developed by Moratto (1999) (Table 1) wereused to compare changes of composite mean fire in-terval (MFI) over time. Statistical comparisons of eachtime period to subsequent periods were conducted us-ing FHX2 software. To determine if patterns of an-thropogenic fire use differed based on land-use pat-terns, fire-scar data were analyzed based on anthro-pological land-use types. At both study sites, fire-scardata were subdivided based their proximity to the vil-lage, gathering area, and control (Figures 2, 3).
RESULTSArchaeological Excavations
Archaeological excavations were unable to locateany physical manifestations of Native American oc-cupation at one study area. Surface manifestations andexcavations found that two sites in the southwest por-tion of Yosemite Valley had Native American occu-pation during the Late Prehistoric 3, Protohistoric, and/or Historic 1–3 periods (Figure 1).
Location 1, the village of Sap-pah’sam-mah, wasidentified in the 1890s as ‘‘the lowermost (most west-erly) village or camp on south side of the valley, abouthalf a mile east of Pohono Meadows’’ (Merriam 1917:205) (Figure 2). Archaeological evidence for Sap-
33NATIVE AMERICAN FIRE PATTERNS IN YOSEMITE VALLEY
Fig. 2. Fire-scar samples from areas associated with the village of Sap-pah’sam-mah (location 1), Yosemite Valley, Yosemite NationalPark, California.
pah’sam-mah consists of one archaeological site, CA-MRP-71. Artifacts from the site were consistent withtwo periods of occupation. A late prehistoric periodconsisting of small obsidian retouch flakes and debi-tage, one transverse side scraper, and one blue glasstrade bead, were all consistent with Merriam’s descrip-tion of a seasonal camp with possibly seasonally low-intensity use and with a low diversity of use. A secondperiod of use consisted of artifacts dating from ca.1870 to 1960s, which is consistent with Euro-Ameri-can occupation and tourism associated with the Wa-wona Road, which opened in 1875.
Location 2, the village of Kis’-se, is located mid-valley, south of the Merced River (Figure 3). The firstdocumented use of this area by Native Americans oc-curred in 1879 on the Wheeler Survey map (Wheeler1883, Hutchings 1886). The map indicates that thearea northwest of Kis’-se and its adjacent gatheringarea was ‘‘Indian Pasture.’’ The first written descrip-tion of Kis’-se was by C. Hart Merriam (1917:207),who described Kis’-se or Kis’s-se-uh it as a ‘‘largevillage near the river . . . Kis’-se was the westernmostof the large villages on the south side.’’
The village of Kis’-se consists of the archaeolog-ical site CA-MRP-76, which consists of midden soils,
two stationary milling outcrops with 50 mortar cups,and an obsidian debitage scatter (Hull and Kelly1995). C. Hart Merriam’s identification of Kis’-se, andsurface constituents, are consistent with Protohistoricand Historic 1 occupation.
Fire History
The fire return intervals observed in the dendro-chronological fire history, AD 1552–2004, revealed acomposite MFI of 1.92 and a point MFI of 17.83 ywith a range of 1–56 y (Figure 4; Tables 2, 3).
Significant differences in burning patterns oc-curred between the Late Prehistoric 3 (AD 1350–1800)and Protohistoric (AD 1800–1847) periods and the His-toric 2 (AD 1864–1890) and Historic 3 periods (AD
1891–1944) (Table 4). The majority of land-use typesshowed no statistical difference between any of theother land-use areas by time period. The only statis-tical difference was between the bigleaf maple (Acermacrophyllum) and bracken fern (Pteridium aquilin-um) gathering area, YV-01 (Table 3). When data fromland-use types at both village sites were merged, nodifferences were detected. Each land-use type showed
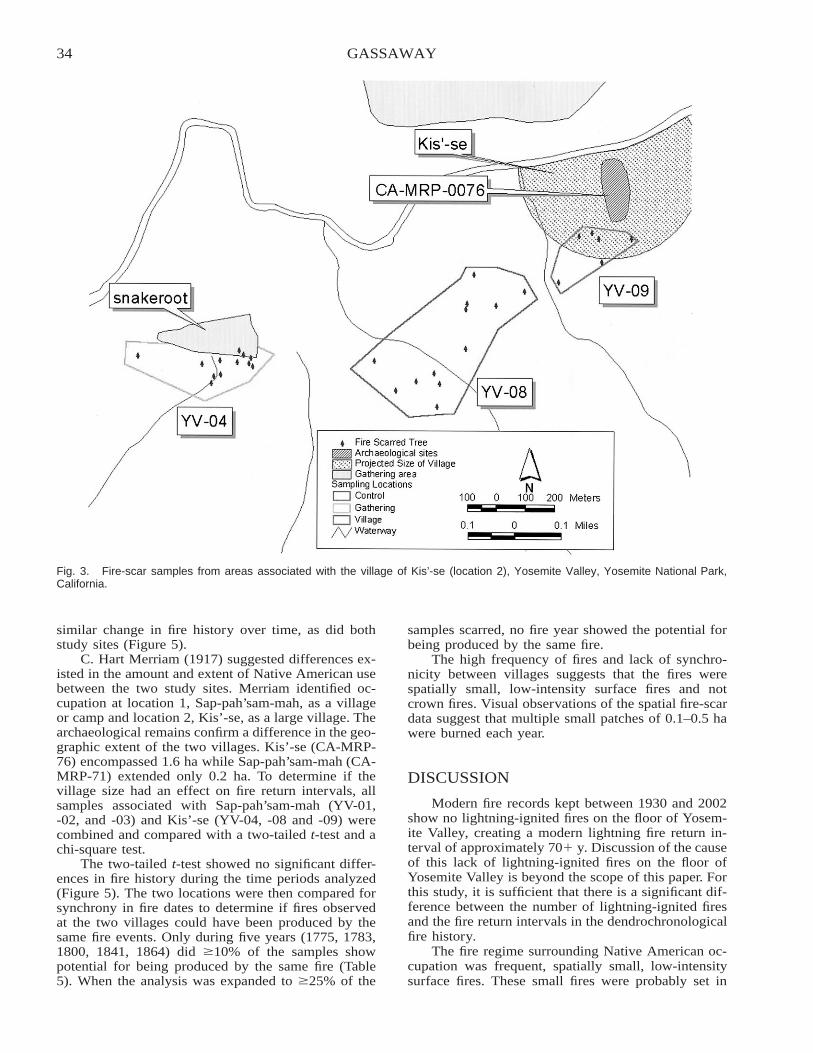
34 GASSAWAY
Fig. 3. Fire-scar samples from areas associated with the village of Kis’-se (location 2), Yosemite Valley, Yosemite National Park,California.
similar change in fire history over time, as did bothstudy sites (Figure 5).
C. Hart Merriam (1917) suggested differences ex-isted in the amount and extent of Native American usebetween the two study sites. Merriam identified oc-cupation at location 1, Sap-pah’sam-mah, as a villageor camp and location 2, Kis’-se, as a large village. Thearchaeological remains confirm a difference in the geo-graphic extent of the two villages. Kis’-se (CA-MRP-76) encompassed 1.6 ha while Sap-pah’sam-mah (CA-MRP-71) extended only 0.2 ha. To determine if thevillage size had an effect on fire return intervals, allsamples associated with Sap-pah’sam-mah (YV-01,-02, and -03) and Kis’-se (YV-04, -08 and -09) werecombined and compared with a two-tailed t-test and achi-square test.
The two-tailed t-test showed no significant differ-ences in fire history during the time periods analyzed(Figure 5). The two locations were then compared forsynchrony in fire dates to determine if fires observedat the two villages could have been produced by thesame fire events. Only during five years (1775, 1783,1800, 1841, 1864) did �10% of the samples showpotential for being produced by the same fire (Table5). When the analysis was expanded to �25% of the
samples scarred, no fire year showed the potential forbeing produced by the same fire.
The high frequency of fires and lack of synchro-nicity between villages suggests that the fires werespatially small, low-intensity surface fires and notcrown fires. Visual observations of the spatial fire-scardata suggest that multiple small patches of 0.1–0.5 hawere burned each year.
DISCUSSION
Modern fire records kept between 1930 and 2002show no lightning-ignited fires on the floor of Yosem-ite Valley, creating a modern lightning fire return in-terval of approximately 70� y. Discussion of the causeof this lack of lightning-ignited fires on the floor ofYosemite Valley is beyond the scope of this paper. Forthis study, it is sufficient that there is a significant dif-ference between the number of lightning-ignited firesand the fire return intervals in the dendrochronologicalfire history.
The fire regime surrounding Native American oc-cupation was frequent, spatially small, low-intensitysurface fires. These small fires were probably set in
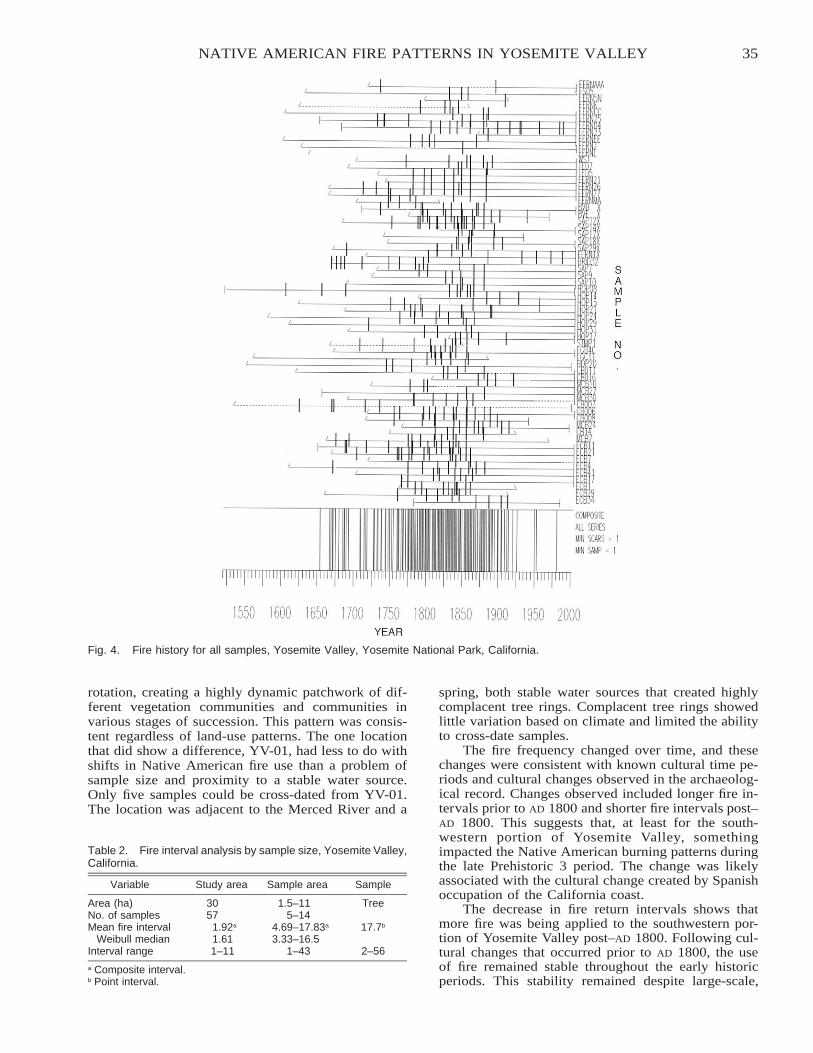
35NATIVE AMERICAN FIRE PATTERNS IN YOSEMITE VALLEY
Fig. 4. Fire history for all samples, Yosemite Valley, Yosemite National Park, California.
Table 2. Fire interval analysis by sample size, Yosemite Valley,California.
Variable Study area Sample area Sample
Area (ha) 30 1.5–11 TreeNo. of samples 57 5–14Mean fire interval 1.92a 4.69–17.83a 17.7b
Weibull median 1.61 3.33–16.5Interval range 1–11 1–43 2–56
a Composite interval.b Point interval.
rotation, creating a highly dynamic patchwork of dif-ferent vegetation communities and communities invarious stages of succession. This pattern was consis-tent regardless of land-use patterns. The one locationthat did show a difference, YV-01, had less to do withshifts in Native American fire use than a problem ofsample size and proximity to a stable water source.Only five samples could be cross-dated from YV-01.The location was adjacent to the Merced River and a
spring, both stable water sources that created highlycomplacent tree rings. Complacent tree rings showedlittle variation based on climate and limited the abilityto cross-date samples.
The fire frequency changed over time, and thesechanges were consistent with known cultural time pe-riods and cultural changes observed in the archaeolog-ical record. Changes observed included longer fire in-tervals prior to AD 1800 and shorter fire intervals post–AD 1800. This suggests that, at least for the south-western portion of Yosemite Valley, somethingimpacted the Native American burning patterns duringthe late Prehistoric 3 period. The change was likelyassociated with the cultural change created by Spanishoccupation of the California coast.
The decrease in fire return intervals shows thatmore fire was being applied to the southwestern por-tion of Yosemite Valley post–AD 1800. Following cul-tural changes that occurred prior to AD 1800, the useof fire remained stable throughout the early historicperiods. This stability remained despite large-scale,
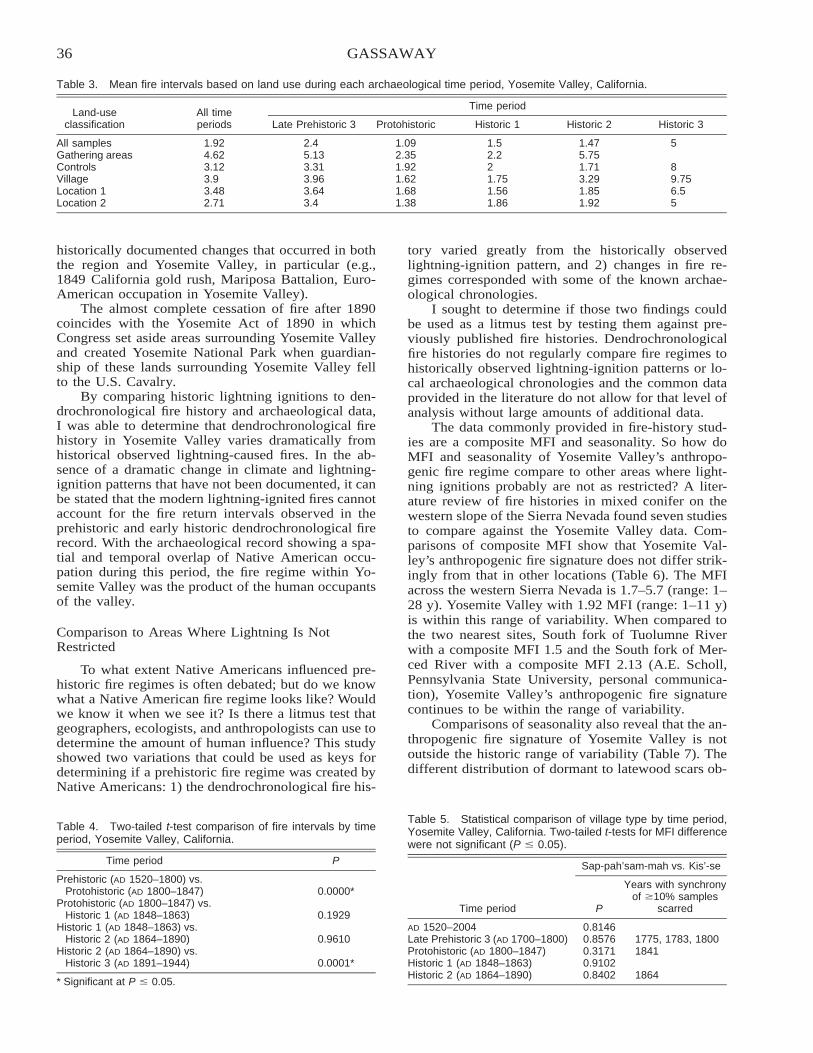
36 GASSAWAY
Table 3. Mean fire intervals based on land use during each archaeological time period, Yosemite Valley, California.
Land-useclassification
All timeperiods
Time period
Late Prehistoric 3 Protohistoric Historic 1 Historic 2 Historic 3
All samples 1.92 2.4 1.09 1.5 1.47 5Gathering areas 4.62 5.13 2.35 2.2 5.75Controls 3.12 3.31 1.92 2 1.71 8Village 3.9 3.96 1.62 1.75 3.29 9.75Location 1 3.48 3.64 1.68 1.56 1.85 6.5Location 2 2.71 3.4 1.38 1.86 1.92 5
Table 4. Two-tailed t-test comparison of fire intervals by timeperiod, Yosemite Valley, California.
Time period P
Prehistoric (AD 1520–1800) vs.Protohistoric (AD 1800–1847) 0.0000*
Protohistoric (AD 1800–1847) vs.Historic 1 (AD 1848–1863) 0.1929
Historic 1 (AD 1848–1863) vs.Historic 2 (AD 1864–1890) 0.9610
Historic 2 (AD 1864–1890) vs.Historic 3 (AD 1891–1944) 0.0001*
* Significant at P � 0.05.
Table 5. Statistical comparison of village type by time period,Yosemite Valley, California. Two-tailed t-tests for MFI differencewere not significant (P � 0.05).
Time period
Sap-pah’sam-mah vs. Kis’-se
P
Years with synchronyof �10% samples
scarred
AD 1520–2004 0.8146Late Prehistoric 3 (AD 1700–1800) 0.8576 1775, 1783, 1800Protohistoric (AD 1800–1847) 0.3171 1841Historic 1 (AD 1848–1863) 0.9102Historic 2 (AD 1864–1890) 0.8402 1864
historically documented changes that occurred in boththe region and Yosemite Valley, in particular (e.g.,1849 California gold rush, Mariposa Battalion, Euro-American occupation in Yosemite Valley).
The almost complete cessation of fire after 1890coincides with the Yosemite Act of 1890 in whichCongress set aside areas surrounding Yosemite Valleyand created Yosemite National Park when guardian-ship of these lands surrounding Yosemite Valley fellto the U.S. Cavalry.
By comparing historic lightning ignitions to den-drochronological fire history and archaeological data,I was able to determine that dendrochronological firehistory in Yosemite Valley varies dramatically fromhistorical observed lightning-caused fires. In the ab-sence of a dramatic change in climate and lightning-ignition patterns that have not been documented, it canbe stated that the modern lightning-ignited fires cannotaccount for the fire return intervals observed in theprehistoric and early historic dendrochronological firerecord. With the archaeological record showing a spa-tial and temporal overlap of Native American occu-pation during this period, the fire regime within Yo-semite Valley was the product of the human occupantsof the valley.
Comparison to Areas Where Lightning Is NotRestricted
To what extent Native Americans influenced pre-historic fire regimes is often debated; but do we knowwhat a Native American fire regime looks like? Wouldwe know it when we see it? Is there a litmus test thatgeographers, ecologists, and anthropologists can use todetermine the amount of human influence? This studyshowed two variations that could be used as keys fordetermining if a prehistoric fire regime was created byNative Americans: 1) the dendrochronological fire his-
tory varied greatly from the historically observedlightning-ignition pattern, and 2) changes in fire re-gimes corresponded with some of the known archae-ological chronologies.
I sought to determine if those two findings couldbe used as a litmus test by testing them against pre-viously published fire histories. Dendrochronologicalfire histories do not regularly compare fire regimes tohistorically observed lightning-ignition patterns or lo-cal archaeological chronologies and the common dataprovided in the literature do not allow for that level ofanalysis without large amounts of additional data.
The data commonly provided in fire-history stud-ies are a composite MFI and seasonality. So how doMFI and seasonality of Yosemite Valley’s anthropo-genic fire regime compare to other areas where light-ning ignitions probably are not as restricted? A liter-ature review of fire histories in mixed conifer on thewestern slope of the Sierra Nevada found seven studiesto compare against the Yosemite Valley data. Com-parisons of composite MFI show that Yosemite Val-ley’s anthropogenic fire signature does not differ strik-ingly from that in other locations (Table 6). The MFIacross the western Sierra Nevada is 1.7–5.7 (range: 1–28 y). Yosemite Valley with 1.92 MFI (range: 1–11 y)is within this range of variability. When compared tothe two nearest sites, South fork of Tuolumne Riverwith a composite MFI 1.5 and the South fork of Mer-ced River with a composite MFI 2.13 (A.E. Scholl,Pennsylvania State University, personal communica-tion), Yosemite Valley’s anthropogenic fire signaturecontinues to be within the range of variability.
Comparisons of seasonality also reveal that the an-thropogenic fire signature of Yosemite Valley is notoutside the historic range of variability (Table 7). Thedifferent distribution of dormant to latewood scars ob-
37NATIVE AMERICAN FIRE PATTERNS IN YOSEMITE VALLEY
Fig. 5. Mean fire return interval (y) by period for the villages of Sap-pah’sam-mah and Kis’-se, Yosemite Valley, Yosemite NationalPark, California.
Table 6. Composite mean fire interval (MFI) for locations in Yosemite Valley, California.
LocationStudy area
(ha)
No. oftrees
sampled
CompositeMFI for study
area (y)
CompositeMFI range
(y) Source
Blodgett 5 46 4.7 4–28 Stephens and Collins 2004Pilot Creek 15 15 5.7 3–18 Stephens and Collins 2004South fork of Tuolumne 2,100 209 1.5 1–16 A.E. Scholl, Pennsylvania State University, per-
sonal communicationYosemite Valley 30 57 1.92 1–11 Gassaway 2005South fork of Merced 1,625 69 2.13 1–28 A.E. Scholl, Pennsylvania State University, per-
sonal communicationSouthern-central Sierra Nevada,
Yosemite National Park20–50 2–3 1–25 Swetnam et al. 1998, Stephens and Collins 2004
Sequoia Kings Canyon NationalPark, Redwood Creek
1,030 37 2.1 1.73–2.35 Kilgore and Taylor 1979
Bearskin Creek 770 183 1.7 1.55–1.86 Kilgore and Taylor 1979Mountain Home Demonstration
State Forest20–50 3–5 1–12 Swetnam et al. 1998, Stephens and Collins 2004
served in Yosemite Valley and other studies is consis-tent with latitudinal gradients of climate.
Comparison of the anthropogenic fire signature inYosemite Valley to other studies within the Sierra Ne-vada shows that Native American fire regimes are notnecessarily outside the range of variability of otherfire-history studies within the Sierra Nevada. The sim-ilarity may be due to a high degree of Native Americaninfluence on fire regimes outside of Yosemite Valley,a dependence of fire spread on fuel and climatic eventsregardless of ignition source, or Native Americansmimicking lightning-fire patterns, or it may be relatedto data sources and sampling methods. The reasons forthe similarity in fire regimes cannot be determinedwithout further research.
Barrett et al. (2005:32) stated ‘‘lightning fires . . .
were well capable of maintaining most fire regimes inthe West.’’ In the case of Yosemite Valley, this is nottrue: lightning fires could not maintain the prehistoricand historic fire regimes seen in the dendrochronolog-ical fire history. Whether this can be said for the restof the West remains to be tested using site-specifichuman-occupation data. Most fire-history studies arenot designed to determine source of ignition or differ-entiate between potential amount of lightning and an-thropogenic ignitions. Currently, we do not even knowwhat a definitive anthropogenic signature looks likeand we do not know if or how much it varies overspace, time, or how much it is based on human intentand needs.
We know that Native Americans lived in discretelocations and various times. The similarity of Yosemite
38 GASSAWAY
Table 7. Fire seasonality, western slope of Sierra Nevada, California.
Location
Seasona (%)
D L EEW MEW LEW Source
Blodgett 21 79 NR NR NR Stephens and Collins 2004Pilot Creek 21 79 NR NR NR Stephens and Collins 2004South fork of Tuolumne 51 24 NR NR NR A.E. Scholl, Pennsylvania State University, per-
sonal communicationYosemite Valley 48 31.5 7.3 5.2 7.3 Gassaway 2005South fork of Merced 38 32 NR NR NR A.E. Scholl, Pennsylvania State University, per-
sonal communicationSouthern-central Sierra Nevada,
Yosemite National Park23 54 1 4 18 Swetnam et al. 1998, Stephens and Collins
2004Mountain Home Demonstration
State Forest20 61 0 1 16 Swetnam et al. 1998, Stephens and Collins
2004
a Abbreviations: D, dormant; EEW, early earlywood; L, latewood; LEW, late earlywood; MEW, middle earlywood; NR, not reported.
Valley’s anthropogenic fire signature to other fire his-tories may indicate that mean fire return intervals andseasonality cannot be used alone to determine theamount of lightning versus anthropogenic interventionwithin a fire regime. In order to determine the amountof influence Native Americans and lightning had onfire regimes, studies have to either explicitly or quan-titatively determine ignition sources and use site-spe-cific ethnographic and archaeological data.
Without additional studies that take into accountthe site-specific ethnographic and archaeological data,our understanding of anthropogenic fire use will befraught with subjective opinion and bias. We need totest our assumptions.
ACKNOWLEDGMENTS
I acknowledge all the fieldworkers who helpedgather data: Nelson Siefkin, Dayna Tinsley, MarkGiambastiani, Nikolai Shebalin, Stacey Zolnoski, LoriSlicton, George Buckingham, Susan Kerr, Amy Mc-Carthy, Phil Reid, Mathew Moore, Sonny Montague,and Laura Kirn, Anthropology 492: ArchaeologicalMethods, SFSU (2003), students from Modesto JuniorCollege (5 April 2003): Fire scar samples: Brian Mat-tos, the Yosemite Fire sawyers who did the real workof cutting the samples: Kelly Singer, Jeff Pirog, Bran-don Dethlefs, Taro Pusina, Jeff Hinson, Logan Sand-ers, Jeff Crandal, Parker Bevington, and Tony Thaler.Without the help of four universities, their staff, andfacilities this study would not have been completed:San Francisco State University, Department of An-thropology; The Laboratory of Tree Ring Research,University of Arizona; John Sakulich and Andy Schollat Pennsylvania State University; and David L. Peter-son and James Agee at University of Washington.
LITERATURE CITEDAnderson, M.K. 1988. Southern Sierra Miwok plant resource use
and management of the Yosemite region: a study of thebiological and cultural bases for plant gathering, field hor-ticulture, and anthropogenic impacts on sierra vegetation.M.A. Thesis, University of California, Berkeley.
Anderson, M.K. 1993. Indian fire-based management in the se-quoia–mixed conifer forests of the central and southern Si-
erra Nevada. Cooperative Agreement Order 8027-2-002,Yosemite Research Center, Yosemite National Park, CA.
Anderson, M.K., and M.J. Moratto. 1996. Native American land-use practices and ecological impacts. Pages 09-01–09-20 inM. Barbour (ed.). Status of the Sierra Nevada: Sierra Ne-vada Ecosystems Project final report to Congress. Volume2. University of California Centers for Water and WildlandResources, Davis.
Baisan, C.H. 1990. Fire history of the Rincon Mountain Wil-derness, Saguaro National Monument. Technical Report 29,National Park Service, Cooperative Resources Studies Unit,University of Arizona, Tucson.
Barrett, S.A., and E.W. Gifford. 1933. Miwok material culture:Indian life of the Yosemite region. 1976 reprint. YosemiteNatural History Association, Yosemite National Park, Yo-semite, CA.
Barrett, S.W. 1981. Relationship of Indian-caused fires to theecology of the western Montana forests. M.S. Thesis, Uni-versity of Montana, Missoula.
Barrett, S.W., T.W. Swetnam, and W.L. Baker. 2005. Indian fireuse: deflating the legend. Fire Management Today 65:31–34.
Bennyhoff, J.A. 1953. Preliminary report on archaeological ex-cavations in Yosemite National Park. Report to the NationalPark Service, San Francisco. University of California,Berkeley.
Bennyhoff, J.A. 1956. An appraisal of the archaeological re-sources of Yosemite National Park. University of CaliforniaArchaeological Survey 34, Berkeley.
Bibby, B. 1994. An ethnographic evaluation of Yosemite Valley:the Native American cultural landscape. Unpublished doc-ument, Yosemite National Park, CA.
Bonnicksen, T.M., M.K. Anderson, H.T. Lewis, C.E. Kay, andR. Knudson. 1999. Native American influences on the de-velopment of forest ecosystems. Pages 439–470 in N.C.Johnson, A.J. Malk, W.T. Sexton, and R. Szaro (eds.). Eco-logical stewardship: a common reference for ecosystemmanagement. Elsevier Science, Oxford, United Kingdom.
Broadbent, S.M. 1960. A grammar of Southern Sierra Miwok.Ph.D. Dissertation, University of California, Berkeley.
Byram, S. 1996. On-site lithic analysis manual: prepared for theMalheur National Forest. Malheur National Forest, JohnDay, OR.
Dieterich, J.H., and T.W. Swetnam. 1984. Dendrochronology ofa fire-scarred ponderosa pine. Forest Science 30:238–247.
Gassaway, L. 2004. Reexamination of village sites identified byMerriam and Powers in Yosemite Valley. Proceedings ofthe Society for California Archaeology 37:67–73.
Gassaway, L. 2005. Hujpu-St: spatial and temporal patterns ofanthropogenic fire in Yosemite Valley. M.A. Thesis, SanFrancisco State University, San Francisco, CA.
Gifford, E.W. 1916. Miwok moieties. University of CaliforniaPress, Berkeley.
39NATIVE AMERICAN FIRE PATTERNS IN YOSEMITE VALLEY
Grissino-Mayer, H.D. 2001. FHX2—software for analyzing tem-poral and spatial patterns in fire regimes from tree rings.Tree-Ring Research 57:115–124.
Grosscup, G.L. 1954. An archaeological survey of Yosemite Na-tional Park, 1954. Submitted to the National Park Service,San Francisco. University of California Archaeological Sur-vey, Berkeley.
Gruell, G.E. 1985. Indian fires in the Interior West: a widespreadinfluence. Pages 69–74 in J.E. Lotan, B.M. Kilgore, W.C.Fischer, and R.W. Mutch (technical coordinators). Proceed-ings: symposium and workshop on wilderness fire. GeneralTechnical Report INT-182, U.S. Department of Agriculture,Forest Service, Intermountain Forest and Range ExperimentStation, Ogden, UT.
Hull, K.L., and M.S. Kelly. 1995. An archeological inventory ofYosemite Valley, Yosemite National Park, California. U.S.Department of the Interior, National Park Service, YosemiteNational Park, Yosemite, CA.
Hutchings, J.M. 1886. In the heart of the Sierras: the Yo SemiteValley, both historical and descriptive: and scenes by theway. Pacific Press Publishing House, Oakland, CA.
Kaye, M.W., and T.W. Swetnam. 1999. An assessment of fireclimate and Apache history in the Sacramento Mountains,New Mexico. Physical Geography 20:305–330.
Kilgore, B.M., and D. Taylor. 1979. Fire history of a sequoia–mixed conifer forest. Ecology 60:129–142.
King, J.C. 1991. Douglas-fir chronology, Yosemite Valley, Yo-semite National Park. International Tree-Ring Data Bank,IGBP PAGES/World Data Center for Paleoclimatology,NOAA/NCDC Paleoclimatology Program, Boulder, CO.http://www.ncdc.noaa.gov/paleo/treering.html [accessed 7Jun 2007].
Komarek, E.V. Sr. 1967. The nature of lightning fires. Proceed-ings of the Annual Tall Timbers Fire Ecology Conference6:5–41.
Lewis, H.T. 1973. Patterns of Indian burning in California: ecol-ogy and ethnohistory. Ballena Press, Ramona, CA.
Merriam, C.H. 1917. Indian village and camp sites in YosemiteValley. Sierra Club Bulletin 10:202–209.
Moratto, M.J. 1999. Cultural chronology 2: the Yosemite data.Yosemite Research Center Publications in Anthropology 21:17–28.
Napton, L.K. 1978. Archeological overview of Yosemite Na-tional Park, California. Submitted to U.S. Department of theInterior, National Park Service, Western ArchaeologicalCenter, Tucson, Arizona. In partial fulfillment of ContractNo. CX800040032, Institute for Archeological Research,California State College, Stanislaus, Turlock.
Napton, L.K., A.D. Albee, and E.A. Greathouse. 1974. Archeo-logical survey in Yosemite National Park, California: Yo-semite Valley (Parts 1–2). Submitted to U.S. Department of
the Interior, National Park Service, Western Archeologicaland Conservation Center, Tucson, AZ.
National Park Service. 2002. Draft Yosemite fire managementplan: environmental impact statement. Yosemite NationalPark, Yosemite, CA.
Pyne, S.J. 1983. Indian fires: the fire practices of North Ameri-can Indians transformed large areas from forest to grass-land. Natural History 92:6, 8, 10–11.
Reynolds, R.D. 1959. Effect of natural fires and aboriginal burn-ing upon the forests of the Central Sierra Nevada. M.A.Thesis, University of California, Berkeley.
Roper Wickstrom, C.K. 1987. Issues concerning Native Ameri-can use of fire: a literature review. Yosemite National ParkPublications in Anthropology 6, Yosemite, CA.
Savage, M., and T.W. Swetnam. 1990. Early 19th-century firedecline following sheep pasturing in a Navajo ponderosapine forest. Ecology 71:2374–2378.
Stephens, S.L., and B.M. Collins. 2004. Fire regimes of mixedconifer forests in the north-central Sierra Nevada at multiplespatial scales. Northwest Science 78:12–23.
Stewart, O.C. 1956. Fire as the first great force employed byman. Pages 115–133 in W.L. Thomas (ed.). Man’s role inchanging the face of the earth. Published for the Wenner-Gren Foundation for Anthropological Research and the Na-tional Science Foundation by the University of ChicagoPress, Chicago, IL.
Stokes, M.A. 1980. The dendrochronology of fire history. Pages1–3 in Proceedings of the Fire History Workshop. GeneralTechnical Report RM-81, U.S. Department of Agriculture,Forest Service, Rocky Mountain Forest and Range Exper-iment Station, Fort Collins, CO.
Stokes, M.A., and T.L. Smiley. 1996. An introduction to tree-ring dating. University of Arizona Press, Tucson.
Swetnam, T.W., C.H. Baisan, K.A. Morino, and A.C. Caprio.1998. Fire history along elevational transects in the SierraNevada, California. Laboratory of Tree Ring Research, Uni-versity of Arizona, Tucson.
van Wagtendonk, J.W. 1993. Spatial patterns of lightning strikesand fires in Yosemite National Park. Pages 223–231 in Pro-ceedings of the 12th Conference on Fire and Forest Meteo-rology. 26–28 Oct 1993, Jekyll Island, GA. Society ofAmerican Foresters, Bethesda, MD.
Wheeler, G.M. 1883. Topographical map of Yosemite Valley andvicinity. Norris Peters, Washington, D.C.
Williams, G.W. 2003. References on the American Indian use offire in ecosystems. http://www.wildlandfire.com/docs/biblio�indianfire.htm [accessed 8 Feb 2007].
Wilson, D., R. Cromwell, T. Langford, D. Semrau, and G. Ka-ehler. 2002. Archaeology lab manual. U.S. Department ofthe Interior, National Park Service, Fort Vancouver NationalHistoric Site, Vancouver, WA.
Yamaguchi, D.K. 1991. A simple method for cross-dating incre-ment cores from living trees. Canadian Journal of ForestResearch 21:414–416.
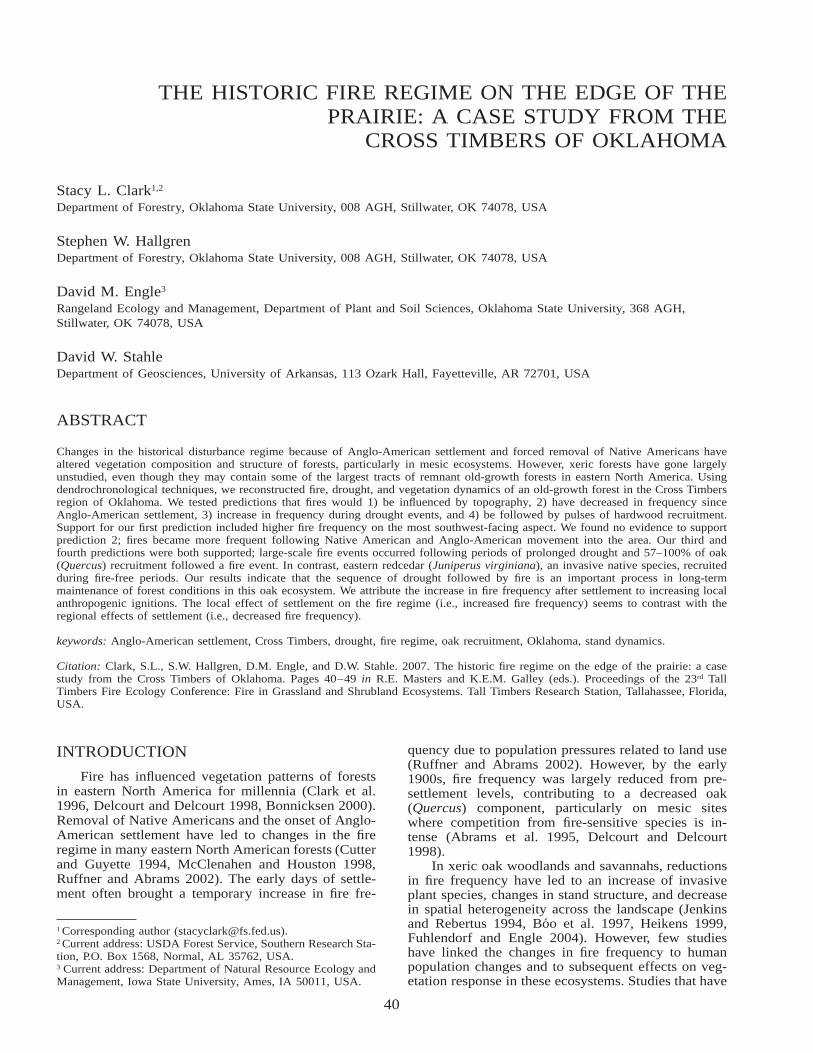
40
THE HISTORIC FIRE REGIME ON THE EDGE OF THEPRAIRIE: A CASE STUDY FROM THE
CROSS TIMBERS OF OKLAHOMA
Stacy L. Clark1,2
Department of Forestry, Oklahoma State University, 008 AGH, Stillwater, OK 74078, USA
Stephen W. HallgrenDepartment of Forestry, Oklahoma State University, 008 AGH, Stillwater, OK 74078, USA
David M. Engle3
Rangeland Ecology and Management, Department of Plant and Soil Sciences, Oklahoma State University, 368 AGH,Stillwater, OK 74078, USA
David W. StahleDepartment of Geosciences, University of Arkansas, 113 Ozark Hall, Fayetteville, AR 72701, USA
ABSTRACT
Changes in the historical disturbance regime because of Anglo-American settlement and forced removal of Native Americans havealtered vegetation composition and structure of forests, particularly in mesic ecosystems. However, xeric forests have gone largelyunstudied, even though they may contain some of the largest tracts of remnant old-growth forests in eastern North America. Usingdendrochronological techniques, we reconstructed fire, drought, and vegetation dynamics of an old-growth forest in the Cross Timbersregion of Oklahoma. We tested predictions that fires would 1) be influenced by topography, 2) have decreased in frequency sinceAnglo-American settlement, 3) increase in frequency during drought events, and 4) be followed by pulses of hardwood recruitment.Support for our first prediction included higher fire frequency on the most southwest-facing aspect. We found no evidence to supportprediction 2; fires became more frequent following Native American and Anglo-American movement into the area. Our third andfourth predictions were both supported; large-scale fire events occurred following periods of prolonged drought and 57–100% of oak(Quercus) recruitment followed a fire event. In contrast, eastern redcedar (Juniperus virginiana), an invasive native species, recruitedduring fire-free periods. Our results indicate that the sequence of drought followed by fire is an important process in long-termmaintenance of forest conditions in this oak ecosystem. We attribute the increase in fire frequency after settlement to increasing localanthropogenic ignitions. The local effect of settlement on the fire regime (i.e., increased fire frequency) seems to contrast with theregional effects of settlement (i.e., decreased fire frequency).
keywords: Anglo-American settlement, Cross Timbers, drought, fire regime, oak recruitment, Oklahoma, stand dynamics.
Citation: Clark, S.L., S.W. Hallgren, D.M. Engle, and D.W. Stahle. 2007. The historic fire regime on the edge of the prairie: a casestudy from the Cross Timbers of Oklahoma. Pages 40–49 in R.E. Masters and K.E.M. Galley (eds.). Proceedings of the 23rd TallTimbers Fire Ecology Conference: Fire in Grassland and Shrubland Ecosystems. Tall Timbers Research Station, Tallahassee, Florida,USA.
INTRODUCTION
Fire has influenced vegetation patterns of forestsin eastern North America for millennia (Clark et al.1996, Delcourt and Delcourt 1998, Bonnicksen 2000).Removal of Native Americans and the onset of Anglo-American settlement have led to changes in the fireregime in many eastern North American forests (Cutterand Guyette 1994, McClenahen and Houston 1998,Ruffner and Abrams 2002). The early days of settle-ment often brought a temporary increase in fire fre-
1 Corresponding author ([email protected]).2 Current address: USDA Forest Service, Southern Research Sta-tion, P.O. Box 1568, Normal, AL 35762, USA.3 Current address: Department of Natural Resource Ecology andManagement, Iowa State University, Ames, IA 50011, USA.
quency due to population pressures related to land use(Ruffner and Abrams 2002). However, by the early1900s, fire frequency was largely reduced from pre-settlement levels, contributing to a decreased oak(Quercus) component, particularly on mesic siteswhere competition from fire-sensitive species is in-tense (Abrams et al. 1995, Delcourt and Delcourt1998).
In xeric oak woodlands and savannahs, reductionsin fire frequency have led to an increase of invasiveplant species, changes in stand structure, and decreasein spatial heterogeneity across the landscape (Jenkinsand Rebertus 1994, Boo et al. 1997, Heikens 1999,Fuhlendorf and Engle 2004). However, few studieshave linked the changes in fire frequency to humanpopulation changes and to subsequent effects on veg-etation response in these ecosystems. Studies that have
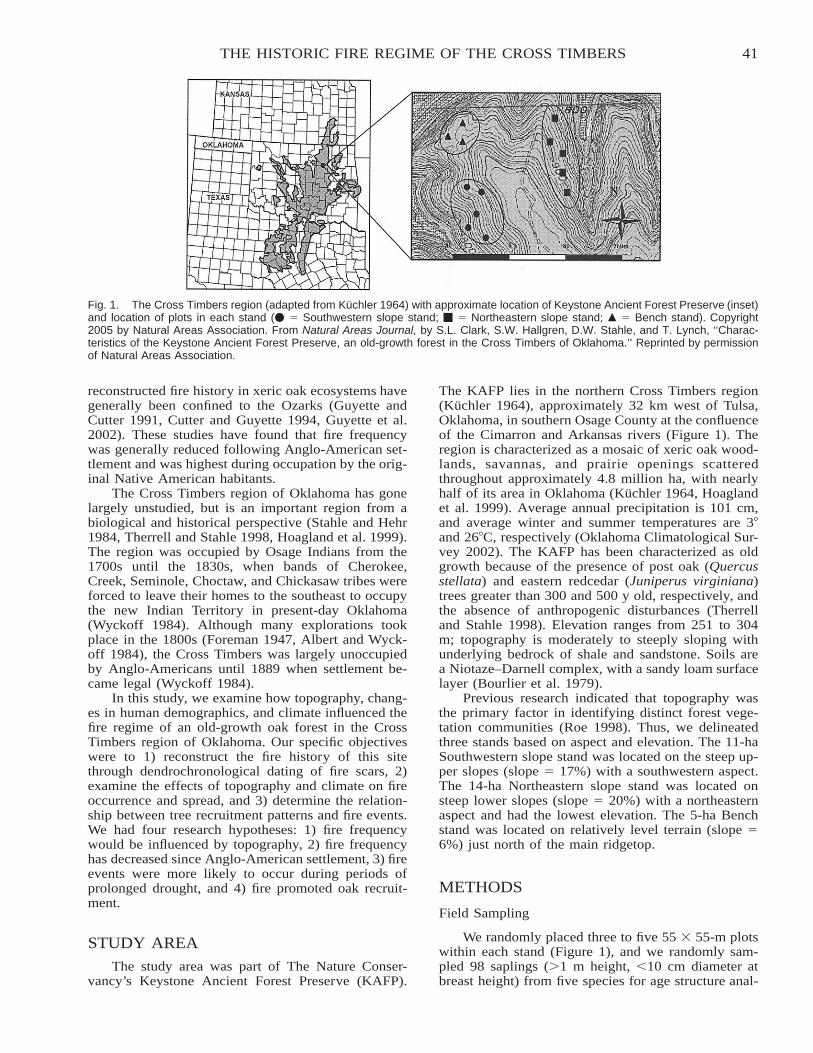
41THE HISTORIC FIRE REGIME OF THE CROSS TIMBERS
Fig. 1. The Cross Timbers region (adapted from Kuchler 1964) with approximate location of Keystone Ancient Forest Preserve (inset)and location of plots in each stand (� � Southwestern slope stand; � � Northeastern slope stand; � � Bench stand). Copyright2005 by Natural Areas Association. From Natural Areas Journal, by S.L. Clark, S.W. Hallgren, D.W. Stahle, and T. Lynch, ‘‘Charac-teristics of the Keystone Ancient Forest Preserve, an old-growth forest in the Cross Timbers of Oklahoma.’’ Reprinted by permissionof Natural Areas Association.
reconstructed fire history in xeric oak ecosystems havegenerally been confined to the Ozarks (Guyette andCutter 1991, Cutter and Guyette 1994, Guyette et al.2002). These studies have found that fire frequencywas generally reduced following Anglo-American set-tlement and was highest during occupation by the orig-inal Native American habitants.
The Cross Timbers region of Oklahoma has gonelargely unstudied, but is an important region from abiological and historical perspective (Stahle and Hehr1984, Therrell and Stahle 1998, Hoagland et al. 1999).The region was occupied by Osage Indians from the1700s until the 1830s, when bands of Cherokee,Creek, Seminole, Choctaw, and Chickasaw tribes wereforced to leave their homes to the southeast to occupythe new Indian Territory in present-day Oklahoma(Wyckoff 1984). Although many explorations tookplace in the 1800s (Foreman 1947, Albert and Wyck-off 1984), the Cross Timbers was largely unoccupiedby Anglo-Americans until 1889 when settlement be-came legal (Wyckoff 1984).
In this study, we examine how topography, chang-es in human demographics, and climate influenced thefire regime of an old-growth oak forest in the CrossTimbers region of Oklahoma. Our specific objectiveswere to 1) reconstruct the fire history of this sitethrough dendrochronological dating of fire scars, 2)examine the effects of topography and climate on fireoccurrence and spread, and 3) determine the relation-ship between tree recruitment patterns and fire events.We had four research hypotheses: 1) fire frequencywould be influenced by topography, 2) fire frequencyhas decreased since Anglo-American settlement, 3) fireevents were more likely to occur during periods ofprolonged drought, and 4) fire promoted oak recruit-ment.
STUDY AREA
The study area was part of The Nature Conser-vancy’s Keystone Ancient Forest Preserve (KAFP).
The KAFP lies in the northern Cross Timbers region(Kuchler 1964), approximately 32 km west of Tulsa,Oklahoma, in southern Osage County at the confluenceof the Cimarron and Arkansas rivers (Figure 1). Theregion is characterized as a mosaic of xeric oak wood-lands, savannas, and prairie openings scatteredthroughout approximately 4.8 million ha, with nearlyhalf of its area in Oklahoma (Kuchler 1964, Hoaglandet al. 1999). Average annual precipitation is 101 cm,and average winter and summer temperatures are 3�and 26�C, respectively (Oklahoma Climatological Sur-vey 2002). The KAFP has been characterized as oldgrowth because of the presence of post oak (Quercusstellata) and eastern redcedar (Juniperus virginiana)trees greater than 300 and 500 y old, respectively, andthe absence of anthropogenic disturbances (Therrelland Stahle 1998). Elevation ranges from 251 to 304m; topography is moderately to steeply sloping withunderlying bedrock of shale and sandstone. Soils area Niotaze–Darnell complex, with a sandy loam surfacelayer (Bourlier et al. 1979).
Previous research indicated that topography wasthe primary factor in identifying distinct forest vege-tation communities (Roe 1998). Thus, we delineatedthree stands based on aspect and elevation. The 11-haSouthwestern slope stand was located on the steep up-per slopes (slope � 17%) with a southwestern aspect.The 14-ha Northeastern slope stand was located onsteep lower slopes (slope � 20%) with a northeasternaspect and had the lowest elevation. The 5-ha Benchstand was located on relatively level terrain (slope �6%) just north of the main ridgetop.
METHODS
Field Sampling
We randomly placed three to five 55 � 55-m plotswithin each stand (Figure 1), and we randomly sam-pled 98 saplings (�1 m height, �10 cm diameter atbreast height) from five species for age structure anal-
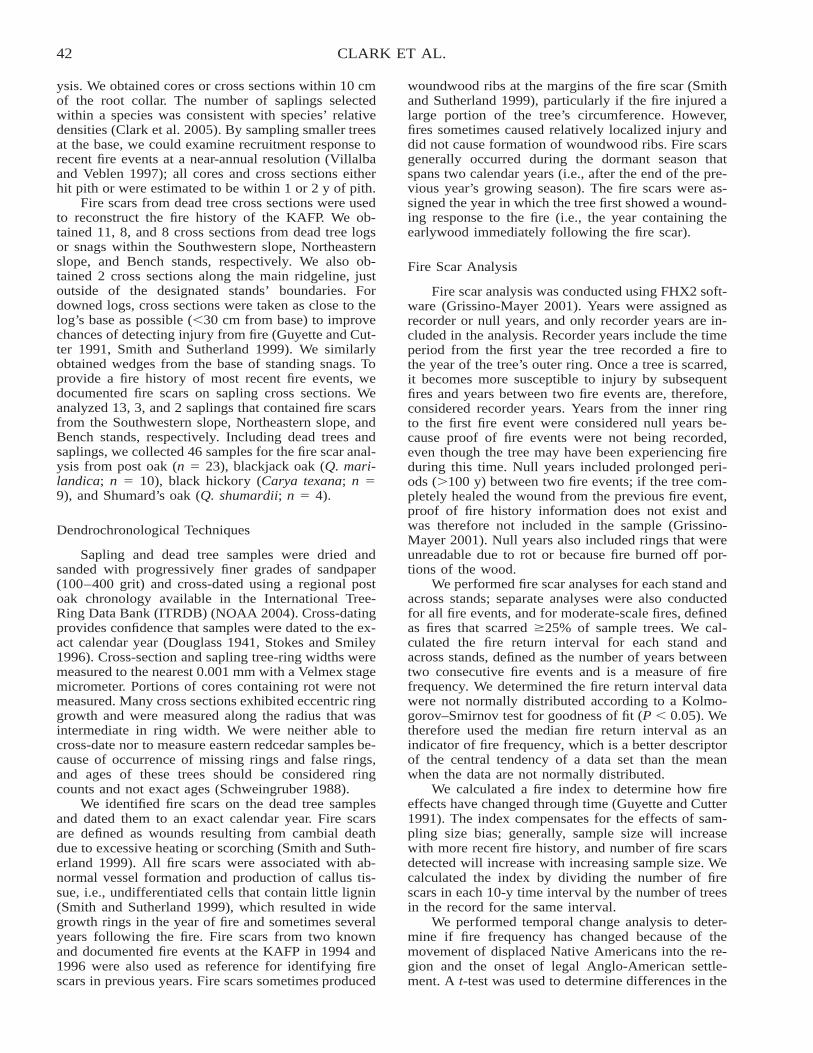
42 CLARK ET AL.
ysis. We obtained cores or cross sections within 10 cmof the root collar. The number of saplings selectedwithin a species was consistent with species’ relativedensities (Clark et al. 2005). By sampling smaller treesat the base, we could examine recruitment response torecent fire events at a near-annual resolution (Villalbaand Veblen 1997); all cores and cross sections eitherhit pith or were estimated to be within 1 or 2 y of pith.
Fire scars from dead tree cross sections were usedto reconstruct the fire history of the KAFP. We ob-tained 11, 8, and 8 cross sections from dead tree logsor snags within the Southwestern slope, Northeasternslope, and Bench stands, respectively. We also ob-tained 2 cross sections along the main ridgeline, justoutside of the designated stands’ boundaries. Fordowned logs, cross sections were taken as close to thelog’s base as possible (�30 cm from base) to improvechances of detecting injury from fire (Guyette and Cut-ter 1991, Smith and Sutherland 1999). We similarlyobtained wedges from the base of standing snags. Toprovide a fire history of most recent fire events, wedocumented fire scars on sapling cross sections. Weanalyzed 13, 3, and 2 saplings that contained fire scarsfrom the Southwestern slope, Northeastern slope, andBench stands, respectively. Including dead trees andsaplings, we collected 46 samples for the fire scar anal-ysis from post oak (n � 23), blackjack oak (Q. mari-landica; n � 10), black hickory (Carya texana; n �9), and Shumard’s oak (Q. shumardii; n � 4).
Dendrochronological Techniques
Sapling and dead tree samples were dried andsanded with progressively finer grades of sandpaper(100–400 grit) and cross-dated using a regional postoak chronology available in the International Tree-Ring Data Bank (ITRDB) (NOAA 2004). Cross-datingprovides confidence that samples were dated to the ex-act calendar year (Douglass 1941, Stokes and Smiley1996). Cross-section and sapling tree-ring widths weremeasured to the nearest 0.001 mm with a Velmex stagemicrometer. Portions of cores containing rot were notmeasured. Many cross sections exhibited eccentric ringgrowth and were measured along the radius that wasintermediate in ring width. We were neither able tocross-date nor to measure eastern redcedar samples be-cause of occurrence of missing rings and false rings,and ages of these trees should be considered ringcounts and not exact ages (Schweingruber 1988).
We identified fire scars on the dead tree samplesand dated them to an exact calendar year. Fire scarsare defined as wounds resulting from cambial deathdue to excessive heating or scorching (Smith and Suth-erland 1999). All fire scars were associated with ab-normal vessel formation and production of callus tis-sue, i.e., undifferentiated cells that contain little lignin(Smith and Sutherland 1999), which resulted in widegrowth rings in the year of fire and sometimes severalyears following the fire. Fire scars from two knownand documented fire events at the KAFP in 1994 and1996 were also used as reference for identifying firescars in previous years. Fire scars sometimes produced
woundwood ribs at the margins of the fire scar (Smithand Sutherland 1999), particularly if the fire injured alarge portion of the tree’s circumference. However,fires sometimes caused relatively localized injury anddid not cause formation of woundwood ribs. Fire scarsgenerally occurred during the dormant season thatspans two calendar years (i.e., after the end of the pre-vious year’s growing season). The fire scars were as-signed the year in which the tree first showed a wound-ing response to the fire (i.e., the year containing theearlywood immediately following the fire scar).
Fire Scar Analysis
Fire scar analysis was conducted using FHX2 soft-ware (Grissino-Mayer 2001). Years were assigned asrecorder or null years, and only recorder years are in-cluded in the analysis. Recorder years include the timeperiod from the first year the tree recorded a fire tothe year of the tree’s outer ring. Once a tree is scarred,it becomes more susceptible to injury by subsequentfires and years between two fire events are, therefore,considered recorder years. Years from the inner ringto the first fire event were considered null years be-cause proof of fire events were not being recorded,even though the tree may have been experiencing fireduring this time. Null years included prolonged peri-ods (�100 y) between two fire events; if the tree com-pletely healed the wound from the previous fire event,proof of fire history information does not exist andwas therefore not included in the sample (Grissino-Mayer 2001). Null years also included rings that wereunreadable due to rot or because fire burned off por-tions of the wood.
We performed fire scar analyses for each stand andacross stands; separate analyses were also conductedfor all fire events, and for moderate-scale fires, definedas fires that scarred �25% of sample trees. We cal-culated the fire return interval for each stand andacross stands, defined as the number of years betweentwo consecutive fire events and is a measure of firefrequency. We determined the fire return interval datawere not normally distributed according to a Kolmo-gorov–Smirnov test for goodness of fit (P � 0.05). Wetherefore used the median fire return interval as anindicator of fire frequency, which is a better descriptorof the central tendency of a data set than the meanwhen the data are not normally distributed.
We calculated a fire index to determine how fireeffects have changed through time (Guyette and Cutter1991). The index compensates for the effects of sam-pling size bias; generally, sample size will increasewith more recent fire history, and number of fire scarsdetected will increase with increasing sample size. Wecalculated the index by dividing the number of firescars in each 10-y time interval by the number of treesin the record for the same interval.
We performed temporal change analysis to deter-mine if fire frequency has changed because of themovement of displaced Native Americans into the re-gion and the onset of legal Anglo-American settle-ment. A t-test was used to determine differences in the
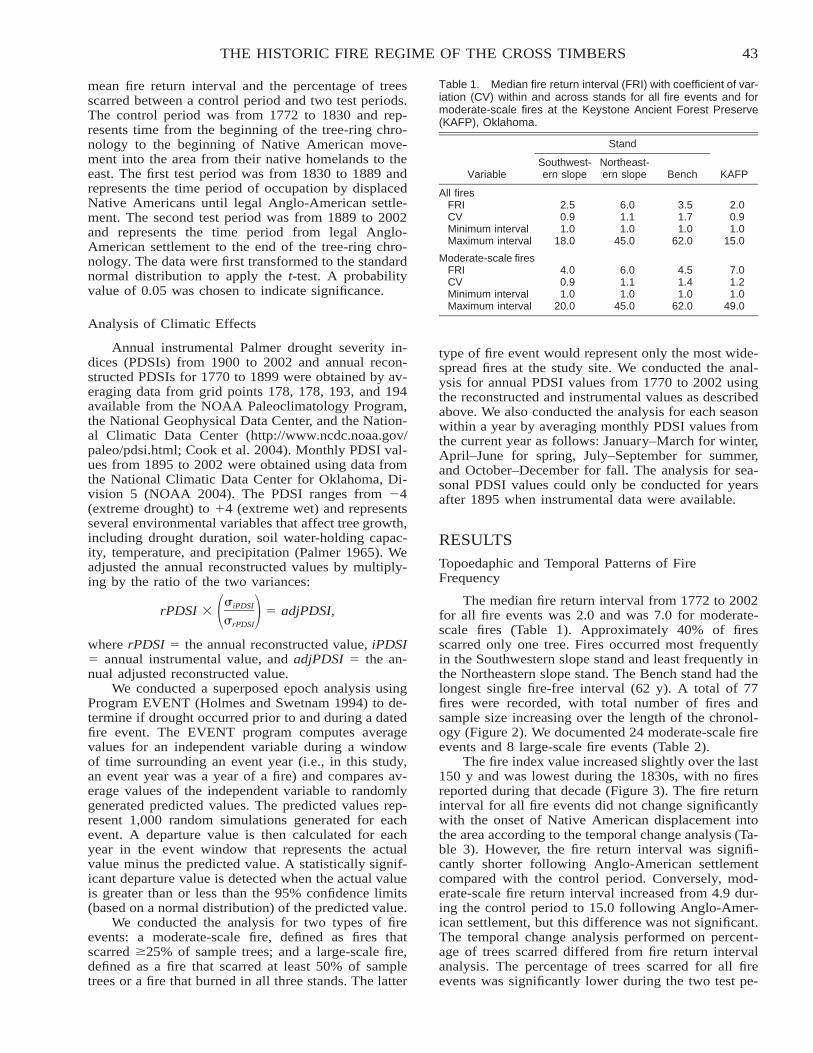
43THE HISTORIC FIRE REGIME OF THE CROSS TIMBERS
Table 1. Median fire return interval (FRI) with coefficient of var-iation (CV) within and across stands for all fire events and formoderate-scale fires at the Keystone Ancient Forest Preserve(KAFP), Oklahoma.
Variable
Stand
Southwest-ern slope
Northeast-ern slope Bench KAFP
All firesFRI 2.5 6.0 3.5 2.0CV 0.9 1.1 1.7 0.9Minimum interval 1.0 1.0 1.0 1.0Maximum interval 18.0 45.0 62.0 15.0
Moderate-scale firesFRI 4.0 6.0 4.5 7.0CV 0.9 1.1 1.4 1.2Minimum interval 1.0 1.0 1.0 1.0Maximum interval 20.0 45.0 62.0 49.0
mean fire return interval and the percentage of treesscarred between a control period and two test periods.The control period was from 1772 to 1830 and rep-resents time from the beginning of the tree-ring chro-nology to the beginning of Native American move-ment into the area from their native homelands to theeast. The first test period was from 1830 to 1889 andrepresents the time period of occupation by displacedNative Americans until legal Anglo-American settle-ment. The second test period was from 1889 to 2002and represents the time period from legal Anglo-American settlement to the end of the tree-ring chro-nology. The data were first transformed to the standardnormal distribution to apply the t-test. A probabilityvalue of 0.05 was chosen to indicate significance.
Analysis of Climatic Effects
Annual instrumental Palmer drought severity in-dices (PDSIs) from 1900 to 2002 and annual recon-structed PDSIs for 1770 to 1899 were obtained by av-eraging data from grid points 178, 178, 193, and 194available from the NOAA Paleoclimatology Program,the National Geophysical Data Center, and the Nation-al Climatic Data Center (http://www.ncdc.noaa.gov/paleo/pdsi.html; Cook et al. 2004). Monthly PDSI val-ues from 1895 to 2002 were obtained using data fromthe National Climatic Data Center for Oklahoma, Di-vision 5 (NOAA 2004). The PDSI ranges from �4(extreme drought) to �4 (extreme wet) and representsseveral environmental variables that affect tree growth,including drought duration, soil water-holding capac-ity, temperature, and precipitation (Palmer 1965). Weadjusted the annual reconstructed values by multiply-ing by the ratio of the two variances:
iPDSIrPDSI � � adjPDSI,� �rPDSI
where rPDSI � the annual reconstructed value, iPDSI� annual instrumental value, and adjPDSI � the an-nual adjusted reconstructed value.
We conducted a superposed epoch analysis usingProgram EVENT (Holmes and Swetnam 1994) to de-termine if drought occurred prior to and during a datedfire event. The EVENT program computes averagevalues for an independent variable during a windowof time surrounding an event year (i.e., in this study,an event year was a year of a fire) and compares av-erage values of the independent variable to randomlygenerated predicted values. The predicted values rep-resent 1,000 random simulations generated for eachevent. A departure value is then calculated for eachyear in the event window that represents the actualvalue minus the predicted value. A statistically signif-icant departure value is detected when the actual valueis greater than or less than the 95% confidence limits(based on a normal distribution) of the predicted value.
We conducted the analysis for two types of fireevents: a moderate-scale fire, defined as fires thatscarred �25% of sample trees; and a large-scale fire,defined as a fire that scarred at least 50% of sampletrees or a fire that burned in all three stands. The latter
type of fire event would represent only the most wide-spread fires at the study site. We conducted the anal-ysis for annual PDSI values from 1770 to 2002 usingthe reconstructed and instrumental values as describedabove. We also conducted the analysis for each seasonwithin a year by averaging monthly PDSI values fromthe current year as follows: January–March for winter,April–June for spring, July–September for summer,and October–December for fall. The analysis for sea-sonal PDSI values could only be conducted for yearsafter 1895 when instrumental data were available.
RESULTS
Topoedaphic and Temporal Patterns of FireFrequency
The median fire return interval from 1772 to 2002for all fire events was 2.0 and was 7.0 for moderate-scale fires (Table 1). Approximately 40% of firesscarred only one tree. Fires occurred most frequentlyin the Southwestern slope stand and least frequently inthe Northeastern slope stand. The Bench stand had thelongest single fire-free interval (62 y). A total of 77fires were recorded, with total number of fires andsample size increasing over the length of the chronol-ogy (Figure 2). We documented 24 moderate-scale fireevents and 8 large-scale fire events (Table 2).
The fire index value increased slightly over the last150 y and was lowest during the 1830s, with no firesreported during that decade (Figure 3). The fire returninterval for all fire events did not change significantlywith the onset of Native American displacement intothe area according to the temporal change analysis (Ta-ble 3). However, the fire return interval was signifi-cantly shorter following Anglo-American settlementcompared with the control period. Conversely, mod-erate-scale fire return interval increased from 4.9 dur-ing the control period to 15.0 following Anglo-Amer-ican settlement, but this difference was not significant.The temporal change analysis performed on percent-age of trees scarred differed from fire return intervalanalysis. The percentage of trees scarred for all fireevents was significantly lower during the two test pe-
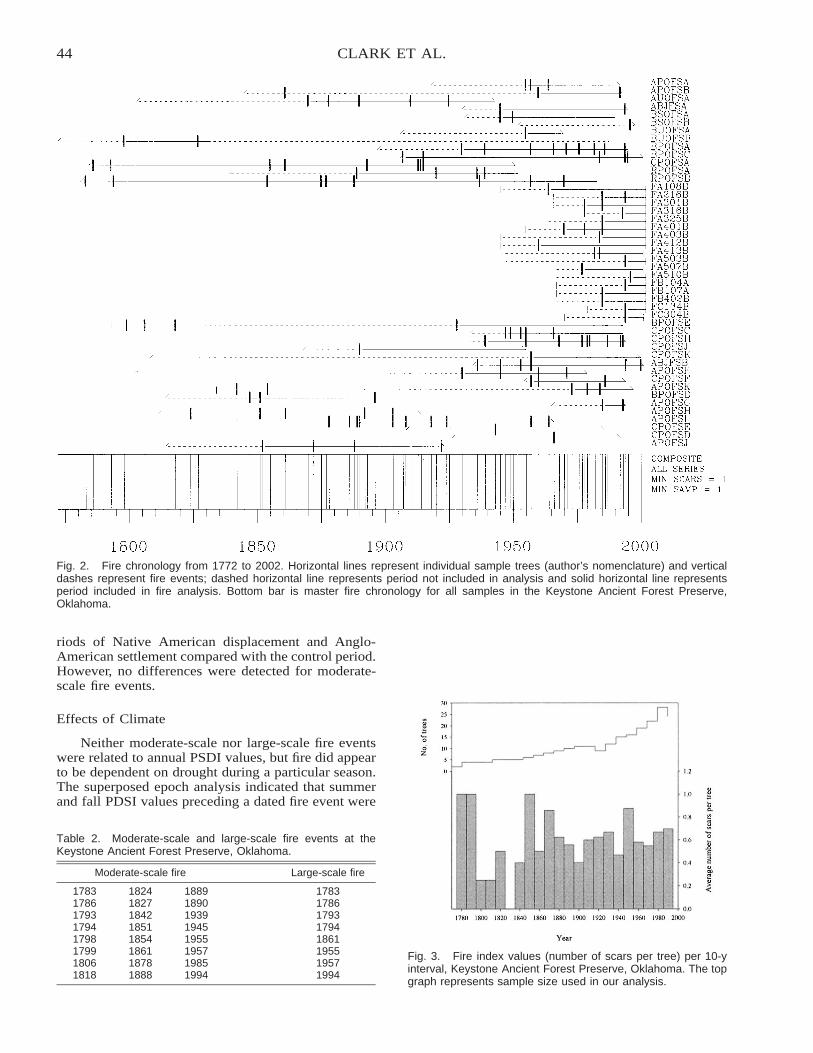
44 CLARK ET AL.
Fig. 2. Fire chronology from 1772 to 2002. Horizontal lines represent individual sample trees (author’s nomenclature) and verticaldashes represent fire events; dashed horizontal line represents period not included in analysis and solid horizontal line representsperiod included in fire analysis. Bottom bar is master fire chronology for all samples in the Keystone Ancient Forest Preserve,Oklahoma.
Table 2. Moderate-scale and large-scale fire events at theKeystone Ancient Forest Preserve, Oklahoma.
Moderate-scale fire Large-scale fire
17831786179317941798179918061818
18241827184218511854186118781888
18891890193919451955195719851994
17831786179317941861195519571994
Fig. 3. Fire index values (number of scars per tree) per 10-yinterval, Keystone Ancient Forest Preserve, Oklahoma. The topgraph represents sample size used in our analysis.
riods of Native American displacement and Anglo-American settlement compared with the control period.However, no differences were detected for moderate-scale fire events.
Effects of Climate
Neither moderate-scale nor large-scale fire eventswere related to annual PSDI values, but fire did appearto be dependent on drought during a particular season.The superposed epoch analysis indicated that summerand fall PDSI values preceding a dated fire event were
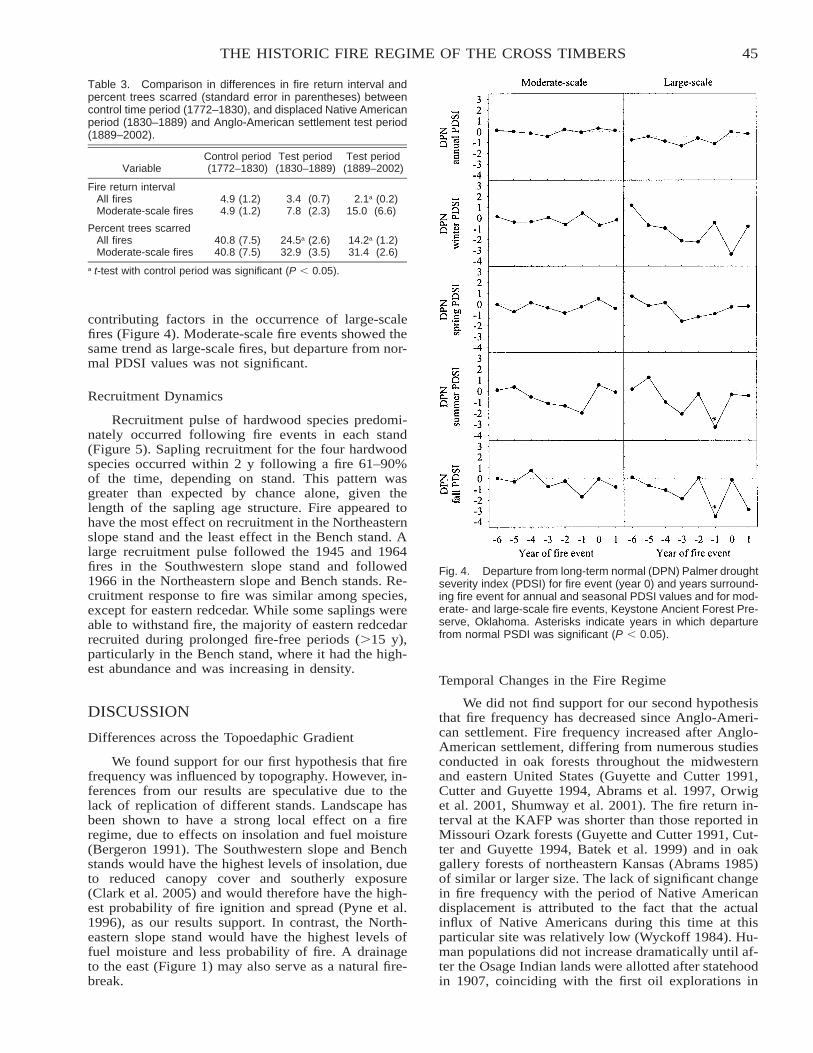
45THE HISTORIC FIRE REGIME OF THE CROSS TIMBERS
Table 3. Comparison in differences in fire return interval andpercent trees scarred (standard error in parentheses) betweencontrol time period (1772–1830), and displaced Native Americanperiod (1830–1889) and Anglo-American settlement test period(1889–2002).
VariableControl period(1772–1830)
Test period(1830–1889)
Test period(1889–2002)
Fire return intervalAll fires 4.9 (1.2) 3.4 (0.7) 2.1a (0.2)Moderate-scale fires 4.9 (1.2) 7.8 (2.3) 15.0 (6.6)
Percent trees scarredAll fires 40.8 (7.5) 24.5a (2.6) 14.2a (1.2)Moderate-scale fires 40.8 (7.5) 32.9 (3.5) 31.4 (2.6)
a t-test with control period was significant (P � 0.05).
Fig. 4. Departure from long-term normal (DPN) Palmer droughtseverity index (PDSI) for fire event (year 0) and years surround-ing fire event for annual and seasonal PDSI values and for mod-erate- and large-scale fire events, Keystone Ancient Forest Pre-serve, Oklahoma. Asterisks indicate years in which departurefrom normal PSDI was significant (P � 0.05).
contributing factors in the occurrence of large-scalefires (Figure 4). Moderate-scale fire events showed thesame trend as large-scale fires, but departure from nor-mal PDSI values was not significant.
Recruitment Dynamics
Recruitment pulse of hardwood species predomi-nately occurred following fire events in each stand(Figure 5). Sapling recruitment for the four hardwoodspecies occurred within 2 y following a fire 61–90%of the time, depending on stand. This pattern wasgreater than expected by chance alone, given thelength of the sapling age structure. Fire appeared tohave the most effect on recruitment in the Northeasternslope stand and the least effect in the Bench stand. Alarge recruitment pulse followed the 1945 and 1964fires in the Southwestern slope stand and followed1966 in the Northeastern slope and Bench stands. Re-cruitment response to fire was similar among species,except for eastern redcedar. While some saplings wereable to withstand fire, the majority of eastern redcedarrecruited during prolonged fire-free periods (�15 y),particularly in the Bench stand, where it had the high-est abundance and was increasing in density.
DISCUSSION
Differences across the Topoedaphic Gradient
We found support for our first hypothesis that firefrequency was influenced by topography. However, in-ferences from our results are speculative due to thelack of replication of different stands. Landscape hasbeen shown to have a strong local effect on a fireregime, due to effects on insolation and fuel moisture(Bergeron 1991). The Southwestern slope and Benchstands would have the highest levels of insolation, dueto reduced canopy cover and southerly exposure(Clark et al. 2005) and would therefore have the high-est probability of fire ignition and spread (Pyne et al.1996), as our results support. In contrast, the North-eastern slope stand would have the highest levels offuel moisture and less probability of fire. A drainageto the east (Figure 1) may also serve as a natural fire-break.
Temporal Changes in the Fire Regime
We did not find support for our second hypothesisthat fire frequency has decreased since Anglo-Ameri-can settlement. Fire frequency increased after Anglo-American settlement, differing from numerous studiesconducted in oak forests throughout the midwesternand eastern United States (Guyette and Cutter 1991,Cutter and Guyette 1994, Abrams et al. 1997, Orwiget al. 2001, Shumway et al. 2001). The fire return in-terval at the KAFP was shorter than those reported inMissouri Ozark forests (Guyette and Cutter 1991, Cut-ter and Guyette 1994, Batek et al. 1999) and in oakgallery forests of northeastern Kansas (Abrams 1985)of similar or larger size. The lack of significant changein fire frequency with the period of Native Americandisplacement is attributed to the fact that the actualinflux of Native Americans during this time at thisparticular site was relatively low (Wyckoff 1984). Hu-man populations did not increase dramatically until af-ter the Osage Indian lands were allotted after statehoodin 1907, coinciding with the first oil explorations in
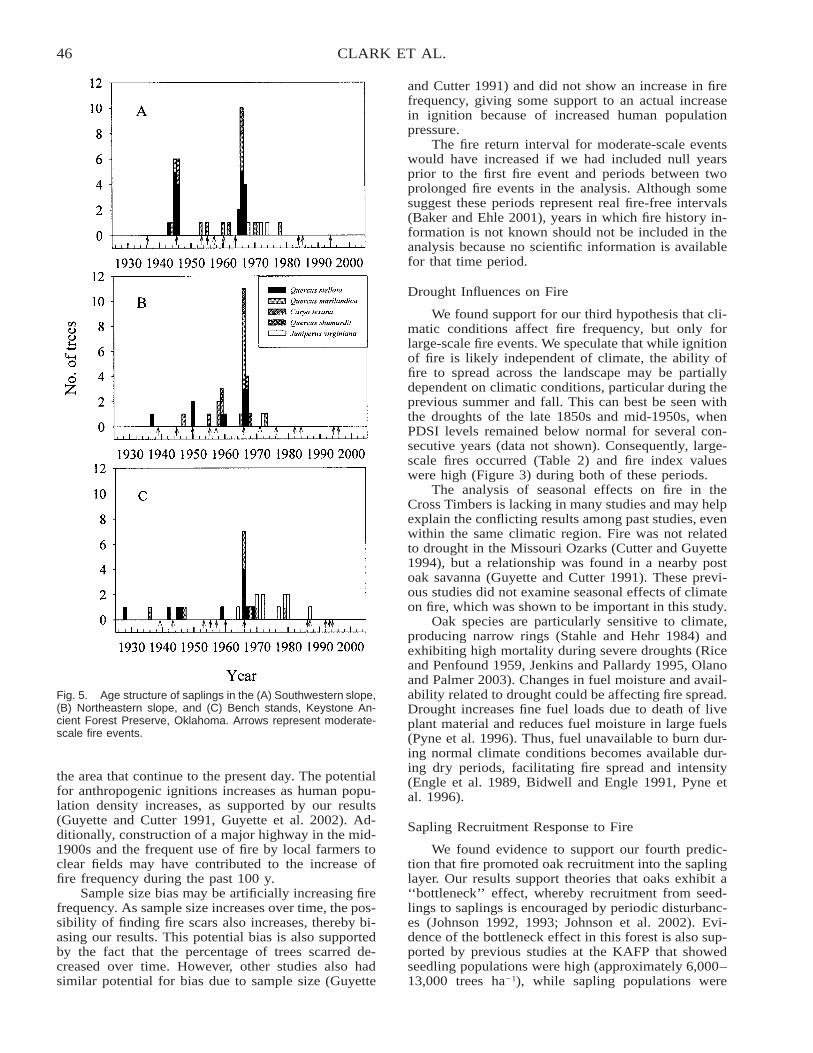
46 CLARK ET AL.
Fig. 5. Age structure of saplings in the (A) Southwestern slope,(B) Northeastern slope, and (C) Bench stands, Keystone An-cient Forest Preserve, Oklahoma. Arrows represent moderate-scale fire events.
the area that continue to the present day. The potentialfor anthropogenic ignitions increases as human popu-lation density increases, as supported by our results(Guyette and Cutter 1991, Guyette et al. 2002). Ad-ditionally, construction of a major highway in the mid-1900s and the frequent use of fire by local farmers toclear fields may have contributed to the increase offire frequency during the past 100 y.
Sample size bias may be artificially increasing firefrequency. As sample size increases over time, the pos-sibility of finding fire scars also increases, thereby bi-asing our results. This potential bias is also supportedby the fact that the percentage of trees scarred de-creased over time. However, other studies also hadsimilar potential for bias due to sample size (Guyette
and Cutter 1991) and did not show an increase in firefrequency, giving some support to an actual increasein ignition because of increased human populationpressure.
The fire return interval for moderate-scale eventswould have increased if we had included null yearsprior to the first fire event and periods between twoprolonged fire events in the analysis. Although somesuggest these periods represent real fire-free intervals(Baker and Ehle 2001), years in which fire history in-formation is not known should not be included in theanalysis because no scientific information is availablefor that time period.
Drought Influences on Fire
We found support for our third hypothesis that cli-matic conditions affect fire frequency, but only forlarge-scale fire events. We speculate that while ignitionof fire is likely independent of climate, the ability offire to spread across the landscape may be partiallydependent on climatic conditions, particular during theprevious summer and fall. This can best be seen withthe droughts of the late 1850s and mid-1950s, whenPDSI levels remained below normal for several con-secutive years (data not shown). Consequently, large-scale fires occurred (Table 2) and fire index valueswere high (Figure 3) during both of these periods.
The analysis of seasonal effects on fire in theCross Timbers is lacking in many studies and may helpexplain the conflicting results among past studies, evenwithin the same climatic region. Fire was not relatedto drought in the Missouri Ozarks (Cutter and Guyette1994), but a relationship was found in a nearby postoak savanna (Guyette and Cutter 1991). These previ-ous studies did not examine seasonal effects of climateon fire, which was shown to be important in this study.
Oak species are particularly sensitive to climate,producing narrow rings (Stahle and Hehr 1984) andexhibiting high mortality during severe droughts (Riceand Penfound 1959, Jenkins and Pallardy 1995, Olanoand Palmer 2003). Changes in fuel moisture and avail-ability related to drought could be affecting fire spread.Drought increases fine fuel loads due to death of liveplant material and reduces fuel moisture in large fuels(Pyne et al. 1996). Thus, fuel unavailable to burn dur-ing normal climate conditions becomes available dur-ing dry periods, facilitating fire spread and intensity(Engle et al. 1989, Bidwell and Engle 1991, Pyne etal. 1996).
Sapling Recruitment Response to Fire
We found evidence to support our fourth predic-tion that fire promoted oak recruitment into the saplinglayer. Our results support theories that oaks exhibit a‘‘bottleneck’’ effect, whereby recruitment from seed-lings to saplings is encouraged by periodic disturbanc-es (Johnson 1992, 1993; Johnson et al. 2002). Evi-dence of the bottleneck effect in this forest is also sup-ported by previous studies at the KAFP that showedseedling populations were high (approximately 6,000–13,000 trees ha�1), while sapling populations were
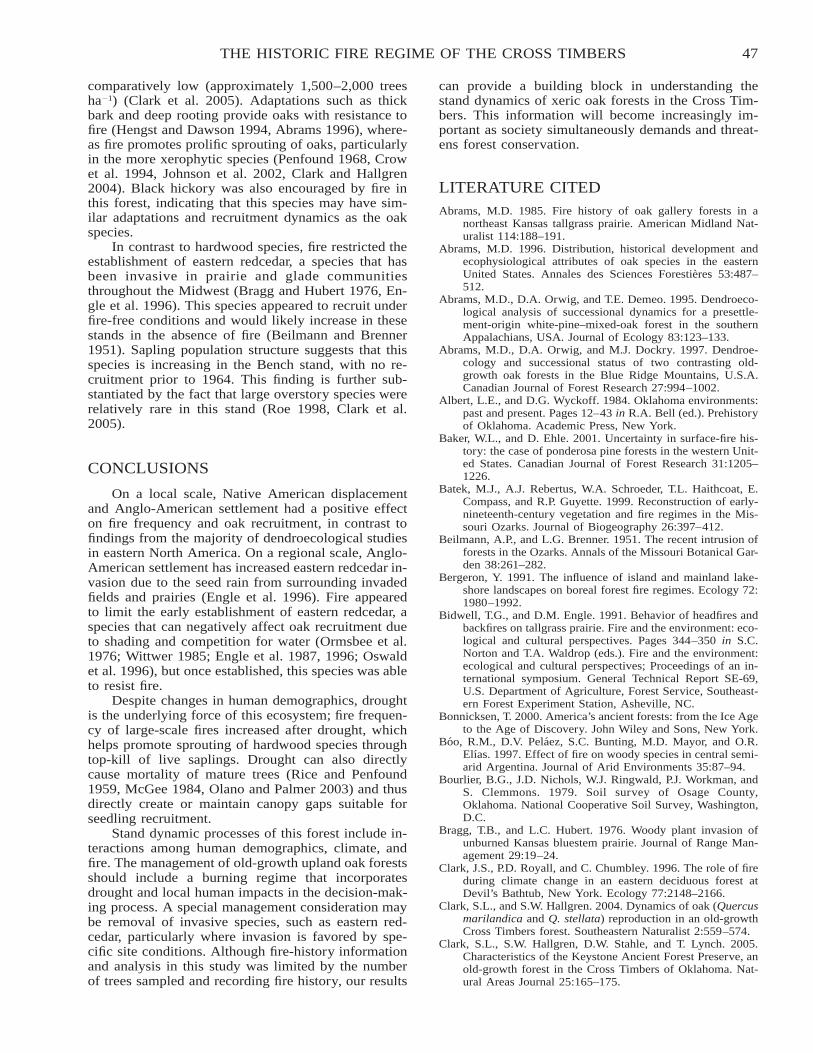
47THE HISTORIC FIRE REGIME OF THE CROSS TIMBERS
comparatively low (approximately 1,500–2,000 treesha�1) (Clark et al. 2005). Adaptations such as thickbark and deep rooting provide oaks with resistance tofire (Hengst and Dawson 1994, Abrams 1996), where-as fire promotes prolific sprouting of oaks, particularlyin the more xerophytic species (Penfound 1968, Crowet al. 1994, Johnson et al. 2002, Clark and Hallgren2004). Black hickory was also encouraged by fire inthis forest, indicating that this species may have sim-ilar adaptations and recruitment dynamics as the oakspecies.
In contrast to hardwood species, fire restricted theestablishment of eastern redcedar, a species that hasbeen invasive in prairie and glade communitiesthroughout the Midwest (Bragg and Hubert 1976, En-gle et al. 1996). This species appeared to recruit underfire-free conditions and would likely increase in thesestands in the absence of fire (Beilmann and Brenner1951). Sapling population structure suggests that thisspecies is increasing in the Bench stand, with no re-cruitment prior to 1964. This finding is further sub-stantiated by the fact that large overstory species wererelatively rare in this stand (Roe 1998, Clark et al.2005).
CONCLUSIONS
On a local scale, Native American displacementand Anglo-American settlement had a positive effecton fire frequency and oak recruitment, in contrast tofindings from the majority of dendroecological studiesin eastern North America. On a regional scale, Anglo-American settlement has increased eastern redcedar in-vasion due to the seed rain from surrounding invadedfields and prairies (Engle et al. 1996). Fire appearedto limit the early establishment of eastern redcedar, aspecies that can negatively affect oak recruitment dueto shading and competition for water (Ormsbee et al.1976; Wittwer 1985; Engle et al. 1987, 1996; Oswaldet al. 1996), but once established, this species was ableto resist fire.
Despite changes in human demographics, droughtis the underlying force of this ecosystem; fire frequen-cy of large-scale fires increased after drought, whichhelps promote sprouting of hardwood species throughtop-kill of live saplings. Drought can also directlycause mortality of mature trees (Rice and Penfound1959, McGee 1984, Olano and Palmer 2003) and thusdirectly create or maintain canopy gaps suitable forseedling recruitment.
Stand dynamic processes of this forest include in-teractions among human demographics, climate, andfire. The management of old-growth upland oak forestsshould include a burning regime that incorporatesdrought and local human impacts in the decision-mak-ing process. A special management consideration maybe removal of invasive species, such as eastern red-cedar, particularly where invasion is favored by spe-cific site conditions. Although fire-history informationand analysis in this study was limited by the numberof trees sampled and recording fire history, our results
can provide a building block in understanding thestand dynamics of xeric oak forests in the Cross Tim-bers. This information will become increasingly im-portant as society simultaneously demands and threat-ens forest conservation.
LITERATURE CITEDAbrams, M.D. 1985. Fire history of oak gallery forests in a
northeast Kansas tallgrass prairie. American Midland Nat-uralist 114:188–191.
Abrams, M.D. 1996. Distribution, historical development andecophysiological attributes of oak species in the easternUnited States. Annales des Sciences Forestieres 53:487–512.
Abrams, M.D., D.A. Orwig, and T.E. Demeo. 1995. Dendroeco-logical analysis of successional dynamics for a presettle-ment-origin white-pine–mixed-oak forest in the southernAppalachians, USA. Journal of Ecology 83:123–133.
Abrams, M.D., D.A. Orwig, and M.J. Dockry. 1997. Dendroe-cology and successional status of two contrasting old-growth oak forests in the Blue Ridge Mountains, U.S.A.Canadian Journal of Forest Research 27:994–1002.
Albert, L.E., and D.G. Wyckoff. 1984. Oklahoma environments:past and present. Pages 12–43 in R.A. Bell (ed.). Prehistoryof Oklahoma. Academic Press, New York.
Baker, W.L., and D. Ehle. 2001. Uncertainty in surface-fire his-tory: the case of ponderosa pine forests in the western Unit-ed States. Canadian Journal of Forest Research 31:1205–1226.
Batek, M.J., A.J. Rebertus, W.A. Schroeder, T.L. Haithcoat, E.Compass, and R.P. Guyette. 1999. Reconstruction of early-nineteenth-century vegetation and fire regimes in the Mis-souri Ozarks. Journal of Biogeography 26:397–412.
Beilmann, A.P., and L.G. Brenner. 1951. The recent intrusion offorests in the Ozarks. Annals of the Missouri Botanical Gar-den 38:261–282.
Bergeron, Y. 1991. The influence of island and mainland lake-shore landscapes on boreal forest fire regimes. Ecology 72:1980–1992.
Bidwell, T.G., and D.M. Engle. 1991. Behavior of headfires andbackfires on tallgrass prairie. Fire and the environment: eco-logical and cultural perspectives. Pages 344–350 in S.C.Norton and T.A. Waldrop (eds.). Fire and the environment:ecological and cultural perspectives; Proceedings of an in-ternational symposium. General Technical Report SE-69,U.S. Department of Agriculture, Forest Service, Southeast-ern Forest Experiment Station, Asheville, NC.
Bonnicksen, T. 2000. America’s ancient forests: from the Ice Ageto the Age of Discovery. John Wiley and Sons, New York.
Boo, R.M., D.V. Pelaez, S.C. Bunting, M.D. Mayor, and O.R.Elıas. 1997. Effect of fire on woody species in central semi-arid Argentina. Journal of Arid Environments 35:87–94.
Bourlier, B.G., J.D. Nichols, W.J. Ringwald, P.J. Workman, andS. Clemmons. 1979. Soil survey of Osage County,Oklahoma. National Cooperative Soil Survey, Washington,D.C.
Bragg, T.B., and L.C. Hubert. 1976. Woody plant invasion ofunburned Kansas bluestem prairie. Journal of Range Man-agement 29:19–24.
Clark, J.S., P.D. Royall, and C. Chumbley. 1996. The role of fireduring climate change in an eastern deciduous forest atDevil’s Bathtub, New York. Ecology 77:2148–2166.
Clark, S.L., and S.W. Hallgren. 2004. Dynamics of oak (Quercusmarilandica and Q. stellata) reproduction in an old-growthCross Timbers forest. Southeastern Naturalist 2:559–574.
Clark, S.L., S.W. Hallgren, D.W. Stahle, and T. Lynch. 2005.Characteristics of the Keystone Ancient Forest Preserve, anold-growth forest in the Cross Timbers of Oklahoma. Nat-ural Areas Journal 25:165–175.
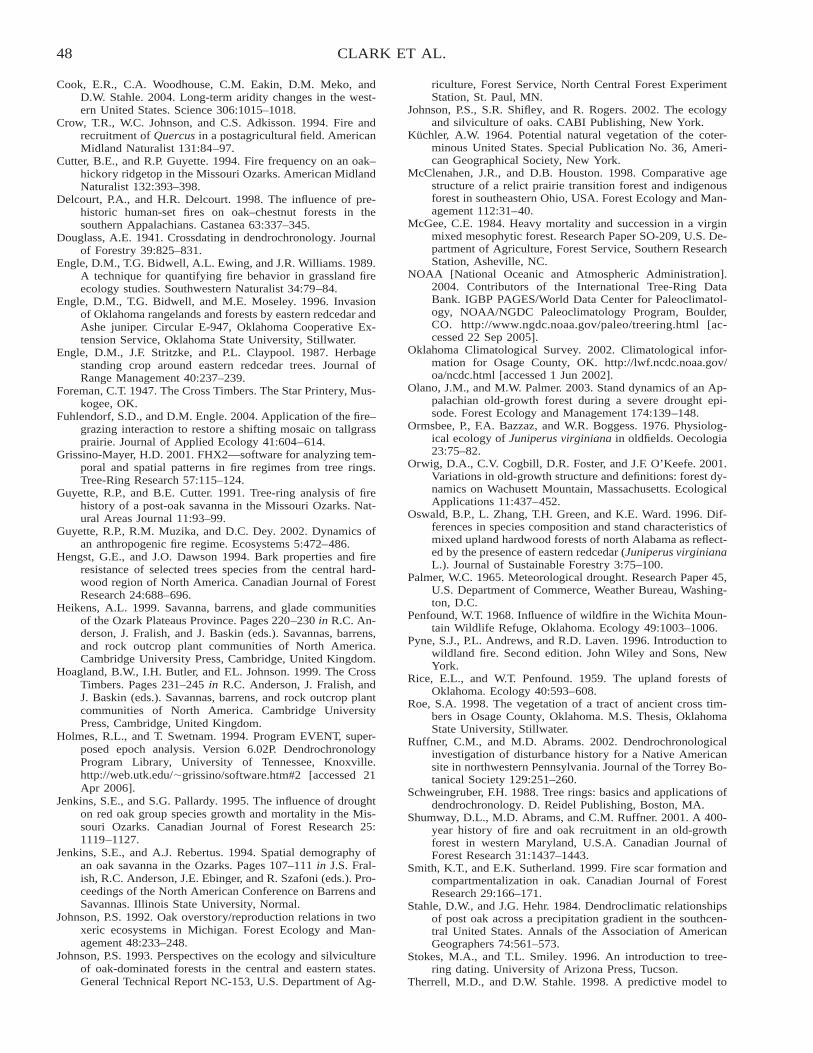
48 CLARK ET AL.
Cook, E.R., C.A. Woodhouse, C.M. Eakin, D.M. Meko, andD.W. Stahle. 2004. Long-term aridity changes in the west-ern United States. Science 306:1015–1018.
Crow, T.R., W.C. Johnson, and C.S. Adkisson. 1994. Fire andrecruitment of Quercus in a postagricultural field. AmericanMidland Naturalist 131:84–97.
Cutter, B.E., and R.P. Guyette. 1994. Fire frequency on an oak–hickory ridgetop in the Missouri Ozarks. American MidlandNaturalist 132:393–398.
Delcourt, P.A., and H.R. Delcourt. 1998. The influence of pre-historic human-set fires on oak–chestnut forests in thesouthern Appalachians. Castanea 63:337–345.
Douglass, A.E. 1941. Crossdating in dendrochronology. Journalof Forestry 39:825–831.
Engle, D.M., T.G. Bidwell, A.L. Ewing, and J.R. Williams. 1989.A technique for quantifying fire behavior in grassland fireecology studies. Southwestern Naturalist 34:79–84.
Engle, D.M., T.G. Bidwell, and M.E. Moseley. 1996. Invasionof Oklahoma rangelands and forests by eastern redcedar andAshe juniper. Circular E-947, Oklahoma Cooperative Ex-tension Service, Oklahoma State University, Stillwater.
Engle, D.M., J.F. Stritzke, and P.L. Claypool. 1987. Herbagestanding crop around eastern redcedar trees. Journal ofRange Management 40:237–239.
Foreman, C.T. 1947. The Cross Timbers. The Star Printery, Mus-kogee, OK.
Fuhlendorf, S.D., and D.M. Engle. 2004. Application of the fire–grazing interaction to restore a shifting mosaic on tallgrassprairie. Journal of Applied Ecology 41:604–614.
Grissino-Mayer, H.D. 2001. FHX2—software for analyzing tem-poral and spatial patterns in fire regimes from tree rings.Tree-Ring Research 57:115–124.
Guyette, R.P., and B.E. Cutter. 1991. Tree-ring analysis of firehistory of a post-oak savanna in the Missouri Ozarks. Nat-ural Areas Journal 11:93–99.
Guyette, R.P., R.M. Muzika, and D.C. Dey. 2002. Dynamics ofan anthropogenic fire regime. Ecosystems 5:472–486.
Hengst, G.E., and J.O. Dawson 1994. Bark properties and fireresistance of selected trees species from the central hard-wood region of North America. Canadian Journal of ForestResearch 24:688–696.
Heikens, A.L. 1999. Savanna, barrens, and glade communitiesof the Ozark Plateaus Province. Pages 220–230 in R.C. An-derson, J. Fralish, and J. Baskin (eds.). Savannas, barrens,and rock outcrop plant communities of North America.Cambridge University Press, Cambridge, United Kingdom.
Hoagland, B.W., I.H. Butler, and F.L. Johnson. 1999. The CrossTimbers. Pages 231–245 in R.C. Anderson, J. Fralish, andJ. Baskin (eds.). Savannas, barrens, and rock outcrop plantcommunities of North America. Cambridge UniversityPress, Cambridge, United Kingdom.
Holmes, R.L., and T. Swetnam. 1994. Program EVENT, super-posed epoch analysis. Version 6.02P. DendrochronologyProgram Library, University of Tennessee, Knoxville.http://web.utk.edu/grissino/software.htm#2 [accessed 21Apr 2006].
Jenkins, S.E., and S.G. Pallardy. 1995. The influence of droughton red oak group species growth and mortality in the Mis-souri Ozarks. Canadian Journal of Forest Research 25:1119–1127.
Jenkins, S.E., and A.J. Rebertus. 1994. Spatial demography ofan oak savanna in the Ozarks. Pages 107–111 in J.S. Fral-ish, R.C. Anderson, J.E. Ebinger, and R. Szafoni (eds.). Pro-ceedings of the North American Conference on Barrens andSavannas. Illinois State University, Normal.
Johnson, P.S. 1992. Oak overstory/reproduction relations in twoxeric ecosystems in Michigan. Forest Ecology and Man-agement 48:233–248.
Johnson, P.S. 1993. Perspectives on the ecology and silvicultureof oak-dominated forests in the central and eastern states.General Technical Report NC-153, U.S. Department of Ag-
riculture, Forest Service, North Central Forest ExperimentStation, St. Paul, MN.
Johnson, P.S., S.R. Shifley, and R. Rogers. 2002. The ecologyand silviculture of oaks. CABI Publishing, New York.
Kuchler, A.W. 1964. Potential natural vegetation of the coter-minous United States. Special Publication No. 36, Ameri-can Geographical Society, New York.
McClenahen, J.R., and D.B. Houston. 1998. Comparative agestructure of a relict prairie transition forest and indigenousforest in southeastern Ohio, USA. Forest Ecology and Man-agement 112:31–40.
McGee, C.E. 1984. Heavy mortality and succession in a virginmixed mesophytic forest. Research Paper SO-209, U.S. De-partment of Agriculture, Forest Service, Southern ResearchStation, Asheville, NC.
NOAA [National Oceanic and Atmospheric Administration].2004. Contributors of the International Tree-Ring DataBank. IGBP PAGES/World Data Center for Paleoclimatol-ogy, NOAA/NGDC Paleoclimatology Program, Boulder,CO. http://www.ngdc.noaa.gov/paleo/treering.html [ac-cessed 22 Sep 2005].
Oklahoma Climatological Survey. 2002. Climatological infor-mation for Osage County, OK. http://lwf.ncdc.noaa.gov/oa/ncdc.html [accessed 1 Jun 2002].
Olano, J.M., and M.W. Palmer. 2003. Stand dynamics of an Ap-palachian old-growth forest during a severe drought epi-sode. Forest Ecology and Management 174:139–148.
Ormsbee, P., F.A. Bazzaz, and W.R. Boggess. 1976. Physiolog-ical ecology of Juniperus virginiana in oldfields. Oecologia23:75–82.
Orwig, D.A., C.V. Cogbill, D.R. Foster, and J.F. O’Keefe. 2001.Variations in old-growth structure and definitions: forest dy-namics on Wachusett Mountain, Massachusetts. EcologicalApplications 11:437–452.
Oswald, B.P., L. Zhang, T.H. Green, and K.E. Ward. 1996. Dif-ferences in species composition and stand characteristics ofmixed upland hardwood forests of north Alabama as reflect-ed by the presence of eastern redcedar (Juniperus virginianaL.). Journal of Sustainable Forestry 3:75–100.
Palmer, W.C. 1965. Meteorological drought. Research Paper 45,U.S. Department of Commerce, Weather Bureau, Washing-ton, D.C.
Penfound, W.T. 1968. Influence of wildfire in the Wichita Moun-tain Wildlife Refuge, Oklahoma. Ecology 49:1003–1006.
Pyne, S.J., P.L. Andrews, and R.D. Laven. 1996. Introduction towildland fire. Second edition. John Wiley and Sons, NewYork.
Rice, E.L., and W.T. Penfound. 1959. The upland forests ofOklahoma. Ecology 40:593–608.
Roe, S.A. 1998. The vegetation of a tract of ancient cross tim-bers in Osage County, Oklahoma. M.S. Thesis, OklahomaState University, Stillwater.
Ruffner, C.M., and M.D. Abrams. 2002. Dendrochronologicalinvestigation of disturbance history for a Native Americansite in northwestern Pennsylvania. Journal of the Torrey Bo-tanical Society 129:251–260.
Schweingruber, F.H. 1988. Tree rings: basics and applications ofdendrochronology. D. Reidel Publishing, Boston, MA.
Shumway, D.L., M.D. Abrams, and C.M. Ruffner. 2001. A 400-year history of fire and oak recruitment in an old-growthforest in western Maryland, U.S.A. Canadian Journal ofForest Research 31:1437–1443.
Smith, K.T., and E.K. Sutherland. 1999. Fire scar formation andcompartmentalization in oak. Canadian Journal of ForestResearch 29:166–171.
Stahle, D.W., and J.G. Hehr. 1984. Dendroclimatic relationshipsof post oak across a precipitation gradient in the southcen-tral United States. Annals of the Association of AmericanGeographers 74:561–573.
Stokes, M.A., and T.L. Smiley. 1996. An introduction to tree-ring dating. University of Arizona Press, Tucson.
Therrell, M.D., and D.W. Stahle. 1998. A predictive model to

49THE HISTORIC FIRE REGIME OF THE CROSS TIMBERS
locate ancient forests in the Cross Timbers of Osage Coun-ty, Oklahoma. Journal of Biogeography 25:847–854.
Villalba, R., and T.T. Veblen. 1997. Regional patterns of treepopulation age structures in northern Patagonia: climaticand disturbance influences. Journal of Ecology 85:113–124.
Wittwer, R.F. 1985. Biology of eastern red cedar. Pages 9–16 inR.E. Witter and D.M. Engle (eds.). Eastern red cedar in
Oklahoma. Publication E-849, Cooperative Extension Ser-vice, Oklahoma State University, Stillwater.
Wyckoff, D.G. 1984. The Cross Timbers: an ecotone in historicperspective. Pages 1–20 in P.L. Kawecki and D.G. Wyckoff(eds.). Contributions to the Cross Timbers prehistory.Oklahoma Archeological Survey No. 12, University ofOklahoma, Norman.
50
LANDSCAPE CHARACTERISTICS OF SAGEBRUSH-STEPPE/JUNIPER WOODLAND MOSAICS UNDER VARIOUS
MODELED PRESCRIBED FIRE REGIMES
Stephen C. Bunting,1 Eva K. Strand, and James L. KingeryUniversity of Idaho, Department of Rangeland Ecology and Management, College of Natural Resources, Moscow, ID83844, USA
ABSTRACT
Juniper (Juniperus spp.) encroachment into adjacent vegetation has been identified as an ecological and management issue for juniperwoodlands. This encroachment has resulted in numerous site- and landscape-level ecosystem changes, such as reduced herbaceousbiomass production, altered watershed characteristics, reduced site and landscape diversity, and increased soil erosion. The cause ofthe encroachment includes direct and indirect fire suppression, livestock grazing, and climatic change. Regardless of cause, the use ofprescribed fire has been proposed in many ecosystems as a management technique to address juniper encroachment. The effects ofprescribed burning programs on the characteristics of juniper woodland–dominated landscapes and their ability to meet long-termecological and management objectives have not previously been assessed.
Three 6th-order watersheds were selected on the Owyhee Plateau, Idaho, because of the availability of prescribed fire effects dataand other supporting data. The watersheds were classified into potential vegetation types and the area of each was classified intocurrent successional stages utilizing Landsat 7 Enhanced Thematic Mapper (ETM�) and digital elevation model data. Landscapedynamics under four different prescribed fire regimes were modeled for each watershed with the Tool for Exploratory LandscapeScenario Analyses (TELSA). The fire regimes studied were prescribed burning levels affecting 0, 2, 5, and 7% of each watershed’sarea per decade. Ten simulations of the predicted landscape composition for each watershed under each fire regime were analyzedusing FRAGSTATS.
Our results suggest that encroachment of western juniper (J. occidentalis ssp. occidentalis) is likely to continue into the future ifno fire or even limited prescribed burning were implemented. Continued encroachment of western juniper is predicted to result indecreased landscape diversity. While the overall mean patch size within the landscapes decreased, mean patch size of juniper-dominatedpatches increased. This increase, together with decreases in Simpson’s evenness indices, indicate a continued successional trajectoryof simplification of watershed composition. Prescribed fire can be utilized to maintain landscape diversity or at least minimize the lossof diversity. Fire occurrence on at least 5% of the watersheds per decade will be required to maintain sagebrush-steppe vegetation atcurrent levels.
keywords: FRAGSTATS, Idaho, Juniperus occidentalis, landscape diversity, landscape model, successional model, TELSA, westernjuniper.
Citation: Bunting, S.C., E.K. Strand, and J.L. Kingery. 2007. Landscape characteristics of sagebrush-steppe/juniper woodland mosaicsunder various modeled prescribed fire regimes. Pages 50–57 in R.E. Masters and K.E.M. Galley (eds.). Proceedings of the 23rd TallTimbers Fire Ecology Conference: Fire in Grassland and Shrubland Ecosystems. Tall Timbers Research Station, Tallahassee, Florida,USA.
INTRODUCTION
Western juniper (Juniperus occidentalis) wood-lands dominate approximately 3.6 million ha in thenorthwestern portion of the Great Basin and southernColumbia Basin (Miller et al. 2005). Western juniperhas been classified into two subspecies: J. occidentalisssp. australis, which occurs in the Sierra Mountains ofCalifornia; and J. occidentalis ssp. occidentalis, whichoccurs in extreme northern California, eastern Oregon,and southwestern Idaho (Vasek 1966, Burkhardt andTisdale 1969). Western juniper–dominated areas areconsidered to be the northwestern equivalent of theIntermountain pinyon–juniper zone (West 1999) but donot have an associated codominant pine (Pinus spp.).Widespread encroachment of western juniper appearsto have accelerated during the last 150 y (Burkhardtand Tisdale 1969, 1976; Miller and Rose 1994; Miller
1 Corresponding author ([email protected]).
and Wigand 1994; Miller et al. 2005), which coincideswith the period of Euro-American settlement and de-velopment of western North America. Research onage-class distributions of western juniper stands indi-cates that recent expansion began during the periodbetween 1860 and 1880 (Burkhardt and Tisdale 1969,Miller and Rose 1994), slowed during the 1930s and1940s, and since 1960 has been progressing at an ex-ponential rate (Miller and Rose 1994). The area cur-rently dominated by western juniper in southwesternIdaho has more than doubled since 1960 (Burkhardtand Tisdale 1969).
During the pre–Euro-American settlement period,western juniper is thought to have primarily occurredas dense stands on the more dissected topography orto have occurred as open, savanna-like woodlands oncanyon slopes and more regular topography (Burk-hardt and Tisdale 1969, 1976; O’Rourke and Ogden1969; Vasek and Thorne 1977; Miller and Rose 1994;Miller and Wigand 1994). Western juniper has pri-
51JUNIPER WOODLAND/SAGEBRUSH-STEPPE LANDSCAPE DYNAMICS
marily encroached into many adjacent vegetationtypes, but the encroachment has been most dramaticin vegetation types with deeper soils (Young andEvans 1981, Eddleman 1987, Miller and Wigand 1994,Miller et al. 1995). These sites include those domi-nated by mountain big sagebrush (Artemisia tridentatassp. vaseyana) steppe, aspen (Populus tremuloides)woodlands, and Idaho fescue (Festuca idahoensis)/bluebunch wheatgrass (Pseudoroegneria spicata)steppe. Encroachment has also occurred into low sage-brush (Artemisia arbuscula) steppe; however, the ratehas been much lower due to less productive site con-ditions (Miller et al. 2005).
Causes for encroachment of western juniper arethought to be similar to those of juniper woodlands ingeneral (Bunting 1993, Miller and Wigand 1994). Re-search has shown that changes in plant competition areprobably not a factor in western juniper encroachmentbecause plant composition did not affect rate of estab-lishment (Burkhardt and Tisdale 1976, Eddleman1987, Miller and Rose 1994). However, heavy utili-zation of rangelands by livestock could facilitate ju-niper establishment through secondary effects. The re-sulting reduction in fine fuel loads due to high forageutilization would decrease fire occurrence (Bunting1993, Miller et al. 1995) and increase sagebrush seed-ling establishment (Ellison 1960, Tisdale 1969). In-creased sagebrush density provides greater availabilityof safe sites for juniper seedling establishment (Burk-hardt and Tisdale 1976, Eddleman 1987, Miller andRose 1994, Miller et al. 1995). Miller et al. (2005)found that pre–Euro-American period fire-free inter-vals (FFI) in western juniper varied depending on localconditions but was usually less than 20 y for wood-lands associated with mountain big sagebrush steppe.Young and Evans (1981) estimated, based on thegrowth rate of young western juniper seedlings, that afire every 50 y or less would prevent their encroach-ment in northern California. The encroachment of ju-niper usually reduces the herbaceous production on thesite (Tausch and Tueller 1990) and thereby greatly re-duces fire potential (Bunting 1987, Everett 1987).Wildfires may burn only under the most severe weath-er conditions in dense stands of mature juniper.
Western juniper encroachment into sagebrushsteppe or grassland communities decreases herbaceousand shrub biomass production (Vaitkus and Eddleman1991, Bunting 1993, Miller and Wigand 1994, Milleret al. 1995). A reduction of plant species richness andspecies diversity has been documented for western ju-niper and other Great Basin juniper woodlands (Black-burn and Tueller 1970, West et al. 1979, Koniak andEverett 1982, Miller et al. 2000). Bunting et al. (1999)did not find a decrease in species richness. However,species diversity declined due to changes in speciesequitability of canopy coverage. Sites were increasing-ly dominated by a single species, western juniper, withassociated declines in the canopy coverage of otherspecies.
Studies have shown that fire occurrence can beeffective in maintaining early seral vegetation com-munities associated with juniper woodlands (Miller et
al. 2005). However, little information exists on the pro-portion of fire on the landscape required to stabilizecomposition or the effects of fires on landscape char-acteristics. Our study was designed to address thesequestions for the Owyhee Plateau in southwestern Ida-ho. We hypothesized that at some level of fire occur-rence within the landscape, the current characteristics(i.e., proportions of cover types and landscape metrics)of the watersheds could be maintained into the future.
STUDY AREA
The Upper Owyhee River basin is located withinthe southern portion of the Owyhee Plateau in south-western Idaho (lat 42�30�N, long 116�50�W) and wasselected for this study because of the abundance ofwestern juniper–dominated vegetation and availabilityof auxiliary data. Western juniper forms a noncontin-uous woodland zone between 1,450 and 2,100 m inelevation within the Owyhee Plateau. The cool, semi-arid climate is characteristic of the northern Great Ba-sin, with precipitation varying from 25 to 50 cm.Three 6th-order hydrologic code (HUC6) watersheds,ranging in area from 6,380 to 6,910 ha, were chosenthat had western juniper vegetation on at least 60% ofthe watersheds’ area with a variety of successionalstages present. The selected areas include Red CanyonCreek, Smith Creek, and Currant Creek watersheds.Currently, wildfires rarely occur and are suppressed.Prescribed fire has not been commonly applied in thesewatersheds during the past decade.
METHODS
The potential vegetation type (PVT) classificationutilized was developed from a modified classificationof the Interior Columbia Basin Ecosystem Manage-ment Project (ICBEMP) midscale analysis (Quigley etal. 1996, USDA 1996). PVTs are defined as groupingsof habitat types that have similar overstory composi-tion, structure, and environmental requirements, andconsequently are broader than habitat types developedfor the Columbia Basin. The ICBEMP classification ofthe watersheds was modified because, for example,many sites that currently supported juniper were notclassified as a juniper PVT. We reclassified those areasmisclassified to the appropriate PVT taxonomic unit.
Two PVTs of primary interest for this study weredefined for the three watersheds: western juniper/mountain big sagebrush and western juniper/low sage-brush woodland. In addition, the following PVTs thatcovered a smaller portion of the watersheds were de-fined in order to create a continuous vegetation layerfor the watersheds: western juniper–curl-leaf mountainmahogany (Cercocarpus ledifolius) woodland, westernjuniper woodland/rock, aspen woodland, broadleaf ri-parian woodland, mountain shrubland, low sagebrushsteppe, and meadow.
A successional stage classification was developedfor each PVT. The classifications were developed bymodifying those previously described by Quigley et
52 BUNTING ET AL.
Table 1. Successional stage descriptions of the three most prevalent potential vegetation types found within three watersheds in theOwyhee Plateau, Idaho.
Successional stage
Potential vegetation type
Western juniper/mountain big sagebrush Western juniper/low sagebrush
Herbland Shrub cover �5%, herbaceous cover �67% Shrub cover �5%, herbaceous cover �67%Shrubland Canopy of low (�50-cm) and/or medium 50- to
200-cm shrubs with a canopy coverage�67%, tree coverage �2%
Canopy of low (�50-cm) shrubs with a canopycoverage �67%, tree coverage �2%. Some-times very open stands of large mature juni-per trees are present.
Woodland initiation (Phase 1) Canopy (�5%) of usually young, sometimesmid-aged junipers present. Juniper is havingonly minor effects on competition and environ-ment of the site, and the sagebrush communi-ty is intact except directly under juniper trees.
Juniper canopy (�3%) of usually young, some-times mid-aged junipers present. Juniper ishaving minor effects on competition and envi-ronment of the site, and the sagebrush com-munity is intact except directly under junipertrees.
Open young woodland (Phase 2) Canopy (5–10%) of young and mid-aged juni-pers present. Juniper beginning to have an ef-fect on the environment of the site. Sage-brush-steppe species declining and sagebrushskeletons often present.
Canopy (3–8%) of young and mid-aged juniperspresent. Juniper beginning to have an effecton the plant interspace environment of thesite. Sagebrush-steppe species declining andsagebrush skeletons present. However, lowsagebrush still common in interspaces.
Young multistory woodland (Phase 3) Canopy (�10%) of young and mid-aged juni-pers present. Few or no mature junipers pres-ent. Sagebrush skeletons often numerous inunderstory.
Canopy (�8%) of young and mid-aged juniperspresent. Usually a few mature junipers pres-ent. Sagebrush skeletons often present in un-derstory. However, low sagebrush still com-mon in interspaces.
Mature woodland Overstory canopy �15%, composed of primarilymature individuals (flat-topped trees and wolflichen [Letharia vulpina] usually present). Fewsagebrush remain except in larger openings.Some stands are completely dominated byold mature trees. Other stands may haveopen canopy of mature trees and a codomi-nant layer of various aged mid-aged junipers.
Overstory canopy �8%, composed of primarilymature individuals (flat-topped trees and wolflichen usually present). Trees may not neces-sarily be large sized. Sagebrush usually pres-ent in openings except in the denser standsof juniper.
al. (1996). For those areas supporting western juniper/mountain big sagebrush and western juniper/low sage-brush woodland PVTs, successional stages identifiedincluded herbland, shrubland, and initiation, openyoung, young multistory, and mature woodlands with0, �2, �5, 5–10, �10, and �15% western juniper can-opy coverage, respectively (Table 1). Stand initiation,open young, and young multistory woodlands corre-spond to the Phase 1, Phase 2, and Phase 3 succes-sional stages, respectively, as described by Miller etal. (2005).
Landsat Classification Procedures
The land cover PVT/structural stage map was pro-duced through a supervised classification (Roth 2004)of a Landsat 7 ETM� image from 2 August 2002.Image preprocessing steps included radiometric cor-rection and georeferencing to U.S. Geological Surveyorthophotos. The classification of the Landsat spectralbands was complemented by the use of topographicvariables, elevation and slope, and a solar radiationvariable. The solar radiation variable was derived fromthe 30-m digital elevation model through processingin the Solar Analyst software (HEMI Solar Analyst1999–2000). The image was classified into succes-sional stages of each PVT using a supervised non-parametric nearest neighbor discriminant analysismethod (SAS 8.02; SAS Institute, Cary, NC). Theoverall accuracy of the land cover classification was72%. Post-processing steps included smoothing of the
image through filtering in ArcInfo (ESRI, Redlands,CA) and conversion of the raster image to polygons.
A total of �740 ground control points were col-lected in the watersheds in 1999–2003. Approximately50% of the points were used as training points for theclassification of satellite imagery, and the remainingpoints were reserved for accuracy assessment. ThePVT and successional stage was recorded for eachpoint. Location of ground reference points were re-corded using Magellan (Santa Clara, CA) Global Po-sitioning System units with an estimated maximumspatial error of 15 m. Large (�2 ha) homogeneousareas were selected for the ground control to ensurethat the control area was larger than the minimummapping unit and that the effects of the GPS spatialerror would be minimized. Each ground control pointwas in the center of homogeneous vegetation with aminimum radius of 100 m.
Succession modeling is critical in order to predictbroadscale long-term landscape trends (Jensen andBourgeron 1993, Kaufmann et al. 1994). The Tool forExploratory Landscape Scenario Analyses (TELSA;Version 3.3), a spatially explicit, deterministic succes-sion modeling tool with stochastic properties, was uti-lized to predict future landscape compositions thatwould result from variety of fire management strate-gies (Kurz et al. 2000a,b; http://www.essa.com/downloads/telsa/index.htm). Changes in future land-scape composition given different land managementstrategies were modeled using TELSA (Klenner et al.
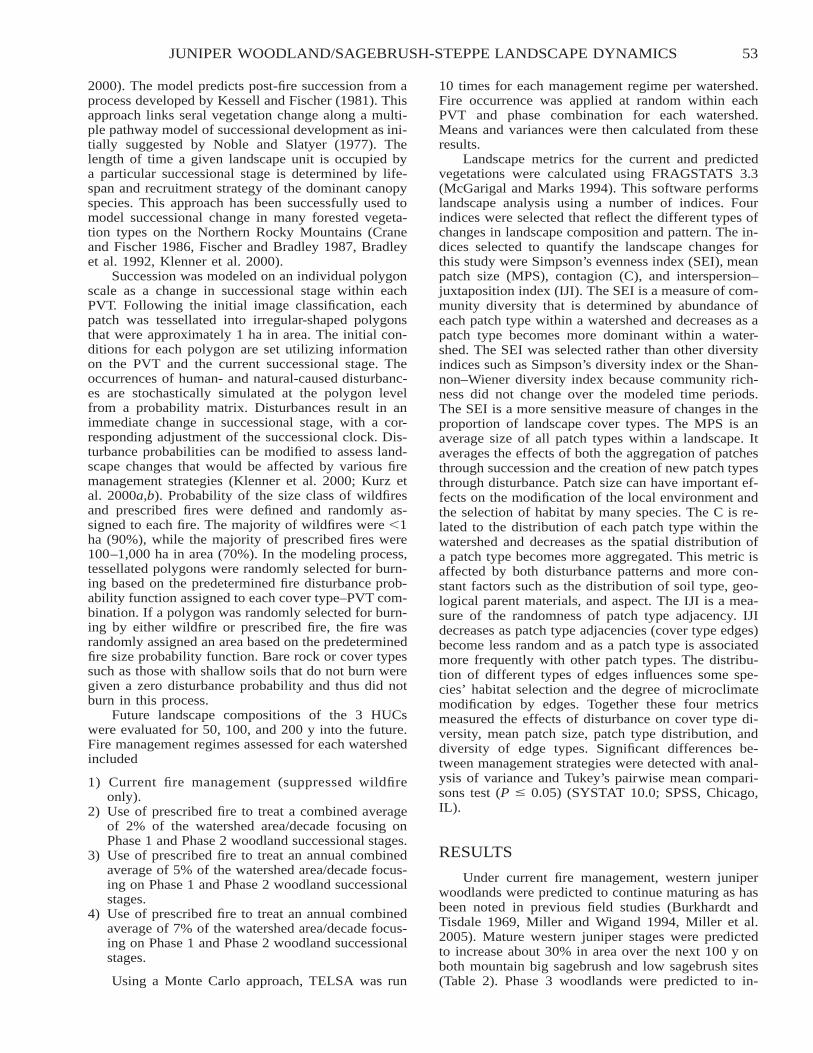
53JUNIPER WOODLAND/SAGEBRUSH-STEPPE LANDSCAPE DYNAMICS
2000). The model predicts post-fire succession from aprocess developed by Kessell and Fischer (1981). Thisapproach links seral vegetation change along a multi-ple pathway model of successional development as ini-tially suggested by Noble and Slatyer (1977). Thelength of time a given landscape unit is occupied bya particular successional stage is determined by life-span and recruitment strategy of the dominant canopyspecies. This approach has been successfully used tomodel successional change in many forested vegeta-tion types on the Northern Rocky Mountains (Craneand Fischer 1986, Fischer and Bradley 1987, Bradleyet al. 1992, Klenner et al. 2000).
Succession was modeled on an individual polygonscale as a change in successional stage within eachPVT. Following the initial image classification, eachpatch was tessellated into irregular-shaped polygonsthat were approximately 1 ha in area. The initial con-ditions for each polygon are set utilizing informationon the PVT and the current successional stage. Theoccurrences of human- and natural-caused disturbanc-es are stochastically simulated at the polygon levelfrom a probability matrix. Disturbances result in animmediate change in successional stage, with a cor-responding adjustment of the successional clock. Dis-turbance probabilities can be modified to assess land-scape changes that would be affected by various firemanagement strategies (Klenner et al. 2000; Kurz etal. 2000a,b). Probability of the size class of wildfiresand prescribed fires were defined and randomly as-signed to each fire. The majority of wildfires were �1ha (90%), while the majority of prescribed fires were100–1,000 ha in area (70%). In the modeling process,tessellated polygons were randomly selected for burn-ing based on the predetermined fire disturbance prob-ability function assigned to each cover type–PVT com-bination. If a polygon was randomly selected for burn-ing by either wildfire or prescribed fire, the fire wasrandomly assigned an area based on the predeterminedfire size probability function. Bare rock or cover typessuch as those with shallow soils that do not burn weregiven a zero disturbance probability and thus did notburn in this process.
Future landscape compositions of the 3 HUCswere evaluated for 50, 100, and 200 y into the future.Fire management regimes assessed for each watershedincluded
1) Current fire management (suppressed wildfireonly).
2) Use of prescribed fire to treat a combined averageof 2% of the watershed area/decade focusing onPhase 1 and Phase 2 woodland successional stages.
3) Use of prescribed fire to treat an annual combinedaverage of 5% of the watershed area/decade focus-ing on Phase 1 and Phase 2 woodland successionalstages.
4) Use of prescribed fire to treat an annual combinedaverage of 7% of the watershed area/decade focus-ing on Phase 1 and Phase 2 woodland successionalstages.
Using a Monte Carlo approach, TELSA was run
10 times for each management regime per watershed.Fire occurrence was applied at random within eachPVT and phase combination for each watershed.Means and variances were then calculated from theseresults.
Landscape metrics for the current and predictedvegetations were calculated using FRAGSTATS 3.3(McGarigal and Marks 1994). This software performslandscape analysis using a number of indices. Fourindices were selected that reflect the different types ofchanges in landscape composition and pattern. The in-dices selected to quantify the landscape changes forthis study were Simpson’s evenness index (SEI), meanpatch size (MPS), contagion (C), and interspersion–juxtaposition index (IJI). The SEI is a measure of com-munity diversity that is determined by abundance ofeach patch type within a watershed and decreases as apatch type becomes more dominant within a water-shed. The SEI was selected rather than other diversityindices such as Simpson’s diversity index or the Shan-non–Wiener diversity index because community rich-ness did not change over the modeled time periods.The SEI is a more sensitive measure of changes in theproportion of landscape cover types. The MPS is anaverage size of all patch types within a landscape. Itaverages the effects of both the aggregation of patchesthrough succession and the creation of new patch typesthrough disturbance. Patch size can have important ef-fects on the modification of the local environment andthe selection of habitat by many species. The C is re-lated to the distribution of each patch type within thewatershed and decreases as the spatial distribution ofa patch type becomes more aggregated. This metric isaffected by both disturbance patterns and more con-stant factors such as the distribution of soil type, geo-logical parent materials, and aspect. The IJI is a mea-sure of the randomness of patch type adjacency. IJIdecreases as patch type adjacencies (cover type edges)become less random and as a patch type is associatedmore frequently with other patch types. The distribu-tion of different types of edges influences some spe-cies’ habitat selection and the degree of microclimatemodification by edges. Together these four metricsmeasured the effects of disturbance on cover type di-versity, mean patch size, patch type distribution, anddiversity of edge types. Significant differences be-tween management strategies were detected with anal-ysis of variance and Tukey’s pairwise mean compari-sons test (P � 0.05) (SYSTAT 10.0; SPSS, Chicago,IL).
RESULTS
Under current fire management, western juniperwoodlands were predicted to continue maturing as hasbeen noted in previous field studies (Burkhardt andTisdale 1969, Miller and Wigand 1994, Miller et al.2005). Mature western juniper stages were predictedto increase about 30% in area over the next 100 y onboth mountain big sagebrush and low sagebrush sites(Table 2). Phase 3 woodlands were predicted to in-
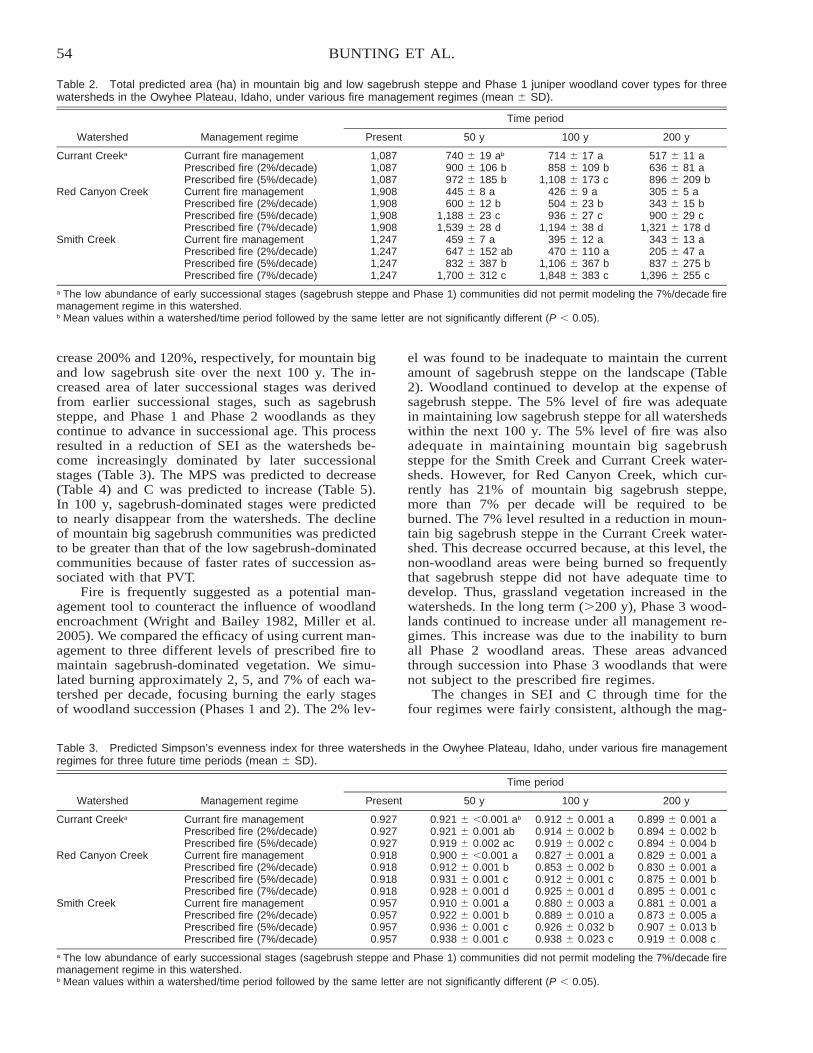
54 BUNTING ET AL.
Table 2. Total predicted area (ha) in mountain big and low sagebrush steppe and Phase 1 juniper woodland cover types for threewatersheds in the Owyhee Plateau, Idaho, under various fire management regimes (mean � SD).
Watershed Management regime
Time period
Present 50 y 100 y 200 y
Currant Creeka Currant fire management 1,087 740 � 19 ab 714 � 17 a 517 � 11 aPrescribed fire (2%/decade) 1,087 900 � 106 b 858 � 109 b 636 � 81 aPrescribed fire (5%/decade) 1,087 972 � 185 b 1,108 � 173 c 896 � 209 b
Red Canyon Creek Current fire management 1,908 445 � 8 a 426 � 9 a 305 � 5 aPrescribed fire (2%/decade) 1,908 600 � 12 b 504 � 23 b 343 � 15 bPrescribed fire (5%/decade) 1,908 1,188 � 23 c 936 � 27 c 900 � 29 cPrescribed fire (7%/decade) 1,908 1,539 � 28 d 1,194 � 38 d 1,321 � 178 d
Smith Creek Current fire management 1,247 459 � 7 a 395 � 12 a 343 � 13 aPrescribed fire (2%/decade) 1,247 647 � 152 ab 470 � 110 a 205 � 47 aPrescribed fire (5%/decade) 1,247 832 � 387 b 1,106 � 367 b 837 � 275 bPrescribed fire (7%/decade) 1,247 1,700 � 312 c 1,848 � 383 c 1,396 � 255 c
a The low abundance of early successional stages (sagebrush steppe and Phase 1) communities did not permit modeling the 7%/decade firemanagement regime in this watershed.b Mean values within a watershed/time period followed by the same letter are not significantly different (P � 0.05).
Table 3. Predicted Simpson’s evenness index for three watersheds in the Owyhee Plateau, Idaho, under various fire managementregimes for three future time periods (mean � SD).
Watershed Management regime
Time period
Present 50 y 100 y 200 y
Currant Creeka Currant fire management 0.927 0.921 � �0.001 ab 0.912 � 0.001 a 0.899 � 0.001 aPrescribed fire (2%/decade) 0.927 0.921 � 0.001 ab 0.914 � 0.002 b 0.894 � 0.002 bPrescribed fire (5%/decade) 0.927 0.919 � 0.002 ac 0.919 � 0.002 c 0.894 � 0.004 b
Red Canyon Creek Current fire management 0.918 0.900 � �0.001 a 0.827 � 0.001 a 0.829 � 0.001 aPrescribed fire (2%/decade) 0.918 0.912 � 0.001 b 0.853 � 0.002 b 0.830 � 0.001 aPrescribed fire (5%/decade) 0.918 0.931 � 0.001 c 0.912 � 0.001 c 0.875 � 0.001 bPrescribed fire (7%/decade) 0.918 0.928 � 0.001 d 0.925 � 0.001 d 0.895 � 0.001 c
Smith Creek Current fire management 0.957 0.910 � 0.001 a 0.880 � 0.003 a 0.881 � 0.001 aPrescribed fire (2%/decade) 0.957 0.922 � 0.001 b 0.889 � 0.010 a 0.873 � 0.005 aPrescribed fire (5%/decade) 0.957 0.936 � 0.001 c 0.926 � 0.032 b 0.907 � 0.013 bPrescribed fire (7%/decade) 0.957 0.938 � 0.001 c 0.938 � 0.023 c 0.919 � 0.008 c
a The low abundance of early successional stages (sagebrush steppe and Phase 1) communities did not permit modeling the 7%/decade firemanagement regime in this watershed.b Mean values within a watershed/time period followed by the same letter are not significantly different (P � 0.05).
crease 200% and 120%, respectively, for mountain bigand low sagebrush site over the next 100 y. The in-creased area of later successional stages was derivedfrom earlier successional stages, such as sagebrushsteppe, and Phase 1 and Phase 2 woodlands as theycontinue to advance in successional age. This processresulted in a reduction of SEI as the watersheds be-come increasingly dominated by later successionalstages (Table 3). The MPS was predicted to decrease(Table 4) and C was predicted to increase (Table 5).In 100 y, sagebrush-dominated stages were predictedto nearly disappear from the watersheds. The declineof mountain big sagebrush communities was predictedto be greater than that of the low sagebrush-dominatedcommunities because of faster rates of succession as-sociated with that PVT.
Fire is frequently suggested as a potential man-agement tool to counteract the influence of woodlandencroachment (Wright and Bailey 1982, Miller et al.2005). We compared the efficacy of using current man-agement to three different levels of prescribed fire tomaintain sagebrush-dominated vegetation. We simu-lated burning approximately 2, 5, and 7% of each wa-tershed per decade, focusing burning the early stagesof woodland succession (Phases 1 and 2). The 2% lev-
el was found to be inadequate to maintain the currentamount of sagebrush steppe on the landscape (Table2). Woodland continued to develop at the expense ofsagebrush steppe. The 5% level of fire was adequatein maintaining low sagebrush steppe for all watershedswithin the next 100 y. The 5% level of fire was alsoadequate in maintaining mountain big sagebrushsteppe for the Smith Creek and Currant Creek water-sheds. However, for Red Canyon Creek, which cur-rently has 21% of mountain big sagebrush steppe,more than 7% per decade will be required to beburned. The 7% level resulted in a reduction in moun-tain big sagebrush steppe in the Currant Creek water-shed. This decrease occurred because, at this level, thenon-woodland areas were being burned so frequentlythat sagebrush steppe did not have adequate time todevelop. Thus, grassland vegetation increased in thewatersheds. In the long term (�200 y), Phase 3 wood-lands continued to increase under all management re-gimes. This increase was due to the inability to burnall Phase 2 woodland areas. These areas advancedthrough succession into Phase 3 woodlands that werenot subject to the prescribed fire regimes.
The changes in SEI and C through time for thefour regimes were fairly consistent, although the mag-
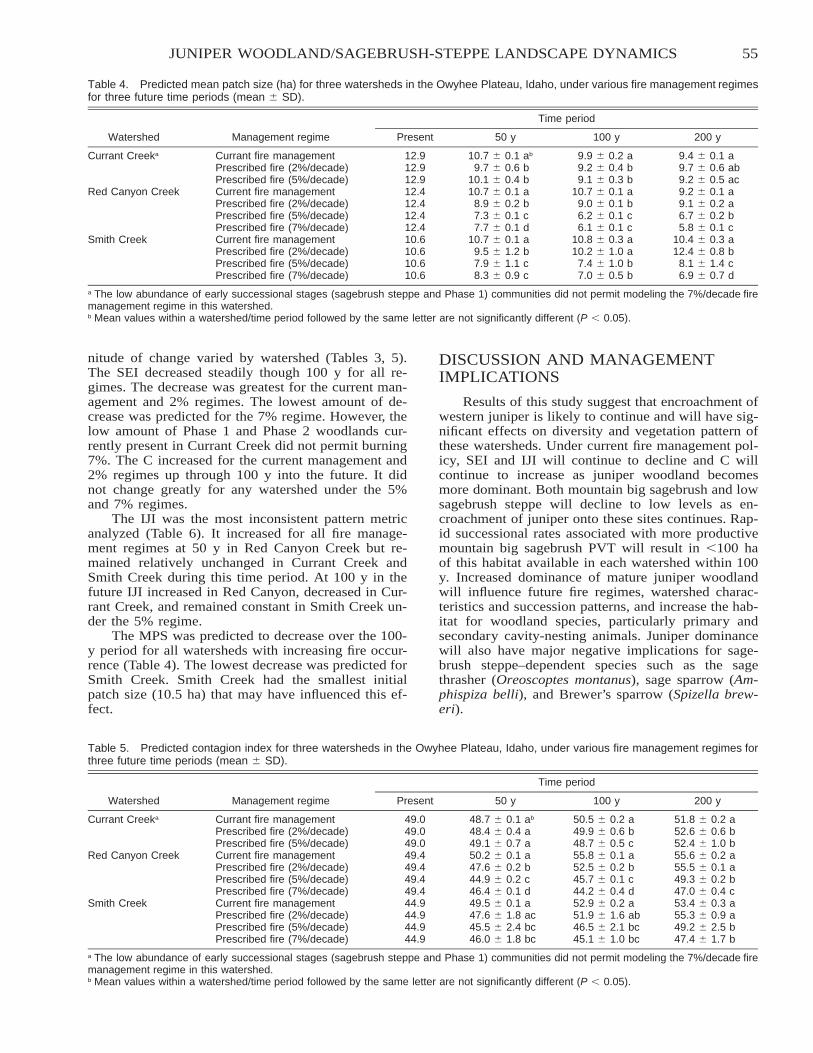
55JUNIPER WOODLAND/SAGEBRUSH-STEPPE LANDSCAPE DYNAMICS
Table 4. Predicted mean patch size (ha) for three watersheds in the Owyhee Plateau, Idaho, under various fire management regimesfor three future time periods (mean � SD).
Watershed Management regime
Time period
Present 50 y 100 y 200 y
Currant Creeka Currant fire management 12.9 10.7 � 0.1 ab 9.9 � 0.2 a 9.4 � 0.1 aPrescribed fire (2%/decade) 12.9 9.7 � 0.6 b 9.2 � 0.4 b 9.7 � 0.6 abPrescribed fire (5%/decade) 12.9 10.1 � 0.4 b 9.1 � 0.3 b 9.2 � 0.5 ac
Red Canyon Creek Current fire management 12.4 10.7 � 0.1 a 10.7 � 0.1 a 9.2 � 0.1 aPrescribed fire (2%/decade) 12.4 8.9 � 0.2 b 9.0 � 0.1 b 9.1 � 0.2 aPrescribed fire (5%/decade) 12.4 7.3 � 0.1 c 6.2 � 0.1 c 6.7 � 0.2 bPrescribed fire (7%/decade) 12.4 7.7 � 0.1 d 6.1 � 0.1 c 5.8 � 0.1 c
Smith Creek Current fire management 10.6 10.7 � 0.1 a 10.8 � 0.3 a 10.4 � 0.3 aPrescribed fire (2%/decade) 10.6 9.5 � 1.2 b 10.2 � 1.0 a 12.4 � 0.8 bPrescribed fire (5%/decade) 10.6 7.9 � 1.1 c 7.4 � 1.0 b 8.1 � 1.4 cPrescribed fire (7%/decade) 10.6 8.3 � 0.9 c 7.0 � 0.5 b 6.9 � 0.7 d
a The low abundance of early successional stages (sagebrush steppe and Phase 1) communities did not permit modeling the 7%/decade firemanagement regime in this watershed.b Mean values within a watershed/time period followed by the same letter are not significantly different (P � 0.05).
Table 5. Predicted contagion index for three watersheds in the Owyhee Plateau, Idaho, under various fire management regimes forthree future time periods (mean � SD).
Watershed Management regime
Time period
Present 50 y 100 y 200 y
Currant Creeka Currant fire management 49.0 48.7 � 0.1 ab 50.5 � 0.2 a 51.8 � 0.2 aPrescribed fire (2%/decade) 49.0 48.4 � 0.4 a 49.9 � 0.6 b 52.6 � 0.6 bPrescribed fire (5%/decade) 49.0 49.1 � 0.7 a 48.7 � 0.5 c 52.4 � 1.0 b
Red Canyon Creek Current fire management 49.4 50.2 � 0.1 a 55.8 � 0.1 a 55.6 � 0.2 aPrescribed fire (2%/decade) 49.4 47.6 � 0.2 b 52.5 � 0.2 b 55.5 � 0.1 aPrescribed fire (5%/decade) 49.4 44.9 � 0.2 c 45.7 � 0.1 c 49.3 � 0.2 bPrescribed fire (7%/decade) 49.4 46.4 � 0.1 d 44.2 � 0.4 d 47.0 � 0.4 c
Smith Creek Current fire management 44.9 49.5 � 0.1 a 52.9 � 0.2 a 53.4 � 0.3 aPrescribed fire (2%/decade) 44.9 47.6 � 1.8 ac 51.9 � 1.6 ab 55.3 � 0.9 aPrescribed fire (5%/decade) 44.9 45.5 � 2.4 bc 46.5 � 2.1 bc 49.2 � 2.5 bPrescribed fire (7%/decade) 44.9 46.0 � 1.8 bc 45.1 � 1.0 bc 47.4 � 1.7 b
a The low abundance of early successional stages (sagebrush steppe and Phase 1) communities did not permit modeling the 7%/decade firemanagement regime in this watershed.b Mean values within a watershed/time period followed by the same letter are not significantly different (P � 0.05).
nitude of change varied by watershed (Tables 3, 5).The SEI decreased steadily though 100 y for all re-gimes. The decrease was greatest for the current man-agement and 2% regimes. The lowest amount of de-crease was predicted for the 7% regime. However, thelow amount of Phase 1 and Phase 2 woodlands cur-rently present in Currant Creek did not permit burning7%. The C increased for the current management and2% regimes up through 100 y into the future. It didnot change greatly for any watershed under the 5%and 7% regimes.
The IJI was the most inconsistent pattern metricanalyzed (Table 6). It increased for all fire manage-ment regimes at 50 y in Red Canyon Creek but re-mained relatively unchanged in Currant Creek andSmith Creek during this time period. At 100 y in thefuture IJI increased in Red Canyon, decreased in Cur-rant Creek, and remained constant in Smith Creek un-der the 5% regime.
The MPS was predicted to decrease over the 100-y period for all watersheds with increasing fire occur-rence (Table 4). The lowest decrease was predicted forSmith Creek. Smith Creek had the smallest initialpatch size (10.5 ha) that may have influenced this ef-fect.
DISCUSSION AND MANAGEMENTIMPLICATIONS
Results of this study suggest that encroachment ofwestern juniper is likely to continue and will have sig-nificant effects on diversity and vegetation pattern ofthese watersheds. Under current fire management pol-icy, SEI and IJI will continue to decline and C willcontinue to increase as juniper woodland becomesmore dominant. Both mountain big sagebrush and lowsagebrush steppe will decline to low levels as en-croachment of juniper onto these sites continues. Rap-id successional rates associated with more productivemountain big sagebrush PVT will result in �100 haof this habitat available in each watershed within 100y. Increased dominance of mature juniper woodlandwill influence future fire regimes, watershed charac-teristics and succession patterns, and increase the hab-itat for woodland species, particularly primary andsecondary cavity-nesting animals. Juniper dominancewill also have major negative implications for sage-brush steppe–dependent species such as the sagethrasher (Oreoscoptes montanus), sage sparrow (Am-phispiza belli), and Brewer’s sparrow (Spizella brew-eri).
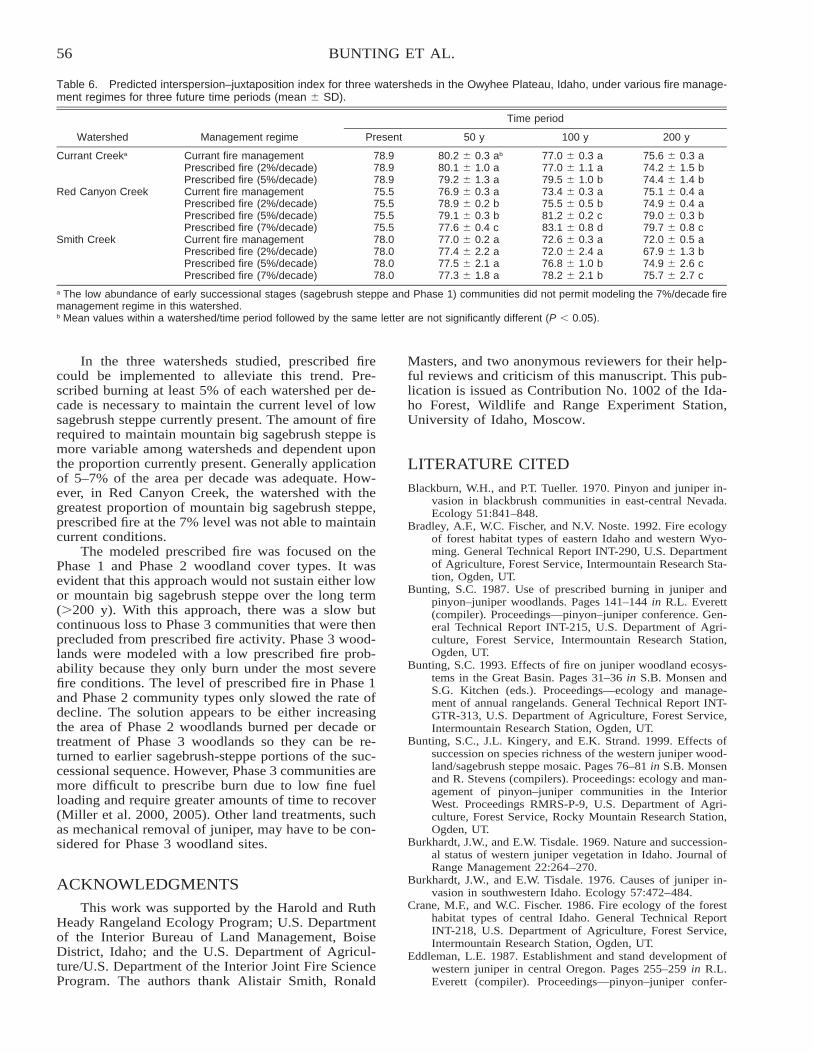
56 BUNTING ET AL.
Table 6. Predicted interspersion–juxtaposition index for three watersheds in the Owyhee Plateau, Idaho, under various fire manage-ment regimes for three future time periods (mean � SD).
Watershed Management regime
Time period
Present 50 y 100 y 200 y
Currant Creeka Currant fire management 78.9 80.2 � 0.3 ab 77.0 � 0.3 a 75.6 � 0.3 aPrescribed fire (2%/decade) 78.9 80.1 � 1.0 a 77.0 � 1.1 a 74.2 � 1.5 bPrescribed fire (5%/decade) 78.9 79.2 � 1.3 a 79.5 � 1.0 b 74.4 � 1.4 b
Red Canyon Creek Current fire management 75.5 76.9 � 0.3 a 73.4 � 0.3 a 75.1 � 0.4 aPrescribed fire (2%/decade) 75.5 78.9 � 0.2 b 75.5 � 0.5 b 74.9 � 0.4 aPrescribed fire (5%/decade) 75.5 79.1 � 0.3 b 81.2 � 0.2 c 79.0 � 0.3 bPrescribed fire (7%/decade) 75.5 77.6 � 0.4 c 83.1 � 0.8 d 79.7 � 0.8 c
Smith Creek Current fire management 78.0 77.0 � 0.2 a 72.6 � 0.3 a 72.0 � 0.5 aPrescribed fire (2%/decade) 78.0 77.4 � 2.2 a 72.0 � 2.4 a 67.9 � 1.3 bPrescribed fire (5%/decade) 78.0 77.5 � 2.1 a 76.8 � 1.0 b 74.9 � 2.6 cPrescribed fire (7%/decade) 78.0 77.3 � 1.8 a 78.2 � 2.1 b 75.7 � 2.7 c
a The low abundance of early successional stages (sagebrush steppe and Phase 1) communities did not permit modeling the 7%/decade firemanagement regime in this watershed.b Mean values within a watershed/time period followed by the same letter are not significantly different (P � 0.05).
In the three watersheds studied, prescribed firecould be implemented to alleviate this trend. Pre-scribed burning at least 5% of each watershed per de-cade is necessary to maintain the current level of lowsagebrush steppe currently present. The amount of firerequired to maintain mountain big sagebrush steppe ismore variable among watersheds and dependent uponthe proportion currently present. Generally applicationof 5–7% of the area per decade was adequate. How-ever, in Red Canyon Creek, the watershed with thegreatest proportion of mountain big sagebrush steppe,prescribed fire at the 7% level was not able to maintaincurrent conditions.
The modeled prescribed fire was focused on thePhase 1 and Phase 2 woodland cover types. It wasevident that this approach would not sustain either lowor mountain big sagebrush steppe over the long term(�200 y). With this approach, there was a slow butcontinuous loss to Phase 3 communities that were thenprecluded from prescribed fire activity. Phase 3 wood-lands were modeled with a low prescribed fire prob-ability because they only burn under the most severefire conditions. The level of prescribed fire in Phase 1and Phase 2 community types only slowed the rate ofdecline. The solution appears to be either increasingthe area of Phase 2 woodlands burned per decade ortreatment of Phase 3 woodlands so they can be re-turned to earlier sagebrush-steppe portions of the suc-cessional sequence. However, Phase 3 communities aremore difficult to prescribe burn due to low fine fuelloading and require greater amounts of time to recover(Miller et al. 2000, 2005). Other land treatments, suchas mechanical removal of juniper, may have to be con-sidered for Phase 3 woodland sites.
ACKNOWLEDGMENTS
This work was supported by the Harold and RuthHeady Rangeland Ecology Program; U.S. Departmentof the Interior Bureau of Land Management, BoiseDistrict, Idaho; and the U.S. Department of Agricul-ture/U.S. Department of the Interior Joint Fire ScienceProgram. The authors thank Alistair Smith, Ronald
Masters, and two anonymous reviewers for their help-ful reviews and criticism of this manuscript. This pub-lication is issued as Contribution No. 1002 of the Ida-ho Forest, Wildlife and Range Experiment Station,University of Idaho, Moscow.
LITERATURE CITED
Blackburn, W.H., and P.T. Tueller. 1970. Pinyon and juniper in-vasion in blackbrush communities in east-central Nevada.Ecology 51:841–848.
Bradley, A.F., W.C. Fischer, and N.V. Noste. 1992. Fire ecologyof forest habitat types of eastern Idaho and western Wyo-ming. General Technical Report INT-290, U.S. Departmentof Agriculture, Forest Service, Intermountain Research Sta-tion, Ogden, UT.
Bunting, S.C. 1987. Use of prescribed burning in juniper andpinyon–juniper woodlands. Pages 141–144 in R.L. Everett(compiler). Proceedings—pinyon–juniper conference. Gen-eral Technical Report INT-215, U.S. Department of Agri-culture, Forest Service, Intermountain Research Station,Ogden, UT.
Bunting, S.C. 1993. Effects of fire on juniper woodland ecosys-tems in the Great Basin. Pages 31–36 in S.B. Monsen andS.G. Kitchen (eds.). Proceedings—ecology and manage-ment of annual rangelands. General Technical Report INT-GTR-313, U.S. Department of Agriculture, Forest Service,Intermountain Research Station, Ogden, UT.
Bunting, S.C., J.L. Kingery, and E.K. Strand. 1999. Effects ofsuccession on species richness of the western juniper wood-land/sagebrush steppe mosaic. Pages 76–81 in S.B. Monsenand R. Stevens (compilers). Proceedings: ecology and man-agement of pinyon–juniper communities in the InteriorWest. Proceedings RMRS-P-9, U.S. Department of Agri-culture, Forest Service, Rocky Mountain Research Station,Ogden, UT.
Burkhardt, J.W., and E.W. Tisdale. 1969. Nature and succession-al status of western juniper vegetation in Idaho. Journal ofRange Management 22:264–270.
Burkhardt, J.W., and E.W. Tisdale. 1976. Causes of juniper in-vasion in southwestern Idaho. Ecology 57:472–484.
Crane, M.F., and W.C. Fischer. 1986. Fire ecology of the foresthabitat types of central Idaho. General Technical ReportINT-218, U.S. Department of Agriculture, Forest Service,Intermountain Research Station, Ogden, UT.
Eddleman, L.E. 1987. Establishment and stand development ofwestern juniper in central Oregon. Pages 255–259 in R.L.Everett (compiler). Proceedings—pinyon–juniper confer-
57JUNIPER WOODLAND/SAGEBRUSH-STEPPE LANDSCAPE DYNAMICS
ence. General Technical Report INT-215, U.S. Departmentof Agriculture, Forest Service, Intermountain Research Sta-tion, Ogden, UT.
Ellison, L. 1960. Influence of grazing on plant succession ofrangelands. Botanical Review 26:1–78.
Everett, R.L. 1987. Plant response to fire in the pinyon–juniperzone. Pages 152–157 in R.L. Everett (compiler). Proceed-ings—pinyon–juniper conference. General Technical ReportINT-215, U.S. Department of Agriculture, Forest Service,Intermountain Research Station, Ogden, UT.
Fischer, W.C., and A.F. Bradley. 1987. Fire ecology of westernMontana forest habitat types. General Technical ReportINT-223, U.S. Department of Agriculture, Forest Service,Intermountain Research Station, Ogden, UT.
HEMI Solar Analyst. 1999–2000. The Solar Analyst 1.0 usermanual. Helios Environmental Modeling Institute, Lawr-ence, KS. http://www.fs.fed.us/informs/solaranalyst/solar�analyst�users�guide.pdf [accessed 25 Aug 2005].
Jensen, M.E., and P.S. Bourgeron. 1993. Eastside forest healthassessment. Volume II: Ecosystem management: principlesand applications. General Technical Report PNW-432, U.S.Department of Agriculture, Forest Service, Pacific North-west Research Station, Portland, OR.
Kaufmann, M.R., R.T. Graham, D.A. Boyce, W.H. Moir, L. Per-ry, R.T. Reynolds, R.L. Bassett, P. Mehlhop, C.B. Edmins-ter, W.M. Block, and P.S. Corn. 1994. An ecological basisfor ecosystem management. General Technical Report RM-246, U.S. Department of Agriculture, Forest Service, RockyMountain Research Station, Fort Collins, CO.
Kessell, S.R., and W.C. Fischer. 1981. Predicting postfire plantsuccession for fire management planning. General TechnicalReport INT-94, U.S. Department of Agriculture, Forest Ser-vice, Intermountain Research Station, Ogden, UT.
Klenner, W., W. Kurz, and S. Beukema. 2000. Habitat patternsin forested landscapes: management practices and the un-certainty associated with natural disturbances. Computersand Electronics in Agriculture 27:243–262.
Koniak, S., and R.L. Everett. 1982. Seed reserves in soils ofsuccessional stages on pinyon woodlands. American Mid-land Naturalist 102:295–303.
Kurz, W., S. Beukema, J. Merzenich, M. Arbaugh, and S. Schil-ling. 2000a. Long-range modeling of stochastic disturbanc-es and management treatments using VDDT and TELSA.Pages 349–355 in Proceedings of the Society of AmericanForesters National Convention, 11–15 Sep 1999, Portland,OR.
Kurz, W.A., S. Beukema, W. Klenner, J.A. Greenough, D.C.E.Robinson, A.D. Sharpe, and T.M. Webb. 2000b. TELSA:the tool for exploratory landscape scenario analyses. Com-puters and Electronics in Agriculture 27:227–242.
McGarigal, K., and B.J. Marks. 1994. FRAGSTATS: spatial pat-tern analysis program for quantifying landscape structure.Version 2.0. Forest Science Department, Oregon State Uni-versity, Corvallis.
Miller, R.F., J.D. Bates, T.J. Svejcar, F.B. Pierson, and L.E. Ed-dleman. 2005. Biology, ecology and management of west-ern juniper. Technical Bulletin 152, Oregon State UniversityAgricultural Experiment Station, Corvallis.
Miller, R.F., and J. Rose. 1994. Historic expansion of Juniperisoccidentalis (western juniper) expansion in southeasternOregon. Great Basin Naturalist 55:37–45.
Miller, R.F., J. Rose, T. Svejcar, J. Bates, and K. Paintner. 1995.Western juniper woodlands: 100 years of plant succession.Pages 5–8 in D.W. Shaw, E.F. Aldon, and C. LoSapio (tech-nical coordinators). Desired future conditions for pinon–ju-niper ecosystems. General Technical Report RM-258, U.S.
Department of Agriculture, Forest Service, Rocky MountainResearch Station, Fort Collins, CO.
Miller, R.F., T. Svejcar, and J. Rose. 2000. Impacts of westernjuniper on plant community composition and structure.Journal of Range Management 53:574–585.
Miller, R.F., and P.E. Wigand. 1994. Holocene changes in semi-arid pinyon–juniper woodlands. BioScience 44:465–474.
Noble, I.R., and R.O. Slatyer. 1977. Postfire succession of plantin Mediterranean ecosystems. Pages 27–36 in H.A. Mooneyand C.E. Conrad (eds.). Proceedings of the symposium: en-vironmental consequences of fire and fuel management inMediterranean climate ecosystems. General Technical Re-port WO-3, U.S. Department of Agriculture, Forest Service,Washington, D.C.
O’Rourke, J.T., and P.R. Ogden. 1969. Vegetative response fol-lowing pinyon–juniper control in Arizona. Journal of RangeManagement 22:416–418.
Quigley, T.M., R.W. Haynes, and R.T. Graham (technical eds.).1996. An integrated scientific assessment for ecosystemmanagement in the Interior Columbia River Basin and por-tions of the Klamath and Great Basins. General TechnicalReport PNW-GTR-382, U.S. Department of Agriculture,Forest Service, Pacific Northwest Research Station, Port-land, OR.
Roth, A. 2004. Fire patterns within a successional gradient of asagebrush steppe/juniper woodland. M.S. Thesis, Universityof Idaho, Moscow.
Tausch, R.J., and P.T. Tueller. 1990. Foliage biomass and coverrelationships between tree- and shrub-dominated commu-nities in pinyon–juniper woodlands. Great Basin Naturalist50:121–134.
Tisdale, E.W. 1969. The sagebrush region in Idaho. A problemin range resource management. Station Bulletin 512, Uni-versity of Idaho, Agricultural Experiment Station, Moscow.
USDA [U.S. Department of Agriculture]. 1996. Status of theInterior Columbia Basin: summary of scientific findings.General Technical Report PNW-GTR-385, U.S. Departmentof Agriculture, Forest Service, Pacific Northwest ResearchStation, Portland, OR.
Vaitkus, M.R., and L.E. Eddleman. 1991. Tree size and under-story phytomass production in a western juniper woodland.Great Basin Naturalist 51:236–243.
Vasek, F.C. 1966. Distribution and taxonomy of three westernjunipers. Brittonia 18:350–372.
Vasek, F.C., and R.F. Thorne. 1977. Transmontane coniferousvegetation. Pages 797–832 in M.G. Barbour and J. Major(eds.). Terrestrial vegetation of California. Special Publi-cation No. 9, California Native Plant Society, Sacramento.
West, N.E. 1999. Distribution, composition, and classification ofcurrent juniper–pinyon woodlands and savannas acrosswestern North America. Pages 20–23 in S.B. Monsen andR. Stevens (compilers). Proceedings: ecology and manage-ment of pinyon–juniper communities in the Interior West.Proceedings RMRS-P-9, U.S. Department of Agriculture,Forest Service, Rocky Mountain Research Station, Ogden,UT.
West, N.E., R.J. Tausch, K.H. Rhea, and P.T. Tueller. 1979. Phy-togeographic variation within the juniper–pinyon wood-lands of the Great Basin. Pages 119–136 in K.T. Harper andJ.L. Reveal (coordinators). Intermountain biogeography: asymposium. Great Basin Naturalist Memoirs 2. BrighamYoung University Press, Provo, UT.
Wright, H.A., and A.W. Bailey. 1982. Fire ecology—UnitedStates and southern Canada. J. Wiley and Sons, New York.
Young, J.A., and R.A. Evans. 1981. Demography and fire historyof a western juniper stand. Journal of Range Management34:501–506.
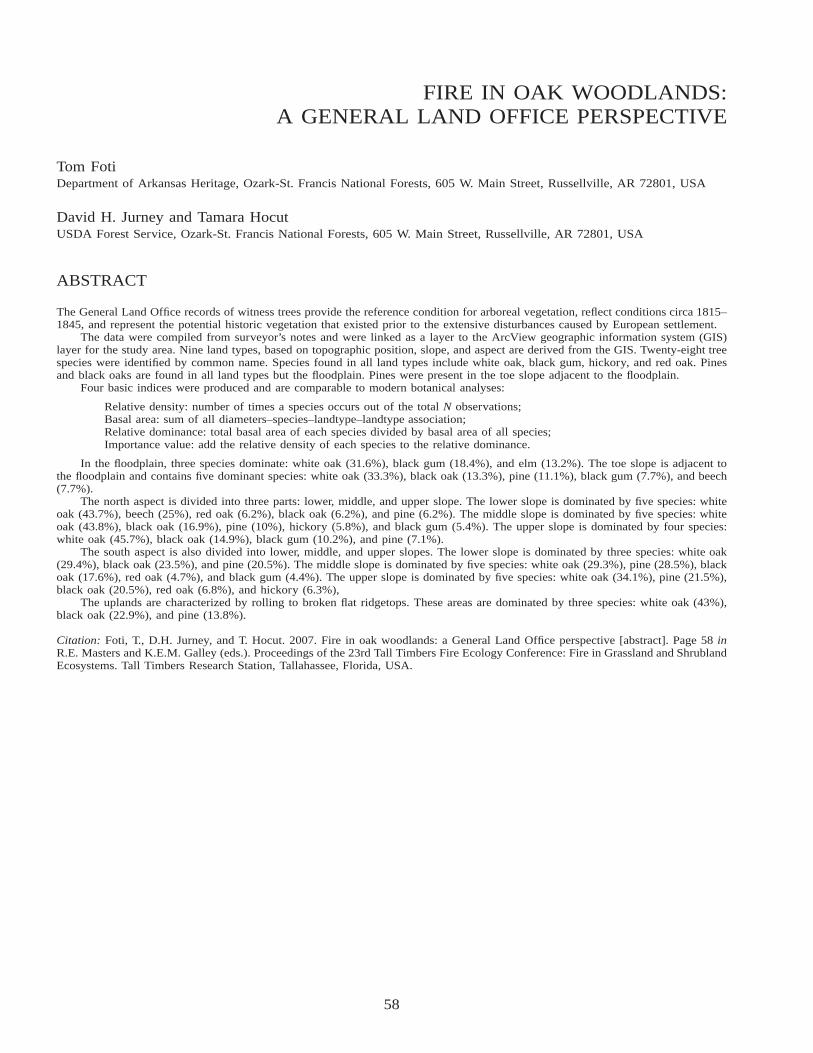
58
FIRE IN OAK WOODLANDS:A GENERAL LAND OFFICE PERSPECTIVE
Tom FotiDepartment of Arkansas Heritage, Ozark-St. Francis National Forests, 605 W. Main Street, Russellville, AR 72801, USA
David H. Jurney and Tamara HocutUSDA Forest Service, Ozark-St. Francis National Forests, 605 W. Main Street, Russellville, AR 72801, USA
ABSTRACT
The General Land Office records of witness trees provide the reference condition for arboreal vegetation, reflect conditions circa 1815–1845, and represent the potential historic vegetation that existed prior to the extensive disturbances caused by European settlement.
The data were compiled from surveyor’s notes and were linked as a layer to the ArcView geographic information system (GIS)layer for the study area. Nine land types, based on topographic position, slope, and aspect are derived from the GIS. Twenty-eight treespecies were identified by common name. Species found in all land types include white oak, black gum, hickory, and red oak. Pinesand black oaks are found in all land types but the floodplain. Pines were present in the toe slope adjacent to the floodplain.
Four basic indices were produced and are comparable to modern botanical analyses:
Relative density: number of times a species occurs out of the total N observations;Basal area: sum of all diameters–species–landtype–landtype association;Relative dominance: total basal area of each species divided by basal area of all species;Importance value: add the relative density of each species to the relative dominance.
In the floodplain, three species dominate: white oak (31.6%), black gum (18.4%), and elm (13.2%). The toe slope is adjacent tothe floodplain and contains five dominant species: white oak (33.3%), black oak (13.3%), pine (11.1%), black gum (7.7%), and beech(7.7%).
The north aspect is divided into three parts: lower, middle, and upper slope. The lower slope is dominated by five species: whiteoak (43.7%), beech (25%), red oak (6.2%), black oak (6.2%), and pine (6.2%). The middle slope is dominated by five species: whiteoak (43.8%), black oak (16.9%), pine (10%), hickory (5.8%), and black gum (5.4%). The upper slope is dominated by four species:white oak (45.7%), black oak (14.9%), black gum (10.2%), and pine (7.1%).
The south aspect is also divided into lower, middle, and upper slopes. The lower slope is dominated by three species: white oak(29.4%), black oak (23.5%), and pine (20.5%). The middle slope is dominated by five species: white oak (29.3%), pine (28.5%), blackoak (17.6%), red oak (4.7%), and black gum (4.4%). The upper slope is dominated by five species: white oak (34.1%), pine (21.5%),black oak (20.5%), red oak (6.8%), and hickory (6.3%),
The uplands are characterized by rolling to broken flat ridgetops. These areas are dominated by three species: white oak (43%),black oak (22.9%), and pine (13.8%).
Citation: Foti, T., D.H. Jurney, and T. Hocut. 2007. Fire in oak woodlands: a General Land Office perspective [abstract]. Page 58 inR.E. Masters and K.E.M. Galley (eds.). Proceedings of the 23rd Tall Timbers Fire Ecology Conference: Fire in Grassland and ShrublandEcosystems. Tall Timbers Research Station, Tallahassee, Florida, USA.
59
EFFECTS OF FIRE ON VEGETATION DYNAMICS INTALLGRASS PRAIRIE: 30 YEARS OF RESEARCH AT THE
KONZA PRAIRIE BIOLOGICAL STATION
David C. HartnettKansas State University, Division of Biology, Manhattan, KS 66506, USA
ABSTRACT
Fire is a key factor shaping the structure and dynamics of tallgrass prairie ecosystems. Since 1972, studies at the Konza PrairieBiological Station (KPBS) have been examining the effects of fire on plant and animal populations and communities, and on ecosystem-level processes. The 3,487-ha preserve is divided into 55 watershed units (average size � 60 ha), each subjected to a specific com-bination of prescribed fire frequency (burned in the spring at 1-, 2-, 4-, 10-, or 20-y intervals) or fire season (burned in February,April, July, or November), and grazing treatment (grazed by bison [Bison bison], cattle, or ungrazed). These experimental treatments,replicated at the watershed level, allow large-scale studies of the effects of varying fire regimes, and their interaction with grazingeffects, on tallgrass prairie.
These long-term studies at KPBS have shown that frequent fire in tallgrass prairie (e.g., annual or biannual spring burning)increases the competitive dominance and relative abundance of warm-season perennial C4 grasses and decreases the relative abundanceof subdominant C3 graminoids and forbs, resulting in a decrease in plant species richness and diversity. Frequent fire also significantlyreduces the cover and frequency of woody plant species, and in the absence of fire, complete displacement of native prairie by woodyvegetation can occur in �4 decades. Long-term study at KPBS has also shown that frequent fire reduces the frequency of exotic grassand forb species in tallgrass prairie plant communities. The reduction in floristic diversity due to frequent fire is offset by grazing,which increases plant species diversity. Plant species richness is not significantly affected by season of burn. Plant species responddifferentially to season of fire, although there is a general increase in the relative abundance of perennial forbs under frequent dormant-season (autumn or winter) fire.
These vegetation responses are driven by fire effects on nutrient cycling processes and on shifts in the relative limitation of keyplant resources (light, water, and nutrients). Many plant population and community responses to fire in tallgrass prairie are mediatedby fire effects on mutualistic symbiotic associations between plants and arbuscular mycorrhizal fungi.
Citation: Hartnett, D.C. 2007. Effects of fire on vegetation dynamics in tallgrass prairie: 30 years of research at the Konza PrairieBiological Station [abstract]. Page 59 in R.E. Masters and K.E.M. Galley (eds.). Proceedings of the 23rd Tall Timbers Fire EcologyConference: Fire in Grassland and Shrubland Ecosystems. Tall Timbers Research Station, Tallahassee, Florida, USA.
60
FIRE-INDUCED CHANGES IN SOIL NITROGEN AND CARBONDYNAMICS IN TALLGRASS PRAIRIE
John M. Blair and Loretta C. JohnsonKansas State University, Division of Biology, Manhattan, KS 66506, USA
Alan K. KnappColorado State University, Department of Biology, Fort Collins, CO 80523, USA
ABSTRACT
Periodic fires are essential for the development and persistence of relatively mesic grasslands, including the tallgrass prairies of theU.S. Central Plains. Today, fire is widely used as a management tool to limit encroachment by woody plants and to maintain theproductivity of the dominant C4 grasses in these grasslands. Fires at different frequencies affect many aspects of tallgrass prairieecosystem structure and functioning, including plant species composition, plant productivity, plant tissue chemistry, and the soilmicroclimate, all of which can affect soil processes and soil biota. Long-term studies at the Konza Prairie Long Term EcologicalResearch site have been evaluating belowground responses to fire at different frequencies (i.e., annual spring fires versus infrequentfires or long-term fire exclusion). Here we summarize some of the major findings of these studies with respect to belowground nitrogen(N) and carbon (C) cycling. Fire results in the volatilization of N from aboveground detritus in tallgrass prairie, while subsequentchanges in the light and energy environment generally increase both above- and belowground plant productivity. Increased rootproductivity and increased N use efficiency by the dominant grasses leads to greater inputs of plant material to the soil and a widerC/N ratio of those inputs, both of which influence soil N and C flux. Soils under frequently burned prairie exhibit lower N availability,evidenced by reduced concentrations of inorganic N and 33–66% lower rates of soil net N mineralization, relative to unburned prairie.Soils of frequently burned prairie also exhibit less spatial heterogeneity in available soil N, with potential consequences for plantcommunity dynamics. In contrast to the effects of fire on N mineralization, total soil CO2 efflux is increased by up to 55% in frequentlyburned, relative to unburned, prairie. Root productivity and biomass are also higher in frequently burned prairie. Comparisons of soilC and N dynamics in annually burned and infrequently burned prairie with similar soil microclimates suggest that abiotic factors alone(e.g., altered soil temperature and moisture) cannot account for these changes and that biotic factors are key to explaining belowgroundresponses to fire in tallgrass prairie.
Citation: Blair, J.M., L.C. Johnson, and A.K. Knapp. 2007. Fire-induced changes in soil nitrogen and carbon dynamics in tallgrassprairie [abstract]. Page 60 in R.E. Masters and K.E.M. Galley (eds.). Proceedings of the 23rd Tall Timbers Fire Ecology Conference:Fire in Grassland and Shrubland Ecosystems. Tall Timbers Research Station, Tallahassee, Florida, USA.
61
FIRST-YEAR RESPONSE TO SUMMER FIRE AND POST-FIREGRAZING EFFECTS IN NORTHERN MIXED PRAIRIE
Jessica L. RoseTexas Tech University, Department of Range, Wildlife and Fisheries Management, Box 42125, Lubbock, TX 79409, USA
Lance T. VermeireUSDA-ARS, Fort Keogh Livestock & Range Research Laboratory, 243 Fort Keogh Road, Miles City, MT 59301, USA
David B. WesterTexas Tech University, Department of Range, Wildlife and Fisheries Management, Box 42125, Lubbock, TX 79409, USA
ABSTRACT
Summer wildfire is a common occurrence in the northern mixed prairie. Two-year deferment from grazing is generally recommendedfollowing wildfire. However, little research has been conducted to determine whether deferment is necessary for vegetative recovery.Research objectives were to determine if summer fire and post-fire grazing at different utilization levels would affect standing crop,current-year biomass, and species composition. Five treatments were applied to twenty 0.75-ha plots near Miles City, Montana, withfour replications of each treatment. Treatments were no burn � no graze, burn � 0% utilization, burn � 17% utilization, burn � 34%utilization, and burn � 50% utilization. Fire was applied 29 August 2003, and grazing treatments were applied late June through earlyJuly 2004. Current-year biomass was similar between burned and unburned plots for herbaceous components. Total standing crop andcurrent-year biomass were each similar among utilization levels. Fire decreased threadleaf sedge (Carex filifolia) and needle-and-thread(Heterostipa comata) by 106 and 136 kg ha–1, respectively. Annual bromes (Bromus spp.) and fringed sage (Artemisia frigida) wereminor components, but were reduced by fire as well. Western wheatgrass (Pascopyrum smithii), other cool-season perennial grasses,and forbs were unaffected by fire. Warm-season perennial grasses, predominantly blue grama (Bouteloua gracilis), were reduced 156kg ha–1 by fire and decreased linearly with increasing utilization. Early results indicate that summer fire and grazing may alter speciescomposition but do not reduce current-year biomass across species during a drought year.
Citation: Rose, J.L., L.T. Vermeire, and D.B. Wester. 2007. First-year response to summer fire and post-fire grazing effects in northernmixed prairie [abstract]. Page 61 in R.E. Masters and K.E.M. Galley (eds.). Proceedings of the 23rd Tall Timbers Fire EcologyConference: Fire in Grassland and Shrubland Ecosystems. Tall Timbers Research Station, Tallahassee, Florida, USA.
62
EFFECTS OF SEASONAL FIRES ON THE TEMPORALSTABILITY OF HERBACEOUS PRODUCTION IN A
MESQUITE-ENCROACHED GRASSLAND
Michael J. Castellano and R. James AnsleyTexas Agricultural Experiment Station, P.O. 1658, Vernon, TX 76384, USA
ABSTRACT
In Great Plains ecosystems, fire has long been used to suppress shrub encroachment and augment herbaceous production. Accordingly,the effects of fire on vegetative physiognomy and herbaceous production have received much attention. However, the effect of fire onthe temporal stability of herbaceous production has received relatively little attention. Here we evaluate the results of repeated seasonalfires on the post-treatment temporal stability of herbaceous production within honey mesquite (Prosopis glandulosa)–encroachedgrasslands. We define temporal stability as the coefficient of variation for herbaceous biomass (CV � 100 � 1 SD/mean) within eachtreatment plot across years. In one analysis, we examine the effects of repeated winter fires or repeated summer fires in combinationwith either simulated grazing or no grazing on the temporal stability of an ecologically and economically important C4 midgrass. In asecond analysis, we examine the effects of repeated summer fires, repeated winter fires, and alternating winter–summer fires on thetemporal stability of a complete herbaceous community exclosed from livestock grazing. Preliminary results indicate summer firedecreases temporal stability, while winter fire and grazing have little effect. Post-fire mesquite regrowth is highest in winter burntreatments and likely lowers herbaceous production but increases temporal stability. Potential effects of seasonal fires, or the resultantalteration in shrub physiognomy, on the temporal stability of herbaceous production are important information for land managers,especially in arid and semiarid environments where precipitation varies greatly between years. Long-term, post-fire biomass data areneeded to determine how fires affect processes such as temporal stability and drought resilience.
Citation: Castellano, M.J., and R.J. Ansley. 2007. Effects of seasonal fires on the temporal stability of herbaceous production in amesquite-encroached grassland [abstract]. Page 62 in R.E. Masters and K.E.M. Galley (eds.). Proceedings of the 23rd Tall Timbers FireEcology Conference: Fire in Grassland and Shrubland Ecosystems. Tall Timbers Research Station, Tallahassee, Florida, USA.
63
EFFECTS OF SUMMER FIRES ON WOODY, SUCCULENT, ANDGRAMINOID VEGETATION IN SOUTHERN MIXED-PRAIRIE
ECOSYSTEMS: A REVIEW
R. James Ansley1 and Michael J. CastellanoTexas Agricultural Experiment Station, P.O. Box 1658, Vernon, TX 76384, USA
ABSTRACT
Interest in the use of summer fires to restore southern Great Plains prairie ecosystems infested with woody plants and cactus isincreasing, but information regarding effects on target and nontarget plant species is needed before this practice can be recommended.We review effects of summer and winter fires on mortality and growth of honey mesquite (Prosopis glandulosa), prickly pear (Opuntiaphaeacantha), and grasses common to the southern mixed prairie, including C4 midgrass sideoats grama (Bouteloua curtipendula), C4
shortgrass buffalograss (Buchloe dactyloides), and C3 midgrass Texas wintergrass (Nassella leucotricha). Summer fires were moreeffective than winter fires at top-killing mature mesquite, but plant mortality was �4% in all fire treatments. Prickly pear plant mortalitywas much greater following summer than winter fires. Sideoats grama, buffalograss, and Texas wintergrass were all tolerant of summerfire, although post-fire recovery rate was slower in sideoats grama than in the other species. Clipping once each spring reduced sideoatsgrama and Texas wintergrass standing crop in all treatments when measured 1 y after clipping, but effects of clipping � summer firewere not negatively additive. The only time fire negatively affected Texas wintergrass was when spring clipping followed winter fire.In contrast, buffalograss standing crop was not reduced by clipping or clipping � summer fire at 1 y after treatment. Results suggestthat summer fire will not eradicate mesquite and that frequent fires either in summer or winter are necessary to maintain suppression.Grasses studied thus far have demonstrated a tolerance to fire in either season.
keywords: cactus, grassland, herbaceous production, mesquite, prescribed fire, southern Great Plains, species composition, summer fire,woody plants.
Citation: Ansley, R.J., and M.J. Castellano. 2007. Effects of summer fires on woody, succulent, and graminoid vegetation in southernmixed-prairie ecosystems: a review. Pages 63–70 in R.E. Masters and K.E.M. Galley (eds.). Proceedings of the 23rd Tall Timbers FireEcology Conference: Fire in Grassland and Shrubland Ecosystems. Tall Timbers Research Station, Tallahassee, Florida, USA.
INTRODUCTION
Prescribed fires in the southern Great Plains prairiehave historically been conducted during the dormantseason (January–March) because they are safer andmore manageable than growing-season, or ‘‘summer,’’fires (Wright and Bailey 1982, Scifres and Hamilton1993). However, there has been increasing interest inthe use of summer-season fires because of their greaterability to suppress or even kill noxious woody plantsand cacti species (Ansley and Jacoby 1998, Taylor2001, Ansley and Taylor 2004). While the potentialcontrolling effects of summer fires on target noxiousspecies holds promise, there is concern that summerfires may damage economically and/or ecologicallyimportant nontarget herbaceous species (Bailey 1988)or drastically reduce grass production (Engle andBultsma 1984, Engle and Bidwell 2001). Very fewdata are available that document responses of target ornontarget species in replicated studies that comparesummer fires, winter fires, and an unburned control.Our purpose is to provide a historical context for andto summarize the effects of summer fires on GreatPlains vegetation, with particular emphasis on plantspecies in the southern Great Plains.
Historically, Great Plains vegetation was most prob-ably maintained as grassland because of the frequent oc-currence of fires (Archer 1989, Collins and Wallace
1 Corresponding author ([email protected]).
1990, Van Auken 2000). This conclusion is not new, andit is surprising how many early observers realized thatthe vast grasslands of the Great Plains were maintainedby fire and would experience woody plant encroachmentif fire was removed from these ecosystems. As early as160 y ago, Josiah Gregg, probably writing about westernOklahoma (Stewart et al. 2002), commented on how fires(called ‘‘conflagrations’’) maintained the southern prairiegrasslands (Gregg 1844:202):
It is unquestionably the prairie conflagrationsthat keep down the woody growth upon mostof the western uplands. The occasional skirtsand fringes which have escaped their ragehave been protected by the streams they bor-der. Yet, may not the time come when thesevast plains will be covered with timber? . . .Indeed there are parts of the southwest nowthickly set with trees of good size that withinthe remembrance of the oldest inhabitantswere as naked as the prairie plains and theappearance of the timber in many other sec-tions indicates that it has grown up within lessthan a century. In fact, we are now witnessingthe encroachment of the timber upon the prai-rie wherever the devastating conflagrationshave ceased their ravages.
Bray (1901:209) in western Texas, even acknowl-edging then that this was not a new idea, stated:
64 ANSLEY AND CASTELLANO
Apparently under the open prairie regime theequilibrium was maintained by more or lessregular recurrence of prairie fires. This, ofcourse, is by no means a new idea, but thestrength of it lies in the fact that the grass veg-etation was tolerant of fires and the woodyvegetation was not. It was only after weak-ening the grass floor by heavy pasturing andceasing to ward off the encroaching species byfire that the latter invaded the grass lands.
Cook (1908:1–16) wrote about fire and woody en-croachment in South Texas prairies:
That such fires were evidently the cause of theformer treeless condition of the southwesternprairies is also shown by the fact that trees arefound in all situations which afford protectionagainst fires.
Foster (1917:442–445) wrote, concerning central Texas:
The causes which have resulted in the spreadof timbered areas are traceable directly to theinterference of man. Before the white man es-tablished his ranch home in these hills the In-dians burned over the country repeatedly andthus prevented an extension of forest areas.With the settlement of the country grazing be-came the only important industry. . . .
. . . Overgrazing has greatly reduced thedensity of grass vegetation. . . . Almost un-questionably the spread of timbered areas re-ceived its impetus with the gradual disappear-ance of grassland fires and has been hastenedby the reduction of the grass cover itself.
Recent review articles by Daubenmire (1968), Ax-elrod (1985), Anderson (1990), Bock and Bock(1995), Van Auken (2000) and Briggs et al. (2005)have all reaffirmed that fires were common and nec-essary to maintain Great Plains grasslands. Sauer(1950) and Bock and Bock (1995) concluded that thereis no climatic condition that favors grassland overwoodland. In other words, there is no combination ofprecipitation and temperature that is sufficient to allowgrassland to replace desert, but that is insufficient forwoodland to replace grassland. Thus, without fire, thesoils and climate that support grasslands could, in mostcases, support a shrubland or woodland as well.
Frost (1998) suggested the fire return interval inmost of the Great Plains was �6 y, and in certainregions, �3 y. It is thought that most fires were causedby lightning strikes of dry vegetation. However, firesin some areas were ignited by Native Americans, ei-ther to assist hunting large game by surrounding themwith a ring of fire, or kill small mammals and reptilesfor food, or use as a means to stimulate lush herba-ceous growth the following year to either attract game,such as bison (Bison bison), or to increase yields ofseeds and berries (Axelrod 1985, Stewart et al. 2002).In some instances, they may have used fire to clearareas of brush or fires occurred accidentally (Foster1917, Stewart et al. 2002).
Because lightning strikes are more frequent duringsummer thunderstorms, many fire ecologists believethat summer wildfires were more common than dor-mant-season (i.e., winter or spring) fires (Higgins1986, Ewing and Engle 1988, Taylor 2001). The tim-ing of the ignition of fires by Native Americans onsouthern Great Plains grasslands is largely unknown.Higgins (1986) indicated that, in the northern mixed-grass prairie of the Dakotas, most fires were ignitedby Native Americans during fall (October) or earlyspring (April). Stewart et al. (2002) quoted several ear-ly explorers near St. Louis who witnessed late autumnburning by Native Americans. Jared Smith, referringto central Texas, wrote in 1899 that, ‘‘Weeds and brushwere kept in check by the fires set by the Indians inearly spring to improve pasturages. In this manner theencroaching of thorny shrubs, cactus and mesquite wasprevented. . . .’’ (Smith 1899:7–8). While traveling inOklahoma in October 1832, Washington Irving re-ported that he observed daily ‘‘haziness’’ from firesbeing ignited by Native Americans (Stewart et al.2002:150). In contrast, Frost (1998) suggested thatburning by Native Americans in the southern mixed-prairie regions of Oklahoma and North Texas coincid-ed with lightning strike peaks in midsummer.
It is our opinion that it was more likely for NativeAmericans in the southern prairie to conduct dormant-season rather than summer fires, especially if the goalwas to provide green growth in spring to attract bisonand other game. Thus, if we make a very simplisticgeneralization and imagine that most lightning-strikefires occurred in summer and most Native American–ignited fires occurred during the dormant months (latefall, winter, or early spring), it is conceivable that firecould potentially have occurred most months of theyear in the southern prairie. Thus, the long-term resultprior to European settlement may have been a contin-ually changing mosaic of summer-burned, dormantseason–burned, and unburned patches of widely rang-ing and often overlapping sizes.
For this paper, we assumed that summer fires werecommon to the southern Great Plains prior to Europeansettlement (Engle and Bidwell 2001). We review someof the research that has been conducted regarding re-sponses of certain plant species to summer fires. In par-ticular, we focus on our research in North Texas that hasemphasized direct contrasts between summer fire anddormant-season (i.e., ‘‘winter’’) fire effects within thesame experimental framework on the woody legumehoney mesquite (Prosopis glandulosa), brown-spinedprickly pear cactus (Opuntia phaeacantha), the C4 mid-grass sideoats grama (Bouteloua curtipendula), the C4
shortgrass buffalograss (Buchloe dactyloides), and the C3
midgrass Texas wintergrass (Nassella leucotricha). Re-search from other locations is also reviewed where itmost strongly relates to our studies, but this is by nomeans a comprehensive review.
MESQUITE RESPONSE TO SUMMERFIRES
Most of the early research on fire effects on honeymesquite focused on effects of late-winter or early
65EFFECTS OF SUMMER FIRES ON VEGETATION
spring fires (Wright and Bailey 1982). This researchprovided little evidence that single winter fires will killadult mesquite trees. Wright et al. (1976) and Brittonand Wright (1971) found moderate adult honey mes-quite mortality (50% and 32%, respectively) followingsingle late-winter (March) fires in West Texas. How-ever, the reason for even this level of mortality wasthat the mesquite had been sprayed with a top-killingherbicide (2,4,5-T) 2–5 y prior to burning, and whenfire was applied, the standing dead stems from the her-bicide treatment ignited and burned into live rootcrowns, killing the buds that would have developedbasal sprouts. Because these fires occurred so soon af-ter a herbicide treatment, we view these results as re-sponses to a combined herbicide–fire treatment, ratherthan to effects of fire alone.
In contrast, Ansley and Jacoby (1998) found that noadult mesquite trees were killed following single high-intensity winter fires (average 2,435 kW/m intensity, 2.4m flame height, 2,800 kg/ha fine fuel) in North Texas.In this study, mesquite had also been sprayed with top-killing herbicides, but fire treatments were not imple-mented until 11–26 y after the herbicide treatments. Be-cause of this delay, most of the standing dead stems fromthe herbicide treatments had decayed and disappeared.This may explain why root-kill response to fire was solow. On another site in North Texas, Ansley and Cas-tellano (2006) found that high-intensity winter fires(flame heights 2–5 m, fine fuel 3,150 kg/ha) killed only3% of 2- to 3-m-tall honey mesquite.
The literature indicates that honey mesquite is notsusceptible to summer fires, with respect to plant mor-tality, although few studies have quantified this. Lessthan 3% of adult mesquite trees were completely killedby intense summer fires (average 4,042 kW/m inten-sity), even after 2 summer fires in 3 y or consecutivesummer fires and under moderate herbaceous fine fuelloads (2,800 kg/ha) (Ansley and Jacoby 1998). Recentstudies in southern New Mexico found similar resultsfor 10-y-old honey mesquite (height 0.8 m) (Drewa etal. 2001) or 0.5-m-tall honey mesquite (Drewa 2003).In South Texas, late-summer fires caused 10% honeymesquite mortality (Box et al. 1967). However, thisevaluation was conducted �1 y post-fire and possiblyoverestimated mortalities because basal sprouting fol-lowing top-kill is often delayed the first growing sea-son post-fire.
Aboveground mortality (i.e., top-kill) of adultmultistemmed honey mesquite has been found to begreater following summer fires than winter fires, butthis may depend on composition of the herbaceous finefuel vegetation. On a site that had a mixture of C3 andC4 grasses, top-kill was greater following summer(93%) than winter (33%) fire (Ansley and Jacoby1998). However, on a site dominated by C4 grasses,there was little difference in top-kill between summer(86%) and winter (70%) fires. The C3 grasses on themixed site (mainly Texas wintergrass) were somewhatgreen during winter fires, and this lowered fire inten-sity and reduced fire impact on mesquite canopies.
Research in Arizona during the last 60 y has inves-tigated the effects of annual or biennial summer fires
(mostly in June) on velvet mesquite (Prosopis glandu-losa var. velutina). Humphrey (1949) found that summerfires caused 50% velvet mesquite mortality. Glendeningand Paulson (1955) found only 15% mortality in adultvelvet mesquite, but 52% mortality in mesquite seedlingsfollowing summer fire. Cable (1965) reported that a Junefire killed 25% of mesquite on a high herbaceous fuelarea (5,000 kg/ha), but only 8% on a lower fuel area(2,400 kg/ha). However, this evaluation was conductedat 1 y post-fire and possibly overestimated mortalities.Cable (1967) reported that a June fire reduced velvetmesquite density by 26% at 3 y post-fire. Reynolds andBohning (1956) found 28% velvet mesquite mortality 2growing seasons after June fires.
In studies that directly contrasted effects of sum-mer and winter fires, Glendening and Paulson (1955)found that summer fires in June killed 29% of velvetmesquite, while winter fires killed only 4%. Blyden-stein (1957) found that summer fires killed 5% of vel-vet mesquite, while winter fires yielded only 1% mor-tality. Thus, in these studies in Arizona, mortality ofmature velvet mesquite from summer fires ranged from5 to 50%, and averaged 23%.
In summary, these results indicate that one or twofire events, either in winter or summer, will not killmany adult honey mesquite trees. On sites with a highpercentage of C3 grasses, summer fire has a greaterpotential than winter fire for top-killing mesquite.Summer fire has caused greater mortality on adult vel-vet mesquite in Arizona than on honey mesquite inTexas and New Mexico.
It remains unknown as to whether or not a histor-ical pattern of frequent fire was successful in killingthe majority of honey mesquite plants that encroachedinto the southern Great Plains, although this is widelyassumed (Gregg 1844, Van Auken 2000, Stewart et al.2002). Wright et al. (1976) found that nearly 100% ofhoney mesquite seedlings that were 1.5 y old or youn-ger were killed by fire, but mortality ranged from 20to 72% in 2.5-y-old seedlings, depending on fire tem-perature, and was only 8% in 3-y-old seedlings. Thus,mesquite developmental resistance to fire may occurmore rapidly than what is believed to be the historicalfire regime for the southern Great Plains (Frost 1998).
PRICKLY PEAR RESPONSE TOSEASONAL FIRES
Little research has been published that has con-trasted effects of summer and winter fires on pricklypear cactus. In a recent study, we (Ansley and Castel-lano 2007a) compared brown-spined prickly pear re-sponse to summer fires (7,446 kW/m intensity), high-intensity winter fires (4,314 kW/m), low-intensity win-ter fires (791 kW/m), and unburned controls. At 3 ypost-treatment, mortality of individual prickly pearmottes (size ranging from 10 to 500 pads per motte)was 86% in summer fire and �16% in all other treat-ments. Similarly, Taylor (2001), in the Edwards Pla-teau of south-central Texas, found that summer andwinter fires reduced prickly pear density by 97% and
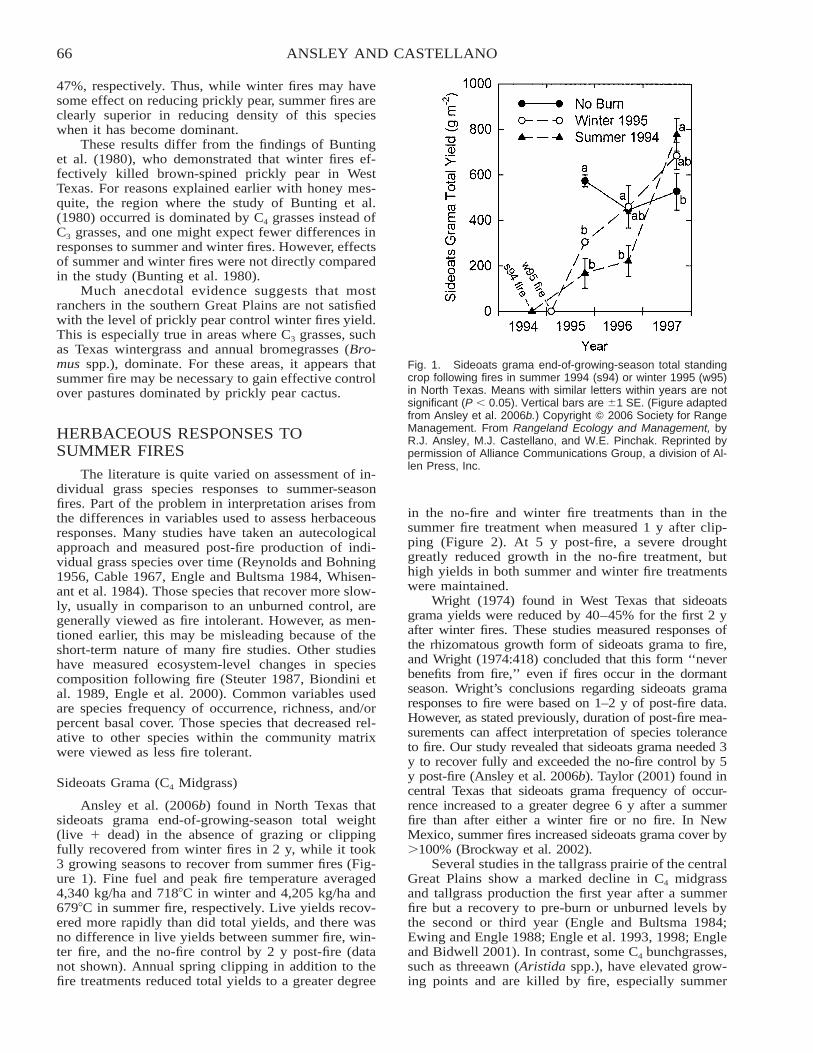
66 ANSLEY AND CASTELLANO
Fig. 1. Sideoats grama end-of-growing-season total standingcrop following fires in summer 1994 (s94) or winter 1995 (w95)in North Texas. Means with similar letters within years are notsignificant (P � 0.05). Vertical bars are �1 SE. (Figure adaptedfrom Ansley et al. 2006b.) Copyright � 2006 Society for RangeManagement. From Rangeland Ecology and Management, byR.J. Ansley, M.J. Castellano, and W.E. Pinchak. Reprinted bypermission of Alliance Communications Group, a division of Al-len Press, Inc.
47%, respectively. Thus, while winter fires may havesome effect on reducing prickly pear, summer fires areclearly superior in reducing density of this specieswhen it has become dominant.
These results differ from the findings of Buntinget al. (1980), who demonstrated that winter fires ef-fectively killed brown-spined prickly pear in WestTexas. For reasons explained earlier with honey mes-quite, the region where the study of Bunting et al.(1980) occurred is dominated by C4 grasses instead ofC3 grasses, and one might expect fewer differences inresponses to summer and winter fires. However, effectsof summer and winter fires were not directly comparedin the study (Bunting et al. 1980).
Much anecdotal evidence suggests that mostranchers in the southern Great Plains are not satisfiedwith the level of prickly pear control winter fires yield.This is especially true in areas where C3 grasses, suchas Texas wintergrass and annual bromegrasses (Bro-mus spp.), dominate. For these areas, it appears thatsummer fire may be necessary to gain effective controlover pastures dominated by prickly pear cactus.
HERBACEOUS RESPONSES TOSUMMER FIRES
The literature is quite varied on assessment of in-dividual grass species responses to summer-seasonfires. Part of the problem in interpretation arises fromthe differences in variables used to assess herbaceousresponses. Many studies have taken an autecologicalapproach and measured post-fire production of indi-vidual grass species over time (Reynolds and Bohning1956, Cable 1967, Engle and Bultsma 1984, Whisen-ant et al. 1984). Those species that recover more slow-ly, usually in comparison to an unburned control, aregenerally viewed as fire intolerant. However, as men-tioned earlier, this may be misleading because of theshort-term nature of many fire studies. Other studieshave measured ecosystem-level changes in speciescomposition following fire (Steuter 1987, Biondini etal. 1989, Engle et al. 2000). Common variables usedare species frequency of occurrence, richness, and/orpercent basal cover. Those species that decreased rel-ative to other species within the community matrixwere viewed as less fire tolerant.
Sideoats Grama (C4 Midgrass)
Ansley et al. (2006b) found in North Texas thatsideoats grama end-of-growing-season total weight(live � dead) in the absence of grazing or clippingfully recovered from winter fires in 2 y, while it took3 growing seasons to recover from summer fires (Fig-ure 1). Fine fuel and peak fire temperature averaged4,340 kg/ha and 718�C in winter and 4,205 kg/ha and679�C in summer fire, respectively. Live yields recov-ered more rapidly than did total yields, and there wasno difference in live yields between summer fire, win-ter fire, and the no-fire control by 2 y post-fire (datanot shown). Annual spring clipping in addition to thefire treatments reduced total yields to a greater degree
in the no-fire and winter fire treatments than in thesummer fire treatment when measured 1 y after clip-ping (Figure 2). At 5 y post-fire, a severe droughtgreatly reduced growth in the no-fire treatment, buthigh yields in both summer and winter fire treatmentswere maintained.
Wright (1974) found in West Texas that sideoatsgrama yields were reduced by 40–45% for the first 2 yafter winter fires. These studies measured responses ofthe rhizomatous growth form of sideoats grama to fire,and Wright (1974:418) concluded that this form ‘‘neverbenefits from fire,’’ even if fires occur in the dormantseason. Wright’s conclusions regarding sideoats gramaresponses to fire were based on 1–2 y of post-fire data.However, as stated previously, duration of post-fire mea-surements can affect interpretation of species toleranceto fire. Our study revealed that sideoats grama needed 3y to recover fully and exceeded the no-fire control by 5y post-fire (Ansley et al. 2006b). Taylor (2001) found incentral Texas that sideoats grama frequency of occur-rence increased to a greater degree 6 y after a summerfire than after either a winter fire or no fire. In NewMexico, summer fires increased sideoats grama cover by�100% (Brockway et al. 2002).
Several studies in the tallgrass prairie of the centralGreat Plains show a marked decline in C4 midgrassand tallgrass production the first year after a summerfire but a recovery to pre-burn or unburned levels bythe second or third year (Engle and Bultsma 1984;Ewing and Engle 1988; Engle et al. 1993, 1998; Engleand Bidwell 2001). In contrast, some C4 bunchgrasses,such as threeawn (Aristida spp.), have elevated grow-ing points and are killed by fire, especially summer
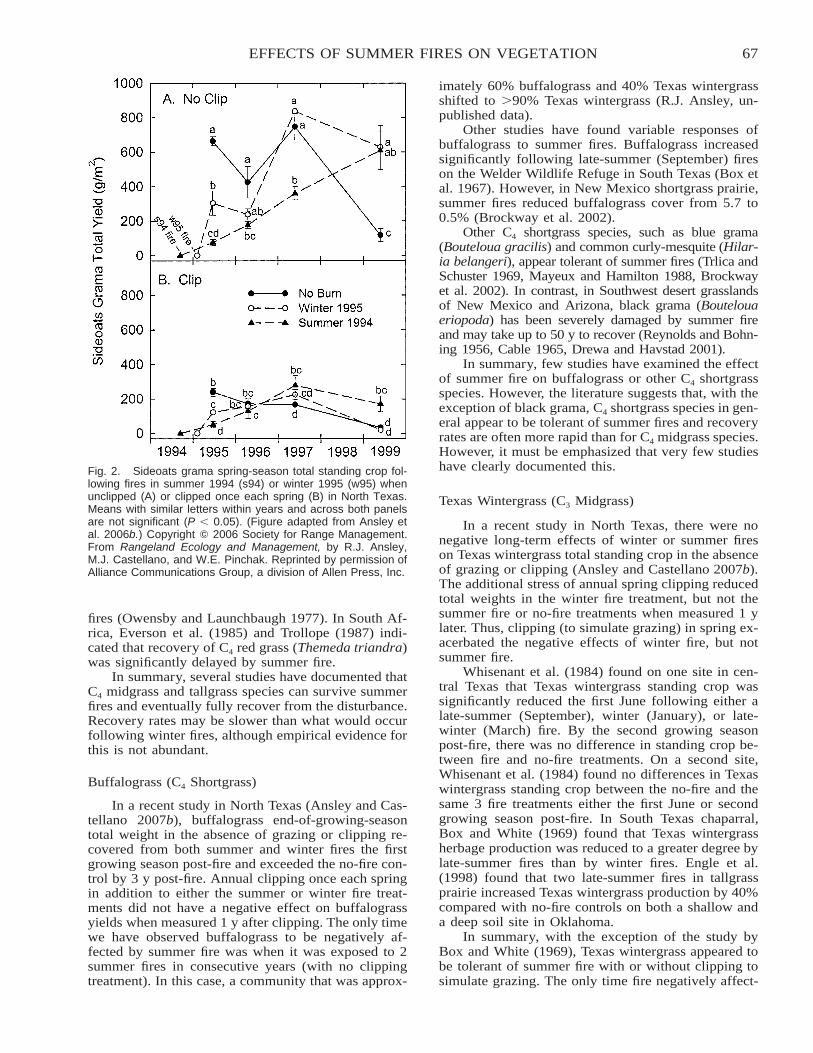
67EFFECTS OF SUMMER FIRES ON VEGETATION
Fig. 2. Sideoats grama spring-season total standing crop fol-lowing fires in summer 1994 (s94) or winter 1995 (w95) whenunclipped (A) or clipped once each spring (B) in North Texas.Means with similar letters within years and across both panelsare not significant (P � 0.05). (Figure adapted from Ansley etal. 2006b.) Copyright � 2006 Society for Range Management.From Rangeland Ecology and Management, by R.J. Ansley,M.J. Castellano, and W.E. Pinchak. Reprinted by permission ofAlliance Communications Group, a division of Allen Press, Inc.
fires (Owensby and Launchbaugh 1977). In South Af-rica, Everson et al. (1985) and Trollope (1987) indi-cated that recovery of C4 red grass (Themeda triandra)was significantly delayed by summer fire.
In summary, several studies have documented thatC4 midgrass and tallgrass species can survive summerfires and eventually fully recover from the disturbance.Recovery rates may be slower than what would occurfollowing winter fires, although empirical evidence forthis is not abundant.
Buffalograss (C4 Shortgrass)
In a recent study in North Texas (Ansley and Cas-tellano 2007b), buffalograss end-of-growing-seasontotal weight in the absence of grazing or clipping re-covered from both summer and winter fires the firstgrowing season post-fire and exceeded the no-fire con-trol by 3 y post-fire. Annual clipping once each springin addition to either the summer or winter fire treat-ments did not have a negative effect on buffalograssyields when measured 1 y after clipping. The only timewe have observed buffalograss to be negatively af-fected by summer fire was when it was exposed to 2summer fires in consecutive years (with no clippingtreatment). In this case, a community that was approx-
imately 60% buffalograss and 40% Texas wintergrassshifted to �90% Texas wintergrass (R.J. Ansley, un-published data).
Other studies have found variable responses ofbuffalograss to summer fires. Buffalograss increasedsignificantly following late-summer (September) fireson the Welder Wildlife Refuge in South Texas (Box etal. 1967). However, in New Mexico shortgrass prairie,summer fires reduced buffalograss cover from 5.7 to0.5% (Brockway et al. 2002).
Other C4 shortgrass species, such as blue grama(Bouteloua gracilis) and common curly-mesquite (Hilar-ia belangeri), appear tolerant of summer fires (Trlica andSchuster 1969, Mayeux and Hamilton 1988, Brockwayet al. 2002). In contrast, in Southwest desert grasslandsof New Mexico and Arizona, black grama (Boutelouaeriopoda) has been severely damaged by summer fireand may take up to 50 y to recover (Reynolds and Bohn-ing 1956, Cable 1965, Drewa and Havstad 2001).
In summary, few studies have examined the effectof summer fire on buffalograss or other C4 shortgrassspecies. However, the literature suggests that, with theexception of black grama, C4 shortgrass species in gen-eral appear to be tolerant of summer fires and recoveryrates are often more rapid than for C4 midgrass species.However, it must be emphasized that very few studieshave clearly documented this.
Texas Wintergrass (C3 Midgrass)
In a recent study in North Texas, there were nonegative long-term effects of winter or summer fireson Texas wintergrass total standing crop in the absenceof grazing or clipping (Ansley and Castellano 2007b).The additional stress of annual spring clipping reducedtotal weights in the winter fire treatment, but not thesummer fire or no-fire treatments when measured 1 ylater. Thus, clipping (to simulate grazing) in spring ex-acerbated the negative effects of winter fire, but notsummer fire.
Whisenant et al. (1984) found on one site in cen-tral Texas that Texas wintergrass standing crop wassignificantly reduced the first June following either alate-summer (September), winter (January), or late-winter (March) fire. By the second growing seasonpost-fire, there was no difference in standing crop be-tween fire and no-fire treatments. On a second site,Whisenant et al. (1984) found no differences in Texaswintergrass standing crop between the no-fire and thesame 3 fire treatments either the first June or secondgrowing season post-fire. In South Texas chaparral,Box and White (1969) found that Texas wintergrassherbage production was reduced to a greater degree bylate-summer fires than by winter fires. Engle et al.(1998) found that two late-summer fires in tallgrassprairie increased Texas wintergrass production by 40%compared with no-fire controls on both a shallow anda deep soil site in Oklahoma.
In summary, with the exception of the study byBox and White (1969), Texas wintergrass appeared tobe tolerant of summer fire with or without clipping tosimulate grazing. The only time fire negatively affect-
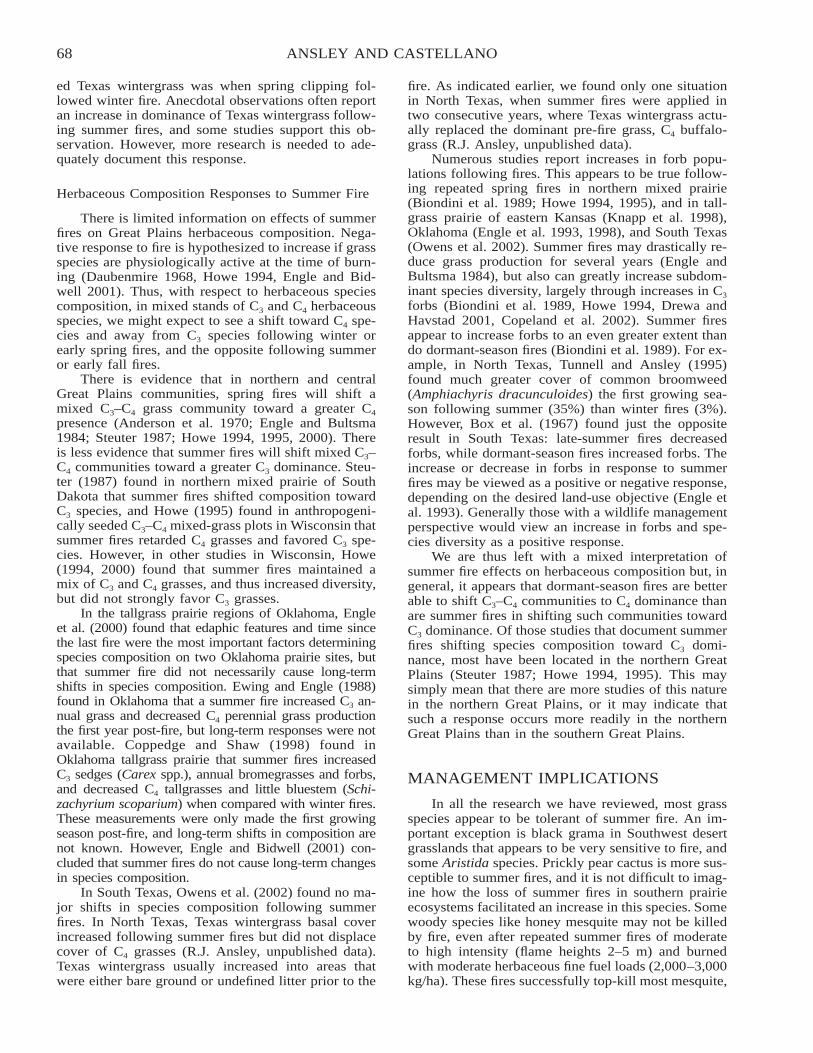
68 ANSLEY AND CASTELLANO
ed Texas wintergrass was when spring clipping fol-lowed winter fire. Anecdotal observations often reportan increase in dominance of Texas wintergrass follow-ing summer fires, and some studies support this ob-servation. However, more research is needed to ade-quately document this response.
Herbaceous Composition Responses to Summer Fire
There is limited information on effects of summerfires on Great Plains herbaceous composition. Nega-tive response to fire is hypothesized to increase if grassspecies are physiologically active at the time of burn-ing (Daubenmire 1968, Howe 1994, Engle and Bid-well 2001). Thus, with respect to herbaceous speciescomposition, in mixed stands of C3 and C4 herbaceousspecies, we might expect to see a shift toward C4 spe-cies and away from C3 species following winter orearly spring fires, and the opposite following summeror early fall fires.
There is evidence that in northern and centralGreat Plains communities, spring fires will shift amixed C3–C4 grass community toward a greater C4
presence (Anderson et al. 1970; Engle and Bultsma1984; Steuter 1987; Howe 1994, 1995, 2000). Thereis less evidence that summer fires will shift mixed C3–C4 communities toward a greater C3 dominance. Steu-ter (1987) found in northern mixed prairie of SouthDakota that summer fires shifted composition towardC3 species, and Howe (1995) found in anthropogeni-cally seeded C3–C4 mixed-grass plots in Wisconsin thatsummer fires retarded C4 grasses and favored C3 spe-cies. However, in other studies in Wisconsin, Howe(1994, 2000) found that summer fires maintained amix of C3 and C4 grasses, and thus increased diversity,but did not strongly favor C3 grasses.
In the tallgrass prairie regions of Oklahoma, Engleet al. (2000) found that edaphic features and time sincethe last fire were the most important factors determiningspecies composition on two Oklahoma prairie sites, butthat summer fire did not necessarily cause long-termshifts in species composition. Ewing and Engle (1988)found in Oklahoma that a summer fire increased C3 an-nual grass and decreased C4 perennial grass productionthe first year post-fire, but long-term responses were notavailable. Coppedge and Shaw (1998) found inOklahoma tallgrass prairie that summer fires increasedC3 sedges (Carex spp.), annual bromegrasses and forbs,and decreased C4 tallgrasses and little bluestem (Schi-zachyrium scoparium) when compared with winter fires.These measurements were only made the first growingseason post-fire, and long-term shifts in composition arenot known. However, Engle and Bidwell (2001) con-cluded that summer fires do not cause long-term changesin species composition.
In South Texas, Owens et al. (2002) found no ma-jor shifts in species composition following summerfires. In North Texas, Texas wintergrass basal coverincreased following summer fires but did not displacecover of C4 grasses (R.J. Ansley, unpublished data).Texas wintergrass usually increased into areas thatwere either bare ground or undefined litter prior to the
fire. As indicated earlier, we found only one situationin North Texas, when summer fires were applied intwo consecutive years, where Texas wintergrass actu-ally replaced the dominant pre-fire grass, C4 buffalo-grass (R.J. Ansley, unpublished data).
Numerous studies report increases in forb popu-lations following fires. This appears to be true follow-ing repeated spring fires in northern mixed prairie(Biondini et al. 1989; Howe 1994, 1995), and in tall-grass prairie of eastern Kansas (Knapp et al. 1998),Oklahoma (Engle et al. 1993, 1998), and South Texas(Owens et al. 2002). Summer fires may drastically re-duce grass production for several years (Engle andBultsma 1984), but also can greatly increase subdom-inant species diversity, largely through increases in C3
forbs (Biondini et al. 1989, Howe 1994, Drewa andHavstad 2001, Copeland et al. 2002). Summer firesappear to increase forbs to an even greater extent thando dormant-season fires (Biondini et al. 1989). For ex-ample, in North Texas, Tunnell and Ansley (1995)found much greater cover of common broomweed(Amphiachyris dracunculoides) the first growing sea-son following summer (35%) than winter fires (3%).However, Box et al. (1967) found just the oppositeresult in South Texas: late-summer fires decreasedforbs, while dormant-season fires increased forbs. Theincrease or decrease in forbs in response to summerfires may be viewed as a positive or negative response,depending on the desired land-use objective (Engle etal. 1993). Generally those with a wildlife managementperspective would view an increase in forbs and spe-cies diversity as a positive response.
We are thus left with a mixed interpretation ofsummer fire effects on herbaceous composition but, ingeneral, it appears that dormant-season fires are betterable to shift C3–C4 communities to C4 dominance thanare summer fires in shifting such communities towardC3 dominance. Of those studies that document summerfires shifting species composition toward C3 domi-nance, most have been located in the northern GreatPlains (Steuter 1987; Howe 1994, 1995). This maysimply mean that there are more studies of this naturein the northern Great Plains, or it may indicate thatsuch a response occurs more readily in the northernGreat Plains than in the southern Great Plains.
MANAGEMENT IMPLICATIONS
In all the research we have reviewed, most grassspecies appear to be tolerant of summer fire. An im-portant exception is black grama in Southwest desertgrasslands that appears to be very sensitive to fire, andsome Aristida species. Prickly pear cactus is more sus-ceptible to summer fires, and it is not difficult to imag-ine how the loss of summer fires in southern prairieecosystems facilitated an increase in this species. Somewoody species like honey mesquite may not be killedby fire, even after repeated summer fires of moderateto high intensity (flame heights 2–5 m) and burnedwith moderate herbaceous fine fuel loads (2,000–3,000kg/ha). These fires successfully top-kill most mesquite,
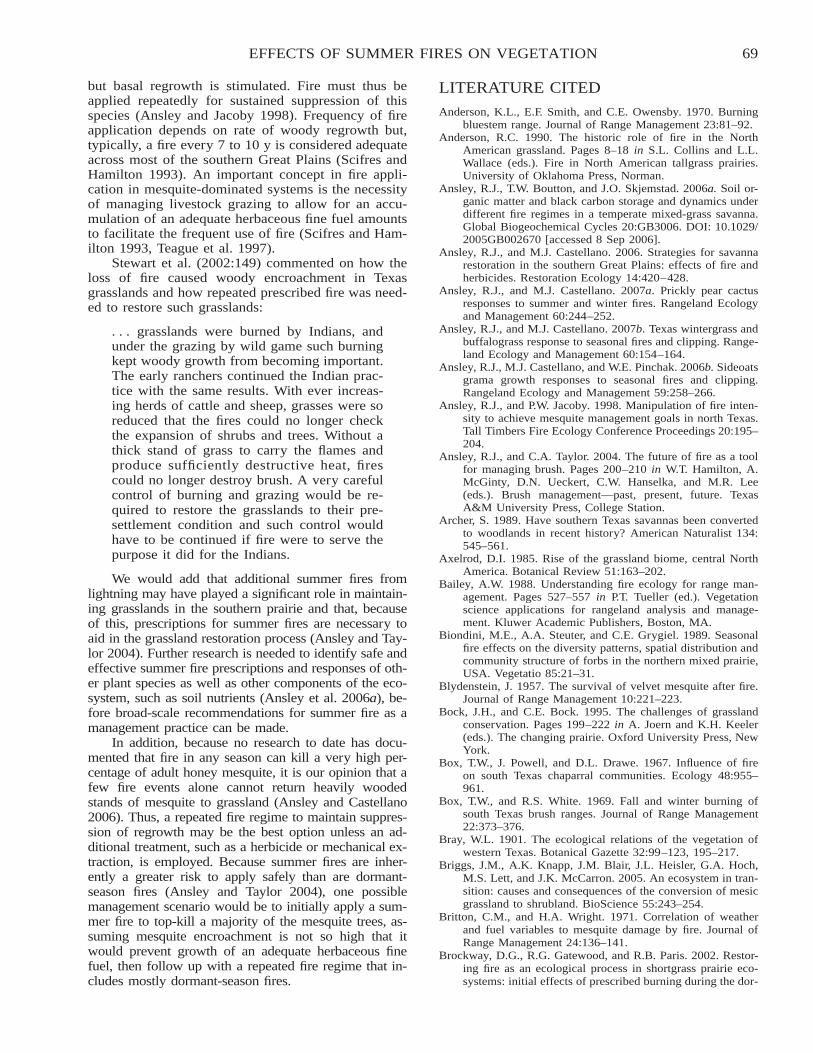
69EFFECTS OF SUMMER FIRES ON VEGETATION
but basal regrowth is stimulated. Fire must thus beapplied repeatedly for sustained suppression of thisspecies (Ansley and Jacoby 1998). Frequency of fireapplication depends on rate of woody regrowth but,typically, a fire every 7 to 10 y is considered adequateacross most of the southern Great Plains (Scifres andHamilton 1993). An important concept in fire appli-cation in mesquite-dominated systems is the necessityof managing livestock grazing to allow for an accu-mulation of an adequate herbaceous fine fuel amountsto facilitate the frequent use of fire (Scifres and Ham-ilton 1993, Teague et al. 1997).
Stewart et al. (2002:149) commented on how theloss of fire caused woody encroachment in Texasgrasslands and how repeated prescribed fire was need-ed to restore such grasslands:
. . . grasslands were burned by Indians, andunder the grazing by wild game such burningkept woody growth from becoming important.The early ranchers continued the Indian prac-tice with the same results. With ever increas-ing herds of cattle and sheep, grasses were soreduced that the fires could no longer checkthe expansion of shrubs and trees. Without athick stand of grass to carry the flames andproduce sufficiently destructive heat, firescould no longer destroy brush. A very carefulcontrol of burning and grazing would be re-quired to restore the grasslands to their pre-settlement condition and such control wouldhave to be continued if fire were to serve thepurpose it did for the Indians.
We would add that additional summer fires fromlightning may have played a significant role in maintain-ing grasslands in the southern prairie and that, becauseof this, prescriptions for summer fires are necessary toaid in the grassland restoration process (Ansley and Tay-lor 2004). Further research is needed to identify safe andeffective summer fire prescriptions and responses of oth-er plant species as well as other components of the eco-system, such as soil nutrients (Ansley et al. 2006a), be-fore broad-scale recommendations for summer fire as amanagement practice can be made.
In addition, because no research to date has docu-mented that fire in any season can kill a very high per-centage of adult honey mesquite, it is our opinion that afew fire events alone cannot return heavily woodedstands of mesquite to grassland (Ansley and Castellano2006). Thus, a repeated fire regime to maintain suppres-sion of regrowth may be the best option unless an ad-ditional treatment, such as a herbicide or mechanical ex-traction, is employed. Because summer fires are inher-ently a greater risk to apply safely than are dormant-season fires (Ansley and Taylor 2004), one possiblemanagement scenario would be to initially apply a sum-mer fire to top-kill a majority of the mesquite trees, as-suming mesquite encroachment is not so high that itwould prevent growth of an adequate herbaceous finefuel, then follow up with a repeated fire regime that in-cludes mostly dormant-season fires.
LITERATURE CITED
Anderson, K.L., E.F. Smith, and C.E. Owensby. 1970. Burningbluestem range. Journal of Range Management 23:81–92.
Anderson, R.C. 1990. The historic role of fire in the NorthAmerican grassland. Pages 8–18 in S.L. Collins and L.L.Wallace (eds.). Fire in North American tallgrass prairies.University of Oklahoma Press, Norman.
Ansley, R.J., T.W. Boutton, and J.O. Skjemstad. 2006a. Soil or-ganic matter and black carbon storage and dynamics underdifferent fire regimes in a temperate mixed-grass savanna.Global Biogeochemical Cycles 20:GB3006. DOI: 10.1029/2005GB002670 [accessed 8 Sep 2006].
Ansley, R.J., and M.J. Castellano. 2006. Strategies for savannarestoration in the southern Great Plains: effects of fire andherbicides. Restoration Ecology 14:420–428.
Ansley, R.J., and M.J. Castellano. 2007a. Prickly pear cactusresponses to summer and winter fires. Rangeland Ecologyand Management 60:244–252.
Ansley, R.J., and M.J. Castellano. 2007b. Texas wintergrass andbuffalograss response to seasonal fires and clipping. Range-land Ecology and Management 60:154–164.
Ansley, R.J., M.J. Castellano, and W.E. Pinchak. 2006b. Sideoatsgrama growth responses to seasonal fires and clipping.Rangeland Ecology and Management 59:258–266.
Ansley, R.J., and P.W. Jacoby. 1998. Manipulation of fire inten-sity to achieve mesquite management goals in north Texas.Tall Timbers Fire Ecology Conference Proceedings 20:195–204.
Ansley, R.J., and C.A. Taylor. 2004. The future of fire as a toolfor managing brush. Pages 200–210 in W.T. Hamilton, A.McGinty, D.N. Ueckert, C.W. Hanselka, and M.R. Lee(eds.). Brush management—past, present, future. TexasA&M University Press, College Station.
Archer, S. 1989. Have southern Texas savannas been convertedto woodlands in recent history? American Naturalist 134:545–561.
Axelrod, D.I. 1985. Rise of the grassland biome, central NorthAmerica. Botanical Review 51:163–202.
Bailey, A.W. 1988. Understanding fire ecology for range man-agement. Pages 527–557 in P.T. Tueller (ed.). Vegetationscience applications for rangeland analysis and manage-ment. Kluwer Academic Publishers, Boston, MA.
Biondini, M.E., A.A. Steuter, and C.E. Grygiel. 1989. Seasonalfire effects on the diversity patterns, spatial distribution andcommunity structure of forbs in the northern mixed prairie,USA. Vegetatio 85:21–31.
Blydenstein, J. 1957. The survival of velvet mesquite after fire.Journal of Range Management 10:221–223.
Bock, J.H., and C.E. Bock. 1995. The challenges of grasslandconservation. Pages 199–222 in A. Joern and K.H. Keeler(eds.). The changing prairie. Oxford University Press, NewYork.
Box, T.W., J. Powell, and D.L. Drawe. 1967. Influence of fireon south Texas chaparral communities. Ecology 48:955–961.
Box, T.W., and R.S. White. 1969. Fall and winter burning ofsouth Texas brush ranges. Journal of Range Management22:373–376.
Bray, W.L. 1901. The ecological relations of the vegetation ofwestern Texas. Botanical Gazette 32:99–123, 195–217.
Briggs, J.M., A.K. Knapp, J.M. Blair, J.L. Heisler, G.A. Hoch,M.S. Lett, and J.K. McCarron. 2005. An ecosystem in tran-sition: causes and consequences of the conversion of mesicgrassland to shrubland. BioScience 55:243–254.
Britton, C.M., and H.A. Wright. 1971. Correlation of weatherand fuel variables to mesquite damage by fire. Journal ofRange Management 24:136–141.
Brockway, D.G., R.G. Gatewood, and R.B. Paris. 2002. Restor-ing fire as an ecological process in shortgrass prairie eco-systems: initial effects of prescribed burning during the dor-
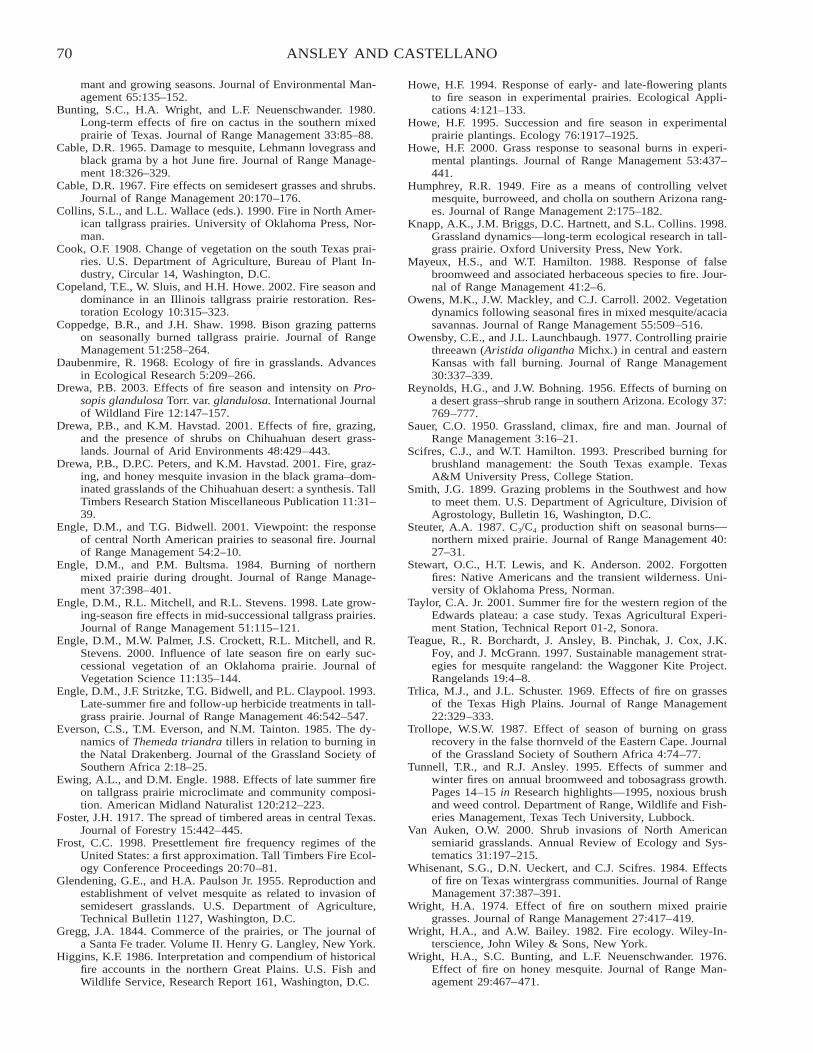
70 ANSLEY AND CASTELLANO
mant and growing seasons. Journal of Environmental Man-agement 65:135–152.
Bunting, S.C., H.A. Wright, and L.F. Neuenschwander. 1980.Long-term effects of fire on cactus in the southern mixedprairie of Texas. Journal of Range Management 33:85–88.
Cable, D.R. 1965. Damage to mesquite, Lehmann lovegrass andblack grama by a hot June fire. Journal of Range Manage-ment 18:326–329.
Cable, D.R. 1967. Fire effects on semidesert grasses and shrubs.Journal of Range Management 20:170–176.
Collins, S.L., and L.L. Wallace (eds.). 1990. Fire in North Amer-ican tallgrass prairies. University of Oklahoma Press, Nor-man.
Cook, O.F. 1908. Change of vegetation on the south Texas prai-ries. U.S. Department of Agriculture, Bureau of Plant In-dustry, Circular 14, Washington, D.C.
Copeland, T.E., W. Sluis, and H.H. Howe. 2002. Fire season anddominance in an Illinois tallgrass prairie restoration. Res-toration Ecology 10:315–323.
Coppedge, B.R., and J.H. Shaw. 1998. Bison grazing patternson seasonally burned tallgrass prairie. Journal of RangeManagement 51:258–264.
Daubenmire, R. 1968. Ecology of fire in grasslands. Advancesin Ecological Research 5:209–266.
Drewa, P.B. 2003. Effects of fire season and intensity on Pro-sopis glandulosa Torr. var. glandulosa. International Journalof Wildland Fire 12:147–157.
Drewa, P.B., and K.M. Havstad. 2001. Effects of fire, grazing,and the presence of shrubs on Chihuahuan desert grass-lands. Journal of Arid Environments 48:429–443.
Drewa, P.B., D.P.C. Peters, and K.M. Havstad. 2001. Fire, graz-ing, and honey mesquite invasion in the black grama–dom-inated grasslands of the Chihuahuan desert: a synthesis. TallTimbers Research Station Miscellaneous Publication 11:31–39.
Engle, D.M., and T.G. Bidwell. 2001. Viewpoint: the responseof central North American prairies to seasonal fire. Journalof Range Management 54:2–10.
Engle, D.M., and P.M. Bultsma. 1984. Burning of northernmixed prairie during drought. Journal of Range Manage-ment 37:398–401.
Engle, D.M., R.L. Mitchell, and R.L. Stevens. 1998. Late grow-ing-season fire effects in mid-successional tallgrass prairies.Journal of Range Management 51:115–121.
Engle, D.M., M.W. Palmer, J.S. Crockett, R.L. Mitchell, and R.Stevens. 2000. Influence of late season fire on early suc-cessional vegetation of an Oklahoma prairie. Journal ofVegetation Science 11:135–144.
Engle, D.M., J.F. Stritzke, T.G. Bidwell, and P.L. Claypool. 1993.Late-summer fire and follow-up herbicide treatments in tall-grass prairie. Journal of Range Management 46:542–547.
Everson, C.S., T.M. Everson, and N.M. Tainton. 1985. The dy-namics of Themeda triandra tillers in relation to burning inthe Natal Drakenberg. Journal of the Grassland Society ofSouthern Africa 2:18–25.
Ewing, A.L., and D.M. Engle. 1988. Effects of late summer fireon tallgrass prairie microclimate and community composi-tion. American Midland Naturalist 120:212–223.
Foster, J.H. 1917. The spread of timbered areas in central Texas.Journal of Forestry 15:442–445.
Frost, C.C. 1998. Presettlement fire frequency regimes of theUnited States: a first approximation. Tall Timbers Fire Ecol-ogy Conference Proceedings 20:70–81.
Glendening, G.E., and H.A. Paulson Jr. 1955. Reproduction andestablishment of velvet mesquite as related to invasion ofsemidesert grasslands. U.S. Department of Agriculture,Technical Bulletin 1127, Washington, D.C.
Gregg, J.A. 1844. Commerce of the prairies, or The journal ofa Santa Fe trader. Volume II. Henry G. Langley, New York.
Higgins, K.F. 1986. Interpretation and compendium of historicalfire accounts in the northern Great Plains. U.S. Fish andWildlife Service, Research Report 161, Washington, D.C.
Howe, H.F. 1994. Response of early- and late-flowering plantsto fire season in experimental prairies. Ecological Appli-cations 4:121–133.
Howe, H.F. 1995. Succession and fire season in experimentalprairie plantings. Ecology 76:1917–1925.
Howe, H.F. 2000. Grass response to seasonal burns in experi-mental plantings. Journal of Range Management 53:437–441.
Humphrey, R.R. 1949. Fire as a means of controlling velvetmesquite, burroweed, and cholla on southern Arizona rang-es. Journal of Range Management 2:175–182.
Knapp, A.K., J.M. Briggs, D.C. Hartnett, and S.L. Collins. 1998.Grassland dynamics—long-term ecological research in tall-grass prairie. Oxford University Press, New York.
Mayeux, H.S., and W.T. Hamilton. 1988. Response of falsebroomweed and associated herbaceous species to fire. Jour-nal of Range Management 41:2–6.
Owens, M.K., J.W. Mackley, and C.J. Carroll. 2002. Vegetationdynamics following seasonal fires in mixed mesquite/acaciasavannas. Journal of Range Management 55:509–516.
Owensby, C.E., and J.L. Launchbaugh. 1977. Controlling prairiethreeawn (Aristida oligantha Michx.) in central and easternKansas with fall burning. Journal of Range Management30:337–339.
Reynolds, H.G., and J.W. Bohning. 1956. Effects of burning ona desert grass–shrub range in southern Arizona. Ecology 37:769–777.
Sauer, C.O. 1950. Grassland, climax, fire and man. Journal ofRange Management 3:16–21.
Scifres, C.J., and W.T. Hamilton. 1993. Prescribed burning forbrushland management: the South Texas example. TexasA&M University Press, College Station.
Smith, J.G. 1899. Grazing problems in the Southwest and howto meet them. U.S. Department of Agriculture, Division ofAgrostology, Bulletin 16, Washington, D.C.
Steuter, A.A. 1987. C3/C4 production shift on seasonal burns—northern mixed prairie. Journal of Range Management 40:27–31.
Stewart, O.C., H.T. Lewis, and K. Anderson. 2002. Forgottenfires: Native Americans and the transient wilderness. Uni-versity of Oklahoma Press, Norman.
Taylor, C.A. Jr. 2001. Summer fire for the western region of theEdwards plateau: a case study. Texas Agricultural Experi-ment Station, Technical Report 01-2, Sonora.
Teague, R., R. Borchardt, J. Ansley, B. Pinchak, J. Cox, J.K.Foy, and J. McGrann. 1997. Sustainable management strat-egies for mesquite rangeland: the Waggoner Kite Project.Rangelands 19:4–8.
Trlica, M.J., and J.L. Schuster. 1969. Effects of fire on grassesof the Texas High Plains. Journal of Range Management22:329–333.
Trollope, W.S.W. 1987. Effect of season of burning on grassrecovery in the false thornveld of the Eastern Cape. Journalof the Grassland Society of Southern Africa 4:74–77.
Tunnell, T.R., and R.J. Ansley. 1995. Effects of summer andwinter fires on annual broomweed and tobosagrass growth.Pages 14–15 in Research highlights—1995, noxious brushand weed control. Department of Range, Wildlife and Fish-eries Management, Texas Tech University, Lubbock.
Van Auken, O.W. 2000. Shrub invasions of North Americansemiarid grasslands. Annual Review of Ecology and Sys-tematics 31:197–215.
Whisenant, S.G., D.N. Ueckert, and C.J. Scifres. 1984. Effectsof fire on Texas wintergrass communities. Journal of RangeManagement 37:387–391.
Wright, H.A. 1974. Effect of fire on southern mixed prairiegrasses. Journal of Range Management 27:417–419.
Wright, H.A., and A.W. Bailey. 1982. Fire ecology. Wiley-In-terscience, John Wiley & Sons, New York.
Wright, H.A., S.C. Bunting, and L.F. Neuenschwander. 1976.Effect of fire on honey mesquite. Journal of Range Man-agement 29:467–471.

71
EFFECTS OF DORMANT-SEASON FIRE AT THREE DIFFERENTFIRE FREQUENCIES IN SHORTGRASS STEPPE OF THE
SOUTHERN GREAT PLAINS
Paulette L. FordUSDA Forest Service, Rocky Mountain Research Station, 333 Broadway Street, Suite 115, Albuquerque, NM 87102, USA
Carleton S. WhiteUniversity of New Mexico, Department of Biology, Albuquerque, NM 87131, USA
ABSTRACT
Prior to proceeding with large-scale fire reintroduction as a grassland management option, appropriate fire frequencies need to bedetermined. This research experimentally tested the effects of dormant-season fire on ground cover and on plant and soil nutrientcycling in shortgrass steppe at three different fire frequencies. The objective was to determine if fire return interval had detrimentaleffects on soil fertility and perennial grass cover relative to untreated grassland. This study is part of a long-term, 18-y study examiningthe effects of fire at return intervals of 3, 6, and 9 y. The study is located in the southern Great Plains of northeastern New Mexico(lat 36�31�20�N, long 103�3�30�W). The 160-ha site has mostly native vegetation, with the sod-forming Buchloe dactyloides and thebunchgrass Bouteloua gracilis being the dominant plant cover. The experimental design was completely randomized with four treat-ments and five replicate 2-ha plots per treatment. Treatments were fire return intervals of 3 y (3D) burned three times, 6 y (6D) burnedtwice, 9 y (9D) burned once, and unburned (U) plots. Treatments were applied in April 1997, 2000, and 2004. Vegetation and soilsamples and ground-cover measurements were taken in October 2004. Response variables included percent litter, bare ground and liveperennial grass cover, soil organic matter content and potentially mineralizable nitrogen, and Bouteloua gracilis nutrient content. Sixmonths after fire treatments, there were no significant differences in perennial grass cover among treatments. However, litter cover wassignificantly reduced by increased burn frequencies (P � 0.05) from highest to lowest, as follows: U, 9D, 6D, and 3D. Conversely,bare ground increased with increased burn frequencies (P � 0.05) from lowest to highest, as follows: U, 9D, 6D, and 3D. Burnfrequency had no significant effect on soil organic matter and nutrient availability. There were no significant differences in Boutelouagracilis nutrient content, but there was a trend toward a higher percentage of nitrogen with more frequent burns. All fire frequenciesproduced minimal changes in grass cover and nutrient content and soil fertility. However, shorter fire return intervals may increasebare soil and erosion potential.
Citation: Ford, P.L., and C.S. White. 2007. Effects of dormant-season fire at three different fire frequencies in shortgrass steppe of thesouthern Great Plains [abstract]. Page 71 in R.E. Masters and K.E.M. Galley (eds.). Proceedings of the 23rd Tall Timbers Fire EcologyConference: Fire in Grassland and Shrubland Ecosystems. Tall Timbers Research Station, Tallahassee, Florida, USA.

72
FIRE ECOLOGY OF WOODY PLANT POPULATIONS INUNGRAZED TALLGRASS PRAIRIE: EFFECTS OF SEASON OF
FIRE ON DEMOGRAPHY, ABUNDANCE, AND REGENERATION
Kristy M. Hajny, David Hartnett, Gail Wilson, Ben Vanderweide, and Krysta HougenKansas State University, Division of Biology, Manhattan, KS 66506, USA
ABSTRACT
Reductions in fire frequency and changing land use and management have enabled woody plant species to increase in grasslandsworldwide. Nevertheless, fire is seldom eliminated from grasslands and the survival of woody shrubs depends on their fire-resistancetraits and their ability to tolerate fire through regeneration from basal and aerial meristems. We assessed how season of fire affectedgrowth, stem densities, and mortality rates of Jersey tea (Ceanothus herbaceus) and smooth sumac (Rhus glabra), two common shrubsof North American grasslands, in ungrazed sites. Additionally, we measured relative frequency and cover at various topographicalpositions on watersheds seasonally burned for 12 y, long-term unburned sites, and sites burned every 4 y. Although, spring, fall, andwinter fires resulted in 100% stem mortality, fire stimulated increased basal resprouting, resulting in positive stem population growthrates. By contrast, populations in unburned and summer-burned sites showed lower mortality rates, both basal and aerial resprouting,but lower resprouting rates and lower population growth rates. Stem densities in spring-, fall-, and winter-burned sites increasedsignificantly during the early growing season, but declined thereafter. Unburned areas did not show any change, while summer-burnedpopulations showed continually decreasing stem densities. Therefore, our preliminary data suggest that summer burning may be amore effective management tool in reducing shrub densities and population growth rates in grasslands than spring burning, the mostcommon management practice in the Flint Hills region. However, summer watersheds are only burned every 2 y because of insufficientfuel loads and these data may not show a full oscillation of stem-density dynamics. Genet (clone) populations were characterized bystable densities and low flux, whereas intraclonal ramet (stem) densities showed high turnover rates with fire, suggesting that frequentfire strongly influences the demography but not the genetic structure of clonal shrub populations.
Citation: Hajny, K.M., D. Hartnett, G. Wilson, B. Vanderweide, and K. Hougen. 2007. Fire ecology of woody plant populations inungrazed tallgrass prairie: effects of season of fire on demography, abundance, and regeneration [abstract]. Page 72 in R.E. Mastersand K.E.M. Galley (eds.). Proceedings of the 23rd Tall Timbers Fire Ecology Conference: Fire in Grassland and Shrubland Ecosystems.Tall Timbers Research Station, Tallahassee, Florida, USA.

73
RESTORING BARRENS SHRUBLANDS: DECREASING FIREHAZARD AND IMPROVING RARE PLANT HABITAT
William A. Patterson III1 and Gretel L. Clarke2
University of Massachusetts, Department of Natural Resources Conservation, 214 Holdsworth Natural Resources Center,Amherst, MA 01003, USA
ABSTRACT
The coastal sandplain of southeastern New England is characterized by a complex of xeric, fire-prone shrubland and open woodlandcommunities. Also known as barrens, these landscapes supported frequent fires until recently when suppression efforts became effective.Currently, shrubland components are increasingly being lost through succession to closed woodlands. Within our study area—theManuel F. Correllus State Forest (MFCSF) on the island of Martha’s Vineyard—heathlands and scrub oak (bear oak [Quercus ilicifolia]and dwarf chinkapin oak [Q. prinoides]) shrublands are declining while oak (Quercus spp.) woodlands (and less frequently pitch pine[Pinus rigida] forests) increase in area.
The MFCSF, with 11 rare plant species, has one of the highest concentrations of rare plants in the coastal region. Our goal wasto determine if management (including thinning, brushcutting, grazing, pile burning, and broadcast prescribed burning) can be usedboth to reduce fire hazard and create rare plant habitat. Species composition was largely unchanged by treatments, as many speciesresprouted. However, following fuel treatments, new occurrences of two rare species and several grassland-associated species werefound where bare soil was created. Grassland associates colonized plots with lower duff depths and greater lichen cover than plotslacking these species. Grazing increased establishment of nonnative species, although most did not persist past the first growing season.
Treatments reduced fine (1- and 10-h time lag) fuel loads �50% from averages of 32 t/ha and 23 t/ha in scrub oak and pitchpine, respectively. In scrub oak, treatments reduced shrub fuel depths �75% (from 1.3 to 0.3 m). In untreated plots (under moderatemidflame wind speeds of 5.8 km/h and humidities of 65%), rates of spread of research burns were �4.6 m/min and flame lengthswere �2 m. Under similar burning conditions in treated plots, flame lengths were �0.6 m and rates of spread �2.1 m/min. Initialresults suggest that treatments created rare plant habitat and reduced fire hazard without adversely impacting native shrub communities.
keywords: Atlantic Coastal Plain, barrens, fire hazard, fire intensity, fuel loads, fuel management, Massachusetts, rare plants, shrublands.
Citation: Patterson, W.A. III, and G.L. Clarke. 2007. Restoring barrens shrublands: decreasing fire hazard and improving rare planthabitat. Pages 73–82 in R.E. Masters and K.E.M. Galley (eds.). Proceedings of the 23rd Tall Timbers Fire Ecology Conference: Firein Grassland and Shrubland Ecosystems. Tall Timbers Research Station, Tallahassee, Florida, USA.
INTRODUCTION
In the northeastern United States, open, early seralcommunities are rare and declining in size and number(Noss et al. 1995, Motzkin and Foster 2002). Mostoccur in sandplains with level topography and coarse-textured soils. They support a variety of plant com-munities, including grasslands, heathlands, shrublands,oak (Quercus spp.) savannas, and pitch pine (Pinusrigida)–scrub oak (bear oak [Quercus ilicifolia] anddwarf chinkapin oak [Q. prinoides]) barrens (Gold-stein 1997). Sandplain soils, for the most part derivedfrom outwash left by retreating ice of the Wisconsinglacial stage, are well drained and nutrient poor. Theunique physical and phytosociological characteristicsof sandplains combine to create ecosystems that areglobally rare. Often referred to as barrens, they pro-vide habitat for numerous rare plant and animal spe-cies, making them the focus of conservation efforts(Noss et al. 1995, Barbour et al. 1998, MassachusettsNatural Heritage and Endangered Species Program2001, Wagner et al. 2003).
Barrens vegetation produces abundant, flammable
1 Corresponding author ([email protected]).2 Current address: Archbold Biological Station, P.O. Box 2057,Lake Placid, FL 33862, USA.
fuel that decomposes slowly, creating the potential forintense wildfires. Sandplains are preferred sites forhousing and light industry, which increases the needfor fuels management to reduce wildfire threat to hu-man resources. Fuel breaks (areas with reduced fuels)have been created and maintained at barrens sites inMassachusetts, using a variety of techniques includingthinning, mowing, grazing, plowing, and, to a limitedextent, prescribed burning. In some areas, such as theManuel F. Correllus State Forest on the island of Mar-tha’s Vineyard, these fuel breaks are dominated bygrassland vegetation and currently support populationsof state-listed rare plants. However some considerthese fuel breaks to be unnatural because of the plow-ing and mowing required for their creation and main-tenance. Alternative management practices that do notcreate grasslands might be used to reduce fuels andmaintain open sandplain habitats more typical of nat-ural conditions (Foster and Motzkin 1999).
In 2002, we began a 3-y study of alternative meth-ods for fuel break maintenance and expansion, includ-ing overstory thinning, understory mowing and graz-ing, and prescribed burning (Patterson et al. 2005). Todetermine the effects of different management optionson rare plant habitat and to demonstrate the extent towhich alternative management techniques affect fuelbeds and fire behavior in the three major sandplain
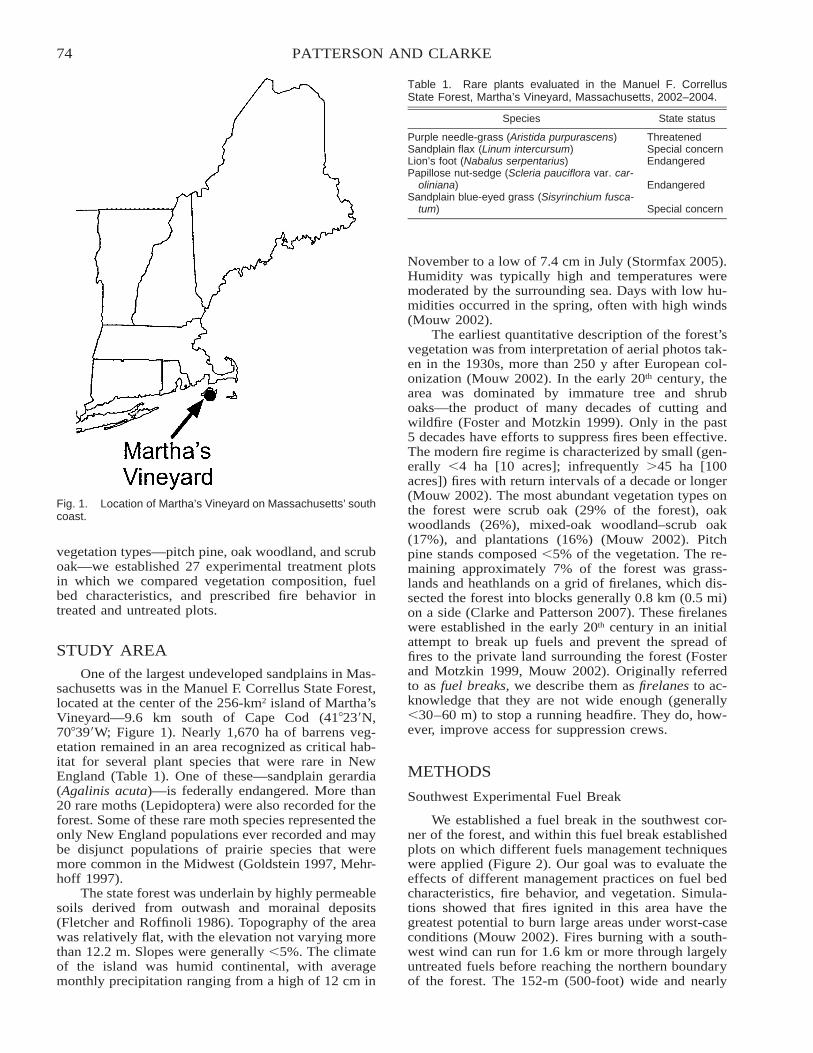
74 PATTERSON AND CLARKE
Fig. 1. Location of Martha’s Vineyard on Massachusetts’ southcoast.
Table 1. Rare plants evaluated in the Manuel F. CorrellusState Forest, Martha’s Vineyard, Massachusetts, 2002–2004.
Species State status
Purple needle-grass (Aristida purpurascens) ThreatenedSandplain flax (Linum intercursum) Special concernLion’s foot (Nabalus serpentarius) EndangeredPapillose nut-sedge (Scleria pauciflora var. car-
oliniana) EndangeredSandplain blue-eyed grass (Sisyrinchium fusca-
tum) Special concern
vegetation types—pitch pine, oak woodland, and scruboak—we established 27 experimental treatment plotsin which we compared vegetation composition, fuelbed characteristics, and prescribed fire behavior intreated and untreated plots.
STUDY AREA
One of the largest undeveloped sandplains in Mas-sachusetts was in the Manuel F. Correllus State Forest,located at the center of the 256-km2 island of Martha’sVineyard—9.6 km south of Cape Cod (41�23�N,70�39�W; Figure 1). Nearly 1,670 ha of barrens veg-etation remained in an area recognized as critical hab-itat for several plant species that were rare in NewEngland (Table 1). One of these—sandplain gerardia(Agalinis acuta)—is federally endangered. More than20 rare moths (Lepidoptera) were also recorded for theforest. Some of these rare moth species represented theonly New England populations ever recorded and maybe disjunct populations of prairie species that weremore common in the Midwest (Goldstein 1997, Mehr-hoff 1997).
The state forest was underlain by highly permeablesoils derived from outwash and morainal deposits(Fletcher and Roffinoli 1986). Topography of the areawas relatively flat, with the elevation not varying morethan 12.2 m. Slopes were generally �5%. The climateof the island was humid continental, with averagemonthly precipitation ranging from a high of 12 cm in
November to a low of 7.4 cm in July (Stormfax 2005).Humidity was typically high and temperatures weremoderated by the surrounding sea. Days with low hu-midities occurred in the spring, often with high winds(Mouw 2002).
The earliest quantitative description of the forest’svegetation was from interpretation of aerial photos tak-en in the 1930s, more than 250 y after European col-onization (Mouw 2002). In the early 20th century, thearea was dominated by immature tree and shruboaks—the product of many decades of cutting andwildfire (Foster and Motzkin 1999). Only in the past5 decades have efforts to suppress fires been effective.The modern fire regime is characterized by small (gen-erally �4 ha [10 acres]; infrequently �45 ha [100acres]) fires with return intervals of a decade or longer(Mouw 2002). The most abundant vegetation types onthe forest were scrub oak (29% of the forest), oakwoodlands (26%), mixed-oak woodland–scrub oak(17%), and plantations (16%) (Mouw 2002). Pitchpine stands composed �5% of the vegetation. The re-maining approximately 7% of the forest was grass-lands and heathlands on a grid of firelanes, which dis-sected the forest into blocks generally 0.8 km (0.5 mi)on a side (Clarke and Patterson 2007). These firelaneswere established in the early 20th century in an initialattempt to break up fuels and prevent the spread offires to the private land surrounding the forest (Fosterand Motzkin 1999, Mouw 2002). Originally referredto as fuel breaks, we describe them as firelanes to ac-knowledge that they are not wide enough (generally�30–60 m) to stop a running headfire. They do, how-ever, improve access for suppression crews.
METHODS
Southwest Experimental Fuel Break
We established a fuel break in the southwest cor-ner of the forest, and within this fuel break establishedplots on which different fuels management techniqueswere applied (Figure 2). Our goal was to evaluate theeffects of different management practices on fuel bedcharacteristics, fire behavior, and vegetation. Simula-tions showed that fires ignited in this area have thegreatest potential to burn large areas under worst-caseconditions (Mouw 2002). Fires burning with a south-west wind can run for 1.6 km or more through largelyuntreated fuels before reaching the northern boundaryof the forest. The 152-m (500-foot) wide and nearly
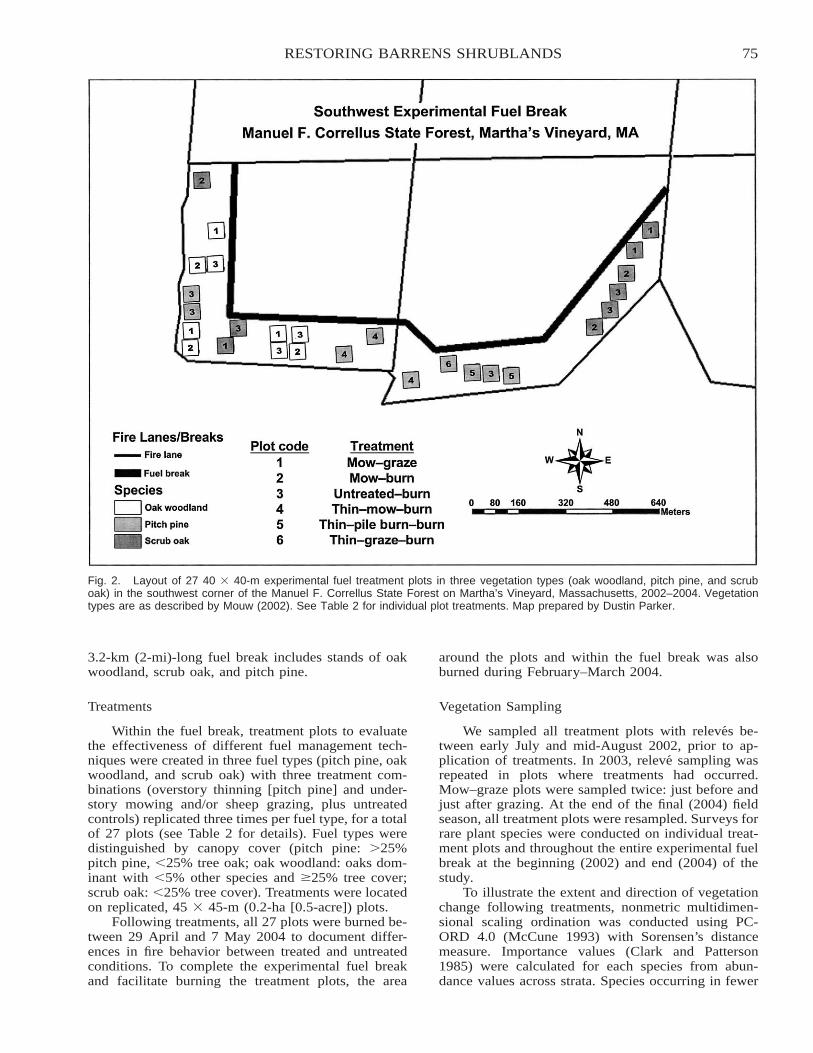
75RESTORING BARRENS SHRUBLANDS
Fig. 2. Layout of 27 40 � 40-m experimental fuel treatment plots in three vegetation types (oak woodland, pitch pine, and scruboak) in the southwest corner of the Manuel F. Correllus State Forest on Martha’s Vineyard, Massachusetts, 2002–2004. Vegetationtypes are as described by Mouw (2002). See Table 2 for individual plot treatments. Map prepared by Dustin Parker.
3.2-km (2-mi)-long fuel break includes stands of oakwoodland, scrub oak, and pitch pine.
Treatments
Within the fuel break, treatment plots to evaluatethe effectiveness of different fuel management tech-niques were created in three fuel types (pitch pine, oakwoodland, and scrub oak) with three treatment com-binations (overstory thinning [pitch pine] and under-story mowing and/or sheep grazing, plus untreatedcontrols) replicated three times per fuel type, for a totalof 27 plots (see Table 2 for details). Fuel types weredistinguished by canopy cover (pitch pine: �25%pitch pine, �25% tree oak; oak woodland: oaks dom-inant with �5% other species and �25% tree cover;scrub oak: �25% tree cover). Treatments were locatedon replicated, 45 � 45-m (0.2-ha [0.5-acre]) plots.
Following treatments, all 27 plots were burned be-tween 29 April and 7 May 2004 to document differ-ences in fire behavior between treated and untreatedconditions. To complete the experimental fuel breakand facilitate burning the treatment plots, the area
around the plots and within the fuel break was alsoburned during February–March 2004.
Vegetation Sampling
We sampled all treatment plots with releves be-tween early July and mid-August 2002, prior to ap-plication of treatments. In 2003, releve sampling wasrepeated in plots where treatments had occurred.Mow–graze plots were sampled twice: just before andjust after grazing. At the end of the final (2004) fieldseason, all treatment plots were resampled. Surveys forrare plant species were conducted on individual treat-ment plots and throughout the entire experimental fuelbreak at the beginning (2002) and end (2004) of thestudy.
To illustrate the extent and direction of vegetationchange following treatments, nonmetric multidimen-sional scaling ordination was conducted using PC-ORD 4.0 (McCune 1993) with Sorensen’s distancemeasure. Importance values (Clark and Patterson1985) were calculated for each species from abun-dance values across strata. Species occurring in fewer
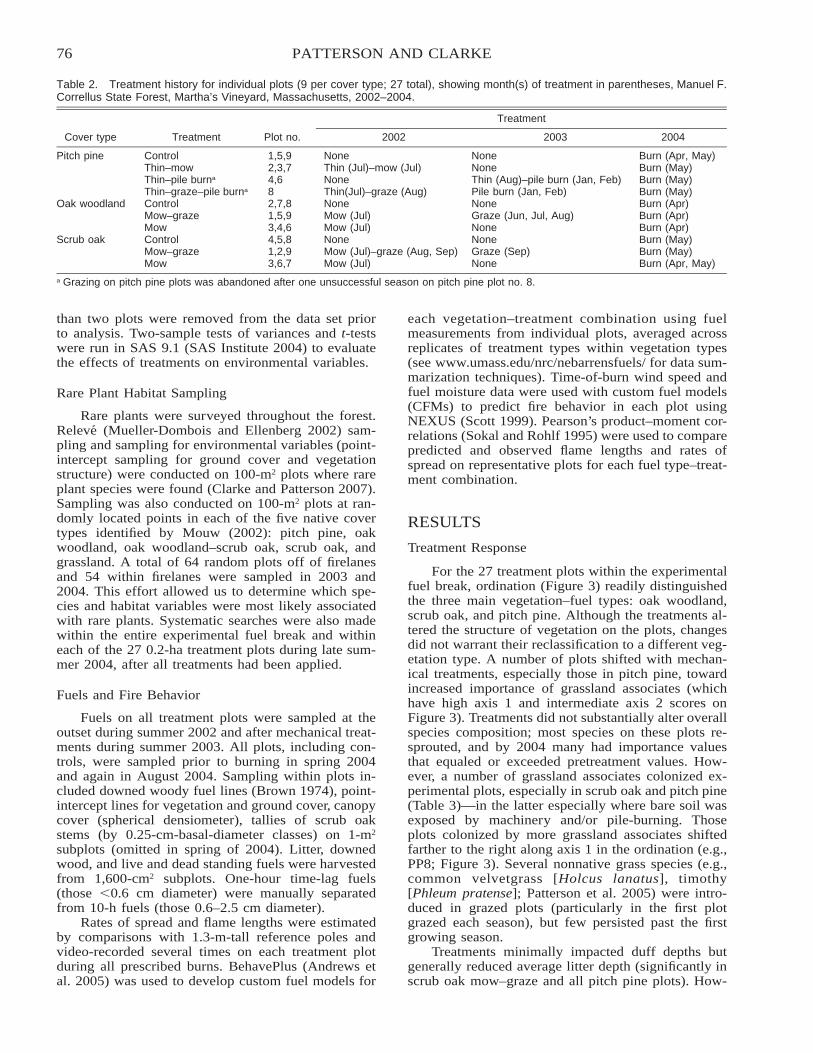
76 PATTERSON AND CLARKE
Table 2. Treatment history for individual plots (9 per cover type; 27 total), showing month(s) of treatment in parentheses, Manuel F.Correllus State Forest, Martha’s Vineyard, Massachusetts, 2002–2004.
Cover type Treatment Plot no.
Treatment
2002 2003 2004
Pitch pine Control 1,5,9 None None Burn (Apr, May)Thin–mow 2,3,7 Thin (Jul)–mow (Jul) None Burn (May)Thin–pile burna 4,6 None Thin (Aug)–pile burn (Jan, Feb) Burn (May)Thin–graze–pile burna 8 Thin(Jul)–graze (Aug) Pile burn (Jan, Feb) Burn (May)
Oak woodland Control 2,7,8 None None Burn (Apr)Mow–graze 1,5,9 Mow (Jul) Graze (Jun, Jul, Aug) Burn (Apr)Mow 3,4,6 Mow (Jul) None Burn (Apr)
Scrub oak Control 4,5,8 None None Burn (May)Mow–graze 1,2,9 Mow (Jul)–graze (Aug, Sep) Graze (Sep) Burn (May)Mow 3,6,7 Mow (Jul) None Burn (Apr, May)
a Grazing on pitch pine plots was abandoned after one unsuccessful season on pitch pine plot no. 8.
than two plots were removed from the data set priorto analysis. Two-sample tests of variances and t-testswere run in SAS 9.1 (SAS Institute 2004) to evaluatethe effects of treatments on environmental variables.
Rare Plant Habitat Sampling
Rare plants were surveyed throughout the forest.Releve (Mueller-Dombois and Ellenberg 2002) sam-pling and sampling for environmental variables (point-intercept sampling for ground cover and vegetationstructure) were conducted on 100-m2 plots where rareplant species were found (Clarke and Patterson 2007).Sampling was also conducted on 100-m2 plots at ran-domly located points in each of the five native covertypes identified by Mouw (2002): pitch pine, oakwoodland, oak woodland–scrub oak, scrub oak, andgrassland. A total of 64 random plots off of firelanesand 54 within firelanes were sampled in 2003 and2004. This effort allowed us to determine which spe-cies and habitat variables were most likely associatedwith rare plants. Systematic searches were also madewithin the entire experimental fuel break and withineach of the 27 0.2-ha treatment plots during late sum-mer 2004, after all treatments had been applied.
Fuels and Fire Behavior
Fuels on all treatment plots were sampled at theoutset during summer 2002 and after mechanical treat-ments during summer 2003. All plots, including con-trols, were sampled prior to burning in spring 2004and again in August 2004. Sampling within plots in-cluded downed woody fuel lines (Brown 1974), point-intercept lines for vegetation and ground cover, canopycover (spherical densiometer), tallies of scrub oakstems (by 0.25-cm-basal-diameter classes) on 1-m2
subplots (omitted in spring of 2004). Litter, downedwood, and live and dead standing fuels were harvestedfrom 1,600-cm2 subplots. One-hour time-lag fuels(those �0.6 cm diameter) were manually separatedfrom 10-h fuels (those 0.6–2.5 cm diameter).
Rates of spread and flame lengths were estimatedby comparisons with 1.3-m-tall reference poles andvideo-recorded several times on each treatment plotduring all prescribed burns. BehavePlus (Andrews etal. 2005) was used to develop custom fuel models for
each vegetation–treatment combination using fuelmeasurements from individual plots, averaged acrossreplicates of treatment types within vegetation types(see www.umass.edu/nrc/nebarrensfuels/ for data sum-marization techniques). Time-of-burn wind speed andfuel moisture data were used with custom fuel models(CFMs) to predict fire behavior in each plot usingNEXUS (Scott 1999). Pearson’s product–moment cor-relations (Sokal and Rohlf 1995) were used to comparepredicted and observed flame lengths and rates ofspread on representative plots for each fuel type–treat-ment combination.
RESULTS
Treatment Response
For the 27 treatment plots within the experimentalfuel break, ordination (Figure 3) readily distinguishedthe three main vegetation–fuel types: oak woodland,scrub oak, and pitch pine. Although the treatments al-tered the structure of vegetation on the plots, changesdid not warrant their reclassification to a different veg-etation type. A number of plots shifted with mechan-ical treatments, especially those in pitch pine, towardincreased importance of grassland associates (whichhave high axis 1 and intermediate axis 2 scores onFigure 3). Treatments did not substantially alter overallspecies composition; most species on these plots re-sprouted, and by 2004 many had importance valuesthat equaled or exceeded pretreatment values. How-ever, a number of grassland associates colonized ex-perimental plots, especially in scrub oak and pitch pine(Table 3)—in the latter especially where bare soil wasexposed by machinery and/or pile-burning. Thoseplots colonized by more grassland associates shiftedfarther to the right along axis 1 in the ordination (e.g.,PP8; Figure 3). Several nonnative grass species (e.g.,common velvetgrass [Holcus lanatus], timothy[Phleum pratense]; Patterson et al. 2005) were intro-duced in grazed plots (particularly in the first plotgrazed each season), but few persisted past the firstgrowing season.
Treatments minimally impacted duff depths butgenerally reduced average litter depth (significantly inscrub oak mow–graze and all pitch pine plots). How-
77RESTORING BARRENS SHRUBLANDS
Fig. 3. Ordination (nonmetric multidimensional scaling) of 27 experimental fuel treatment plots in space defined by species abun-dances (importance values) in 2002 and 2004 (arrows point toward the latter), Manuel F. Correllus State Forest on Martha’s Vineyard,Massachusetts, 2002–2004. Grassland-associated species have high axis 1 scores and intermediate axis 2 scores. Treatments gen-erally shifted scrub oak (SO) and pitch pine (PP) plots toward increasing importance of grassland associates, with no consistent trendsidentified in the movement of oak woodland (OW) plots.
ever, treatments often resulted in significant increasesin litter load due to the addition of shredded shrubstems to the litter layer.
Rare Plants
In searches throughout the forest, rare plants wereonly found in disturbed areas, either in firelanes oralong paths where frequent disturbance occurs. How-ever, grassland associates, which occurred often(�80% frequency of occurrence) in firelane plots andrarely in woodland and shrubland plots (�10% fre-quency of occurrence), were found, where they didoccur in woodlands–shrublands, in association withsignificantly lower duff depth and higher lichen coverthan is typically found on woodland and shrublandplots (Clarke and Patterson 2007). These grass andherb species occurred occasionally in plots character-ized as oak woodland–scrub oak (3 of 29 plots), pitchpine (2 of 15 plots), and oak woodland (1 of 12 plots),and frequently in scrub oak (4 of 7 plots).
During pre-treatment sampling within the experi-mental fuel break, only one stem of one rare plantspecies (sandplain blue-eyed grass [Sisyrinchium fus-catum]) was found along a bridle path. Followingtreatments, papillose nut-sedge (Scleria pauciflora var.
caroliniana) established at two sites in areas wherebare soil was exposed by machinery, and lion’s foot(Nabalus serpentarius) was found in a scrub oak standthat had been mowed and burned.
Treatments affected environmental variables inways that might be interpreted as being favorable torare plants. Vegetative (canopy) cover �0.5 m inheight in scrub oak plots was equivalent to that foundon rare plant plots prior to, and was further reducedby, treatments (Table 4). Canopy cover was signifi-cantly higher in pitch pine and oak woodland plots(Tables 5, 6) than in rare plant plots both before andafter treatments, despite a significant reduction in cov-er following thinning in pitch pine plots. Litter depthswere reduced by treatments in all three vegetationtypes (Tables 4–6), although duff depths remained sig-nificantly higher than in rare plant plots (Figure 4).
Fuels and Fire Behavior
In the first and second growing seasons after treat-ments, shrub fuel loads were generally reduced to�50% of pretreatment levels, and shrub heights to�25% (Figure 5). Shrub heights in oak woodland plotswere more heterogeneous because mowing was inten-
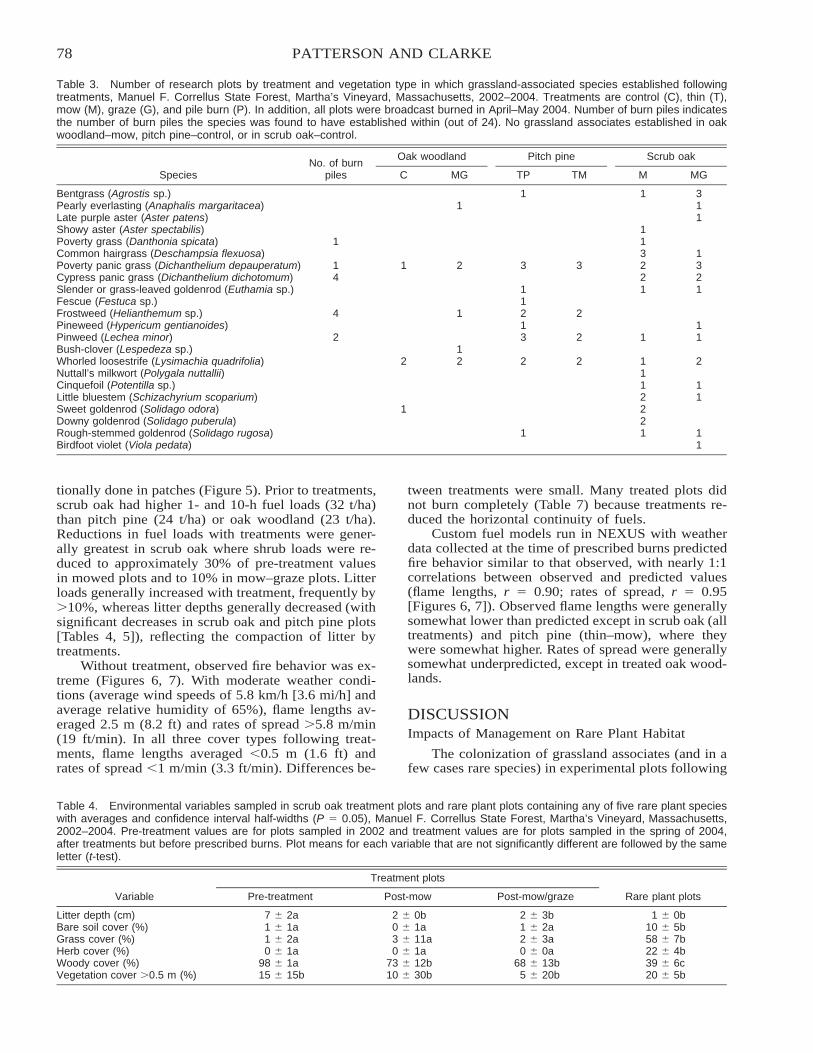
78 PATTERSON AND CLARKE
Table 3. Number of research plots by treatment and vegetation type in which grassland-associated species established followingtreatments, Manuel F. Correllus State Forest, Martha’s Vineyard, Massachusetts, 2002–2004. Treatments are control (C), thin (T),mow (M), graze (G), and pile burn (P). In addition, all plots were broadcast burned in April–May 2004. Number of burn piles indicatesthe number of burn piles the species was found to have established within (out of 24). No grassland associates established in oakwoodland–mow, pitch pine–control, or in scrub oak–control.
SpeciesNo. of burn
piles
Oak woodland
C MG
Pitch pine
TP TM
Scrub oak
M MG
Bentgrass (Agrostis sp.) 1 1 3Pearly everlasting (Anaphalis margaritacea) 1 1Late purple aster (Aster patens) 1Showy aster (Aster spectabilis) 1Poverty grass (Danthonia spicata) 1 1Common hairgrass (Deschampsia flexuosa) 3 1Poverty panic grass (Dichanthelium depauperatum) 1 1 2 3 3 2 3Cypress panic grass (Dichanthelium dichotomum) 4 2 2Slender or grass-leaved goldenrod (Euthamia sp.) 1 1 1Fescue (Festuca sp.) 1Frostweed (Helianthemum sp.) 4 1 2 2Pineweed (Hypericum gentianoides) 1 1Pinweed (Lechea minor) 2 3 2 1 1Bush-clover (Lespedeza sp.) 1Whorled loosestrife (Lysimachia quadrifolia) 2 2 2 2 1 2Nuttall’s milkwort (Polygala nuttallii) 1Cinquefoil (Potentilla sp.) 1 1Little bluestem (Schizachyrium scoparium) 2 1Sweet goldenrod (Solidago odora) 1 2Downy goldenrod (Solidago puberula) 2Rough-stemmed goldenrod (Solidago rugosa) 1 1 1Birdfoot violet (Viola pedata) 1
Table 4. Environmental variables sampled in scrub oak treatment plots and rare plant plots containing any of five rare plant specieswith averages and confidence interval half-widths (P � 0.05), Manuel F. Correllus State Forest, Martha’s Vineyard, Massachusetts,2002–2004. Pre-treatment values are for plots sampled in 2002 and treatment values are for plots sampled in the spring of 2004,after treatments but before prescribed burns. Plot means for each variable that are not significantly different are followed by the sameletter (t-test).
Variable
Treatment plots
Pre-treatment Post-mow Post-mow/graze Rare plant plots
Litter depth (cm) 7 � 2a 2 � 0b 2 � 3b 1 � 0bBare soil cover (%) 1 � 1a 0 � 1a 1 � 2a 10 � 5bGrass cover (%) 1 � 2a 3 � 11a 2 � 3a 58 � 7bHerb cover (%) 0 � 1a 0 � 1a 0 � 0a 22 � 4bWoody cover (%) 98 � 1a 73 � 12b 68 � 13b 39 � 6cVegetation cover �0.5 m (%) 15 � 15b 10 � 30b 5 � 20b 20 � 5b
tionally done in patches (Figure 5). Prior to treatments,scrub oak had higher 1- and 10-h fuel loads (32 t/ha)than pitch pine (24 t/ha) or oak woodland (23 t/ha).Reductions in fuel loads with treatments were gener-ally greatest in scrub oak where shrub loads were re-duced to approximately 30% of pre-treatment valuesin mowed plots and to 10% in mow–graze plots. Litterloads generally increased with treatment, frequently by�10%, whereas litter depths generally decreased (withsignificant decreases in scrub oak and pitch pine plots[Tables 4, 5]), reflecting the compaction of litter bytreatments.
Without treatment, observed fire behavior was ex-treme (Figures 6, 7). With moderate weather condi-tions (average wind speeds of 5.8 km/h [3.6 mi/h] andaverage relative humidity of 65%), flame lengths av-eraged 2.5 m (8.2 ft) and rates of spread �5.8 m/min(19 ft/min). In all three cover types following treat-ments, flame lengths averaged �0.5 m (1.6 ft) andrates of spread �1 m/min (3.3 ft/min). Differences be-
tween treatments were small. Many treated plots didnot burn completely (Table 7) because treatments re-duced the horizontal continuity of fuels.
Custom fuel models run in NEXUS with weatherdata collected at the time of prescribed burns predictedfire behavior similar to that observed, with nearly 1:1correlations between observed and predicted values(flame lengths, r � 0.90; rates of spread, r � 0.95[Figures 6, 7]). Observed flame lengths were generallysomewhat lower than predicted except in scrub oak (alltreatments) and pitch pine (thin–mow), where theywere somewhat higher. Rates of spread were generallysomewhat underpredicted, except in treated oak wood-lands.
DISCUSSIONImpacts of Management on Rare Plant Habitat
The colonization of grassland associates (and in afew cases rare species) in experimental plots following
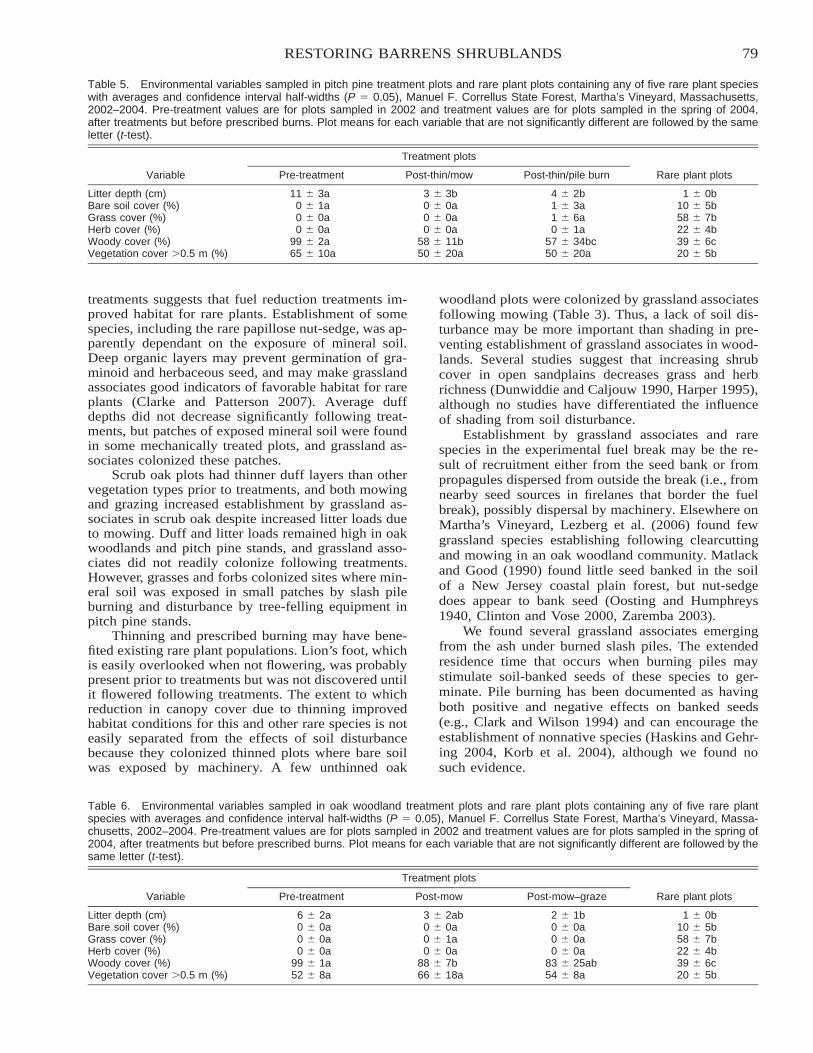
79RESTORING BARRENS SHRUBLANDS
Table 5. Environmental variables sampled in pitch pine treatment plots and rare plant plots containing any of five rare plant specieswith averages and confidence interval half-widths (P � 0.05), Manuel F. Correllus State Forest, Martha’s Vineyard, Massachusetts,2002–2004. Pre-treatment values are for plots sampled in 2002 and treatment values are for plots sampled in the spring of 2004,after treatments but before prescribed burns. Plot means for each variable that are not significantly different are followed by the sameletter (t-test).
Variable
Treatment plots
Pre-treatment Post-thin/mow Post-thin/pile burn Rare plant plots
Litter depth (cm) 11 � 3a 3 � 3b 4 � 2b 1 � 0bBare soil cover (%) 0 � 1a 0 � 0a 1 � 3a 10 � 5bGrass cover (%) 0 � 0a 0 � 0a 1 � 6a 58 � 7bHerb cover (%) 0 � 0a 0 � 0a 0 � 1a 22 � 4bWoody cover (%) 99 � 2a 58 � 11b 57 � 34bc 39 � 6cVegetation cover �0.5 m (%) 65 � 10a 50 � 20a 50 � 20a 20 � 5b
Table 6. Environmental variables sampled in oak woodland treatment plots and rare plant plots containing any of five rare plantspecies with averages and confidence interval half-widths (P � 0.05), Manuel F. Correllus State Forest, Martha’s Vineyard, Massa-chusetts, 2002–2004. Pre-treatment values are for plots sampled in 2002 and treatment values are for plots sampled in the spring of2004, after treatments but before prescribed burns. Plot means for each variable that are not significantly different are followed by thesame letter (t-test).
Variable
Treatment plots
Pre-treatment Post-mow Post-mow–graze Rare plant plots
Litter depth (cm) 6 � 2a 3 � 2ab 2 � 1b 1 � 0bBare soil cover (%) 0 � 0a 0 � 0a 0 � 0a 10 � 5bGrass cover (%) 0 � 0a 0 � 1a 0 � 0a 58 � 7bHerb cover (%) 0 � 0a 0 � 0a 0 � 0a 22 � 4bWoody cover (%) 99 � 1a 88 � 7b 83 � 25ab 39 � 6cVegetation cover �0.5 m (%) 52 � 8a 66 � 18a 54 � 8a 20 � 5b
treatments suggests that fuel reduction treatments im-proved habitat for rare plants. Establishment of somespecies, including the rare papillose nut-sedge, was ap-parently dependant on the exposure of mineral soil.Deep organic layers may prevent germination of gra-minoid and herbaceous seed, and may make grasslandassociates good indicators of favorable habitat for rareplants (Clarke and Patterson 2007). Average duffdepths did not decrease significantly following treat-ments, but patches of exposed mineral soil were foundin some mechanically treated plots, and grassland as-sociates colonized these patches.
Scrub oak plots had thinner duff layers than othervegetation types prior to treatments, and both mowingand grazing increased establishment by grassland as-sociates in scrub oak despite increased litter loads dueto mowing. Duff and litter loads remained high in oakwoodlands and pitch pine stands, and grassland asso-ciates did not readily colonize following treatments.However, grasses and forbs colonized sites where min-eral soil was exposed in small patches by slash pileburning and disturbance by tree-felling equipment inpitch pine stands.
Thinning and prescribed burning may have bene-fited existing rare plant populations. Lion’s foot, whichis easily overlooked when not flowering, was probablypresent prior to treatments but was not discovered untilit flowered following treatments. The extent to whichreduction in canopy cover due to thinning improvedhabitat conditions for this and other rare species is noteasily separated from the effects of soil disturbancebecause they colonized thinned plots where bare soilwas exposed by machinery. A few unthinned oak
woodland plots were colonized by grassland associatesfollowing mowing (Table 3). Thus, a lack of soil dis-turbance may be more important than shading in pre-venting establishment of grassland associates in wood-lands. Several studies suggest that increasing shrubcover in open sandplains decreases grass and herbrichness (Dunwiddie and Caljouw 1990, Harper 1995),although no studies have differentiated the influenceof shading from soil disturbance.
Establishment by grassland associates and rarespecies in the experimental fuel break may be the re-sult of recruitment either from the seed bank or frompropagules dispersed from outside the break (i.e., fromnearby seed sources in firelanes that border the fuelbreak), possibly dispersal by machinery. Elsewhere onMartha’s Vineyard, Lezberg et al. (2006) found fewgrassland species establishing following clearcuttingand mowing in an oak woodland community. Matlackand Good (1990) found little seed banked in the soilof a New Jersey coastal plain forest, but nut-sedgedoes appear to bank seed (Oosting and Humphreys1940, Clinton and Vose 2000, Zaremba 2003).
We found several grassland associates emergingfrom the ash under burned slash piles. The extendedresidence time that occurs when burning piles maystimulate soil-banked seeds of these species to ger-minate. Pile burning has been documented as havingboth positive and negative effects on banked seeds(e.g., Clark and Wilson 1994) and can encourage theestablishment of nonnative species (Haskins and Gehr-ing 2004, Korb et al. 2004), although we found nosuch evidence.
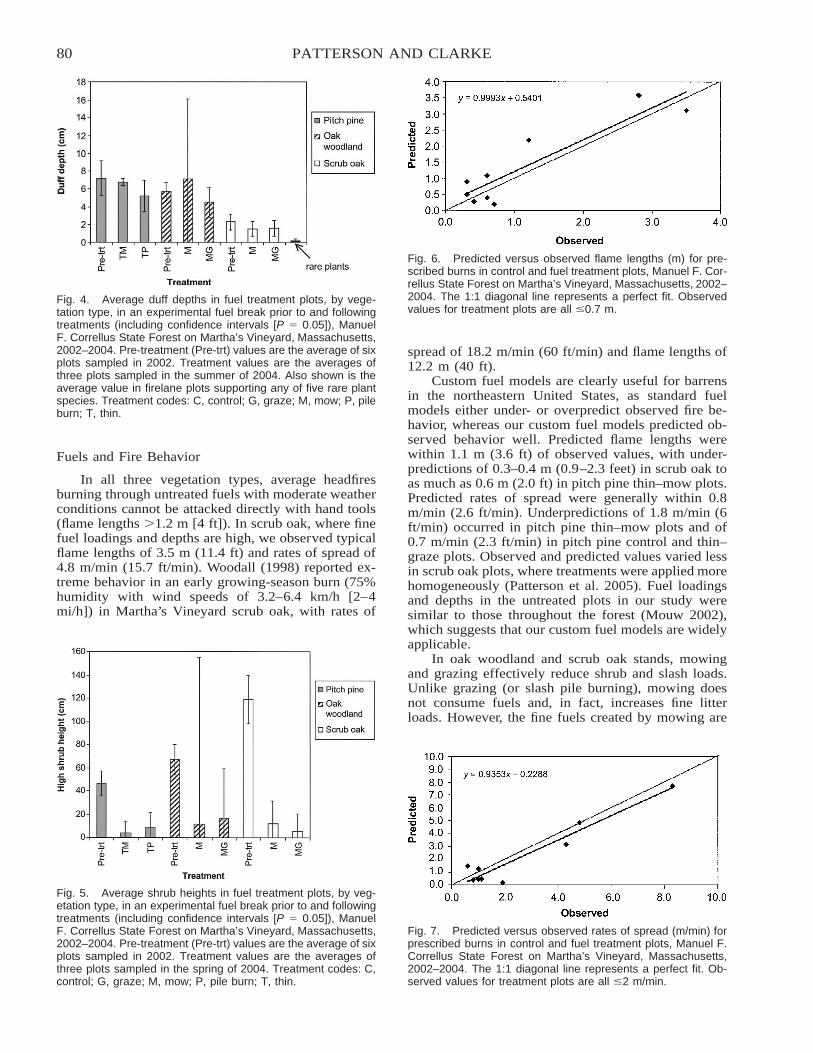
80 PATTERSON AND CLARKE
Fig. 4. Average duff depths in fuel treatment plots, by vege-tation type, in an experimental fuel break prior to and followingtreatments (including confidence intervals [P � 0.05]), ManuelF. Correllus State Forest on Martha’s Vineyard, Massachusetts,2002–2004. Pre-treatment (Pre-trt) values are the average of sixplots sampled in 2002. Treatment values are the averages ofthree plots sampled in the summer of 2004. Also shown is theaverage value in firelane plots supporting any of five rare plantspecies. Treatment codes: C, control; G, graze; M, mow; P, pileburn; T, thin.
Fig. 6. Predicted versus observed flame lengths (m) for pre-scribed burns in control and fuel treatment plots, Manuel F. Cor-rellus State Forest on Martha’s Vineyard, Massachusetts, 2002–2004. The 1:1 diagonal line represents a perfect fit. Observedvalues for treatment plots are all �0.7 m.
Fig. 5. Average shrub heights in fuel treatment plots, by veg-etation type, in an experimental fuel break prior to and followingtreatments (including confidence intervals [P � 0.05]), ManuelF. Correllus State Forest on Martha’s Vineyard, Massachusetts,2002–2004. Pre-treatment (Pre-trt) values are the average of sixplots sampled in 2002. Treatment values are the averages ofthree plots sampled in the spring of 2004. Treatment codes: C,control; G, graze; M, mow; P, pile burn; T, thin.
Fig. 7. Predicted versus observed rates of spread (m/min) forprescribed burns in control and fuel treatment plots, Manuel F.Correllus State Forest on Martha’s Vineyard, Massachusetts,2002–2004. The 1:1 diagonal line represents a perfect fit. Ob-served values for treatment plots are all �2 m/min.
Fuels and Fire Behavior
In all three vegetation types, average headfiresburning through untreated fuels with moderate weatherconditions cannot be attacked directly with hand tools(flame lengths �1.2 m [4 ft]). In scrub oak, where finefuel loadings and depths are high, we observed typicalflame lengths of 3.5 m (11.4 ft) and rates of spread of4.8 m/min (15.7 ft/min). Woodall (1998) reported ex-treme behavior in an early growing-season burn (75%humidity with wind speeds of 3.2–6.4 km/h [2–4mi/h]) in Martha’s Vineyard scrub oak, with rates of
spread of 18.2 m/min (60 ft/min) and flame lengths of12.2 m (40 ft).
Custom fuel models are clearly useful for barrensin the northeastern United States, as standard fuelmodels either under- or overpredict observed fire be-havior, whereas our custom fuel models predicted ob-served behavior well. Predicted flame lengths werewithin 1.1 m (3.6 ft) of observed values, with under-predictions of 0.3–0.4 m (0.9–2.3 feet) in scrub oak toas much as 0.6 m (2.0 ft) in pitch pine thin–mow plots.Predicted rates of spread were generally within 0.8m/min (2.6 ft/min). Underpredictions of 1.8 m/min (6ft/min) occurred in pitch pine thin–mow plots and of0.7 m/min (2.3 ft/min) in pitch pine control and thin–graze plots. Observed and predicted values varied lessin scrub oak plots, where treatments were applied morehomogeneously (Patterson et al. 2005). Fuel loadingsand depths in the untreated plots in our study weresimilar to those throughout the forest (Mouw 2002),which suggests that our custom fuel models are widelyapplicable.
In oak woodland and scrub oak stands, mowingand grazing effectively reduce shrub and slash loads.Unlike grazing (or slash pile burning), mowing doesnot consume fuels and, in fact, increases fine litterloads. However, the fine fuels created by mowing are
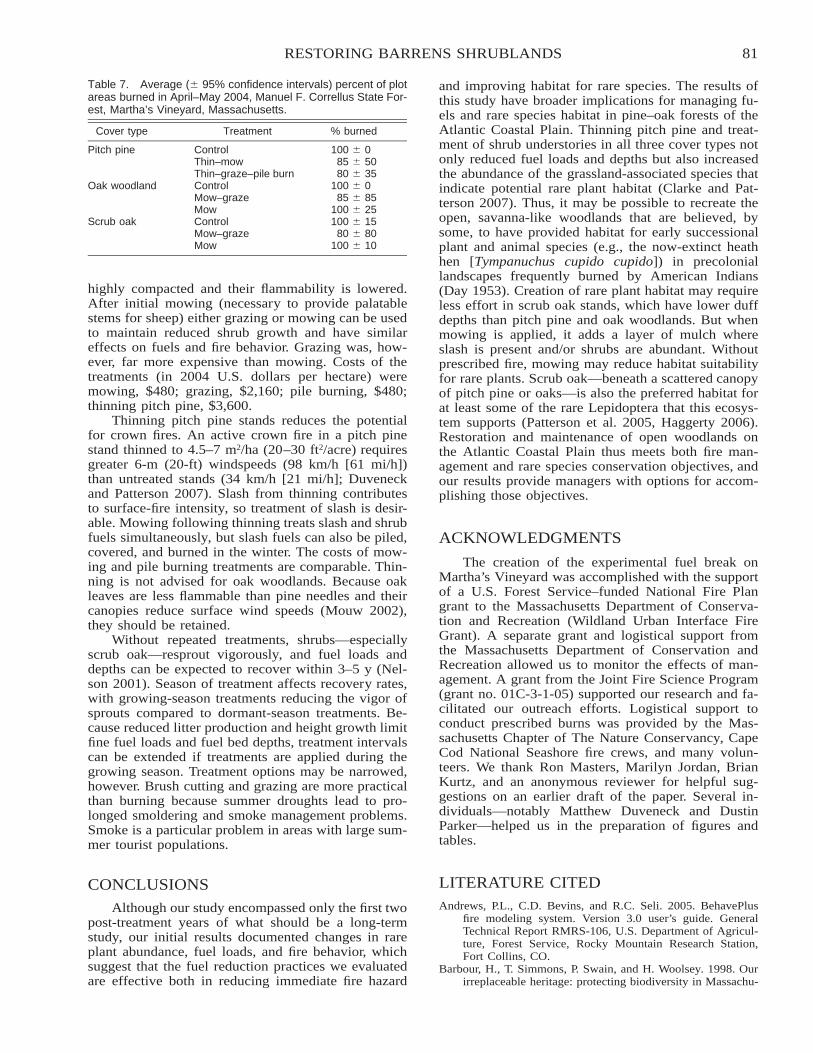
81RESTORING BARRENS SHRUBLANDS
Table 7. Average (� 95% confidence intervals) percent of plotareas burned in April–May 2004, Manuel F. Correllus State For-est, Martha’s Vineyard, Massachusetts.
Cover type Treatment % burned
Pitch pine Control 100 � 0Thin–mow 85 � 50Thin–graze–pile burn 80 � 35
Oak woodland Control 100 � 0Mow–graze 85 � 85Mow 100 � 25
Scrub oak Control 100 � 15Mow–graze 80 � 80Mow 100 � 10
highly compacted and their flammability is lowered.After initial mowing (necessary to provide palatablestems for sheep) either grazing or mowing can be usedto maintain reduced shrub growth and have similareffects on fuels and fire behavior. Grazing was, how-ever, far more expensive than mowing. Costs of thetreatments (in 2004 U.S. dollars per hectare) weremowing, $480; grazing, $2,160; pile burning, $480;thinning pitch pine, $3,600.
Thinning pitch pine stands reduces the potentialfor crown fires. An active crown fire in a pitch pinestand thinned to 4.5–7 m2/ha (20–30 ft2/acre) requiresgreater 6-m (20-ft) windspeeds (98 km/h [61 mi/h])than untreated stands (34 km/h [21 mi/h]; Duveneckand Patterson 2007). Slash from thinning contributesto surface-fire intensity, so treatment of slash is desir-able. Mowing following thinning treats slash and shrubfuels simultaneously, but slash fuels can also be piled,covered, and burned in the winter. The costs of mow-ing and pile burning treatments are comparable. Thin-ning is not advised for oak woodlands. Because oakleaves are less flammable than pine needles and theircanopies reduce surface wind speeds (Mouw 2002),they should be retained.
Without repeated treatments, shrubs—especiallyscrub oak—resprout vigorously, and fuel loads anddepths can be expected to recover within 3–5 y (Nel-son 2001). Season of treatment affects recovery rates,with growing-season treatments reducing the vigor ofsprouts compared to dormant-season treatments. Be-cause reduced litter production and height growth limitfine fuel loads and fuel bed depths, treatment intervalscan be extended if treatments are applied during thegrowing season. Treatment options may be narrowed,however. Brush cutting and grazing are more practicalthan burning because summer droughts lead to pro-longed smoldering and smoke management problems.Smoke is a particular problem in areas with large sum-mer tourist populations.
CONCLUSIONS
Although our study encompassed only the first twopost-treatment years of what should be a long-termstudy, our initial results documented changes in rareplant abundance, fuel loads, and fire behavior, whichsuggest that the fuel reduction practices we evaluatedare effective both in reducing immediate fire hazard
and improving habitat for rare species. The results ofthis study have broader implications for managing fu-els and rare species habitat in pine–oak forests of theAtlantic Coastal Plain. Thinning pitch pine and treat-ment of shrub understories in all three cover types notonly reduced fuel loads and depths but also increasedthe abundance of the grassland-associated species thatindicate potential rare plant habitat (Clarke and Pat-terson 2007). Thus, it may be possible to recreate theopen, savanna-like woodlands that are believed, bysome, to have provided habitat for early successionalplant and animal species (e.g., the now-extinct heathhen [Tympanuchus cupido cupido]) in precoloniallandscapes frequently burned by American Indians(Day 1953). Creation of rare plant habitat may requireless effort in scrub oak stands, which have lower duffdepths than pitch pine and oak woodlands. But whenmowing is applied, it adds a layer of mulch whereslash is present and/or shrubs are abundant. Withoutprescribed fire, mowing may reduce habitat suitabilityfor rare plants. Scrub oak—beneath a scattered canopyof pitch pine or oaks—is also the preferred habitat forat least some of the rare Lepidoptera that this ecosys-tem supports (Patterson et al. 2005, Haggerty 2006).Restoration and maintenance of open woodlands onthe Atlantic Coastal Plain thus meets both fire man-agement and rare species conservation objectives, andour results provide managers with options for accom-plishing those objectives.
ACKNOWLEDGMENTS
The creation of the experimental fuel break onMartha’s Vineyard was accomplished with the supportof a U.S. Forest Service–funded National Fire Plangrant to the Massachusetts Department of Conserva-tion and Recreation (Wildland Urban Interface FireGrant). A separate grant and logistical support fromthe Massachusetts Department of Conservation andRecreation allowed us to monitor the effects of man-agement. A grant from the Joint Fire Science Program(grant no. 01C-3-1-05) supported our research and fa-cilitated our outreach efforts. Logistical support toconduct prescribed burns was provided by the Mas-sachusetts Chapter of The Nature Conservancy, CapeCod National Seashore fire crews, and many volun-teers. We thank Ron Masters, Marilyn Jordan, BrianKurtz, and an anonymous reviewer for helpful sug-gestions on an earlier draft of the paper. Several in-dividuals—notably Matthew Duveneck and DustinParker—helped us in the preparation of figures andtables.
LITERATURE CITEDAndrews, P.L., C.D. Bevins, and R.C. Seli. 2005. BehavePlus
fire modeling system. Version 3.0 user’s guide. GeneralTechnical Report RMRS-106, U.S. Department of Agricul-ture, Forest Service, Rocky Mountain Research Station,Fort Collins, CO.
Barbour, H., T. Simmons, P. Swain, and H. Woolsey. 1998. Ourirreplaceable heritage: protecting biodiversity in Massachu-
82 PATTERSON AND CLARKE
setts. Massachusetts Natural Heritage and Endangered Spe-cies Program, Massachusetts Division of Fisheries andWildlife, Westborough, and The Nature Conservancy, Mas-sachusetts Chapter, Boston.
Brown, J.K. 1974. Handbook for inventorying downed woodyfuel material. General Technical Report INT-16, U.S. De-partment of Agriculture, Forest Service, Intermountain For-est and Range Experiment Station, Ogden, UT.
Clark, D.L., and M.V. Wilson. 1994. Heat-treatment effects onseed bank species of an old-growth Douglas fir forest.Northwest Science 68:1–5.
Clark, J.S., and W.A. Patterson III. 1985. The development of atidal marsh: upland and oceanic influences. EcologicalMonographs 55:189–217.
Clarke, G.L., and W.A. Patterson III. 2007. The distribution ofrare plants in a coastal Massachusetts sandplain: implica-tions for conservation and management. Biological Conser-vation 136:4–16.
Clinton, B.D., and J.M. Vose. 2000. Plant succession and com-munity restoration following felling and burning in thesouthern Appalachian Mountains. Proceedings of the TallTimbers Fire Ecology Conference 21:22–29.
Day, G.M. 1953. The Indian as an ecological factor in the north-eastern forest. Ecology 34:329–347.
Dunwiddie, P.W., and C. Caljouw. 1990. Prescribed burning andmowing of coastal heathlands and grasslands in Massachu-setts. Pages 271–275 in R.S. Mitchell, C.J. Sheviak, andD.J. Leopold (eds.). Ecosystem management: rare speciesand significant habitats. New York State Museum Bulletin471, Albany.
Duveneck, M.J., and W.A. Patterson III. 2007. Characterizingcanopy fuels to predict fire behavior in pitch pine stands.Northern Journal of Applied Forestry 24:65–70.
Fletcher, P.C., and R.J. Roffinoli. 1986. Soil survey of DukesCounty, Massachusetts. U.S. Department of Agriculture,Soil Conservation Service, in cooperation with Massachu-setts Agricultural Experiment Station, Amherst.
Foster, D.R., and G. Motzkin. 1999. Historical influences on thelandscape of Martha’s Vineyard, perspectives on the man-agement of the Manuel F. Correllus State Forest. HarvardForest Paper 23, Harvard University Press, Cambridge,MA.
Goldstein, P.Z. 1997. Lepidopteran assemblages and the man-agement of sandplain communities on Martha’s Vineyard,Massachusetts. Pages 217–236 in P.D. Vickery and P.W.Dunwiddie (eds.). Grasslands of North America. Massachu-setts Audubon Society, Lincoln.
Haggerty, S.A. 2006. Land management implications for Hem-ileuca maia (Lepidoptera: Saturniidae) habitat at Manuel F.Correllus State Forest, Martha’s Vineyard, Massachusetts.M.S. Thesis, University of Massachusetts, Amherst.
Harper, K.A. 1995. Effect of expanding clones of Gaylussaciabaccata (black huckleberry) on species composition in asandplain grassland on Nantucket Island, Massachusetts.Bulletin of the Torrey Botanical Club 122:124–133.
Haskins, K.E., and C.A. Gehring. 2004. Long-term effects ofburning slash on plant communities and arbuscular mycor-rhizae in a semi-arid woodland. Journal of Applied Ecology41:379–388.
Korb, J.E., N.C. Johnson, and W.W. Covington. 2004. Slash pileburning effects on soil biotic and chemical properties andplant establishment: recommendations for amelioration.Restoration Ecology 12:52–62.
Lezberg, A.L., K. Buresch, C. Neill, and T. Chase. 2006. Me-chanical land clearing to promote establishment of coastalsandplain grassland and shrubland communities. Restora-tion Ecology 14:220–232.
Massachusetts Natural Heritage and Endangered Species Pro-
gram. 2001. BioMap: guiding land conservation for biodi-versity in Massachusetts. Massachusetts Division of Fish-eries and Wildlife, Westborough.
Matlack, G.R., and R.E. Good. 1990. Spatial heterogeneity inthe soil seed bank of a mature coastal plain forest. Bulletinof the Torrey Botanical Club 117:143–152.
McCune, B. 1993. Multivariate analysis on the PC-ORD system.Oregon State University, Corvallis.
Mehrhoff, L.J. 1997. Thoughts on the biogeography of grasslandplants in New England. Pages 15–23 in P.D. Vickery andP.W. Dunwiddie (eds.). Grasslands of North America. Mas-sachusetts Audubon Society, Lincoln.
Motzkin, G., and D.R. Foster. 2002. Grasslands, heathlands andshrublands in coastal New England: historical interpreta-tions and approaches to conservation. Journal of Biogeog-raphy 29:1569–1590.
Mouw, A.R. 2002. The modern and historic fire regimes of cen-tral Martha’s Vineyard, Massachusetts. M.S. Thesis, Uni-versity of Massachusetts, Amherst.
Mueller-Dombois, D., and H. Ellenberg. 2002. Aims and meth-ods of vegetation ecology [reprint]. Blackburn Press, Cald-well, NJ.
Nelson, K.E. 2001. Determining the optimal prescribed burn fre-quency for ecological restoration in pitch pine–scrub oakbarrens of Hollis, Maine. Department of Forestry and Wild-life Management, University of Massachusetts, Amherst.http://www.umass.edu/nrc/nebarrensfuels/publications/pdfs/Kent�Nelson�Hollis�report.pdf [accessed 9 Dec 2005].
Noss, R.F., E.T. LaRoe III, and J.M. Scott. 1995. Endangeredecosystems of the United States: a preliminary assessmentof loss and degradation. Biological Report 28, National Bi-ological Service, Washington, D.C. http://biology.usgs.gov/pubs/ecosys.htm [accessed 22 Feb 2007].
Oosting, H.J., and M.E. Humphreys. 1940. Buried viable seedsin a successional series of old fields and forest soils. Bul-letin of the Torrey Botanical Club 67:253–273.
Patterson, W.A. III, G.L. Clarke, S.A. Haggerty, P.R. Sievert, andM.J. Kelty. 2005. Wildland fuel management options forthe Central Plains of Martha’s Vineyard: impacts on fuelloads, fire behavior and rare plant and insect species. Un-published report to Massachusetts Department of Conser-vation and Recreation. Department of Natural ResourcesConservation, University of Massachusetts, Amherst.http://www.umass.edu/nrc/nebarrensfuels/publications/pdfs/FINAL%20DCR%20report.pdf [accessed 30 Oct 2006].
SAS Institute. 2004. SAS user’s guide. Version 9.1. SAS Insti-tute, Cary, NC.
Scott, J.H. 1999. NEXUS: a system for assessing crown firehazard. Fire Management Notes 59:20–24.
Sokal, R.R., and F.J. Rohlf. 1995. Biometry: the principles andpractice of statistics in biological research. Third edition.W.H. Freeman, New York.
Stormfax. 2005. Climatological data for Martha’s Vineyard,1961–1990. http://www.stormfax.com/climovin.htm [ac-cessed 9 Dec 2005].
Wagner, D.L., M.W. Nelson, and D.F. Schweitzer. 2003. Shrub-land Lepidoptera of southern New England and southeast-ern New York: ecology, conservation, and management.Forest Ecology and Management 185:95–112.
Woodall, C.A. 1998. Prescribed fire behavior and custom fuelmodeling in the pitch pine–scrub oak barrens and pine–oakforests of New England. Department of Forestry and Wild-life Management, University of Massachusetts, Amherst.http://www.umass.edu/nrc/nebarrensfuels/publications/pdfs/claiborne�woodall.pdf [accessed 18 Jan 2007].
Zaremba, R.E. 2003. Linum sulcatum Riddell (grooved flax)conservation and research plan. New England Wild FlowerSociety, Framingham, MA.
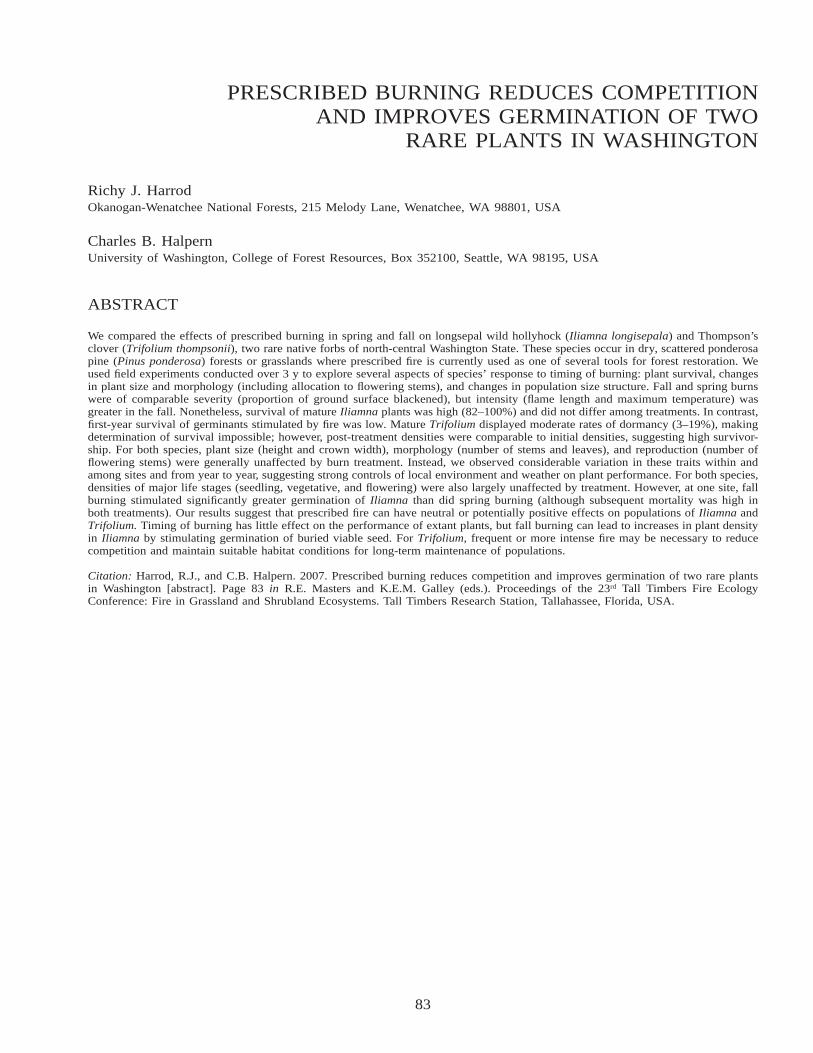
83
PRESCRIBED BURNING REDUCES COMPETITIONAND IMPROVES GERMINATION OF TWO
RARE PLANTS IN WASHINGTON
Richy J. HarrodOkanogan-Wenatchee National Forests, 215 Melody Lane, Wenatchee, WA 98801, USA
Charles B. HalpernUniversity of Washington, College of Forest Resources, Box 352100, Seattle, WA 98195, USA
ABSTRACT
We compared the effects of prescribed burning in spring and fall on longsepal wild hollyhock (Iliamna longisepala) and Thompson’sclover (Trifolium thompsonii), two rare native forbs of north-central Washington State. These species occur in dry, scattered ponderosapine (Pinus ponderosa) forests or grasslands where prescribed fire is currently used as one of several tools for forest restoration. Weused field experiments conducted over 3 y to explore several aspects of species’ response to timing of burning: plant survival, changesin plant size and morphology (including allocation to flowering stems), and changes in population size structure. Fall and spring burnswere of comparable severity (proportion of ground surface blackened), but intensity (flame length and maximum temperature) wasgreater in the fall. Nonetheless, survival of mature Iliamna plants was high (82–100%) and did not differ among treatments. In contrast,first-year survival of germinants stimulated by fire was low. Mature Trifolium displayed moderate rates of dormancy (3–19%), makingdetermination of survival impossible; however, post-treatment densities were comparable to initial densities, suggesting high survivor-ship. For both species, plant size (height and crown width), morphology (number of stems and leaves), and reproduction (number offlowering stems) were generally unaffected by burn treatment. Instead, we observed considerable variation in these traits within andamong sites and from year to year, suggesting strong controls of local environment and weather on plant performance. For both species,densities of major life stages (seedling, vegetative, and flowering) were also largely unaffected by treatment. However, at one site, fallburning stimulated significantly greater germination of Iliamna than did spring burning (although subsequent mortality was high inboth treatments). Our results suggest that prescribed fire can have neutral or potentially positive effects on populations of Iliamna andTrifolium. Timing of burning has little effect on the performance of extant plants, but fall burning can lead to increases in plant densityin Iliamna by stimulating germination of buried viable seed. For Trifolium, frequent or more intense fire may be necessary to reducecompetition and maintain suitable habitat conditions for long-term maintenance of populations.
Citation: Harrod, R.J., and C.B. Halpern. 2007. Prescribed burning reduces competition and improves germination of two rare plantsin Washington [abstract]. Page 83 in R.E. Masters and K.E.M. Galley (eds.). Proceedings of the 23rd Tall Timbers Fire EcologyConference: Fire in Grassland and Shrubland Ecosystems. Tall Timbers Research Station, Tallahassee, Florida, USA.
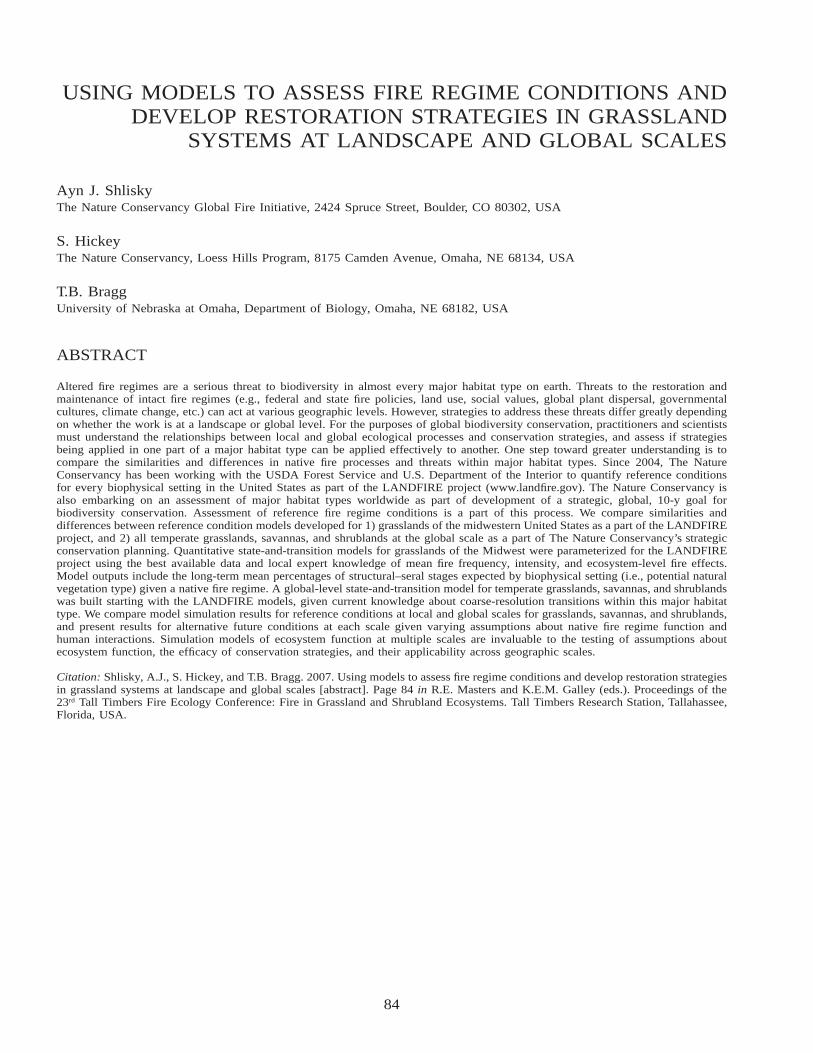
84
USING MODELS TO ASSESS FIRE REGIME CONDITIONS ANDDEVELOP RESTORATION STRATEGIES IN GRASSLAND
SYSTEMS AT LANDSCAPE AND GLOBAL SCALES
Ayn J. ShliskyThe Nature Conservancy Global Fire Initiative, 2424 Spruce Street, Boulder, CO 80302, USA
S. HickeyThe Nature Conservancy, Loess Hills Program, 8175 Camden Avenue, Omaha, NE 68134, USA
T.B. BraggUniversity of Nebraska at Omaha, Department of Biology, Omaha, NE 68182, USA
ABSTRACT
Altered fire regimes are a serious threat to biodiversity in almost every major habitat type on earth. Threats to the restoration andmaintenance of intact fire regimes (e.g., federal and state fire policies, land use, social values, global plant dispersal, governmentalcultures, climate change, etc.) can act at various geographic levels. However, strategies to address these threats differ greatly dependingon whether the work is at a landscape or global level. For the purposes of global biodiversity conservation, practitioners and scientistsmust understand the relationships between local and global ecological processes and conservation strategies, and assess if strategiesbeing applied in one part of a major habitat type can be applied effectively to another. One step toward greater understanding is tocompare the similarities and differences in native fire processes and threats within major habitat types. Since 2004, The NatureConservancy has been working with the USDA Forest Service and U.S. Department of the Interior to quantify reference conditionsfor every biophysical setting in the United States as part of the LANDFIRE project (www.landfire.gov). The Nature Conservancy isalso embarking on an assessment of major habitat types worldwide as part of development of a strategic, global, 10-y goal forbiodiversity conservation. Assessment of reference fire regime conditions is a part of this process. We compare similarities anddifferences between reference condition models developed for 1) grasslands of the midwestern United States as a part of the LANDFIREproject, and 2) all temperate grasslands, savannas, and shrublands at the global scale as a part of The Nature Conservancy’s strategicconservation planning. Quantitative state-and-transition models for grasslands of the Midwest were parameterized for the LANDFIREproject using the best available data and local expert knowledge of mean fire frequency, intensity, and ecosystem-level fire effects.Model outputs include the long-term mean percentages of structural–seral stages expected by biophysical setting (i.e., potential naturalvegetation type) given a native fire regime. A global-level state-and-transition model for temperate grasslands, savannas, and shrublandswas built starting with the LANDFIRE models, given current knowledge about coarse-resolution transitions within this major habitattype. We compare model simulation results for reference conditions at local and global scales for grasslands, savannas, and shrublands,and present results for alternative future conditions at each scale given varying assumptions about native fire regime function andhuman interactions. Simulation models of ecosystem function at multiple scales are invaluable to the testing of assumptions aboutecosystem function, the efficacy of conservation strategies, and their applicability across geographic scales.
Citation: Shlisky, A.J., S. Hickey, and T.B. Bragg. 2007. Using models to assess fire regime conditions and develop restoration strategiesin grassland systems at landscape and global scales [abstract]. Page 84 in R.E. Masters and K.E.M. Galley (eds.). Proceedings of the23rd Tall Timbers Fire Ecology Conference: Fire in Grassland and Shrubland Ecosystems. Tall Timbers Research Station, Tallahassee,Florida, USA.
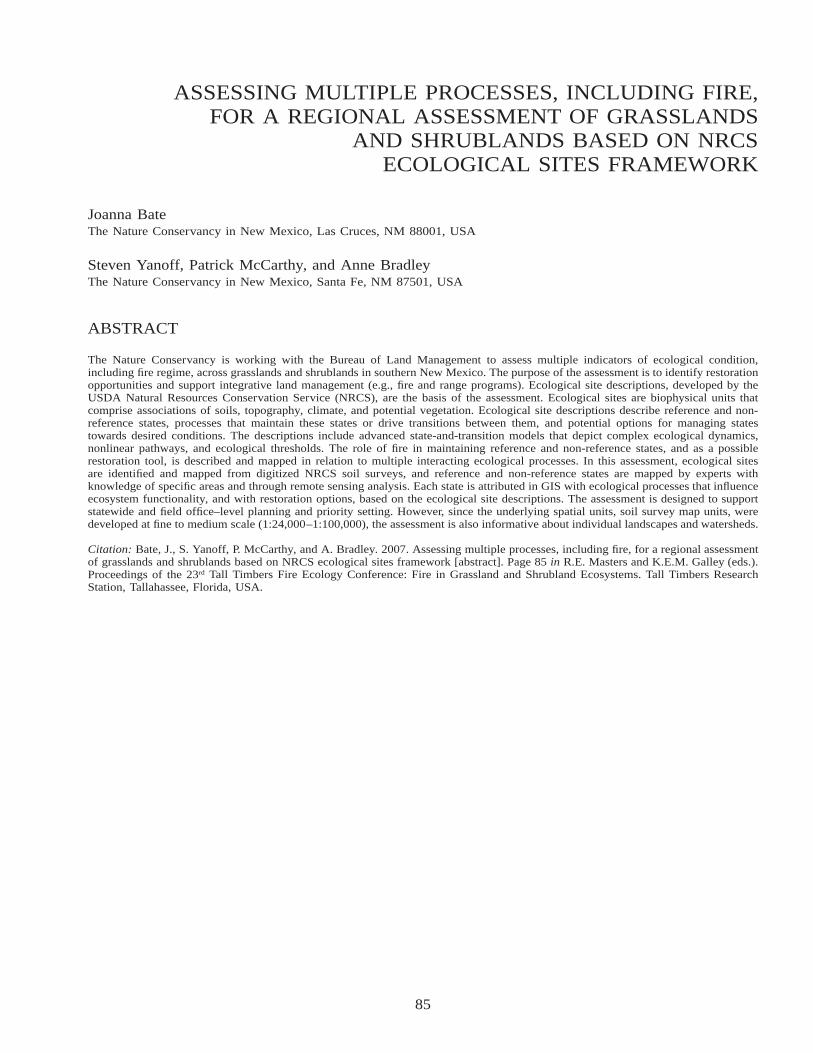
85
ASSESSING MULTIPLE PROCESSES, INCLUDING FIRE,FOR A REGIONAL ASSESSMENT OF GRASSLANDS
AND SHRUBLANDS BASED ON NRCSECOLOGICAL SITES FRAMEWORK
Joanna BateThe Nature Conservancy in New Mexico, Las Cruces, NM 88001, USA
Steven Yanoff, Patrick McCarthy, and Anne BradleyThe Nature Conservancy in New Mexico, Santa Fe, NM 87501, USA
ABSTRACT
The Nature Conservancy is working with the Bureau of Land Management to assess multiple indicators of ecological condition,including fire regime, across grasslands and shrublands in southern New Mexico. The purpose of the assessment is to identify restorationopportunities and support integrative land management (e.g., fire and range programs). Ecological site descriptions, developed by theUSDA Natural Resources Conservation Service (NRCS), are the basis of the assessment. Ecological sites are biophysical units thatcomprise associations of soils, topography, climate, and potential vegetation. Ecological site descriptions describe reference and non-reference states, processes that maintain these states or drive transitions between them, and potential options for managing statestowards desired conditions. The descriptions include advanced state-and-transition models that depict complex ecological dynamics,nonlinear pathways, and ecological thresholds. The role of fire in maintaining reference and non-reference states, and as a possiblerestoration tool, is described and mapped in relation to multiple interacting ecological processes. In this assessment, ecological sitesare identified and mapped from digitized NRCS soil surveys, and reference and non-reference states are mapped by experts withknowledge of specific areas and through remote sensing analysis. Each state is attributed in GIS with ecological processes that influenceecosystem functionality, and with restoration options, based on the ecological site descriptions. The assessment is designed to supportstatewide and field office–level planning and priority setting. However, since the underlying spatial units, soil survey map units, weredeveloped at fine to medium scale (1:24,000–1:100,000), the assessment is also informative about individual landscapes and watersheds.
Citation: Bate, J., S. Yanoff, P. McCarthy, and A. Bradley. 2007. Assessing multiple processes, including fire, for a regional assessmentof grasslands and shrublands based on NRCS ecological sites framework [abstract]. Page 85 in R.E. Masters and K.E.M. Galley (eds.).Proceedings of the 23rd Tall Timbers Fire Ecology Conference: Fire in Grassland and Shrubland Ecosystems. Tall Timbers ResearchStation, Tallahassee, Florida, USA.
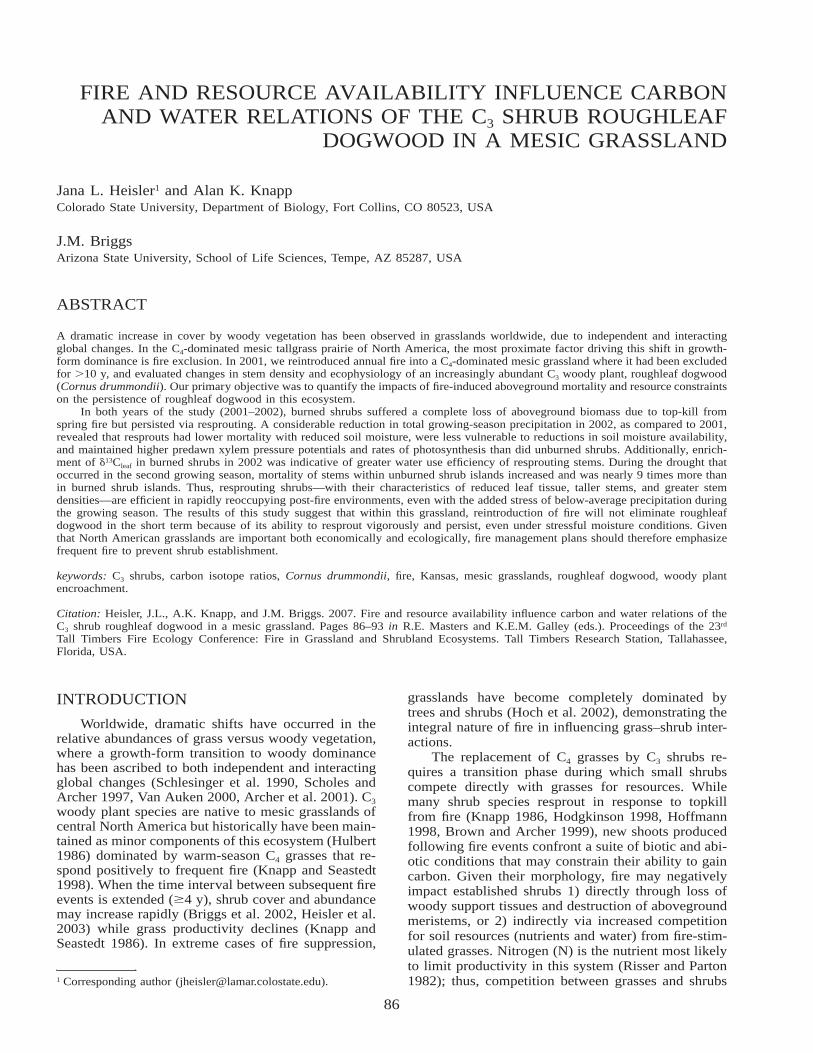
86
FIRE AND RESOURCE AVAILABILITY INFLUENCE CARBONAND WATER RELATIONS OF THE C3 SHRUB ROUGHLEAF
DOGWOOD IN A MESIC GRASSLAND
Jana L. Heisler1 and Alan K. KnappColorado State University, Department of Biology, Fort Collins, CO 80523, USA
J.M. BriggsArizona State University, School of Life Sciences, Tempe, AZ 85287, USA
ABSTRACT
A dramatic increase in cover by woody vegetation has been observed in grasslands worldwide, due to independent and interactingglobal changes. In the C4-dominated mesic tallgrass prairie of North America, the most proximate factor driving this shift in growth-form dominance is fire exclusion. In 2001, we reintroduced annual fire into a C4-dominated mesic grassland where it had been excludedfor �10 y, and evaluated changes in stem density and ecophysiology of an increasingly abundant C3 woody plant, roughleaf dogwood(Cornus drummondii). Our primary objective was to quantify the impacts of fire-induced aboveground mortality and resource constraintson the persistence of roughleaf dogwood in this ecosystem.
In both years of the study (2001–2002), burned shrubs suffered a complete loss of aboveground biomass due to top-kill fromspring fire but persisted via resprouting. A considerable reduction in total growing-season precipitation in 2002, as compared to 2001,revealed that resprouts had lower mortality with reduced soil moisture, were less vulnerable to reductions in soil moisture availability,and maintained higher predawn xylem pressure potentials and rates of photosynthesis than did unburned shrubs. Additionally, enrich-ment of �13Cleaf in burned shrubs in 2002 was indicative of greater water use efficiency of resprouting stems. During the drought thatoccurred in the second growing season, mortality of stems within unburned shrub islands increased and was nearly 9 times more thanin burned shrub islands. Thus, resprouting shrubs—with their characteristics of reduced leaf tissue, taller stems, and greater stemdensities—are efficient in rapidly reoccupying post-fire environments, even with the added stress of below-average precipitation duringthe growing season. The results of this study suggest that within this grassland, reintroduction of fire will not eliminate roughleafdogwood in the short term because of its ability to resprout vigorously and persist, even under stressful moisture conditions. Giventhat North American grasslands are important both economically and ecologically, fire management plans should therefore emphasizefrequent fire to prevent shrub establishment.
keywords: C3 shrubs, carbon isotope ratios, Cornus drummondii, fire, Kansas, mesic grasslands, roughleaf dogwood, woody plantencroachment.
Citation: Heisler, J.L., A.K. Knapp, and J.M. Briggs. 2007. Fire and resource availability influence carbon and water relations of theC3 shrub roughleaf dogwood in a mesic grassland. Pages 86–93 in R.E. Masters and K.E.M. Galley (eds.). Proceedings of the 23rd
Tall Timbers Fire Ecology Conference: Fire in Grassland and Shrubland Ecosystems. Tall Timbers Research Station, Tallahassee,Florida, USA.
INTRODUCTION
Worldwide, dramatic shifts have occurred in therelative abundances of grass versus woody vegetation,where a growth-form transition to woody dominancehas been ascribed to both independent and interactingglobal changes (Schlesinger et al. 1990, Scholes andArcher 1997, Van Auken 2000, Archer et al. 2001). C3
woody plant species are native to mesic grasslands ofcentral North America but historically have been main-tained as minor components of this ecosystem (Hulbert1986) dominated by warm-season C4 grasses that re-spond positively to frequent fire (Knapp and Seastedt1998). When the time interval between subsequent fireevents is extended (�4 y), shrub cover and abundancemay increase rapidly (Briggs et al. 2002, Heisler et al.2003) while grass productivity declines (Knapp andSeastedt 1986). In extreme cases of fire suppression,
1 Corresponding author ([email protected]).
grasslands have become completely dominated bytrees and shrubs (Hoch et al. 2002), demonstrating theintegral nature of fire in influencing grass–shrub inter-actions.
The replacement of C4 grasses by C3 shrubs re-quires a transition phase during which small shrubscompete directly with grasses for resources. Whilemany shrub species resprout in response to topkillfrom fire (Knapp 1986, Hodgkinson 1998, Hoffmann1998, Brown and Archer 1999), new shoots producedfollowing fire events confront a suite of biotic and abi-otic conditions that may constrain their ability to gaincarbon. Given their morphology, fire may negativelyimpact established shrubs 1) directly through loss ofwoody support tissues and destruction of abovegroundmeristems, or 2) indirectly via increased competitionfor soil resources (nutrients and water) from fire-stim-ulated grasses. Nitrogen (N) is the nutrient most likelyto limit productivity in this system (Risser and Parton1982); thus, competition between grasses and shrubs

87CARBON AND WATER RELATIONS OF ROUGHLEAF DOGWOOD
in mesic grasslands is considered strongest for this re-source (Kochy and Wilson 2000). Additionally, annualfire reduces available N in the soil due to consistentlyhigh levels of plant production (Blair et al. 1998). Be-cause fires in this region occur most often in spring(March–May), the combined effect of removing ac-cumulated plant litter and low albedo of blackenedsoils contributes to rapid warming and subsequent dry-ing of the soil (Knapp and Seastedt 1986). Such con-ditions may negatively impact plant–water relations,further constrain carbon gain, and reduce the ability ofresprouting shrubs to recover and reoccupy sites. Weexpected that shrubs in this transition stage (young andrecently established) would show clearest evidence ofthe adverse effects of fire and reduced resource avail-ability, given a less developed root system and smallercarbohydrate stores.
From a management perspective, understandingthe mechanisms that constrain or facilitate growth ofshrubs during this transition stage is essential. We referto this as a ‘‘transition stage’’ because, from a plantcommunity perspective, young shrubs in this stage ex-ist as 40–60 clumped stems (�0.8 m in height) withina matrix of C4 grasses and C3 forbs (circa 5–8 m2 inarea). While many shrub islands may be spread acrossthe landscape, herbaceous vegetation biomass remainshigh and represents fuels effective at carrying fire. Incontrast, advanced stages of shrub growth and expan-sion in this ecosystem exhibit limited herbaceous bio-mass (fuels) in and around shrub islands that fail tosupport fire. Thus, introduction of annual fire duringthe transition phase may reduce or eliminate shrubs.However, when the fire return interval is extended to�4 y, shrubs rapidly establish and increase in cover(Heisler et al. 2003).
While Lett and Knapp (2003) demonstrated thatphysical removal of large shrub islands promotes a re-turn to a more grass-dominated ecosystem, the timerequired for complete restoration is uncertain and theprocess is labor intensive. Such a landscape in whichC4 grasses and mature C3 shrubs are codominant hasbeen characterized as an alternative stable state that isbiotically maintained by shrub-induced low light levelsthat eliminate understory grasses (Briggs et al. 2005).This evidence suggests that research focusing on theinitial years post-establishment, when shrubs coexistwith grasses, may be the most effective time to inter-vene.
The primary goal of this research was to reintro-duce annual fire into a landscape in which it had beenexcluded for �10 y to assess whether successive fireevents would reduce or eliminate recently establishedshrubs in this ecosystem. We selected roughleaf dog-wood (Cornus drummondii) as a focal species becauseit is one of the most abundant shrubs in this grasslandand tends to form monospecific stands (or ‘‘islands’’)as it matures in the absence of frequent fire. Given thedifference in total growing-season precipitation be-tween the two years of this study, we were able toquantify the response of both burned and unburnedshrubs to ‘‘average’’ (2001) and stressful (2002) be-low-average moisture conditions.
We tested the following hypotheses: 1) leaf-levelphotosynthetic rates of resprouts, as compared to un-burned shrubs, would be reduced; 2) water limitationsin burned shrubs would be greater, with resprouts hav-ing lower predawn xylem pressure potentials (XPPs)and greater water use efficiency (WUE) than preexist-ing stems; and 3) N additions would result in elevatedrates of photosynthesis in both burned and unburnedshrubs as compared to their respective unfertilizedcounterparts, suggesting competition with grasses forplant-available N in the soil. To test these hypotheses,we utilized both instantaneous and integrative mea-surements of plant carbon and water relations (leaf-level photosynthetic rates, predawn XPPs, and carbonisotope ratios) and estimated stem densities of burnedand unburned shrubs in a factorial experiment that in-cluded fire and N addition during the 2001–2002growing seasons.
STUDY AREA
This study was conducted during the 2001 and2002 growing seasons at the Konza Prairie BiologicalStation (KPBS), a 3,487-ha tract of unplowed nativetallgrass prairie located approximately 15 km south ofManhattan, Kansas (39�05�N, 96�35�W). KPBS is lo-cated within the Flint Hills and exists as the largestcontinuous tract (1.6 million ha) of unplowed tallgrassprairie in North America. KPBS is characterized by astream-dissected landscape and rolling hills erodedfrom chert-bearing limestone and shale of Permianage. Elevation ranges from 320 m in the lowlands to440 m in uplands and soil (Oviatt 1998). Soil depthvaries with topographic postion, with shallow, rockyupland soils and considerably deeper lowland soils thatmay extend to �1 m. In 1981, KPBS was incorporatedinto the National Science Foundation’s Long-TermEcological Research network. The location of thisstudy was an experimental unit that has been desig-nated as unburned and ungrazed since 1981; however,a wildfire occurred in 1991, resulting in a 10-y post-fire recovery.
The plant community of KPBS was dominated byC4 perennial grasses, such as big bluestem (Andropo-gon gerardii) and Indiangrass (Sorghastrum nutans),but the presence of several hundred native forb species(non-graminoid herbs) greatly increased plant com-munity diversity (Freeman 1998). C3 shrubs such asroughleaf dogwood and smooth sumac (Rhus glabra)were native to this ecosystem and became increasinglyabundant in areas in which fire occurred less frequent-ly (Bragg and Hulbert 1976, Heisler et al. 2003).
The climate of KPBS was characterized by a highdegree of interannual variability in precipitation. Meanannual precipitation (100-y average) was 835 mm,75% of which fell during the growing season (April–September; approximately 630 mm). Precipitation dur-ing the 2001 growing season was 720 mm and aboveaverage; however, only 510 mm of rain fell during the2002 growing season.
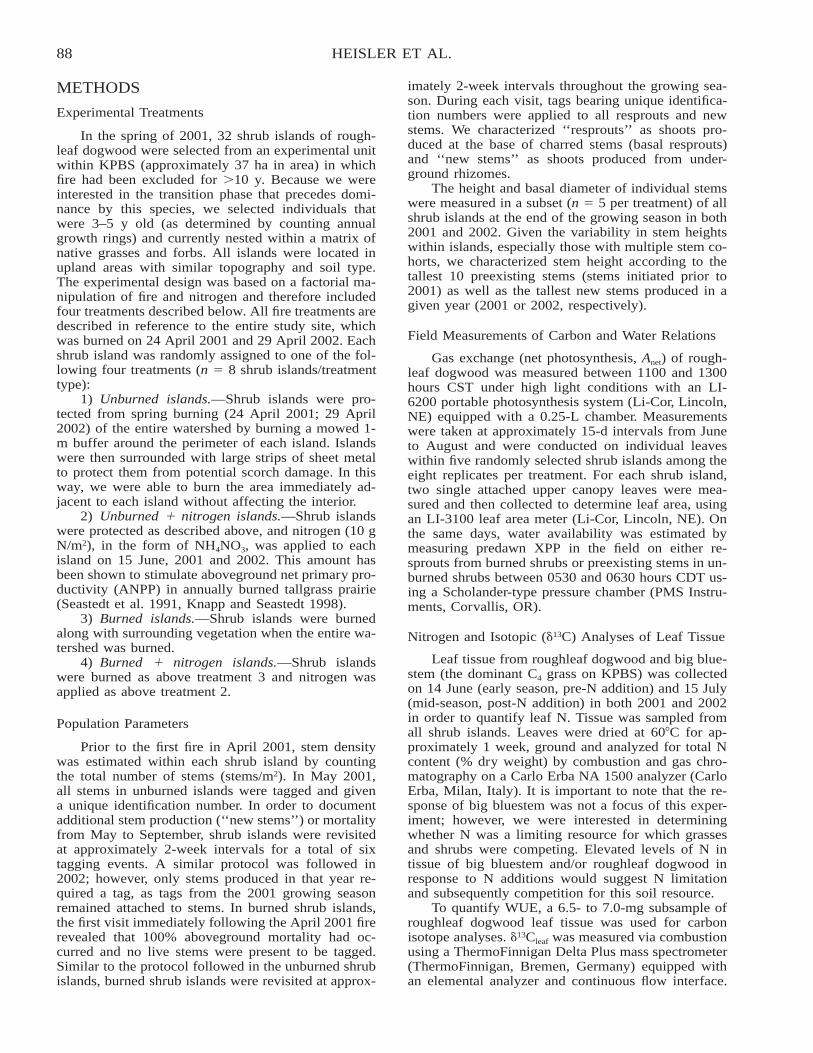
88 HEISLER ET AL.
METHODS
Experimental Treatments
In the spring of 2001, 32 shrub islands of rough-leaf dogwood were selected from an experimental unitwithin KPBS (approximately 37 ha in area) in whichfire had been excluded for �10 y. Because we wereinterested in the transition phase that precedes domi-nance by this species, we selected individuals thatwere 3–5 y old (as determined by counting annualgrowth rings) and currently nested within a matrix ofnative grasses and forbs. All islands were located inupland areas with similar topography and soil type.The experimental design was based on a factorial ma-nipulation of fire and nitrogen and therefore includedfour treatments described below. All fire treatments aredescribed in reference to the entire study site, whichwas burned on 24 April 2001 and 29 April 2002. Eachshrub island was randomly assigned to one of the fol-lowing four treatments (n � 8 shrub islands/treatmenttype):
1) Unburned islands.—Shrub islands were pro-tected from spring burning (24 April 2001; 29 April2002) of the entire watershed by burning a mowed 1-m buffer around the perimeter of each island. Islandswere then surrounded with large strips of sheet metalto protect them from potential scorch damage. In thisway, we were able to burn the area immediately ad-jacent to each island without affecting the interior.
2) Unburned � nitrogen islands.—Shrub islandswere protected as described above, and nitrogen (10 gN/m2), in the form of NH4NO3, was applied to eachisland on 15 June, 2001 and 2002. This amount hasbeen shown to stimulate aboveground net primary pro-ductivity (ANPP) in annually burned tallgrass prairie(Seastedt et al. 1991, Knapp and Seastedt 1998).
3) Burned islands.—Shrub islands were burnedalong with surrounding vegetation when the entire wa-tershed was burned.
4) Burned � nitrogen islands.—Shrub islandswere burned as above treatment 3 and nitrogen wasapplied as above treatment 2.
Population Parameters
Prior to the first fire in April 2001, stem densitywas estimated within each shrub island by countingthe total number of stems (stems/m2). In May 2001,all stems in unburned islands were tagged and givena unique identification number. In order to documentadditional stem production (‘‘new stems’’) or mortalityfrom May to September, shrub islands were revisitedat approximately 2-week intervals for a total of sixtagging events. A similar protocol was followed in2002; however, only stems produced in that year re-quired a tag, as tags from the 2001 growing seasonremained attached to stems. In burned shrub islands,the first visit immediately following the April 2001 firerevealed that 100% aboveground mortality had oc-curred and no live stems were present to be tagged.Similar to the protocol followed in the unburned shrubislands, burned shrub islands were revisited at approx-
imately 2-week intervals throughout the growing sea-son. During each visit, tags bearing unique identifica-tion numbers were applied to all resprouts and newstems. We characterized ‘‘resprouts’’ as shoots pro-duced at the base of charred stems (basal resprouts)and ‘‘new stems’’ as shoots produced from under-ground rhizomes.
The height and basal diameter of individual stemswere measured in a subset (n � 5 per treatment) of allshrub islands at the end of the growing season in both2001 and 2002. Given the variability in stem heightswithin islands, especially those with multiple stem co-horts, we characterized stem height according to thetallest 10 preexisting stems (stems initiated prior to2001) as well as the tallest new stems produced in agiven year (2001 or 2002, respectively).
Field Measurements of Carbon and Water Relations
Gas exchange (net photosynthesis, Anet) of rough-leaf dogwood was measured between 1100 and 1300hours CST under high light conditions with an LI-6200 portable photosynthesis system (Li-Cor, Lincoln,NE) equipped with a 0.25-L chamber. Measurementswere taken at approximately 15-d intervals from Juneto August and were conducted on individual leaveswithin five randomly selected shrub islands among theeight replicates per treatment. For each shrub island,two single attached upper canopy leaves were mea-sured and then collected to determine leaf area, usingan LI-3100 leaf area meter (Li-Cor, Lincoln, NE). Onthe same days, water availability was estimated bymeasuring predawn XPP in the field on either re-sprouts from burned shrubs or preexisting stems in un-burned shrubs between 0530 and 0630 hours CDT us-ing a Scholander-type pressure chamber (PMS Instru-ments, Corvallis, OR).
Nitrogen and Isotopic (�13C) Analyses of Leaf Tissue
Leaf tissue from roughleaf dogwood and big blue-stem (the dominant C4 grass on KPBS) was collectedon 14 June (early season, pre-N addition) and 15 July(mid-season, post-N addition) in both 2001 and 2002in order to quantify leaf N. Tissue was sampled fromall shrub islands. Leaves were dried at 60�C for ap-proximately 1 week, ground and analyzed for total Ncontent (% dry weight) by combustion and gas chro-matography on a Carlo Erba NA 1500 analyzer (CarloErba, Milan, Italy). It is important to note that the re-sponse of big bluestem was not a focus of this exper-iment; however, we were interested in determiningwhether N was a limiting resource for which grassesand shrubs were competing. Elevated levels of N intissue of big bluestem and/or roughleaf dogwood inresponse to N additions would suggest N limitationand subsequently competition for this soil resource.
To quantify WUE, a 6.5- to 7.0-mg subsample ofroughleaf dogwood leaf tissue was used for carbonisotope analyses. �13Cleaf was measured via combustionusing a ThermoFinnigan Delta Plus mass spectrometer(ThermoFinnigan, Bremen, Germany) equipped withan elemental analyzer and continuous flow interface.
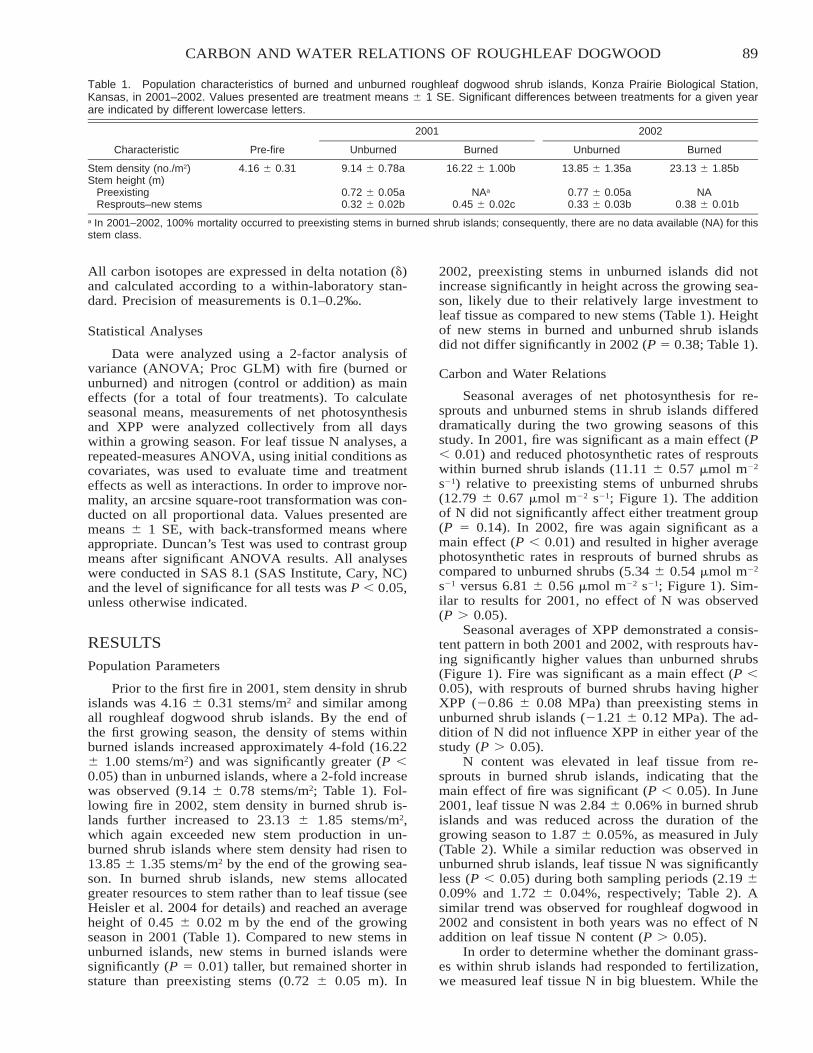
89CARBON AND WATER RELATIONS OF ROUGHLEAF DOGWOOD
Table 1. Population characteristics of burned and unburned roughleaf dogwood shrub islands, Konza Prairie Biological Station,Kansas, in 2001–2002. Values presented are treatment means � 1 SE. Significant differences between treatments for a given yearare indicated by different lowercase letters.
Characteristic Pre-fire
2001
Unburned Burned
2002
Unburned Burned
Stem density (no./m2) 4.16 � 0.31 9.14 � 0.78a 16.22 � 1.00b 13.85 � 1.35a 23.13 � 1.85bStem height (m)
Preexisting 0.72 � 0.05a NAa 0.77 � 0.05a NAResprouts–new stems 0.32 � 0.02b 0.45 � 0.02c 0.33 � 0.03b 0.38 � 0.01b
a In 2001–2002, 100% mortality occurred to preexisting stems in burned shrub islands; consequently, there are no data available (NA) for thisstem class.
All carbon isotopes are expressed in delta notation (�)and calculated according to a within-laboratory stan-dard. Precision of measurements is 0.1–0.2‰.
Statistical Analyses
Data were analyzed using a 2-factor analysis ofvariance (ANOVA; Proc GLM) with fire (burned orunburned) and nitrogen (control or addition) as maineffects (for a total of four treatments). To calculateseasonal means, measurements of net photosynthesisand XPP were analyzed collectively from all dayswithin a growing season. For leaf tissue N analyses, arepeated-measures ANOVA, using initial conditions ascovariates, was used to evaluate time and treatmenteffects as well as interactions. In order to improve nor-mality, an arcsine square-root transformation was con-ducted on all proportional data. Values presented aremeans � 1 SE, with back-transformed means whereappropriate. Duncan’s Test was used to contrast groupmeans after significant ANOVA results. All analyseswere conducted in SAS 8.1 (SAS Institute, Cary, NC)and the level of significance for all tests was P 0.05,unless otherwise indicated.
RESULTS
Population Parameters
Prior to the first fire in 2001, stem density in shrubislands was 4.16 � 0.31 stems/m2 and similar amongall roughleaf dogwood shrub islands. By the end ofthe first growing season, the density of stems withinburned islands increased approximately 4-fold (16.22� 1.00 stems/m2) and was significantly greater (P 0.05) than in unburned islands, where a 2-fold increasewas observed (9.14 � 0.78 stems/m2; Table 1). Fol-lowing fire in 2002, stem density in burned shrub is-lands further increased to 23.13 � 1.85 stems/m2,which again exceeded new stem production in un-burned shrub islands where stem density had risen to13.85 � 1.35 stems/m2 by the end of the growing sea-son. In burned shrub islands, new stems allocatedgreater resources to stem rather than to leaf tissue (seeHeisler et al. 2004 for details) and reached an averageheight of 0.45 � 0.02 m by the end of the growingseason in 2001 (Table 1). Compared to new stems inunburned islands, new stems in burned islands weresignificantly (P � 0.01) taller, but remained shorter instature than preexisting stems (0.72 � 0.05 m). In
2002, preexisting stems in unburned islands did notincrease significantly in height across the growing sea-son, likely due to their relatively large investment toleaf tissue as compared to new stems (Table 1). Heightof new stems in burned and unburned shrub islandsdid not differ significantly in 2002 (P � 0.38; Table 1).
Carbon and Water Relations
Seasonal averages of net photosynthesis for re-sprouts and unburned stems in shrub islands differeddramatically during the two growing seasons of thisstudy. In 2001, fire was significant as a main effect (P 0.01) and reduced photosynthetic rates of resproutswithin burned shrub islands (11.11 � 0.57 mol m�2
s�1) relative to preexisting stems of unburned shrubs(12.79 � 0.67 mol m�2 s�1; Figure 1). The additionof N did not significantly affect either treatment group(P � 0.14). In 2002, fire was again significant as amain effect (P 0.01) and resulted in higher averagephotosynthetic rates in resprouts of burned shrubs ascompared to unburned shrubs (5.34 � 0.54 mol m�2
s�1 versus 6.81 � 0.56 mol m�2 s�1; Figure 1). Sim-ilar to results for 2001, no effect of N was observed(P � 0.05).
Seasonal averages of XPP demonstrated a consis-tent pattern in both 2001 and 2002, with resprouts hav-ing significantly higher values than unburned shrubs(Figure 1). Fire was significant as a main effect (P 0.05), with resprouts of burned shrubs having higherXPP (�0.86 � 0.08 MPa) than preexisting stems inunburned shrub islands (�1.21 � 0.12 MPa). The ad-dition of N did not influence XPP in either year of thestudy (P � 0.05).
N content was elevated in leaf tissue from re-sprouts in burned shrub islands, indicating that themain effect of fire was significant (P 0.05). In June2001, leaf tissue N was 2.84 � 0.06% in burned shrubislands and was reduced across the duration of thegrowing season to 1.87 � 0.05%, as measured in July(Table 2). While a similar reduction was observed inunburned shrub islands, leaf tissue N was significantlyless (P 0.05) during both sampling periods (2.19 �0.09% and 1.72 � 0.04%, respectively; Table 2). Asimilar trend was observed for roughleaf dogwood in2002 and consistent in both years was no effect of Naddition on leaf tissue N content (P � 0.05).
In order to determine whether the dominant grass-es within shrub islands had responded to fertilization,we measured leaf tissue N in big bluestem. While the

90 HEISLER ET AL.
Fig. 1. Seasonal means for net photosynthetic rates (Anet; left), predawn xylem pressure potentials (right), and precipitation (inset)during the 2001–2002 growing seasons for burned and unburned shrub islands of roughleaf dogwood, Konza Prairie Biological Station,Kansas. Vertical bars represent �1 SE. Within years and according to measurement type, significant differences (P 0.05) areindicated by different letters.
Table 2. Leaf tissue nitrogen (N; %) for roughleaf dogwood and big bluestem within shrub islands, Konza Prairie Biological Station,Kansas, in 2001 and 2002. Samples were taken in June (pre-N addition) and July (approximately 1 mo post-N addition). Values shownare means � 1 SE. Lowercase letters indicate significant differences (P 0.05) for main effects both within and between time periods.
Year Species Main effect Treatment
Month
Jun Jul
2001 Roughleaf dogwood Fire Burned 2.84 � 0.06a 1.87 � 0.05cUnburned 2.19 � 0.09b 1.72 � 0.04d
Nitrogen Control 2.57 � 0.02a 1.82 � 0.05bAddition 2.48 � 0.11a 1.78 � 0.06b
Big bluestem Fire Burned 1.57 � 0.04a 1.37 � 0.06bUnburned 1.55 � 0.05a 1.33 � 0.03b
Nitrogen Control 1.53 � 0.05a 1.26 � 0.03bAddition 1.59 � 0.04a 1.44 � 0.06c
2002 Roughleaf dogwood Fire Burned 2.60 � 0.06a 1.60 � 0.04cUnburned 2.31 � 0.05b 1.47 � 0.03d
Nitrogen Control 2.50 � 0.06a 1.51 � 0.04bAddition 2.38 � 0.06a 1.55 � 0.03b
Big bluestem Fire Burned 2.18 � 0.04a 1.09 � 0.03bUnburned 2.04 � 0.05a 1.14 � 0.03b
Nitrogen Control 2.11 � 0.04a 1.13 � 0.03bAddition 2.09 � 0.06a 1.11 � 0.03b
main effect of fire did not significantly influence leaftissue N content in big bluestem (P � 0.05), in 2001the addition of N resulted in an increase in leaf tissueN content in fertilized islands as compared to controls(1.44 � 0.06% versus 1.26 � 0.03%; Table 2). Therewas no effect of fire or N observed in 2002.
In 2001, burned and unburned shrubs had similarcarbon isotope ratios and thus WUE over the courseof the growing season (Figure 2). In contrast, growing-season precipitation was reduced by approximately200 mm in the 2002 growing season, and resprouts ofburned shrubs were enriched in �13C (�25.8 � 33‰)as compared to unburned shrubs (�26.90 � 0.25‰).This enrichment of 13C in the leaf tissue of burnedshrubs indicates greater WUE (Figure 2).
Stem Mortality
An assessment of growing-season stem mortalityrevealed that in 2001, rates were significantly greater
within unburned shrub islands (8.45 � 1.51%) thanwithin burned shrub islands (2.50 � 0.06%; P 0.01;Figure 3). While similar rates were observed in 2002for burned shrub islands (2.72 � 0.67%), mortalityrates in protected islands increased to 17.58 � 2.76%.
DISCUSSION
Grasslands are structured by the interaction of fire,climate variability, and herbivory (Cowles 1928), andtallgrass prairie is no exception. Historically, this com-bination of factors has mediated a tension zone be-tween C4 grass and C3 woody species, resulting in anecosystem that is dominated by herbaceous plants.During the last century, however, reductions in the in-tensity and frequency of fire have been associated withan increase in woody vegetation abundance. Roughleafdogwood has proven to be a particularly aggressivespecies, as mature shrub islands completely exclude
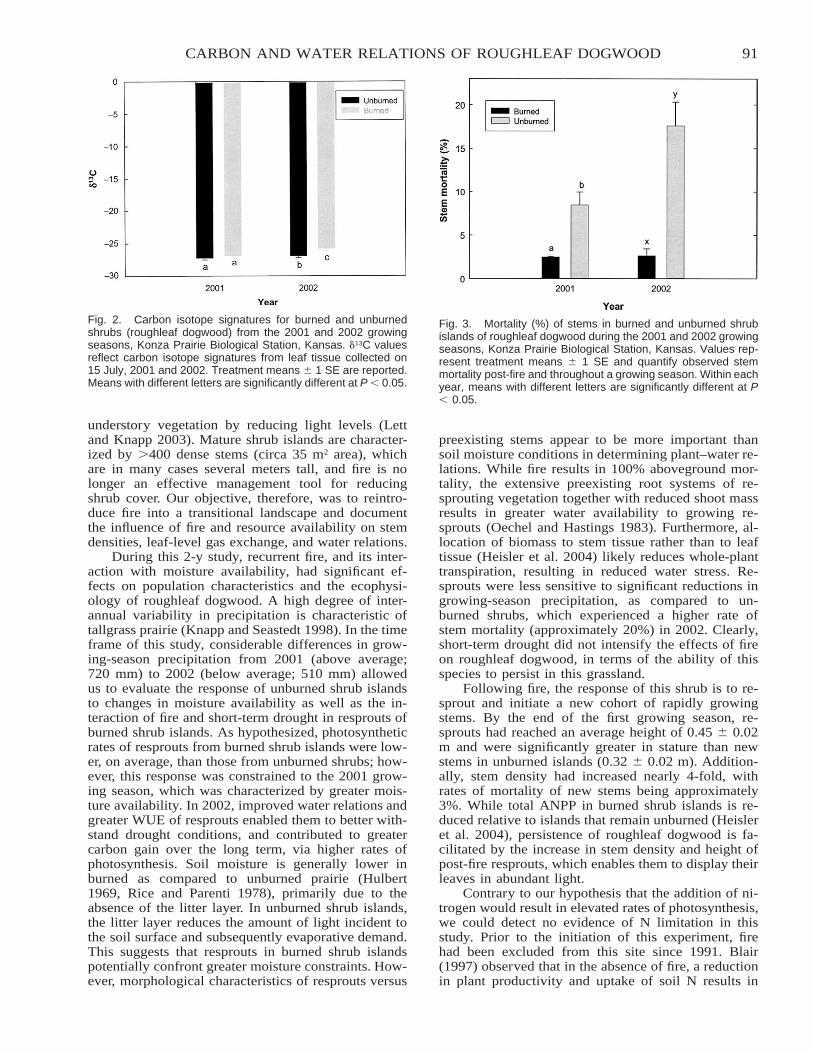
91CARBON AND WATER RELATIONS OF ROUGHLEAF DOGWOOD
Fig. 2. Carbon isotope signatures for burned and unburnedshrubs (roughleaf dogwood) from the 2001 and 2002 growingseasons, Konza Prairie Biological Station, Kansas. �13C valuesreflect carbon isotope signatures from leaf tissue collected on15 July, 2001 and 2002. Treatment means � 1 SE are reported.Means with different letters are significantly different at P 0.05.
Fig. 3. Mortality (%) of stems in burned and unburned shrubislands of roughleaf dogwood during the 2001 and 2002 growingseasons, Konza Prairie Biological Station, Kansas. Values rep-resent treatment means � 1 SE and quantify observed stemmortality post-fire and throughout a growing season. Within eachyear, means with different letters are significantly different at P 0.05.
understory vegetation by reducing light levels (Lettand Knapp 2003). Mature shrub islands are character-ized by �400 dense stems (circa 35 m2 area), whichare in many cases several meters tall, and fire is nolonger an effective management tool for reducingshrub cover. Our objective, therefore, was to reintro-duce fire into a transitional landscape and documentthe influence of fire and resource availability on stemdensities, leaf-level gas exchange, and water relations.
During this 2-y study, recurrent fire, and its inter-action with moisture availability, had significant ef-fects on population characteristics and the ecophysi-ology of roughleaf dogwood. A high degree of inter-annual variability in precipitation is characteristic oftallgrass prairie (Knapp and Seastedt 1998). In the timeframe of this study, considerable differences in grow-ing-season precipitation from 2001 (above average;720 mm) to 2002 (below average; 510 mm) allowedus to evaluate the response of unburned shrub islandsto changes in moisture availability as well as the in-teraction of fire and short-term drought in resprouts ofburned shrub islands. As hypothesized, photosyntheticrates of resprouts from burned shrub islands were low-er, on average, than those from unburned shrubs; how-ever, this response was constrained to the 2001 grow-ing season, which was characterized by greater mois-ture availability. In 2002, improved water relations andgreater WUE of resprouts enabled them to better with-stand drought conditions, and contributed to greatercarbon gain over the long term, via higher rates ofphotosynthesis. Soil moisture is generally lower inburned as compared to unburned prairie (Hulbert1969, Rice and Parenti 1978), primarily due to theabsence of the litter layer. In unburned shrub islands,the litter layer reduces the amount of light incident tothe soil surface and subsequently evaporative demand.This suggests that resprouts in burned shrub islandspotentially confront greater moisture constraints. How-ever, morphological characteristics of resprouts versus
preexisting stems appear to be more important thansoil moisture conditions in determining plant–water re-lations. While fire results in 100% aboveground mor-tality, the extensive preexisting root systems of re-sprouting vegetation together with reduced shoot massresults in greater water availability to growing re-sprouts (Oechel and Hastings 1983). Furthermore, al-location of biomass to stem tissue rather than to leaftissue (Heisler et al. 2004) likely reduces whole-planttranspiration, resulting in reduced water stress. Re-sprouts were less sensitive to significant reductions ingrowing-season precipitation, as compared to un-burned shrubs, which experienced a higher rate ofstem mortality (approximately 20%) in 2002. Clearly,short-term drought did not intensify the effects of fireon roughleaf dogwood, in terms of the ability of thisspecies to persist in this grassland.
Following fire, the response of this shrub is to re-sprout and initiate a new cohort of rapidly growingstems. By the end of the first growing season, re-sprouts had reached an average height of 0.45 � 0.02m and were significantly greater in stature than newstems in unburned islands (0.32 � 0.02 m). Addition-ally, stem density had increased nearly 4-fold, withrates of mortality of new stems being approximately3%. While total ANPP in burned shrub islands is re-duced relative to islands that remain unburned (Heisleret al. 2004), persistence of roughleaf dogwood is fa-cilitated by the increase in stem density and height ofpost-fire resprouts, which enables them to display theirleaves in abundant light.
Contrary to our hypothesis that the addition of ni-trogen would result in elevated rates of photosynthesis,we could detect no evidence of N limitation in thisstudy. Prior to the initiation of this experiment, firehad been excluded from this site since 1991. Blair(1997) observed that in the absence of fire, a reductionin plant productivity and uptake of soil N results in
92 HEISLER ET AL.
the accumulation of this resource. Thus, when N ad-ditions accompany fire in long-unburned areas, theproduction response, if any, is limited. This explainsthe absence of a response to N addition in 2001. In2002, a reduction in growing-season precipitation mayhave resulted in water being a much greater limitingresource rather than soil N. Although resprouts hadgreater tissue N levels, it was not associated with anincrease in photosynthetic rate, suggesting that N wasnot limiting photosynthesis in roughleaf dogwood.
In summary, short-term reductions in growing-sea-son precipitation, and therefore moisture availability,had a strong impact on seasonal photosynthetic ratesand carbon gain of roughleaf dogwood. During a yearof above-average precipitation, unburned shrubs hadhigher rates of photosynthesis as compared to re-sprouts of burned vegetation. Conversely, when grow-ing-season precipitation was reduced to below average,unburned shrubs experienced greater moisture stressand a reduction in photosynthetic rate as well as ele-vated rates of stem mortality. While resprouts inburned shrub islands were also impacted by drought,they were able to sustain higher rates of photosynthesisand experienced no increase in stem mortality duringthe growing season. During dry periods, a well-devel-oped root system and reduced leaf area ameliorate con-ditions of moisture limitation in resprouts, thereby fa-cilitating persistence of roughleaf dogwood. We pre-sent these data with the caveat that responses of rough-leaf dogwood are limited to the early stages ofrestoring annual fire to this ecosystem. We could findno other published studies describing responses ofshrubs to an annual fire regime in the long term. Whileannually burned mesic grasslands are generally devoidof woody vegetation, few data exist to suggest that thisis due to the gradual elimination of shrubs. Rather,annual fire instead appears to have prevented shrubsfrom establishing in C4-dominated grasslands. Indeed,further studies are needed of how the functional re-sponses of this shrub are affected by repeated cyclesof fire and drought, particularly given that climatemodels predict extreme weather in the future.
MANAGEMENT IMPLICATIONS
The expansion of woody vegetation in grass-dom-inated ecosystems is a global phenomenon. Fire sup-pression is the most cited cause of shrub expansion inmesic grasslands, and the long-term effect of elimi-nating fire from this ecosystem can be the completeconversion of grassland to shrubland. While long-termdata suggest that fire remains effective in preventingshrub establishment, it is currently unclear as to wheth-er management strategies that prescribe frequent firewill be effective in reducing or eliminating shrubsfrom mesic grassland. Our study results suggest thatin the short term, fire does not reduce stem densitieswithin shrub islands and that resprouting shrubs pos-sess morphological attributes that enable them to con-front moisture constraints that are typical of grass-lands. It is our goal to continue monitoring the re-
sponse of roughleaf dogwood to annual fire in orderto determine the long-term efficacy of restoring fre-quent fire to shrub-invaded mesic grasslands. Giventhe existing data, management plans should emphasizefrequent (4-y fire return intervals) fire in an effort toprevent shrub establishment.
ACKNOWLEDGMENTS
We thank Amy Seery, Barry Broeckleman, andMark Lundgren for field assistance and sample pro-cessing. For their assistance and cooperation in exe-cuting the experimental fire treatment regime of thisresearch study, we also thank the Konza Prairie Bio-logical Station. The comments and suggestions of twoanonymous reviewers greatly improved this manu-script. This study was funded by National ScienceFoundation grant 0075350.
LITERATURE CITEDArcher, S., T.W. Boutton, and K.A. Hibbard. 2001. Trees in
grasslands: biogeochemical consequences of woody plantexpansion. Pages 115–130 in E.-D. Schulze, M. Heimann,S. Harrison, E. Holland, J. Lloyd, I.C. Prentice, and D.Schimel (eds.). Global biogeochemical cycles in the climatesystems. Academic Press, San Diego, CA.
Blair, J.M. 1997. Fire, N availability, and plant responses ingrasslands: a test of the transient maxima hypothesis. Ecol-ogy 78:2359–2368.
Blair, J.M., T.R. Seastedt, C.W. Rice, and R.A. Ramundo. 1998.Terrestrial nutrient cycling in tallgrass prairie. Pages 222–243 in A.K. Knapp, J.M. Briggs, D.C. Hartnett, and S.L.Collins (eds.). Grassland dynamics: long-term ecological re-search in tallgrass prairie. Oxford University Press, NewYork.
Bragg, T.B., and L.C. Hulbert. 1976. Woody plant invasions ofunburned Kansas bluestem prairie. Journal of Range Man-agement 29:19–23.
Briggs, J.M., A.K. Knapp, J.M. Blair, J.L. Heisler, G.A. Hoch,M.S. Lett, and K. McCarron. 2005. An ecosystem in tran-sition: woody plant expansion into mesic grassland. Bio-Science 55:243–254.
Briggs, J.M., A.K. Knapp, and B.L. Brock. 2002. Expansion ofwoody plants in tallgrass prairie: a 15-year study of fire andfire–grazing interactions. American Midland Naturalist 147:287–294.
Brown, J.R., and S. Archer. 1999. Shrub invasion of grassland:recruitment is continuous and not regulated by herbaceousbiomass or density. Ecology 80:2385–2396.
Cowles, H.C. 1928. Persistence of prairies. Ecology 9:380–382.Freeman, C.C. 1998. The flora of Konza Prairie: a historical
review and contemporary patterns. Pages 69–80 in A.K.Knapp, J.M. Briggs, D.C. Hartnett, and S.L. Collins (eds.).Grassland dynamics: long-term ecological research in tall-grass prairie. Oxford University Press, New York.
Heisler, J.L., J.M. Briggs, and A.K. Knapp. 2003. Long-termpatterns of shrub expansion in a C4-dominated grassland:fire frequency and the dynamics of shrub cover and abun-dance. American Journal of Botany 90:423–428.
Heisler, J.L., J.M. Briggs, A.K. Knapp, J.M. Blair, and A. Seery.2004. Direct and indirect effects of fire on shrub densityand aboveground productivity in a mesic grassland. Ecol-ogy 85:2245–2257.
Hoch, G.A., J.M. Briggs, and L.C. Johnson. 2002. Assessing therate, mechanisms, and consequences of the conversion oftallgrass prairie to Juniperus virginiana forest. Ecosystems5:578–586.
93CARBON AND WATER RELATIONS OF ROUGHLEAF DOGWOOD
Hodgkinson, K.C. 1998. Sprouting success of shrubs after fire:height-dependent relationships for different strategies. Oec-ologia 115:64–72.
Hoffmann, W.A. 1998. Post-burn reproduction of woody plantsin a Neotropical savanna: the relative importance of sexualand vegetative reproduction. Journal of Applied Ecology35:422–433.
Hulbert, L.C. 1969. Fire and litter effects in undisturbed blue-stem prairie in Kansas. Ecology 50:874–877.
Hulbert, L.C. 1986. Fire effects on tallgrass prairie. Pages 138–142 in G.K. Clambey and R.H. Pemble (eds.). Proceedingsof the Ninth North American Prairie Conference, 29 Jul–1Aug 1984, Moorhead, MN. North Dakota State University,Fargo.
Knapp, A.K. 1986. Postfire water relations, production, and bio-mass allocation in the shrub, Rhus glabra, in tallgrass prai-rie. Botanical Gazette 147:90–97.
Knapp, A.K., and T.R. Seastedt. 1986. Detritus accumulationlimits productivity of tallgrass prairie. BioScience 36:662–668.
Knapp, A.K., and T.R. Seastedt. 1998. Introduction: grasslands,Konza Prairie, and long-term ecological research. Pages 3–18 in A.K. Knapp, J.M. Briggs, D.C. Hartnett, and S.L.Collins (eds.). Grassland dynamics: long-term ecological re-search in tallgrass prairie. Oxford University Press, NewYork.
Kochy, M., and S.D. Wilson. 2000. Competitive effects of shrubsand grasses in prairie. Oikos 91:385–395.
Lett, M., and A.K. Knapp. 2003. Consequences of shrub expan-
sion in mesic grassland: resource alterations and graminoidresponses. Journal of Vegetation Science 14:487–496.
Oechel, W.C., and S.J. Hastings. 1983. The effects of periodicfire on photosynthesis of chaparral resprouts. Pages 274–285 in F.J. Kruger, D.T. Mitchell, and J.U.M. Jarvis (eds.).Structure and function of Mediterranean-type ecosystems.Springer-Verlag, New York.
Oviatt, C.G. 1998. Geomorphology of Konza Prairie. Pages 35–47 in A.K. Knapp, J.M. Briggs, D.C. Hartnett, and S.L.Collins (eds.). Grassland dynamics: long-term ecological re-search in tallgrass prairie. Oxford University Press, NewYork.
Rice, E.L., and R.L. Parenti. 1978. Causes of decreases in pro-ductivity in undisturbed tallgrass prairie. American Journalof Botany 65:1091–1097.
Risser, P., and W.J. Parton. 1982. Ecological analysis of a tall-grass prairie: nitrogen cycle. Ecology 63:1342–1351.
Schlesinger, W.H., J.F. Reynolds, G.L. Cunningham, L.R. Huen-neke, W.H. Jarrell, R.A. Virginia, and W.G. Whitford. 1990.Biological feedbacks in global desertification. Science 247:1043–1048.
Scholes, R.J., and S.R. Archer. 1997. Tree-grass interactions insavannas. Annual Review of Ecology and Systematics 28:517–544.
Seastedt, T.R., J.M. Briggs, and D.J. Gibson. 1991. Controls ofnitrogen limitation in tallgrass prairie. Oecologia 87:72–79.
Van Auken, O.W. 2000. Shrub invasions of North Americansemiarid grasslands. Annual Review of Ecology and Sys-tematics 31:197–215.
94
IMPACT OF FIRE ON SOIL RESOURCE PATTERNS IN ANORTHERN CALIFORNIA MONTANE ECOSYSTEM
Jessica R. Miesel1
The Ohio State University, Department of Evolution, Ecology, and Organismal Biology, 300 Aronoff Laboratory, 318 West12th Avenue, Columbus, OH 43210, USA
Carl N. SkinnerUSDA Forest Service Pacific Southwest Research Station, 3644 Avtech Parkway, Redding, CA 96002, USA
Ralph E.J. BoernerThe Ohio State University, Department of Evolution, Ecology, and Organismal Biology, 300 Aronoff Laboratory, 318 West12th Avenue, Columbus, OH 43210, USA
ABSTRACT
The montane ecosystems of the Cascade Range have been subjected to repeated manipulation and active fire suppression for morethan a century. This has resulted in changes in community structure that contribute to increased wildfire hazard and severity. Ongoingefforts to return these ecosystems to a state with intrinsic low fuel loads have received substantial attention in recent years; however,many ecological questions remain unanswered. This study addresses belowground impacts of restorative treatments. We report proxi-mate effects of the application of prescribed fire (burn-only) and the combination of fire and mechanical thinning (thin � burn) onsoil chemical and microbial parameters in treatment units of 10 ha each in the Klamath National Forest of northern California. Soilorganic carbon (C) decreased and C:N (carbon:nitrogen) ratio increased as a result of fire in the burn-only treatment; however, nosignificant changes from pre-fire to post-fire were observed for thin � burn treatment plots. N mineralization rates did not change asa result of fire in either burn-only or thin � burn plots. Nitrification rates decreased as a result of fire in thin � burn units, but didnot change significantly in the burn-only treatment. Total inorganic N increased from pre-fire to post-fire, with and without thinning.Activity of acid phosphatase, an indicator of overall microbial activity, was reduced by fire, both with and without thinning, whereasactivity of chitinase was reduced by fire in thin � burn plots only. There were no significant changes in phenol oxidase activity as aresult of fire, with or without thinning. This study demonstrates that fire has short-term effects on soil ecological properties, e.g., soilorganic matter, N turnover and availability, and microbial function, and that the combination of mechanical thinning and fire may havedifferent effects from fire alone.
keywords: California, thinning, mixed conifer, prescribed fire, soil enzyme activity, soil resources.
Citation: Miesel, J.R., C.N. Skinner, and R.E.J. Boerner. 2007. Impact of fire on soil resource patterns in a northern California montaneecosystem. Pages 94–102 in R.E. Masters and K.E.M. Galley (eds.). Proceedings of the 23rd Tall Timbers Fire Ecology Conference:Fire in Grassland and Shrubland Ecosystems. Tall Timbers Research Station, Tallahassee, Florida, USA.
INTRODUCTION
Fire has been an important process in determiningvegetation structure and composition of ecosystemsthroughout North American history. In western NorthAmerica pre–European settlement ponderosa pine (Pi-nus ponderosa) (nomenclature follows Hickman 1993)forests experienced fire return intervals as frequent as2 to 15 y (Weaver 1951, Agee 1993). These fires re-sulted from both natural causes, such as lightningstrikes or volcanic activity, and anthropogenic igni-tions, such as seasonal burns set by Native Americanpeoples (Weaver 1951, Agee 1993). The historic pat-tern of frequent, low-intensity fires limited understorygrowth and selected for resistant, thick-barked, shade-intolerant tree species such as ponderosa pine. Reportsof presettlement forests describe open, park-like standsof trees (Laudenslayer and Darr 1990, Covington andMoore 1994), and detailed dendrochronological anal-
1 Corresponding author ([email protected]).
ysis of forests dominated by ponderosa pine and Jef-frey pine (P. jeffreyi) in the Cascade Range and SierraNevada of California and Oregon profile a pine-dom-inated forest that was originally moderately open, un-even-aged, large-tree dominated, and shaped by fre-quent, low-intensity fires (Agee 1993, Skinner andChang 1996, Taylor 2000).
Today’s mixed-conifer forests of the Southern Cas-cades differ substantially from historic conditions inseveral characteristics, including increased stand den-sity, altered species composition, increased presence ofdisease, and nutrient cycling, among others (Agee1993, Skinner and Chang 1996, Taylor 2000). Grazing,logging, and aggressive fire-suppression policies havecontributed to these post–European settlement changesin stand composition and structure (Weaver 1951,Agee 1993). Forests that were historically dominatedby a low density of large pines now include large num-bers of white fir (Abies concolor) and other shade-tolerant species, and stem density in these stands hasincreased dramatically since European settlement. The
95IMPACT OF FIRE ON SOIL RESOURCE PATTERNS
combination of fire suppression and higher stem den-sity has led to the accumulation of both surface andvertical fuels such that conditions are now conduciveto the development of fires with intensity far greaterthan the historical condition. Large, catastrophic wild-fires in California during the summers of 1977, 1987,1990, 1992, 1999, 2001, and 2003 provide stark evi-dence of the potential of existing forest conditions forextensive and severe fires.
The problem of hazardous fuel conditions in for-ests has received substantial attention in recent yearsas land managers attempt to reduce the threat of cat-astrophic fires. Reduction of fuel loads, especially inareas of wildland–urban interface, has been conductedprimarily via mechanical treatment (usually thinningfrom below); however, prescribed burning or combi-nations of thinning and burning are also used. Al-though such stand manipulations may be able to returnforests to approximate historic structural conditions,many questions about the ecological consequences ofthese fire surrogate treatments remain unanswered (Si-erra Nevada Ecosystem Project 1996). For example,the question of the effects of structural and functionalmanipulations on soil fertility, microbial ecology, andnutrient cycling has only recently begun to attract sci-entific attention (e.g., DeLuca and Zouhar 2000).
This study details one portion of the National Fireand Fire Surrogate Network study (www.fs.fed.us/ffs), which is designed to evaluate the efficacy of al-ternative management strategies for the mitigation ofthe current wildfire hazard and for the improvement offorest ecosystem sustainability and health on a nationalscale. Our study site in the southern Cascades Rangeof northern California is one of 13 in which a commonexperimental design is being employed to determinewhether prescribed fire, mechanical treatment (usuallythinning from below), or a combination of the twocould best 1) minimize the hazard of catastrophic fireand 2) accelerate and sustain the development of alarge-tree–dominated, late-successional pine forestsimilar to that originally created and sustained by thehistorical fire regime. Within that larger experimentalcontext, we present here the results of a study designedto determine the belowground impacts of prescribedfire, both alone and in combination with thinning.
STUDY AREA
This study took place in the Goosenest AdaptiveManagement Area (GAMA) of the Klamath NationalForest in Siskiyou County, California (lat 41�35�N,long 121�53�W). The forests of GAMA were loggedbetween 1900 and 1920. The gentle, dissected land-scape of GAMA was the result of recent volcanic ac-tivity. Slopes were generally �10% but could locallybe �50%, with elevation ranging from 1,500 to 2,000m. White fir and ponderosa pine were dominant in theforest canopy, with sugar pine (P. lambertiana), in-cense cedar (Calocedrus decurrens), Shasta red fir(Abies magnifica var. shastensis), and Sierra lodgepolepine (P. contorta var. murrayana) common. Shrubs in-
cluded ceanothus (Ceanothus spp.), manzanita (Arc-tostaphylos spp.), antelope bitterbrush (Purshia triden-tata), curl-leaf mountain mahogany (Cercocarpus led-ifolius), rabbitbrush (Chrysothamnus spp.), and sage-brush (Artemisia spp.) (USFS 1996).
The soils of the experimental area were the Bel-zar–Wintoner complex of inceptisols mixed with lessercover of alfisols (USFS 1982). The Belzar series con-sists of loamy-skeletal, mixed, frigid Andic Xero-chrepts. The Wintoner series, pumice overburdenphase, consists of fine-loamy, mixed, frigid Ultic Hap-loxeralfs. These sand and sandy loam soils drain rap-idly and have relatively low water-holding capacity.The climate was Mediterranean-type, and the studysite received most of the 25- to 100-cm annual precip-itation as winter snowfall (USFS 1996).
METHODS
Study Design and Field Methods
The base Fire and Fire Surrogate (FFS) study de-sign is a completely randomized design consisting offour treatments each replicated three times, with pre-treatment sampling to be done in 2000 and treatmentsimplemented in 2001. The intended location of theSouthern Cascades FFS study site in the Klamath Na-tional Forest became unavailable in 2000, too late forus to restart and complete the permitting process foran entirely new location in time to meet the imple-mentation schedule. In order not to lose the opportu-nity to include the Southern Cascades in the nationalFFS study, we decided to overlay the treatment unitsof this study on preexisting research plots of the LittleHorse Peak Interdisciplinary Study (LHPIS). TheLHPIS was established in 1998 to accelerate the de-velopment of late-successional characteristics of east-side pine forests (Zack et al. 1999, Ritchie 2005). Sev-eral of the LHPIS treatments paralleled the base FFSdesign closely. The combination of mechanical treat-ment (i.e., thinning from below) and prescribed fire(hereafter thin � burn) was replicated in five experi-mental units for the LHPIS study, three of which wererandomly selected in 2000 for this FFS study. In con-trast, the LHPIS did not include a treatment that par-alleled the FFS burn-only treatment. Treatment unitsfor FFS burn-only treatments (hereafter burn-only)were interspersed among the Little Horse Peak in2001. Although vegetation and fuels data were takenin 1998, prior to treatment of the LHPIS units, no pre-treatment soil sampling was done.
The thinning of the thin � burn units involvedthinning from below combined with selection cuttingthat focused on removing shade-tolerant species suchas white fir. An average of 34% of the basal area wasremoved as mean basal area was reduced from 36.5m2/ha to 24.1 m2/ha. Processing followed standard har-vesting procedure for forests in this region. Wholetrees were transported to central processing landingswhere limbs and tops were removed from larger treesand logs cut to appropriate length for hauling to pro-cessing plants. Limbs, tops, and small trees were
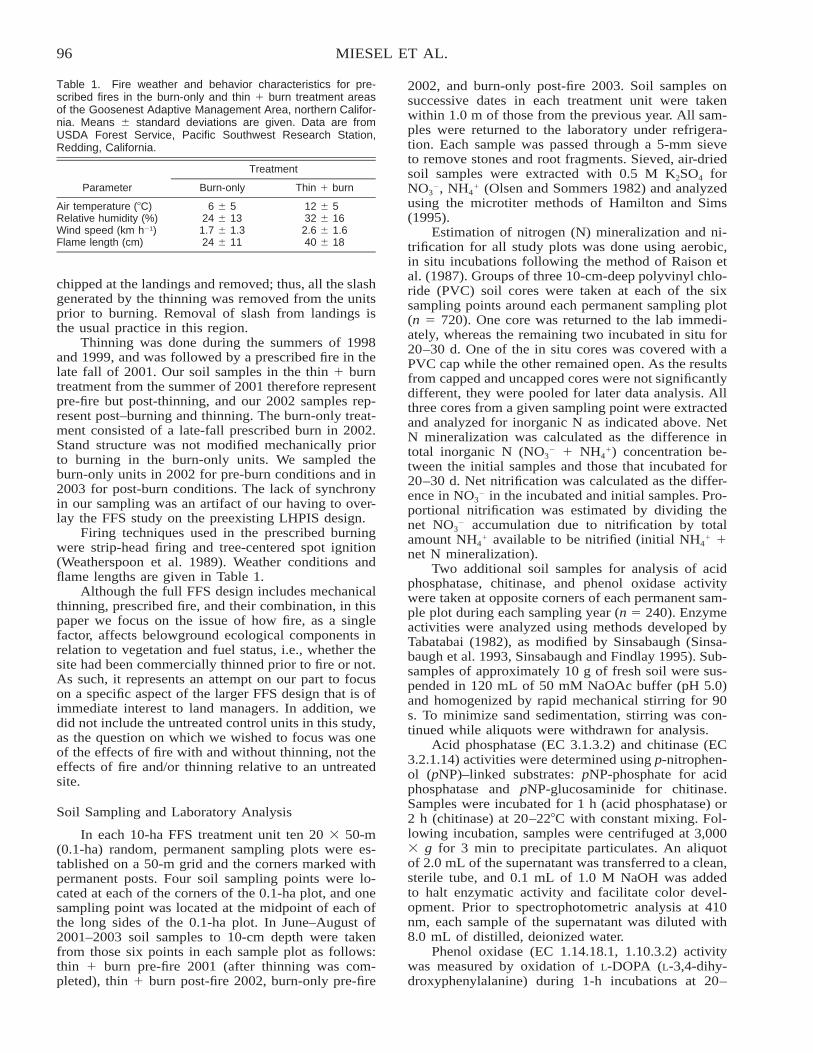
96 MIESEL ET AL.
Table 1. Fire weather and behavior characteristics for pre-scribed fires in the burn-only and thin � burn treatment areasof the Goosenest Adaptive Management Area, northern Califor-nia. Means � standard deviations are given. Data are fromUSDA Forest Service, Pacific Southwest Research Station,Redding, California.
Parameter
Treatment
Burn-only Thin � burn
Air temperature (�C) 6 � 5 12 � 5Relative humidity (%) 24 � 13 32 � 16Wind speed (km h�1) 1.7 � 1.3 2.6 � 1.6Flame length (cm) 24 � 11 40 � 18
chipped at the landings and removed; thus, all the slashgenerated by the thinning was removed from the unitsprior to burning. Removal of slash from landings isthe usual practice in this region.
Thinning was done during the summers of 1998and 1999, and was followed by a prescribed fire in thelate fall of 2001. Our soil samples in the thin � burntreatment from the summer of 2001 therefore representpre-fire but post-thinning, and our 2002 samples rep-resent post–burning and thinning. The burn-only treat-ment consisted of a late-fall prescribed burn in 2002.Stand structure was not modified mechanically priorto burning in the burn-only units. We sampled theburn-only units in 2002 for pre-burn conditions and in2003 for post-burn conditions. The lack of synchronyin our sampling was an artifact of our having to over-lay the FFS study on the preexisting LHPIS design.
Firing techniques used in the prescribed burningwere strip-head firing and tree-centered spot ignition(Weatherspoon et al. 1989). Weather conditions andflame lengths are given in Table 1.
Although the full FFS design includes mechanicalthinning, prescribed fire, and their combination, in thispaper we focus on the issue of how fire, as a singlefactor, affects belowground ecological components inrelation to vegetation and fuel status, i.e., whether thesite had been commercially thinned prior to fire or not.As such, it represents an attempt on our part to focuson a specific aspect of the larger FFS design that is ofimmediate interest to land managers. In addition, wedid not include the untreated control units in this study,as the question on which we wished to focus was oneof the effects of fire with and without thinning, not theeffects of fire and/or thinning relative to an untreatedsite.
Soil Sampling and Laboratory Analysis
In each 10-ha FFS treatment unit ten 20 50-m(0.1-ha) random, permanent sampling plots were es-tablished on a 50-m grid and the corners marked withpermanent posts. Four soil sampling points were lo-cated at each of the corners of the 0.1-ha plot, and onesampling point was located at the midpoint of each ofthe long sides of the 0.1-ha plot. In June–August of2001–2003 soil samples to 10-cm depth were takenfrom those six points in each sample plot as follows:thin � burn pre-fire 2001 (after thinning was com-pleted), thin � burn post-fire 2002, burn-only pre-fire
2002, and burn-only post-fire 2003. Soil samples onsuccessive dates in each treatment unit were takenwithin 1.0 m of those from the previous year. All sam-ples were returned to the laboratory under refrigera-tion. Each sample was passed through a 5-mm sieveto remove stones and root fragments. Sieved, air-driedsoil samples were extracted with 0.5 M K2SO4 forNO3
�, NH4� (Olsen and Sommers 1982) and analyzed
using the microtiter methods of Hamilton and Sims(1995).
Estimation of nitrogen (N) mineralization and ni-trification for all study plots was done using aerobic,in situ incubations following the method of Raison etal. (1987). Groups of three 10-cm-deep polyvinyl chlo-ride (PVC) soil cores were taken at each of the sixsampling points around each permanent sampling plot(n 720). One core was returned to the lab immedi-ately, whereas the remaining two incubated in situ for20–30 d. One of the in situ cores was covered with aPVC cap while the other remained open. As the resultsfrom capped and uncapped cores were not significantlydifferent, they were pooled for later data analysis. Allthree cores from a given sampling point were extractedand analyzed for inorganic N as indicated above. NetN mineralization was calculated as the difference intotal inorganic N (NO3
� � NH4�) concentration be-
tween the initial samples and those that incubated for20–30 d. Net nitrification was calculated as the differ-ence in NO3
� in the incubated and initial samples. Pro-portional nitrification was estimated by dividing thenet NO3
� accumulation due to nitrification by totalamount NH4
� available to be nitrified (initial NH4� �
net N mineralization).Two additional soil samples for analysis of acid
phosphatase, chitinase, and phenol oxidase activitywere taken at opposite corners of each permanent sam-ple plot during each sampling year (n 240). Enzymeactivities were analyzed using methods developed byTabatabai (1982), as modified by Sinsabaugh (Sinsa-baugh et al. 1993, Sinsabaugh and Findlay 1995). Sub-samples of approximately 10 g of fresh soil were sus-pended in 120 mL of 50 mM NaOAc buffer (pH 5.0)and homogenized by rapid mechanical stirring for 90s. To minimize sand sedimentation, stirring was con-tinued while aliquots were withdrawn for analysis.
Acid phosphatase (EC 3.1.3.2) and chitinase (EC3.2.1.14) activities were determined using p-nitrophen-ol (pNP)–linked substrates: pNP-phosphate for acidphosphatase and pNP-glucosaminide for chitinase.Samples were incubated for 1 h (acid phosphatase) or2 h (chitinase) at 20–22�C with constant mixing. Fol-lowing incubation, samples were centrifuged at 3,000 g for 3 min to precipitate particulates. An aliquotof 2.0 mL of the supernatant was transferred to a clean,sterile tube, and 0.1 mL of 1.0 M NaOH was addedto halt enzymatic activity and facilitate color devel-opment. Prior to spectrophotometric analysis at 410nm, each sample of the supernatant was diluted with8.0 mL of distilled, deionized water.
Phenol oxidase (EC 1.14.18.1, 1.10.3.2) activitywas measured by oxidation of L-DOPA (L-3,4-dihy-droxyphenylalanine) during 1-h incubations at 20–
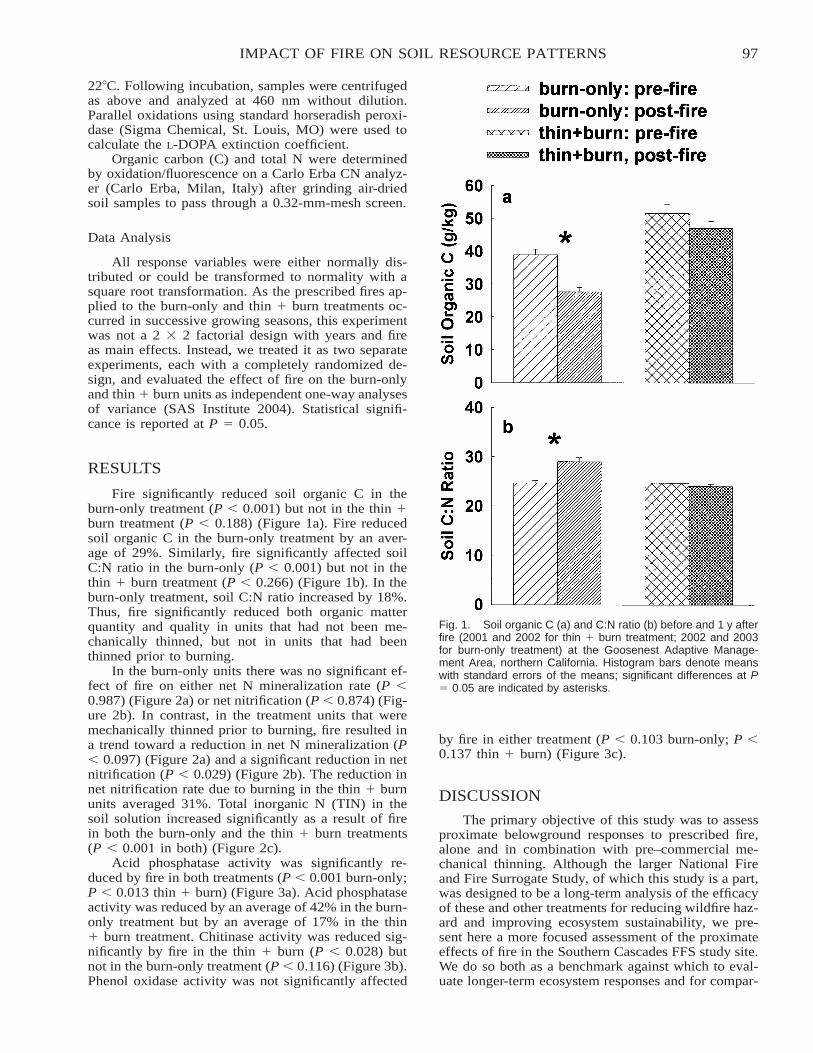
97IMPACT OF FIRE ON SOIL RESOURCE PATTERNS
Fig. 1. Soil organic C (a) and C:N ratio (b) before and 1 y afterfire (2001 and 2002 for thin � burn treatment; 2002 and 2003for burn-only treatment) at the Goosenest Adaptive Manage-ment Area, northern California. Histogram bars denote meanswith standard errors of the means; significant differences at P 0.05 are indicated by asterisks.
22�C. Following incubation, samples were centrifugedas above and analyzed at 460 nm without dilution.Parallel oxidations using standard horseradish peroxi-dase (Sigma Chemical, St. Louis, MO) were used tocalculate the L-DOPA extinction coefficient.
Organic carbon (C) and total N were determinedby oxidation/fluorescence on a Carlo Erba CN analyz-er (Carlo Erba, Milan, Italy) after grinding air-driedsoil samples to pass through a 0.32-mm-mesh screen.
Data Analysis
All response variables were either normally dis-tributed or could be transformed to normality with asquare root transformation. As the prescribed fires ap-plied to the burn-only and thin � burn treatments oc-curred in successive growing seasons, this experimentwas not a 2 2 factorial design with years and fireas main effects. Instead, we treated it as two separateexperiments, each with a completely randomized de-sign, and evaluated the effect of fire on the burn-onlyand thin � burn units as independent one-way analysesof variance (SAS Institute 2004). Statistical signifi-cance is reported at P 0.05.
RESULTS
Fire significantly reduced soil organic C in theburn-only treatment (P � 0.001) but not in the thin �burn treatment (P � 0.188) (Figure 1a). Fire reducedsoil organic C in the burn-only treatment by an aver-age of 29%. Similarly, fire significantly affected soilC:N ratio in the burn-only (P � 0.001) but not in thethin � burn treatment (P � 0.266) (Figure 1b). In theburn-only treatment, soil C:N ratio increased by 18%.Thus, fire significantly reduced both organic matterquantity and quality in units that had not been me-chanically thinned, but not in units that had beenthinned prior to burning.
In the burn-only units there was no significant ef-fect of fire on either net N mineralization rate (P �0.987) (Figure 2a) or net nitrification (P � 0.874) (Fig-ure 2b). In contrast, in the treatment units that weremechanically thinned prior to burning, fire resulted ina trend toward a reduction in net N mineralization (P� 0.097) (Figure 2a) and a significant reduction in netnitrification (P � 0.029) (Figure 2b). The reduction innet nitrification rate due to burning in the thin � burnunits averaged 31%. Total inorganic N (TIN) in thesoil solution increased significantly as a result of firein both the burn-only and the thin � burn treatments(P � 0.001 in both) (Figure 2c).
Acid phosphatase activity was significantly re-duced by fire in both treatments (P � 0.001 burn-only;P � 0.013 thin � burn) (Figure 3a). Acid phosphataseactivity was reduced by an average of 42% in the burn-only treatment but by an average of 17% in the thin� burn treatment. Chitinase activity was reduced sig-nificantly by fire in the thin � burn (P � 0.028) butnot in the burn-only treatment (P � 0.116) (Figure 3b).Phenol oxidase activity was not significantly affected
by fire in either treatment (P � 0.103 burn-only; P �0.137 thin � burn) (Figure 3c).
DISCUSSION
The primary objective of this study was to assessproximate belowground responses to prescribed fire,alone and in combination with pre–commercial me-chanical thinning. Although the larger National Fireand Fire Surrogate Study, of which this study is a part,was designed to be a long-term analysis of the efficacyof these and other treatments for reducing wildfire haz-ard and improving ecosystem sustainability, we pre-sent here a more focused assessment of the proximateeffects of fire in the Southern Cascades FFS study site.We do so both as a benchmark against which to eval-uate longer-term ecosystem responses and for compar-
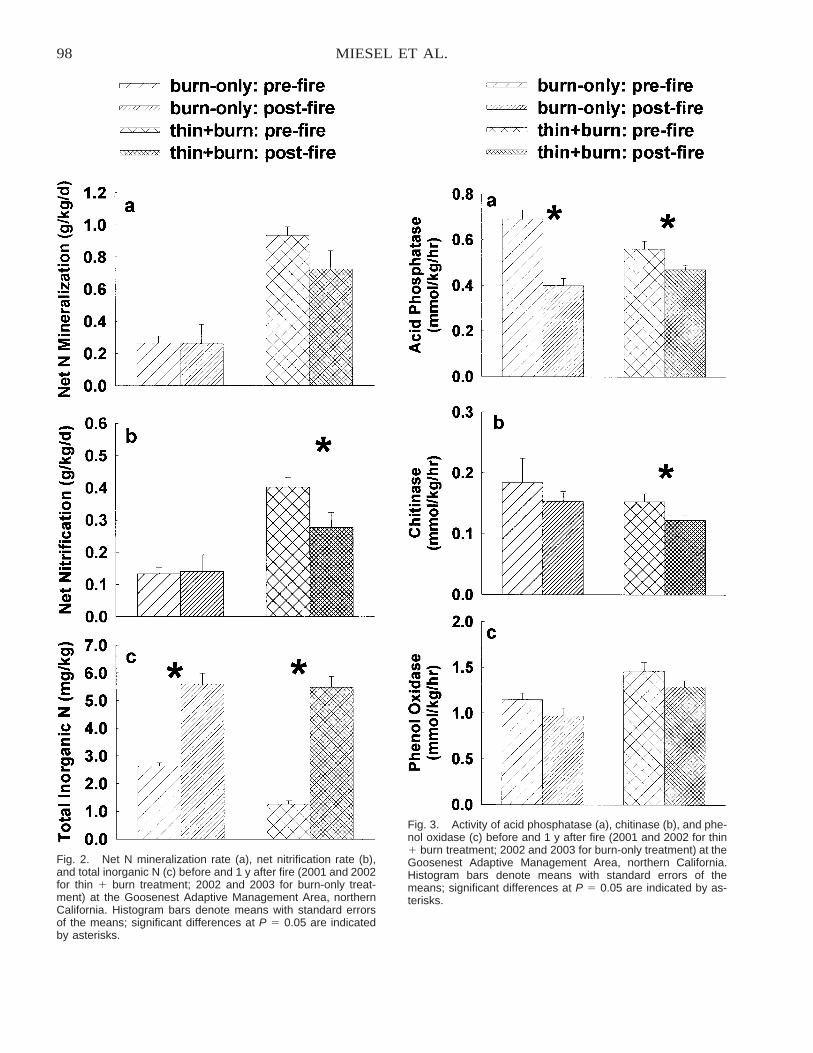
98 MIESEL ET AL.
Fig. 2. Net N mineralization rate (a), net nitrification rate (b),and total inorganic N (c) before and 1 y after fire (2001 and 2002for thin � burn treatment; 2002 and 2003 for burn-only treat-ment) at the Goosenest Adaptive Management Area, northernCalifornia. Histogram bars denote means with standard errorsof the means; significant differences at P 0.05 are indicatedby asterisks.
Fig. 3. Activity of acid phosphatase (a), chitinase (b), and phe-nol oxidase (c) before and 1 y after fire (2001 and 2002 for thin� burn treatment; 2002 and 2003 for burn-only treatment) at theGoosenest Adaptive Management Area, northern California.Histogram bars denote means with standard errors of themeans; significant differences at P 0.05 are indicated by as-terisks.
99IMPACT OF FIRE ON SOIL RESOURCE PATTERNS
ison with the existing fire-effects literature, most ofwhich focuses on first-year effects.
When compared with pre-burn conditions, fire re-duced soil organic matter quantity in the burn-onlytreatment, but not in the treatment units that had beenmechanically thinned prior to burning. High pre-burnsoil C content coupled with low fire severity may ex-plain the lack of significant change in organic matterquantity in units that received thinning prior to pre-scribed fire. Other studies of mechanically thinned co-niferous forests have also noted high soil C after log-ging, although post-harvest increases in soil C did notoccur in the majority of studies reviewed by Johnson(1992). However, in two examples from mixed-coniferforests, increases in mineral soil C of 18% and 23%after whole-tree harvesting and 6 y after a clear-cutharvest, respectively, were reported; these increasesmay be attributed to the addition of slash to the forestfloor, mixing of organic matter into mineral soil layers,and increased decomposition rates following harvest-ing (Johnson 1992).
The loss of soil organic matter is largely depen-dent upon the temperature and intensity of a fire (Ahl-gren and Ahlgren 1960); prescribed burning generallyresults in increased soil C near the soil surface, buthigher-severity fires have been shown to decrease soilC (Johnson 1992). Carbon can be added to the soilwhen charcoal from burned forest floor material is in-corporated into the soil (Johnson 1992), and this canresult in overly conservative estimates of the loss ofsoil organic C during a fire (Johnson and Curtis 2000).The significant loss of organic matter in the burn-onlytreatment could have been due either to loss via com-bustion during the fire or to increased microbial min-eralization of organic matter after the fire (Johnson andCurtis 2000). As the results from our acid phosphataseactivity assays do not support the latter, the more likelyexplanation appears to be greater consumption of or-ganic matter by fire in the burn-only treatment than inthe thin � burn treatment. Although fire weather andflame lengths were similar during the fires in the burn-only and thin � burn treatments, flame length (fireintensity) is not directly correlated with fire severity(loss of forest floor organic matter). For example, aslow-moving fire with low flame lengths may sustaingreater soil heating and organic matter combustionthan a relatively faster-moving fire with greater flamelengths (Busse et al. 2004).
More important to the difference in organic matterloss may have been the spatial continuity of the fuelbed. Our visual observations indicate that the activitiesassociated with the thinning resulted in some mixingof litter, duff, and mineral soil in areas of particularlyheavy vehicular and human traffic. This, in turn, couldhave resulted in a reduction of the exposure of someof that organic matter to direct combustion, thus pre-venting the prescribed fire from having as great aneffect in the thin � burn treatment as it did in the burn-only treatment. Furthermore, although total pre-burnfine and coarse woody debris loads in the thin � burntreatment were equal to those of the burn-only treat-ment (both averaged 7.4 Mg ha�1), fuels were not as
continuous in the thin � burn as in the burn-only treat-ment (Schmidt 2005).
We observed an increase in C:N ratio as a resultof fire in the burn-only treatment but no correspondingchange due to fire in the thin � burn treatment. In theburn-only treatment, the C:N ratio of the soil organicmatter was likely decreased by the combination of anaddition of partially combusted woody material andcharcoal, both of which have high C:N ratio, and aloss of relatively low C:N ratio organic matter to directcombustion. The lack of a similar effect on C:N ratioin the thin � burn treatment could have resulted fromlower fire severity (as discussed previously) or a great-er proportion of relatively low C:N ratio organic mat-ter in the fuels (the result of green needles being de-posited on the surface as a result of thinning opera-tions), or both.
The N mineralization rate was essentially unaf-fected by prescribed fire, whereas nitrification rate wasreduced significantly in the thin � burn treatment butnot in the burn-only treatment. The processes of Nmineralization are accomplished by a wide variety ofsoil organisms, including bacteria, fungi, and nema-todes, whereas nitrification is accomplished primarilyby a specialist guild of bacteria. Thus, modification ofthe chemical and biochemical conditions in the soil ismore likely to have affected the latter more than theformer (Raison 1979).
It was initially unclear to us why there was a lackof change in N mineralization in the burn-only units,as many studies have demonstrated increases in Nmineralization after single fires (reviews by Raison1979, Boerner 1982, Wan et al. 2001). Such increasesare often attributed to the alteration of organic matterby fire in such a manner as to render it more suscep-tible to microbial attack, to increases in microbial ac-tivity, and to changes in microclimate. To the degreeto which our enzyme activity assays reflect compo-nents of microbial activity, our results are not consis-tent with an increase in microbial activity. Similarly,if one assumes that C:N ratio and other properties as-sociated with organic matter quality (e.g., phenoliccontent, sclerophyll index) vary in parallel, the in-crease we observed in C:N ratio would suggest thatsusceptibility to microbial attack would have been re-duced rather than enhanced by fire in this site. Giventhe paucity of growing-season precipitation in this re-gion (monthly averages for the June–August samplingperiod were 0.76 cm/mo for 2002 and 0.25 cm/mo for2003 [USFS 2006]), changes in microclimate duringthe parts of the year that are otherwise suitable formineralization may not have been sufficient to over-come the lack of rainfall. Thus, the lack of stimulationof N mineralization by fire in this study may havereflected a lack of the types of changes in microbialactivity, organic matter quality, and microclimate thathave occurred in sites where increases in N minerali-zation has been demonstrated.
Total inorganic N in the soil solution increased asa result of fire in both treatments, although thin � burnplots exhibited a 4-fold increase in TIN from pre-fireto post-fire years while levels in burn-only plots mere-
100 MIESEL ET AL.
ly doubled. The difference in the magnitude of theincrease in TIN is consistent with studies that reportthat thinning and the creation of canopy gaps as smallas 0.07 ha in forests create areas of greater N avail-ability (Prescott et al. 1992, Parsons et al. 1994, Bau-hus and Barthel 1995).
This increase in mineral N was expected, as Wanet al. (2001) concluded from their meta-analysis of fireeffects on N that TIN generally increases in coniferousforests during the initial post-fire growing season. Thedifference in magnitude of increase observed for TINmay be explained by difference in fire severity as low-er-intensity fires transfer larger amounts of NH4
� to thesoil than more severe fires, during which a greateramount of soil N is volatized (DeBano 1991). Mineralsoil N may increase after fire due to transport of Nfrom the forest floor (Wells et al. 1979), as well asfrom the release of NH4
� from soil minerals and clay-organic complexes during combustion, and both maybe followed by conversion of NH4
� to NO3� due to
nitrification (Russell et al. 1974, Raison 1979). How-ever, such increases in available N are typically tran-sitory and are likely to dissipate by the end of thesecond post-fire growing season (Wan et al. 2001).
We chose acid phosphatase as an indicator of over-all microbial activity as the activity of this enzyme isoften strongly correlated with microbial biomass (Kan-deler and Eder 1993), microbial biomass N (Clarholm1993), fungal hyphal length (Haussling and Marschner1989), and N mineralization (Decker et al. 1999). Acidphosphatase activity was reduced significantly by bothtreatments. Similarly, Saa et al. (1993) reported 80–90% decreases in acid phosphatase levels after fire ingorse (Ulex europaeus) shrublands and pine planta-tions in Spain, and Boerner et al. (2000) reported de-creases of similar magnitude to those we report herein their study of fire in mixed-oak (Quercus spp.) for-ests in eastern North America. Acid phosphatase ac-tivity may remain low for as long as 4 y after burning,at least in the jack pine (Pinus banksiana) forests ofOntario studied by Staddon et al. (1998).
In our study, acid phosphatase activity was re-duced considerably more by the burn-only treatment(42%) than by the thin � burn treatment (16%). In along-term (40� y) study of microbial activity and soilorganic matter in a Missouri oak flatwoods, Eivazi andBayan (1996) demonstrated that more frequent burningcauses greater reductions in acid phosphatase activity,�-glucosidase activity, and microbial biomass than didless frequent burning, and Staddon et al. (1998) dem-onstrated a direct correlation between fire severity andreduction in acid phosphatase activity in a jack pineforest. Thus, the greater reduction in acid phosphataseactivity in our burn-only than the thin � burn treat-ment may again reflect greater effective fire severityin the former than the latter.
Chitinase activity reflects the use of chitin (the de-trital remains of arthropods and fungi) as a source ofboth C and N by bacteria and, in some ecosystems,actinomycetes. As chitin is intermediate in its resis-tance to microbial metabolism, its synthesis is onlyinduced when other, more labile C and N sources are
absent (Handzlikova and Jandera 1993). As chitinaseis produced only by bacteria, changes in chitinase ac-tivity relative to that of other enzymes give an indi-cation both of changes in the relative contribution ofbacteria to microbial activity as well as changes inorganic matter along the gradient from labile to recal-citrant (Handzlikova and Jandera 1993).
In our study, chitinase activity decreased as a re-sult of the thin � burn treatment, but not as a resultof fire alone. Such a decrease in chitinase activityshould indicate a reduction in the importance of chitinas a source of C and N for bacterial production. Asour results indicate that organic matter content andquality both decreased following the burn-only treat-ment but not the thin � burn treatment, one wouldanticipate that chitinase activity would increase in theburn-only treatment and remain unchanged in the thin� burn treatment. This is the opposite of what weactually observed. We currently have no mechanisticexplanation for this apparent contradiction.
It should be noted, however, that the degree ofvariability present in chitinase activity in our pre-burndata for the burn-only treatment was 3- to 4-fold great-er than was the case in any other enzyme–treatment–year combination. This variability was the reason thatthe difference between pre-burn and post-burn yearswas not statistically significant in the burn-only treat-ment, despite similar absolute (0.03 mmol g�1 h�1 forboth) and relative (16% and 20%) decreases in chiti-nase activity in the burn-only and thin � burn treat-ments. Whether this greater variability was a reflectionof a difference in spatial heterogeneity between treat-ment units or an aberration in sampling and/or analysisis unclear.
The index of fungal activity we used was phenoloxidase, an enzyme produced primarily by white rotfungi, which is specific for highly recalcitrant organicmatter such as lignin (Carlile and Watkinson 1994).Although phenol oxidase activity should not be con-sidered a proxy for the abundance or activity of allfungi, it is a useful indicator of the activity of fungithat specialize on the breakdown of wood, bark, andother lignin-rich substrates (Carlile and Watkinson1994). Based on this parameter, fungal activity was notaffected by burning, alone or in combination with me-chanical thinning. Given the preponderance of rela-tively recalcitrant materials in the forest floor and soilsof this (and most other) coniferous forests and the rel-atively low severity of the fires, the lack of responseby organisms that specialize on low-quality organicmatter is not surprising. Taken together, our enzymeactivity results suggest that the impact of fire may dif-fer among types of soil organisms associated with de-composition, and those effects may be influenced bytreatment type.
MANAGEMENT IMPLICATIONS ANDCONCLUSIONS
This study demonstrates that fire has short-termeffects on soil ecological properties, such as soil or-
101IMPACT OF FIRE ON SOIL RESOURCE PATTERNS
ganic matter, N availability, and microbial enzyme ac-tivity, and that the combination of mechanical thinningand fire may have different effects from fire alone. Firealone resulted in reduced soil organic matter contentand increased C:N ratio, whereas the combination ofa mechanical thinning treatment and burning did notaffect soil organic matter. Activities associated withthinning may mix litter, duff, and mineral soil mate-rials in such a manner as to make some of the organicmatter less susceptible to combustion. Thus, the morecontinuous ground fuels and lower relative humidityin the burn-only treatment and the less continuous fuelbed in the more open thinned stand may have contrib-uted to greater fire severity in the burn-only treatmentthan in the thin � burn treatment.
Soil organic matter is important to a productiveforest ecosystem because of its role in stabilizing soil,maintaining soil conditions suitable for seedling estab-lishment and growth, and supplying both nutrient stor-age and water-holding capacity. Thus, managersshould be aware not only of the effect that manage-ment activities may have on soil organic matter, butalso of the strong interactions that exist among standdensity, fuel loading, fire behavior, and post-fire soilorganic matter.
Our results also show that burning influences ni-trification and available N in the soil, and that thoseeffects differed between burn-only and thin � burntreatments. Based on prior studies in coniferous for-ests, the increases we observed in available N are like-ly to be transitory, and further study is required todetermine if there will be longer-term effects of thesetreatments on the supply of N to trees.
The results of our assays of the activity of threeenzymes that microbes secrete into the soil to digestsoil organic matter are consistent with what one wouldexpect if overall microbial activity was somewhat re-duced by fire in these sites. The significant reductionin acid phosphatase and chitinase activities we ob-served suggest that there may have been a decrease inthe activity of microbes that rely on more easily di-gested (labile) organic matter, and the lack of changein phenol oxidase activity suggests that the activity oforganisms that specialize on recalcitrant organic com-pounds (such as wood-rotting fungi) did not likelychange to any appreciable degree. We assume thatwhatever effect these fires had on microbial commu-nity structure is likely to dissipate as new litterfall re-stores the pre-fire nutritional characteristics of the for-est floor and soil organic matter, though longer-termstudies are required to verify this.
Prescribed fire following thinning resulted in agreater impact on nitrification and soil enzyme activ-ities than did prescribed fire alone, whereas changesin soil organic matter content and C:N ratio weregreater as a result of fire alone. Thus, for our mixed-conifer site in northern California, the application ofprescribed fire to mechanically thinned stands has agreater impact on soil biological processes 1 y afterburning, whereas soil C and organic matter quality areimpacted more by fire in stands that were not me-chanically thinned prior to burning. This study pro-
vides information useful for predicting the short-term,ecosystem-level effects of different forest restorationand wildfire hazard–reduction techniques in the wide-spread ponderosa pine ecosystem type.
ACKNOWLEDGMENTS
This is publication no. 94 of the National Fire andFire Surrogate study, supported by the Joint Fire Sci-ence Program. We thank C. Abbott, R. Carlson, J. Sy-mons, and U.S. Forest Service Pacific Southwest Re-search Station field technicians for sample collection,and J.A. Brinkman, C.M. Giai, J. Huang, A. Shenoy,and P. Ruse for laboratory assistance.
LITERATURE CITEDAgee, J.K. 1993. Fire ecology of Pacific Northwest forests. Is-
land Press, Washington, D.C.Ahlgren, L.F., and L.E. Ahlgren. 1960. Ecological effects of for-
est fire. Botanical Review 26:483–533.Bauhus, J., and R. Barthel. 1995. Mechanisms for carbon and
nutrient release and retention within beech forest gaps. II.The role of microbial biomass. Plant and Soil 168/169:585–592.
Boerner, R.E.J. 1982. Fire and nutrient cycling in temperate eco-systems. BioScience 32:187�192.
Boerner, R.E.J., K.L.M. Decker, and E.K. Sutherland. 2000. Pre-scribed burning effects on soil enzyme activity in a southernOhio hardwood forest: a landscape-scale analysis. Soil Bi-ology and Biochemistry 32:899–908.
Busse, M.D., K.R. Hubbert, G.O. Fiddler, C.J. Shestak, and R.F.Powers. 2004. Lethal soil temperatures during burning ofmasticated forest residues. International Journal of WildlandFire 14:267–276.
Carlile, M.J., and S.C. Watkinson. 1994. The fungi. AcademicPress, New York.
Clarholm, M. 1993. Microbial biomass P, labile P, and acid phos-phatase activity in the humus layer of a spruce forest, afterrepeated additions of fertilizer. Biology and Fertility ofSoils 8:128–133.
Covington, W.W., and M.M. Moore. 1994. Southwestern pon-derosa forest structure, changes since Euro-American settle-ment. Journal of Forestry 92(1):39–47.
DeBano, L.F. 1991. The effect of fire on soil properties. Pages151–156 in A.E. Harvey and L.F. Neuenschwander (eds.).Proceedings: management and productivity of western-montane forest soils. General Technical Report INT-280,U.S. Department of Agriculture, Forest Service, Washing-ton, D.C.
Decker, K.L.M., R.E.J. Boerner, and S.J. Morris. 1999. Scale-dependent patterns of soil enzyme activity in a forestedlandscape. Canadian Journal of Forest Research 29:232–241.
DeLuca, T.H., and K.L. Zouhar. 2000. Effects of selection har-vest and prescribed fire on the soil nitrogen status of pon-derosa pine forests. Forest Ecology and Management 138:263–271.
Eivazi, F., and M.R. Bayan. 1996. Effects of long-term pre-scribed burning on the activity of selected soil enzymes inan oak–hickory forest. Canadian Journal of Forest Research26:1799–1804.
Hamilton, C.M., and J.T. Sims. 1995. Nitrogen and phosphorusavailability in enriched, palletized poultry litters. Journal ofSustainable Agriculture 5:115–132.
Handzlikova, A., and A. Jandera. 1993. Chitinase and changesof microbial community in soil. Folia Microbiologica 38:159–160.
102 MIESEL ET AL.
Haussling, M., and H. Marschner. 1989. Organic and inorganicsoil phosphates and acid phosphatase activity in the rhizo-sphere of 80-year-old Norway spruce (Picea abies (L.)Karst.) trees. Biology and Fertility of Soils 8:128–133.
Hickman, J.C. (ed.). 1993. The Jepson manual: higher plants ofCalifornia. University of California Press, Berkeley.
Johnson, D.W. 1992. Effects of forest management on soil car-bon storage. Water, Air, and Soil Pollution 64:83–120.
Johnson, D.W., and P.S. Curtis. 2000. Effects of forest manage-ment on soil C and N storage: meta analysis. Forest Ecologyand Management 140:227–238.
Kandeler, E., and G. Eder. 1993. Effect of cattle slurry in grass-lands on microbial biomass and on activities of various en-zymes. Biology and Fertility of Soils 16:249–254.
Laudenslayer, W.F. Jr., and H.H. Darr. 1990. Historical effects oflogging on the forests of the Cascade and Sierra Nevadaranges in California. Transactions of the Western Section,The Wildlife Society 26:12–23.
Olsen, S.R., and L.E. Sommers. 1982. Phosphorus. Pages 403–430 in A.L. Page (ed.). Methods of soil analysis. Part 2:chemical and microbiological properties. American Societyof Agronomy, Madison, WI.
Parsons, W.F.J., D.H. Knight, and S.L. Miller. 1994. Root gapdynamics in lodgepole pine forest: nitrogen transformationsin gaps of different size. Ecological Applications 4:354–362.
Prescott, C.E., J.P. Corbin, and D. Parkinson. 1992. Immobili-zation and availability of N and P in the forest floors offertilized Rocky Mountain coniferous forests. Plant and Soil143:1–10.
Raison, R.J. 1979. Modification of the soil environment by veg-etation fires, with particular reference to nitrogen transfor-mations: a review. Plant and Soil 51:73–108.
Raison, R.J., M.J. Connell, and P.K. Khanna. 1987. Methodologyfor studying fluxes of soil mineral-N in situ. Soil Biologyand Biochemistry 19:521–530.
Ritchie, M.W. 2005. Ecological research at the Goosenest Adap-tive Management Area in northeastern California. GeneralTechnical Report PSW-GTR-192, U.S. Department of Ag-riculture, Forest Service, Pacific Southwest Research Sta-tion, Albany, CA.
Russell, J.D., A.R. Fraser, J.R. Watson, and J.W. Parsons. 1974.Thermal decomposition of protein in soil organic matter.Geoderma 11:63–66.
SAS Institute. 2004. The SAS system for Windows. Release9.1e. SAS Institute, Cary, NC.
Saa, A., M.C. Trasar-Cepeda, F. Gil-Sotres, and T. Carballas.1993. Changes in soil phosphorus and acid phosphatase ac-tivity immediately following forest fires. Soil Biology &Biochemistry 25:1223–1230.
Schmidt, D.A. 2005. The influence of stand- and landscape-levelfuel treatment type and arrangement on simulated fire be-havior in mixed-conifer forests of northern California. M.S.Thesis, Pennsylvania State University, University Park.
Sinsabaugh, R.L., R.K. Antibus, A.E. Linkins, C.A. Mc-Claugherty, L. Rayburn, and T. Weiland. 1993. Wood de-composition: nitrogen and phosphorus dynamics in relationto extracellular enzyme activity. Ecology 74:1586–1593.
Sinsabaugh, R.L., and S. Findlay. 1995. Microbial production,enzyme activity, and carbon turnover in surface sediments
of the Hudson River estuary. Microbial Ecology 30:127–141.
Skinner, C.N., and C. Chang. 1996. Fire regimes, past and pre-sent. Pages 1041–1069 in Sierra Nevada Ecosystem Project:final report to Congress. Volume II: assessments and sci-entific basis for management options. Water Resources Cen-ter Report No. 37, Centers for Water and Wildland Resourc-es, University of California, Davis.
Sierra Nevada Ecosystem Project. 1996. Summary of the SierraNevada Ecosystem Project Report. Wildland ResourcesCenter Report No. 39, Centers for Water and Wildland Re-sources, University of California, Davis.
Staddon, W.J., L.C. Duschesne, and J.T. Trevors. 1998. Acidphosphatase, alkaline phosphatase and arylsulfatase activi-ties in soils from a jack pine (Pinus banksiana Lamb.) eco-system after clear-cutting, prescribed burning, and scarifi-cation. Biology and Fertility of Soils 27:1–4.
Tabatabai, M.A. 1982. Soil enzymes. Pages 903–947 in A.L.Page (ed.). Methods of soil analysis. Part 2: chemical andmicrobiological properties. American Society of Agronomy,Madison, WI.
Taylor, A.H. 2000. Fire regimes and forest changes along a mon-tane forest gradient, Lassen Volcanic National Park, south-ern Cascade Mountains, USA. Journal of Biogeography 27:87–104.
USFS [United States Forest Service]. 1982. Soil survey KlamathNational Forest area, California. U.S. Department of Agri-culture, Forest Service and Soil Conservation Service incooperation with Regents of the University of California(Agricultural Experiment Station). U.S. Department of Ag-riculture, Forest Service, Klamath National Forest, Yreka,CA.
USFS [United States Forest Service]. 1996. Goosenest AdaptiveManagement Area ecosystem analysis, Goosenest RangerDistrict. U.S. Forest Service, Klamath National Forest, Yre-ka, CA.
USFS [United States Forest Service]. 2006. 50� years of his-torical precipitation averages. Klamath National Forest,Yreka, CA. http://www.fs.fed.us/r5/klamath/fire/datafiles/rainklamath05-06.xls [accessed 07 Jul 2006].
Wan, S., D. Hui, and Y. Luo. 2001. Fire effects on nitrogen poolsand dynamics in terrestrial ecosystems: a meta-analysis.Ecological Applications 11:1349–1365.
Weatherspoon, C.P., G.A. Almond, and C.N. Skinner. 1989.Tree-centered spot firing—a technique for prescribed burn-ing beneath standing trees. Western Journal of Applied For-estry 4:29–31.
Weaver, H. 1951. Fire as an ecological factor in the southwesternponderosa pine forests. Journal of Forestry 49(2):93–98.
Wells, C.G., R.E. Campbell, L.F. DeBano, C.E. Lewis, R.L.Fredriksen, E.C. Franklin, R.C. Froelich, and P.H. Dunn.1979. Effects of fire on soil. General Technical ReportGTR-WO-7, U.S. Department of Agriculture, Forest Ser-vice, Washington, D.C.
Zack, S., W.F. Laudenslayer Jr., T.L. George, C. Skinner, and W.Oliver. 1999. A prospectus on restoring late-successionalforest structure to eastside pine ecosystems through large-scale, interdisciplinary research. Pages 343–345 in J.E.Cook and B.P. Oswald (eds.). First Biennial North Ameri-can Forest Ecology Workshop. Society of American For-esters, 24–26 Jun 1997, Raleigh, NC.
103
RESPONSE OF FOUR LAKE WALES RIDGE SANDHILLSPECIES TO REINTRODUCTION OF PRESCRIBED FIRE WITH
AND WITHOUT MECHANICAL PRE-TREATMENT
Carl W. Weekley, Eric S. Menges, and Marcia A. RickeyArchbold Biological Station, P.O. Box 2057, Lake Placid, FL 33862, USA
ABSTRACT
Restoration of endemic-rich but long-unburned sandhills on the Lake Wales Ridge (LWR) of peninsular Florida poses a considerablechallenge to land managers and plant conservationists. Decades of fire suppression have led to the development of an extensive oak-dominated subcanopy and a concomitant loss of graminoid fine fuels and herb diversity. Two major objectives of LWR sandhillrestoration are 1) protection of the sparse longleaf pine (Pinus palustris) canopy, which provides an irreplaceable source of fine fuelsthrough annual needle-drop; and 2) promotion of the many plant species (n � 15) endemic to this globally imperiled ecosystem. Aspart of a larger experiment to investigate the recovery dynamics of a long-unburned LWR sandhill following the reintroduction of firewith and without prior chainsaw-felling of the subcanopy (saw � burn versus burn-only treatments), we conducted pre- and post-treatment censuses of 228 longleaf pines and of hundreds of individuals of three species of federally listed plants: scrub plum (Prunusgeniculata), a multistemmed shrub; and two herbs, scrub buckwheat (Eriogonum longifolium var. gnaphalifolium) and Lewton’s milk-wort (Polygala lewtonii). We found that 1) longleaf pine mortality was significantly higher in the saw � burn treatment, most likelydue to higher fire temperatures relative to the burn-only treatment; 2) scrub plum post-burn resprouting rates were independent oftreatment (and largely independent of fire severity); 3) scrub buckwheat appears to have benefited most from the higher fire intensityand more complete fire coverage in the saw � burn treatment, demonstrating higher rates of seedling recruitment and flowering thanin the burn-only treatment; and 4) Lewton’s milkwort seedling recruitment and survival were significantly greater in burned versusunburned quadrats. These results suggest that while some sandhill endemics benefit from the mechanical pre-treatments used to facilitatethe reintroduction of fire, care must be taken to prevent loss of longleaf pines, particularly in pre-treated areas with their greater fireintensities.
Citation: Weekley, C.W., E.S. Menges, and M.A. Rickey. 2007. Response of four Lake Wales Ridge sandhill species to reintroductionof prescribed fire with and without mechanical pre-treatment [abstract]. Page 103 in R.E. Masters and K.E.M. Galley (eds.). Proceedingsof the 23rd Tall Timbers Fire Ecology Conference: Fire in Grassland and Shrubland Ecosystems. Tall Timbers Research Station,Tallahassee, Florida, USA.
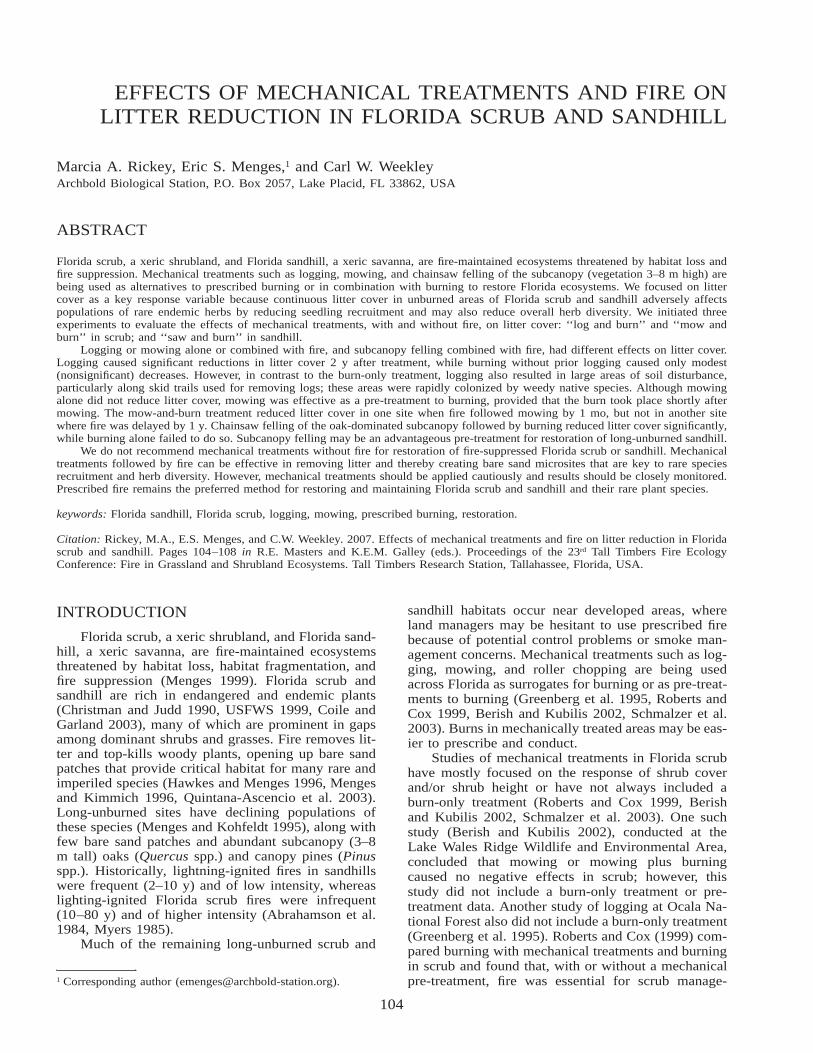
104
EFFECTS OF MECHANICAL TREATMENTS AND FIRE ONLITTER REDUCTION IN FLORIDA SCRUB AND SANDHILL
Marcia A. Rickey, Eric S. Menges,1 and Carl W. WeekleyArchbold Biological Station, P.O. Box 2057, Lake Placid, FL 33862, USA
ABSTRACT
Florida scrub, a xeric shrubland, and Florida sandhill, a xeric savanna, are fire-maintained ecosystems threatened by habitat loss andfire suppression. Mechanical treatments such as logging, mowing, and chainsaw felling of the subcanopy (vegetation 3–8 m high) arebeing used as alternatives to prescribed burning or in combination with burning to restore Florida ecosystems. We focused on littercover as a key response variable because continuous litter cover in unburned areas of Florida scrub and sandhill adversely affectspopulations of rare endemic herbs by reducing seedling recruitment and may also reduce overall herb diversity. We initiated threeexperiments to evaluate the effects of mechanical treatments, with and without fire, on litter cover: ‘‘log and burn’’ and ‘‘mow andburn’’ in scrub; and ‘‘saw and burn’’ in sandhill.
Logging or mowing alone or combined with fire, and subcanopy felling combined with fire, had different effects on litter cover.Logging caused significant reductions in litter cover 2 y after treatment, while burning without prior logging caused only modest(nonsignificant) decreases. However, in contrast to the burn-only treatment, logging also resulted in large areas of soil disturbance,particularly along skid trails used for removing logs; these areas were rapidly colonized by weedy native species. Although mowingalone did not reduce litter cover, mowing was effective as a pre-treatment to burning, provided that the burn took place shortly aftermowing. The mow-and-burn treatment reduced litter cover in one site when fire followed mowing by 1 mo, but not in another sitewhere fire was delayed by 1 y. Chainsaw felling of the oak-dominated subcanopy followed by burning reduced litter cover significantly,while burning alone failed to do so. Subcanopy felling may be an advantageous pre-treatment for restoration of long-unburned sandhill.
We do not recommend mechanical treatments without fire for restoration of fire-suppressed Florida scrub or sandhill. Mechanicaltreatments followed by fire can be effective in removing litter and thereby creating bare sand microsites that are key to rare speciesrecruitment and herb diversity. However, mechanical treatments should be applied cautiously and results should be closely monitored.Prescribed fire remains the preferred method for restoring and maintaining Florida scrub and sandhill and their rare plant species.
keywords: Florida sandhill, Florida scrub, logging, mowing, prescribed burning, restoration.
Citation: Rickey, M.A., E.S. Menges, and C.W. Weekley. 2007. Effects of mechanical treatments and fire on litter reduction in Floridascrub and sandhill. Pages 104–108 in R.E. Masters and K.E.M. Galley (eds.). Proceedings of the 23rd Tall Timbers Fire EcologyConference: Fire in Grassland and Shrubland Ecosystems. Tall Timbers Research Station, Tallahassee, Florida, USA.
INTRODUCTION
Florida scrub, a xeric shrubland, and Florida sand-hill, a xeric savanna, are fire-maintained ecosystemsthreatened by habitat loss, habitat fragmentation, andfire suppression (Menges 1999). Florida scrub andsandhill are rich in endangered and endemic plants(Christman and Judd 1990, USFWS 1999, Coile andGarland 2003), many of which are prominent in gapsamong dominant shrubs and grasses. Fire removes lit-ter and top-kills woody plants, opening up bare sandpatches that provide critical habitat for many rare andimperiled species (Hawkes and Menges 1996, Mengesand Kimmich 1996, Quintana-Ascencio et al. 2003).Long-unburned sites have declining populations ofthese species (Menges and Kohfeldt 1995), along withfew bare sand patches and abundant subcanopy (3–8m tall) oaks (Quercus spp.) and canopy pines (Pinusspp.). Historically, lightning-ignited fires in sandhillswere frequent (2–10 y) and of low intensity, whereaslighting-ignited Florida scrub fires were infrequent(10–80 y) and of higher intensity (Abrahamson et al.1984, Myers 1985).
Much of the remaining long-unburned scrub and
1 Corresponding author ([email protected]).
sandhill habitats occur near developed areas, whereland managers may be hesitant to use prescribed firebecause of potential control problems or smoke man-agement concerns. Mechanical treatments such as log-ging, mowing, and roller chopping are being usedacross Florida as surrogates for burning or as pre-treat-ments to burning (Greenberg et al. 1995, Roberts andCox 1999, Berish and Kubilis 2002, Schmalzer et al.2003). Burns in mechanically treated areas may be eas-ier to prescribe and conduct.
Studies of mechanical treatments in Florida scrubhave mostly focused on the response of shrub coverand/or shrub height or have not always included aburn-only treatment (Roberts and Cox 1999, Berishand Kubilis 2002, Schmalzer et al. 2003). One suchstudy (Berish and Kubilis 2002), conducted at theLake Wales Ridge Wildlife and Environmental Area,concluded that mowing or mowing plus burningcaused no negative effects in scrub; however, thisstudy did not include a burn-only treatment or pre-treatment data. Another study of logging at Ocala Na-tional Forest also did not include a burn-only treatment(Greenberg et al. 1995). Roberts and Cox (1999) com-pared burning with mechanical treatments and burningin scrub and found that, with or without a mechanicalpre-treatment, fire was essential for scrub manage-
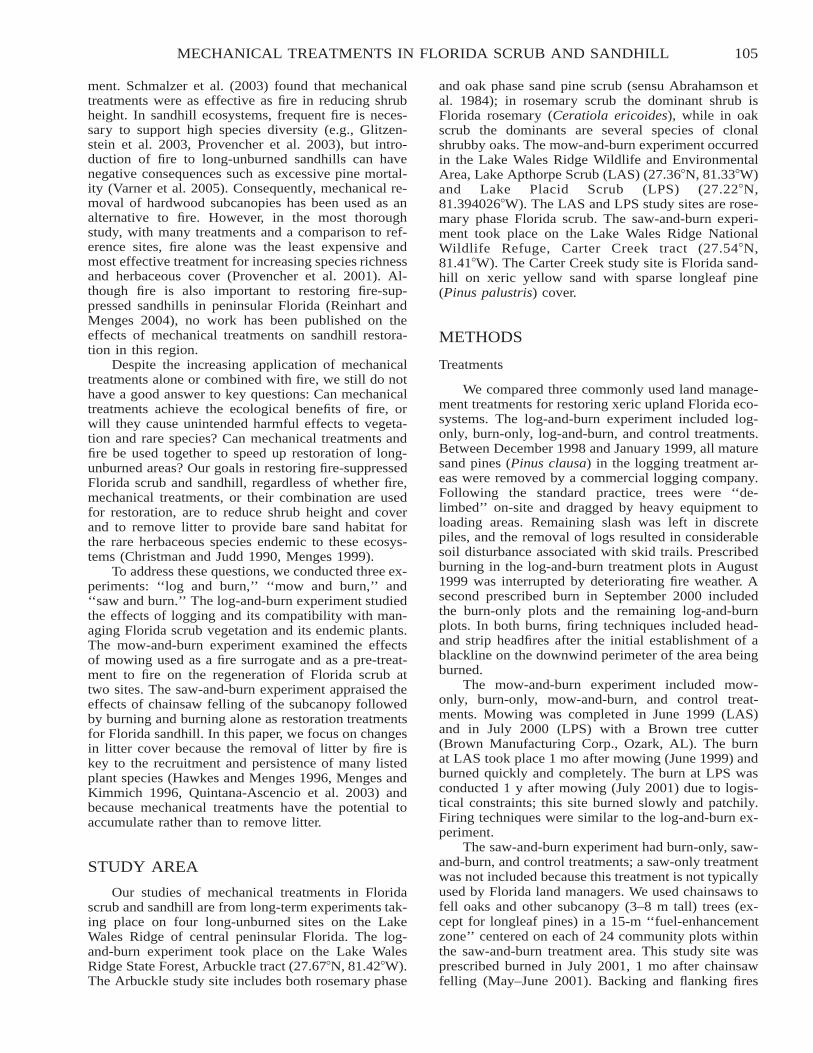
105MECHANICAL TREATMENTS IN FLORIDA SCRUB AND SANDHILL
ment. Schmalzer et al. (2003) found that mechanicaltreatments were as effective as fire in reducing shrubheight. In sandhill ecosystems, frequent fire is neces-sary to support high species diversity (e.g., Glitzen-stein et al. 2003, Provencher et al. 2003), but intro-duction of fire to long-unburned sandhills can havenegative consequences such as excessive pine mortal-ity (Varner et al. 2005). Consequently, mechanical re-moval of hardwood subcanopies has been used as analternative to fire. However, in the most thoroughstudy, with many treatments and a comparison to ref-erence sites, fire alone was the least expensive andmost effective treatment for increasing species richnessand herbaceous cover (Provencher et al. 2001). Al-though fire is also important to restoring fire-sup-pressed sandhills in peninsular Florida (Reinhart andMenges 2004), no work has been published on theeffects of mechanical treatments on sandhill restora-tion in this region.
Despite the increasing application of mechanicaltreatments alone or combined with fire, we still do nothave a good answer to key questions: Can mechanicaltreatments achieve the ecological benefits of fire, orwill they cause unintended harmful effects to vegeta-tion and rare species? Can mechanical treatments andfire be used together to speed up restoration of long-unburned areas? Our goals in restoring fire-suppressedFlorida scrub and sandhill, regardless of whether fire,mechanical treatments, or their combination are usedfor restoration, are to reduce shrub height and coverand to remove litter to provide bare sand habitat forthe rare herbaceous species endemic to these ecosys-tems (Christman and Judd 1990, Menges 1999).
To address these questions, we conducted three ex-periments: ‘‘log and burn,’’ ‘‘mow and burn,’’ and‘‘saw and burn.’’ The log-and-burn experiment studiedthe effects of logging and its compatibility with man-aging Florida scrub vegetation and its endemic plants.The mow-and-burn experiment examined the effectsof mowing used as a fire surrogate and as a pre-treat-ment to fire on the regeneration of Florida scrub attwo sites. The saw-and-burn experiment appraised theeffects of chainsaw felling of the subcanopy followedby burning and burning alone as restoration treatmentsfor Florida sandhill. In this paper, we focus on changesin litter cover because the removal of litter by fire iskey to the recruitment and persistence of many listedplant species (Hawkes and Menges 1996, Menges andKimmich 1996, Quintana-Ascencio et al. 2003) andbecause mechanical treatments have the potential toaccumulate rather than to remove litter.
STUDY AREA
Our studies of mechanical treatments in Floridascrub and sandhill are from long-term experiments tak-ing place on four long-unburned sites on the LakeWales Ridge of central peninsular Florida. The log-and-burn experiment took place on the Lake WalesRidge State Forest, Arbuckle tract (27.67�N, 81.42�W).The Arbuckle study site includes both rosemary phase
and oak phase sand pine scrub (sensu Abrahamson etal. 1984); in rosemary scrub the dominant shrub isFlorida rosemary (Ceratiola ericoides), while in oakscrub the dominants are several species of clonalshrubby oaks. The mow-and-burn experiment occurredin the Lake Wales Ridge Wildlife and EnvironmentalArea, Lake Apthorpe Scrub (LAS) (27.36�N, 81.33�W)and Lake Placid Scrub (LPS) (27.22�N,81.394026�W). The LAS and LPS study sites are rose-mary phase Florida scrub. The saw-and-burn experi-ment took place on the Lake Wales Ridge NationalWildlife Refuge, Carter Creek tract (27.54�N,81.41�W). The Carter Creek study site is Florida sand-hill on xeric yellow sand with sparse longleaf pine(Pinus palustris) cover.
METHODS
Treatments
We compared three commonly used land manage-ment treatments for restoring xeric upland Florida eco-systems. The log-and-burn experiment included log-only, burn-only, log-and-burn, and control treatments.Between December 1998 and January 1999, all maturesand pines (Pinus clausa) in the logging treatment ar-eas were removed by a commercial logging company.Following the standard practice, trees were ‘‘de-limbed’’ on-site and dragged by heavy equipment toloading areas. Remaining slash was left in discretepiles, and the removal of logs resulted in considerablesoil disturbance associated with skid trails. Prescribedburning in the log-and-burn treatment plots in August1999 was interrupted by deteriorating fire weather. Asecond prescribed burn in September 2000 includedthe burn-only plots and the remaining log-and-burnplots. In both burns, firing techniques included head-and strip headfires after the initial establishment of ablackline on the downwind perimeter of the area beingburned.
The mow-and-burn experiment included mow-only, burn-only, mow-and-burn, and control treat-ments. Mowing was completed in June 1999 (LAS)and in July 2000 (LPS) with a Brown tree cutter(Brown Manufacturing Corp., Ozark, AL). The burnat LAS took place 1 mo after mowing (June 1999) andburned quickly and completely. The burn at LPS wasconducted 1 y after mowing (July 2001) due to logis-tical constraints; this site burned slowly and patchily.Firing techniques were similar to the log-and-burn ex-periment.
The saw-and-burn experiment had burn-only, saw-and-burn, and control treatments; a saw-only treatmentwas not included because this treatment is not typicallyused by Florida land managers. We used chainsaws tofell oaks and other subcanopy (3–8 m tall) trees (ex-cept for longleaf pines) in a 15-m ‘‘fuel-enhancementzone’’ centered on each of 24 community plots withinthe saw-and-burn treatment area. This study site wasprescribed burned in July 2001, 1 mo after chainsawfelling (May–June 2001). Backing and flanking fires
106 RICKEY ET AL.
Fig. 1. Boxplots showing mean percent litter cover pre-treat-ment (1998–1999) and 2 y post-treatment (2000–2002) for a log-and-burn experiment to restore fire-suppressed scrub, LakeWales Ridge, central Florida. The lower and upper horizontalbars of the boxplot represent the 25th and 75th percentiles, re-spectively; the solid middle bar represents the median. The low-er and upper whiskers show the largest and smallest values thatare not outliers. The circles are outliers (more than 1.5 box-lengths from 25th and 75th percentiles) and the asterisks are ex-treme outliers (more than 3 box-lengths from 25th and 75th per-centiles).
were ignited, followed by strip headfires throughoutthe burn units.
Date Collection and Analysis
Although sampling protocols varied among pro-jects due to the nature of the vegetation and treatments,in all experiments we estimated litter cover in smallplots or using line intercepts. In the log-and-burn ex-periment, we sampled litter cover within 24 50 � 25-m plots pre-treatment and 1, 2, and 5 y post-treatment.In the mow-and-burn experiment, we sampled 80 20� 2-m belt transects, measuring litter cover along eachtransect pre-treatment and 1, 2, and 5 y post-treatment.In the saw-and-burn experiment, we sampled 61 5-m-radius community plots; 11 plots in the burn-onlytreatment did not burn and were excluded from thestudy. Within each community plot, we estimated littercover in eight 0.19-m2 quadrats. We sampled pre-treat-ment and 1, 2, 3, and 4 y post-treatment.
We summed litter cover data collected in herbquadrats (log-and-burn, saw-and-burn) or along lineintercepts (mow-and-burn) to the community plot lev-el. We used pairwise Kruskal–Wallis tests to comparethe change in percent litter cover pre-treatment versus2 y post-treatment (mow-and-burn, log-and-burn) or 1y post-treatment (saw-and-burn) because the data werenot normally distributed. Degrees of freedom � 1 forall statistics and �2 values are Kruskal–Wallis chi-square values.
Species names follow Wunderlin and Hansen(2003).
RESULTS
Log-and-Burn Experiment
Logging treatments were effective in reducing lit-ter cover (Figure 1). Litter cover was reduced more inthe log-only and the log-and-burn treatments reducedlitter cover significantly lower than the control (�2 �9.00, P � 0.003; �2 � 7.50, P � 0.006, respectively).Litter cover reductions were only somewhat lower butnot different in the burn-only versus the control treat-ment (�2 � 0.410, P � 0.522); the log-and-burn versusthe log-only treatments were not different (�2 � 0.798,P � 0.372).
Mow-and-Burn Experiment
At LAS, where burning was done 1 mo after mow-ing, litter cover was reduced in both the mow-and-burnand burn-only treatments compared with the control(�2 � 27.774, P � 0.001; �2 � 13.605, P � 0.001,respectively), while the litter cover in the mow-onlytreatment was not different from the control (�2 �1.467, P � 0.226; Figure 2A). However, at LPS, whereburning was delayed for a year after mowing, themow-and-burn treatment was ineffective in reducinglitter cover (�2 � 2.599, P � 0.107; Figure 2B). Theburn-only treatment effectively reduced litter coverversus all other treatments at LPS (P � 0.001; Figure2B).
Saw-and-Burn Experiment
The saw-and-burn treatment was most effective inreducing litter cover (Figure 3). Litter cover in thesaw-and-burn treatment decreased significantly com-pared with both the burn-only and the control treat-ments (�2 � 15.478, P � 0.001; �2 � 26.906, P �0.001, respectively). The burn-only treatment margin-ally reduced litter cover (�2 � 3.762, P � 0.052).
DISCUSSION
By the 1980s, �85% of fire-maintained Floridascrub and sandhill ecosystems on the Lake WalesRidge of central peninsular Florida had been lost todevelopment (Peroni and Abrahamson 1985). Much ofthe remaining Florida scrub and sandhill (currently�15% of its original area) is embedded in an increas-ingly urbanized landscape, making it difficult for landmanagers to apply prescribed fire safely. Remainingxeric uplands in other parts of the state are even rarerand more fragmented. Thus, land managers haveturned to various mechanical means as either surro-gates for fire or as pre-treatments to fire. When usedas pre-treatments to fire, mechanical treatments reducethe height of fuel and make it more homogeneous,decreasing the risk of fire escape and facilitating evenburn coverage. Based on preliminary results fromthree studies on four sites, we have found that somemechanical treatments are more effective than othersin creating conditions that promote the restoration andmaintenance of Florida scrub and sandhill ecosystems.
Logging reduced litter cover much more than
107MECHANICAL TREATMENTS IN FLORIDA SCRUB AND SANDHILL
Fig. 2. Boxplots comparing percent litter cover pre-treatment(1998) and post-treatment (2000–2003) for a mow-and-burn ex-periment to restore fire-suppressed scrub, Lake Wales Ridge,central Florida. (A) Lake Apthorpe scrub. (B) Lake Placid scrub.The lower and upper horizontal bars of the boxplot represent the25th and 75th percentiles, respectively; the solid middle bar rep-resents the median. The lower and upper whiskers show thelargest and smallest values that are not outliers. The circles areoutliers (more than 1.5 box-lengths from 25th and 75th percen-tiles) and the asterisks are extreme outliers (more than 3 box-lengths from 25th and 75th percentiles).
burning alone; however, skid trails from timber re-moval in the log-only and log-and-burn treatments cre-ated large areas of bare sand characterized by consid-erable soil disturbance. Logged areas were dominatedby weedy natives and are susceptible to invasion byexotics such as cogongrass (Imperata cylindrica) andnatal grass (Rhychelytrum repens). Logging producedmore extreme changes than burning alone in the can-opy layer (M.A. Rickey, E.S. Menges, and C.W. Week-ley, unpublished data) and in litter cover. All treat-ments were successful in reducing the subcanopy layerand reducing shrub cover (M.A. Rickey, E.S. Menges,and C.W. Weekley, unpublished data). Because of thesoil disturbances associated with logging, we recom-
mend caution when logging in Florida scrub. Overtime, the negative effects of these soil disturbancesmay decline (P.A. Schmalzer, Dynamac Corporation,personal communication).
The effectiveness of the mow-and-burn treatmentdepended upon the timing of the burn. When the burnoccurred 1 mo after mowing, the mow-and-burn treat-ment mimicked the burn-only treatment; when theburn was delayed for a year, litter reductions in themow-and-burn treatment were more similar to mowingalone, which was not effective in reducing litter cover.This result is in agreement with that of Schmalzer etal. (2003), who found that mechanical treatments plusburning were most similar to burning alone when thefire occurred �6 mo after cutting. In our study, themow-only treatment was not effective because it cre-ated a thick layer of thatch that reduced bare sandpatches needed for seedling requirement by many rareFlorida scrub plants. All treatments at both mow-and-burn sites were effective in reducing shrub heights rel-ative to the control (M.A. Rickey, E.S. Menges, andC.W. Weekley, unpublished data). Chainsaw fellingfollowed by fire was more effective in reducing littercover than fire alone, perhaps because of the higherfire intensity (Wally et al. 2006) and more completecoverage (E.S. Menges, personal observation) associ-ated with the chainsaw pre-treatment. All three me-chanical treatments examined in this study, when usedas pre-treatments for prescribed burning, were at leastas effective in reducing litter cover as burning alone.
MANAGEMENT IMPLICATIONS
Mechanical treatment followed quickly by fire canbe a useful management tool to accelerate restorationof Florida scrub and sandhill sites degraded by decadesof fire suppression. Because of the scarcity of data onthe effects of various mechanical treatments or pre-treatments, we strongly recommend pre- and post-treatment monitoring of vegetation responses to themethods employed. This is particularly important ifmechanical treatments are used as a surrogate for fire.Monitoring programs should explicitly target the rareherbaceous species endemic to Florida scrub and sand-hill because they may be vulnerable to mechanicaltreatments. However, because these endemics are alsoespecially vulnerable to fire suppression, the use ofmechanical treatments followed by fire may be of ben-efit. Soil disturbance may lead to increases in exoticplants, or as in the case of our log-and-burn experi-ment, weedy native species. Mechanical treatmentscombined with fire may be especially useful for thefirst attempt to burn long-unburned sites; however,subsequent management of Florida scrub and sandhillshould focus on prescribed burning.
ACKNOWLEDGMENTS
We thank Archbold Biological Station, the FloridaDivision of Forestry, the Florida Fish and WildlifeConservation Commission, The Nature Conservancy,
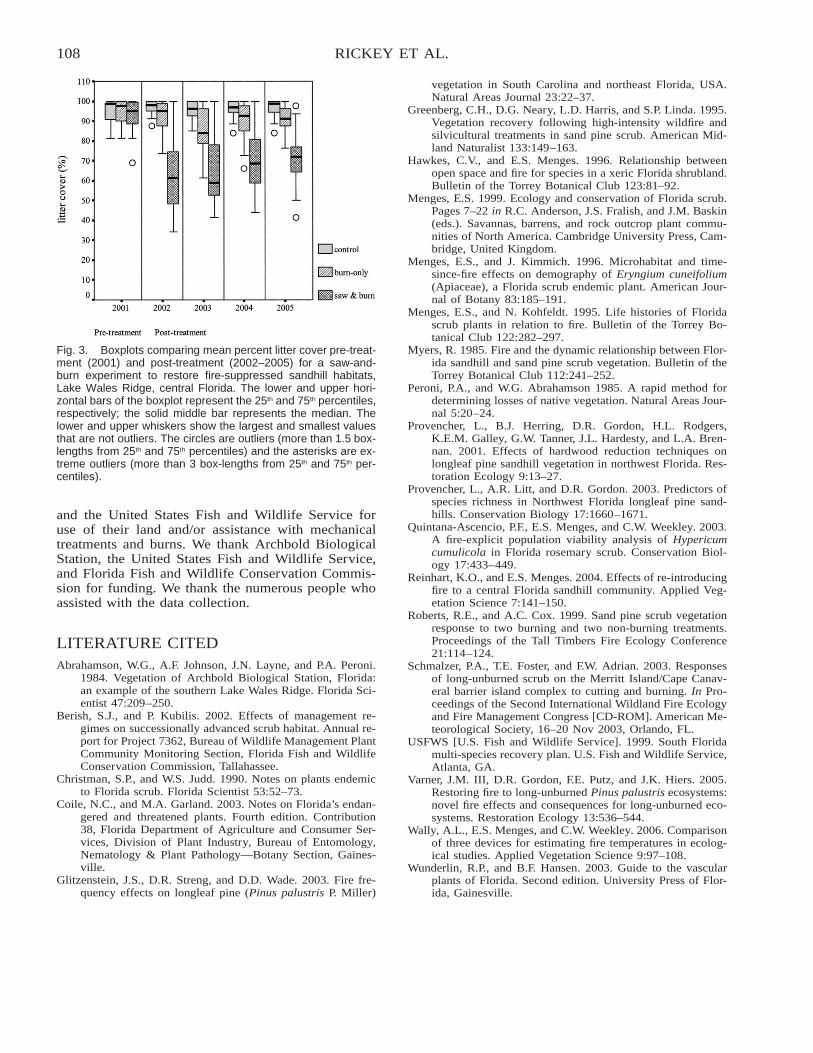
108 RICKEY ET AL.
Fig. 3. Boxplots comparing mean percent litter cover pre-treat-ment (2001) and post-treatment (2002–2005) for a saw-and-burn experiment to restore fire-suppressed sandhill habitats,Lake Wales Ridge, central Florida. The lower and upper hori-zontal bars of the boxplot represent the 25th and 75th percentiles,respectively; the solid middle bar represents the median. Thelower and upper whiskers show the largest and smallest valuesthat are not outliers. The circles are outliers (more than 1.5 box-lengths from 25th and 75th percentiles) and the asterisks are ex-treme outliers (more than 3 box-lengths from 25th and 75th per-centiles).
and the United States Fish and Wildlife Service foruse of their land and/or assistance with mechanicaltreatments and burns. We thank Archbold BiologicalStation, the United States Fish and Wildlife Service,and Florida Fish and Wildlife Conservation Commis-sion for funding. We thank the numerous people whoassisted with the data collection.
LITERATURE CITEDAbrahamson, W.G., A.F. Johnson, J.N. Layne, and P.A. Peroni.
1984. Vegetation of Archbold Biological Station, Florida:an example of the southern Lake Wales Ridge. Florida Sci-entist 47:209–250.
Berish, S.J., and P. Kubilis. 2002. Effects of management re-gimes on successionally advanced scrub habitat. Annual re-port for Project 7362, Bureau of Wildlife Management PlantCommunity Monitoring Section, Florida Fish and WildlifeConservation Commission, Tallahassee.
Christman, S.P., and W.S. Judd. 1990. Notes on plants endemicto Florida scrub. Florida Scientist 53:52–73.
Coile, N.C., and M.A. Garland. 2003. Notes on Florida’s endan-gered and threatened plants. Fourth edition. Contribution38, Florida Department of Agriculture and Consumer Ser-vices, Division of Plant Industry, Bureau of Entomology,Nematology & Plant Pathology—Botany Section, Gaines-ville.
Glitzenstein, J.S., D.R. Streng, and D.D. Wade. 2003. Fire fre-quency effects on longleaf pine (Pinus palustris P. Miller)
vegetation in South Carolina and northeast Florida, USA.Natural Areas Journal 23:22–37.
Greenberg, C.H., D.G. Neary, L.D. Harris, and S.P. Linda. 1995.Vegetation recovery following high-intensity wildfire andsilvicultural treatments in sand pine scrub. American Mid-land Naturalist 133:149–163.
Hawkes, C.V., and E.S. Menges. 1996. Relationship betweenopen space and fire for species in a xeric Florida shrubland.Bulletin of the Torrey Botanical Club 123:81–92.
Menges, E.S. 1999. Ecology and conservation of Florida scrub.Pages 7–22 in R.C. Anderson, J.S. Fralish, and J.M. Baskin(eds.). Savannas, barrens, and rock outcrop plant commu-nities of North America. Cambridge University Press, Cam-bridge, United Kingdom.
Menges, E.S., and J. Kimmich. 1996. Microhabitat and time-since-fire effects on demography of Eryngium cuneifolium(Apiaceae), a Florida scrub endemic plant. American Jour-nal of Botany 83:185–191.
Menges, E.S., and N. Kohfeldt. 1995. Life histories of Floridascrub plants in relation to fire. Bulletin of the Torrey Bo-tanical Club 122:282–297.
Myers, R. 1985. Fire and the dynamic relationship between Flor-ida sandhill and sand pine scrub vegetation. Bulletin of theTorrey Botanical Club 112:241–252.
Peroni, P.A., and W.G. Abrahamson 1985. A rapid method fordetermining losses of native vegetation. Natural Areas Jour-nal 5:20–24.
Provencher, L., B.J. Herring, D.R. Gordon, H.L. Rodgers,K.E.M. Galley, G.W. Tanner, J.L. Hardesty, and L.A. Bren-nan. 2001. Effects of hardwood reduction techniques onlongleaf pine sandhill vegetation in northwest Florida. Res-toration Ecology 9:13–27.
Provencher, L., A.R. Litt, and D.R. Gordon. 2003. Predictors ofspecies richness in Northwest Florida longleaf pine sand-hills. Conservation Biology 17:1660–1671.
Quintana-Ascencio, P.F., E.S. Menges, and C.W. Weekley. 2003.A fire-explicit population viability analysis of Hypericumcumulicola in Florida rosemary scrub. Conservation Biol-ogy 17:433–449.
Reinhart, K.O., and E.S. Menges. 2004. Effects of re-introducingfire to a central Florida sandhill community. Applied Veg-etation Science 7:141–150.
Roberts, R.E., and A.C. Cox. 1999. Sand pine scrub vegetationresponse to two burning and two non-burning treatments.Proceedings of the Tall Timbers Fire Ecology Conference21:114–124.
Schmalzer, P.A., T.E. Foster, and F.W. Adrian. 2003. Responsesof long-unburned scrub on the Merritt Island/Cape Canav-eral barrier island complex to cutting and burning. In Pro-ceedings of the Second International Wildland Fire Ecologyand Fire Management Congress [CD-ROM]. American Me-teorological Society, 16–20 Nov 2003, Orlando, FL.
USFWS [U.S. Fish and Wildlife Service]. 1999. South Floridamulti-species recovery plan. U.S. Fish and Wildlife Service,Atlanta, GA.
Varner, J.M. III, D.R. Gordon, F.E. Putz, and J.K. Hiers. 2005.Restoring fire to long-unburned Pinus palustris ecosystems:novel fire effects and consequences for long-unburned eco-systems. Restoration Ecology 13:536–544.
Wally, A.L., E.S. Menges, and C.W. Weekley. 2006. Comparisonof three devices for estimating fire temperatures in ecolog-ical studies. Applied Vegetation Science 9:97–108.
Wunderlin, R.P., and B.F. Hansen. 2003. Guide to the vascularplants of Florida. Second edition. University Press of Flor-ida, Gainesville.
109
A COMPARISON OF NATIVE VERSUS OLD-FIELDVEGETATION IN UPLAND PINELANDS MANAGED WITH
FREQUENT FIRE, SOUTH GEORGIA, USA
Thomas E. Ostertag1 and Kevin M. Robertson2
Tall Timbers Research Station, 13093 Henry Beadel Drive, Tallahassee, FL 32312, USA
ABSTRACT
Fire-maintained, herb-dominated upland pinelands of the southeastern U.S. Coastal Plain may be broadly divided into those that havearisen through secondary succession following abandonment of agriculture (old-field pinelands) and those that have never been plowed(native pinelands). The ability to distinguish these habitat types is important for setting conservation priorities by identifying naturalareas for conservation and appropriate management and for assessing the ecological value and restoration potential for old-field pineforests managed with frequent fire. However, differences in species composition have rarely been quantified. The goals of this studywere to characterize the species composition of native and old-field pineland ground cover, test the ability to distinguish communitiesof previously unknown disturbance history, and suggest indicator species for native versus old-field pinelands. Plant composition wassurveyed in areas known to be native ground cover, those known to be old fields, and those with an uncertain disturbance history.Twelve permanent plots were established in each cover type and sampled in spring (April–May) and fall (October–November) in 2004and 2005. Of the 232 species identified in the plots, 56 species were present only in native ground-cover plots, of which 17 speciesoccurred in a sufficient number of plots to have a statistically significant binomial probability of occurring in native ground cover andmight be considered indicator species. In addition, 15 species were confined to old fields, of which 5 had a statistically significantbinomial probability. Additionally, plant census transects from a previous survey were comparatively analyzed, yielding a total of 432species, of which 111 were present only in native ground-cover transects and 3 occurred in a sufficient number of transects to havestatistically significant binomial association with native areas. Also, 111 species were confined to old fields but none in a sufficientnumber of transects for a significant association with old fields. In both the plot and transect data sets, most old-field species representeda subset of those found in native areas, suggesting differential ability of certain native species to disperse to and become establishedin abandoned agricultural land. These results will assist in identifying natural areas for conservation as well as assessing the ecologicalvalue and restoration potential of old-field pine forests managed with frequent fire.
keywords: indicator species, longleaf pine, native ground cover, old fields, Pinus palustris, prescribed fire, secondary succession, SouthGeorgia, upland pinelands.
Citation: Ostertag, T.E., and K.M. Robertson. 2007. A comparison of native versus old-field vegetation in upland pinelands managedwith frequent fire, South Georgia, USA. Pages 109–120 in R.E. Masters and K.E.M. Galley (eds.). Proceedings of the 23rd Tall TimbersFire Ecology Conference: Fire in Grassland and Shrubland Ecosystems. Tall Timbers Research Station, Tallahassee, Florida, USA.
INTRODUCTION
A detailed knowledge of a region’s natural com-munities is crucial for conservation and restoration ef-forts as well for the management of currently protectedareas. This baseline knowledge allows for a determi-nation of the degree to which a degraded system haschanged and potentially concurrent loss of biodiversityand possible changes in ecosystem processes (Noss2000). The ability to identify undisturbed natural com-munities may be obfuscated by a past history of an-thropogenic disturbance or alteration of natural distur-bance regimes. In the southeastern U.S. Coastal Plain,intensive agriculture is chief among anthropogenic ac-tivities that have contributed to a 97% conversion ofnative pineland habitat (Frost 1993). Thus, conserva-tion efforts require the means to distinguish and char-acterize native versus post-agricultural communities inorder to set conservation priorities for acquisition and
1 Current address: Florida Fish and Wildlife Conservation Com-mission, 620 S. Meridian Street, MS 2-A, Tallahassee, FL 32399,USA.2 Corresponding author ([email protected]).
protection and to assess the ecological value and res-toration potential of each.
Following the large-scale abandonment of agri-cultural fields on the Coastal Plain in the late 19th andearly 20th centuries (Paisley 1968, Brueckheimer1979), fallow fields that were periodically burned re-turned to pinelands with an herb-dominated understory(Moser et al. 2002). Thus, fire-maintained, herb-dom-inated upland pinelands of the southeastern U.S.Coastal Plain may be broadly divided into those thathave arisen through secondary succession followingabandonment of agriculture (old-field pinelands) andthose that have never been plowed (native pinelands).With proactive management (i.e., prescribed burningand selective timber thinning), these old-field pine-lands provide habitat to gopher tortoises (Gopheruspolyphemus), Bachman’s sparrows (Aimophila aesti-valis), fox squirrels (Sciurus niger), and reintroducedred-cockaded woodpeckers (Picoides borealis) (Mas-ters et al. 2003). Even so, old-field successional hab-itats are thought to constitute a major shift in floristiccharacteristics from their original composition (Meansand Grow 1985, Myers 1990). In the eastern portionof the southeastern U.S. Coastal Plain, upland old-field
110 OSTERTAG AND ROBERTSON
pinelands once dominated by longleaf pine (Pinus pal-ustris) and wiregrass (Aristida stricta) are now typi-cally dominated by loblolly pine (Pinus taeda) andshortleaf pine (P. echinata) (Moser et al. 2002) andhave lost wiregrass as a component of their herbaceousground cover (Crafton and Wells 1934, McQuilken1940, Oosting 1942, Grelen 1962, Clewell 1986, Hed-man et al. 2000). It is generally observed that old-fieldvegetation has a smaller number of native species andthat these species are relatively common (Clewell1986, Hedman et al. 2000, Kirkman et al. 2004). Thisprevalence is attributed to their ability to disperse toand colonize disturbed soil (Kirkman et al. 2004).Thus, old-field pinelands may be placed at a lowerpriority for conservation and protection.
Although species composition of native longleafpine habitats has often been described (e.g., Bridgesand Orzell 1989, Hardin and White 1989, Drew et al.1998, Kush and Meldahl 2000, Varner et al. 2003,Carter et al. 2004), comparatively few published stud-ies have compared vegetation composition betweenold-field and relatively undisturbed upland pine habi-tats (Hedman et al. 2000, Kirkman et al. 2004). Thesestudies have shown significant differences in speciescomposition between old-field sites and ‘‘referencesites’’ representing the native community type, as wellas lower species richness in old-field sites because ofdispersal limitations on certain native species (Kirk-man et al. 2004). Native pineland communities are alsosensitive to vehicular traffic, soil compaction, and sur-face scarification associated with planted pine sitepreparation, logging, and military training (Hedman etal. 2000, Dale et al. 2002, Smith et al. 2002). However,soil disturbance associated with intensive agricultureappears to have the greatest impact on species com-position in fire-maintained pinelands relative to theseother disturbance types (Hedman et al. 2000).
The sensitivity of many species to anthropogenicdisturbance makes them useful indicators of habitat in-tegrity (Noss 1990, Kimberling et al. 2001, McLachlanand Bazely 2001, Moffatt and McLachlan 2004). Indi-cator species should be sensitive to the environmentalstress of interest, and thus may indicate the biologicalintegrity of an ecosystem (Dale and Beyeler 2001) andabundant and tractable components of the system (Welshand Ollivier 1998). Indicator species for relatively un-disturbed native pinelands maintained with frequent firein the Coastal Plain have been proposed in other studies(Rodgers and Provencher 1999, Dale et al. 2002, Smithet al. 2002, Kirkman et al. 2004). However, additionalstudies are needed both to confirm the reliability of cer-tain widely distributed species as indicators throughoutthe region as well as to identify local indicator speciesamong physiographic features within the region (e.g.,Dougherty Plain, Tifton Uplands).
The goals of this study were to characterize and con-trast the species composition between native and old-field upland clayhill pinelands in Southwest Georgia, totest the utility of these data in interpreting the communityintegrity of sites with unknown disturbance history, andto identify possible indicator species that can aid in dis-tinguishing these community types. The results should
assist in identifying natural areas for conservation andappropriate management and for assessing the ecologicalvalue and restoration potential for old-field pine forestsmanaged with frequent fire.
METHODS
Study Area
The study was conducted within the Red Hills re-gion of southern Georgia and northern Florida on Peb-ble Hill Plantation (PHP) (30�35�N, 84�20�W), whichcovered approximately 1,222 ha in Grady and Thomascounties, Georgia. The Red Hills region was charac-terized by gently sloping, well-drained sandy or loamysoils underlain by clayey or sandy sub-horizons (Cal-houn 1979). Plots were more or less evenly distributedamong the following soil types: Bonneau loamy sand,Dothan loamy sand, Lucy loamy sand, Tifton loamysand, Faceville sandy loam, and Nankin–Cowartssandy loam. Mean annual temperature was 19.6�C(11�–27.4�C monthly means) and mean annual precip-itation was 1,373.4 mm (Southeast Regional ClimateCenter 2004). The growing season for this region wasfrom early March to November (Calhoun 1979; T.E.Ostertag and K.M. Robertson, unpublished data). PHPhad been managed for northern bobwhite (Colinus vir-ginianus) and timber during the past century, primarilywith the use of frequent prescribed fire (1- to 2-y fireinterval) and both even- and uneven-aged managementsystems.
The forested upland habitats at PHP were a mix-ture of old fields, pine plantations, and native pine-lands (never plowed) (Robertson and Ostertag 2003).The native areas had a canopy dominated by longleafpine, often mixed with shortleaf pine, and an under-story supporting a high diversity of other woodyplants, forbs, and grasses, especially wiregrass. Theold-field pineland habitats had a canopy dominated bysome mixture of shortleaf and loblolly pines and anunderstory of woody species typical of disturbed areasin the region, such as water oak (Quercus nigra) andsweetgum (Liquidambar styraciflua), and herbs com-posed of some subset of native species as well as ag-ricultural weeds. Timber management had been simi-larly applied to the specifically selected native and old-field pineland sites, such that stand densities and struc-ture were similar between the two habitat types(average of 9.6 � 6.3 SD m2/ha in native stands basedon 54 random plots, 10.9 m2 � 6.3 m2 basal area/hain old-field stands based on 59 random plots [K.M.Robertson, unpublished data]).
Site Selection and Sampling Methods
Plant communities were compared among the fol-lowing cover types: native ground cover, old fields,and areas of unknown soil disturbance history. Nativeground cover was identified by the presence of wire-grass, based on the general observation that wiregrassdoes not readily return to extensive areas of heavilydisturbed soil or prolonged fire suppression (Hebb
111A COMPARISON OF UPLAND PINELANDS
1957, 1971; Woods 1959; Grelen 1962; Harris et al.1974; Schultz and Wilhite 1974; White et al. 1975;Myers 1990). Old-field sites were identified as culti-vated in a 1928 (earliest known) aerial photograph.Based on the age of current pines and other historicalrecords, we estimated these sites had been abandonedfrom cultivation circa 1950. Areas of unknown man-agement history (may or may not be native groundcover) were forest at the time of the 1928 aerial pho-tograph (current age of trees approximately 150 y old)but lacked wiregrass at the time of this study.
For each of the three cover types, 12 permanentsampling plots were established, with 3 plots in eachof 4 separate burn units. Burn units ranged in areafrom 2.6 to 18.5 ha. Burn units and plot locations with-in burn units were randomly chosen using ArcView3.2 Animal Movement extension (Environmental Sys-tems Research Institute 1999). Potential plot locationswere limited to ridge tops and the upper halves ofslopes to restrict them to upland pine habitats. Eachplot was 100 m2 (10 m � 10 m), with nested subplotsof 10 m2 and 1 m2 in one corner. Thus, the 36 totalplots covered 3,600 m2. Species were censused startingwith the 1-m2 subplot, then proceeding to the 10-m2
and the 100-m2 plots. Species of all herbaceous vas-cular plants and woody shrubs and trees �1 m highwere censused within the plots. Percent cover withinthe 100-m2 plot was estimated for each species usinga modified Daubenmire cover class method (Peet et al.1998). Maximum cover for each species was 100%,but cumulative cover for all species could exceed100%. The plots were censused four times between fall2003 and spring 2005 (once in each of the following:October–November 2003, October–November 2004,April–May 2004, and April–May 2005) to incorporateseasonal and annual variation in the presence and vis-ibility of plant species. Plants were identified to spe-cies and otherwise were not included in the analysis.Unidentified plants were generally seedlings or thosebadly damaged by herbivory or senescence. Uniden-tified specimens accounted for 8% of all samples col-lected.
Species composition in the study plots was com-pared to species lists compiled between July 1995 andNovember 2002 from transects running throughoutPHP (A. Gholson and C. Martin, PHP, unpublisheddata). Transects used in the analysis were limited tothose entirely contained within native (n � 9) and old-field (n � 8) cover types. There were no transects con-tained entirely within the unknown-disturbance-historycover type. These censuses incorporated plants thatcould be easily observed by the surveyors to eitherside of each transect (total width of 4 m). Transectsvaried in length from 160 to 719 m due to size of theburn unit. The total area censused for all transects wasapproximately 22,000 m2. Transects were not boundby topographic or hydrological constraints as were thestudy plots, such that lower hillslope and wetland pine-lands were included. All plants, including trees andshrubs regardless of size, were recorded. Taxonomyand nomenclature for both the plot censuses and tran-sects follows Wunderlin and Hansen (2003).
Data Analysis
A detrended canonical correspondence analysis(DCCA) in CANOCO 4.5 (ter Braak and Smilauer2002) was used to test the null hypothesis of no pre-dictable difference in species composition and coveramong native, old-field, or unknown study plots. Themedian cover values for 100-m2 plots estimated forspecies were used as the response variables in the anal-ysis, and plots served as units of replication. MonteCarlo permutations (499 iterations) on the first canon-ical axis were used to produce an F-statistic testing fordifferences among sampling plots (Leps and Smilauer2003). A detrended correspondence analysis (DCA) inCANOCO 4.5 was used to create an ordination dia-gram in CANODRAW 4.5 (ter Braak and Smilauer2002) to visually assess floristic similarity among sam-pling plots (Leps and Smilauer 2003). Similarly,DCCA and DCA were used to test for differences inspecies composition between native and old-field tran-sects based on presence–absence of species.
Binomial analyses were used to identify the mostlikely indicator species for native and old-field groundcover using both the plot and transect data. Plots (ex-cluding those of unknown disturbance history) con-taining a given species were assigned a binomial var-iable based on whether they were native or old field.Binomial tables were used to determine if there was astatistically nonrandom (two-sided � � 0.05) associa-tion of a species with a particular ground-cover type(Sokal and Rohlf 1995). Each occurrence of a speciesin a plot or transect was considered to have a 0.5 prob-ability of occurring in either native or old-field coverby chance; for example, occurrence of a species in 5native plots and none in old-field plots would be as-signed the probability of 0.031 (nonrandom). Indica-tors were defined as plants characteristic of and con-fined predominately to a particular habitat based onthe binomial analysis. This assessment was made sep-arately for plots and transects.
Plant species affiliated with one cover type wereplaced in one of three categories: 1) restricted to onecover type and in a sufficient number of plots or transects(5 or more) to have a statistically significant affinity (P� 0.031); 2) found predominately in one cover type witha statistically significant affinity; 3) found only in onecover type in 3 or 4 plots or transects (P � 0.125 or0.063, respectively). Category 3 was designed to identifyplants with a trend toward a definitive association withone ground-cover type versus the other, which might berevealed with additional sampling. Species for which plotand transect data contradicted one another were not listedas potential indicators.
RESULTS
A total of 232 plant species in 53 families wereidentified in the study plots, of which six were non-native species (Appendix A). Five families, Poaceae,Fabaceae, Asteraceae, Fagaceae, and Ericaceae, en-compassed 58% of the species, and 31 families wererepresented by a single species. The number of species
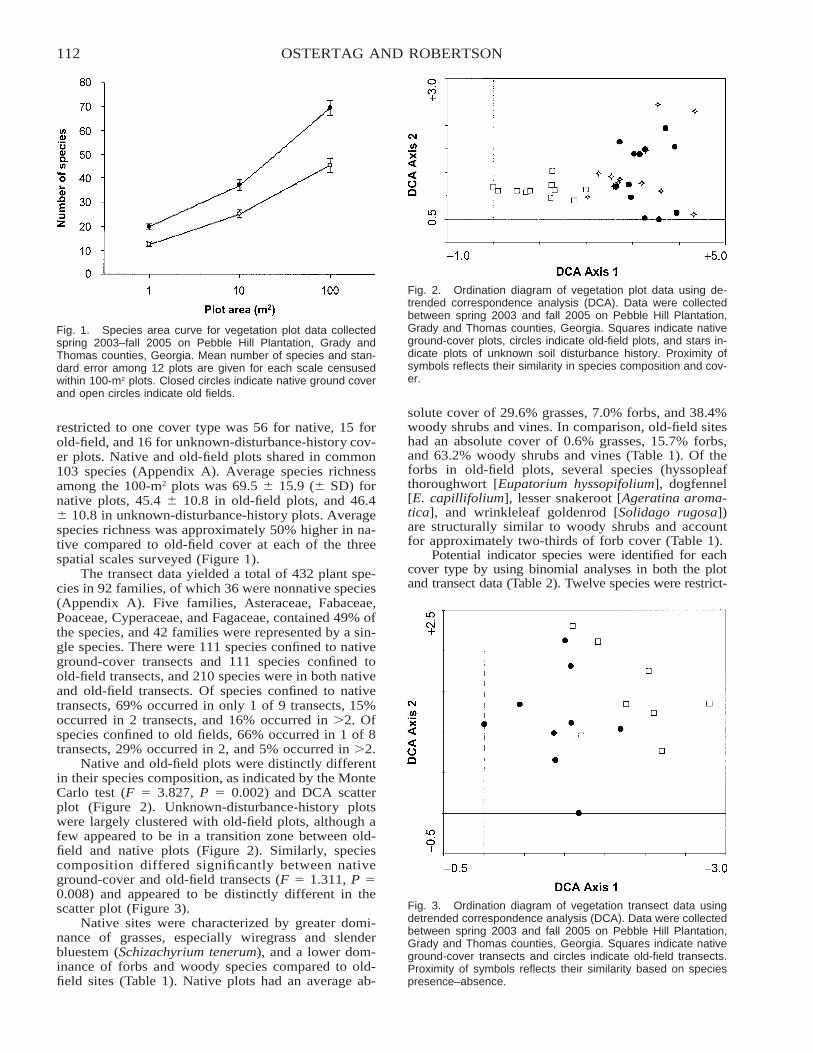
112 OSTERTAG AND ROBERTSON
Fig. 1. Species area curve for vegetation plot data collectedspring 2003–fall 2005 on Pebble Hill Plantation, Grady andThomas counties, Georgia. Mean number of species and stan-dard error among 12 plots are given for each scale censusedwithin 100-m2 plots. Closed circles indicate native ground coverand open circles indicate old fields.
Fig. 2. Ordination diagram of vegetation plot data using de-trended correspondence analysis (DCA). Data were collectedbetween spring 2003 and fall 2005 on Pebble Hill Plantation,Grady and Thomas counties, Georgia. Squares indicate nativeground-cover plots, circles indicate old-field plots, and stars in-dicate plots of unknown soil disturbance history. Proximity ofsymbols reflects their similarity in species composition and cov-er.
Fig. 3. Ordination diagram of vegetation transect data usingdetrended correspondence analysis (DCA). Data were collectedbetween spring 2003 and fall 2005 on Pebble Hill Plantation,Grady and Thomas counties, Georgia. Squares indicate nativeground-cover transects and circles indicate old-field transects.Proximity of symbols reflects their similarity based on speciespresence–absence.
restricted to one cover type was 56 for native, 15 forold-field, and 16 for unknown-disturbance-history cov-er plots. Native and old-field plots shared in common103 species (Appendix A). Average species richnessamong the 100-m2 plots was 69.5 � 15.9 (� SD) fornative plots, 45.4 � 10.8 in old-field plots, and 46.4� 10.8 in unknown-disturbance-history plots. Averagespecies richness was approximately 50% higher in na-tive compared to old-field cover at each of the threespatial scales surveyed (Figure 1).
The transect data yielded a total of 432 plant spe-cies in 92 families, of which 36 were nonnative species(Appendix A). Five families, Asteraceae, Fabaceae,Poaceae, Cyperaceae, and Fagaceae, contained 49% ofthe species, and 42 families were represented by a sin-gle species. There were 111 species confined to nativeground-cover transects and 111 species confined toold-field transects, and 210 species were in both nativeand old-field transects. Of species confined to nativetransects, 69% occurred in only 1 of 9 transects, 15%occurred in 2 transects, and 16% occurred in 2. Ofspecies confined to old fields, 66% occurred in 1 of 8transects, 29% occurred in 2, and 5% occurred in 2.
Native and old-field plots were distinctly differentin their species composition, as indicated by the MonteCarlo test (F � 3.827, P � 0.002) and DCA scatterplot (Figure 2). Unknown-disturbance-history plotswere largely clustered with old-field plots, although afew appeared to be in a transition zone between old-field and native plots (Figure 2). Similarly, speciescomposition differed significantly between nativeground-cover and old-field transects (F � 1.311, P �0.008) and appeared to be distinctly different in thescatter plot (Figure 3).
Native sites were characterized by greater domi-nance of grasses, especially wiregrass and slenderbluestem (Schizachyrium tenerum), and a lower dom-inance of forbs and woody species compared to old-field sites (Table 1). Native plots had an average ab-
solute cover of 29.6% grasses, 7.0% forbs, and 38.4%woody shrubs and vines. In comparison, old-field siteshad an absolute cover of 0.6% grasses, 15.7% forbs,and 63.2% woody shrubs and vines (Table 1). Of theforbs in old-field plots, several species (hyssopleafthoroughwort [Eupatorium hyssopifolium], dogfennel[E. capillifolium], lesser snakeroot [Ageratina aroma-tica], and wrinkleleaf goldenrod [Solidago rugosa])are structurally similar to woody shrubs and accountfor approximately two-thirds of forb cover (Table 1).
Potential indicator species were identified for eachcover type by using binomial analyses in both the plotand transect data (Table 2). Twelve species were restrict-
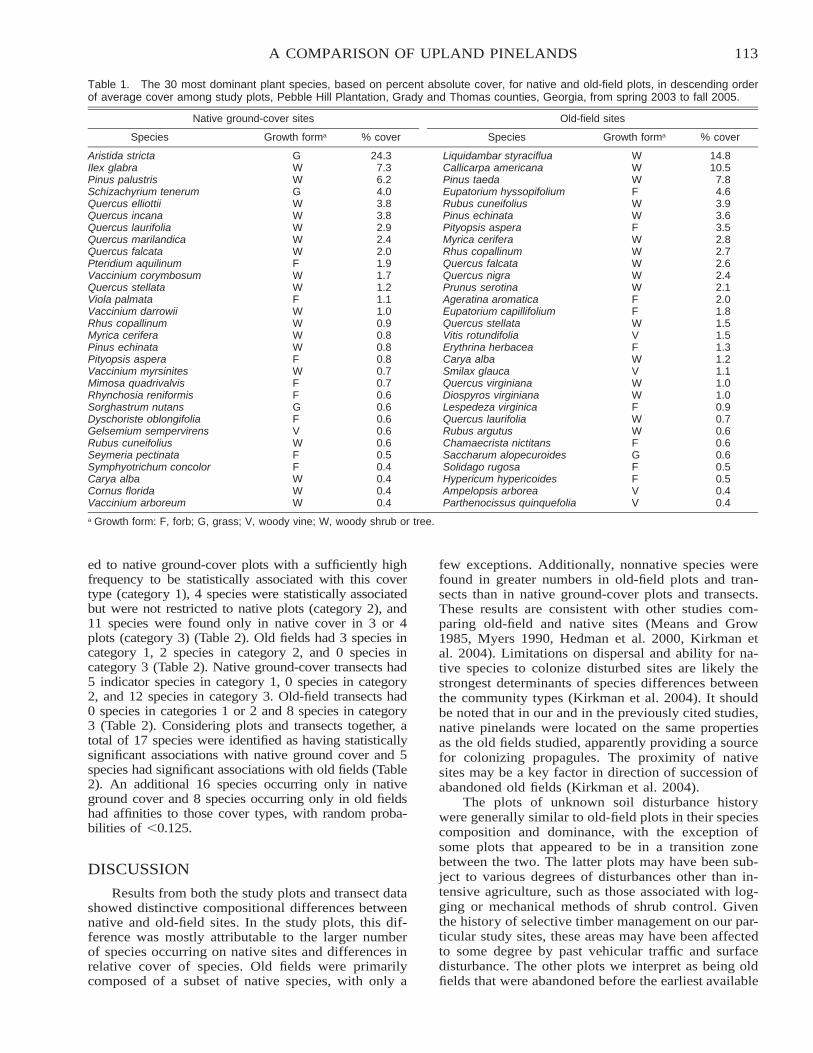
113A COMPARISON OF UPLAND PINELANDS
Table 1. The 30 most dominant plant species, based on percent absolute cover, for native and old-field plots, in descending orderof average cover among study plots, Pebble Hill Plantation, Grady and Thomas counties, Georgia, from spring 2003 to fall 2005.
Native ground-cover sites
Species Growth forma % cover
Old-field sites
Species Growth forma % cover
Aristida stricta G 24.3 Liquidambar styraciflua W 14.8Ilex glabra W 7.3 Callicarpa americana W 10.5Pinus palustris W 6.2 Pinus taeda W 7.8Schizachyrium tenerum G 4.0 Eupatorium hyssopifolium F 4.6Quercus elliottii W 3.8 Rubus cuneifolius W 3.9Quercus incana W 3.8 Pinus echinata W 3.6Quercus laurifolia W 2.9 Pityopsis aspera F 3.5Quercus marilandica W 2.4 Myrica cerifera W 2.8Quercus falcata W 2.0 Rhus copallinum W 2.7Pteridium aquilinum F 1.9 Quercus falcata W 2.6Vaccinium corymbosum W 1.7 Quercus nigra W 2.4Quercus stellata W 1.2 Prunus serotina W 2.1Viola palmata F 1.1 Ageratina aromatica F 2.0Vaccinium darrowii W 1.0 Eupatorium capillifolium F 1.8Rhus copallinum W 0.9 Quercus stellata W 1.5Myrica cerifera W 0.8 Vitis rotundifolia V 1.5Pinus echinata W 0.8 Erythrina herbacea F 1.3Pityopsis aspera F 0.8 Carya alba W 1.2Vaccinium myrsinites W 0.7 Smilax glauca V 1.1Mimosa quadrivalvis F 0.7 Quercus virginiana W 1.0Rhynchosia reniformis F 0.6 Diospyros virginiana W 1.0Sorghastrum nutans G 0.6 Lespedeza virginica F 0.9Dyschoriste oblongifolia F 0.6 Quercus laurifolia W 0.7Gelsemium sempervirens V 0.6 Rubus argutus W 0.6Rubus cuneifolius W 0.6 Chamaecrista nictitans F 0.6Seymeria pectinata F 0.5 Saccharum alopecuroides G 0.6Symphyotrichum concolor F 0.4 Solidago rugosa F 0.5Carya alba W 0.4 Hypericum hypericoides F 0.5Cornus florida W 0.4 Ampelopsis arborea V 0.4Vaccinium arboreum W 0.4 Parthenocissus quinquefolia V 0.4
a Growth form: F, forb; G, grass; V, woody vine; W, woody shrub or tree.
ed to native ground-cover plots with a sufficiently highfrequency to be statistically associated with this covertype (category 1), 4 species were statistically associatedbut were not restricted to native plots (category 2), and11 species were found only in native cover in 3 or 4plots (category 3) (Table 2). Old fields had 3 species incategory 1, 2 species in category 2, and 0 species incategory 3 (Table 2). Native ground-cover transects had5 indicator species in category 1, 0 species in category2, and 12 species in category 3. Old-field transects had0 species in categories 1 or 2 and 8 species in category3 (Table 2). Considering plots and transects together, atotal of 17 species were identified as having statisticallysignificant associations with native ground cover and 5species had significant associations with old fields (Table2). An additional 16 species occurring only in nativeground cover and 8 species occurring only in old fieldshad affinities to those cover types, with random proba-bilities of �0.125.
DISCUSSION
Results from both the study plots and transect datashowed distinctive compositional differences betweennative and old-field sites. In the study plots, this dif-ference was mostly attributable to the larger numberof species occurring on native sites and differences inrelative cover of species. Old fields were primarilycomposed of a subset of native species, with only a
few exceptions. Additionally, nonnative species werefound in greater numbers in old-field plots and tran-sects than in native ground-cover plots and transects.These results are consistent with other studies com-paring old-field and native sites (Means and Grow1985, Myers 1990, Hedman et al. 2000, Kirkman etal. 2004). Limitations on dispersal and ability for na-tive species to colonize disturbed sites are likely thestrongest determinants of species differences betweenthe community types (Kirkman et al. 2004). It shouldbe noted that in our and in the previously cited studies,native pinelands were located on the same propertiesas the old fields studied, apparently providing a sourcefor colonizing propagules. The proximity of nativesites may be a key factor in direction of succession ofabandoned old fields (Kirkman et al. 2004).
The plots of unknown soil disturbance historywere generally similar to old-field plots in their speciescomposition and dominance, with the exception ofsome plots that appeared to be in a transition zonebetween the two. The latter plots may have been sub-ject to various degrees of disturbances other than in-tensive agriculture, such as those associated with log-ging or mechanical methods of shrub control. Giventhe history of selective timber management on our par-ticular study sites, these areas may have been affectedto some degree by past vehicular traffic and surfacedisturbance. The other plots we interpret as being oldfields that were abandoned before the earliest available
114 OSTERTAG AND ROBERTSON
Table 2. Potential indicator species of native ground cover andold fields from Pebble Hill Plantation, Grady and Thomas coun-ties, Georgia, 2003–2005, and their identification as suggestedindicator species in other studies in the southeastern U.S.Coastal Plain. Nomenclature follows Wunderlin and Hansen(2003).
Species
Categorya
Plots Transects Other studiesb
Native ground-cover indicatorsAngelica dentata 3 1 FAristida stricta –c 1 B, D, EAsimina angustifolia 2Aureolaria pedicularia 3Carphephorus odoratissimus 1 3Chrysopsis mariana 1 D, EDalea carnea 3Dyschoriste oblongifolia 1 B, EEuphorbia curtisii 3 AEuphorbia discoidalis 1 AGaylussacia dumosa 1 3Gaylussacia frondosa 3 1Gymnopogon brevifolius 3Helianthus angustifolius 3Hypericum hypericoides 3Ilex glabra 1Lobelia amoena 3Mimosa quadrivalvis 2 EMonotropa uniflora 3Muhlenbergia capillaris 3 3 EPanicum virgatum 3 EPityopsis graminifolia 1Pleopeltis polypodioides 3Pteridium aquilinum 1 B, C, EQuercus elliottii 1Quercus incana 1 3Quercus laevis 1 3Sebastiania fruticosa 3Saccharum coarctatum 3Salvia azurea 1 1Seymeria pectinata 3Strophostyles umbellata 2 C, E, FStylisma patens 3Symphyotrichum adnatum 1 B, ESymphyotrichum concolor 2 C, ETephrosia virginiana 3 A, B, C, E, F
Old-field indicatorsCroton glandulosus 3Erythrina herbacea 2Eupatorium capillifolium 2Gamochaeta pensylvanica 3Lespedeza procumbens 3Liatris tenuifolia 3Quercus virginiana 1Ruellia caroliniensis 3 A, B, DSebastiania fruticosa 3Seymeria pectinata 3Solidago rugosa 1Trichostema dichotomum 1Yucca filamentosa 3
a Category: 1, plants restricted to one cover type with a statisticalaffinity; 2, plants predominately in one cover type with a statisticalaffinity; 3, plants restricted to one cover type without statistical affin-ity.b Other studies: A, Rodgers and Provencher 1999; B, Hedman et al.2000; C, Dale et al. 2002; D, Smith et al. 2002; E, Kirkman et al.2004; F, Carter et al. 2004.c Aristida stricta was used as an indicator of whether or not sites hadbeen disturbed and hence was not included in the analysis.
aerial photograph, based on their close similarity inspecies composition and structure to confirmed old-field plots. This assessment provides an example of theway in which baseline data characterizing the com-position and dominance of native and old-field sitesmay be used in interpreting the disturbance history ofpineland ground cover through multivariate analysis.
In contrast to the study plots, transects had anequal number of species limited to either native or old-field sites. This difference is attributable to the incor-poration of a much larger area and thus a greater ac-cumulation of rare species in transects relative to theplots, reflected by the fact that the great majority ofspecies in the transect data occurred in only one ortwo transects. These species may be either naturallyrare species or species associated with isolated distur-bances; in either case, they are likely to be missed bytransects in the other cover type.
In addition to compositional differences betweennative and old-field sites, there were significant differ-ences in structure and species dominance. In particular,native sites were characterized by high grass cover andrelatively lower forb and woody species cover, where-as old fields had only trace cover by grass and weredominated by large-statured forbs and woody plants.Clearly the likelihood of dispersal and establishmentof plants from native areas to abandoned fields is de-pendent, at least in part, on whether they are grass,forb, or woody species. The association of higher forband woody species dominance with degree of soil dis-turbance in southern pinelands has been noted in otherstudies (Hedman et al. 2000, Dale et al. 2002, Smithet al. 2002). This observation has implications for themanagement techniques that may be required to restorecertain old-field pinelands to a more natural vegetationstructure, including more frequent burning (White etal. 1991, Waldrop et al. 1992, Provencher et al. 2001c,Glitzenstein et al. 2003) and use of selective herbicides(Brockway et al. 1998, Litt et al. 2001, Provencher etal. 2001a,b, Jones and Chamberlain 2004, Miller andMiller 2004).
In addition to distinguishing native versus old-fieldpinelands, our study reveals the potential for old-fieldpine forests to harbor a significant proportion of nativepineland species when managed with frequent fire andselective timber thinning. Such forests are more ap-propriately described as partially to mostly restored na-tive pinelands rather than purely anthropogenic habi-tats, as demonstrated by their potential to support adiversity of rare animal species adapted to native pine-lands (Masters et al. 2003, Provencher et al. 2003).These qualities attest to the benefits of frequent fireand appropriate timber management for restoring andmaintaining high-quality wildlife habitat in post-agri-culture pine forests.
We propose 17 species as indicators of nativeground cover lacking intensive soil disturbance, basedon their statistical affinity to that cover type, and 16species to be potential indicators based on their nearlysignificant associations with native sites. Of these, 14species have been identified as indicators of nativeground cover lacking an intensive soil disturbance his-
115A COMPARISON OF UPLAND PINELANDS
tory in Coastal Plain pinelands in other studies (Rodg-ers and Provencher 1999, Hedman et al. 2000, Dale etal. 2002, Smith et al. 2002, Kirkman et al. 2004; Table2). In addition to wiregrass, used to identify nativeplots in this study and thus excluded from analysis,coastalplain angelica (Angelica dentata), Marylandgoldenaster (Chrysopsis mariana), oblongleaf snake-herb (Dyschoriste oblongifolia), Curtis’ spurge (Eu-phorbia curtisii), summer spurge (Euphorbia discoi-dalis), sensitive brier (Mimosa quadrivalvis), hairawnmuhly (Muhlenbergia capillaris), switchgrass (Pani-cum virgatum), brackenfern (Pteridium aquilinum),pink fuzzybean (Strophostyles umbellata), eastern sil-ver aster (Symphyotrichum concolor), and goat’s rue(Tephrosia virginiana) appear to have geographicallybroad utility as indicators of pineland sites which haveexperienced minimal ground-cover disturbance. Otherspecies, live oak (Quercus virginiana), Carolina wildpetunia (Ruellia caroliniensis), wrinkleleaf goldenrod,and forked bluecurls (Trichostema dichotomum), ap-pear to be reliable indicators of soil disturbance.
These studies of upland pine forests also point outthe variation in floristic composition among pinelands.In individual studies, most of the species identified aspotential indicators have not been found in sufficientlylarge numbers in other studies to merit distinction (Hed-man et al. 2000, Dale et al. 2002, Smith et al. 2002,Kirkman et al. 2004). This may be related to inherentsite and soil differences (i.e., sandy vs. clayey soils).However, given that it is recommended to use the fullsuite of plant species available in interpreting naturalhabitat integrity (Zonneveld 1983, Kremen 1992, Car-ignan and Villard 2002), all suggested species, when ap-pearing in significant numbers, should be considered asindicative of native community presence. Such interpre-tations are critical and time sensitive, given the ongoingconversion of native pinelands to other land uses in thesoutheastern U.S. Coastal Plain.
In summary, southern pineland native ground cov-er contains a significant number of species that do notreadily become reestablished during several years oreven decades following extensive soil disturbance. Theextreme sensitivity of many native species to intensivesoil disturbance underscores the need to identify re-maining undisturbed areas for conservation, as facili-tated by the use of indicator species suggested by thisand other studies. Nevertheless, our data demonstratethe potentially high species richness of native plantsin old fields managed with frequent fire and selectivetimber management. Understanding the differencesand similarities between these community types, in-cluding species composition and community structure,is important for prioritizing future conservation, res-toration, and management of the species they support.
ACKNOWLEDGMENTSWe thank Susan Carr and Wilson Baker for their
invaluable assistance in plant identification. We aregrateful to Angus Gholson and Chuck Martin for useof their Pebble Hill data set. We thank Christine Sloanand John Pywell for assisting with data collection.
LITERATURE CITEDBridges, E.L., and S.L. Orzell. 1989. Longleaf pine communities
of the West Gulf Coastal Plain. Natural Areas Journal 9:246–263.
Brockway, D.G., K.W. Outcalt, and R.N. Wilkins. 1998. Restor-ing longleaf pine wiregrass ecosystems: plant cover, diver-sity and biomass following low-rate hexazinone applicationon Florida sandhills. Forest Ecology and Management 103:159–175.
Brueckheimer, W.R. 1979. The quail plantations of the Thom-asville–Tallahassee–Albany regions. Proceedings of the TallTimbers Ecology and Management Conference 16:141–165.
Calhoun, J.W. 1979. Soil survey of Brookes and Thomas coun-ties, Georgia. U.S. Department of Agriculture, Soil Conser-vation Service and University of Georgia, College of Ag-riculture, Agriculture Experiment Station, Athens.
Carignan, V., and M.-A. Villard. 2002. Selecting indicator spe-cies to monitor ecological integrity. Environmental Moni-toring and Assessment 78:45–61.
Carter, R.E., M.D. MacKenzie, D.H. Gjerstad, and D. Jones.2004. Species composition of fire disturbed ecological landunits in the Southern Loam Hills of south Alabama. South-eastern Naturalist 3:297–308.
Clewell, A.F. 1986. Natural setting and vegetation of the FloridaPanhandle. U.S. Army Corps of Engineers, Mobile, AL.
Crafton, W.M., and B.W. Wells. 1934. The old field prisere: anecological study. Journal of the Elisha Mitchell ScientificSociety 50:225–246.
Dale, V.H., and S.C. Beyeler. 2001. Challenges in the develop-ment and use of ecological indicators. Ecological Indicators1:3–10.
Dale, V.H., S.C. Beyeler, and B. Jackson. 2002. Understory veg-etation indicators of anthropogenic disturbance in longleafpine forests at Fort Benning, Georgia. Ecological Indicators1:155–170.
Drew, M.B., L.K. Kirkman, and A.K. Gholson. 1998. The vas-cular flora of Ichauway, Baker County, Georgia: a remnantlongleaf pine/wiregrass ecosystem. Castanea 63:1–24.
Environmental Systems Research Institute. 1999. ArcView 3.2.Environmental Systems Research Institute, Redlands, CA.
Frost, C.C. 1993. Four centuries of changing landscape patternsin the longleaf pine ecosystem. Proceedings of the Tall Tim-bers Fire Ecology Conference 18:17–43.
Glitzenstein, J.S., D.R. Streng, and D.D. Wade. 2003. Fire fre-quency effects on longleaf pine (Pinus palustris P. Miller)vegetation in South Carolina and northeast Florida. NaturalAreas Journal 23:22–37.
Grelen, H.E. 1962. Plant succession on cleared sandhills innorthwest Florida. American Midland Naturalist 67:36–44.
Hardin, E.D., and D.L. White. 1989. Rare vascular plant taxaassociated with wiregrass (Aristida stricta) in the south-eastern United States. Natural Areas Journal 9:234–245.
Harris, L.D., L.D. White, J.E. Johnson, and D.G. Milchunas.1974. Impacts of forest plantations on north Florida wildlifeand habitat. Proceedings of the Annual Conference of theSoutheastern Association of Game and Fish Commissioners28:659–677.
Hebb, E.A. 1957. Regeneration in the sandhills. Journal of For-estry 55:210–212.
Hebb, E.A. 1971. Site preparation decreases game food plantsin Florida sandhills. Journal of Wildlife Management 35:155–162.
Hedman, C.W., S.L. Grace, and S.E. King. 2000. Vegetationcomposition and structure of southern Coastal Plain forests:an ecological comparison. Forest Ecology and Management134:233–247.
Jones, J.D.J., and M.J. Chamberlain. 2004. Efficacy of herbicidesand fire to improve vegetative conditions for northern bob-whites in mature pine forests. Wildlife Society Bulletin 32:1077–1084.
Kimberling, D.N., J.R. Karr, and L.S. Fore. 2001. Measuring
116 OSTERTAG AND ROBERTSON
human disturbance using terrestrial invertebrates in theshrub-steppe of eastern Washington (USA). Ecological In-dicators 1:63–81.
Kirkman, L.K., K.L. Coffey, R.J. Mitchell, and E.B. Moser.2004. Ground cover recovery patterns and life-history traits:implications for restoration obstacles and opportunities in aspecies-rich savanna. Journal of Ecology 92:409–421.
Kremen, C. 1992. Assessing the indicator properties of speciesassemblages for natural areas monitoring. Ecological Ap-plications 2:203–217.
Kush, J.S., and R.S. Meldahl. 2000. Composition of a virginlongleaf pine stand in south Alabama. Castanea 65:56–63.
Leps, J., and P. Smilauer. 2003. Multivariate analysis of ecolog-ical data using CANOCO. Cambridge University Press,Cambridge, United Kingdom.
Litt, A.R., L. Provencher, G.W. Tanner, and R. Franz. 2001. Her-petofaunal responses to restoration treatments of longleafpine sandhills in Florida. Restoration Ecology 9:462–474.
Masters, R.E., K.M. Robertson, W.E. Palmer, J. Cox, K. Mc-Gorty, L. Green, and C. Ambrose. 2003. Red Hills foreststewardship guide. Tall Timbers Research Station Miscel-laneous Publication 12, Tall Timbers Research, Inc., Talla-hassee, FL.
McLachlan, S.M., and D.R. Bazely. 2001. Recovery patterns ofunderstory herbs and their use as indicators of deciduousforest regeneration. Conservation Biology 15:98–110.
McQuilkin, W.E. 1940. The natural establishment of pine inabandoned fields in the Piedmont Plateau region. Ecology21:135–147.
Means, D.B., and G. Grow. 1985. The endangered longleaf pinecommunity. ENFO 85:1–12.
Miller, K.V., and J.H. Miller. 2004. Forestry herbicide influenceson biodiversity and wildlife habitat in southern forests.Wildlife Society Bulletin 32:1049–1060.
Moffatt, S.F., and S.M. McLachlan. 2004. Understorey indicatorsof disturbance for riparian forests along an urban–rural gra-dient in Manitoba. Ecological Indicators 4:1–13.
Moser, W.K., S.M. Jackson, V. Podrazsky, and D.R. Larsen.2002. Examination of stand structure on quail plantationsin the Red Hills region of Georgia and Florida managed bythe Stoddard–Neel system: an example for forest managers.Forestry 75:443–449.
Myers, R.L. 1990. Scrub and high pine. Pages 150–193 in R.L.Myers and J.J. Ewel (eds.). Ecosystems of Florida. Univer-sity of Central Florida Press, Orlando.
Noss, R.F. 1990. Indicators for monitoring biodiversity: a hier-archical approach. Conservation Biology 4:355–364.
Noss, R.F. 2000. Maintaining integrity of landscapes and ecore-gions. Pages 191–208 in D. Pimentel, L. Westra, and R.F.Noss (eds.). Ecological integrity: integrating environment,conservation, and health. Island Press, Washington, D.C.
Oosting, H.J. 1942. An ecological analysis of the plant com-munities of Piedmont, North Carolina. American MidlandNaturalist 28:1–126.
Paisley, C. 1968. From cotton to quail: an agricultural chronicleof Leon County, Florida, 1860–1967. University of FloridaPress, Gainesville.
Peet, R.K., T.R. Wentworth, and P.S. White. 1998. A flexible,multipurpose method for recording vegetation compositionand structure. Castanea 63:262–274.
Provencher, L., B.J. Herring, D.R. Gordon, H.L. Rodgers,K.E.M. Galley, G.W. Tanner, J.L. Hardesty, and L.A. Bren-nan. 2001a. Effects of hardwood reduction techniques onlongleaf pine sandhill vegetation in northwest Florida. Res-toration Ecology 9:13–27.
Provencher, L., B.J. Herring, D.R. Gordon, H.L. Rodgers, G.W.Tanner, J.L. Hardesty, L.A. Brennan, and A.R. Litt. 2001b.Longleaf pine and oak responses to hardwood reduction
techniques in fire-suppressed sandhills in northwest Florida.Forest Ecology and Management 148:63–77.
Provencher, L., A.R. Litt, and D.R. Gordon. 2003. Predictors ofspecies richness in northwest Florida longleaf pine sand-hills. Conservation Biology 17:1660–1671.
Provencher, L., A.R. Litt, D.R. Gordon, H.L. Rodgers, B.J. Her-ring, K.E.M. Galley, J.P. McAdoo, S.J. McAdoo, N.M.Gobris, and J.L. Hardesty. 2001c. Restoration fire and hur-ricanes in longleaf pine sandhills. Ecological Restoration19:92–98.
Robertson, K.M., and T.E. Ostertag. 2003. Fuel characteristicsand fire behavior predictions in native and old field pine-lands in the Red Hills Region, southwest Georgia. Page 73in Proceedings of the 2nd International Wildfire and FireManagement Congress and Fifth Symposium on Fire andForest Meteorology. American Meteorology Society, 16–20Nov 2003, Orlando, FL. http://www.ttrs.org/images/pdfs/RobertsonandOstertag2003.pdf [accessed 25 Apr 2006].
Rodgers, H.L., and L. Provencher. 1999. Analysis of longleafpine sandhill vegetation in northwest Florida. Castanea 64:138–162.
Schultz, R.P., and L.P. Wilhite. 1974. Changes in a flatwoods sitefollowing intensive preparation. Forest Science 20:230–237.
Smith, G.P., V.B. Shelbourne, and J.L. Walker. 2002. Structureand composition of vegetation on longleaf pine plantationsites compared to natural stands occurring along an envi-ronmental gradient at the Savannah River Site. Pages 481–486 in K.W. Outcalt (ed.). Proceedings of the 11th BiennialSilvicultural Research Conference. General Technical Re-port SRS-48, U.S. Department of Agriculture, Forest Ser-vice, Southern Research Station, Asheville, NC.
Sokal, R.R., and F.J. Rohlf. 1995. Biometry: the principles andpractice of statistics in biological research. Third edition.W.H. Freeman, New York.
Southeast Regional Climate Center. 2004. Historical climatesummaries [online]. http://water.dnr.state.sc.us/climate/sercc/index.html [accessed 4 Nov 2004].
ter Braak, C.J., and P. Smilauer. 2002. CANOCO reference man-ual and CanoDraw for Windows user’s guide: software forcanonical community ordination. Version 4.5. Microcom-puter Power, Ithaca, NY.
Varner, J.M. III, J.S. Kush, and R.S. Meldahl. 2003. Vegetationof frequently burned old-growth longleaf pine (Pinus pal-ustris Mill.) savannas on Choccolocco Mountain, Alabama,USA. Natural Areas Journal 23:23–52.
Waldrop, T.A., D.L. White, and S.M. Jones. 1992. Fire regimesfor pine–grassland communities in the southeastern UnitedStates. Forest Ecology and Management 47:195–210.
Welsh, H.H. Jr., and L.M. Ollivier. 1998. Stream amphibians asindicators of ecosystem stress: a case study from Califor-nia’s redwoods. Ecological Applications 8:1118–1132.
White, D.L., T.A. Waldrop, and S.M. Jones. 1991. Forty yearsof prescribed burning on the Santee Fire Plots: effects onunderstory vegetation. Pages 51–59 in S.C. Nodvin andT.A. Waldrop (eds.). Fire and the environment: ecologicaland cultural perspectives. General Technical Report SE-69,U.S. Department of Agriculture, Forest Service, Southeast-ern Forest Experiment Station, Asheville, NC.
White, L.D., L.D. Harris, J.E. Johnson, and D.G. Milchunas.1975. Impact of site preparation on flatwoods wildlife hab-itat. Proceedings of the Annual Conference of the South-eastern Association of Game and Fish Commissioners 29:347–353.
Woods, F.W. 1959. Converting scrub oak sandhills to pine forestsin Florida. Journal of Forestry 57:117–119.
Wunderlin, R.P., and B.F. Hansen. 2003. Guide to the vascularplants of Florida. Second edition. University Presses ofFlorida, Gainesville.
Zonneveld, I.S. 1983. Principles of bio-indication. Environmen-tal Monitoring and Assessment 3:207–217.
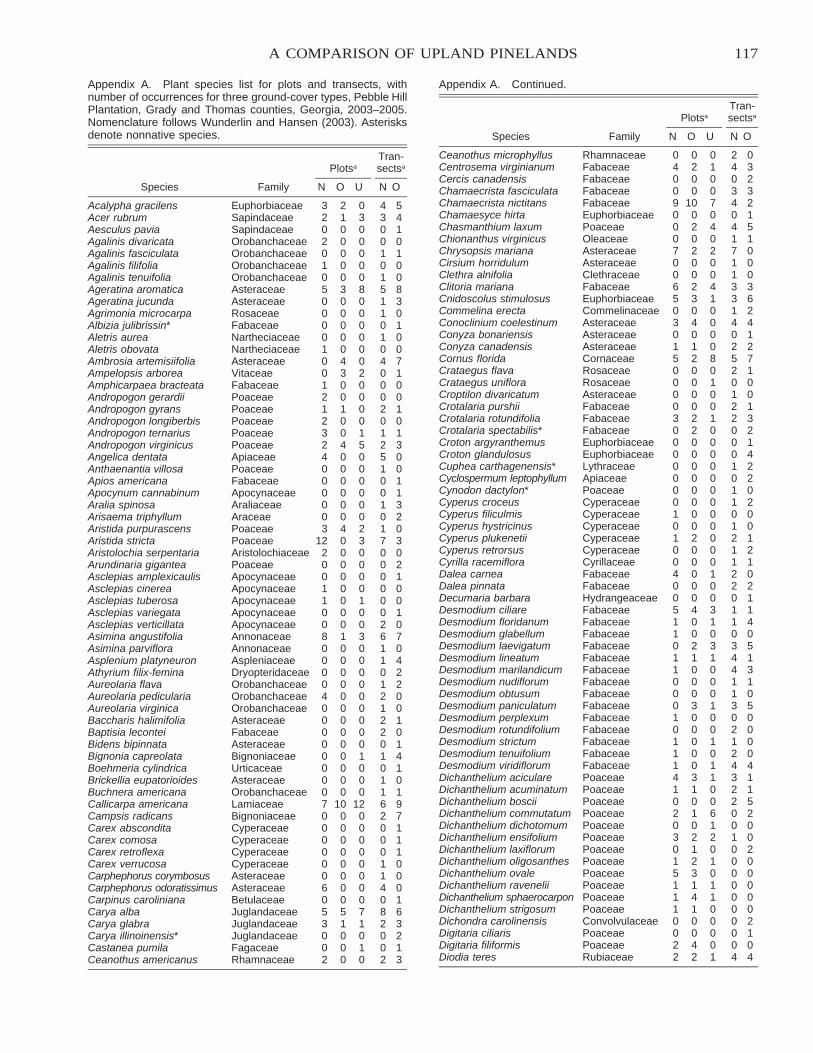
117A COMPARISON OF UPLAND PINELANDS
Appendix A. Plant species list for plots and transects, withnumber of occurrences for three ground-cover types, Pebble HillPlantation, Grady and Thomas counties, Georgia, 2003–2005.Nomenclature follows Wunderlin and Hansen (2003). Asterisksdenote nonnative species.
Species Family
Plotsa
N O U
Tran-sectsa
N O
Acalypha gracilens Euphorbiaceae 3 2 0 4 5Acer rubrum Sapindaceae 2 1 3 3 4Aesculus pavia Sapindaceae 0 0 0 0 1Agalinis divaricata Orobanchaceae 2 0 0 0 0Agalinis fasciculata Orobanchaceae 0 0 0 1 1Agalinis filifolia Orobanchaceae 1 0 0 0 0Agalinis tenuifolia Orobanchaceae 0 0 0 1 0Ageratina aromatica Asteraceae 5 3 8 5 8Ageratina jucunda Asteraceae 0 0 0 1 3Agrimonia microcarpa Rosaceae 0 0 0 1 0Albizia julibrissin* Fabaceae 0 0 0 0 1Aletris aurea Nartheciaceae 0 0 0 1 0Aletris obovata Nartheciaceae 1 0 0 0 0Ambrosia artemisiifolia Asteraceae 0 4 0 4 7Ampelopsis arborea Vitaceae 0 3 2 0 1Amphicarpaea bracteata Fabaceae 1 0 0 0 0Andropogon gerardii Poaceae 2 0 0 0 0Andropogon gyrans Poaceae 1 1 0 2 1Andropogon longiberbis Poaceae 2 0 0 0 0Andropogon ternarius Poaceae 3 0 1 1 1Andropogon virginicus Poaceae 2 4 5 2 3Angelica dentata Apiaceae 4 0 0 5 0Anthaenantia villosa Poaceae 0 0 0 1 0Apios americana Fabaceae 0 0 0 0 1Apocynum cannabinum Apocynaceae 0 0 0 0 1Aralia spinosa Araliaceae 0 0 0 1 3Arisaema triphyllum Araceae 0 0 0 0 2Aristida purpurascens Poaceae 3 4 2 1 0Aristida stricta Poaceae 12 0 3 7 3Aristolochia serpentaria Aristolochiaceae 2 0 0 0 0Arundinaria gigantea Poaceae 0 0 0 0 2Asclepias amplexicaulis Apocynaceae 0 0 0 0 1Asclepias cinerea Apocynaceae 1 0 0 0 0Asclepias tuberosa Apocynaceae 1 0 1 0 0Asclepias variegata Apocynaceae 0 0 0 0 1Asclepias verticillata Apocynaceae 0 0 0 2 0Asimina angustifolia Annonaceae 8 1 3 6 7Asimina parviflora Annonaceae 0 0 0 1 0Asplenium platyneuron Aspleniaceae 0 0 0 1 4Athyrium filix-femina Dryopteridaceae 0 0 0 0 2Aureolaria flava Orobanchaceae 0 0 0 1 2Aureolaria pedicularia Orobanchaceae 4 0 0 2 0Aureolaria virginica Orobanchaceae 0 0 0 1 0Baccharis halimifolia Asteraceae 0 0 0 2 1Baptisia lecontei Fabaceae 0 0 0 2 0Bidens bipinnata Asteraceae 0 0 0 0 1Bignonia capreolata Bignoniaceae 0 0 1 1 4Boehmeria cylindrica Urticaceae 0 0 0 0 1Brickellia eupatorioides Asteraceae 0 0 0 1 0Buchnera americana Orobanchaceae 0 0 0 1 1Callicarpa americana Lamiaceae 7 10 12 6 9Campsis radicans Bignoniaceae 0 0 0 2 7Carex abscondita Cyperaceae 0 0 0 0 1Carex comosa Cyperaceae 0 0 0 0 1Carex retroflexa Cyperaceae 0 0 0 0 1Carex verrucosa Cyperaceae 0 0 0 1 0Carphephorus corymbosus Asteraceae 0 0 0 1 0Carphephorus odoratissimus Asteraceae 6 0 0 4 0Carpinus caroliniana Betulaceae 0 0 0 0 1Carya alba Juglandaceae 5 5 7 8 6Carya glabra Juglandaceae 3 1 1 2 3Carya illinoinensis* Juglandaceae 0 0 0 0 2Castanea pumila Fagaceae 0 0 1 0 1Ceanothus americanus Rhamnaceae 2 0 0 2 3
Appendix A. Continued.
Species Family
Plotsa
N O U
Tran-sectsa
N O
Ceanothus microphyllus Rhamnaceae 0 0 0 2 0Centrosema virginianum Fabaceae 4 2 1 4 3Cercis canadensis Fabaceae 0 0 0 0 2Chamaecrista fasciculata Fabaceae 0 0 0 3 3Chamaecrista nictitans Fabaceae 9 10 7 4 2Chamaesyce hirta Euphorbiaceae 0 0 0 0 1Chasmanthium laxum Poaceae 0 2 4 4 5Chionanthus virginicus Oleaceae 0 0 0 1 1Chrysopsis mariana Asteraceae 7 2 2 7 0Cirsium horridulum Asteraceae 0 0 0 1 0Clethra alnifolia Clethraceae 0 0 0 1 0Clitoria mariana Fabaceae 6 2 4 3 3Cnidoscolus stimulosus Euphorbiaceae 5 3 1 3 6Commelina erecta Commelinaceae 0 0 0 1 2Conoclinium coelestinum Asteraceae 3 4 0 4 4Conyza bonariensis Asteraceae 0 0 0 0 1Conyza canadensis Asteraceae 1 1 0 2 2Cornus florida Cornaceae 5 2 8 5 7Crataegus flava Rosaceae 0 0 0 2 1Crataegus uniflora Rosaceae 0 0 1 0 0Croptilon divaricatum Asteraceae 0 0 0 1 0Crotalaria purshii Fabaceae 0 0 0 2 1Crotalaria rotundifolia Fabaceae 3 2 1 2 3Crotalaria spectabilis* Fabaceae 0 2 0 0 2Croton argyranthemus Euphorbiaceae 0 0 0 0 1Croton glandulosus Euphorbiaceae 0 0 0 0 4Cuphea carthagenensis* Lythraceae 0 0 0 1 2Cyclospermum leptophyllum Apiaceae 0 0 0 0 2Cynodon dactylon* Poaceae 0 0 0 1 0Cyperus croceus Cyperaceae 0 0 0 1 2Cyperus filiculmis Cyperaceae 1 0 0 0 0Cyperus hystricinus Cyperaceae 0 0 0 1 0Cyperus plukenetii Cyperaceae 1 2 0 2 1Cyperus retrorsus Cyperaceae 0 0 0 1 2Cyrilla racemiflora Cyrillaceae 0 0 0 1 1Dalea carnea Fabaceae 4 0 1 2 0Dalea pinnata Fabaceae 0 0 0 2 2Decumaria barbara Hydrangeaceae 0 0 0 0 1Desmodium ciliare Fabaceae 5 4 3 1 1Desmodium floridanum Fabaceae 1 0 1 1 4Desmodium glabellum Fabaceae 1 0 0 0 0Desmodium laevigatum Fabaceae 0 2 3 3 5Desmodium lineatum Fabaceae 1 1 1 4 1Desmodium marilandicum Fabaceae 1 0 0 4 3Desmodium nudiflorum Fabaceae 0 0 0 1 1Desmodium obtusum Fabaceae 0 0 0 1 0Desmodium paniculatum Fabaceae 0 3 1 3 5Desmodium perplexum Fabaceae 1 0 0 0 0Desmodium rotundifolium Fabaceae 0 0 0 2 0Desmodium strictum Fabaceae 1 0 1 1 0Desmodium tenuifolium Fabaceae 1 0 0 2 0Desmodium viridiflorum Fabaceae 1 0 1 4 4Dichanthelium aciculare Poaceae 4 3 1 3 1Dichanthelium acuminatum Poaceae 1 1 0 2 1Dichanthelium boscii Poaceae 0 0 0 2 5Dichanthelium commutatum Poaceae 2 1 6 0 2Dichanthelium dichotomum Poaceae 0 0 1 0 0Dichanthelium ensifolium Poaceae 3 2 2 1 0Dichanthelium laxiflorum Poaceae 0 1 0 0 2Dichanthelium oligosanthes Poaceae 1 2 1 0 0Dichanthelium ovale Poaceae 5 3 0 0 0Dichanthelium ravenelii Poaceae 1 1 1 0 0Dichanthelium sphaerocarpon Poaceae 1 4 1 0 0Dichanthelium strigosum Poaceae 1 1 0 0 0Dichondra carolinensis Convolvulaceae 0 0 0 0 2Digitaria ciliaris Poaceae 0 0 0 0 1Digitaria filiformis Poaceae 2 4 0 0 0Diodia teres Rubiaceae 2 2 1 4 4
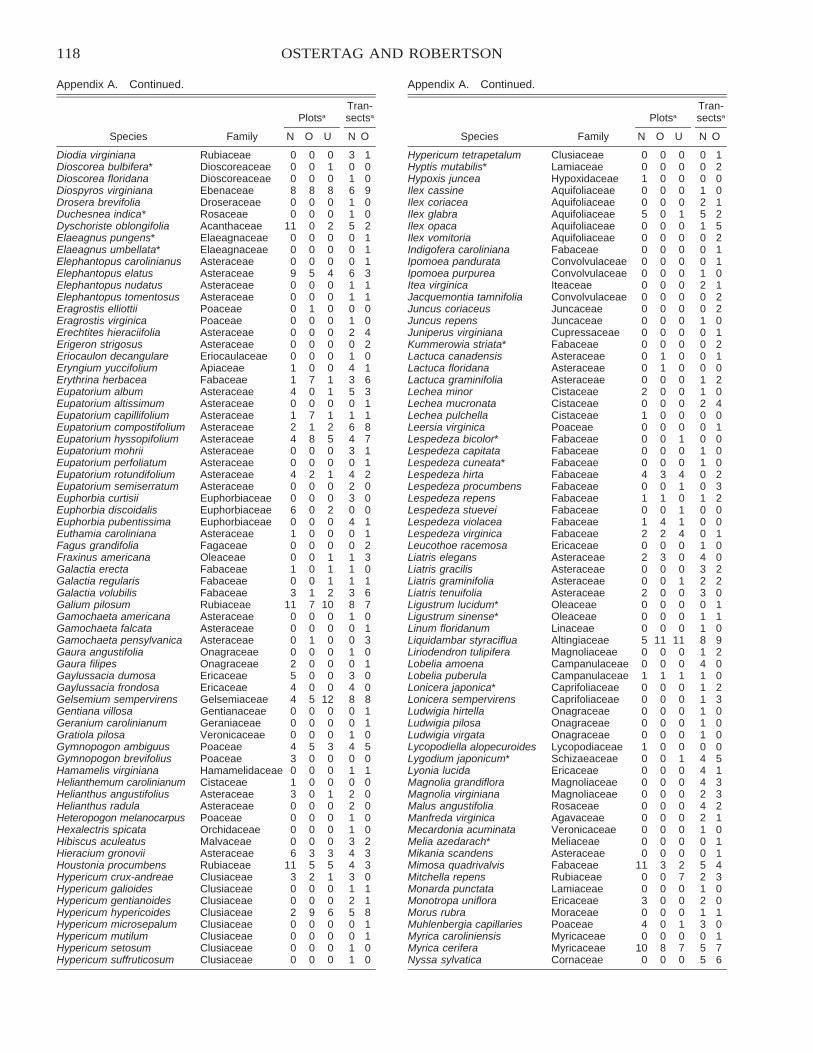
118 OSTERTAG AND ROBERTSON
Appendix A. Continued.
Species Family
Plotsa
N O U
Tran-sectsa
N O
Diodia virginiana Rubiaceae 0 0 0 3 1Dioscorea bulbifera* Dioscoreaceae 0 0 1 0 0Dioscorea floridana Dioscoreaceae 0 0 0 1 0Diospyros virginiana Ebenaceae 8 8 8 6 9Drosera brevifolia Droseraceae 0 0 0 1 0Duchesnea indica* Rosaceae 0 0 0 1 0Dyschoriste oblongifolia Acanthaceae 11 0 2 5 2Elaeagnus pungens* Elaeagnaceae 0 0 0 0 1Elaeagnus umbellata* Elaeagnaceae 0 0 0 0 1Elephantopus carolinianus Asteraceae 0 0 0 0 1Elephantopus elatus Asteraceae 9 5 4 6 3Elephantopus nudatus Asteraceae 0 0 0 1 1Elephantopus tomentosus Asteraceae 0 0 0 1 1Eragrostis elliottii Poaceae 0 1 0 0 0Eragrostis virginica Poaceae 0 0 0 1 0Erechtites hieraciifolia Asteraceae 0 0 0 2 4Erigeron strigosus Asteraceae 0 0 0 0 2Eriocaulon decangulare Eriocaulaceae 0 0 0 1 0Eryngium yuccifolium Apiaceae 1 0 0 4 1Erythrina herbacea Fabaceae 1 7 1 3 6Eupatorium album Asteraceae 4 0 1 5 3Eupatorium altissimum Asteraceae 0 0 0 0 1Eupatorium capillifolium Asteraceae 1 7 1 1 1Eupatorium compostifolium Asteraceae 2 1 2 6 8Eupatorium hyssopifolium Asteraceae 4 8 5 4 7Eupatorium mohrii Asteraceae 0 0 0 3 1Eupatorium perfoliatum Asteraceae 0 0 0 0 1Eupatorium rotundifolium Asteraceae 4 2 1 4 2Eupatorium semiserratum Asteraceae 0 0 0 2 0Euphorbia curtisii Euphorbiaceae 0 0 0 3 0Euphorbia discoidalis Euphorbiaceae 6 0 2 0 0Euphorbia pubentissima Euphorbiaceae 0 0 0 4 1Euthamia caroliniana Asteraceae 1 0 0 0 1Fagus grandifolia Fagaceae 0 0 0 0 2Fraxinus americana Oleaceae 0 0 1 1 3Galactia erecta Fabaceae 1 0 1 1 0Galactia regularis Fabaceae 0 0 1 1 1Galactia volubilis Fabaceae 3 1 2 3 6Galium pilosum Rubiaceae 11 7 10 8 7Gamochaeta americana Asteraceae 0 0 0 1 0Gamochaeta falcata Asteraceae 0 0 0 0 1Gamochaeta pensylvanica Asteraceae 0 1 0 0 3Gaura angustifolia Onagraceae 0 0 0 1 0Gaura filipes Onagraceae 2 0 0 0 1Gaylussacia dumosa Ericaceae 5 0 0 3 0Gaylussacia frondosa Ericaceae 4 0 0 4 0Gelsemium sempervirens Gelsemiaceae 4 5 12 8 8Gentiana villosa Gentianaceae 0 0 0 0 1Geranium carolinianum Geraniaceae 0 0 0 0 1Gratiola pilosa Veronicaceae 0 0 0 1 0Gymnopogon ambiguus Poaceae 4 5 3 4 5Gymnopogon brevifolius Poaceae 3 0 0 0 0Hamamelis virginiana Hamamelidaceae 0 0 0 1 1Helianthemum carolinianum Cistaceae 1 0 0 0 0Helianthus angustifolius Asteraceae 3 0 1 2 0Helianthus radula Asteraceae 0 0 0 2 0Heteropogon melanocarpus Poaceae 0 0 0 1 0Hexalectris spicata Orchidaceae 0 0 0 1 0Hibiscus aculeatus Malvaceae 0 0 0 3 2Hieracium gronovii Asteraceae 6 3 3 4 3Houstonia procumbens Rubiaceae 11 5 5 4 3Hypericum crux-andreae Clusiaceae 3 2 1 3 0Hypericum galioides Clusiaceae 0 0 0 1 1Hypericum gentianoides Clusiaceae 0 0 0 2 1Hypericum hypericoides Clusiaceae 2 9 6 5 8Hypericum microsepalum Clusiaceae 0 0 0 0 1Hypericum mutilum Clusiaceae 0 0 0 0 1Hypericum setosum Clusiaceae 0 0 0 1 0Hypericum suffruticosum Clusiaceae 0 0 0 1 0
Appendix A. Continued.
Species Family
Plotsa
N O U
Tran-sectsa
N O
Hypericum tetrapetalum Clusiaceae 0 0 0 0 1Hyptis mutabilis* Lamiaceae 0 0 0 0 2Hypoxis juncea Hypoxidaceae 1 0 0 0 0Ilex cassine Aquifoliaceae 0 0 0 1 0Ilex coriacea Aquifoliaceae 0 0 0 2 1Ilex glabra Aquifoliaceae 5 0 1 5 2Ilex opaca Aquifoliaceae 0 0 0 1 5Ilex vomitoria Aquifoliaceae 0 0 0 0 2Indigofera caroliniana Fabaceae 0 0 0 0 1Ipomoea pandurata Convolvulaceae 0 0 0 0 1Ipomoea purpurea Convolvulaceae 0 0 0 1 0Itea virginica Iteaceae 0 0 0 2 1Jacquemontia tamnifolia Convolvulaceae 0 0 0 0 2Juncus coriaceus Juncaceae 0 0 0 0 2Juncus repens Juncaceae 0 0 0 1 0Juniperus virginiana Cupressaceae 0 0 0 0 1Kummerowia striata* Fabaceae 0 0 0 0 2Lactuca canadensis Asteraceae 0 1 0 0 1Lactuca floridana Asteraceae 0 1 0 0 0Lactuca graminifolia Asteraceae 0 0 0 1 2Lechea minor Cistaceae 2 0 0 1 0Lechea mucronata Cistaceae 0 0 0 2 4Lechea pulchella Cistaceae 1 0 0 0 0Leersia virginica Poaceae 0 0 0 0 1Lespedeza bicolor* Fabaceae 0 0 1 0 0Lespedeza capitata Fabaceae 0 0 0 1 0Lespedeza cuneata* Fabaceae 0 0 0 1 0Lespedeza hirta Fabaceae 4 3 4 0 2Lespedeza procumbens Fabaceae 0 0 1 0 3Lespedeza repens Fabaceae 1 1 0 1 2Lespedeza stuevei Fabaceae 0 0 1 0 0Lespedeza violacea Fabaceae 1 4 1 0 0Lespedeza virginica Fabaceae 2 2 4 0 1Leucothoe racemosa Ericaceae 0 0 0 1 0Liatris elegans Asteraceae 2 3 0 4 0Liatris gracilis Asteraceae 0 0 0 3 2Liatris graminifolia Asteraceae 0 0 1 2 2Liatris tenuifolia Asteraceae 2 0 0 3 0Ligustrum lucidum* Oleaceae 0 0 0 0 1Ligustrum sinense* Oleaceae 0 0 0 1 1Linum floridanum Linaceae 0 0 0 1 0Liquidambar styraciflua Altingiaceae 5 11 11 8 9Liriodendron tulipifera Magnoliaceae 0 0 0 1 2Lobelia amoena Campanulaceae 0 0 0 4 0Lobelia puberula Campanulaceae 1 1 1 1 0Lonicera japonica* Caprifoliaceae 0 0 0 1 2Lonicera sempervirens Caprifoliaceae 0 0 0 1 3Ludwigia hirtella Onagraceae 0 0 0 1 0Ludwigia pilosa Onagraceae 0 0 0 1 0Ludwigia virgata Onagraceae 0 0 0 1 0Lycopodiella alopecuroides Lycopodiaceae 1 0 0 0 0Lygodium japonicum* Schizaeaceae 0 0 1 4 5Lyonia lucida Ericaceae 0 0 0 4 1Magnolia grandiflora Magnoliaceae 0 0 0 4 3Magnolia virginiana Magnoliaceae 0 0 0 2 3Malus angustifolia Rosaceae 0 0 0 4 2Manfreda virginica Agavaceae 0 0 0 2 1Mecardonia acuminata Veronicaceae 0 0 0 1 0Melia azedarach* Meliaceae 0 0 0 0 1Mikania scandens Asteraceae 0 0 0 0 1Mimosa quadrivalvis Fabaceae 11 3 2 5 4Mitchella repens Rubiaceae 0 0 7 2 3Monarda punctata Lamiaceae 0 0 0 1 0Monotropa uniflora Ericaceae 3 0 0 2 0Morus rubra Moraceae 0 0 0 1 1Muhlenbergia capillaries Poaceae 4 0 1 3 0Myrica caroliniensis Myricaceae 0 0 0 0 1Myrica cerifera Myricaceae 10 8 7 5 7Nyssa sylvatica Cornaceae 0 0 0 5 6
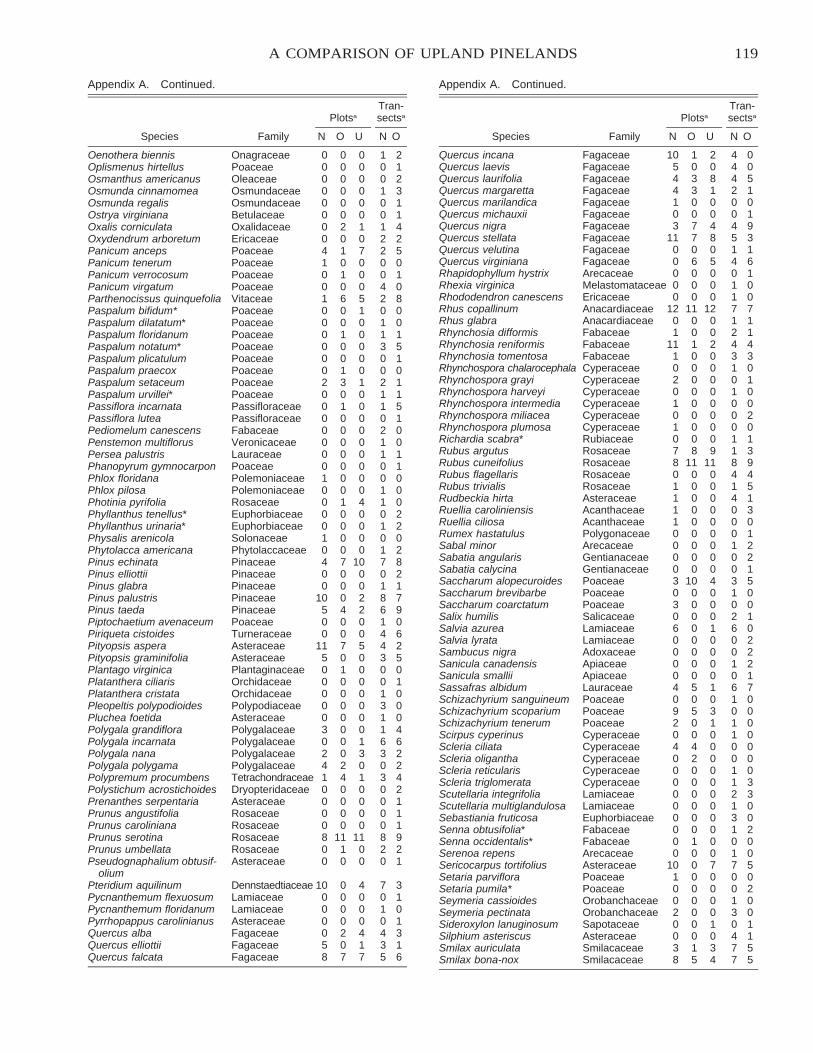
119A COMPARISON OF UPLAND PINELANDS
Appendix A. Continued.
Species Family
Plotsa
N O U
Tran-sectsa
N O
Oenothera biennis Onagraceae 0 0 0 1 2Oplismenus hirtellus Poaceae 0 0 0 0 1Osmanthus americanus Oleaceae 0 0 0 0 2Osmunda cinnamomea Osmundaceae 0 0 0 1 3Osmunda regalis Osmundaceae 0 0 0 0 1Ostrya virginiana Betulaceae 0 0 0 0 1Oxalis corniculata Oxalidaceae 0 2 1 1 4Oxydendrum arboretum Ericaceae 0 0 0 2 2Panicum anceps Poaceae 4 1 7 2 5Panicum tenerum Poaceae 1 0 0 0 0Panicum verrocosum Poaceae 0 1 0 0 1Panicum virgatum Poaceae 0 0 0 4 0Parthenocissus quinquefolia Vitaceae 1 6 5 2 8Paspalum bifidum* Poaceae 0 0 1 0 0Paspalum dilatatum* Poaceae 0 0 0 1 0Paspalum floridanum Poaceae 0 1 0 1 1Paspalum notatum* Poaceae 0 0 0 3 5Paspalum plicatulum Poaceae 0 0 0 0 1Paspalum praecox Poaceae 0 1 0 0 0Paspalum setaceum Poaceae 2 3 1 2 1Paspalum urvillei* Poaceae 0 0 0 1 1Passiflora incarnata Passifloraceae 0 1 0 1 5Passiflora lutea Passifloraceae 0 0 0 0 1Pediomelum canescens Fabaceae 0 0 0 2 0Penstemon multiflorus Veronicaceae 0 0 0 1 0Persea palustris Lauraceae 0 0 0 1 1Phanopyrum gymnocarpon Poaceae 0 0 0 0 1Phlox floridana Polemoniaceae 1 0 0 0 0Phlox pilosa Polemoniaceae 0 0 0 1 0Photinia pyrifolia Rosaceae 0 1 4 1 0Phyllanthus tenellus* Euphorbiaceae 0 0 0 0 2Phyllanthus urinaria* Euphorbiaceae 0 0 0 1 2Physalis arenicola Solonaceae 1 0 0 0 0Phytolacca americana Phytolaccaceae 0 0 0 1 2Pinus echinata Pinaceae 4 7 10 7 8Pinus elliottii Pinaceae 0 0 0 0 2Pinus glabra Pinaceae 0 0 0 1 1Pinus palustris Pinaceae 10 0 2 8 7Pinus taeda Pinaceae 5 4 2 6 9Piptochaetium avenaceum Poaceae 0 0 0 1 0Piriqueta cistoides Turneraceae 0 0 0 4 6Pityopsis aspera Asteraceae 11 7 5 4 2Pityopsis graminifolia Asteraceae 5 0 0 3 5Plantago virginica Plantaginaceae 0 1 0 0 0Platanthera ciliaris Orchidaceae 0 0 0 0 1Platanthera cristata Orchidaceae 0 0 0 1 0Pleopeltis polypodioides Polypodiaceae 0 0 0 3 0Pluchea foetida Asteraceae 0 0 0 1 0Polygala grandiflora Polygalaceae 3 0 0 1 4Polygala incarnata Polygalaceae 0 0 1 6 6Polygala nana Polygalaceae 2 0 3 3 2Polygala polygama Polygalaceae 4 2 0 0 2Polypremum procumbens Tetrachondraceae 1 4 1 3 4Polystichum acrostichoides Dryopteridaceae 0 0 0 0 2Prenanthes serpentaria Asteraceae 0 0 0 0 1Prunus angustifolia Rosaceae 0 0 0 0 1Prunus caroliniana Rosaceae 0 0 0 0 1Prunus serotina Rosaceae 8 11 11 8 9Prunus umbellata Rosaceae 0 1 0 2 2Pseudognaphalium obtusif-
oliumAsteraceae 0 0 0 0 1
Pteridium aquilinum Dennstaedtiaceae 10 0 4 7 3Pycnanthemum flexuosum Lamiaceae 0 0 0 0 1Pycnanthemum floridanum Lamiaceae 0 0 0 1 0Pyrrhopappus carolinianus Asteraceae 0 0 0 0 1Quercus alba Fagaceae 0 2 4 4 3Quercus elliottii Fagaceae 5 0 1 3 1Quercus falcata Fagaceae 8 7 7 5 6
Appendix A. Continued.
Species Family
Plotsa
N O U
Tran-sectsa
N O
Quercus incana Fagaceae 10 1 2 4 0Quercus laevis Fagaceae 5 0 0 4 0Quercus laurifolia Fagaceae 4 3 8 4 5Quercus margaretta Fagaceae 4 3 1 2 1Quercus marilandica Fagaceae 1 0 0 0 0Quercus michauxii Fagaceae 0 0 0 0 1Quercus nigra Fagaceae 3 7 4 4 9Quercus stellata Fagaceae 11 7 8 5 3Quercus velutina Fagaceae 0 0 0 1 1Quercus virginiana Fagaceae 0 6 5 4 6Rhapidophyllum hystrix Arecaceae 0 0 0 0 1Rhexia virginica Melastomataceae 0 0 0 1 0Rhododendron canescens Ericaceae 0 0 0 1 0Rhus copallinum Anacardiaceae 12 11 12 7 7Rhus glabra Anacardiaceae 0 0 0 1 1Rhynchosia difformis Fabaceae 1 0 0 2 1Rhynchosia reniformis Fabaceae 11 1 2 4 4Rhynchosia tomentosa Fabaceae 1 0 0 3 3Rhynchospora chalarocephala Cyperaceae 0 0 0 1 0Rhynchospora grayi Cyperaceae 2 0 0 0 1Rhynchospora harveyi Cyperaceae 0 0 0 1 0Rhynchospora intermedia Cyperaceae 1 0 0 0 0Rhynchospora miliacea Cyperaceae 0 0 0 0 2Rhynchospora plumosa Cyperaceae 1 0 0 0 0Richardia scabra* Rubiaceae 0 0 0 1 1Rubus argutus Rosaceae 7 8 9 1 3Rubus cuneifolius Rosaceae 8 11 11 8 9Rubus flagellaris Rosaceae 0 0 0 4 4Rubus trivialis Rosaceae 1 0 0 1 5Rudbeckia hirta Asteraceae 1 0 0 4 1Ruellia caroliniensis Acanthaceae 1 0 0 0 3Ruellia ciliosa Acanthaceae 1 0 0 0 0Rumex hastatulus Polygonaceae 0 0 0 0 1Sabal minor Arecaceae 0 0 0 1 2Sabatia angularis Gentianaceae 0 0 0 0 2Sabatia calycina Gentianaceae 0 0 0 0 1Saccharum alopecuroides Poaceae 3 10 4 3 5Saccharum brevibarbe Poaceae 0 0 0 1 0Saccharum coarctatum Poaceae 3 0 0 0 0Salix humilis Salicaceae 0 0 0 2 1Salvia azurea Lamiaceae 6 0 1 6 0Salvia lyrata Lamiaceae 0 0 0 0 2Sambucus nigra Adoxaceae 0 0 0 0 2Sanicula canadensis Apiaceae 0 0 0 1 2Sanicula smallii Apiaceae 0 0 0 0 1Sassafras albidum Lauraceae 4 5 1 6 7Schizachyrium sanguineum Poaceae 0 0 0 1 0Schizachyrium scoparium Poaceae 9 5 3 0 0Schizachyrium tenerum Poaceae 2 0 1 1 0Scirpus cyperinus Cyperaceae 0 0 0 1 0Scleria ciliata Cyperaceae 4 4 0 0 0Scleria oligantha Cyperaceae 0 2 0 0 0Scleria reticularis Cyperaceae 0 0 0 1 0Scleria triglomerata Cyperaceae 0 0 0 1 3Scutellaria integrifolia Lamiaceae 0 0 0 2 3Scutellaria multiglandulosa Lamiaceae 0 0 0 1 0Sebastiania fruticosa Euphorbiaceae 0 0 0 3 0Senna obtusifolia* Fabaceae 0 0 0 1 2Senna occidentalis* Fabaceae 0 1 0 0 0Serenoa repens Arecaceae 0 0 0 1 0Sericocarpus tortifolius Asteraceae 10 0 7 7 5Setaria parviflora Poaceae 1 0 0 0 0Setaria pumila* Poaceae 0 0 0 0 2Seymeria cassioides Orobanchaceae 0 0 0 1 0Seymeria pectinata Orobanchaceae 2 0 0 3 0Sideroxylon lanuginosum Sapotaceae 0 0 1 0 1Silphium asteriscus Asteraceae 0 0 0 4 1Smilax auriculata Smilacaceae 3 1 3 7 5Smilax bona-nox Smilacaceae 8 5 4 7 5
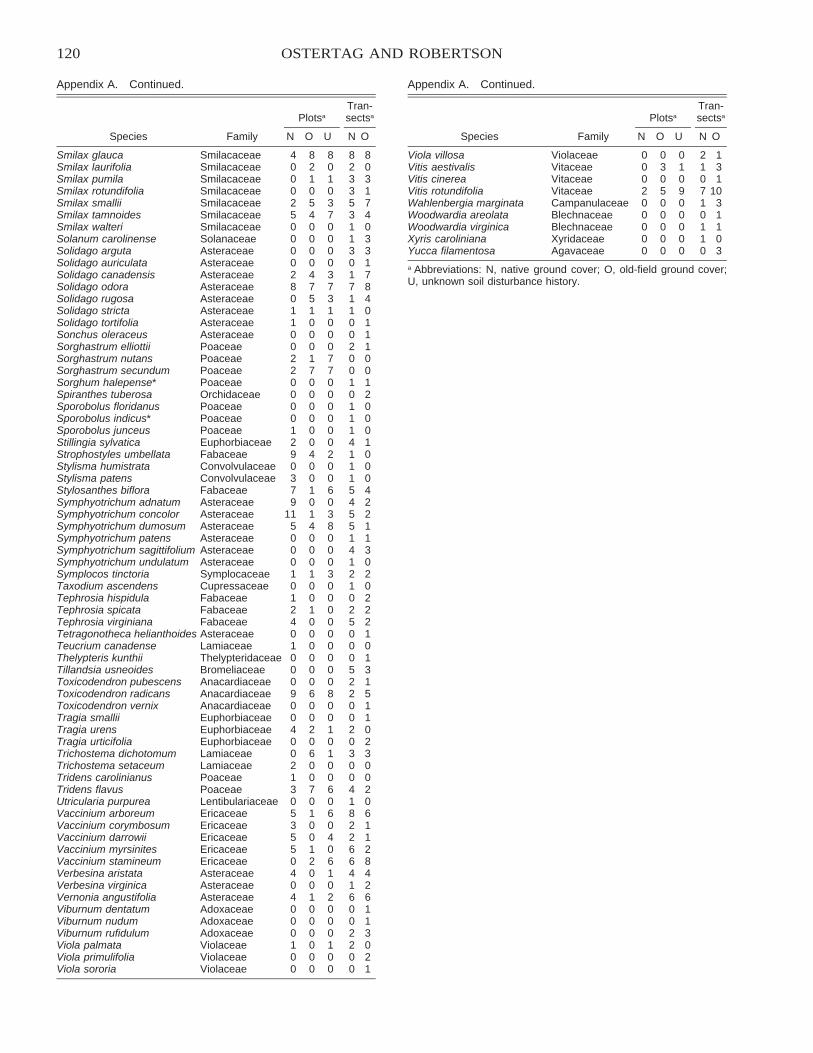
120 OSTERTAG AND ROBERTSON
Appendix A. Continued.
Species Family
Plotsa
N O U
Tran-sectsa
N O
Smilax glauca Smilacaceae 4 8 8 8 8Smilax laurifolia Smilacaceae 0 2 0 2 0Smilax pumila Smilacaceae 0 1 1 3 3Smilax rotundifolia Smilacaceae 0 0 0 3 1Smilax smallii Smilacaceae 2 5 3 5 7Smilax tamnoides Smilacaceae 5 4 7 3 4Smilax walteri Smilacaceae 0 0 0 1 0Solanum carolinense Solanaceae 0 0 0 1 3Solidago arguta Asteraceae 0 0 0 3 3Solidago auriculata Asteraceae 0 0 0 0 1Solidago canadensis Asteraceae 2 4 3 1 7Solidago odora Asteraceae 8 7 7 7 8Solidago rugosa Asteraceae 0 5 3 1 4Solidago stricta Asteraceae 1 1 1 1 0Solidago tortifolia Asteraceae 1 0 0 0 1Sonchus oleraceus Asteraceae 0 0 0 0 1Sorghastrum elliottii Poaceae 0 0 0 2 1Sorghastrum nutans Poaceae 2 1 7 0 0Sorghastrum secundum Poaceae 2 7 7 0 0Sorghum halepense* Poaceae 0 0 0 1 1Spiranthes tuberosa Orchidaceae 0 0 0 0 2Sporobolus floridanus Poaceae 0 0 0 1 0Sporobolus indicus* Poaceae 0 0 0 1 0Sporobolus junceus Poaceae 1 0 0 1 0Stillingia sylvatica Euphorbiaceae 2 0 0 4 1Strophostyles umbellata Fabaceae 9 4 2 1 0Stylisma humistrata Convolvulaceae 0 0 0 1 0Stylisma patens Convolvulaceae 3 0 0 1 0Stylosanthes biflora Fabaceae 7 1 6 5 4Symphyotrichum adnatum Asteraceae 9 0 0 4 2Symphyotrichum concolor Asteraceae 11 1 3 5 2Symphyotrichum dumosum Asteraceae 5 4 8 5 1Symphyotrichum patens Asteraceae 0 0 0 1 1Symphyotrichum sagittifolium Asteraceae 0 0 0 4 3Symphyotrichum undulatum Asteraceae 0 0 0 1 0Symplocos tinctoria Symplocaceae 1 1 3 2 2Taxodium ascendens Cupressaceae 0 0 0 1 0Tephrosia hispidula Fabaceae 1 0 0 0 2Tephrosia spicata Fabaceae 2 1 0 2 2Tephrosia virginiana Fabaceae 4 0 0 5 2Tetragonotheca helianthoides Asteraceae 0 0 0 0 1Teucrium canadense Lamiaceae 1 0 0 0 0Thelypteris kunthii Thelypteridaceae 0 0 0 0 1Tillandsia usneoides Bromeliaceae 0 0 0 5 3Toxicodendron pubescens Anacardiaceae 0 0 0 2 1Toxicodendron radicans Anacardiaceae 9 6 8 2 5Toxicodendron vernix Anacardiaceae 0 0 0 0 1Tragia smallii Euphorbiaceae 0 0 0 0 1Tragia urens Euphorbiaceae 4 2 1 2 0Tragia urticifolia Euphorbiaceae 0 0 0 0 2Trichostema dichotomum Lamiaceae 0 6 1 3 3Trichostema setaceum Lamiaceae 2 0 0 0 0Tridens carolinianus Poaceae 1 0 0 0 0Tridens flavus Poaceae 3 7 6 4 2Utricularia purpurea Lentibulariaceae 0 0 0 1 0Vaccinium arboreum Ericaceae 5 1 6 8 6Vaccinium corymbosum Ericaceae 3 0 0 2 1Vaccinium darrowii Ericaceae 5 0 4 2 1Vaccinium myrsinites Ericaceae 5 1 0 6 2Vaccinium stamineum Ericaceae 0 2 6 6 8Verbesina aristata Asteraceae 4 0 1 4 4Verbesina virginica Asteraceae 0 0 0 1 2Vernonia angustifolia Asteraceae 4 1 2 6 6Viburnum dentatum Adoxaceae 0 0 0 0 1Viburnum nudum Adoxaceae 0 0 0 0 1Viburnum rufidulum Adoxaceae 0 0 0 2 3Viola palmata Violaceae 1 0 1 2 0Viola primulifolia Violaceae 0 0 0 0 2Viola sororia Violaceae 0 0 0 0 1
Appendix A. Continued.
Species Family
Plotsa
N O U
Tran-sectsa
N O
Viola villosa Violaceae 0 0 0 2 1Vitis aestivalis Vitaceae 0 3 1 1 3Vitis cinerea Vitaceae 0 0 0 0 1Vitis rotundifolia Vitaceae 2 5 9 7 10Wahlenbergia marginata Campanulaceae 0 0 0 1 3Woodwardia areolata Blechnaceae 0 0 0 0 1Woodwardia virginica Blechnaceae 0 0 0 1 1Xyris caroliniana Xyridaceae 0 0 0 1 0Yucca filamentosa Agavaceae 0 0 0 0 3
a Abbreviations: N, native ground cover; O, old-field ground cover;U, unknown soil disturbance history.
121
EFFECTS OF PRESCRIBED BURNING FREQUENCY ONAVIAN COMMUNITIES IN LONGLEAF PINE FORESTS IN
WESTERN LOUISIANA
R. Montague Whiting, Jr.,1 Michael S. Fountain, and Kenneth J. Laterza2
Arthur Temple College of Forestry and Agriculture, Stephen F. Austin State University, Nacogdoches, TX 75962, USA
ABSTRACT
We examined the effects of four prescribed burning regimes (annual, 2- to 3-y, 4- to 7-y, and unburned) on avian communities inwestern Louisiana longleaf pine (Pinus palustris) stands for two spring (May and June) and two winter (January and February) seasons.Avian species richness and abundance were evaluated by season. During spring, red-cockaded woodpeckers (Picoides borealis), Bach-man’s sparrows (Aimophila aestivalis), and pine warblers (Dendroica pinus) showed increasing abundance with increasing frequencyof fire. Four resident and six Neotropical migrant species increased with decreased frequency of fire (P � 0.05). During winter, numbersof red-cockaded woodpeckers, pine warblers, and brown-headed nuthatches (Sitta pusilla) increased with increased regularity of fires;no temperate-zone migrant species displayed such an increase. Six resident and six temperate-zone migrant species increased withdecreasing frequency of fire (P � 0.05). Although avian species richness and abundance increased with decreasing frequency of fire,species that increased in abundance or were not present in frequently burned stands are not currently in jeopardy. The longleaf pine–grassland forest type occupies �5% of its original area; therefore, this type must be maintained and its extent expanded because it iscritical to some avian species that are declining in numbers.
Keywords: avian communities, birds, longleaf pine, Pinus palustris, prescribed burning frequency, western Louisiana.
Citation: Whiting, Jr., R.M., M.S. Fountain, and K.J. Laterza. 2007. Effects of prescribed burning frequency on avian communities in longleafpine forests in western Louisiana. Pages 121–128 in R.E. Masters and K.E.M. Galley (eds.). Proceedings of the 23rd Tall Timbers FireEcology Conference: Fire in Grassland and Shrubland Ecosystems. Tall Timbers Research Station, Tallahassee, Florida, USA.
INTRODUCTION
Longleaf pine (Pinus palustris) ecosystems arefire-maintained, subclimax forests (Wahlenburg 1946)that have occurred along the Atlantic and Gulf coastalplains in the southeastern United States for the past 8million y (Webb 1986). These ecosystems are depen-dent on fire to limit encroachment of hardwoods thatcompose most climax communities on the coastalplains (Engstrom et al. 1984).
Prior to European colonization, longleaf pine wasthe dominant vegetation on as much as 37.2 millionha of uplands in the Southeast (Frost 1993). However,only a small percentage of that area is currently oc-cupied by longleaf pine forests (Platt et al. 1988, Frost1993, Landers et al. 1995). Exploitation of virgin for-ests, fire suppression, reforestation to other pine spe-cies, and conversion of longleaf pinelands to otherland uses have resulted in the loss of as much as 35.6million ha of longleaf pine–dominated forests (Frost1993, Landers et al. 1995, Outcalt and Sheffield 1996).
Frequent burning in a longleaf pine forest resultsin a pine–grassland savannah with little or no hard-wood midstory or understory. In pine-dominatedstands, however, the impact of burning on avian abun-dance and composition is species specific; thus, gen-eralizations about correlations between birds and fireare difficult (Bendell 1974, Sousa 1984, Rotenberry etal. 1993). Burning benefits pine–grassland obligate
1 Corresponding author ([email protected]).2 Current address: U.S. Army Corps of Engineers, 819 TaylorStreet, Room 3A37, Fort Worth, TX 76102, USA.
species; however, species dependent on deciduous can-opy vegetation, midstory and understory trees andshrubs, or accumulated litter are disadvantaged (Dick-son 1981, Dickson et al. 1993). In recent years, Neo-tropical migratory birds (NTMBs) have become thefocus of concern due to decreasing abundancethroughout the breeding ranges of some species (Rob-bins et al. 1992). Sauer and Droege (1992) analyzedcontinent-wide Breeding Bird Survey data and foundsignificant declines in some species, particularlyamong eastern species breeding in forest ecosystems,including those that are dependent on pine–grasslandand other early succession habitats (Jackson 1988).Several studies have investigated the impacts of long-leaf pine restoration and management on avian com-munities (Rutledge and Conner 2002, Tucker et al.2004, Wood et al. 2004). However, no studies haveinvestigated the effects of prescribed burning frequen-cy on abundance and composition of resident and mi-gratory bird communities in longleaf pine forests inwestern Louisiana. This study investigated the impactsof burning frequency on avian communities in longleafpine forests dominated by sawtimber size-class trees(�24.5 cm diameter at breast height [DBH], i.e., di-ameter at 1.37 m above groundline on uphill side ofthe tree; Stoddard and Stoddard 1987).
STUDY AREA
This study took place on and adjacent to the FortPolk Military Reservation, approximately 20 kmsoutheast of Leesville, Louisiana (lat 93�15�N, long
122 WHITING ET AL.
31�00�W). This area was part of the Louisiana Long-leaf Pinelands Region of the Gulf Coastal Plain (Nel-son and Zillgitt 1969). It was characterized by gentlyrolling topography with upland areas dominated bylongleaf pine in the overstory. The forests were inter-spersed with perennial and intermittent streams bor-dered by riparian zones that were dominated by hard-woods (Hamilton and Yurkunas 1987). Overstory treeswere 40–50 y old and were of the sawtimber size class.
Six study sites were selected according to previousburning frequency. Two study sites, Bunkhouse Eastand Forest Service Road West, were in stands on an-nual burning cycles. Likewise, there were two studysites, Bunkhouse West and Forest Service Road East,in stands on 2- to 3-y burning cycles. These four siteswere on U.S. Forest Service land immediately adjacentto the military reservation. Each site was part of alarge (�50 ha) stand that had been prescribed burnedfor numerous years; normally the burns took place inlate February or March. The study site on the 4- to7-y burning cycle, Castor, was on the military reser-vation. It also was part of a large stand (�50 ha) thathad been burned in late fall by an unplanned fire 4 yprior to the initiation of the study. Fire had been ex-cluded from the unburned study site, Airport, for atleast 20 y, and probably for the life of the stand. Theentire stand was small (�10 ha) and adjacent to urbanareas on the reservation.
Both annually burned sites (Bunkhouse East andForest Service Road West) were open, park-like, purelongleaf pine stands interspersed with small areas ofnatural longleaf regeneration; there were few snags(�5/ha) on either site. Bunkhouse East had almost nohardwood midstory (i.e., woody plants �2.54 cmDBH with canopies below the general level of the for-est canopy) or understory (i.e., woody plants �1.0 mtall but �2.54 cm DBH). Forest Service Road Westhad a few midstory hardwoods and scattered understo-ry woody vegetation, mostly concentrated in andaround a minor drainage that had no distinguishablechannel. Both study sites had dense forest floor veg-etation (i.e., plants �1.0 m tall) dominated by grasseswith scattered herbaceous and woody plants (Laterza1999). Laterza (1999:31–45) provides detailed de-scriptions of study site vegetation.
Overstory vegetation and forest floor characteris-tics of the 2- to 3-y burning cycle stands (BunkhouseWest and Forest Service Road East) were marginallysimilar to those of the annually burned stands. How-ever, each had more midstory and understory hard-wood species and stems per hectare than did the an-nually burned sites. Bunkhouse West contained a smallperennial stream bordered by a 20-m-wide riparianzone with dense hardwood midstory and understoryvegetation; two avian transects ran perpendicularlythrough the riparian zone. Forest Service Road Eastcontained a shallow drainage similar to that on ForestService Road West. Numerous scattered understoryhardwoods and vines were associated with the drain-age. One avian transect crossed perpendicularlythrough the drainage; another ran diagonally along itsuch that a portion of the drainage area was included
in the avian sampling area. Snags were rare (�2.5/ha)on each study site (Laterza 1999).
Characteristics of the vegetation on the Castorstudy site, burned on a 4- to 7-y cycle, were verydifferent from those of the more frequently burnedstudy sites. Castor had a greater overstory hardwoodcomponent, and the combined numbers of loblolly (P.taeda) and shortleaf pines (P. echinata) in the over-story were approximately equal to that of longleafpine. Also, Castor had dense midstory and understoryvegetation dominated by hardwood species. Althoughthe forest floor vegetation was dominated by grasses,an increase in woody plants was evident as comparedto the more frequently burned sites. The study site con-tained approximately 16 snags/ha (Laterza 1999).
The unburned Airport study site had the fewestoverstory pines; however, diameter of overstory pineswas significantly larger than on the more frequentlyburned sites. Numbers of overstory hardwood speciesand stems per hectare were similar to those on Castorand higher than on the other sites. Both the midstoryand understory were well developed and very dense;each was dominated by hardwood species. Forest floorvegetation was dominated by woody plant species, andvines were prevalent. The site contained approximately13 snags/ha (Laterza 1999).
METHODS
Sampling Birds
Birds were sampled using the fixed-width striptransect method (Conner and Dickson 1980). Fourtransects (i.e., replications), each 100 m wide and 200m long and spaced at least 100 m apart, were estab-lished within each study site. The centerline of eachtransect was marked with plastic flagging along its en-tire length, and exterior boundaries were marked asneeded. The starting and ending points of each transectwere recorded using the Global Positioning System.
Bird counts were performed each spring and win-ter for 2 y. Spring counts were conducted betweenmid-May and mid-June, 1995 and 1996; winter countswere performed between mid-January and mid-Feb-ruary, 1996 and 1997 (Conner and Dickson 1980). Pri-or to the beginning of each season, several trainingsessions were held for participating observers. Thesesessions allowed the observers to become familiar withthe study sites and the local avifauna.
Each study site was sampled nine mornings eachseason. Each of three observers sampled a pair of siteseach morning. For each pair, the study site sampledfirst was rotated every other morning; beginning pointson each site also were alternated. Sampling of the sixstudy sites was performed on a rotational basis suchthat each observer sampled each site three times perseason. To reduce weather and observer bias, birdswere sampled only on days when all three observerscould participate. Birds were recorded if they werewithin the transect, flew into or out of the transect(Conner and Dickson 1980), or flew over the transectand appeared to be associated with overstory vegeta-
123BURNING FREQUENCY AND AVIAN COMMUNITIES
Table 1. Average numbers of species and individuals per survey (18 surveys) and results of Kruskal–Wallis tests and associatedNemenyi multiple comparisons by season for study sites used for avian sampling on or adjacent to the Fort Polk Military Reservationin western Louisiana, 1995–1997.
Season
Study site burning regime and namea
Annual
BNKH East FSRD West
2–3 y
BNKH West FSRD East4–7 yCastor
UnburnedAirport
SpringAvg. no. species/survey 5.44ab (21) 6.28ab (22) 6.83ab (26) 7.67b (23) 11.06c (34) 11.06c (29)Avg. no. individuals/survey 12.67a 13.00a 13.33a 12.83a 20.33b 28.72b
WinterAvg. no. species/survey 5.78a (27) 6.67ab (26) 7.28ab (28) 7.39ab (31) 8.28b (26) 11.78c (29)Avg. no. individuals/survey 18.61a 43.06a 27.39a 25.89a 24.67a 48.56b
a Abbreviations: BNKH, Bunkhouse; FSRD, Forest Service Road.b Within rows, values followed by same letter did not differ (� � 0.05). Total numbers of species recorded are in parentheses.
tion. Data recorded for each observation included spe-cies name and number of individuals.
Data Analysis
Because of differences in riparian zones in the an-nual and 2- to 3-y burning regime study sites, each sitewas considered separately rather than as a replicate.Each day was considered as a single sampling unit;thus, sample size was nine per study site per season.For each study site, Mann–Whitney U-tests (� � 0.10)were used to test for differences in numbers of birdspecies and individuals between years by season. If nodifferences were detected, the two years of data foreach study site were pooled; thus, sample size became18 for each season. Numbers of bird species, individ-uals, and individuals of selected species were com-pared among study sites by season using Kruskal–Wal-lis tests; differences were examined with nonparamet-ric Tukey-type multiple comparisons using the Ne-menyi test (� � 0.05) (Zar 1996). These tests usedranked observation data pooled by study site and sea-son. Therefore, more weight was given to frequencyof occurrence than to actual numbers observed; it wasthus possible that average numbers of species, individ-uals, or individuals of a selected species recorded persurvey were similar between two or more study sites,yet were statistically different.
The null hypotheses tested were that 1) for eachstudy site, seasonal avian species richness and abun-dance did not differ between years; and 2) within aseason, avian species richness, abundance, and num-bers of individuals of selected species did not differamong study sites.
RESULTS
Avian Communities
During 216 avian surveys, 5,362 individuals of 72species were observed among all study sites. Eighteenspecies recorded during spring were also recorded dur-ing winter. Mann–Whitney U-tests comparing seasonalnumbers of species and individuals between years bystudy sites revealed only 2 of 24 comparisons differed;more individuals were recorded in winter 1997 than in
winter 1996 on two sites (annually burned Forest Ser-vice Road West and 2- to 3-y burned BunkhouseWest). Therefore, for each study site, data gatheredduring the two years were pooled by season for furtheranalyses.
Spring Birds
During the spring surveys, 1,822 individuals rep-resenting 46 species of birds were recorded (Laterza1999:47–48). Average numbers of species and indi-viduals recorded per survey increased with decreasingburning frequency. Multiple range tests formed threegroups for species richness and two for avian abun-dance. For both parameters, values for the 4- to 7-yburned Castor and unburned Airport study sites weresimilar and were higher than values for the more fre-quently burned study sites (Table 1). The lowest avianrichness and abundance values were recorded on theannually burned Bunkhouse East study site; values re-corded there were less than half as large as those re-corded on the Castor and Airport study sites. Richnessand abundance values for the other three frequentlyburned study sites were only slightly higher than thoserecorded on Bunkhouse East (Table 1).
Bachman’s sparrows (Aimophila aestivalis), north-ern cardinals (Cardinalis cardinalis), pine warblers(Dendroica pinus), and Carolina wrens (Thryothorusludovicianus) were the most abundant species recordedduring spring surveys. Abundances of these speciesand 16 others were compared among study sites (Table2). Ten species were classified as residents (Robbinset al. 1983) and nine as Neotropical migrants (Peter-john et al. 1995). Among resident species, red-cock-aded woodpeckers (Picoides borealis), Bachman’ssparrows, and pine warblers were more abundant onstudy sites subjected to annual or 2- to 3-y burningregimes than on the less frequently burned sites.Northern cardinals, Carolina wrens, tufted titmice(Baeolophus bicolor), and Carolina chickadees (Poe-cile carolinensis) were most abundant on the less fre-quently burned sites. Red-bellied woodpeckers (Me-lanerpes carolinus), blue jays (Cyanocitta cristata),and brown-headed nuthatches (Sitta pusilla) showedno differences in abundances among burning regimes.
Six species of NTMBs (great crested flycatcher
124 WHITING ET AL.
Table 2. Average numbers of individuals of selected species per survey and results of Kruskal–Wallis tests and associated Nemenyimultiple comparisons among avian study sites on or adjacent to the Fort Polk Military Reservation in western Louisiana during spring(May–June), 1995 and 1996.
Species
Study site burning regime and namea
Annual
BNKH East FSRD West
2–3 y
BNKH West FSRD East4–7 yCastor
UnburnedAirport
ResidentsRed-cockaded woodpecker 0.06 (1)ab 1.44 (15)b 0.94 (11)b 0.67 (7)a 0.00 0.00Red-bellied woodpecker 0.00 0.16 (3) 0.06 (1) 0.11 (2) 0.06 (1) 0.44 (5)Blue jay 0.50 (6) 0.06 (1) 0.61 (5) 0.50 (6) 0.89 (5) 0.61 (6)Bachman’s sparrow 4.50 (18)a 3.61 (18)ab 3.89 (18)a 1.78 (15)b 0.56 (8)c 0.17 (3)cNorthern cardinal 0.11 (2)a 0.17 (3)a 0.89 (11)a 0.78 (8)a 2.70 (17)b 5.11 (17)bPine warbler 2.61 (17)ab 3.11 (16)a 2.06 (16)ab 2.61 (17)ab 1.67 (13)ab 1.61 (9)bCarolina wren 0.22 (3)a 0.33 (5)a 0.44 (7)a 0.72 (11)ab 1.72 (16)bc 4.44 (16)cBrown-headed nuthatch 1.28 (12) 0.44 (4) 1.06 (7) 1.17 (8) 0.61 (8) 0.56 (5)Tufted titmouse 0.00 0.06 (1)a 0.00 0.06 (1)a 0.72 (8)ab 1.67 (13)bCarolina chickadee 0.00 0.11 (1)a 0.00 0.50 (4)ab 0.72 (9)b 0.83 (8)b
Neotropical migrantsGreat crested flycatcher 0.00 0.11 (2)a 0.06 (1)a 0.28 (5)ab 0.61 (5)b 0.83 (11)bChipping sparrow 0.39 (1) 0.39 (4) 0.39 (4) 0.28 (5) 0.00 0.00Indigo bunting 1.17 (13)a 0.67 (9)ab 0.11 (2)b 0.72 (9)ab 0.83 (9)a 0.61 (6)abSummer tanager 0.33 (5)a 0.22 (4)a 0.17 (3)a 0.33 (4)a 2.06 (16)b 1.17 (14)bRed-eyed vireo 0.00 0.00 0.06 (1)a 0.00 0.67 (9)b 1.50 (12)bWhite-eyed vireo 0.17 (1)a 0.00 0.11 (2)a 0.33 (6)ab 0.89 (11)bc 2.61 (17)cYellow-breasted chat 0.11 (2)a 0.39 (4)a 0.28 (4)a 1.28 (16)b 1.72 (15)b 0.11 (3)aHooded warbler 0.00 0.00 0.33 (5)ab 0.00 0.50 (9)bc 1.39 (12)cBlue-gray gnatcatcher 0.00 0.00 0.00 0.06 (1)a 1.56 (10)b 1.22 (11)b
a Abbreviations: BNKH, Bunkhouse; FSRD, Forest Service Road.b Within rows, values followed by same letter did not differ (� � 0.05). Numbers in parentheses are frequencies of occurrence among 18surveys.
[Myiarchus crinitus], summer tanager [Piranga rub-ra], red-eyed vireo [Vireo olivaceus], white-eyed vireo[Vireo griseus], hooded warbler [Wilsonia citrina], andblue-gray gnatcatcher [Polioptila caerulea]) weremore abundant on the less frequently burned Castorand unburned Airport study sites than on the morefrequently burned sites (Table 2). Yellow-breasted chat(Icteria virens) numbers were higher on Forest ServiceRoad East (2- to 3-y burn) and Castor (4- to 7-y burn)sites than on other sites. Indigo bunting (Passerina cy-anea) and chipping sparrow (Spizella passerina) num-bers were not different among study sites.
Winter Birds
During the 1996 and 1997 winter sampling peri-ods, 3,540 individuals of 44 species were observedamong all study sites (Laterza 1999:54–55). As withspring birds, average numbers of species and individ-uals recorded per survey increased with decreasingburning frequency. Multiple range tests distinguishedthree groups for species richness and two for birdabundance (Table 1). Although average number of in-dividuals per survey on the annually burned ForestService Road West study site was similar to that onthe unburned Airport study site (Table 1), differencesbetween the two sites were significant because of in-frequent observations of large flocks of birds on theForest Service Road West study site. Species of birdsthat were relatively abundant during winter includedthe American goldfinch (Carduelis tristis), white-throated sparrow (Zonotrichia albicollis), dark-eyedjunco (Junco hyemalis), and pine warbler (Table 3).
There were sufficient data to compare abundancesamong study sites for 12 resident and 10 temperate-zone migrant species (Table 3).
During winter, red-cockaded woodpeckers, pinewarblers, and brown-headed nuthatches were moreabundant on the frequently burned stands than on theCastor or Airport study sites (Table 3). Bachman’ssparrows showed a similar though nonsignificant trend(Table 3). Red-cockaded woodpecker and pine warblerabundances were similar during spring (Table 2).However, the brown-headed nuthatch responded dif-ferently. During spring, there were no differences innumbers recorded among study sites (Table 2) whereasduring winter, this species was more abundant in theannually burned stands than in the other stands (Table3).
Red-bellied woodpeckers, northern cardinals, Car-olina wrens, and Carolina chickadees were more abun-dant on the unburned Airport study site than on theother study sites. Likewise, the tufted titmouse in-creased in abundance with decreasing burning fre-quency. There were no differences in numbers of pi-leated woodpeckers (Dryocopus pileatus) and bluejays among study sites; although numbers of Americancrows (Corvus brachyrhynchos) differed among studysites, they did not exhibit a trend across burning re-gimes (Table 3).
Species commonly found in western Louisianaonly during winter (Robbins et al. 1983) were classi-fied as temperate-zone migrants. Five of 10 temperate-zone migrants displayed increasing abundance withdecreasing burning frequency (Table 3). The white-
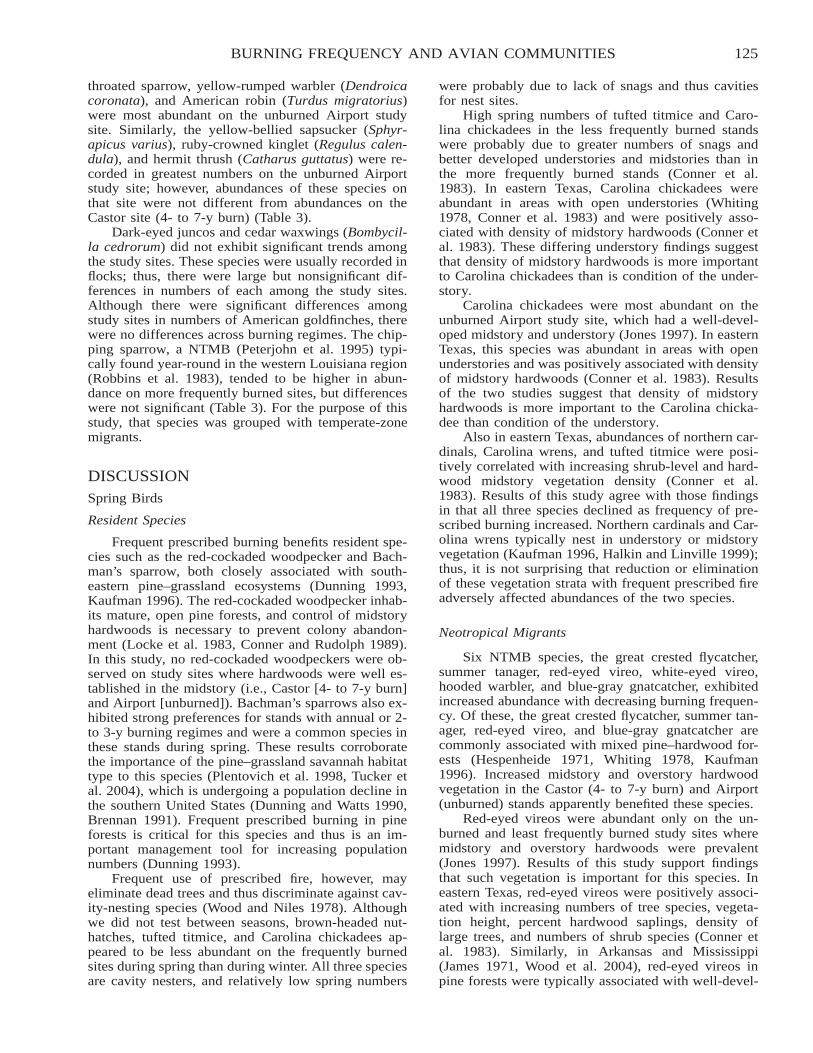
125BURNING FREQUENCY AND AVIAN COMMUNITIES
throated sparrow, yellow-rumped warbler (Dendroicacoronata), and American robin (Turdus migratorius)were most abundant on the unburned Airport studysite. Similarly, the yellow-bellied sapsucker (Sphyr-apicus varius), ruby-crowned kinglet (Regulus calen-dula), and hermit thrush (Catharus guttatus) were re-corded in greatest numbers on the unburned Airportstudy site; however, abundances of these species onthat site were not different from abundances on theCastor site (4- to 7-y burn) (Table 3).
Dark-eyed juncos and cedar waxwings (Bombycil-la cedrorum) did not exhibit significant trends amongthe study sites. These species were usually recorded inflocks; thus, there were large but nonsignificant dif-ferences in numbers of each among the study sites.Although there were significant differences amongstudy sites in numbers of American goldfinches, therewere no differences across burning regimes. The chip-ping sparrow, a NTMB (Peterjohn et al. 1995) typi-cally found year-round in the western Louisiana region(Robbins et al. 1983), tended to be higher in abun-dance on more frequently burned sites, but differenceswere not significant (Table 3). For the purpose of thisstudy, that species was grouped with temperate-zonemigrants.
DISCUSSIONSpring Birds
Resident Species
Frequent prescribed burning benefits resident spe-cies such as the red-cockaded woodpecker and Bach-man’s sparrow, both closely associated with south-eastern pine–grassland ecosystems (Dunning 1993,Kaufman 1996). The red-cockaded woodpecker inhab-its mature, open pine forests, and control of midstoryhardwoods is necessary to prevent colony abandon-ment (Locke et al. 1983, Conner and Rudolph 1989).In this study, no red-cockaded woodpeckers were ob-served on study sites where hardwoods were well es-tablished in the midstory (i.e., Castor [4- to 7-y burn]and Airport [unburned]). Bachman’s sparrows also ex-hibited strong preferences for stands with annual or 2-to 3-y burning regimes and were a common species inthese stands during spring. These results corroboratethe importance of the pine–grassland savannah habitattype to this species (Plentovich et al. 1998, Tucker etal. 2004), which is undergoing a population decline inthe southern United States (Dunning and Watts 1990,Brennan 1991). Frequent prescribed burning in pineforests is critical for this species and thus is an im-portant management tool for increasing populationnumbers (Dunning 1993).
Frequent use of prescribed fire, however, mayeliminate dead trees and thus discriminate against cav-ity-nesting species (Wood and Niles 1978). Althoughwe did not test between seasons, brown-headed nut-hatches, tufted titmice, and Carolina chickadees ap-peared to be less abundant on the frequently burnedsites during spring than during winter. All three speciesare cavity nesters, and relatively low spring numbers
were probably due to lack of snags and thus cavitiesfor nest sites.
High spring numbers of tufted titmice and Caro-lina chickadees in the less frequently burned standswere probably due to greater numbers of snags andbetter developed understories and midstories than inthe more frequently burned stands (Conner et al.1983). In eastern Texas, Carolina chickadees wereabundant in areas with open understories (Whiting1978, Conner et al. 1983) and were positively asso-ciated with density of midstory hardwoods (Conner etal. 1983). These differing understory findings suggestthat density of midstory hardwoods is more importantto Carolina chickadees than is condition of the under-story.
Carolina chickadees were most abundant on theunburned Airport study site, which had a well-devel-oped midstory and understory (Jones 1997). In easternTexas, this species was abundant in areas with openunderstories and was positively associated with densityof midstory hardwoods (Conner et al. 1983). Resultsof the two studies suggest that density of midstoryhardwoods is more important to the Carolina chicka-dee than condition of the understory.
Also in eastern Texas, abundances of northern car-dinals, Carolina wrens, and tufted titmice were posi-tively correlated with increasing shrub-level and hard-wood midstory vegetation density (Conner et al.1983). Results of this study agree with those findingsin that all three species declined as frequency of pre-scribed burning increased. Northern cardinals and Car-olina wrens typically nest in understory or midstoryvegetation (Kaufman 1996, Halkin and Linville 1999);thus, it is not surprising that reduction or eliminationof these vegetation strata with frequent prescribed fireadversely affected abundances of the two species.
Neotropical Migrants
Six NTMB species, the great crested flycatcher,summer tanager, red-eyed vireo, white-eyed vireo,hooded warbler, and blue-gray gnatcatcher, exhibitedincreased abundance with decreasing burning frequen-cy. Of these, the great crested flycatcher, summer tan-ager, red-eyed vireo, and blue-gray gnatcatcher arecommonly associated with mixed pine–hardwood for-ests (Hespenheide 1971, Whiting 1978, Kaufman1996). Increased midstory and overstory hardwoodvegetation in the Castor (4- to 7-y burn) and Airport(unburned) stands apparently benefited these species.
Red-eyed vireos were abundant only on the un-burned and least frequently burned study sites wheremidstory and overstory hardwoods were prevalent(Jones 1997). Results of this study support findingsthat such vegetation is important for this species. Ineastern Texas, red-eyed vireos were positively associ-ated with increasing numbers of tree species, vegeta-tion height, percent hardwood saplings, density oflarge trees, and numbers of shrub species (Conner etal. 1983). Similarly, in Arkansas and Mississippi(James 1971, Wood et al. 2004), red-eyed vireos inpine forests were typically associated with well-devel-
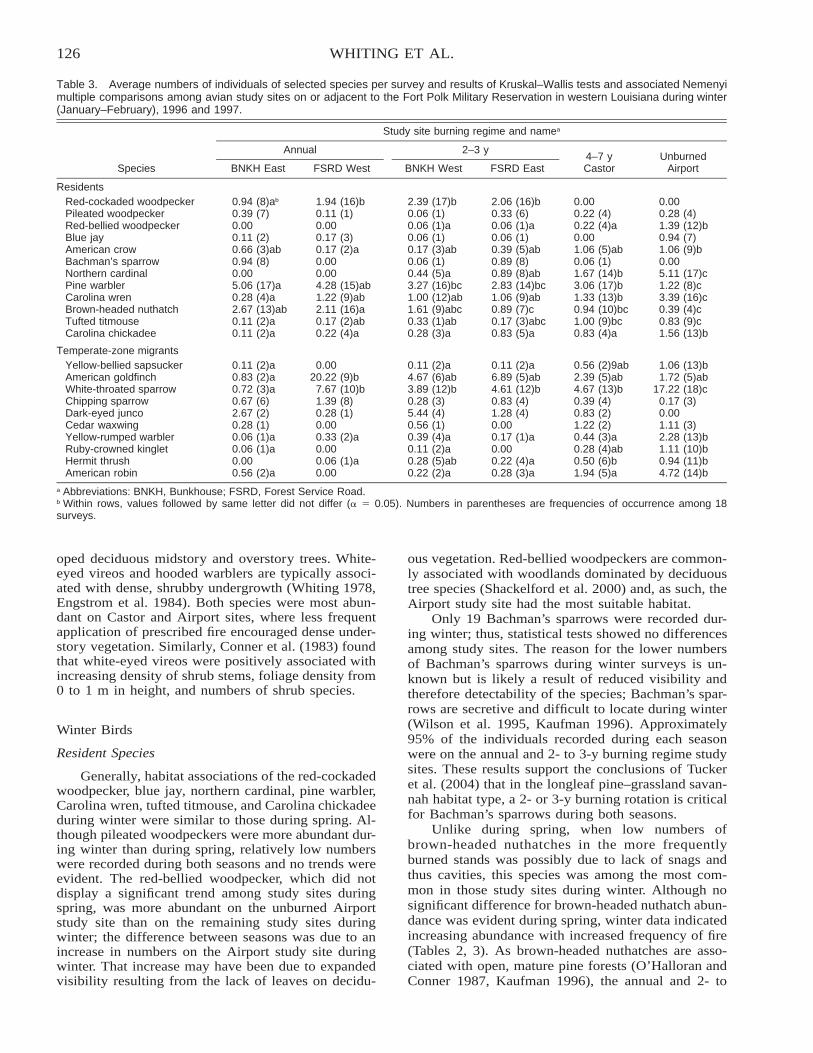
126 WHITING ET AL.
Table 3. Average numbers of individuals of selected species per survey and results of Kruskal–Wallis tests and associated Nemenyimultiple comparisons among avian study sites on or adjacent to the Fort Polk Military Reservation in western Louisiana during winter(January–February), 1996 and 1997.
Species
Study site burning regime and namea
Annual
BNKH East FSRD West
2–3 y
BNKH West FSRD East4–7 yCastor
UnburnedAirport
ResidentsRed-cockaded woodpecker 0.94 (8)ab 1.94 (16)b 2.39 (17)b 2.06 (16)b 0.00 0.00Pileated woodpecker 0.39 (7) 0.11 (1) 0.06 (1) 0.33 (6) 0.22 (4) 0.28 (4)Red-bellied woodpecker 0.00 0.00 0.06 (1)a 0.06 (1)a 0.22 (4)a 1.39 (12)bBlue jay 0.11 (2) 0.17 (3) 0.06 (1) 0.06 (1) 0.00 0.94 (7)American crow 0.66 (3)ab 0.17 (2)a 0.17 (3)ab 0.39 (5)ab 1.06 (5)ab 1.06 (9)bBachman’s sparrow 0.94 (8) 0.00 0.06 (1) 0.89 (8) 0.06 (1) 0.00Northern cardinal 0.00 0.00 0.44 (5)a 0.89 (8)ab 1.67 (14)b 5.11 (17)cPine warbler 5.06 (17)a 4.28 (15)ab 3.27 (16)bc 2.83 (14)bc 3.06 (17)b 1.22 (8)cCarolina wren 0.28 (4)a 1.22 (9)ab 1.00 (12)ab 1.06 (9)ab 1.33 (13)b 3.39 (16)cBrown-headed nuthatch 2.67 (13)ab 2.11 (16)a 1.61 (9)abc 0.89 (7)c 0.94 (10)bc 0.39 (4)cTufted titmouse 0.11 (2)a 0.17 (2)ab 0.33 (1)ab 0.17 (3)abc 1.00 (9)bc 0.83 (9)cCarolina chickadee 0.11 (2)a 0.22 (4)a 0.28 (3)a 0.83 (5)a 0.83 (4)a 1.56 (13)b
Temperate-zone migrantsYellow-bellied sapsucker 0.11 (2)a 0.00 0.11 (2)a 0.11 (2)a 0.56 (2)9ab 1.06 (13)bAmerican goldfinch 0.83 (2)a 20.22 (9)b 4.67 (6)ab 6.89 (5)ab 2.39 (5)ab 1.72 (5)abWhite-throated sparrow 0.72 (3)a 7.67 (10)b 3.89 (12)b 4.61 (12)b 4.67 (13)b 17.22 (18)cChipping sparrow 0.67 (6) 1.39 (8) 0.28 (3) 0.83 (4) 0.39 (4) 0.17 (3)Dark-eyed junco 2.67 (2) 0.28 (1) 5.44 (4) 1.28 (4) 0.83 (2) 0.00Cedar waxwing 0.28 (1) 0.00 0.56 (1) 0.00 1.22 (2) 1.11 (3)Yellow-rumped warbler 0.06 (1)a 0.33 (2)a 0.39 (4)a 0.17 (1)a 0.44 (3)a 2.28 (13)bRuby-crowned kinglet 0.06 (1)a 0.00 0.11 (2)a 0.00 0.28 (4)ab 1.11 (10)bHermit thrush 0.00 0.06 (1)a 0.28 (5)ab 0.22 (4)a 0.50 (6)b 0.94 (11)bAmerican robin 0.56 (2)a 0.00 0.22 (2)a 0.28 (3)a 1.94 (5)a 4.72 (14)b
a Abbreviations: BNKH, Bunkhouse; FSRD, Forest Service Road.b Within rows, values followed by same letter did not differ (� � 0.05). Numbers in parentheses are frequencies of occurrence among 18surveys.
oped deciduous midstory and overstory trees. White-eyed vireos and hooded warblers are typically associ-ated with dense, shrubby undergrowth (Whiting 1978,Engstrom et al. 1984). Both species were most abun-dant on Castor and Airport sites, where less frequentapplication of prescribed fire encouraged dense under-story vegetation. Similarly, Conner et al. (1983) foundthat white-eyed vireos were positively associated withincreasing density of shrub stems, foliage density from0 to 1 m in height, and numbers of shrub species.
Winter Birds
Resident Species
Generally, habitat associations of the red-cockadedwoodpecker, blue jay, northern cardinal, pine warbler,Carolina wren, tufted titmouse, and Carolina chickadeeduring winter were similar to those during spring. Al-though pileated woodpeckers were more abundant dur-ing winter than during spring, relatively low numberswere recorded during both seasons and no trends wereevident. The red-bellied woodpecker, which did notdisplay a significant trend among study sites duringspring, was more abundant on the unburned Airportstudy site than on the remaining study sites duringwinter; the difference between seasons was due to anincrease in numbers on the Airport study site duringwinter. That increase may have been due to expandedvisibility resulting from the lack of leaves on decidu-
ous vegetation. Red-bellied woodpeckers are common-ly associated with woodlands dominated by deciduoustree species (Shackelford et al. 2000) and, as such, theAirport study site had the most suitable habitat.
Only 19 Bachman’s sparrows were recorded dur-ing winter; thus, statistical tests showed no differencesamong study sites. The reason for the lower numbersof Bachman’s sparrows during winter surveys is un-known but is likely a result of reduced visibility andtherefore detectability of the species; Bachman’s spar-rows are secretive and difficult to locate during winter(Wilson et al. 1995, Kaufman 1996). Approximately95% of the individuals recorded during each seasonwere on the annual and 2- to 3-y burning regime studysites. These results support the conclusions of Tuckeret al. (2004) that in the longleaf pine–grassland savan-nah habitat type, a 2- or 3-y burning rotation is criticalfor Bachman’s sparrows during both seasons.
Unlike during spring, when low numbers ofbrown-headed nuthatches in the more frequentlyburned stands was possibly due to lack of snags andthus cavities, this species was among the most com-mon in those study sites during winter. Although nosignificant difference for brown-headed nuthatch abun-dance was evident during spring, winter data indicatedincreasing abundance with increased frequency of fire(Tables 2, 3). As brown-headed nuthatches are asso-ciated with open, mature pine forests (O’Halloran andConner 1987, Kaufman 1996), the annual and 2- to
127BURNING FREQUENCY AND AVIAN COMMUNITIES
3-y burning regime study sites had the most suitablehabitat during both seasons.
Temperate-Zone Migrants
During winter, the yellow-bellied sapsucker, white-throated sparrow, yellow-rumped warbler, ruby-crowned kinglet, hermit thrush, and American robinincreased in abundance with decreasing burning fre-quency. These species commonly winter in forestswith hardwood trees and dense undergrowth (Whiting1978, Kaufman 1996), and frequent prescribed burn-ing may reduce habitat suitability. Yellow-bellied sap-suckers forage by pecking holes into the cambium oftrees and feeding on oozing sap and insects attractedto the sap (Bent 1964). During winter, white-throatedsparrows commonly forage in dense thickets that pro-vide cover and where seeds are abundant beneath leaflitter (Falls and Kopachena 1994). Yellow-rumpedwarblers and ruby-crowned kinglets forage in under-story vegetation in deciduous forests, feeding on in-sects and insect larvae (Kaufman 1996). Typically,robins congregate in large flocks in habitats containingberry-producing trees and shrubs during winter (Whit-ing 1978, Kaufman 1996). American robins were mostabundant during winter on the Castor and Airportstudy sites, which had high densities of a variety ofberry-producing plants such as yaupon (Ilex vomito-ria), privet (Ligustrum spp.), American beautyberry(Callicarpa americana), and American holly (Ilexopaca).
As during spring, winter abundances of chippingsparrows were not different among study sites. Duringspring, chipping sparrows were not recorded on theCastor and Airport study sites and lack of a trend wasprobably due to low numbers recorded. Conversely,wintering chipping sparrows were recorded in ade-quate numbers to statistically analyze. However, theywere recorded on all study sites but with variableabundances that lacked a discernable trend.
MANAGEMENT IMPLICATIONS
Prescribed burning is an important tool with whichresource managers can accomplish many objectives.Obviously, the frequency at which prescribed fire isapplied in a longleaf pine forest will influence the veg-etational structure and composition of individualstands. Although frequent fires in longleaf pine standsthat lead to pine–grassland savannah may discriminateagainst bird species that typically inhabit pine andmixed pine–hardwood stands with well-developed un-derstory and/or midstory vegetation, this habitat typeis critical to many avian species, particularly pine–grassland obligates.
Longleaf pine was once the dominant vegetationcover type in the southeastern United States. At pre-sent, �5% of this forest type remains. Areas currentlycontaining this vegetation type must be maintained inorder to provide suitable habitat for the red-cockadedwoodpecker, Bachman’s sparrow, and many otherpine–grassland species. Furthermore, increasing the
area of longleaf pine–grassland savannah through cre-ation and/or restoration efforts is vital to maintainingor increasing populations of these species. In additionto birds, there is evidence that restoration of the pine–grassland savannah habitat type may be beneficial tomany small mammals (Masters et al. 1998) which, inturn, could benefit many bird, mammal, and reptilespecies that depend on such animals as prey.
Finally, riparian zones and mesic sites influenceavian species composition in longleaf pine–grasslandsavannah habitats. In this study, 16 bird species com-mon to the less frequently burned Castor and unburnedAirport study sites were recorded on the four frequent-ly burned study sites in vegetation associated withsmall drainages. Such areas provided habitat for avianspecies that are not normally associated with the long-leaf pine–grassland savannah habitat type. These re-sults suggest that riparian zones and mesic sites con-taining hardwoods may be extremely beneficial formaintaining a wide array of bird species in frequentlyburned longleaf pine stands.
ACKNOWLEDGMENTSField assistants for this study were D.T. Benefield,
J.F. Benefield, L.S. Jones, C.A. Kelly, and D.A.McAfee; R.N. Conner provided statistical expertise.Comments by J. Cox, R.E. Masters, and an anonymousreviewer improved the manuscript. The study wasfunded by the Arthur Temple College of Forestry andAgriculture at Stephen F. Austin State University.
LITERATURE CITEDBendell, J.F. 1974. Effects of fire on birds and mammals. Pages
73–138 in T.T. Kozlowski and C.E. Ahlgren (eds.). Fire andecosystems. Academic Press, New York.
Bent, A.C. 1964. Life histories of North American woodpeckers.Dover Publications, New York.
Brennan, L.A. 1991. How can we reverse the northern bobwhitepopulation decline? Wildlife Society Bulletin 19:544–555.
Conner, R.N., and J.G. Dickson. 1980. Strip transect samplingand analysis for avian habitat studies. Wildlife Society Bul-letin 8:4–10.
Conner, R.N., J.G. Dickson, B.A. Locke, and C.A. Segelquist.1983. Vegetation characteristics important to common song-birds in east Texas. Wilson Bulletin 95:349–361.
Conner, R.N., and D.C. Rudolph. 1989. Red-cockaded wood-pecker colony status and trends on the Angelina, DavyCrockett, and Sabine national forests. Research Paper SO-250, U.S. Department of Agriculture, Forest Service, South-ern Forest Experiment Station, New Orleans, LA.
Dickson, J.G. 1981. Effects of forest burning on songbirds. Pag-es 67–72 in G.W. Wood (ed.). Prescribed fire and wildlifein southern forests. Belle W. Baruch Forest Science Insti-tute, Clemson University, Clemson, SC.
Dickson, J.G., F.R. Thompson III, R.N. Conner, and K.E. Fra-nzreb. 1993. Effects of silviculture on Neotropical migra-tory birds in central and southeastern oak–pine forests. Pag-es 374–385 in D.M. Finch and P.W. Stangel (eds.). Statusand management of Neotropical migratory birds. GeneralTechnical Report RM-229, U.S. Department of Agriculture,Forest Service, Rocky Mountain Forest and Range Exper-iment Station, Fort Collins, CO.
Dunning, J.B. 1993. Bachman’s sparrow (Aimophila aestivalis).Number 38 in A. Poole, P. Stettenheim, and F. Gill (eds.).
128 WHITING ET AL.
The birds of North America. The Academy of Natural Sci-ences, Philadelphia, PA, and The American Ornithologists’Union, Washington, D.C.
Dunning, J.B. Jr., and B.D. Watts. 1990. Regional differences inhabitat occupancy by Bachman’s sparrow. Auk 107:463–472.
Engstrom, T.R., R.L. Crawford, and W.W. Baker. 1984. Breedingbird populations in relation to changing forest structure fol-lowing fire exclusion: a 15-year study. Wilson Bulletin 96:437–450.
Falls, J.B., and J.G. Kopachena. 1994. White-throated sparrow(Zonotrichia albicollis). Number 128 in A. Poole and F. Gill(eds.). The birds of North America. The Academy of Nat-ural Sciences, Philadelphia, PA, and The American Orni-thologists’ Union, Washington, D.C.
Frost, C.C. 1993. Four centuries of changing landscape patternsin the longleaf pine ecosystem. Proceedings of the Tall Tim-bers Fire Ecology Conference 18:17–42.
Halkin, S.L., and S.U. Linville. 1999. Northern cardinal (Car-dinalis cardinalis). Number 440 in A. Poole and F. Gill(eds.). The birds of North America. The Birds of NorthAmerica, Inc., Philadelphia, PA.
Hamilton, R.B., and V.G. Yurkunas. 1987. Avian use of habitatsin the longleaf–slash pine forests of Louisiana. Pages 125–137 in H.A. Pearson, F.E. Smeins, and R.E. Thill (compil-ers). Ecological, physical and socioeconomic relationshipswithin southern national forests. General Technical ReportSO-68, U.S. Department of Agriculture, Forest Service,Southern Forest Experiment Station, New Orleans, LA.
Hespenheide, H.A. 1971. Flycatcher habitat selection in the east-ern deciduous forest. Auk 88:61–74.
Jackson, J.A. 1988. The southeastern pine forest and its birds:past, present, and future. Pages 111–159 in J.A. Jackson(ed.). Bird conservation 3. International Council of BirdPreservation, University of Wisconsin Press, Madison.
James, F.C. 1971. Ordinations in habitat relationships amongbreeding birds. Wilson Bulletin 83:215–236.
Jones, L.C. 1997. Evaluation of the frequency of prescribed fireon the vegetative composition of an upland longleaf pineecosystem. M.S. Thesis, Stephen F. Austin State University,Nacogdoches, TX.
Kaufman, K. 1996. Lives of North American birds. HoughtonMifflin, New York.
Landers, J.L., D.H. Van Lear, and W.D. Boyer. 1995. The long-leaf pine forests of the Southeast: requiem or renaissance?Journal of Forestry 93:39–44.
Laterza, K.J. 1999. Effects of prescribed burning frequency onavian communities in a longleaf pine ecosystem. M.S. The-sis, Stephen F. Austin State University, Nacogdoches, TX.
Locke, B.A., R.N. Conner, and J.C. Kroll. 1983. Factors influ-encing colony site selection by red-cockaded woodpeckers.Pages 46–50 in D.A. Wood (ed.). Proceedings of the red-cockaded woodpecker symposium II. Florida Game andFresh Water Fish Commission, Tallahassee.
Masters, R.E., R.L. Lochmiller, S.T. McMurry, and G.A. Buken-hofer. 1998. Small mammal response to pine–grassland res-toration for red-cockaded woodpeckers. Wildlife SocietyBulletin 26:148–158.
Nelson, T.C., and W.M. Zillgitt. 1969. A forest atlas of the South.U.S. Department of Agriculture, Forest Service, SouthernForest Experiment Station, New Orleans, LA.
O’Halloran, K.A., and R.N. Conner. 1987. Habitat used bybrown-headed nuthatches. Bulletin of the Texas Ornitholog-ical Society 20:7–13.
Outcalt, K.W., and R.M. Sheffield. 1996. The longleaf pine for-est: trends and current conditions. Resource Bulletin SRS-9, U.S. Department of Agriculture, Forest Service, SouthernResearch Station, Asheville, NC.
Peterjohn, B.G., J.R. Sauer, and C.S. Robbins. 1995. Populationtrends from the North American Breeding Bird Survey.Pages 3–39 in T.E. Martin and D.M. Finch (eds.). Ecology
and management of Neotropical migratory birds. OxfordUniversity Press, New York.
Platt, W.J., G.W. Evans, and S.L. Rathburn. 1988. The popula-tion dynamics of a long-lived conifer. American Naturalist131:491–525.
Plentovich, S., J.W. Tucker, N.R. Holler, and G.E. Hill. 1998.Enhancing Bachman’s sparrow habitat via management ofred-cockaded woodpeckers. Journal of Wildlife Manage-ment 62:347–354.
Robbins, C.S., B. Bruun, and B.G. Peterjohn. 1992. Populationtrends and management opportunities for Neotropical mi-grants. Pages 17–23 in D.M. Finch and P.W. Stangel (eds.).Status and management of Neotropical migratory birds.General Technical Report RM-229, U.S. Department of Ag-riculture, Forest Service, Rocky Mountain Forest and RangeExperiment Station, Fort Collins, CO.
Robbins, C.S., B. Bruun, and H.S. Zim. 1983. Birds of NorthAmerica. Western Publishing, Racine, WI.
Rotenberry, J.T., R.J. Cooper, J.M. Wunderle, and K.G. Smith.1993. Incorporating effects of natural disturbances in man-aged ecosystems. Pages 103–108 in D.M. Finch and P.W.Stangel (eds.). Status and management of Neotropical mi-gratory birds. General Technical Report RM-229, U.S. De-partment of Agriculture, Forest Service, Rocky MountainForest and Range Experiment Station, Fort Collins, CO.
Rutledge, B.T., and L.M. Conner. 2002. Potential effects ofgroundcover restoration on breeding bird communities inlongleaf pine stands. Wildlife Society Bulletin 30:354–360.
Sauer, J.R., and S. Droege. 1992. Geographic patterns in popu-lation trends of Neotropical migrants in North America.Pages 26–42 in J.M. Hagan and D.W. Johnston (eds.). Ecol-ogy and conservation of Neotropical migrant landbirds.Smithsonian Institution Press, Washington, D.C.
Shackelford, C.E., R.E. Brown, and R.N. Conner. 2000. Red-bellied woodpecker (Melanerpes carolinus). Number 500 inA. Poole and F. Gill (eds.). The birds of North America.The Birds of North America, Inc., Philadelphia, PA.
Sousa, W.P. 1984. The role of disturbance in natural communi-ties. Annual Review of Ecology and Systematics 25:353–391.
Stoddard, C.H., and G.M. Stoddard. 1987. Essentials of forestrypractice. Fourth edition. John Wiley and Sons, New York.
Tucker, J.W., W.D. Robinson, and J.G. Grand. 2004. Influenceof fire on Bachman’s sparrow, an endemic North Americansongbird. Journal of Wildlife Management 68:1114–1123.
Wahlenburg, W.G. 1946. Longleaf pine, its use, ecology, regen-eration, protection, growth, and management. Charles La-throp Pack Forestry Foundation, Washington, D.C.
Webb, T. 1986. Vegetational change in eastern North America.Pages 63–69 in C. Rosenweig and R. Dickson (eds.). Pro-ceedings of workshop on climate–vegetation interactions.Office for Interdisciplinary Earth Studies, University Cor-poration for Atmospheric Research, Boulder, CO.
Whiting, R.M. 1978. Avian diversity in various age pine forestsin East Texas. Ph.D. Dissertation, Texas A&M University,College Station.
Wilson, C.W., R.E. Masters, and G.A. Bukenhofer. 1995. Breed-ing bird response to pine–grassland community restorationfor red-cockaded woodpeckers. Journal of Wildlife Man-agement 59:56–67.
Wood, D.R., L.W. Burger Jr., J.L. Bowman, and C.L. Hardy.2004. Avian community response to pine–grassland resto-ration. Wildlife Society Bulletin 32:819–829.
Wood, G.W., and L.J. Niles. 1978. Effects of management prac-tices on nongame bird habitat in longleaf–slash pine forests.Pages 40–49 in R.M. DeGraaf (technical coordinator). Pro-ceedings of the workshop—management of southern forestsfor nongame birds. General Technical Report SE-14, U.S.Department of Agriculture, Forest Service, SoutheasternForest Experiment Station, Asheville, NC.
Zar, J.H. 1996. Biostatistical analysis. Third edition. PrenticeHall, New York.
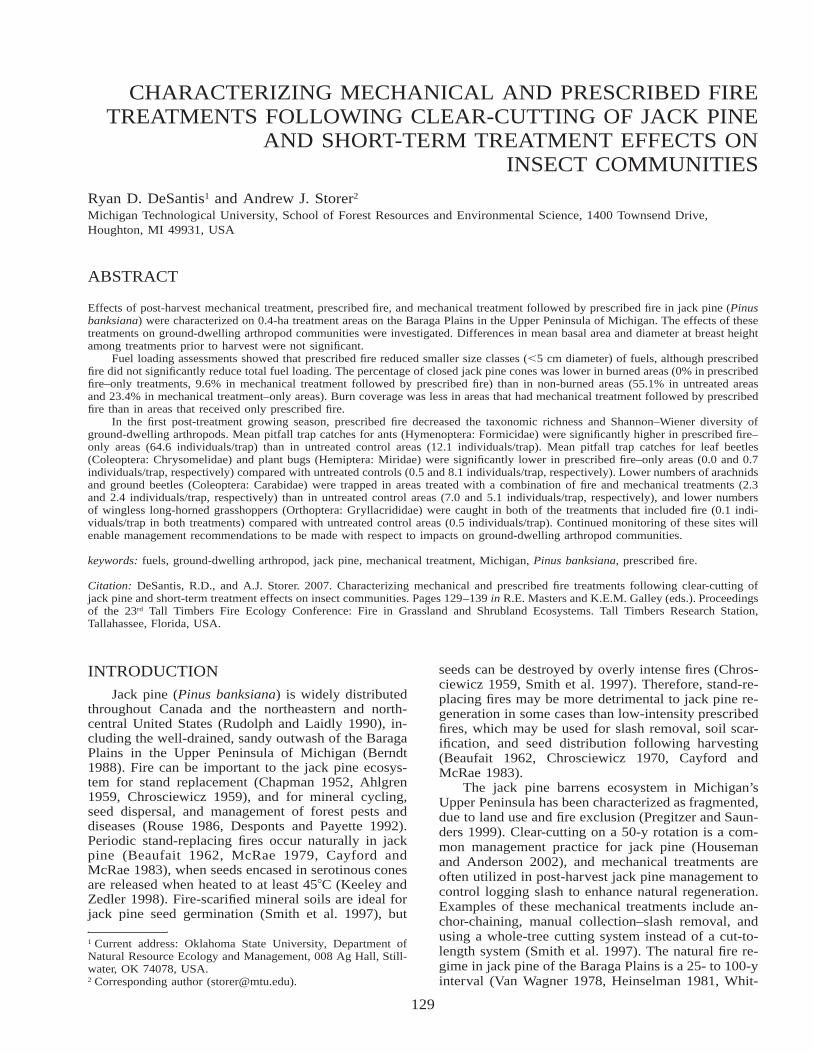
129
CHARACTERIZING MECHANICAL AND PRESCRIBED FIRETREATMENTS FOLLOWING CLEAR-CUTTING OF JACK PINE
AND SHORT-TERM TREATMENT EFFECTS ONINSECT COMMUNITIES
Ryan D. DeSantis1 and Andrew J. Storer2
Michigan Technological University, School of Forest Resources and Environmental Science, 1400 Townsend Drive,Houghton, MI 49931, USA
ABSTRACT
Effects of post-harvest mechanical treatment, prescribed fire, and mechanical treatment followed by prescribed fire in jack pine (Pinusbanksiana) were characterized on 0.4-ha treatment areas on the Baraga Plains in the Upper Peninsula of Michigan. The effects of thesetreatments on ground-dwelling arthropod communities were investigated. Differences in mean basal area and diameter at breast heightamong treatments prior to harvest were not significant.
Fuel loading assessments showed that prescribed fire reduced smaller size classes (�5 cm diameter) of fuels, although prescribedfire did not significantly reduce total fuel loading. The percentage of closed jack pine cones was lower in burned areas (0% in prescribedfire–only treatments, 9.6% in mechanical treatment followed by prescribed fire) than in non-burned areas (55.1% in untreated areasand 23.4% in mechanical treatment–only areas). Burn coverage was less in areas that had mechanical treatment followed by prescribedfire than in areas that received only prescribed fire.
In the first post-treatment growing season, prescribed fire decreased the taxonomic richness and Shannon–Wiener diversity ofground-dwelling arthropods. Mean pitfall trap catches for ants (Hymenoptera: Formicidae) were significantly higher in prescribed fire–only areas (64.6 individuals/trap) than in untreated control areas (12.1 individuals/trap). Mean pitfall trap catches for leaf beetles(Coleoptera: Chrysomelidae) and plant bugs (Hemiptera: Miridae) were significantly lower in prescribed fire–only areas (0.0 and 0.7individuals/trap, respectively) compared with untreated controls (0.5 and 8.1 individuals/trap, respectively). Lower numbers of arachnidsand ground beetles (Coleoptera: Carabidae) were trapped in areas treated with a combination of fire and mechanical treatments (2.3and 2.4 individuals/trap, respectively) than in untreated control areas (7.0 and 5.1 individuals/trap, respectively), and lower numbersof wingless long-horned grasshoppers (Orthoptera: Gryllacrididae) were caught in both of the treatments that included fire (0.1 indi-viduals/trap in both treatments) compared with untreated control areas (0.5 individuals/trap). Continued monitoring of these sites willenable management recommendations to be made with respect to impacts on ground-dwelling arthropod communities.
keywords: fuels, ground-dwelling arthropod, jack pine, mechanical treatment, Michigan, Pinus banksiana, prescribed fire.
Citation: DeSantis, R.D., and A.J. Storer. 2007. Characterizing mechanical and prescribed fire treatments following clear-cutting ofjack pine and short-term treatment effects on insect communities. Pages 129–139 in R.E. Masters and K.E.M. Galley (eds.). Proceedingsof the 23rd Tall Timbers Fire Ecology Conference: Fire in Grassland and Shrubland Ecosystems. Tall Timbers Research Station,Tallahassee, Florida, USA.
INTRODUCTIONJack pine (Pinus banksiana) is widely distributed
throughout Canada and the northeastern and north-central United States (Rudolph and Laidly 1990), in-cluding the well-drained, sandy outwash of the BaragaPlains in the Upper Peninsula of Michigan (Berndt1988). Fire can be important to the jack pine ecosys-tem for stand replacement (Chapman 1952, Ahlgren1959, Chrosciewicz 1959), and for mineral cycling,seed dispersal, and management of forest pests anddiseases (Rouse 1986, Desponts and Payette 1992).Periodic stand-replacing fires occur naturally in jackpine (Beaufait 1962, McRae 1979, Cayford andMcRae 1983), when seeds encased in serotinous conesare released when heated to at least 45�C (Keeley andZedler 1998). Fire-scarified mineral soils are ideal forjack pine seed germination (Smith et al. 1997), but
1 Current address: Oklahoma State University, Department ofNatural Resource Ecology and Management, 008 Ag Hall, Still-water, OK 74078, USA.2 Corresponding author ([email protected]).
seeds can be destroyed by overly intense fires (Chros-ciewicz 1959, Smith et al. 1997). Therefore, stand-re-placing fires may be more detrimental to jack pine re-generation in some cases than low-intensity prescribedfires, which may be used for slash removal, soil scar-ification, and seed distribution following harvesting(Beaufait 1962, Chrosciewicz 1970, Cayford andMcRae 1983).
The jack pine barrens ecosystem in Michigan’sUpper Peninsula has been characterized as fragmented,due to land use and fire exclusion (Pregitzer and Saun-ders 1999). Clear-cutting on a 50-y rotation is a com-mon management practice for jack pine (Housemanand Anderson 2002), and mechanical treatments areoften utilized in post-harvest jack pine management tocontrol logging slash to enhance natural regeneration.Examples of these mechanical treatments include an-chor-chaining, manual collection–slash removal, andusing a whole-tree cutting system instead of a cut-to-length system (Smith et al. 1997). The natural fire re-gime in jack pine of the Baraga Plains is a 25- to 100-yinterval (Van Wagner 1978, Heinselman 1981, Whit-
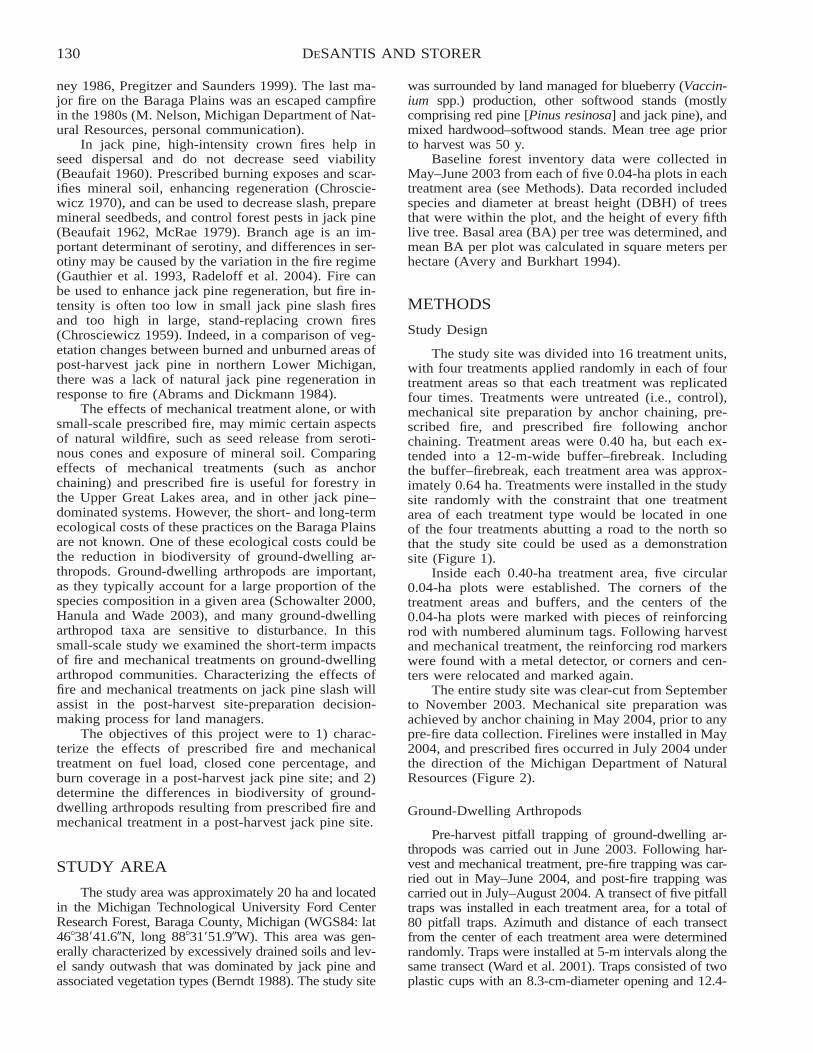
130 DESANTIS AND STORER
ney 1986, Pregitzer and Saunders 1999). The last ma-jor fire on the Baraga Plains was an escaped campfirein the 1980s (M. Nelson, Michigan Department of Nat-ural Resources, personal communication).
In jack pine, high-intensity crown fires help inseed dispersal and do not decrease seed viability(Beaufait 1960). Prescribed burning exposes and scar-ifies mineral soil, enhancing regeneration (Chroscie-wicz 1970), and can be used to decrease slash, preparemineral seedbeds, and control forest pests in jack pine(Beaufait 1962, McRae 1979). Branch age is an im-portant determinant of serotiny, and differences in ser-otiny may be caused by the variation in the fire regime(Gauthier et al. 1993, Radeloff et al. 2004). Fire canbe used to enhance jack pine regeneration, but fire in-tensity is often too low in small jack pine slash firesand too high in large, stand-replacing crown fires(Chrosciewicz 1959). Indeed, in a comparison of veg-etation changes between burned and unburned areas ofpost-harvest jack pine in northern Lower Michigan,there was a lack of natural jack pine regeneration inresponse to fire (Abrams and Dickmann 1984).
The effects of mechanical treatment alone, or withsmall-scale prescribed fire, may mimic certain aspectsof natural wildfire, such as seed release from seroti-nous cones and exposure of mineral soil. Comparingeffects of mechanical treatments (such as anchorchaining) and prescribed fire is useful for forestry inthe Upper Great Lakes area, and in other jack pine–dominated systems. However, the short- and long-termecological costs of these practices on the Baraga Plainsare not known. One of these ecological costs could bethe reduction in biodiversity of ground-dwelling ar-thropods. Ground-dwelling arthropods are important,as they typically account for a large proportion of thespecies composition in a given area (Schowalter 2000,Hanula and Wade 2003), and many ground-dwellingarthropod taxa are sensitive to disturbance. In thissmall-scale study we examined the short-term impactsof fire and mechanical treatments on ground-dwellingarthropod communities. Characterizing the effects offire and mechanical treatments on jack pine slash willassist in the post-harvest site-preparation decision-making process for land managers.
The objectives of this project were to 1) charac-terize the effects of prescribed fire and mechanicaltreatment on fuel load, closed cone percentage, andburn coverage in a post-harvest jack pine site; and 2)determine the differences in biodiversity of ground-dwelling arthropods resulting from prescribed fire andmechanical treatment in a post-harvest jack pine site.
STUDY AREA
The study area was approximately 20 ha and locatedin the Michigan Technological University Ford CenterResearch Forest, Baraga County, Michigan (WGS84: lat46�38�41.6�N, long 88�31�51.9�W). This area was gen-erally characterized by excessively drained soils and lev-el sandy outwash that was dominated by jack pine andassociated vegetation types (Berndt 1988). The study site
was surrounded by land managed for blueberry (Vaccin-ium spp.) production, other softwood stands (mostlycomprising red pine [Pinus resinosa] and jack pine), andmixed hardwood–softwood stands. Mean tree age priorto harvest was 50 y.
Baseline forest inventory data were collected inMay–June 2003 from each of five 0.04-ha plots in eachtreatment area (see Methods). Data recorded includedspecies and diameter at breast height (DBH) of treesthat were within the plot, and the height of every fifthlive tree. Basal area (BA) per tree was determined, andmean BA per plot was calculated in square meters perhectare (Avery and Burkhart 1994).
METHODS
Study Design
The study site was divided into 16 treatment units,with four treatments applied randomly in each of fourtreatment areas so that each treatment was replicatedfour times. Treatments were untreated (i.e., control),mechanical site preparation by anchor chaining, pre-scribed fire, and prescribed fire following anchorchaining. Treatment areas were 0.40 ha, but each ex-tended into a 12-m-wide buffer–firebreak. Includingthe buffer–firebreak, each treatment area was approx-imately 0.64 ha. Treatments were installed in the studysite randomly with the constraint that one treatmentarea of each treatment type would be located in oneof the four treatments abutting a road to the north sothat the study site could be used as a demonstrationsite (Figure 1).
Inside each 0.40-ha treatment area, five circular0.04-ha plots were established. The corners of thetreatment areas and buffers, and the centers of the0.04-ha plots were marked with pieces of reinforcingrod with numbered aluminum tags. Following harvestand mechanical treatment, the reinforcing rod markerswere found with a metal detector, or corners and cen-ters were relocated and marked again.
The entire study site was clear-cut from Septemberto November 2003. Mechanical site preparation wasachieved by anchor chaining in May 2004, prior to anypre-fire data collection. Firelines were installed in May2004, and prescribed fires occurred in July 2004 underthe direction of the Michigan Department of NaturalResources (Figure 2).
Ground-Dwelling Arthropods
Pre-harvest pitfall trapping of ground-dwelling ar-thropods was carried out in June 2003. Following har-vest and mechanical treatment, pre-fire trapping was car-ried out in May–June 2004, and post-fire trapping wascarried out in July–August 2004. A transect of five pitfalltraps was installed in each treatment area, for a total of80 pitfall traps. Azimuth and distance of each transectfrom the center of each treatment area were determinedrandomly. Traps were installed at 5-m intervals along thesame transect (Ward et al. 2001). Traps consisted of twoplastic cups with an 8.3-cm-diameter opening and 12.4-
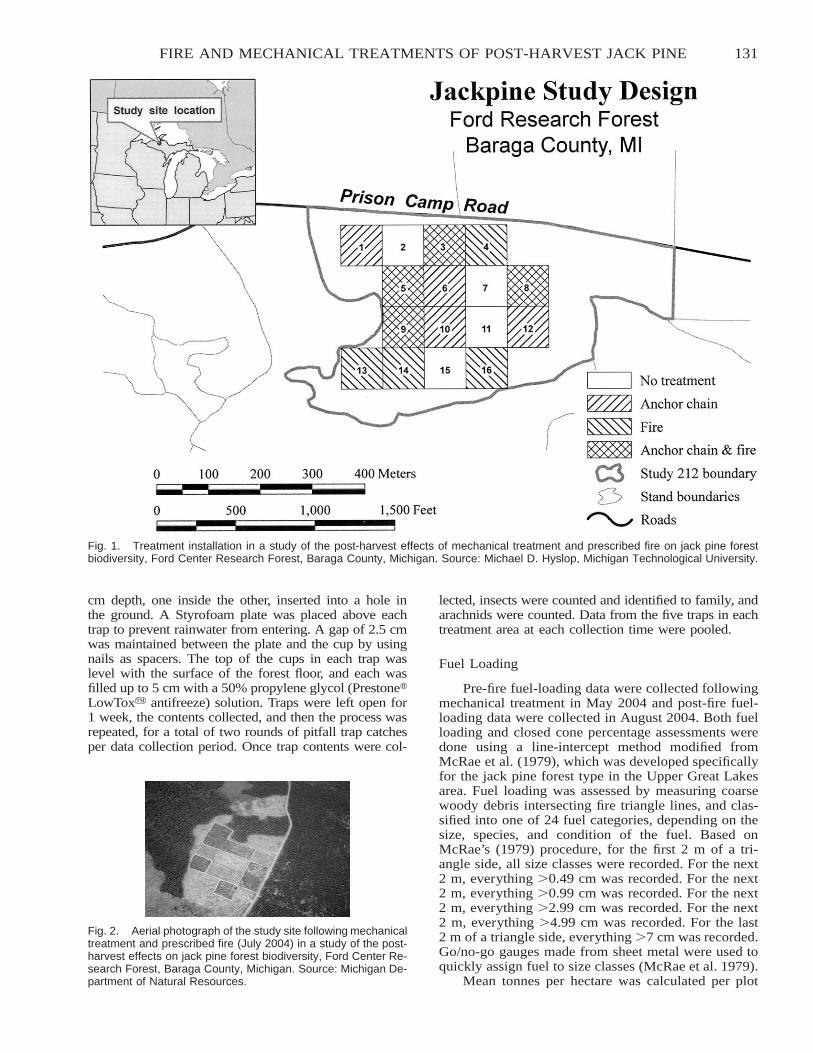
131FIRE AND MECHANICAL TREATMENTS OF POST-HARVEST JACK PINE
Fig. 1. Treatment installation in a study of the post-harvest effects of mechanical treatment and prescribed fire on jack pine forestbiodiversity, Ford Center Research Forest, Baraga County, Michigan. Source: Michael D. Hyslop, Michigan Technological University.
Fig. 2. Aerial photograph of the study site following mechanicaltreatment and prescribed fire (July 2004) in a study of the post-harvest effects on jack pine forest biodiversity, Ford Center Re-search Forest, Baraga County, Michigan. Source: Michigan De-partment of Natural Resources.
cm depth, one inside the other, inserted into a hole inthe ground. A Styrofoam plate was placed above eachtrap to prevent rainwater from entering. A gap of 2.5 cmwas maintained between the plate and the cup by usingnails as spacers. The top of the cups in each trap waslevel with the surface of the forest floor, and each wasfilled up to 5 cm with a 50% propylene glycol (Prestone�LowTox� antifreeze) solution. Traps were left open for1 week, the contents collected, and then the process wasrepeated, for a total of two rounds of pitfall trap catchesper data collection period. Once trap contents were col-
lected, insects were counted and identified to family, andarachnids were counted. Data from the five traps in eachtreatment area at each collection time were pooled.
Fuel Loading
Pre-fire fuel-loading data were collected followingmechanical treatment in May 2004 and post-fire fuel-loading data were collected in August 2004. Both fuelloading and closed cone percentage assessments weredone using a line-intercept method modified fromMcRae et al. (1979), which was developed specificallyfor the jack pine forest type in the Upper Great Lakesarea. Fuel loading was assessed by measuring coarsewoody debris intersecting fire triangle lines, and clas-sified into one of 24 fuel categories, depending on thesize, species, and condition of the fuel. Based onMcRae’s (1979) procedure, for the first 2 m of a tri-angle side, all size classes were recorded. For the next2 m, everything �0.49 cm was recorded. For the next2 m, everything �0.99 cm was recorded. For the next2 m, everything �2.99 cm was recorded. For the next2 m, everything �4.99 cm was recorded. For the last2 m of a triangle side, everything �7 cm was recorded.Go/no-go gauges made from sheet metal were used toquickly assign fuel to size classes (McRae et al. 1979).
Mean tonnes per hectare was calculated per plot
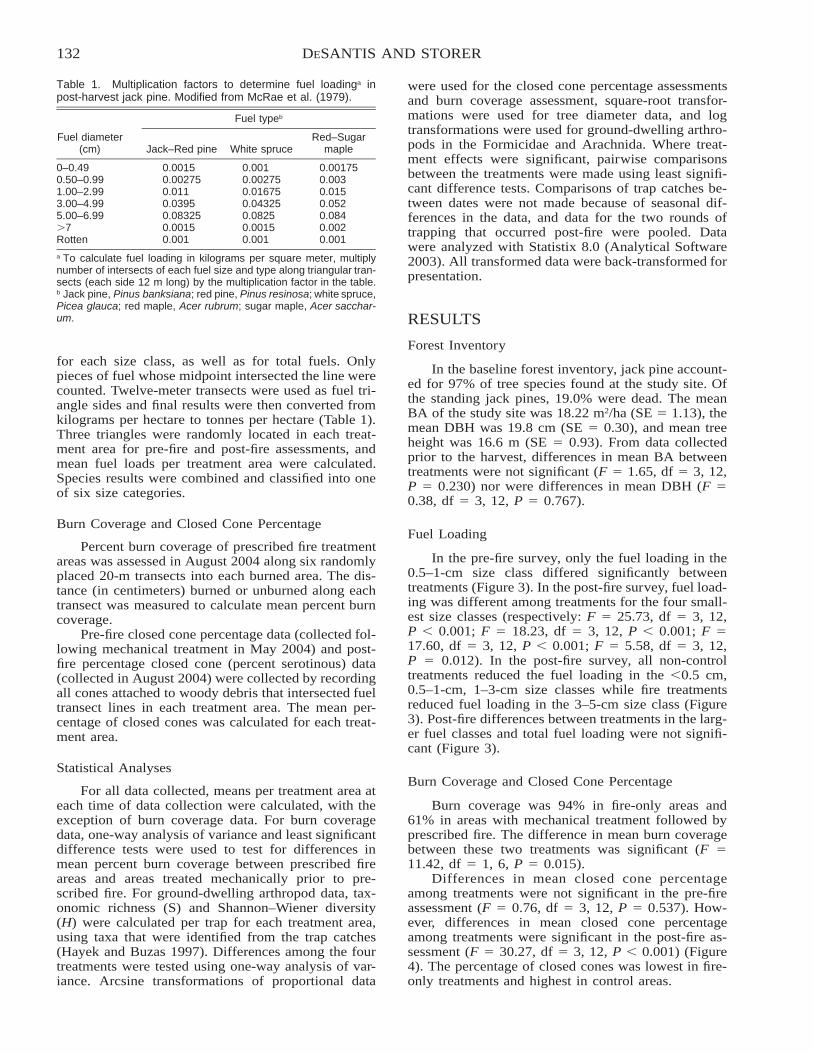
132 DESANTIS AND STORER
Table 1. Multiplication factors to determine fuel loadinga inpost-harvest jack pine. Modified from McRae et al. (1979).
Fuel diameter(cm)
Fuel typeb
Jack–Red pine White spruceRed–Sugar
maple
0–0.49 0.0015 0.001 0.001750.50–0.99 0.00275 0.00275 0.0031.00–2.99 0.011 0.01675 0.0153.00–4.99 0.0395 0.04325 0.0525.00–6.99 0.08325 0.0825 0.084�7 0.0015 0.0015 0.002Rotten 0.001 0.001 0.001
a To calculate fuel loading in kilograms per square meter, multiplynumber of intersects of each fuel size and type along triangular tran-sects (each side 12 m long) by the multiplication factor in the table.b Jack pine, Pinus banksiana; red pine, Pinus resinosa; white spruce,Picea glauca; red maple, Acer rubrum; sugar maple, Acer sacchar-um.
for each size class, as well as for total fuels. Onlypieces of fuel whose midpoint intersected the line werecounted. Twelve-meter transects were used as fuel tri-angle sides and final results were then converted fromkilograms per hectare to tonnes per hectare (Table 1).Three triangles were randomly located in each treat-ment area for pre-fire and post-fire assessments, andmean fuel loads per treatment area were calculated.Species results were combined and classified into oneof six size categories.
Burn Coverage and Closed Cone Percentage
Percent burn coverage of prescribed fire treatmentareas was assessed in August 2004 along six randomlyplaced 20-m transects into each burned area. The dis-tance (in centimeters) burned or unburned along eachtransect was measured to calculate mean percent burncoverage.
Pre-fire closed cone percentage data (collected fol-lowing mechanical treatment in May 2004) and post-fire percentage closed cone (percent serotinous) data(collected in August 2004) were collected by recordingall cones attached to woody debris that intersected fueltransect lines in each treatment area. The mean per-centage of closed cones was calculated for each treat-ment area.
Statistical Analyses
For all data collected, means per treatment area ateach time of data collection were calculated, with theexception of burn coverage data. For burn coveragedata, one-way analysis of variance and least significantdifference tests were used to test for differences inmean percent burn coverage between prescribed fireareas and areas treated mechanically prior to pre-scribed fire. For ground-dwelling arthropod data, tax-onomic richness (S) and Shannon–Wiener diversity(H) were calculated per trap for each treatment area,using taxa that were identified from the trap catches(Hayek and Buzas 1997). Differences among the fourtreatments were tested using one-way analysis of var-iance. Arcsine transformations of proportional data
were used for the closed cone percentage assessmentsand burn coverage assessment, square-root transfor-mations were used for tree diameter data, and logtransformations were used for ground-dwelling arthro-pods in the Formicidae and Arachnida. Where treat-ment effects were significant, pairwise comparisonsbetween the treatments were made using least signifi-cant difference tests. Comparisons of trap catches be-tween dates were not made because of seasonal dif-ferences in the data, and data for the two rounds oftrapping that occurred post-fire were pooled. Datawere analyzed with Statistix 8.0 (Analytical Software2003). All transformed data were back-transformed forpresentation.
RESULTS
Forest Inventory
In the baseline forest inventory, jack pine account-ed for 97% of tree species found at the study site. Ofthe standing jack pines, 19.0% were dead. The meanBA of the study site was 18.22 m2/ha (SE � 1.13), themean DBH was 19.8 cm (SE � 0.30), and mean treeheight was 16.6 m (SE � 0.93). From data collectedprior to the harvest, differences in mean BA betweentreatments were not significant (F � 1.65, df � 3, 12,P � 0.230) nor were differences in mean DBH (F �0.38, df � 3, 12, P � 0.767).
Fuel Loading
In the pre-fire survey, only the fuel loading in the0.5–1-cm size class differed significantly betweentreatments (Figure 3). In the post-fire survey, fuel load-ing was different among treatments for the four small-est size classes (respectively: F � 25.73, df � 3, 12,P � 0.001; F � 18.23, df � 3, 12, P � 0.001; F �17.60, df � 3, 12, P � 0.001; F � 5.58, df � 3, 12,P � 0.012). In the post-fire survey, all non-controltreatments reduced the fuel loading in the �0.5 cm,0.5–1-cm, 1–3-cm size classes while fire treatmentsreduced fuel loading in the 3–5-cm size class (Figure3). Post-fire differences between treatments in the larg-er fuel classes and total fuel loading were not signifi-cant (Figure 3).
Burn Coverage and Closed Cone Percentage
Burn coverage was 94% in fire-only areas and61% in areas with mechanical treatment followed byprescribed fire. The difference in mean burn coveragebetween these two treatments was significant (F �11.42, df � 1, 6, P � 0.015).
Differences in mean closed cone percentageamong treatments were not significant in the pre-fireassessment (F � 0.76, df � 3, 12, P � 0.537). How-ever, differences in mean closed cone percentageamong treatments were significant in the post-fire as-sessment (F � 30.27, df � 3, 12, P � 0.001) (Figure4). The percentage of closed cones was lowest in fire-only treatments and highest in control areas.
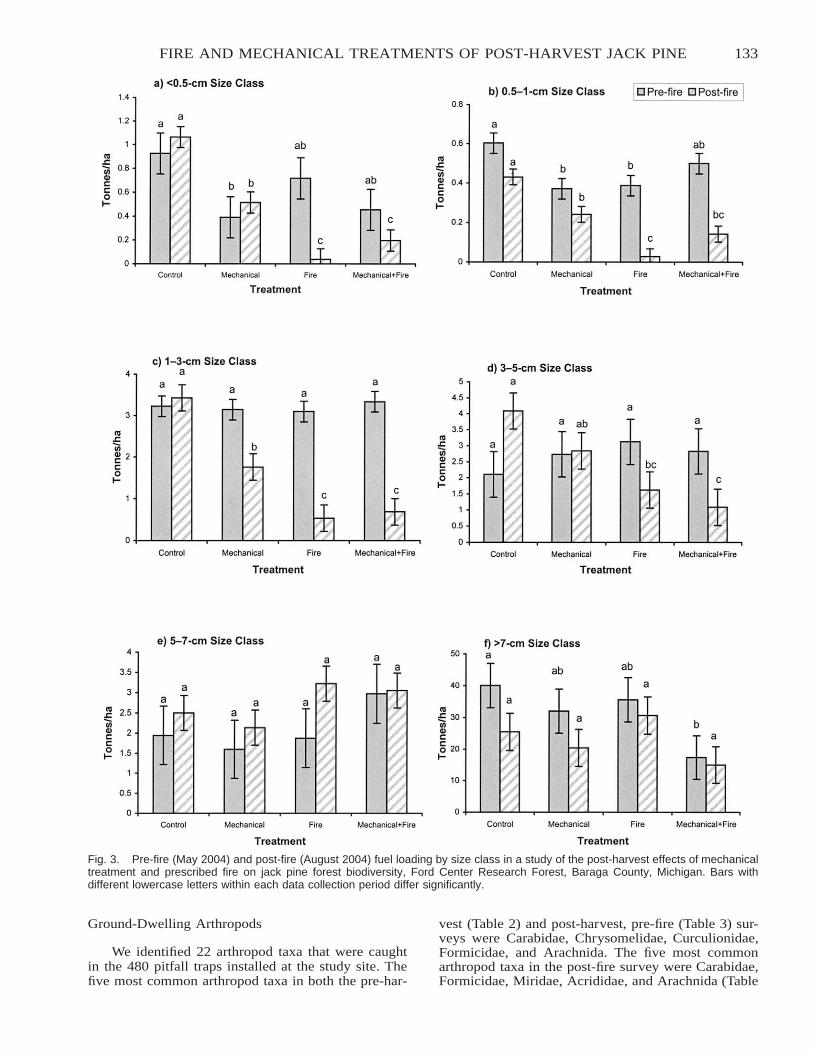
133FIRE AND MECHANICAL TREATMENTS OF POST-HARVEST JACK PINE
Fig. 3. Pre-fire (May 2004) and post-fire (August 2004) fuel loading by size class in a study of the post-harvest effects of mechanicaltreatment and prescribed fire on jack pine forest biodiversity, Ford Center Research Forest, Baraga County, Michigan. Bars withdifferent lowercase letters within each data collection period differ significantly.
Ground-Dwelling Arthropods
We identified 22 arthropod taxa that were caughtin the 480 pitfall traps installed at the study site. Thefive most common arthropod taxa in both the pre-har-
vest (Table 2) and post-harvest, pre-fire (Table 3) sur-veys were Carabidae, Chrysomelidae, Curculionidae,Formicidae, and Arachnida. The five most commonarthropod taxa in the post-fire survey were Carabidae,Formicidae, Miridae, Acrididae, and Arachnida (Table
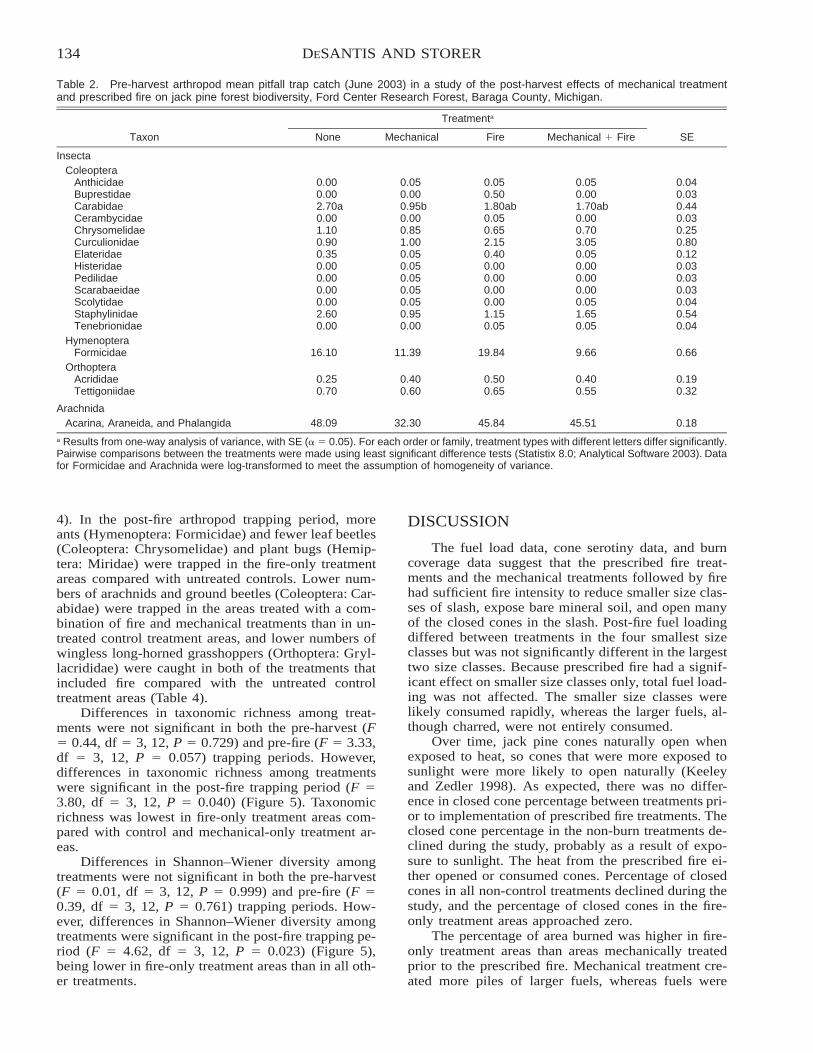
134 DESANTIS AND STORER
Table 2. Pre-harvest arthropod mean pitfall trap catch (June 2003) in a study of the post-harvest effects of mechanical treatmentand prescribed fire on jack pine forest biodiversity, Ford Center Research Forest, Baraga County, Michigan.
Taxon
Treatmenta
None Mechanical Fire Mechanical � Fire SE
InsectaColeoptera
Anthicidae 0.00 0.05 0.05 0.05 0.04Buprestidae 0.00 0.00 0.50 0.00 0.03Carabidae 2.70a 0.95b 1.80ab 1.70ab 0.44Cerambycidae 0.00 0.00 0.05 0.00 0.03Chrysomelidae 1.10 0.85 0.65 0.70 0.25Curculionidae 0.90 1.00 2.15 3.05 0.80Elateridae 0.35 0.05 0.40 0.05 0.12Histeridae 0.00 0.05 0.00 0.00 0.03Pedilidae 0.00 0.05 0.00 0.00 0.03Scarabaeidae 0.00 0.05 0.00 0.00 0.03Scolytidae 0.00 0.05 0.00 0.05 0.04Staphylinidae 2.60 0.95 1.15 1.65 0.54Tenebrionidae 0.00 0.00 0.05 0.05 0.04
HymenopteraFormicidae 16.10 11.39 19.84 9.66 0.66
OrthopteraAcrididae 0.25 0.40 0.50 0.40 0.19Tettigoniidae 0.70 0.60 0.65 0.55 0.32
ArachnidaAcarina, Araneida, and Phalangida 48.09 32.30 45.84 45.51 0.18
a Results from one-way analysis of variance, with SE ( � 0.05). For each order or family, treatment types with different letters differ significantly.Pairwise comparisons between the treatments were made using least significant difference tests (Statistix 8.0; Analytical Software 2003). Datafor Formicidae and Arachnida were log-transformed to meet the assumption of homogeneity of variance.
4). In the post-fire arthropod trapping period, moreants (Hymenoptera: Formicidae) and fewer leaf beetles(Coleoptera: Chrysomelidae) and plant bugs (Hemip-tera: Miridae) were trapped in the fire-only treatmentareas compared with untreated controls. Lower num-bers of arachnids and ground beetles (Coleoptera: Car-abidae) were trapped in the areas treated with a com-bination of fire and mechanical treatments than in un-treated control treatment areas, and lower numbers ofwingless long-horned grasshoppers (Orthoptera: Gryl-lacrididae) were caught in both of the treatments thatincluded fire compared with the untreated controltreatment areas (Table 4).
Differences in taxonomic richness among treat-ments were not significant in both the pre-harvest (F� 0.44, df � 3, 12, P � 0.729) and pre-fire (F � 3.33,df � 3, 12, P � 0.057) trapping periods. However,differences in taxonomic richness among treatmentswere significant in the post-fire trapping period (F �3.80, df � 3, 12, P � 0.040) (Figure 5). Taxonomicrichness was lowest in fire-only treatment areas com-pared with control and mechanical-only treatment ar-eas.
Differences in Shannon–Wiener diversity amongtreatments were not significant in both the pre-harvest(F � 0.01, df � 3, 12, P � 0.999) and pre-fire (F �0.39, df � 3, 12, P � 0.761) trapping periods. How-ever, differences in Shannon–Wiener diversity amongtreatments were significant in the post-fire trapping pe-riod (F � 4.62, df � 3, 12, P � 0.023) (Figure 5),being lower in fire-only treatment areas than in all oth-er treatments.
DISCUSSION
The fuel load data, cone serotiny data, and burncoverage data suggest that the prescribed fire treat-ments and the mechanical treatments followed by firehad sufficient fire intensity to reduce smaller size clas-ses of slash, expose bare mineral soil, and open manyof the closed cones in the slash. Post-fire fuel loadingdiffered between treatments in the four smallest sizeclasses but was not significantly different in the largesttwo size classes. Because prescribed fire had a signif-icant effect on smaller size classes only, total fuel load-ing was not affected. The smaller size classes werelikely consumed rapidly, whereas the larger fuels, al-though charred, were not entirely consumed.
Over time, jack pine cones naturally open whenexposed to heat, so cones that were more exposed tosunlight were more likely to open naturally (Keeleyand Zedler 1998). As expected, there was no differ-ence in closed cone percentage between treatments pri-or to implementation of prescribed fire treatments. Theclosed cone percentage in the non-burn treatments de-clined during the study, probably as a result of expo-sure to sunlight. The heat from the prescribed fire ei-ther opened or consumed cones. Percentage of closedcones in all non-control treatments declined during thestudy, and the percentage of closed cones in the fire-only treatment areas approached zero.
The percentage of area burned was higher in fire-only treatment areas than areas mechanically treatedprior to the prescribed fire. Mechanical treatment cre-ated more piles of larger fuels, whereas fuels were
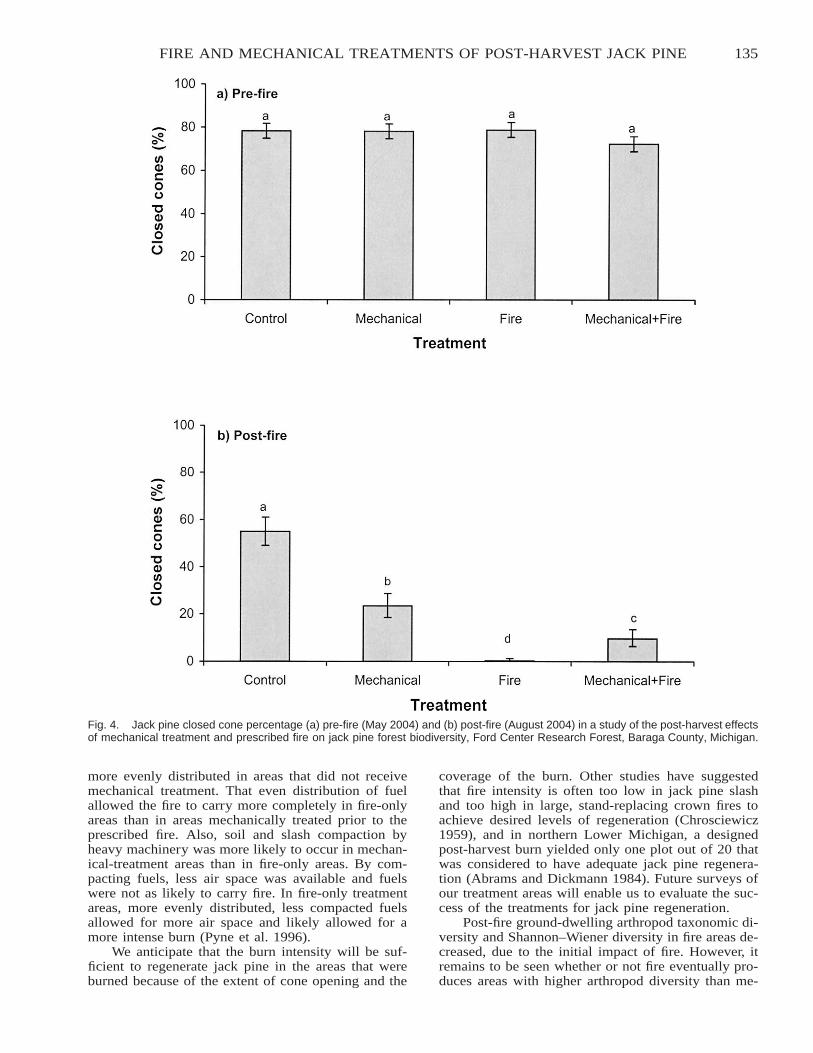
135FIRE AND MECHANICAL TREATMENTS OF POST-HARVEST JACK PINE
Fig. 4. Jack pine closed cone percentage (a) pre-fire (May 2004) and (b) post-fire (August 2004) in a study of the post-harvest effectsof mechanical treatment and prescribed fire on jack pine forest biodiversity, Ford Center Research Forest, Baraga County, Michigan.
more evenly distributed in areas that did not receivemechanical treatment. That even distribution of fuelallowed the fire to carry more completely in fire-onlyareas than in areas mechanically treated prior to theprescribed fire. Also, soil and slash compaction byheavy machinery was more likely to occur in mechan-ical-treatment areas than in fire-only areas. By com-pacting fuels, less air space was available and fuelswere not as likely to carry fire. In fire-only treatmentareas, more evenly distributed, less compacted fuelsallowed for more air space and likely allowed for amore intense burn (Pyne et al. 1996).
We anticipate that the burn intensity will be suf-ficient to regenerate jack pine in the areas that wereburned because of the extent of cone opening and the
coverage of the burn. Other studies have suggestedthat fire intensity is often too low in jack pine slashand too high in large, stand-replacing crown fires toachieve desired levels of regeneration (Chrosciewicz1959), and in northern Lower Michigan, a designedpost-harvest burn yielded only one plot out of 20 thatwas considered to have adequate jack pine regenera-tion (Abrams and Dickmann 1984). Future surveys ofour treatment areas will enable us to evaluate the suc-cess of the treatments for jack pine regeneration.
Post-fire ground-dwelling arthropod taxonomic di-versity and Shannon–Wiener diversity in fire areas de-creased, due to the initial impact of fire. However, itremains to be seen whether or not fire eventually pro-duces areas with higher arthropod diversity than me-
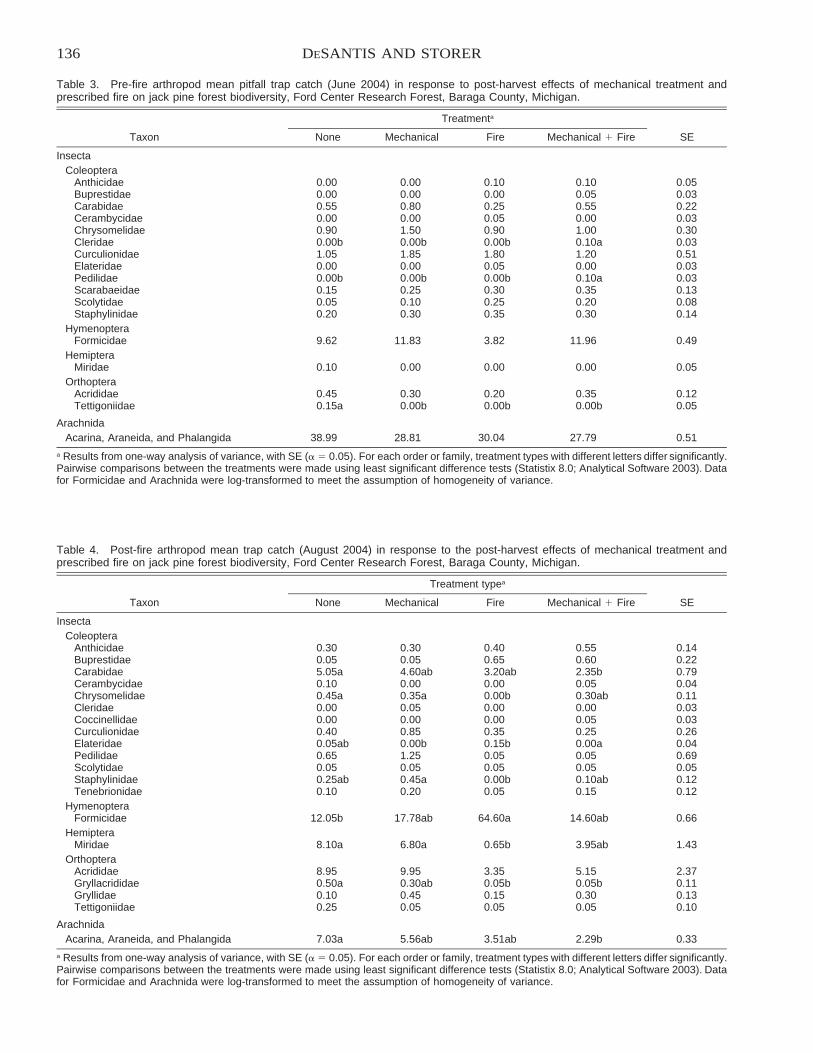
136 DESANTIS AND STORER
Table 3. Pre-fire arthropod mean pitfall trap catch (June 2004) in response to post-harvest effects of mechanical treatment andprescribed fire on jack pine forest biodiversity, Ford Center Research Forest, Baraga County, Michigan.
Taxon
Treatmenta
None Mechanical Fire Mechanical � Fire SE
InsectaColeoptera
Anthicidae 0.00 0.00 0.10 0.10 0.05Buprestidae 0.00 0.00 0.00 0.05 0.03Carabidae 0.55 0.80 0.25 0.55 0.22Cerambycidae 0.00 0.00 0.05 0.00 0.03Chrysomelidae 0.90 1.50 0.90 1.00 0.30Cleridae 0.00b 0.00b 0.00b 0.10a 0.03Curculionidae 1.05 1.85 1.80 1.20 0.51Elateridae 0.00 0.00 0.05 0.00 0.03Pedilidae 0.00b 0.00b 0.00b 0.10a 0.03Scarabaeidae 0.15 0.25 0.30 0.35 0.13Scolytidae 0.05 0.10 0.25 0.20 0.08Staphylinidae 0.20 0.30 0.35 0.30 0.14
HymenopteraFormicidae 9.62 11.83 3.82 11.96 0.49
HemipteraMiridae 0.10 0.00 0.00 0.00 0.05
OrthopteraAcrididae 0.45 0.30 0.20 0.35 0.12Tettigoniidae 0.15a 0.00b 0.00b 0.00b 0.05
ArachnidaAcarina, Araneida, and Phalangida 38.99 28.81 30.04 27.79 0.51
a Results from one-way analysis of variance, with SE ( � 0.05). For each order or family, treatment types with different letters differ significantly.Pairwise comparisons between the treatments were made using least significant difference tests (Statistix 8.0; Analytical Software 2003). Datafor Formicidae and Arachnida were log-transformed to meet the assumption of homogeneity of variance.
Table 4. Post-fire arthropod mean trap catch (August 2004) in response to the post-harvest effects of mechanical treatment andprescribed fire on jack pine forest biodiversity, Ford Center Research Forest, Baraga County, Michigan.
Taxon
Treatment typea
None Mechanical Fire Mechanical � Fire SE
InsectaColeoptera
Anthicidae 0.30 0.30 0.40 0.55 0.14Buprestidae 0.05 0.05 0.65 0.60 0.22Carabidae 5.05a 4.60ab 3.20ab 2.35b 0.79Cerambycidae 0.10 0.00 0.00 0.05 0.04Chrysomelidae 0.45a 0.35a 0.00b 0.30ab 0.11Cleridae 0.00 0.05 0.00 0.00 0.03Coccinellidae 0.00 0.00 0.00 0.05 0.03Curculionidae 0.40 0.85 0.35 0.25 0.26Elateridae 0.05ab 0.00b 0.15b 0.00a 0.04Pedilidae 0.65 1.25 0.05 0.05 0.69Scolytidae 0.05 0.05 0.05 0.05 0.05Staphylinidae 0.25ab 0.45a 0.00b 0.10ab 0.12Tenebrionidae 0.10 0.20 0.05 0.15 0.12
HymenopteraFormicidae 12.05b 17.78ab 64.60a 14.60ab 0.66
HemipteraMiridae 8.10a 6.80a 0.65b 3.95ab 1.43
OrthopteraAcrididae 8.95 9.95 3.35 5.15 2.37Gryllacrididae 0.50a 0.30ab 0.05b 0.05b 0.11Gryllidae 0.10 0.45 0.15 0.30 0.13Tettigoniidae 0.25 0.05 0.05 0.05 0.10
ArachnidaAcarina, Araneida, and Phalangida 7.03a 5.56ab 3.51ab 2.29b 0.33
a Results from one-way analysis of variance, with SE ( � 0.05). For each order or family, treatment types with different letters differ significantly.Pairwise comparisons between the treatments were made using least significant difference tests (Statistix 8.0; Analytical Software 2003). Datafor Formicidae and Arachnida were log-transformed to meet the assumption of homogeneity of variance.
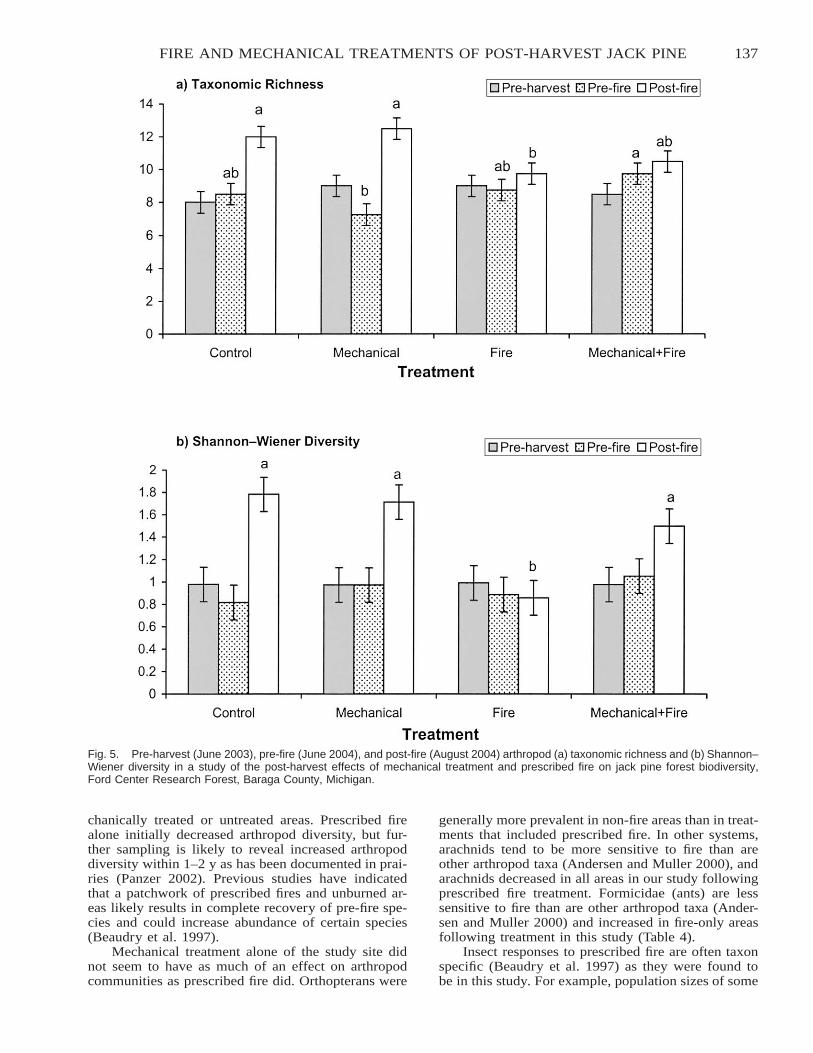
137FIRE AND MECHANICAL TREATMENTS OF POST-HARVEST JACK PINE
Fig. 5. Pre-harvest (June 2003), pre-fire (June 2004), and post-fire (August 2004) arthropod (a) taxonomic richness and (b) Shannon–Wiener diversity in a study of the post-harvest effects of mechanical treatment and prescribed fire on jack pine forest biodiversity,Ford Center Research Forest, Baraga County, Michigan.
chanically treated or untreated areas. Prescribed firealone initially decreased arthropod diversity, but fur-ther sampling is likely to reveal increased arthropoddiversity within 1–2 y as has been documented in prai-ries (Panzer 2002). Previous studies have indicatedthat a patchwork of prescribed fires and unburned ar-eas likely results in complete recovery of pre-fire spe-cies and could increase abundance of certain species(Beaudry et al. 1997).
Mechanical treatment alone of the study site didnot seem to have as much of an effect on arthropodcommunities as prescribed fire did. Orthopterans were
generally more prevalent in non-fire areas than in treat-ments that included prescribed fire. In other systems,arachnids tend to be more sensitive to fire than areother arthropod taxa (Andersen and Muller 2000), andarachnids decreased in all areas in our study followingprescribed fire treatment. Formicidae (ants) are lesssensitive to fire than are other arthropod taxa (Ander-sen and Muller 2000) and increased in fire-only areasfollowing treatment in this study (Table 4).
Insect responses to prescribed fire are often taxonspecific (Beaudry et al. 1997) as they were found tobe in this study. For example, population sizes of some
138 DESANTIS AND STORER
carabid species increase following prescribed burningin jack pine, while others decrease in abundance(Beaudry et al. 1997). Overall carabid trap catch de-clined in mechanical treatment followed by prescribedfire treatments in our study, though species determi-nations were not made. Seasonal differences in arthro-pod abundance probably had a large effect, as datacollection occurred at different periods during thesummer. Given the normally late start of warm weatheron the Baraga Plains, higher arthropod trap catchesshould normally occur later in the summer regardlessof treatment type. As mechanical treatment was per-formed early in the summer, it is likely that arthropodswere not yet fully active and therefore were not asimpacted by mechanical treatment as they were by thefire treatment. Since the fire treatment was applied lat-er in the summer than the mechanical treatment, it islikely that more arthropods were either initially killedby the treatment or that it had more of an initial effecton arthropod habitat than the mechanical treatment did(Panzer 2002, Hanula and Wade 2003). Some insectgroups were also likely able to escape from the smalltreatment areas and subsequently recolonize those ar-eas.
The effects that we have documented here are veryshort-term post-treatment effects, and will likelychange over time as the vegetation changes followingthe treatments. The data presented here reflect short-term effects of the treatments on ground-dwelling ar-thropod communities. Continued monitoring of long-term treatment effects will be necessary to fully eval-uate the potential ecological costs of the fire and me-chanical treatments on these communities and toincorporate this information into management recom-mendations.
ACKNOWLEDGMENTS
We thank Daniel Laux and Robert H. Ziel (Mich-igan Department of Natural Resources) for overseeingthe prescribed fires, James M. Schmierer and Scott D.Noble for assistance with treatment implementation,Susan H. Balint, Devin M. Donaldson, Elizabeth E.Graham, Jordan M. Marshall, Kathryn J. Nelson, Jus-tin N. Rosemier, Russell P. Slatton, and Joseph A. Wil-son for assistance with fieldwork. We also thank BrianL. Beachy for fieldwork assistance and for reviewingthis manuscript. Funding was provided by the Michi-gan Technological University Graduate School andSchool of Forest Resources and Environmental Sci-ence, and the U.S. Department of Agriculture Mac-Intire–Stennis program.
LITERATURE CITED
Abrams, M.D., and D.I. Dickmann. 1984. Floristic compositionbefore and after prescribed fire on a jack pine clear-cut sitein northern lower Michigan. Canadian Journal of Forest Re-search 14:746–749.
Ahlgren, C.E. 1959. Some effects of fire on forest reproductionin northeastern Minnesota. Journal of Forestry 57:194–200.
Analytical Software. 2003. Statistix 8.0. Analytical Software,Tallahassee, FL.
Andersen, A.N., and W.J. Muller. 2000. Arthropod responses toexperimental fire regimes in an Australian tropical savan-nah: ordinal-level analysis. Austral Ecology 25:199–209.
Avery, T.E., and H.E. Burkhart. 1994. Forest measurements.Fourth edition. McGraw-Hill, Boston, MA.
Beaudry, S., L.C. Duchesne, and B. Cote. 1997. Short-term ef-fects of three forestry practices on carabid assemblages ina jack pine forest. Canadian Journal of Forest Research 27:2065–2071.
Beaufait, W.R. 1960. Some effects of high temperatures on thecones and seeds of jack pine. Forest Science 6:194–199.
Beaufait, W.R. 1962. Procedures in prescribed burning for jackpine regeneration. Technical Bulletin 9, Michigan Collegeof Mining and Technology, Houghton.
Berndt, L.W. 1988. Soil survey of Baraga County area, Michi-gan. U.S. Department of Agriculture, Soil ConservationService, Washington, D.C.
Cayford, J.H., and D.J. McRae. 1983. The ecological role of firein jack pine forests. Pages 183–189 in R.W. Wein and D.A.MacLean (eds.). The role of fire in northern circumpolarecosystems. Scope 18. John Wiley & Sons, New York.
Chapman, H.H. 1952. The place of fire in the ecology of pines.Bartonia—Proceedings of the Philadelphia Botanical Club26:39–44.
Chrosciewicz, Z. 1959. Controlled burning experiments on jackpine sites. Technical Note 72, Canadian Department ofNorthern Affairs and National Resources, Forestry Branch,Forest Research Division, Ottawa, Ontario, Canada.
Chrosciewicz, Z. 1970. Regeneration of jack pine by burningand seeding treatments on clear-cut sites in Central Ontario.Information Report 0-X-138, Canadian Forestry Service,Forest Research Laboratory, Sault Sainte Marie, Ontario,Canada.
Desponts, M., and S. Payette. 1992. Recent dynamics of jackpine at its northern distribution limit in northern Quebec.Canadian Journal of Botany 70:1157–1167.
Gauthier, S., Y. Bergeron, and J.-P. Simon. 1993. Cone serotinyin jack pine: ontogenetic, positional, and environmental ef-fects. Canadian Journal of Forest Research 23:394–401.
Hanula, J.L., and D.D. Wade. 2003. Influence of long-term dor-mant-season burning and fire exclusion on ground-dwellingarthropod populations in longleaf pine flatwoods ecosys-tems. Forest Ecology and Management 175:163–184.
Hayek, L.C., and M.A. Buzas. 1997. Surveying natural popu-lations. Columbia University Press, New York.
Heinselman, M.L. 1981. Fire and succession in the conifer for-ests of northern North America. Pages 374–405 in D.C.West, H.H. Shugart, and D.B. Botkin (eds.). Forest succes-sion: concepts and applications. Springer-Verlag, New York.
Houseman, G.R., and R.C. Anderson. 2002. Effects of jack pineplantation management on barrens flora and potential Kirt-land’s warbler nest habitat. Restoration Ecology 10:27–36.
Keeley, J.E., and P.H. Zedler. 1998. Evolution of life histories inPinus. Pages 219–250 in D.M. Richardson (ed.). Ecologyand biogeography of Pinus. Cambridge University Press,Cambridge, United Kingdom.
McRae, D.J. 1979. Prescribed burning in jack pine slash: a re-view. Report 0-X-289, Canadian Forestry Service, GreatLakes Forest Research Centre, Sault Sainte Marie, Ontario,Canada.
McRae, D.J., M.E. Alexander, and B.J. Stocks. 1979. Measure-ment and description of fuels and fire behavior on pre-scribed burns: a handbook. Report 0-X-287, Canadian For-estry Service, Great Lakes Forest Research Centre, SaultSainte Marie, Ontario, Canada.
Panzer, R. 2002. Compatibility of prescribed burning with theconservation of insects in small, isolated prairie reserves.Conservation Biology 16:1296–1307.
Pregitzer, K.S., and S.C. Saunders. 1999. Jack pine barrens ofthe northern Great Lakes region. Pages 343–361 in R.C.

139FIRE AND MECHANICAL TREATMENTS OF POST-HARVEST JACK PINE
Anderson, J.S. Fralish, and J.M. Baskin (eds.). Savannas,barrens, and rock outcrop plant communities of NorthAmerica. Cambridge University Press, Cambridge, UnitedKingdom.
Pyne, S.L., P.L. Andrews, and D.R. Laven. 1996. Introductionto wildland fire. Second edition. John Wiley and Sons, NewYork.
Radeloff, V.C., D.J. Mladenoff, R.P. Guries, and M.S. Boyce.2004. Spatial patterns of cone serotiny in Pinus banksianain relation to fire disturbance. Forest Ecology and Manage-ment 189:133–141.
Rouse, C. 1986. Fire effects in northeastern forests: jack pine.General Technical Report NC-106, U.S. Department of Ag-riculture, Forest Service, North Central Forest ExperimentStation, St. Paul, MN.
Rudolph, T.D., and P.R. Laidly. 1990. Pinus banksiana. Pages
280–293 in R.M. Burns and B.H. Honkala (eds.). Silvics ofNorth America. Volume 1: conifers. Agriculture Handbook654, U.S. Department of Agriculture, Forest Service, Wash-ington, D.C.
Schowalter, T.D. 2000. Insect ecology: an ecosystem approach.Academic Press, San Diego, CA.
Smith, D.M., B.C. Larson, M.J. Kelty, and P.M.S. Ashton. 1997.The practice of silviculture: applied forest ecology. Ninthedition. John Wiley and Sons, New York.
Van Wagner, C.E. 1978. Age-class distribution and the forest firecycle. Canadian Journal of Forest Research 8:220–227.
Ward, D.F., T.R. New, and A.L. Yen. 2001. Effects of pitfall trapspacing on the abundance, richness and composition of in-vertebrate catches. Journal of Insect Conservation 5:47–53.
Whitney, G.G. 1986. Relation of Michigan’s pre-settlement pineforests to substrate and disturbance history. Ecology 67:1548–1559.
140
AN ECOSYSTEM APPROACH TO DETERMINING EFFECTS OFPRESCRIBED FIRE ON SOUTHWESTERN BORDERLANDS
OAK SAVANNAS: A BASELINE STUDY
Gerald J. Gottfried1
USDA Forest Service, Rocky Mountain Research Station, c/o Tonto National Forest, 2324 East McDowell Road, Phoenix,AZ 85006, USA
Daniel G. NearyUSDA Forest Service, Rocky Mountain Research Station, 2500 South Pine Knoll Drive, Flagstaff, AZ 86001, USA
Peter F. FfolliottUniversity of Arizona, School of Natural Resources, 325 Biological Sciences East, Tucson, AZ 85721, USA
ABSTRACT
Many traditional land management activities and supporting research have concentrated on one or two resources, with limited evalu-ations of interactions among other potential values. An ecosystem approach to land management requires an evaluation of the blendof physical and biological factors needed to assure productive, healthy ecosystems. Ideally, social and economic values also should beconsidered. The U.S. Department of Agriculture Forest Service’s Coronado National Forest and its partners have just completed a draftfor the Peloncillo Programmatic Fire Plan to address fire management strategies for this mountain range, which lies along the southernArizona–New Mexico border. The plan was designed to reintroduce prescribed or managed fires into an area where wildfires havebeen excluded since the late 19th century. One persistent question concerned the impacts of cool-season (November–April) and warm-season (May–October) fires on the oak (Quercus spp.) ecosystems that are common throughout these mountains. Fires normally occurin June or early July before the summer monsoon rains. However, hotter warm-season fires could damage important wildlife habitatsby killing larger numbers of standing trees and shrubs used as nesting sites or cover or as sources of food, and thus some managersprefer burning during the cooler season.
The Rocky Mountain Research Station’s Southwestern Borderlands Ecosystem Management Project and its cooperators haveinitiated a research program to evaluate the impacts of season of burning on a large number of ecosystem components, includinghydrology, sedimentation, vegetation, soil nutrient dynamics, small and large mammals, birds, and snakes and other reptiles. Ourresearch is concentrated on 12 small, gauged watersheds that support oak savannas or open woodlands. We plan to burn four watershedsin the warm season, burn four in the cool season, and leave four as controls. The watershed and companion studies are currently inthe pre-burn calibration phase. However, little is actually known about the oak ecosystems of the southwestern United States andnorthern Mexico, where most of these oak stands are found. The preliminary results have provided important new information aboutthese lands. This paper describes the studies and initial results obtained during the pre-treatment phase of this project.
keywords: ecosystem approach, oak (Quercus) savannas, prescribed fire, seasonal burning, southwestern Borderlands.
Citation: Gottfried, G.J., D.G. Neary, and P.F. Ffolliott. 2007. An ecosystem approach to determining effects of prescribed fire onsouthwestern Borderlands oak savannas: a baseline study. Pages 140–146 in R.E. Masters and K.E.M. Galley (eds.). Proceedings ofthe 23rd Tall Timbers Fire Ecology Conference: Fire in Grassland and Shrubland Ecosystems. Tall Timbers Research Station, Tallahassee,Florida, USA.
INTRODUCTION
Fire, which normally occurred as the result oflightning during the late spring and early summer, wasthe most important natural disturbance in the oak(Quercus spp.) woodlands and savannas of the south-western United States and northern Mexico prior toEuropean–American settlement. Some fires were setby Chiricahua Apaches, but the impacts probably werelimited (Kaib et al. 1999). However, more than a cen-tury of settlement has altered the dynamics in theseecosystems, resulting in declines in native herbaceousspecies, less frequent fires, and increases in woodyspecies. The loss of a continuous herbaceous cover
1 Corresponding author ([email protected]).
limited the spread of natural fires and allowed seed-lings of woody species to become established. Pre-scribed fire is seen as a technique for restoring thenatural processes within the savannas.
The U.S. Department of Agriculture (USDA) For-est Service’s Coronado National Forest and its partnershave just completed a draft for the Peloncillo Program-matic Fire Plan to address fire management strategiesfor the Peloncillo Mountain range, which lies alongthe southern Arizona–New Mexico border. One per-sistent question concerned the impacts of cool-season(November–April) and warm-season (May–October)prescribed fires on the oak ecosystems that are com-mon throughout these mountains. Fires normally occurin June or early July before the summer monsoonrains. However, there are questions about the effects
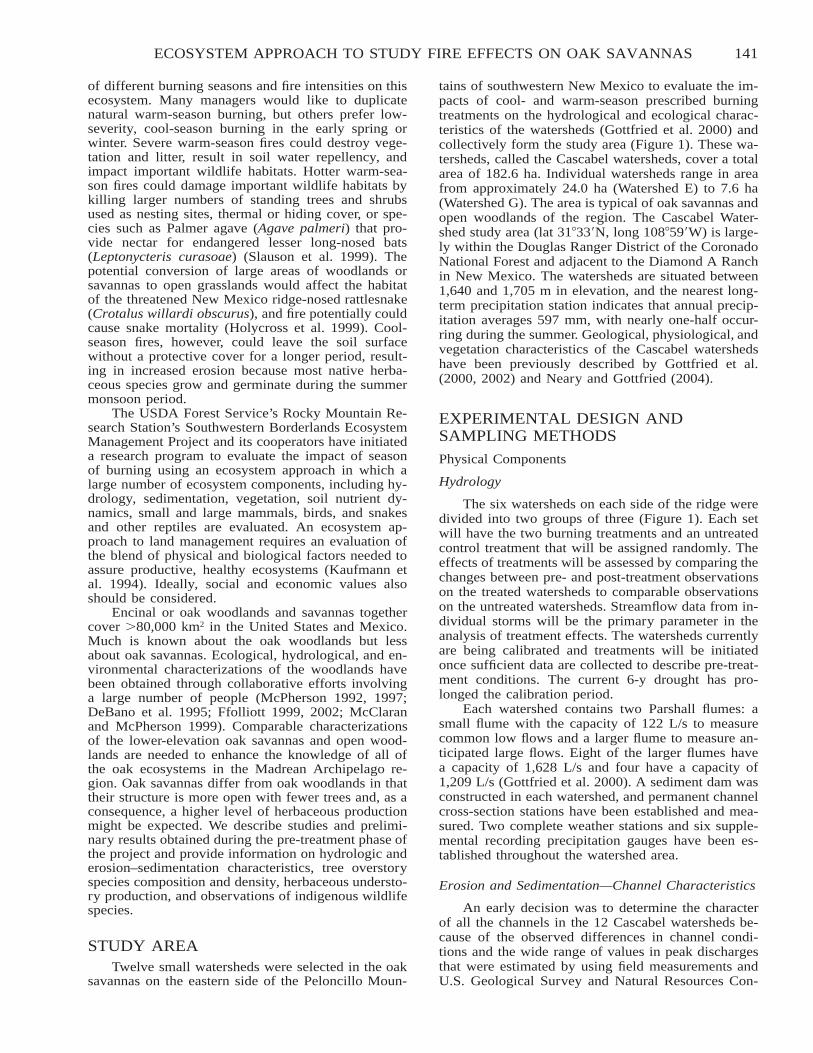
141ECOSYSTEM APPROACH TO STUDY FIRE EFFECTS ON OAK SAVANNAS
of different burning seasons and fire intensities on thisecosystem. Many managers would like to duplicatenatural warm-season burning, but others prefer low-severity, cool-season burning in the early spring orwinter. Severe warm-season fires could destroy vege-tation and litter, result in soil water repellency, andimpact important wildlife habitats. Hotter warm-sea-son fires could damage important wildlife habitats bykilling larger numbers of standing trees and shrubsused as nesting sites, thermal or hiding cover, or spe-cies such as Palmer agave (Agave palmeri) that pro-vide nectar for endangered lesser long-nosed bats(Leptonycteris curasoae) (Slauson et al. 1999). Thepotential conversion of large areas of woodlands orsavannas to open grasslands would affect the habitatof the threatened New Mexico ridge-nosed rattlesnake(Crotalus willardi obscurus), and fire potentially couldcause snake mortality (Holycross et al. 1999). Cool-season fires, however, could leave the soil surfacewithout a protective cover for a longer period, result-ing in increased erosion because most native herba-ceous species grow and germinate during the summermonsoon period.
The USDA Forest Service’s Rocky Mountain Re-search Station’s Southwestern Borderlands EcosystemManagement Project and its cooperators have initiateda research program to evaluate the impact of seasonof burning using an ecosystem approach in which alarge number of ecosystem components, including hy-drology, sedimentation, vegetation, soil nutrient dy-namics, small and large mammals, birds, and snakesand other reptiles are evaluated. An ecosystem ap-proach to land management requires an evaluation ofthe blend of physical and biological factors needed toassure productive, healthy ecosystems (Kaufmann etal. 1994). Ideally, social and economic values alsoshould be considered.
Encinal or oak woodlands and savannas togethercover �80,000 km2 in the United States and Mexico.Much is known about the oak woodlands but lessabout oak savannas. Ecological, hydrological, and en-vironmental characterizations of the woodlands havebeen obtained through collaborative efforts involvinga large number of people (McPherson 1992, 1997;DeBano et al. 1995; Ffolliott 1999, 2002; McClaranand McPherson 1999). Comparable characterizationsof the lower-elevation oak savannas and open wood-lands are needed to enhance the knowledge of all ofthe oak ecosystems in the Madrean Archipelago re-gion. Oak savannas differ from oak woodlands in thattheir structure is more open with fewer trees and, as aconsequence, a higher level of herbaceous productionmight be expected. We describe studies and prelimi-nary results obtained during the pre-treatment phase ofthe project and provide information on hydrologic anderosion–sedimentation characteristics, tree overstoryspecies composition and density, herbaceous understo-ry production, and observations of indigenous wildlifespecies.
STUDY AREATwelve small watersheds were selected in the oak
savannas on the eastern side of the Peloncillo Moun-
tains of southwestern New Mexico to evaluate the im-pacts of cool- and warm-season prescribed burningtreatments on the hydrological and ecological charac-teristics of the watersheds (Gottfried et al. 2000) andcollectively form the study area (Figure 1). These wa-tersheds, called the Cascabel watersheds, cover a totalarea of 182.6 ha. Individual watersheds range in areafrom approximately 24.0 ha (Watershed E) to 7.6 ha(Watershed G). The area is typical of oak savannas andopen woodlands of the region. The Cascabel Water-shed study area (lat 31�33�N, long 108�59�W) is large-ly within the Douglas Ranger District of the CoronadoNational Forest and adjacent to the Diamond A Ranchin New Mexico. The watersheds are situated between1,640 and 1,705 m in elevation, and the nearest long-term precipitation station indicates that annual precip-itation averages 597 mm, with nearly one-half occur-ring during the summer. Geological, physiological, andvegetation characteristics of the Cascabel watershedshave been previously described by Gottfried et al.(2000, 2002) and Neary and Gottfried (2004).
EXPERIMENTAL DESIGN ANDSAMPLING METHODS
Physical Components
Hydrology
The six watersheds on each side of the ridge weredivided into two groups of three (Figure 1). Each setwill have the two burning treatments and an untreatedcontrol treatment that will be assigned randomly. Theeffects of treatments will be assessed by comparing thechanges between pre- and post-treatment observationson the treated watersheds to comparable observationson the untreated watersheds. Streamflow data from in-dividual storms will be the primary parameter in theanalysis of treatment effects. The watersheds currentlyare being calibrated and treatments will be initiatedonce sufficient data are collected to describe pre-treat-ment conditions. The current 6-y drought has pro-longed the calibration period.
Each watershed contains two Parshall flumes: asmall flume with the capacity of 122 L/s to measurecommon low flows and a larger flume to measure an-ticipated large flows. Eight of the larger flumes havea capacity of 1,628 L/s and four have a capacity of1,209 L/s (Gottfried et al. 2000). A sediment dam wasconstructed in each watershed, and permanent channelcross-section stations have been established and mea-sured. Two complete weather stations and six supple-mental recording precipitation gauges have been es-tablished throughout the watershed area.
Erosion and Sedimentation—Channel Characteristics
An early decision was to determine the characterof all the channels in the 12 Cascabel watersheds be-cause of the observed differences in channel condi-tions and the wide range of values in peak dischargesthat were estimated by using field measurements andU.S. Geological Survey and Natural Resources Con-
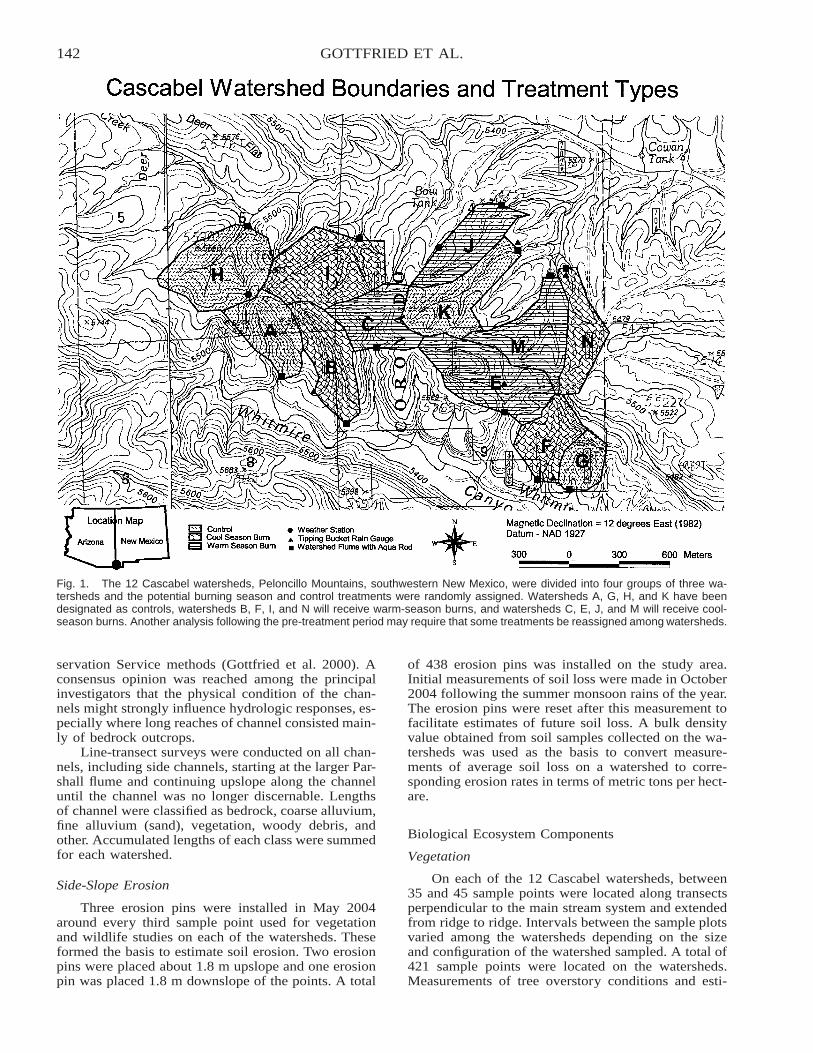
142 GOTTFRIED ET AL.
Fig. 1. The 12 Cascabel watersheds, Peloncillo Mountains, southwestern New Mexico, were divided into four groups of three wa-tersheds and the potential burning season and control treatments were randomly assigned. Watersheds A, G, H, and K have beendesignated as controls, watersheds B, F, I, and N will receive warm-season burns, and watersheds C, E, J, and M will receive cool-season burns. Another analysis following the pre-treatment period may require that some treatments be reassigned among watersheds.
servation Service methods (Gottfried et al. 2000). Aconsensus opinion was reached among the principalinvestigators that the physical condition of the chan-nels might strongly influence hydrologic responses, es-pecially where long reaches of channel consisted main-ly of bedrock outcrops.
Line-transect surveys were conducted on all chan-nels, including side channels, starting at the larger Par-shall flume and continuing upslope along the channeluntil the channel was no longer discernable. Lengthsof channel were classified as bedrock, coarse alluvium,fine alluvium (sand), vegetation, woody debris, andother. Accumulated lengths of each class were summedfor each watershed.
Side-Slope Erosion
Three erosion pins were installed in May 2004around every third sample point used for vegetationand wildlife studies on each of the watersheds. Theseformed the basis to estimate soil erosion. Two erosionpins were placed about 1.8 m upslope and one erosionpin was placed 1.8 m downslope of the points. A total
of 438 erosion pins was installed on the study area.Initial measurements of soil loss were made in October2004 following the summer monsoon rains of the year.The erosion pins were reset after this measurement tofacilitate estimates of future soil loss. A bulk densityvalue obtained from soil samples collected on the wa-tersheds was used as the basis to convert measure-ments of average soil loss on a watershed to corre-sponding erosion rates in terms of metric tons per hect-are.
Biological Ecosystem Components
Vegetation
On each of the 12 Cascabel watersheds, between35 and 45 sample points were located along transectsperpendicular to the main stream system and extendedfrom ridge to ridge. Intervals between the sample plotsvaried among the watersheds depending on the sizeand configuration of the watershed sampled. A total of421 sample points were located on the watersheds.Measurements of tree overstory conditions and esti-
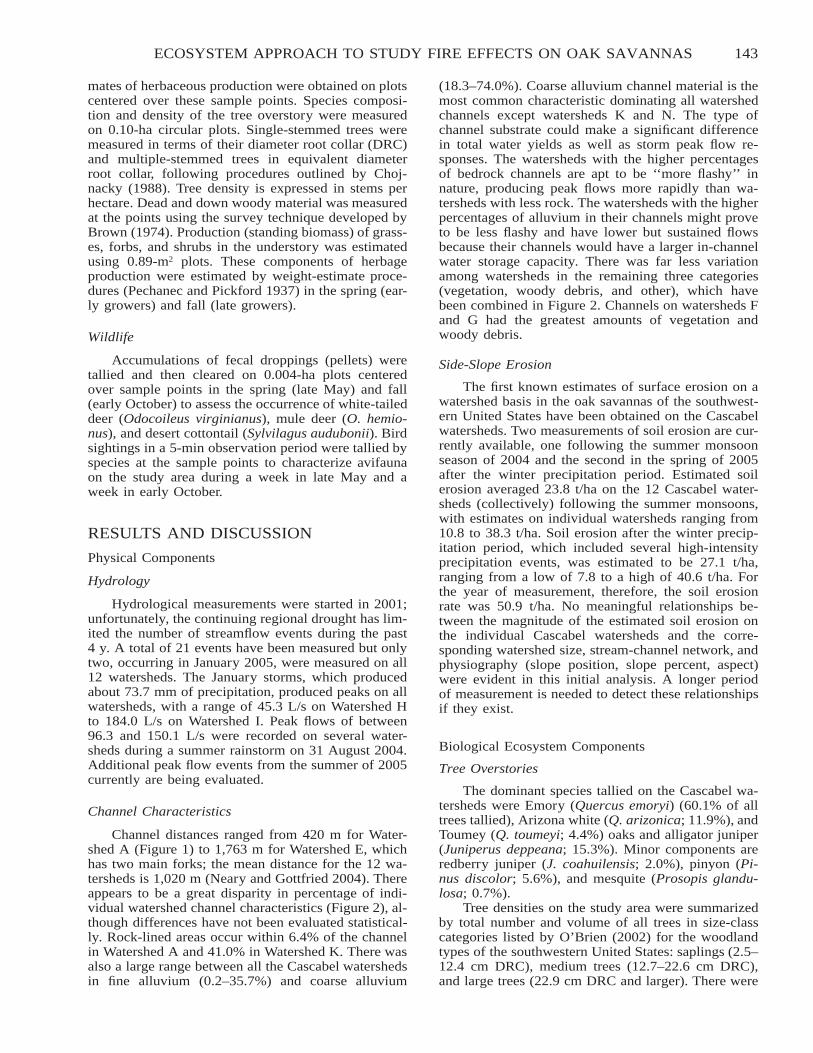
143ECOSYSTEM APPROACH TO STUDY FIRE EFFECTS ON OAK SAVANNAS
mates of herbaceous production were obtained on plotscentered over these sample points. Species composi-tion and density of the tree overstory were measuredon 0.10-ha circular plots. Single-stemmed trees weremeasured in terms of their diameter root collar (DRC)and multiple-stemmed trees in equivalent diameterroot collar, following procedures outlined by Choj-nacky (1988). Tree density is expressed in stems perhectare. Dead and down woody material was measuredat the points using the survey technique developed byBrown (1974). Production (standing biomass) of grass-es, forbs, and shrubs in the understory was estimatedusing 0.89-m2 plots. These components of herbageproduction were estimated by weight-estimate proce-dures (Pechanec and Pickford 1937) in the spring (ear-ly growers) and fall (late growers).
Wildlife
Accumulations of fecal droppings (pellets) weretallied and then cleared on 0.004-ha plots centeredover sample points in the spring (late May) and fall(early October) to assess the occurrence of white-taileddeer (Odocoileus virginianus), mule deer (O. hemio-nus), and desert cottontail (Sylvilagus audubonii). Birdsightings in a 5-min observation period were tallied byspecies at the sample points to characterize avifaunaon the study area during a week in late May and aweek in early October.
RESULTS AND DISCUSSION
Physical Components
Hydrology
Hydrological measurements were started in 2001;unfortunately, the continuing regional drought has lim-ited the number of streamflow events during the past4 y. A total of 21 events have been measured but onlytwo, occurring in January 2005, were measured on all12 watersheds. The January storms, which producedabout 73.7 mm of precipitation, produced peaks on allwatersheds, with a range of 45.3 L/s on Watershed Hto 184.0 L/s on Watershed I. Peak flows of between96.3 and 150.1 L/s were recorded on several water-sheds during a summer rainstorm on 31 August 2004.Additional peak flow events from the summer of 2005currently are being evaluated.
Channel Characteristics
Channel distances ranged from 420 m for Water-shed A (Figure 1) to 1,763 m for Watershed E, whichhas two main forks; the mean distance for the 12 wa-tersheds is 1,020 m (Neary and Gottfried 2004). Thereappears to be a great disparity in percentage of indi-vidual watershed channel characteristics (Figure 2), al-though differences have not been evaluated statistical-ly. Rock-lined areas occur within 6.4% of the channelin Watershed A and 41.0% in Watershed K. There wasalso a large range between all the Cascabel watershedsin fine alluvium (0.2–35.7%) and coarse alluvium
(18.3–74.0%). Coarse alluvium channel material is themost common characteristic dominating all watershedchannels except watersheds K and N. The type ofchannel substrate could make a significant differencein total water yields as well as storm peak flow re-sponses. The watersheds with the higher percentagesof bedrock channels are apt to be ‘‘more flashy’’ innature, producing peak flows more rapidly than wa-tersheds with less rock. The watersheds with the higherpercentages of alluvium in their channels might proveto be less flashy and have lower but sustained flowsbecause their channels would have a larger in-channelwater storage capacity. There was far less variationamong watersheds in the remaining three categories(vegetation, woody debris, and other), which havebeen combined in Figure 2. Channels on watersheds Fand G had the greatest amounts of vegetation andwoody debris.
Side-Slope Erosion
The first known estimates of surface erosion on awatershed basis in the oak savannas of the southwest-ern United States have been obtained on the Cascabelwatersheds. Two measurements of soil erosion are cur-rently available, one following the summer monsoonseason of 2004 and the second in the spring of 2005after the winter precipitation period. Estimated soilerosion averaged 23.8 t/ha on the 12 Cascabel water-sheds (collectively) following the summer monsoons,with estimates on individual watersheds ranging from10.8 to 38.3 t/ha. Soil erosion after the winter precip-itation period, which included several high-intensityprecipitation events, was estimated to be 27.1 t/ha,ranging from a low of 7.8 to a high of 40.6 t/ha. Forthe year of measurement, therefore, the soil erosionrate was 50.9 t/ha. No meaningful relationships be-tween the magnitude of the estimated soil erosion onthe individual Cascabel watersheds and the corre-sponding watershed size, stream-channel network, andphysiography (slope position, slope percent, aspect)were evident in this initial analysis. A longer periodof measurement is needed to detect these relationshipsif they exist.
Biological Ecosystem Components
Tree Overstories
The dominant species tallied on the Cascabel wa-tersheds were Emory (Quercus emoryi) (60.1% of alltrees tallied), Arizona white (Q. arizonica; 11.9%), andToumey (Q. toumeyi; 4.4%) oaks and alligator juniper(Juniperus deppeana; 15.3%). Minor components areredberry juniper (J. coahuilensis; 2.0%), pinyon (Pi-nus discolor; 5.6%), and mesquite (Prosopis glandu-losa; 0.7%).
Tree densities on the study area were summarizedby total number and volume of all trees in size-classcategories listed by O’Brien (2002) for the woodlandtypes of the southwestern United States: saplings (2.5–12.4 cm DRC), medium trees (12.7–22.6 cm DRC),and large trees (22.9 cm DRC and larger). There were
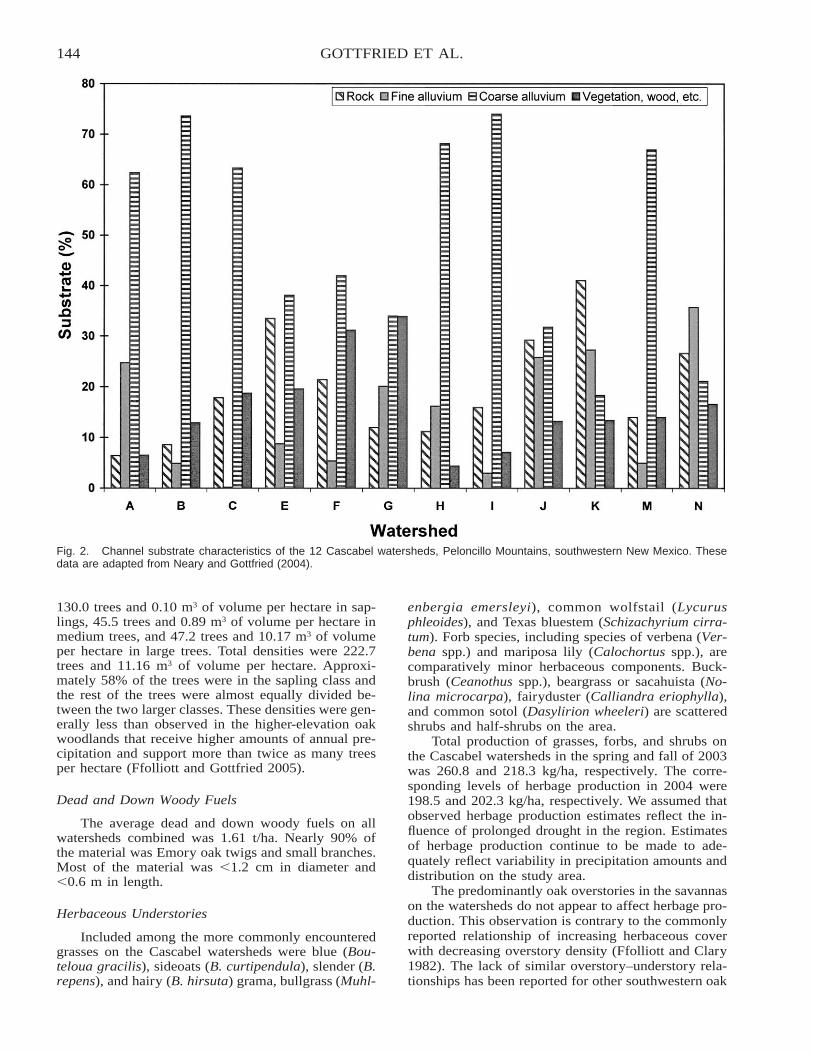
144 GOTTFRIED ET AL.
Fig. 2. Channel substrate characteristics of the 12 Cascabel watersheds, Peloncillo Mountains, southwestern New Mexico. Thesedata are adapted from Neary and Gottfried (2004).
130.0 trees and 0.10 m3 of volume per hectare in sap-lings, 45.5 trees and 0.89 m3 of volume per hectare inmedium trees, and 47.2 trees and 10.17 m3 of volumeper hectare in large trees. Total densities were 222.7trees and 11.16 m3 of volume per hectare. Approxi-mately 58% of the trees were in the sapling class andthe rest of the trees were almost equally divided be-tween the two larger classes. These densities were gen-erally less than observed in the higher-elevation oakwoodlands that receive higher amounts of annual pre-cipitation and support more than twice as many treesper hectare (Ffolliott and Gottfried 2005).
Dead and Down Woody Fuels
The average dead and down woody fuels on allwatersheds combined was 1.61 t/ha. Nearly 90% ofthe material was Emory oak twigs and small branches.Most of the material was �1.2 cm in diameter and�0.6 m in length.
Herbaceous Understories
Included among the more commonly encounteredgrasses on the Cascabel watersheds were blue (Bou-teloua gracilis), sideoats (B. curtipendula), slender (B.repens), and hairy (B. hirsuta) grama, bullgrass (Muhl-
enbergia emersleyi), common wolfstail (Lycurusphleoides), and Texas bluestem (Schizachyrium cirra-tum). Forb species, including species of verbena (Ver-bena spp.) and mariposa lily (Calochortus spp.), arecomparatively minor herbaceous components. Buck-brush (Ceanothus spp.), beargrass or sacahuista (No-lina microcarpa), fairyduster (Calliandra eriophylla),and common sotol (Dasylirion wheeleri) are scatteredshrubs and half-shrubs on the area.
Total production of grasses, forbs, and shrubs onthe Cascabel watersheds in the spring and fall of 2003was 260.8 and 218.3 kg/ha, respectively. The corre-sponding levels of herbage production in 2004 were198.5 and 202.3 kg/ha, respectively. We assumed thatobserved herbage production estimates reflect the in-fluence of prolonged drought in the region. Estimatesof herbage production continue to be made to ade-quately reflect variability in precipitation amounts anddistribution on the study area.
The predominantly oak overstories in the savannason the watersheds do not appear to affect herbage pro-duction. This observation is contrary to the commonlyreported relationship of increasing herbaceous coverwith decreasing overstory density (Ffolliott and Clary1982). The lack of similar overstory–understory rela-tionships has been reported for other southwestern oak
145ECOSYSTEM APPROACH TO STUDY FIRE EFFECTS ON OAK SAVANNAS
ecosystems (Ffolliott and Gottfried 2005). However,the reverse situation might not be true. McClaran andMcPherson (1999) reported that a dense cover of pe-rennial grass can limit successful Emory oak regen-eration on ungrazed sites in similar oak ecosystems.Further study is necessary to verify the overstory–un-derstory relationships or to identify other importantvariables, such as crown characteristics, that may in-fluence herbaceous production.
Utilization of the herbaceous plants by herbivoreshas averaged �5% in both years of study. However,cattle had been removed from the Cascabel watershedsand the surrounding areas by local ranchers for severalmonths in the summer and early fall of 2004 becauseof the prolonged period of below-average annual pre-cipitation. Populations of indigenous herbivores havealso been low on the watersheds in recent years.
Wildlife
Abundance and habitat preferences of birds andsome of the other wildlife found in the densely struc-tured oak woodlands of the southwestern United Statesare known for some of the representative species, butlittle information on these topics is available for themore open oak savannas of the region. White-taileddeer on the Cascabel watersheds are largely scatteredthroughout the year. However, population estimates areunreliable because of the limited time that pelletcounts have been tallied. Patterns of repeated obser-vations of pellet accumulations and habitat conditions(vegetation, physiography, etc.) at the sample pointswere inconclusive. Findings and conclusions for desertcottontail were similar. A larger number of birds anda greater diversity of species were observed on theCascabel watersheds in the spring (May) than in thefall (October) (Jones et al. 2005). While some species,such as bushtit (Psaltriparus minimus), Mexican jay(Aphelocoma ultramarina), juniper titmouse (Baeolo-phus ridgwayi), mourning dove (Zenaida macroura),and scaled quail (Callipepla squamata), were talliedin both observation periods, other species such asdusky-capped flycatcher (Myiarchus tuberculifer),northern mockingbird (Mimus polyglottos), and turkeyvulture (Cathartes aura) were observed in spring butnot in fall. Montezuma quail (Cyrtonyx montezumae)were observed only in the fall. It remains to be seenif this pattern of abundance and species diversity con-tinues to persist on the watersheds in the future. Nomeaningful relationships between bird sightings andthe habitat conditions represented by the sample pointswere observed.
CONCLUSIONS
Researchers and land managers are attempting tolearn more about the oak ecosystems of the south-western United States and northern Mexico so thatsound land stewardship can be maintained or en-hanced. Learning of the impacts of the planned rein-troductions of fire into these ecosystems is a primarycomponent in these efforts. Studies on the hydrology
and erosion–sedimentation dynamics and the relatedbiological impacts of prescribed fire treatments in theoak savannas in the southwestern Borderlands is a fo-cus of this research project. We described initial resultsof the pre-treatment phase of the study. Experimentaldesigns and sampling methods were selected to be ableto detect statistical differences in the measured eco-system characteristics between the pre-treatment andpost-treatment conditions. The calibration period willbe monitored until a sufficient number of storm eventsis observed to provide estimated statistical power of0.90 to detect hydrologic changes of 100% with a sig-nificance of 0.05. Analyses of the biological resourcesresponses assume a level of significance between 0.15and 0.20.
Detectable changes can only be surmised at thistime. Nevertheless, we anticipate post-treatmentchanges in the timing of streamflow and dischargerates. Side-slope erosion rates are likely to increase,leading to changes in channel conditions. Species com-positions might change and the production of grasses,forbs, and shrubs will likely increase after the pre-scribed fire treatments as a result of the decrease intree overstory densities and removal of litter and dufflayers. Increased browse should be available to deerpopulations because the oak species on the watershedsreadily sprout following fire. Ground-nesting avifaunais anticipated to decrease in numbers and diversity,while avifauna nesting in standing dead trees (snags)should increase. Reducing the loadings of dead anddown woody material and other fuel fractions, one ofthe main objectives of the prescribed fire treatments,should occur. All of these possible changes will beevaluated and contrasted within the context of theplanned cool-season and warm-season fires.
Detection of these changes, if they occur, will bedetermined in two ways. If post-treatment weather re-gimes are similar to those encountered in the pre-treat-ment phase—the latter representing a drought condi-tion—comparisons of before and after ecosystem char-acteristics should provide the necessary information.However, if the two weather regimes are significantlydifferent, comparison will be made between changeson burned and unburned control watersheds. Both ap-proaches are planned in an effort to provide the mostcomprehensive picture of the effects of prescribed firein the oak savannas.
ACKNOWLEDGMENTSResearch on the Cascabel watersheds would not
be possible without cooperation among a large groupof individuals and organizations. The list of partnersincludes the Malpai Borderlands Group; Diamond ARanch; Cascabel Ranch; USDA Forest Service-Coro-nado National Forest Supervisor’s Office; DouglasRanger District; Southwestern Region Terrestrial Eco-system Survey; USDA Forest Service, Rocky Moun-tain Research Station; USDA Natural Resources Con-servation Service, School of Natural Resources, Uni-versity of Arizona; Arizona Geological Survey; andthe Arid Lands Project.
146 GOTTFRIED ET AL.
LITERATURE CITED
Brown, J.K. 1974. Handbook for inventorying downed woodymaterial. General Technical Report INT-16, U.S. Depart-ment of Agriculture, Forest Service, Intermountain Forestand Range Experiment Station, Ogden, UT.
Chojnacky, D.C. 1988. Juniper, pinyon, oak, and mesquite vol-ume equations for Arizona. Research Paper INT-391, U.S.Department of Agriculture, Forest Service, IntermountainResearch Station, Ogden, UT.
DeBano, L.F., P.F. Ffolliott, G.J. Gottfried, R.H. Hamre, and C.B.Edminster (technical coordinators). 1995. Biodiversity andmanagement of the Madrean Archipelago: the sky islandsof southwestern United States and northern Mexico. Gen-eral Technical Report RM-264, U.S. Department of Agri-culture, Forest Service, Rocky Mountain Forest and RangeExperiment Station, Fort Collins, CO.
Ffolliott, P.F. 1999. Encinal woodlands in the southwestern UnitedStates. Pages 69–81 in P.F. Ffolliott and A. Ortega-Rubio(eds.). Ecology and management of forests, woodlands, andshrublands in the dryland regions of the United States andMexico: perspectives for the 21st century. Centro de Inves-tigaciones Biologicas del Noroeste, La Paz, Mexico.
Ffolliott, P.F. 2002. Ecology and management of evergreen oakwoodlands in Arizona and New Mexico. Pages 304–316 inW.J. McShea and W.M. Healy (eds.). Oak forest ecosys-tems: ecology and management for wildlife. Johns HopkinsUniversity Press, Baltimore, MD.
Ffolliott, P.F., and W.P. Clary. 1982. Understory–overstory veg-etation relationships: an annotated bibliography. GeneralTechnical Report INT-136, U.S. Department of Agriculture,Forest Service, Intermountain Research Station, Ogden, UT.
Ffolliott, P.F., and G.J. Gottfried. 2005. Vegetation characteristicsof oak savannas in the southwestern United States: a com-parative analysis with oak woodlands in the region. Pages399–402 in G.J. Gottfried, B.S. Gebow, L.G. Eskew, andC.B. Edminster (compilers). Connecting mountain islandsand desert seas: biodiversity and management of the Mad-rean Archipelago. Proceedings RMRS-P-36, U.S. Depart-ment of Agriculture, Forest Service, Rocky Mountain Re-search Station, Fort Collins, CO.
Gottfried, G.J., D.G. Neary, and R.J. Bemis. 2000. Watershedcharacteristics of oak savannas in the southwestern border-lands. Hydrology and Water Resources in Arizona and theSouthwest 30:21–28.
Gottfried, G.J., D.G. Neary, and R.J. Bemis. 2002. Assessing theimpacts of prescribed burning on soil and water resourcesof oak savannas in the southwestern United States. Pages115–122 in Assessing capabilities of soil and water resourc-es in drylands: the role of information retrieval and dissem-ination technologies. International Arid Lands Consortium,20–25 Oct 2002, Tucson, AZ.
Holycross, A.T., L.J. Smith, C.W. Painter, and M.E. Douglas.1999. Effects of prescribed fire on montane rattlesnakes:endangered species and ecosystem restoration. Pages 109–110 in G.J. Gottfried, L.G. Eskew, C.G. Curtin, and C.B.Edminster (compilers). Toward integrated research, landmanagement, and ecosystem protection in the Malpai Bor-derlands: conference summary. Proceedings RMRS-P-10,
U.S. Department of Agriculture, Forest Service, RockyMountain Research Station, Fort Collins, CO.
Jones, W.D., C.M. Jones, P.F. Ffolliott, and G.J. Gottfried. 2005.Abundance of birds in the oak savannas of the southwesternUnited States. Pages 523–524 in G.J. Gottfried, B.S. Ge-bow, L.G. Eskew, and C.B. Edminster (compilers). Con-necting mountain islands and desert seas: biodiversity andmanagement of the Madrean Archipelago. ProceedingsRMRS-P-36, U.S. Department of Agriculture, Forest Ser-vice, Rocky Mountain Research Station, Fort Collins, CO.
Kaib, M., T.W. Swetnam, and C.H. Baisan. 1999. Fire history incanyon pine–oak forests, intervening desert grasslands, andhigher-elevation mixed-conifer forests of the SouthwestBorderlands. Pages 57–64 in G.J. Gottfried, L.G. Eskew,C.G. Curtin, and C.B. Edminster (compilers). Toward in-tegrated research, land management, and ecosystem protec-tion in the Malpai Borderlands: conference summary. Pro-ceedings RMRS-P-10, U.S. Department of Agriculture, For-est Service, Rocky Mountain Research Station, Fort Collins,CO.
Kaufmann, M.R., R.T. Graham, D.A. Boyce Jr., W.H. Moir, L.Perry, R.T. Reynolds, P. Mehlhop, C.B. Edminster, W.M.Block, and P.S. Corn. 1994. An ecological basis for eco-system management. General Technical Report RM-246,U.S. Department of Agriculture, Forest Service, RockyMountain Forest and Range Experiment Station, Fort Col-lins, CO.
McClaran, M.P., and G.R. McPherson. 1999. Oak savanna in theAmerican Southwest. Pages 275–287 in R.C. Anderson, J.S.Fralish, and J.M. Baskin (eds.). Savannas, barrens, and rockoutcrop plant communities of North America. CambridgeUniversity Press, New York.
McPherson, G.R. 1992. Ecology of oak woodlands in Arizona.Pages 24–33 in P.F. Ffolliott, G.J. Gottfried, D.A. Bennett,V.M. Hernandez C., A. Ortega-Rubio, and R.H. Hamre(technical coordinators). Ecology and management of oakand associated woodlands. General Technical Report RM-218, U.S. Department of Agriculture, Forest Service, RockyMountain Forest and Range Experiment Station, Fort Col-lins, CO.
McPherson, G.R. 1997. Ecology and management of NorthAmerican savannas. University of Arizona Press, Tucson.
Neary, D.G., and G.J. Gottfried. 2004. Geomorphology of smallwatersheds in an oak encinal in the Peloncillo Mountains.Hydrology and Water Resources in Arizona and the South-west 34:65–71.
O’Brien, R.A. 2002. Arizona’s forest resources, 1999. ResourceBulletin RMRS-RB-2, U.S. Department of Agriculture, For-est Service, Rocky Mountain Research Station, Ogden, UT.
Pechanec, J.F., and G.D. Pickford. 1937. A weight estimatemethod for determination of range or pasture production.Journal of the American Society of Agronomy 29:894–904.
Slauson, L., V. Dalton, and D. Dalton. 1999. Effects of pre-scribed burning on the Palmer agave and lesser long-nosedbat. Pages 111–114 in G.J. Gottfried, L.G. Eskew, C.G.Curtin, and C.B. Edminster (compilers). Toward integratedresearch, land management, and ecosystem protection in theMalpai Borderlands: conference summary. ProceedingsRMRS-P-10, U.S. Department of Agriculture, Forest Ser-vice, Rocky Mountain Research Station, Fort Collins, CO.
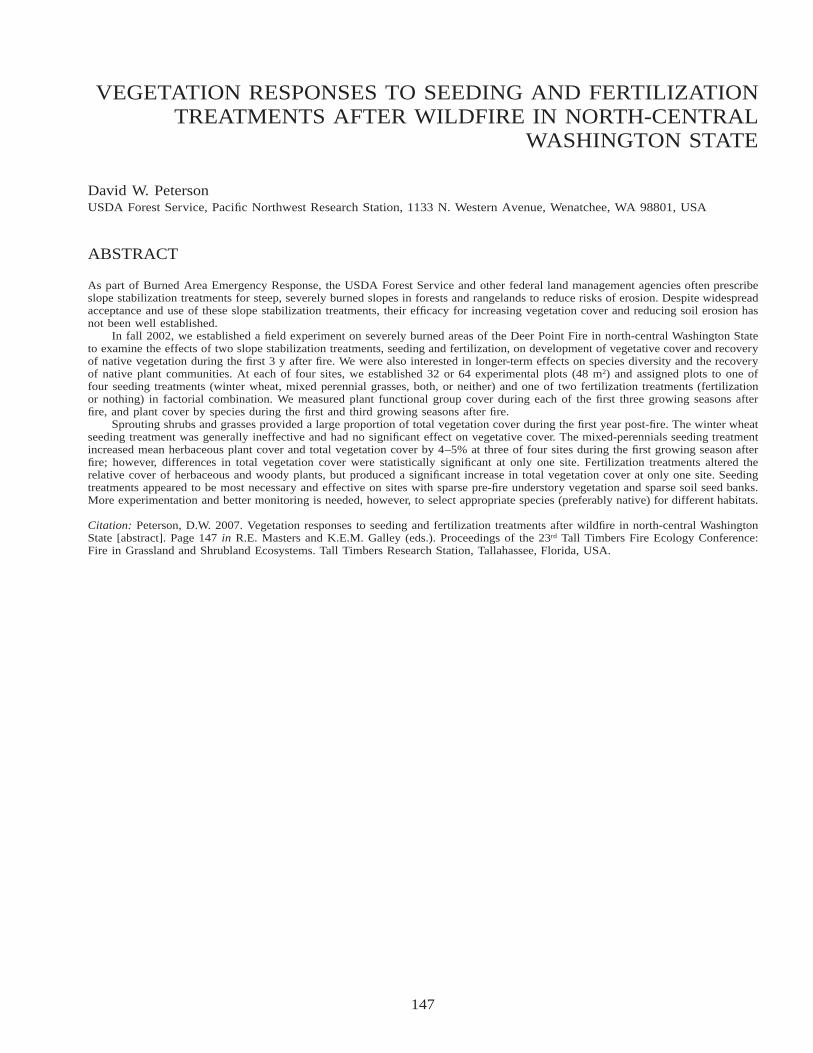
147
VEGETATION RESPONSES TO SEEDING AND FERTILIZATIONTREATMENTS AFTER WILDFIRE IN NORTH-CENTRAL
WASHINGTON STATE
David W. PetersonUSDA Forest Service, Pacific Northwest Research Station, 1133 N. Western Avenue, Wenatchee, WA 98801, USA
ABSTRACT
As part of Burned Area Emergency Response, the USDA Forest Service and other federal land management agencies often prescribeslope stabilization treatments for steep, severely burned slopes in forests and rangelands to reduce risks of erosion. Despite widespreadacceptance and use of these slope stabilization treatments, their efficacy for increasing vegetation cover and reducing soil erosion hasnot been well established.
In fall 2002, we established a field experiment on severely burned areas of the Deer Point Fire in north-central Washington Stateto examine the effects of two slope stabilization treatments, seeding and fertilization, on development of vegetative cover and recoveryof native vegetation during the first 3 y after fire. We were also interested in longer-term effects on species diversity and the recoveryof native plant communities. At each of four sites, we established 32 or 64 experimental plots (48 m2) and assigned plots to one offour seeding treatments (winter wheat, mixed perennial grasses, both, or neither) and one of two fertilization treatments (fertilizationor nothing) in factorial combination. We measured plant functional group cover during each of the first three growing seasons afterfire, and plant cover by species during the first and third growing seasons after fire.
Sprouting shrubs and grasses provided a large proportion of total vegetation cover during the first year post-fire. The winter wheatseeding treatment was generally ineffective and had no significant effect on vegetative cover. The mixed-perennials seeding treatmentincreased mean herbaceous plant cover and total vegetation cover by 4–5% at three of four sites during the first growing season afterfire; however, differences in total vegetation cover were statistically significant at only one site. Fertilization treatments altered therelative cover of herbaceous and woody plants, but produced a significant increase in total vegetation cover at only one site. Seedingtreatments appeared to be most necessary and effective on sites with sparse pre-fire understory vegetation and sparse soil seed banks.More experimentation and better monitoring is needed, however, to select appropriate species (preferably native) for different habitats.
Citation: Peterson, D.W. 2007. Vegetation responses to seeding and fertilization treatments after wildfire in north-central WashingtonState [abstract]. Page 147 in R.E. Masters and K.E.M. Galley (eds.). Proceedings of the 23rd Tall Timbers Fire Ecology Conference:Fire in Grassland and Shrubland Ecosystems. Tall Timbers Research Station, Tallahassee, Florida, USA.

148
MANAGEMENT CHALLENGES AND OPPORTUNITIESRELATED TO PRAIRIE GROUSE; A PICTORIAL OVERVIEW
Steve K. SherrodUniversity of Oklahoma, Sutton Avian Research Center, P.O. Box 2007, Bartlesville, OK 74005, USA
ABSTRACT
Grouse species occupying the Great Plains and associated habitats include greater sage-grouse (Centrocercus urophasianus), Gunnisonsage-grouse (C. minimus), greater prairie-chicken (Tympanuchus cupido pinnatus), lesser prairie-chicken (T. pallidicinctus), and sharp-tailed grouse (T. phasianellus). All of these species have experienced significant declines in numbers during the last half century. Theheath hen (T. cupido cupido) and Attwater’s prairie-chicken (T. cupido attwateri) are extinct and almost extinct, respectively.
Management challenges and opportunities associated with plains grouse declines and potential recoveries are myriad and includebut are not limited to various facets of livestock management, farming activities, farm conservation programs, use of fire, habitatfragmentation, predation, harvest, road management, power lines, towers, fences, resource extraction to include wind power, forestrypractices, habitat conversion, mowing, chemical use, noxious weeds, hydrology, development, recreation, habitat acquisition, andeasements.
The North American Grouse Management Plan considers these challenges, and this presentation provides pictorial understandingof many of the problems involved as well as a brief discussion of associated impacts. Rather than an Exxon Valdez or Mount St.Helens type of catastrophic destruction, habitat in the Great Plains is being slowly chipped away, piece by piece, with little planningor regulation. In many cases, multiple factors combine as threats to synergistically impact grouse survival. There are many fire-relatedcategories such as the brush-control problems in South Texas where we are trying to reintroduce Attwater’s prairie-chicken. Fire couldsolve this problem, but there is great reluctance to use it. A similar situation exists with sharp-tailed grouse where forest-successionproblems in the north country can completely eliminate once suitable sharp-tailed grouse habitat unless fire or mechanical tree removalis utilized. Again, there is a reluctance to use fire due to perceived danger. Fire is only one aspect in the revival of grasslands, but animportant one. As with numerous other management concerns–opportunities, fire is essential for management that results in healthyhabitats. Yet too much or too little, both spatially and temporally, can result in a decidedly negative impact for management of grouseof the plains.
Citation: Sherrod, S.K. 2007. Management challenges and opportunities related to prairie grouse; a pictorial overview [abstract]. Page148 in R.E. Masters and K.E.M. Galley (eds.). Proceedings of the 23rd Tall Timbers Fire Ecology Conference: Fire in Grassland andShrubland Ecosystems. Tall Timbers Research Station, Tallahassee, Florida, USA.
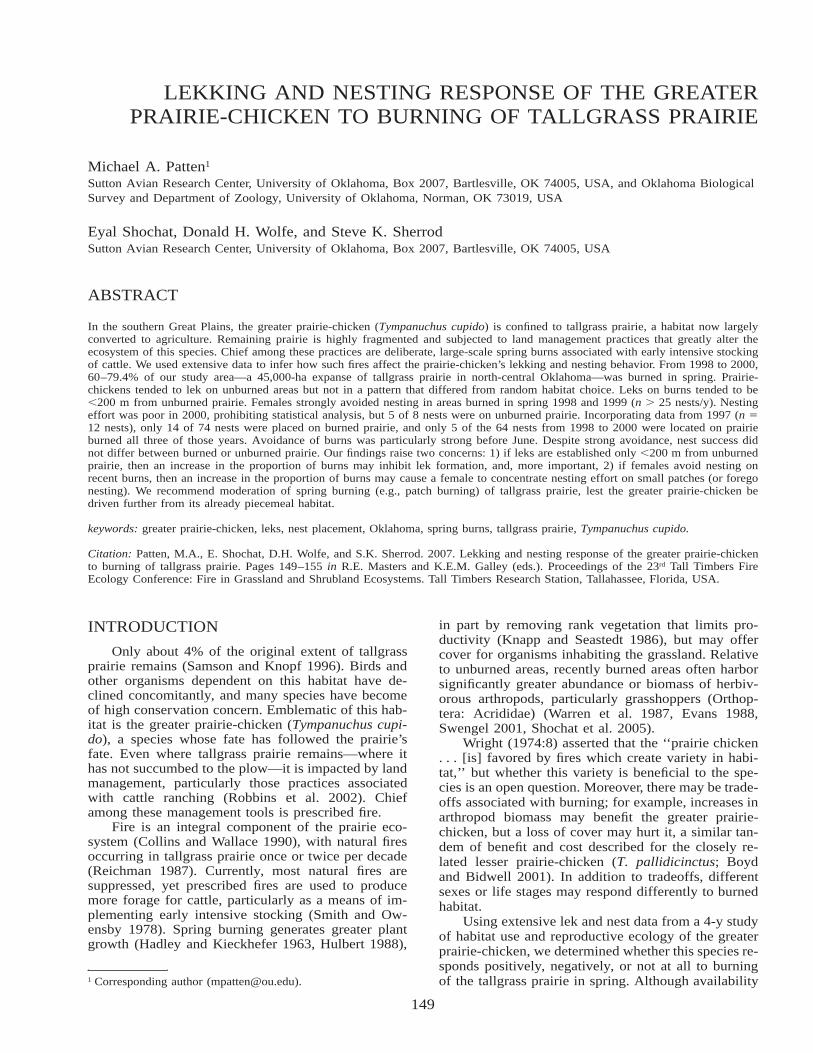
149
LEKKING AND NESTING RESPONSE OF THE GREATERPRAIRIE-CHICKEN TO BURNING OF TALLGRASS PRAIRIE
Michael A. Patten1
Sutton Avian Research Center, University of Oklahoma, Box 2007, Bartlesville, OK 74005, USA, and Oklahoma BiologicalSurvey and Department of Zoology, University of Oklahoma, Norman, OK 73019, USA
Eyal Shochat, Donald H. Wolfe, and Steve K. SherrodSutton Avian Research Center, University of Oklahoma, Box 2007, Bartlesville, OK 74005, USA
ABSTRACT
In the southern Great Plains, the greater prairie-chicken (Tympanuchus cupido) is confined to tallgrass prairie, a habitat now largelyconverted to agriculture. Remaining prairie is highly fragmented and subjected to land management practices that greatly alter theecosystem of this species. Chief among these practices are deliberate, large-scale spring burns associated with early intensive stockingof cattle. We used extensive data to infer how such fires affect the prairie-chicken’s lekking and nesting behavior. From 1998 to 2000,60–79.4% of our study area—a 45,000-ha expanse of tallgrass prairie in north-central Oklahoma—was burned in spring. Prairie-chickens tended to lek on unburned areas but not in a pattern that differed from random habitat choice. Leks on burns tended to be�200 m from unburned prairie. Females strongly avoided nesting in areas burned in spring 1998 and 1999 (n � 25 nests/y). Nestingeffort was poor in 2000, prohibiting statistical analysis, but 5 of 8 nests were on unburned prairie. Incorporating data from 1997 (n �12 nests), only 14 of 74 nests were placed on burned prairie, and only 5 of the 64 nests from 1998 to 2000 were located on prairieburned all three of those years. Avoidance of burns was particularly strong before June. Despite strong avoidance, nest success didnot differ between burned or unburned prairie. Our findings raise two concerns: 1) if leks are established only �200 m from unburnedprairie, then an increase in the proportion of burns may inhibit lek formation, and, more important, 2) if females avoid nesting onrecent burns, then an increase in the proportion of burns may cause a female to concentrate nesting effort on small patches (or foregonesting). We recommend moderation of spring burning (e.g., patch burning) of tallgrass prairie, lest the greater prairie-chicken bedriven further from its already piecemeal habitat.
keywords: greater prairie-chicken, leks, nest placement, Oklahoma, spring burns, tallgrass prairie, Tympanuchus cupido.
Citation: Patten, M.A., E. Shochat, D.H. Wolfe, and S.K. Sherrod. 2007. Lekking and nesting response of the greater prairie-chickento burning of tallgrass prairie. Pages 149–155 in R.E. Masters and K.E.M. Galley (eds.). Proceedings of the 23rd Tall Timbers FireEcology Conference: Fire in Grassland and Shrubland Ecosystems. Tall Timbers Research Station, Tallahassee, Florida, USA.
INTRODUCTION
Only about 4% of the original extent of tallgrassprairie remains (Samson and Knopf 1996). Birds andother organisms dependent on this habitat have de-clined concomitantly, and many species have becomeof high conservation concern. Emblematic of this hab-itat is the greater prairie-chicken (Tympanuchus cupi-do), a species whose fate has followed the prairie’sfate. Even where tallgrass prairie remains—where ithas not succumbed to the plow—it is impacted by landmanagement, particularly those practices associatedwith cattle ranching (Robbins et al. 2002). Chiefamong these management tools is prescribed fire.
Fire is an integral component of the prairie eco-system (Collins and Wallace 1990), with natural firesoccurring in tallgrass prairie once or twice per decade(Reichman 1987). Currently, most natural fires aresuppressed, yet prescribed fires are used to producemore forage for cattle, particularly as a means of im-plementing early intensive stocking (Smith and Ow-ensby 1978). Spring burning generates greater plantgrowth (Hadley and Kieckhefer 1963, Hulbert 1988),
1 Corresponding author ([email protected]).
in part by removing rank vegetation that limits pro-ductivity (Knapp and Seastedt 1986), but may offercover for organisms inhabiting the grassland. Relativeto unburned areas, recently burned areas often harborsignificantly greater abundance or biomass of herbiv-orous arthropods, particularly grasshoppers (Orthop-tera: Acrididae) (Warren et al. 1987, Evans 1988,Swengel 2001, Shochat et al. 2005).
Wright (1974:8) asserted that the ‘‘prairie chicken. . . [is] favored by fires which create variety in habi-tat,’’ but whether this variety is beneficial to the spe-cies is an open question. Moreover, there may be trade-offs associated with burning; for example, increases inarthropod biomass may benefit the greater prairie-chicken, but a loss of cover may hurt it, a similar tan-dem of benefit and cost described for the closely re-lated lesser prairie-chicken (T. pallidicinctus; Boydand Bidwell 2001). In addition to tradeoffs, differentsexes or life stages may respond differently to burnedhabitat.
Using extensive lek and nest data from a 4-y studyof habitat use and reproductive ecology of the greaterprairie-chicken, we determined whether this species re-sponds positively, negatively, or not at all to burningof the tallgrass prairie in spring. Although availability
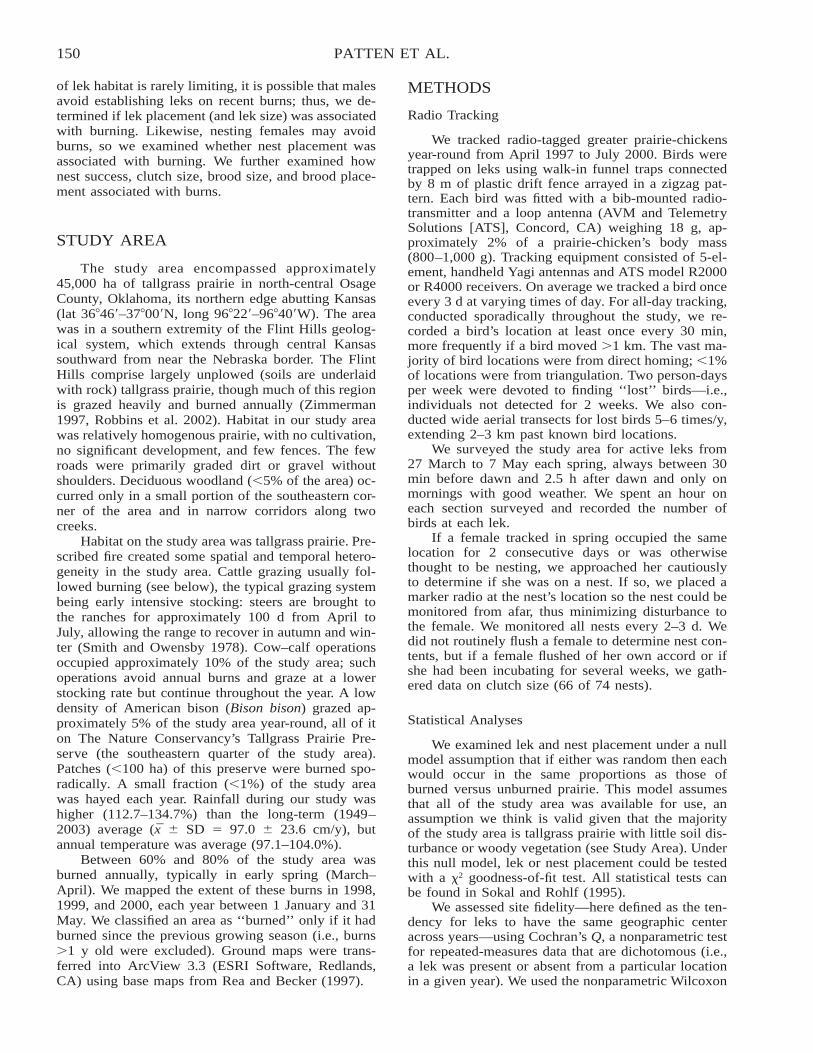
150 PATTEN ET AL.
of lek habitat is rarely limiting, it is possible that malesavoid establishing leks on recent burns; thus, we de-termined if lek placement (and lek size) was associatedwith burning. Likewise, nesting females may avoidburns, so we examined whether nest placement wasassociated with burning. We further examined hownest success, clutch size, brood size, and brood place-ment associated with burns.
STUDY AREA
The study area encompassed approximately45,000 ha of tallgrass prairie in north-central OsageCounty, Oklahoma, its northern edge abutting Kansas(lat 36�46�–37�00�N, long 96�22�–96�40�W). The areawas in a southern extremity of the Flint Hills geolog-ical system, which extends through central Kansassouthward from near the Nebraska border. The FlintHills comprise largely unplowed (soils are underlaidwith rock) tallgrass prairie, though much of this regionis grazed heavily and burned annually (Zimmerman1997, Robbins et al. 2002). Habitat in our study areawas relatively homogenous prairie, with no cultivation,no significant development, and few fences. The fewroads were primarily graded dirt or gravel withoutshoulders. Deciduous woodland (�5% of the area) oc-curred only in a small portion of the southeastern cor-ner of the area and in narrow corridors along twocreeks.
Habitat on the study area was tallgrass prairie. Pre-scribed fire created some spatial and temporal hetero-geneity in the study area. Cattle grazing usually fol-lowed burning (see below), the typical grazing systembeing early intensive stocking: steers are brought tothe ranches for approximately 100 d from April toJuly, allowing the range to recover in autumn and win-ter (Smith and Owensby 1978). Cow–calf operationsoccupied approximately 10% of the study area; suchoperations avoid annual burns and graze at a lowerstocking rate but continue throughout the year. A lowdensity of American bison (Bison bison) grazed ap-proximately 5% of the study area year-round, all of iton The Nature Conservancy’s Tallgrass Prairie Pre-serve (the southeastern quarter of the study area).Patches (�100 ha) of this preserve were burned spo-radically. A small fraction (�1%) of the study areawas hayed each year. Rainfall during our study washigher (112.7–134.7%) than the long-term (1949–2003) average (x � SD � 97.0 � 23.6 cm/y), butannual temperature was average (97.1–104.0%).
Between 60% and 80% of the study area wasburned annually, typically in early spring (March–April). We mapped the extent of these burns in 1998,1999, and 2000, each year between 1 January and 31May. We classified an area as ‘‘burned’’ only if it hadburned since the previous growing season (i.e., burns�1 y old were excluded). Ground maps were trans-ferred into ArcView 3.3 (ESRI Software, Redlands,CA) using base maps from Rea and Becker (1997).
METHODS
Radio Tracking
We tracked radio-tagged greater prairie-chickensyear-round from April 1997 to July 2000. Birds weretrapped on leks using walk-in funnel traps connectedby 8 m of plastic drift fence arrayed in a zigzag pat-tern. Each bird was fitted with a bib-mounted radio-transmitter and a loop antenna (AVM and TelemetrySolutions [ATS], Concord, CA) weighing 18 g, ap-proximately 2% of a prairie-chicken’s body mass(800–1,000 g). Tracking equipment consisted of 5-el-ement, handheld Yagi antennas and ATS model R2000or R4000 receivers. On average we tracked a bird onceevery 3 d at varying times of day. For all-day tracking,conducted sporadically throughout the study, we re-corded a bird’s location at least once every 30 min,more frequently if a bird moved �1 km. The vast ma-jority of bird locations were from direct homing; �1%of locations were from triangulation. Two person-daysper week were devoted to finding ‘‘lost’’ birds—i.e.,individuals not detected for 2 weeks. We also con-ducted wide aerial transects for lost birds 5–6 times/y,extending 2–3 km past known bird locations.
We surveyed the study area for active leks from27 March to 7 May each spring, always between 30min before dawn and 2.5 h after dawn and only onmornings with good weather. We spent an hour oneach section surveyed and recorded the number ofbirds at each lek.
If a female tracked in spring occupied the samelocation for 2 consecutive days or was otherwisethought to be nesting, we approached her cautiouslyto determine if she was on a nest. If so, we placed amarker radio at the nest’s location so the nest could bemonitored from afar, thus minimizing disturbance tothe female. We monitored all nests every 2–3 d. Wedid not routinely flush a female to determine nest con-tents, but if a female flushed of her own accord or ifshe had been incubating for several weeks, we gath-ered data on clutch size (66 of 74 nests).
Statistical Analyses
We examined lek and nest placement under a nullmodel assumption that if either was random then eachwould occur in the same proportions as those ofburned versus unburned prairie. This model assumesthat all of the study area was available for use, anassumption we think is valid given that the majorityof the study area is tallgrass prairie with little soil dis-turbance or woody vegetation (see Study Area). Underthis null model, lek or nest placement could be testedwith a �2 goodness-of-fit test. All statistical tests canbe found in Sokal and Rohlf (1995).
We assessed site fidelity—here defined as the ten-dency for leks to have the same geographic centeracross years—using Cochran’s Q, a nonparametric testfor repeated-measures data that are dichotomous (i.e.,a lek was present or absent from a particular locationin a given year). We used the nonparametric Wilcoxon
151FIRE EFFECTS ON GROUSE LEKKING AND NESTING
rank-sum test to determine if lek size tended to differon burned versus unburned prairie.
For the timing of nest placement, we assessednesting before and after 1 June using a Mantel–Haens-zel �2, a test of frequencies divided into discrete groups(in this case time of year). We assessed differences innest date with a one-way analysis of variance (ANO-VA) with date as the response and burned versus un-burned as the categorical variable. For ANOVAs, wereport effect size as d (Cohen 1988).
Our assessment of reproductive effort was several-fold. We constructed survival curves for nests using aKaplan–Meier product-limit estimator and comparedcurves on burned versus unburned prairie with a log-rank �2 test. We compared productivity by burn treat-ment for clutch size and fledgling production. In bothcases we treated nest date as a covariate and comparedthe response variables with an analysis of covariance(ANCOVA).
RESULTS
Lekking Behavior
The geographic center of leks tended to shift fromyear to year, such that birds did not return to fixedlocations but moved according to changing conditions.As a result, site fidelity was not a strong factor in leklocation, in that interannual locations were only mar-ginally correlated (Cochran’s Q-test: Q � 4.33, df �2, P � 0.11), a finding consistent with past studies(e.g., Merrill et al. 1999). Male prairie-chickens tendedto lek on unburned prairie (Figure 1), but they did notchoose unburned habitat differently from a randomchoice of available unburned habitat (goodness-of-fittest: 0.22 � �2 � 4.46, df � 1, P � 0.10, 20 � n �27 leks). Even so, leks on burned prairie tended to be�200 m from unburned prairie: 54 of 79 leks (68.4%)surveyed during 1998–2000 had unburned prairiesomewhere within this radius, including on the lek it-self. Only 21 of 55 (38.2%) leks were on such landburned in each of the three springs from 1998 to 2000.Regardless, lek size tended to be larger on burned (x� SD � 7.4 � 5.6 birds) than on unburned (x � SD� 5.1 � 3.7 birds) prairie (Wilcoxon rank-sum test:Ws � 1,216, df � 1, P � 0.06).
Nesting Behavior
Females strongly avoided nesting in areas burnedin spring 1998 (Figure 2A; �2 � 64.84, df � 1, P �0.0001, n � 28 nests) and in spring 1999 (Figure 2B;�2 � 29.64, df � 1, P � 0.0001, n � 26 nests). Nestingeffort was poor in 2000, prohibiting statistical analysis,although 5 of 8 nests were on unburned prairie eventhough 63.6% of the area had been burned that spring.Incorporating data from 1997 (n � 12 nests), only18.9% (14 of 74) of the nests were placed on burnedprairie, and only 5 of the 64 (7.8%) nests from 1998to 2000 were located on prairie burned in each of thethree years.
Females particularly favored nesting on unburned
prairie before June (Figure 3; Mantel–Haenszel �2 �17.81, df � 1, P � 0.0001, n � 74), just after theapproximate midpoint (29–30 May for our data) of theprairie-chicken’s nesting season. Indeed, on average,nests were found on burned prairie (x � 07 June, SD� 17 d) �3 weeks later than they were found on un-burned prairie (x � 12 May, SD � 10 d), a significantdifference in nest timing (ANOVA: F1,70 � 55.94, P� 0.0001, n � 74, d � 2.23).
Despite avoidance of burned prairie and eventhough nests on unburned prairie survived, on average,slightly longer than nests on burned prairie (x � SE� 15.4 � 1.2 d vs. 13.9 � 2.3 d), nest survival as awhole did not vary relative to burning (Figure 4).However, nests on unburned prairie were more pro-ductive, with clutch size averaging nearly 2 eggs great-er and fledglings averaging nearly 5 greater (Table 1).
Determining whether smaller clutch sizes were aneffect of burning per se is confounded by the dimi-nution of clutch size with later laying date (linear re-gression: F1,62 � 31.47, P � 0.0001, n � 64, r2 � 0.34)and renesting attempts (ANOVA: F1,64 � 7.16, P �0.01, n � 65, d � 0.96), itself a function of layingdate. Accounting for the effects of nest date—i.e., in-corporating nest date as a covariate in a linear model—implies that neither burns (ANCOVA: F1,62 � 0.26, P� 0.50, n � 64) nor nest attempts (ANCOVA: F1,62 �0.02, P � 0.80, n � 64) had an effect on clutch size.Likewise, once accounting for nest date, brood sizewas apparently not related to burning per se (ANCO-VA: F1,22 � 1.86, P � 0.10, n � 24).
In contrast to nest survival, brood survival may beaffected positively by proximity to a burn edge: 3 of7 (43%) broods from nests �500 m from a burn weredepredated completely within 1 week of hatching, yetnone of 13 nests �500 m from a burn were lost com-pletely.
DISCUSSION
Lekking Males
Our data suggest that lekking male greater prairie-chickens are not affected adversely by spring burns.Prairie-chickens lek in open, short habitat (Hamer-strom et al. 1957), so it is conceivable that regularburning (or grazing) is needed to create open patcheswith short grass or forbs that are favored for lek sites.This hypothesis is supported by our observation thatlarger leks tended to be on burned prairie. Even so,the tendency for leks on burned prairie to be near un-burned prairie suggests that birds sought lekking lo-cations within a short burst of flight from denser cover,presumably as a means of individuals reducing theirrisk of predation.
Regular burning may have an ancillary benefit.Greater prairie-chickens avoid lekking near forestedhabitat (Merrill et al. 1999), perhaps including intru-sive woody plants such as the invasive eastern red ce-dar (Juniperus virginiana), a ‘‘weedy’’ species cur-rently claiming large tracts of tallgrass and mixed-grass prairie (Briggs et al. 2002). Regular fires inhibit

152 PATTEN ET AL.
Fig. 1. Greater prairie-chicken leks (dots) in (A) 1998, (B) 1999, and (C) 2000 in relation to spring burns, Osage County, Oklahoma.Dot size varies according to lek size (small dot � 1–5 males; medium dot � 6–10 males; large dot � 11–25 males). The heavy blackoutline delineates the study area. Unburned patches are shaded gray.
the spread of woody vegetation and promote thespread of grass and forb species, thus contributing toa healthy prairie ecosystem and its component avifau-na (Reinking 2005).
Nesting Females
Nesting females strongly avoided prairie burnedthat spring (Figure 2), at least for their first nest at-tempts (Figure 3), but they preferred burned prairie forsubsequent nest attempts; specifically, after May grass-
land vegetation had recovered from a burn to a suffi-cient extent (see Robel et al. 1998) that females wereless apt to avoid burned areas. Although prairie-chick-en nests may be lost to fire directly (Zimmerman1997), we suggest that the major result of spring burnsis an initial reduction in what females view as suitablenesting habitat. Many birds have facultative responsesto conditions (Newton 1998), meaning they may nest‘‘out of season’’ if conditions are favorable or mayforego nesting ‘‘in season’’ if conditions are unfavor-able (e.g., Bolger et al. 2005). We hypothesize that if

153FIRE EFFECTS ON GROUSE LEKKING AND NESTING
Fig. 2. Greater prairie-chicken nests (triangles) in (A) 1998 and(B) 1999 in relation to spring burns, Osage County, Oklahoma.The heavy black outline delineates the study area. Unburnedpatches are shaded gray.
Fig. 3. Greater prairie-chicken nests, Osage County,Oklahoma, 1998–2000. (A) Proportion of nests in burned andunburned tallgrass prairie across the nesting season. Curveswere derived from LOESS smooths (f � 0.5) of frequency data(accumulated nests per 5-d period). Vegetation recovers as theseason progresses, so females are less likely to avoid burnedareas later, with early June being a transition point. (B) Clutchsizes from individual nests plotted against nest date. Regardlessof burning, regressions of clutch size against date have thesame slope (solid � unburned, dashed � burned).
prairie is burned extensively, females may wait to nestuntil they view conditions as being more favorable—in this case, until the prairie has recovered to an extentthat a nest can be concealed adequately. Before firesuppression and wide cultivation of the prairie, largefires may have had a similar effect, but females thenmay have been able to disperse to suitable habitat con-tiguous with their home range. Extant prairie is cur-
rently highly fragmented, and females may not be ableto move readily to favorable unburned patches.
It is nearly universal that, within a species, avianclutch size decreases as the breeding season progresses(Klomp 1970, Winkler and Walters 1983). Our datashow the same pattern for the greater prairie-chicken.Causes for this pattern are unclear, but if it is inde-pendent of effort—if clutch size is smaller later in theseason regardless of whether the female is on her first,second, or third nesting attempt—then output will belower by the time females begin to occupy areasburned that spring. Thus, there is reason to expect ourobserved pattern of lower reproductive output onburns.
We can only speculate why broods suffered ap-parently higher losses farther from burns. A plausiblehypothesis is that accumulation of litter and tangledvegetation from the previous year’s growth hampersbrood movement, making them less able to escape apredator, an idea supported by our observation thatmost females that nested in unburned prairie typicallymoved their broods to recently burned prairie shortlyafter hatching. But movement to recent burns could bebecause female prairie-chickens preferentially select
154 PATTEN ET AL.
Fig. 4. Greater prairie-chicken nest survival in relation to springburning of tallgrass prairie, Osage County, Oklahoma, 1998–2000. The Kaplan–Meier survival curve for nests on burned prai-rie appears to be lower, but standard errors overlap sufficientlyto make the apparent difference insignificant (log-rank test: �2
� 0.29, df � 1, P � 0.50, n � 70 nests).
Table 1. Productivity of greater prairie-chicken nests on burnedand unburned tallgrass prairie, Osage County, Oklahoma,1998–2000. Statistical tests for differences between means in-clude estimates of the effect size (d ). Although the differenceappears to be associated with burning of prairie, the effect ismore likely related to when the nest was initiated (see text).Even so, because a much higher proportion of later nests arein burned prairie (Figure 3), they are necessarily less productive.
Variable Burned Unburned
Clutch sizeSample size 13 53Mean 9.62 11.56Standard deviation 1.50 2.35Standard error 0.42 0.32ANOVA results F1,62 � 8.09, P � 0.01,
d � 0.88
Number of fledglingsSample size 4 20Mean 6.50 11.20Standard deviation 2.08 2.48Standard error 1.04 0.55ANOVA results F1,22 � 12.44, P � 0.002,
d � 1.93
prairie with higher levels of invertebrate biomass (Ha-gen et al. 2005), a feature of recent burns (Warren etal. 1987, Evans 1988, Swengel 2001).
If these hypotheses hold true and the observationsremain consistent, together they present a conundrumfor nesting greater prairie-chickens. Increased or con-tinued extensive burning may cause females to foregonesting until a later date, by which time their repro-ductive potential will be diminished. Moreover, ifbroods require more open prairie to increase their oddsof escaping predators, then females have another rea-son to wait for burns to recover or, at the least, to findsuitably concealed nest sites (i.e., those in unburnedprairie) near areas burned that spring. In either case,if burning is too extensive, then the predicted reduc-tion in reproductive output on burned plots, a result oflater nesting there, could reduce population size to acritically low level as a cumulative effect over time.Lastly, because our study was conducted during fouryears that, by chance, had higher than average rainfall,it is possible that burned prairie recovered more quick-ly than usual. We speculate that burns would recoverlater, and perhaps not to a sufficient extent, during dryyears.
MANAGEMENT IMPLICATIONS
Our data suggest that both male and female greaterprairie-chickens favor a patchwork of burned and un-disturbed tallgrass prairie. Lekking males may preferburned sites, but they often lek near patches of residualtallgrass, presumably because these patches provideescape cover. Likewise, breeding females avoid plac-ing nests in burned areas until the areas have recoveredsufficiently to provide concealment, but those femaleswhose clutches hatch typically move broods into a re-cently burned area, perhaps because small chicks canbetter maneuver through its more open understory, but
more likely because recent burns have elevated inver-tebrate biomass on which chicks depend (Boyd andBidwell 2001, Hagen et al. 2005).
Fuhlendorf and Engle (2004) noted that range-lands, including the prairie, have long been managedwith the objective of reducing inherent landscape het-erogeneity. In the tallgrass prairie, such managementincludes suppressing natural fires, spreading cattlegrazing evenly, and setting numerous spring fires,enough that much of the habitat is burned annually. Inconcert, then, this effort has greatly minimized the ex-tent of unburned tallgrass prairie. But the greater prai-rie-chicken prefers tallgrass prairie, of at least 1 y re-sidual growth for nesting. As a result, managementpractices will need to change if we hope to conserveviable populations of this species.
A key change involves the timing and extent offires and the associated extent of cattle grazing. Cattlegain weight more quickly when foraging on recentlyburned prairie (Zimmerman 1997), a result of in-creased forage quality and primary productivity; there-fore, ranchers have an economic incentive to continuewith spring burns. Yet such burns need not cover vastareas nor affect the same areas year after year. A ro-tation of smaller burns (and their associated grazingpressure)—the basic idea of patch burning (Johnson1997, Fuhlendorf and Engle 2004)—would create thepatchwork of burned and unburned prairie necessaryfor the greater prairie-chicken.
Regarding the prairie-chicken specifically, we en-courage future researchers to focus on landscape-levelpatterns of nest and brood success on burned versusunburned prairie. For example, what ratio of burnedto unburned prairie is ideal for the greater prairie-chicken? Does this ratio change with the level of hab-itat fragmentation? Is there a temporal pattern to burn-ing that best suits the species? These questions couldbe answered with field experiments established with
155FIRE EFFECTS ON GROUSE LEKKING AND NESTING
the cooperation of landowners, experiments in whichthe extent and timing of burned plots are controlled.
ACKNOWLEDGMENTSThis study was funded in part by Wildlife Resto-
ration Program Grant W146R from the Oklahoma De-partment of Wildlife Conservation (ODWC). We alsoreceived financial support from the U.S. Fish andWildlife Service, World Publishing, Conoco-Phillips,John Brock, Harold Price, the Kenneth S. AdamsFoundation, Arrow Trucking, Carol McGraw, GeorgeRecords, Sam Daniel, Joseph Morris, and other privatedonors. We appreciate the efforts of many field tech-nicians who collected data under difficult conditions.We thank the many landowners—especially The Na-ture Conservancy, National Farms, Sooner Land Com-pany, Paul Jones, Lincoln Robinson Ranch, andODWC—who allowed us to conduct research on theirproperty. We are indebted to David A. Wiedenfeld ofthe Charles Darwin Research Station for preliminaryanalyses of some of these data and to Peter Earle ofOklahoma State University for providing preliminaryArcView maps of burned and unburned land withinour study area. We thank Christian A. Hagen, RonaldE. Masters, and an anonymous referee for improvingour presentation of these data.
LITERATURE CITEDBolger, D.T., M.A. Patten, and D.C. Bostock. 2005. Avian re-
productive failure in response to an extreme climatic event.Oecologia 142:398–406.
Boyd, C.S., and T.G. Bidwell. 2001. Influence of prescribed fireon lesser prairie-chicken habitat in shinnery oak commu-nities in western Oklahoma. Wildlife Society Bulletin 29:938–947.
Briggs, J.M., G.A. Hoch, and L.C. Johnson. 2002. Assessing therate, mechanisms, and consequences of the conversion oftallgrass prairie to Juniperus virginiana forest. Ecosystems5:578–586.
Cohen, J. 1988. Statistical power analysis for the behavioral sci-ences. Second edition. Lawrence Erlbaum Associates, Hills-dale, NJ.
Collins, S.L., and L.L. Wallace (eds.). 1990. Fire in North Amer-ican tallgrass prairies. University of Oklahoma Press, Nor-man.
Evans, E.W. 1988. Grasshopper (Insecta: Orthoptera: Acrididae)assemblages on tallgrass prairie: influences of fire frequen-cy, topography, and vegetation. Canadian Journal of Zool-ogy 66:1495–1501.
Fuhlendorf, S.D., and D.M. Engle. 2004. Application of the fire–grazing interaction to restore a shifting mosaic on tallgrassprairie. Journal of Applied Ecology 41:604–614.
Hadley, E.B., and B.J. Kieckhefer. 1963. Productivity of twoprairie grasses in relation to fire frequency. Ecology 44:389–395.
Hagen, C.A., G.C. Salter, J.C. Pitman, R.J. Robel, and R.D. Ap-plegate. 2005. Lesser prairie-chicken brood habitat in sand
sagebrush: invertebrate biomass and vegetation. WildlifeSociety Bulletin 33:1080–1091.
Hamerstrom, F.N., O.E. Mattson, and F. Hamerstrom. 1957. Aguide to prairie chicken management. Technical WildlifeBulletin 15, Wisconsin Conservation Department, Madison.
Hulbert, L.C. 1988. Causes of fire effects in tallgrass prairie.Ecology 69:46–58.
Johnson, D.H. 1997. Effects of fire on bird populations in mixed-grass prairie. Pages 181–206 in F.L. Knopf and F.B. Samson(eds.). Ecology and conservation of Great Plains verte-brates. Springer, New York.
Klomp, H. 1970. The determination of clutch size in birds. Ar-dea 58:1–124.
Knapp, A.K., and T.R. Seastedt. 1986. Detritus accumulationlimits productivity of tallgrass prairie. BioScience 36:662–668.
Merrill, M.D., K.A. Chapman, K.A. Poiani, and B. Winter. 1999.Land-use patterns surrounding greater prairie-chicken leksin northwestern Minnesota. Journal of Wildlife Manage-ment 63:189–198.
Newton, I. 1998. Population limitation in birds. Academic Press,San Diego, CA.
Rea, A., and C.J. Becker. 1997. Digital atlas of Oklahoma [CD-ROM]. U.S. Geological Survey Open File Report 97-23,Oklahoma City, Oklahoma.
Reichman, O.J. 1987. Konza Prairie: a tallgrass natural history.University Press of Kansas, Lawrence.
Reinking, D.L. 2005. Fire regimes and avian responses in thecentral tallgrass prairie. Studies in Avian Biology 30:116–126.
Robbins, M.B., A.T. Peterson, and M.A. Ortega-Huerta. 2002.Major negative impacts of early intensive cattle stocking ontallgrass prairies: the case of the Greater Prairie-Chicken(Tympanuchus cupido). North American Birds 56:239–244.
Robel, R.J., J.P. Hughes, S.D. Hull, K.E. Kemp, and D.S. Klute.1998. Spring burning: resulting avian abundance and nest-ing in Kansas CRP. Journal of Range Management 51:132–138.
Samson, F.B., and F.L. Knopf (eds.). 1996. Prairie conservation:preserving North America’s most endangered ecosystem. Is-land Press, Washington, D.C.
Shochat, E., D.H. Wolfe, M.A. Patten, D.L. Reinking, and S.K.Sherrod. 2005. Tallgrass prairie management and bird nestsuccess along roadsides. Biological Conservation 121:399–407.
Smith, E.F., and C.E. Owensby. 1978. Intensive early stockingand season-long stocking of Kansas Flint Hills range. Jour-nal of Range Management 31:14–17.
Sokal, R.R., and F.J. Rohlf. 1995. Biometry. Third edition. W.H.Freeman, New York.
Swengel, A.B. 2001. A literature review of insect response tofire, compared to other conservation managements of openhabitats. Biodiversity & Conservation 10:1141–1169.
Warren, S., C. Scifres, and P. Tell. 1987. Response of grasslandarthropods to burning: a review. Agriculture, Ecosystems &Environment 19:105–130.
Winkler, D.W., and J.R. Walters. 1983. The determination ofclutch size in precocial birds. Current Ornithology 1:33–68.
Wright, H.A. 1974. Range burning. Journal of Range Manage-ment 27:5–11.
Zimmerman, J.L. 1997. Avian community responses to fire,grazing, and drought in the tallgrass prairie. Pages 167–180in F.L. Knopf and F.B. Samson (eds.). Ecology and conser-vation of Great Plains vertebrates. Springer, New York.
156
FIRE EFFECTS ON LESSER PRAIRIE-CHICKEN HABITAT
Terrence G. BidwellOklahoma State University, Department of Plant and Soil Sciences, Stillwater, OK 74075, USA
Chad S. BoydUSDA Agricultural Research Service, 67826-A Highway 205, Burns, OR 97720, USA
ABSTRACT
Fire has been suppressed over vast areas of prairie and shrublands in the central and southern Great Plains. Fire suppression and habitatfragmentation promote a negative feedback mechanism that continues unabated on the contemporary landscape. The results have beennegative for native plant communities and wildlife that are habitat specialists, such as the lesser prairie-chicken (Tympanuchus palli-dicinctus). The lesser prairie-chicken has a narrowly defined habitat niche, and fire suppression and habitat fragmentation have con-tributed to its decline. Fire may have a positive or negative effect on specific habitat elements depending on the pre-burn condition ofthe element and the timing (season) of the burn. Habitat elements include lekking or booming grounds, nesting cover, brood rearingcover, and protective cover. Fire affects habitat structure for 3 y or less before the structure returns to pre-burn conditions. Historicalaccounts (ca. 1840) of sand shinnery oak (Quercus havardii) structure on the landscape are similar to a 2-y burn frequency. Thejuxtaposition and pattern of fire on the landscape and its effects on lesser prairie-chicken habitat are also related to herbivory and thusfire cannot be evaluated without an understanding of the fire–herbivory interaction, also known as patch burning–patch grazing orrotational grazing without fences.
Citation: Bidwell, T.G., and C.S. Boyd. 2007. Fire effects on lesser prairie-chicken habitat [abstract]. Page 156 in R.E. Masters andK.E.M. Galley (eds.). Proceedings of the 23rd Tall Timbers Fire Ecology Conference: Fire in Grassland and Shrubland Ecosystems.Tall Timbers Research Station, Tallahassee, Florida, USA.
157
RESTORING THE FIRE–GRAZING INTERACTION FORGRASSLAND CONSERVATION AND MANAGEMENT
Samuel D. Fuhlendorf and David M. EngleOklahoma State University, Department of Plant and Soil Sciences, Stillwater, OK 74075, USA
ABSTRACT
It is well recognized that fire and grazing were common features of pre–European settlement grasslands and may be important inmaintaining grassland structure and function. Most studies of grazing and fire focus on binary (yes or no; a few combining fire andgrazing) treatment designs on relatively small uniform experimental units. This approach of uniform treatment application is incapableof explaining complex patterns that are central to the ecological interaction of fire and grazing within the context of a dynamiclandscape. Our recent research at the Tallgrass Prairie Preserve suggests that fire and grazing are interactive and can lead to a shiftingmosaic landscape that is regulated through a series of positive and negative feedbacks. Unburned prairie has a high probability of fireand a low probability of selection by grazing animals. When a fire occurs on a portion of the landscape, the probability of grazingincreases on that portion and animals tend to congregate and graze the burned area heavily. This fire followed by focal grazing changesthe community structure and lowers the probability of fires. Grazing animals will continue to use the burned area until a new burnedarea becomes available; they then switch to the new burned area, allowing the previously burned area to recover. The result is a shiftingmosaic of patches across the landscape, driven by the interactive influence of fire and grazing. Thus, characteristics of patches aredictated by time since focal disturbance such that the landscape contains plant communities in patches that have been recently burnedand focally grazed and also patches that have not been disturbed for several years. We developed this fire–grazing model into amanagement model capable of enhancing biodiversity while maintaining production of domestic livestock.
Citation: Fuhlendorf, S.D., and D.M. Engle. 2007. Restoring the fire–grazing interaction for grassland conservation and management[abstract]. Page 157 in R.E. Masters and K.E.M. Galley (eds.). Proceedings of the 23rd Tall Timbers Fire Ecology Conference: Fire inGrassland and Shrubland Ecosystems. Tall Timbers Research Station, Tallahassee, Florida, USA.
158
PATCH BURNING AS A HETEROGENEITY APPROACH TORANGELAND MANAGEMENT
Jay D. Kerby,1 David M. Engle,2 Samuel D. Fuhlendorf, David L. Nofziger, and Terrence G. BidwellOklahoma State University, Department of Plant and Soil Sciences, 368 Agricultural Hall, Stillwater, OK 74078, USA
ABSTRACT
Patch burning is a novel approach to rangeland management that has potential to enhance biological diversity while maintaininglivestock production on rangelands. Its foundation is based upon a long history of herbivory by large ungulates and the fire–grazinginteraction on native rangelands. Traditional rangeland management generally attempts to minimize inherent rangeland heterogeneity.Patch burning, which uses the fire–grazing interaction to increase spatial heterogeneity of rangelands, allows free selection by largeungulates among burned and unburned patches within a landscape unrestricted by fencing. Because ungulates prefer to graze forageplants within recently burned patches, intense grazing moves across the landscape in the pattern created by burning patches. The resultis a shifting mosaic of patches at different stages of recovery from burning and grazing disturbance. We suggest that emphasis on aheterogeneity-based approach to managing grasslands is a viable framework for conservation and a potentially useful tool in wildlandfire management.
keywords: fire–grazing interaction, fuel management, heterogeneity, rangeland management.
Citation: Kerby, J.D., D.M. Engle, S.D. Fuhlendorf, D.L. Nofziger, and T.G. Bidwell. 2007. Patch burning as a heterogeneity approachto rangeland management. Pages 158–162 in R.E. Masters and K.E.M. Galley (eds.). Proceedings of the 23rd Tall Timbers Fire EcologyConference: Fire in Grassland and Shrubland Ecosystems. Tall Timbers Research Station, Tallahassee, Florida, USA.
INTRODUCTION
Before European settlement of North America, fireand grazing by native ungulates interacted to create adynamic and heterogeneous landscape. As individualdisturbances, fire and grazing have different effects onecosystems, but when considered as a dynamic, land-scape-level interaction, their influences become morepronounced and synergistic. Grazing by bison (Bisonbison) and other herbivores across the pre–Europeansettlement landscape influenced the structure and func-tion of many grasslands (Knapp et al. 1999), but therecent view is that the distribution of spatially unre-stricted large ungulates within the landscape was notuniform and interacted with patterns of heterogeneitycreated by fire (Kay 1998; Fuhlendorf and Engle 2001,2004). This becomes all the more evident when con-sidering habitat requirements of habitat specialistssuch as grassland birds that evolved with bison grazing(Figure 1; Knopf 1996).
Managing grazing animals typically focuses onstocking rate and grazing systems with emphasis onuniform distribution of grazing disturbance (Holecheket al. 1998). As a result, most rangeland managementpractices (i.e., brush and weed control, fencing, etc.)have been implemented to promote livestock produc-tion by increasing dominance of a key forage speciesand maintaining uniform grazing patterns (Fuhlendorfand Engle 2001). Spatially variable management prac-tices have been recommended only for attracting live-stock to lightly used or unused areas with the objective
1 Corresponding author ([email protected]).2 Current address: Iowa State University, Department of NaturalResource Ecology & Management, Ames, IA 50011, USA.
of reducing spatial heterogeneity and increasing har-vest efficiency (Hooper et al. 1969, Samuel et al. 1980,Vallentine 1989, Holechek et al. 1998). Fire manage-ment has followed a similar template, with fire appli-cation usually applied to reduce forage heterogeneityand to encourage uniform distribution of livestockgrazing. Without patch grazing, frequent burning aspracticed on ranches in the tallgrass prairie region re-duces plant diversity and increases homogeneity oftallgrass prairie (Collins 1992). A paucity of researchhas evaluated the interactive effects of fire and grazingon heterogeneity. Here, we present an overview of anapproach to managing rangelands that promotes het-erogeneity by coupling fire and grazing in a spatiallydynamic fashion that, together with implications forlivestock production and wildlife habitat, might be ofvalue in grassland ecosystem management.
PATCH BURNING AS ANALTERNATIVE MANAGEMENTAPPROACH
Patch burning is an alternative management ap-proach that uses a fire–grazing interaction to producea shifting mosaic landscape. Grassland patches thathave been not burned in several years have an in-creased probability of fire and a decreased probabilityof grazing (Figure 2; Fuhlendorf and Engle 2004).Conversely, grassland patches that have burned re-cently have an increased probability of grazing be-cause forage quality is high and a decreased probabil-ity of burning again until sufficient fuel accumulates.When a patch long excluded from fire is burned, patchpreference by large herbivores shifts to the most recent
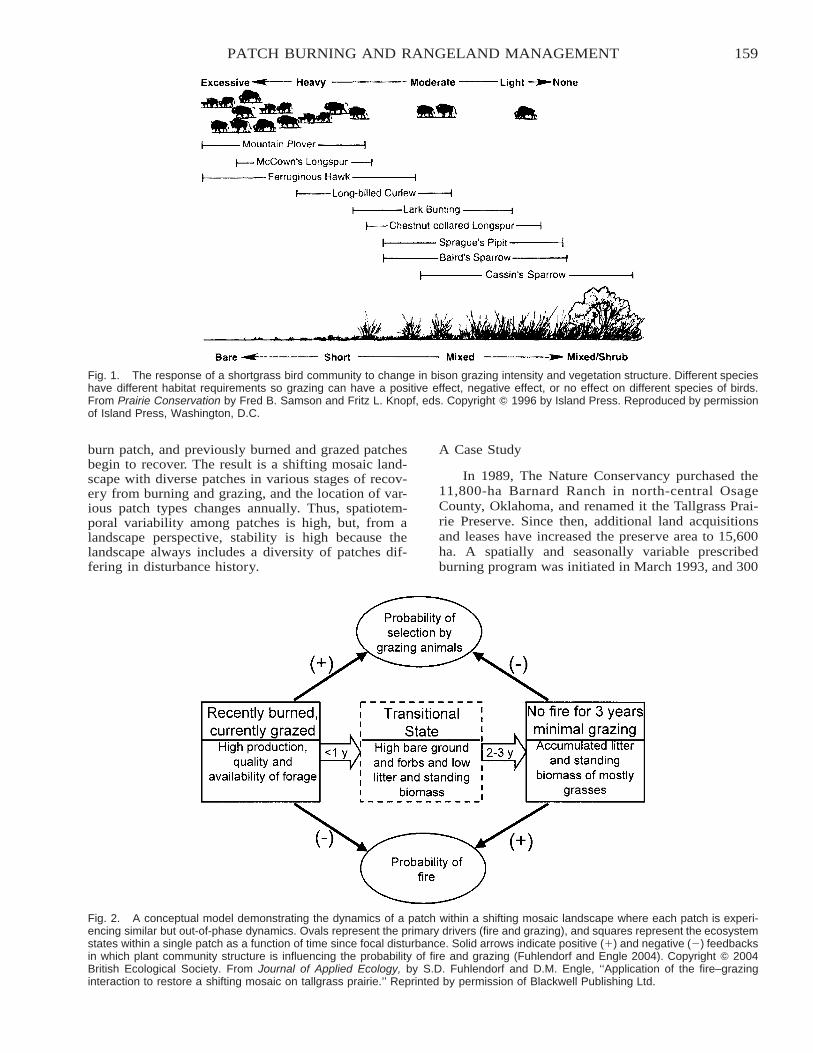
159PATCH BURNING AND RANGELAND MANAGEMENT
Fig. 1. The response of a shortgrass bird community to change in bison grazing intensity and vegetation structure. Different specieshave different habitat requirements so grazing can have a positive effect, negative effect, or no effect on different species of birds.From Prairie Conservation by Fred B. Samson and Fritz L. Knopf, eds. Copyright � 1996 by Island Press. Reproduced by permissionof Island Press, Washington, D.C.
Fig. 2. A conceptual model demonstrating the dynamics of a patch within a shifting mosaic landscape where each patch is experi-encing similar but out-of-phase dynamics. Ovals represent the primary drivers (fire and grazing), and squares represent the ecosystemstates within a single patch as a function of time since focal disturbance. Solid arrows indicate positive (�) and negative (�) feedbacksin which plant community structure is influencing the probability of fire and grazing (Fuhlendorf and Engle 2004). Copyright � 2004British Ecological Society. From Journal of Applied Ecology, by S.D. Fuhlendorf and D.M. Engle, ‘‘Application of the fire–grazinginteraction to restore a shifting mosaic on tallgrass prairie.’’ Reprinted by permission of Blackwell Publishing Ltd.
burn patch, and previously burned and grazed patchesbegin to recover. The result is a shifting mosaic land-scape with diverse patches in various stages of recov-ery from burning and grazing, and the location of var-ious patch types changes annually. Thus, spatiotem-poral variability among patches is high, but, from alandscape perspective, stability is high because thelandscape always includes a diversity of patches dif-fering in disturbance history.
A Case Study
In 1989, The Nature Conservancy purchased the11,800-ha Barnard Ranch in north-central OsageCounty, Oklahoma, and renamed it the Tallgrass Prai-rie Preserve. Since then, additional land acquisitionsand leases have increased the preserve area to 15,600ha. A spatially and seasonally variable prescribedburning program was initiated in March 1993, and 300
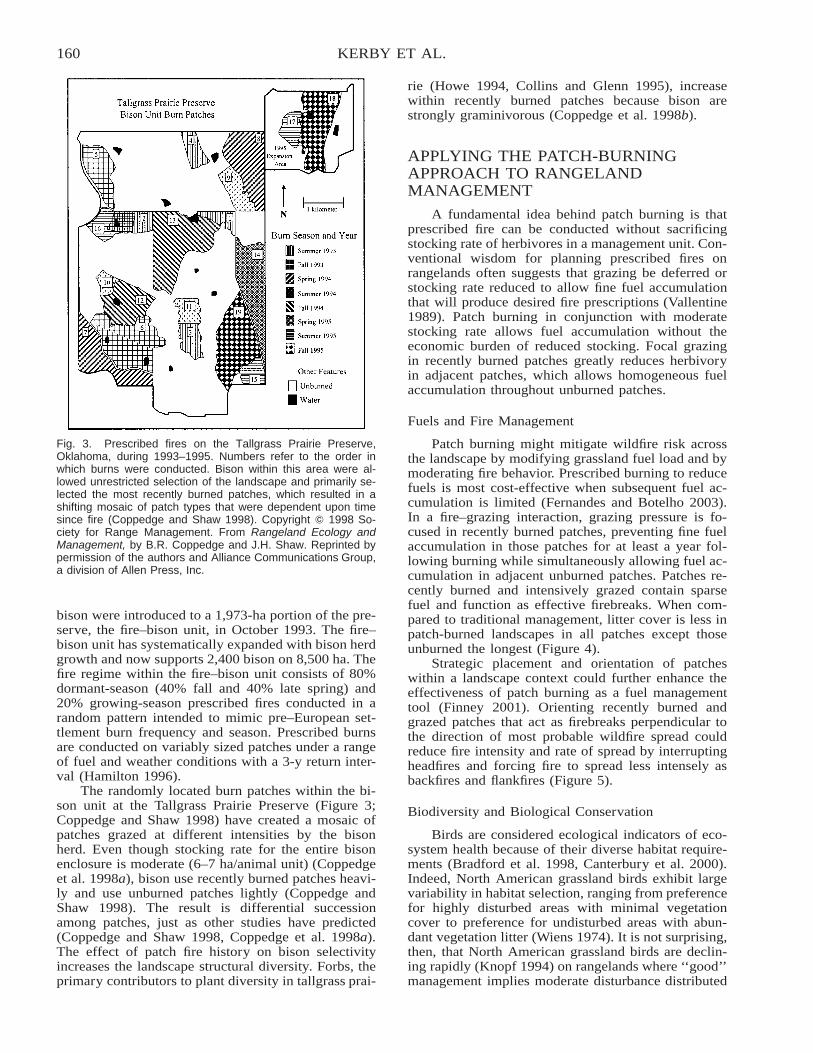
160 KERBY ET AL.
Fig. 3. Prescribed fires on the Tallgrass Prairie Preserve,Oklahoma, during 1993–1995. Numbers refer to the order inwhich burns were conducted. Bison within this area were al-lowed unrestricted selection of the landscape and primarily se-lected the most recently burned patches, which resulted in ashifting mosaic of patch types that were dependent upon timesince fire (Coppedge and Shaw 1998). Copyright � 1998 So-ciety for Range Management. From Rangeland Ecology andManagement, by B.R. Coppedge and J.H. Shaw. Reprinted bypermission of the authors and Alliance Communications Group,a division of Allen Press, Inc.
bison were introduced to a 1,973-ha portion of the pre-serve, the fire–bison unit, in October 1993. The fire–bison unit has systematically expanded with bison herdgrowth and now supports 2,400 bison on 8,500 ha. Thefire regime within the fire–bison unit consists of 80%dormant-season (40% fall and 40% late spring) and20% growing-season prescribed fires conducted in arandom pattern intended to mimic pre–European set-tlement burn frequency and season. Prescribed burnsare conducted on variably sized patches under a rangeof fuel and weather conditions with a 3-y return inter-val (Hamilton 1996).
The randomly located burn patches within the bi-son unit at the Tallgrass Prairie Preserve (Figure 3;Coppedge and Shaw 1998) have created a mosaic ofpatches grazed at different intensities by the bisonherd. Even though stocking rate for the entire bisonenclosure is moderate (6–7 ha/animal unit) (Coppedgeet al. 1998a), bison use recently burned patches heavi-ly and use unburned patches lightly (Coppedge andShaw 1998). The result is differential successionamong patches, just as other studies have predicted(Coppedge and Shaw 1998, Coppedge et al. 1998a).The effect of patch fire history on bison selectivityincreases the landscape structural diversity. Forbs, theprimary contributors to plant diversity in tallgrass prai-
rie (Howe 1994, Collins and Glenn 1995), increasewithin recently burned patches because bison arestrongly graminivorous (Coppedge et al. 1998b).
APPLYING THE PATCH-BURNINGAPPROACH TO RANGELANDMANAGEMENT
A fundamental idea behind patch burning is thatprescribed fire can be conducted without sacrificingstocking rate of herbivores in a management unit. Con-ventional wisdom for planning prescribed fires onrangelands often suggests that grazing be deferred orstocking rate reduced to allow fine fuel accumulationthat will produce desired fire prescriptions (Vallentine1989). Patch burning in conjunction with moderatestocking rate allows fuel accumulation without theeconomic burden of reduced stocking. Focal grazingin recently burned patches greatly reduces herbivoryin adjacent patches, which allows homogeneous fuelaccumulation throughout unburned patches.
Fuels and Fire Management
Patch burning might mitigate wildfire risk acrossthe landscape by modifying grassland fuel load and bymoderating fire behavior. Prescribed burning to reducefuels is most cost-effective when subsequent fuel ac-cumulation is limited (Fernandes and Botelho 2003).In a fire–grazing interaction, grazing pressure is fo-cused in recently burned patches, preventing fine fuelaccumulation in those patches for at least a year fol-lowing burning while simultaneously allowing fuel ac-cumulation in adjacent unburned patches. Patches re-cently burned and intensively grazed contain sparsefuel and function as effective firebreaks. When com-pared to traditional management, litter cover is less inpatch-burned landscapes in all patches except thoseunburned the longest (Figure 4).
Strategic placement and orientation of patcheswithin a landscape context could further enhance theeffectiveness of patch burning as a fuel managementtool (Finney 2001). Orienting recently burned andgrazed patches that act as firebreaks perpendicular tothe direction of most probable wildfire spread couldreduce fire intensity and rate of spread by interruptingheadfires and forcing fire to spread less intensely asbackfires and flankfires (Figure 5).
Biodiversity and Biological Conservation
Birds are considered ecological indicators of eco-system health because of their diverse habitat require-ments (Bradford et al. 1998, Canterbury et al. 2000).Indeed, North American grassland birds exhibit largevariability in habitat selection, ranging from preferencefor highly disturbed areas with minimal vegetationcover to preference for undisturbed areas with abun-dant vegetation litter (Wiens 1974). It is not surprising,then, that North American grassland birds are declin-ing rapidly (Knopf 1994) on rangelands where ‘‘good’’management implies moderate disturbance distributed
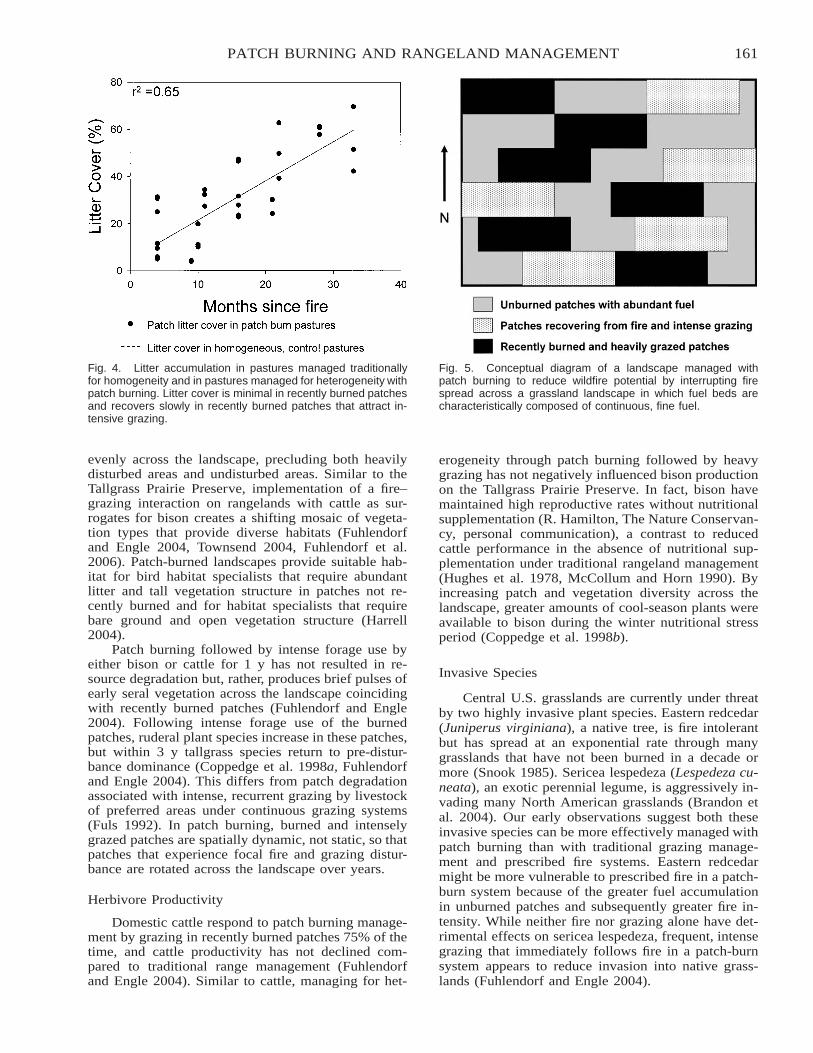
161PATCH BURNING AND RANGELAND MANAGEMENT
Fig. 4. Litter accumulation in pastures managed traditionallyfor homogeneity and in pastures managed for heterogeneity withpatch burning. Litter cover is minimal in recently burned patchesand recovers slowly in recently burned patches that attract in-tensive grazing.
Fig. 5. Conceptual diagram of a landscape managed withpatch burning to reduce wildfire potential by interrupting firespread across a grassland landscape in which fuel beds arecharacteristically composed of continuous, fine fuel.
evenly across the landscape, precluding both heavilydisturbed areas and undisturbed areas. Similar to theTallgrass Prairie Preserve, implementation of a fire–grazing interaction on rangelands with cattle as sur-rogates for bison creates a shifting mosaic of vegeta-tion types that provide diverse habitats (Fuhlendorfand Engle 2004, Townsend 2004, Fuhlendorf et al.2006). Patch-burned landscapes provide suitable hab-itat for bird habitat specialists that require abundantlitter and tall vegetation structure in patches not re-cently burned and for habitat specialists that requirebare ground and open vegetation structure (Harrell2004).
Patch burning followed by intense forage use byeither bison or cattle for 1 y has not resulted in re-source degradation but, rather, produces brief pulses ofearly seral vegetation across the landscape coincidingwith recently burned patches (Fuhlendorf and Engle2004). Following intense forage use of the burnedpatches, ruderal plant species increase in these patches,but within 3 y tallgrass species return to pre-distur-bance dominance (Coppedge et al. 1998a, Fuhlendorfand Engle 2004). This differs from patch degradationassociated with intense, recurrent grazing by livestockof preferred areas under continuous grazing systems(Fuls 1992). In patch burning, burned and intenselygrazed patches are spatially dynamic, not static, so thatpatches that experience focal fire and grazing distur-bance are rotated across the landscape over years.
Herbivore Productivity
Domestic cattle respond to patch burning manage-ment by grazing in recently burned patches 75% of thetime, and cattle productivity has not declined com-pared to traditional range management (Fuhlendorfand Engle 2004). Similar to cattle, managing for het-
erogeneity through patch burning followed by heavygrazing has not negatively influenced bison productionon the Tallgrass Prairie Preserve. In fact, bison havemaintained high reproductive rates without nutritionalsupplementation (R. Hamilton, The Nature Conservan-cy, personal communication), a contrast to reducedcattle performance in the absence of nutritional sup-plementation under traditional rangeland management(Hughes et al. 1978, McCollum and Horn 1990). Byincreasing patch and vegetation diversity across thelandscape, greater amounts of cool-season plants wereavailable to bison during the winter nutritional stressperiod (Coppedge et al. 1998b).
Invasive Species
Central U.S. grasslands are currently under threatby two highly invasive plant species. Eastern redcedar(Juniperus virginiana), a native tree, is fire intolerantbut has spread at an exponential rate through manygrasslands that have not been burned in a decade ormore (Snook 1985). Sericea lespedeza (Lespedeza cu-neata), an exotic perennial legume, is aggressively in-vading many North American grasslands (Brandon etal. 2004). Our early observations suggest both theseinvasive species can be more effectively managed withpatch burning than with traditional grazing manage-ment and prescribed fire systems. Eastern redcedarmight be more vulnerable to prescribed fire in a patch-burn system because of the greater fuel accumulationin unburned patches and subsequently greater fire in-tensity. While neither fire nor grazing alone have det-rimental effects on sericea lespedeza, frequent, intensegrazing that immediately follows fire in a patch-burnsystem appears to reduce invasion into native grass-lands (Fuhlendorf and Engle 2004).
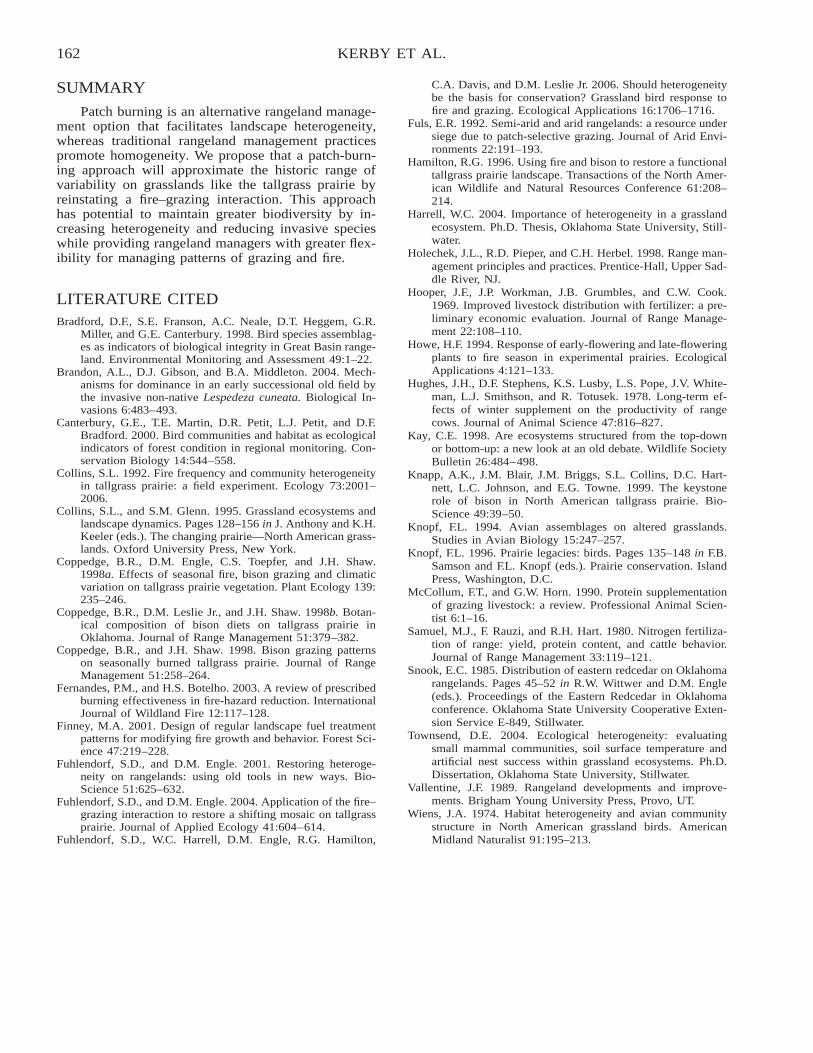
162 KERBY ET AL.
SUMMARY
Patch burning is an alternative rangeland manage-ment option that facilitates landscape heterogeneity,whereas traditional rangeland management practicespromote homogeneity. We propose that a patch-burn-ing approach will approximate the historic range ofvariability on grasslands like the tallgrass prairie byreinstating a fire–grazing interaction. This approachhas potential to maintain greater biodiversity by in-creasing heterogeneity and reducing invasive specieswhile providing rangeland managers with greater flex-ibility for managing patterns of grazing and fire.
LITERATURE CITEDBradford, D.F., S.E. Franson, A.C. Neale, D.T. Heggem, G.R.
Miller, and G.E. Canterbury. 1998. Bird species assemblag-es as indicators of biological integrity in Great Basin range-land. Environmental Monitoring and Assessment 49:1–22.
Brandon, A.L., D.J. Gibson, and B.A. Middleton. 2004. Mech-anisms for dominance in an early successional old field bythe invasive non-native Lespedeza cuneata. Biological In-vasions 6:483–493.
Canterbury, G.E., T.E. Martin, D.R. Petit, L.J. Petit, and D.F.Bradford. 2000. Bird communities and habitat as ecologicalindicators of forest condition in regional monitoring. Con-servation Biology 14:544–558.
Collins, S.L. 1992. Fire frequency and community heterogeneityin tallgrass prairie: a field experiment. Ecology 73:2001–2006.
Collins, S.L., and S.M. Glenn. 1995. Grassland ecosystems andlandscape dynamics. Pages 128–156 in J. Anthony and K.H.Keeler (eds.). The changing prairie—North American grass-lands. Oxford University Press, New York.
Coppedge, B.R., D.M. Engle, C.S. Toepfer, and J.H. Shaw.1998a. Effects of seasonal fire, bison grazing and climaticvariation on tallgrass prairie vegetation. Plant Ecology 139:235–246.
Coppedge, B.R., D.M. Leslie Jr., and J.H. Shaw. 1998b. Botan-ical composition of bison diets on tallgrass prairie inOklahoma. Journal of Range Management 51:379–382.
Coppedge, B.R., and J.H. Shaw. 1998. Bison grazing patternson seasonally burned tallgrass prairie. Journal of RangeManagement 51:258–264.
Fernandes, P.M., and H.S. Botelho. 2003. A review of prescribedburning effectiveness in fire-hazard reduction. InternationalJournal of Wildland Fire 12:117–128.
Finney, M.A. 2001. Design of regular landscape fuel treatmentpatterns for modifying fire growth and behavior. Forest Sci-ence 47:219–228.
Fuhlendorf, S.D., and D.M. Engle. 2001. Restoring heteroge-neity on rangelands: using old tools in new ways. Bio-Science 51:625–632.
Fuhlendorf, S.D., and D.M. Engle. 2004. Application of the fire–grazing interaction to restore a shifting mosaic on tallgrassprairie. Journal of Applied Ecology 41:604–614.
Fuhlendorf, S.D., W.C. Harrell, D.M. Engle, R.G. Hamilton,
C.A. Davis, and D.M. Leslie Jr. 2006. Should heterogeneitybe the basis for conservation? Grassland bird response tofire and grazing. Ecological Applications 16:1706–1716.
Fuls, E.R. 1992. Semi-arid and arid rangelands: a resource undersiege due to patch-selective grazing. Journal of Arid Envi-ronments 22:191–193.
Hamilton, R.G. 1996. Using fire and bison to restore a functionaltallgrass prairie landscape. Transactions of the North Amer-ican Wildlife and Natural Resources Conference 61:208–214.
Harrell, W.C. 2004. Importance of heterogeneity in a grasslandecosystem. Ph.D. Thesis, Oklahoma State University, Still-water.
Holechek, J.L., R.D. Pieper, and C.H. Herbel. 1998. Range man-agement principles and practices. Prentice-Hall, Upper Sad-dle River, NJ.
Hooper, J.F., J.P. Workman, J.B. Grumbles, and C.W. Cook.1969. Improved livestock distribution with fertilizer: a pre-liminary economic evaluation. Journal of Range Manage-ment 22:108–110.
Howe, H.F. 1994. Response of early-flowering and late-floweringplants to fire season in experimental prairies. EcologicalApplications 4:121–133.
Hughes, J.H., D.F. Stephens, K.S. Lusby, L.S. Pope, J.V. White-man, L.J. Smithson, and R. Totusek. 1978. Long-term ef-fects of winter supplement on the productivity of rangecows. Journal of Animal Science 47:816–827.
Kay, C.E. 1998. Are ecosystems structured from the top-downor bottom-up: a new look at an old debate. Wildlife SocietyBulletin 26:484–498.
Knapp, A.K., J.M. Blair, J.M. Briggs, S.L. Collins, D.C. Hart-nett, L.C. Johnson, and E.G. Towne. 1999. The keystonerole of bison in North American tallgrass prairie. Bio-Science 49:39–50.
Knopf, F.L. 1994. Avian assemblages on altered grasslands.Studies in Avian Biology 15:247–257.
Knopf, F.L. 1996. Prairie legacies: birds. Pages 135–148 in F.B.Samson and F.L. Knopf (eds.). Prairie conservation. IslandPress, Washington, D.C.
McCollum, F.T., and G.W. Horn. 1990. Protein supplementationof grazing livestock: a review. Professional Animal Scien-tist 6:1–16.
Samuel, M.J., F. Rauzi, and R.H. Hart. 1980. Nitrogen fertiliza-tion of range: yield, protein content, and cattle behavior.Journal of Range Management 33:119–121.
Snook, E.C. 1985. Distribution of eastern redcedar on Oklahomarangelands. Pages 45–52 in R.W. Wittwer and D.M. Engle(eds.). Proceedings of the Eastern Redcedar in Oklahomaconference. Oklahoma State University Cooperative Exten-sion Service E-849, Stillwater.
Townsend, D.E. 2004. Ecological heterogeneity: evaluatingsmall mammal communities, soil surface temperature andartificial nest success within grassland ecosystems. Ph.D.Dissertation, Oklahoma State University, Stillwater.
Vallentine, J.F. 1989. Rangeland developments and improve-ments. Brigham Young University Press, Provo, UT.
Wiens, J.A. 1974. Habitat heterogeneity and avian communitystructure in North American grassland birds. AmericanMidland Naturalist 91:195–213.
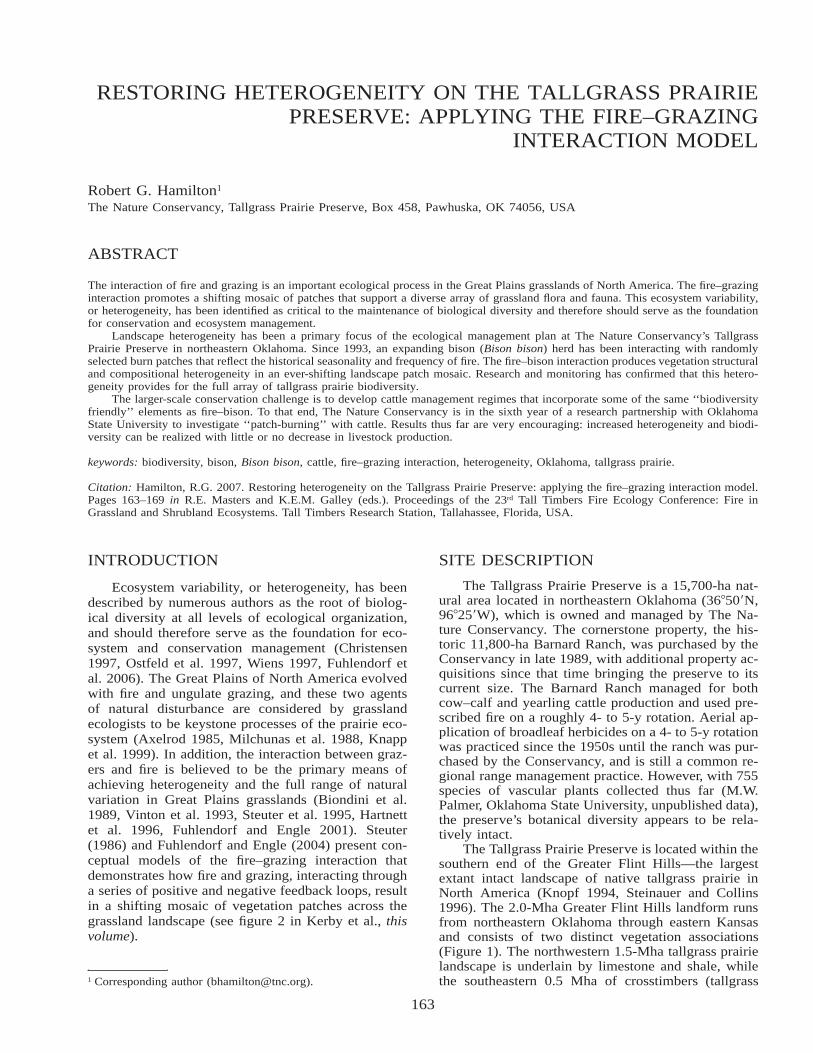
163
RESTORING HETEROGENEITY ON THE TALLGRASS PRAIRIEPRESERVE: APPLYING THE FIRE–GRAZING
INTERACTION MODEL
Robert G. Hamilton1
The Nature Conservancy, Tallgrass Prairie Preserve, Box 458, Pawhuska, OK 74056, USA
ABSTRACT
The interaction of fire and grazing is an important ecological process in the Great Plains grasslands of North America. The fire–grazinginteraction promotes a shifting mosaic of patches that support a diverse array of grassland flora and fauna. This ecosystem variability,or heterogeneity, has been identified as critical to the maintenance of biological diversity and therefore should serve as the foundationfor conservation and ecosystem management.
Landscape heterogeneity has been a primary focus of the ecological management plan at The Nature Conservancy’s TallgrassPrairie Preserve in northeastern Oklahoma. Since 1993, an expanding bison (Bison bison) herd has been interacting with randomlyselected burn patches that reflect the historical seasonality and frequency of fire. The fire–bison interaction produces vegetation structuraland compositional heterogeneity in an ever-shifting landscape patch mosaic. Research and monitoring has confirmed that this hetero-geneity provides for the full array of tallgrass prairie biodiversity.
The larger-scale conservation challenge is to develop cattle management regimes that incorporate some of the same ‘‘biodiversityfriendly’’ elements as fire–bison. To that end, The Nature Conservancy is in the sixth year of a research partnership with OklahomaState University to investigate ‘‘patch-burning’’ with cattle. Results thus far are very encouraging: increased heterogeneity and biodi-versity can be realized with little or no decrease in livestock production.
keywords: biodiversity, bison, Bison bison, cattle, fire–grazing interaction, heterogeneity, Oklahoma, tallgrass prairie.
Citation: Hamilton, R.G. 2007. Restoring heterogeneity on the Tallgrass Prairie Preserve: applying the fire–grazing interaction model.Pages 163–169 in R.E. Masters and K.E.M. Galley (eds.). Proceedings of the 23rd Tall Timbers Fire Ecology Conference: Fire inGrassland and Shrubland Ecosystems. Tall Timbers Research Station, Tallahassee, Florida, USA.
INTRODUCTION
Ecosystem variability, or heterogeneity, has beendescribed by numerous authors as the root of biolog-ical diversity at all levels of ecological organization,and should therefore serve as the foundation for eco-system and conservation management (Christensen1997, Ostfeld et al. 1997, Wiens 1997, Fuhlendorf etal. 2006). The Great Plains of North America evolvedwith fire and ungulate grazing, and these two agentsof natural disturbance are considered by grasslandecologists to be keystone processes of the prairie eco-system (Axelrod 1985, Milchunas et al. 1988, Knappet al. 1999). In addition, the interaction between graz-ers and fire is believed to be the primary means ofachieving heterogeneity and the full range of naturalvariation in Great Plains grasslands (Biondini et al.1989, Vinton et al. 1993, Steuter et al. 1995, Hartnettet al. 1996, Fuhlendorf and Engle 2001). Steuter(1986) and Fuhlendorf and Engle (2004) present con-ceptual models of the fire–grazing interaction thatdemonstrates how fire and grazing, interacting througha series of positive and negative feedback loops, resultin a shifting mosaic of vegetation patches across thegrassland landscape (see figure 2 in Kerby et al., thisvolume).
1 Corresponding author ([email protected]).
SITE DESCRIPTION
The Tallgrass Prairie Preserve is a 15,700-ha nat-ural area located in northeastern Oklahoma (36�50�N,96�25�W), which is owned and managed by The Na-ture Conservancy. The cornerstone property, the his-toric 11,800-ha Barnard Ranch, was purchased by theConservancy in late 1989, with additional property ac-quisitions since that time bringing the preserve to itscurrent size. The Barnard Ranch managed for bothcow–calf and yearling cattle production and used pre-scribed fire on a roughly 4- to 5-y rotation. Aerial ap-plication of broadleaf herbicides on a 4- to 5-y rotationwas practiced since the 1950s until the ranch was pur-chased by the Conservancy, and is still a common re-gional range management practice. However, with 755species of vascular plants collected thus far (M.W.Palmer, Oklahoma State University, unpublished data),the preserve’s botanical diversity appears to be rela-tively intact.
The Tallgrass Prairie Preserve is located within thesouthern end of the Greater Flint Hills—the largestextant intact landscape of native tallgrass prairie inNorth America (Knopf 1994, Steinauer and Collins1996). The 2.0-Mha Greater Flint Hills landform runsfrom northeastern Oklahoma through eastern Kansasand consists of two distinct vegetation associations(Figure 1). The northwestern 1.5-Mha tallgrass prairielandscape is underlain by limestone and shale, whilethe southeastern 0.5 Mha of crosstimbers (tallgrass
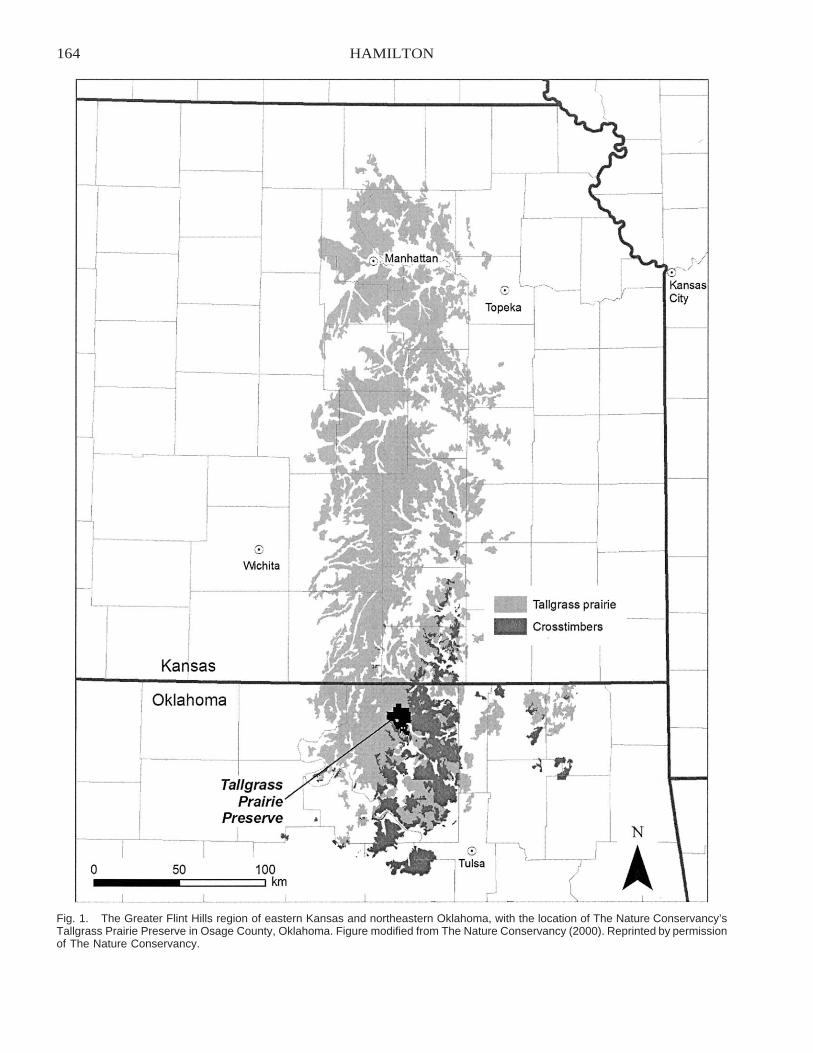
164 HAMILTON
Fig. 1. The Greater Flint Hills region of eastern Kansas and northeastern Oklahoma, with the location of The Nature Conservancy’sTallgrass Prairie Preserve in Osage County, Oklahoma. Figure modified from The Nature Conservancy (2000). Reprinted by permissionof The Nature Conservancy.

165RESTORING TALLGRASS PRAIRIE PRESERVE HETEROGENEITY
prairie and oak woodlands of post oak [Quercus stel-lata] and blackjack oak [Q. marilandica]) is underlainby sandstone and shale. The Tallgrass Prairie Preserveis located on this ecotone and consists of approxi-mately 90% grassland and 10% forest cover. Tallgrassprairie is the dominant grassland (big bluestem [An-dropogon gerardii], Indiangrass [Sorghastrum nu-tans], composite dropseed [Sporobolus compositus],switchgrass [Panicum virgatum], and little bluestem[Schizachyrium scoparium]), but shortgrass prairies(dominated by grama [Bouteloua spp.]) occur on shal-low soils and in ‘‘grazing lawns.’’ Most of the forestedareas on the preserve are crosstimbers, but there aresubstantial areas of floodplain forests and mesic to xe-ric hardwood forests on the upper stream terracesabove Sand Creek. Crosstimbers become the dominantregional vegetation type on the east side of the pre-serve.
Because of its rough topography and shallow,rocky soils, the Greater Flint Hills have not been cul-tivated as was most of the original tallgrass prairie onthe continent. Ranching is the primary economic landuse, with annual spring burning coupled with intensiveearly stocking (IES) of yearling cattle gaining in pop-ularity over the last several decades (Launchbaugh andOwensby 1978, Smith and Owensby 1978, Vermeireand Bidwell 1998). The IES management regime in-volves the intensive early stocking of approximately250 kg/head yearling cattle at twice the season-longstocking rate, but for only the first half of the growingseason. The annual burn–IES range management prac-tice results in uniform grazing use across the entirepasture, and thus a homogeneous landscape with low-ered biodiversity potential. Homogenizing range prac-tices are considered to be one of the leading sourcesof ecological stress in the Flint Hills (The Nature Con-servancy 2000).
ECOLOGICAL MANAGEMENT PLANThe principle of heterogeneity has been a primary
consideration in the development of the ecologicalmanagement plan at Tallgrass Prairie Preserve. Thepreserve’s operating hypothesis is that the best way toachieve The Nature Conservancy’s goal of biodiversityprotection is through the maintenance of a heteroge-neous mix of vegetation (habitat) patches that repre-sent the full range of natural variation. Landscape het-erogeneity will be realized through management re-gimes that couple fire with both native and domesticgrazers. Responses of vegetation and grassland bird tomanagement treatments are presented below in theCattle–Fire section.
There have been several significant revisions to theecological management plan at the Tallgrass PrairiePreserve since the original plan was published (Ham-ilton 1996). I describe those revisions and summarizesome key research results to date.
Bison–Fire
American bison (Bison bison) was the dominantungulate prior to settlement of the Great Plains (Ax-
elrod 1985, Shaw 1995, Shaw and Lee 1997). There-fore, it is intuitive that a large-scale effort to restoreprairie ecosystem dynamics would utilize bison. TheTallgrass Prairie Preserve bison herd was initiated withthe donation of 300 bison in the fall of 1993, whichwere introduced into a year-round unit of 1,960 ha.The area of the bison unit has been expanded eighttimes since then to keep pace with the growing herd(internal recruitment). The bison herd is still growingand currently consists of approximately 2,400 individ-uals in the summer season with calves, occupying aunit of 8,517 ha. The final target herd size of 2,600bison in the summer season will be reached in 2007and occupy a unit of 9,532 ha (Figure 2). On a year-round basis, this herd will be equivalent to 20,200 an-imal-unit months (AUM; 1 AUM is the forage require-ment for 1 mo for a 454-kg animal unit or its equiv-alent).
Both the initial bison stocking rate and fire returninterval were modified in summer 1999. Observationsover the first 5 growing seasons (1994–1998) in thebison–fire unit confirmed that the initial bison stockingrate (forage intake target of 12.5% of annual produc-tion) was a very conservative starting point (50% be-low U.S. Department of Agriculture–Natural Resourc-es Conservation Service [USDA-NRCS] recommen-dations). Abundant standing forage was available tothe herd in all seasons, including several droughtyears. The revised bison forage intake target is 20%intake of annual herbage production, which averagesapproximately 4,300 kg/ha (Bourlier et al. 1979).When combined with an expected similar forage lossfrom animal trampling, total annual forage consump-tion will be approximately 40%, which is 20% belowUSDA-NRCS recommended cow–calf stocking ratesfor the region. The revised bison stocking rate is cal-culated at 2.1 AUM/ha, or 5.7 ha/AU per year (14.1acres/AU per year).
Within the bison unit, there are no internal fencesexcept for one imbedded pasture of 1,500 ha. How-ever, its gates are left open at all times except for sev-eral weeks during roundup when it is used to movethe herd towards the corral. The bison unit is a drive-through, ‘‘open range’’ situation, where visitors candrive 27 km of gravel county roads within the unit.Unfortunately, this public vehicle access within the bi-son unit usually results in the mortality of several an-imals each year from vehicle impacts.
General herd management follows the Conservan-cy’s guidelines for bison management (The NatureConservancy 2002), which emphasizes minimal han-dling and managing for the strengths of bison as a wildspecies. The herd does not receive any supplementalprotein or energy; however, salt with trace minerals isprovided free-choice because some elements may belacking within the bounded landscape. Water is pro-vided by natural stream flow and small, man-madestock ponds. The entire herd is rounded up each falland processed through a bison corral system. Since thehistoric large predators were extirpated over a centuryago, the proper ecological stocking rate is maintainedby culling surplus bison during the roundup, which are
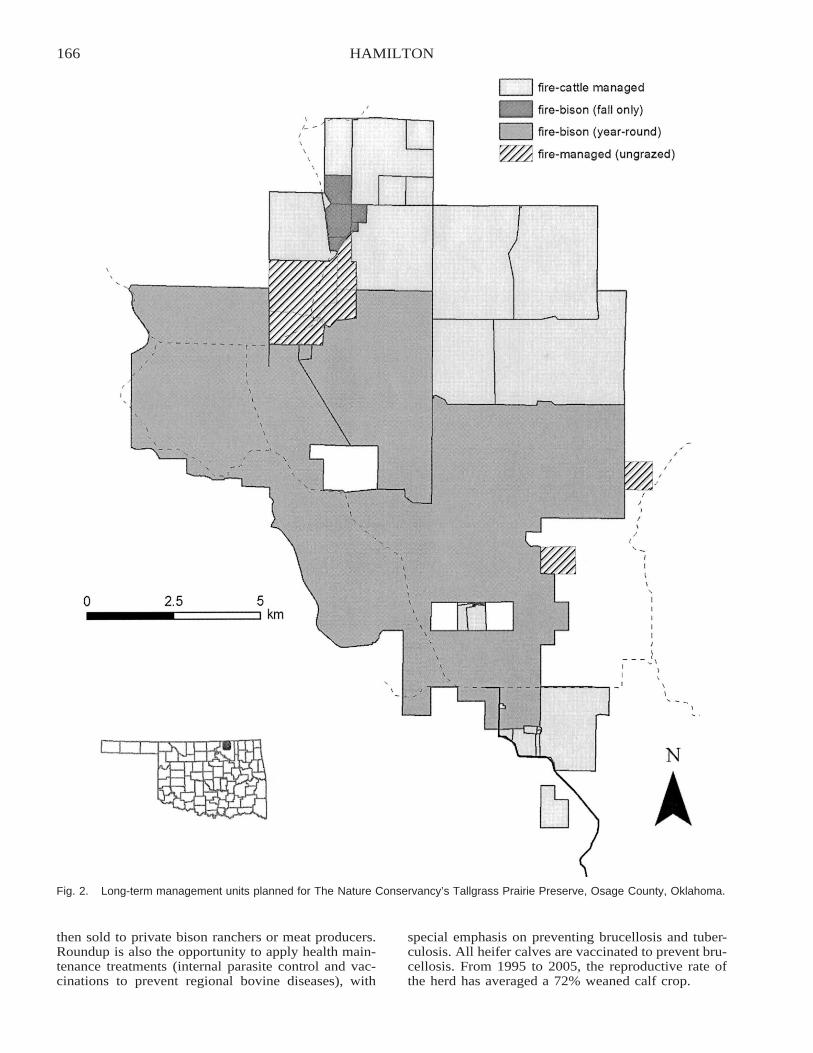
166 HAMILTON
Fig. 2. Long-term management units planned for The Nature Conservancy’s Tallgrass Prairie Preserve, Osage County, Oklahoma.
then sold to private bison ranchers or meat producers.Roundup is also the opportunity to apply health main-tenance treatments (internal parasite control and vac-cinations to prevent regional bovine diseases), with
special emphasis on preventing brucellosis and tuber-culosis. All heifer calves are vaccinated to prevent bru-cellosis. From 1995 to 2005, the reproductive rate ofthe herd has averaged a 72% weaned calf crop.
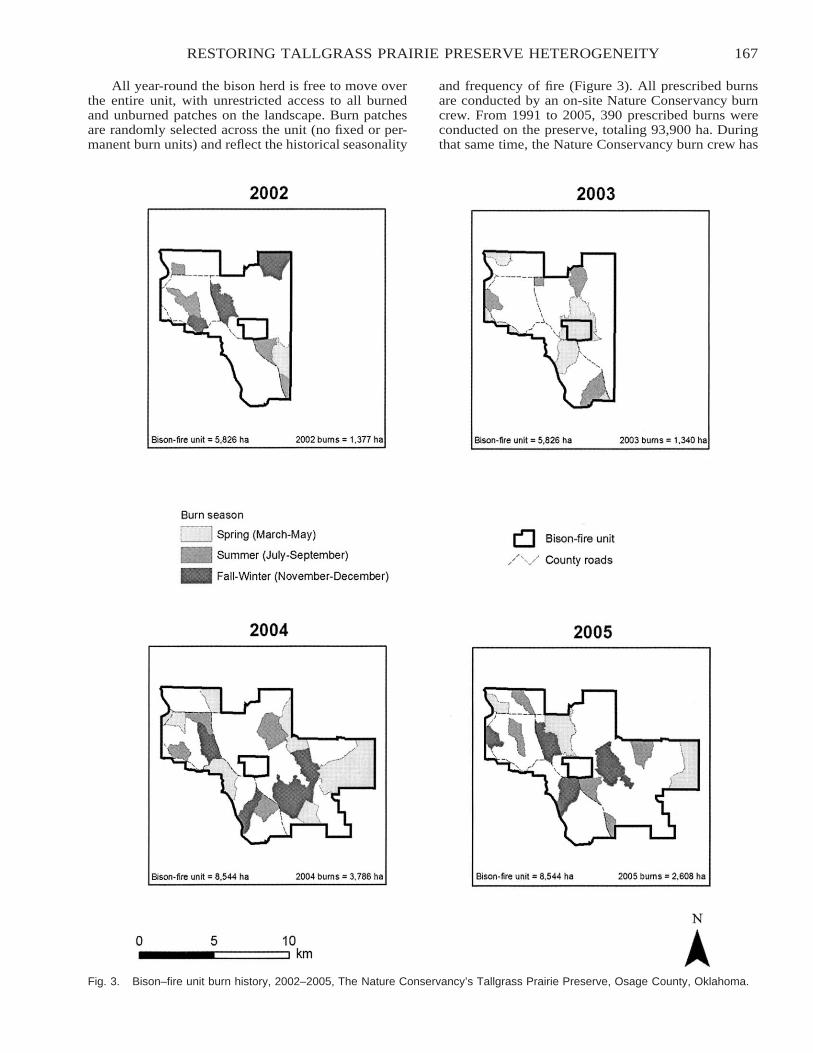
167RESTORING TALLGRASS PRAIRIE PRESERVE HETEROGENEITY
Fig. 3. Bison–fire unit burn history, 2002–2005, The Nature Conservancy’s Tallgrass Prairie Preserve, Osage County, Oklahoma.
All year-round the bison herd is free to move overthe entire unit, with unrestricted access to all burnedand unburned patches on the landscape. Burn patchesare randomly selected across the unit (no fixed or per-manent burn units) and reflect the historical seasonality
and frequency of fire (Figure 3). All prescribed burnsare conducted by an on-site Nature Conservancy burncrew. From 1991 to 2005, 390 prescribed burns wereconducted on the preserve, totaling 93,900 ha. Duringthat same time, the Nature Conservancy burn crew has
168 HAMILTON
also assisted neighboring ranches in burning an addi-tional 79,700 ha and assisted with the suppression of52 wildfires.
The initial fire return interval in the bison unit wasset at 5 y (20% of unit burned each year). However,because of the random selection system used to deter-mine the locations of burn units, some areas were go-ing unburned for a much longer period. Shrubs andtree seedlings were increasing in these long-unburnedareas, suggesting a shorter fire return interval wasneeded. Therefore, the bison unit fire return intervalwas revised in the summer of 1999 to 3 y (33% ofunit burned each year), but the seasonality of the burnswill stay the same: 40% dormant spring (March–April), 20% growing season (July–September), and40% dormant fall (November–December).
In general, the Tallgrass Prairie Preserve bisonherd has reacted to fire as expected, but there havebeen some interesting findings from on-site research.In particular, diet selection: studies at various GreatPlains sites have consistently shown bison to bestrongly graminivorous, usually with graminoids mak-ing up �90% of their diets (Hartnett et al. 1997, Steu-ter and Hidinger 1999). However, Coppedge et al.(1998b) found that the preserve bison herd is extreme-ly focused on grasses and sedges (Carex spp.) and ob-tain not �98% of their diet from graminoids on a year-round basis. As expected, there is a significant bison–fire interaction, with strong selection for recentlyburned patches during the growing season due to theincreased forage quality of the regrowth following aburn (Coppedge and Shaw 1998, Coppedge et al.1998a, Biondini et al. 1999). Interestingly, there wasalso a lesser but still preferential use of recent burnpatches in the dormant season. Although the tallgrassprairie is dominated by warm-season grasses, cool-sea-son sedges were accessible on burn patches in the dor-mant season and accounted for up to 39% and 62% ofbison diets in winter and spring, respectively (Cop-pedge et al. 1998b). Due to this strong selection forgraminoids, forbs increase dramatically within recentlyburned and grazed patches, but native warm-seasongrasses regain their dominance several years post-burn.
Cattle–Fire
The original management plan for the TallgrassPrairie Preserve called for nearly complete eliminationof cattle grazing once the bison herd covered most ofthe preserve (Hamilton 1996). However, the long-termbison/cattle plan was revised in late 2002 and nowcalls for a significant portion of the property to be keptin experimental treatments using cattle, while the‘‘core preserve’’ bison–fire unit has been modestlyscaled back (but will still constitute the dominant man-agement treatment). This revision was prompted by theencouraging results from collaborative cattle ‘‘patch-burn’’ research initiated on 2,350 ha at the preserve in2001 with Oklahoma State University (OSU). Thisproject is comparing traditional intensive early stock-ing (IES) with patch-burn treatments. IES consists ofannual spring burning coupled with stocking double
the density of yearling cattle, but only for the first halfof the grazing season. The patch-burn treatments con-sist of burning only one-third of a cattle pasture eachyear (entire pasture burned after 3 y) and still stockingit at IES levels. Results thus far are very encouraging:patch-burn treatments increased heterogeneity and bio-diversity with little or no decrease in livestock pro-duction when compared with traditional IES treat-ments (Fuhlendorf and Engle 2004). Fuhlendorf et al.(2006: figures 2, 4) found from the cattle patch-burnresearch conducted on the preserve that increasing thespatial and temporal heterogeneity of grassland distur-bances increases vegetation variability, thus supportinga greater diversity of grassland birds.
Although the above bison–fire regime has provento be very attractive for biodiversity conservation, itis unlikely to be very exportable to the private ranch-ing industry that dominates the Flint Hills. Instead, amore productive strategy is to engage with conserva-tion partners in the development of progressive cattlemanagement systems, such as patch-burning, in an ef-fort to impact the conservation of the Flint Hills (andother native prairie) landscapes. Starting in 2008, thenext generation of patch-burn research with OSU willbegin on 4,350 ha and will be testing a wider array offire return intervals (2–4 y) and season of fire (spring-only and spring-plus-summer) using season-long graz-ing with yearling cattle.
ECOLOGICAL RESEARCH
In May 2004, construction of the Tallgrass PrairieEcological Research Station was completed at the pre-serve headquarters in a partnership with the Universityof Tulsa. This modern laboratory and classroom facil-ity will greatly enhance applied and basic ecologicalresearch on the preserve. More than three dozen re-search projects are currently active on the preserve,and 95 articles in scientific journals have been pub-lished. Information regarding research facilities, poli-cies, and GIS data layers can be accessed by going toThe Nature Conservancy’s website at http://www.nature.org, then navigating to Oklahoma, TallgrassPrairie Preserve, then Prairie Science.
LITERATURE CITEDAxelrod, D.I. 1985. Rise of the grassland biome, central North
America. Botanical Review 51:163–201.Biondini, M.E., A.A. Steuter, and C.E. Grygiel. 1989. Seasonal
fire effects on the diversity patterns, spatial distribution, andcommunity structure of forbs in the northern mixed prairie,USA. Vegetatio 85:21–31.
Biondini, M.E., A.A. Steuter, and R.G. Hamilton. 1999. Bisonuse of fire-managed remnant prairies. Journal of RangeManagement 52:454–461.
Bourlier, B.G., J.D. Nichols, W.J. Ringwald, P.J. Workman, andS. Clemmons. 1979. Soil survey of Osage County,Oklahoma. National Cooperative Soil Survey, Washington,D.C.
Christensen, N.L. 1997. Managing for heterogeneity and com-plexity on dynamic landscapes. Pages 167–186 in S.T.A.Pickett, R.S. Ostfeld, M. Shachak, and G.E. Likens (eds.).
169RESTORING TALLGRASS PRAIRIE PRESERVE HETEROGENEITY
The ecological basis for conservation: heterogeneity, eco-systems, and biodiversity. Chapman and Hall, New York.
Coppedge, B.R., D.M. Engle, C.S. Toepfer, and J.H. Shaw.1998a. Effects of seasonal fire, bison grazing, and climaticvariation on tallgrass prairie vegetation. Plant Ecology 139:235–246.
Coppedge, B.R., D.M. Leslie Jr., and J.H. Shaw. 1998b. Botan-ical composition of bison diets on tallgrass prairie inOklahoma. Journal of Range Management 51:379–382.
Coppedge, B.R., and J.H. Shaw. 1998. Bison grazing patternson seasonally burned tallgrass prairie. Journal of RangeManagement 51:258–264.
Fuhlendorf, S.D., and D.M. Engle. 2001. Restoring heteroge-neity on rangelands: ecosystem management based on evo-lutionary grazing patterns. BioScience 51:625–632.
Fuhlendorf, S.D., and D.M. Engle. 2004. Application of the fire–grazing interaction to restore a shifting mosaic on tallgrassprairie. Journal of Applied Ecology 41:604–616.
Fuhlendorf, S.D., W.C. Harrel, D.M. Engle, R.G. Hamilton, C.A.Davis, and D.M. Leslie Jr. 2006. Should heterogeneity bethe basis for conservation? Grassland bird response to fireand grazing. Ecological Applications 16:1706–1716.
Hamilton, R.G. 1996. Using fire and bison to restore a functionaltallgrass prairie landscape. Transactions of the North Amer-ican Wildlife and Natural Resources Conference 61:208–214.
Hartnett, D.C., K.R. Hickman, and L.E. Fischer-Walter. 1996.Effects of bison grazing, fire, and topography on floristicdiversity in tallgrass prairie. Journal of Range Management49:413–420.
Hartnett, D.C., A.A. Steuter, and K.R. Hickman. 1997. Compar-ative ecology of native and introduced ungulates. Pages 72–101 in F.L. Knopf and F.B. Samson (eds.). Ecology andconservation of Great Plains vertebrates. Springer, NewYork.
Knapp, A.K., J.M. Briggs, S.L. Collins, D.C. Hartnett, L.C.Johnson, and E.G. Towne. 1999. The keystone role of bisonin North American tallgrass prairie. BioScience 49:39–50.
Knopf, F.L. 1994. Avian assemblages on altered grasslands.Studies in Avian Biology 15:247–257.
Launchbaugh, J.L., and C.E. Owensby. 1978. Kansas rangelands:their management based on a half century of research. Bul-letin 662, Kansas Agricultural Experiment Station, Man-hattan.
Milchunas, D.G., O.E. Sala, and W.K. Lauenroth. 1988. A gen-eralized model of the effects of grazing by large herbivoreson grassland community structure. American Naturalist132:87–106.
Ostfeld, R.S., S.T.A. Pickett, M. Shackak, and G.E. Likens.1997. Defining scientific issues. Pages 3–10 in S.T.A. Pick-ett, R.S. Ostfeld, M. Shachak, and G.E. Likens (eds.). Theecological basis for conservation: heterogeneity, ecosys-tems, and biodiversity. Chapman and Hall, New York.
Shaw, J.H. 1995. How many bison originally populated westernrangelands? Rangelands 17:148–150.
Shaw, J.H., and M. Lee. 1997. Relative abundance of bison, elk,and pronghorn on the southern Plains, 1806–1857. PlainsAnthropologist 42:163–172.
Smith, E.F., and C.E. Owensby. 1978. Intensive early stockingand season-long stocking of Kansas Flint Hills range. Jour-nal of Range Management 31:14–17.
Steinauer, E.M., and S.L. Collins. 1996. Prairie ecology—thetallgrass prairie. Pages 39–52 in F.B. Samson and F.L.Knopf (eds.). Prairie conservation. Island Press, Washing-ton, D.C.
Steuter, A.A. 1986. Fire behavior and standing crop character-istics on repeated seasonal burns: northern mixed prairie.Pages 54–59 in A.L. Koonce (ed.). Prescribed burning inthe Midwest: state of the art. University of Wisconsin, Col-lege of Natural Resources, Fire Science Center, StevensPoint.
Steuter, A.A., and L. Hidinger. 1999. Comparative ecology ofbison and cattle on mixed-grass prairie. Great Plains Re-search 9:329–342.
Steuter, A.A., E.M. Steinauer, G.L. Hill, P.A. Bowers, and L.L.Tieszen. 1995. Distribution and diet of bison and pocketgophers in a sandhill prairie. Ecological Applications 5:756–766.
The Nature Conservancy. 2000. Ecoregional conservation in theOsage Plains/Flint Hills Prairie. The Nature Conservancy,Midwestern Resource Office, Minneapolis, MN.
The Nature Conservancy. 2002. Guidelines for bison manage-ment. T.K. Bragg, B. Hamilton, and A. Steuter (eds.). TheNature Conservancy, Arlington, VA.
Vermeire, L.T., and T.G. Bidwell. 1998. Intensive early stocking.Oklahoma State University Extension Facts F-2875,Oklahoma Cooperative Extension Service, Stillwater.
Vinton, M.A., D.C. Hartnett, E.J. Finck, and J.M. Briggs. 1993.Interactive effects of fire, bison (Bison bison) grazing, andplant community composition in tallgrass prairie. AmericanMidland Naturalist 129:10–18.
Wiens, J.A. 1997. The emerging role of patchiness in conser-vation biology. Pages 93–107 in S.T.A. Pickett, R.S. Ost-feld, M. Shachak, and G.E. Likens (eds.). The ecologicalbasis for conservation: heterogeneity, ecosystems, and bio-diversity. Chapman and Hall, New York.
170
COMPARISON OF BEHAVE: FIRE BEHAVIOR PREDICTIONAND FUEL MODELING SYSTEM PREDICTIONS WITH
OBSERVED FIRE BEHAVIOR VARYING BY SEASONAND FREQUENCY
Jeffrey C. Sparks1 and Ronald E. Masters2,3
Department of Forestry, Oklahoma State University, Stillwater, OK 74078, USA
David M. Engle4
Department of Plant and Soil Sciences, Oklahoma State University, Stillwater, OK 74078, USA
George A. BukenhoferU.S. Department of Agriculture, Forest Service, 1720 Peachtree Road, NW, Atlanta, GA 30309, USA
Mark E. PaytonOklahoma State University, Department of Statistics, Stillwater, OK 74078, USA
ABSTRACT
Managers are increasingly using computer models to predict prescribed fire behavior in various seasons and under different fuelconditions. Because fire behavior is related to fire effects on vegetation, validation of computer models will help understand possibleoutcomes and increase planning efficacy. Better predictions of fire behavior also will aid in management of risk associated withprescribed burning. We compared fire behavior predicted with BEHAVE, fire behavior and fuel modeling system, using standard andsite-specific customized fuel models with observed fire behavior of strip headfires. These fires were observed in shortleaf pine (Pinusechinata)–dominated stands managed as pine–grassland stands for the endangered red-cockaded woodpecker (Picoides borealis). Weevaluated the accuracy of fuel models across different seasons and fire return intervals.
Fuels in all stands tended to be heterogeneous and discontinuous, with fuel loads differing considerably between growing anddormant seasons and time since burned both in weight and composition. Fuel models varied in accuracy depending on fuel loadingand season of fire. Therefore, multiple fuel models were required to more accurately characterize fire behavior across fire seasons andfire return intervals. All fuel models failed to produce accurate predictions for fireline intensity and rate of spread. All fuel modelstended to overpredict fireline intensity on low-intensity fires and underpredict fireline intensity on high-intensity fires. The firing patternwe chose may have influenced the accuracy of predictions, but we were unable to detect appreciable changes in wind speed due topresumed convective influences of backing and headfires approaching each other. Additional BEHAVE fuel models for a wider rangeof fuel conditions show some promise in providing managers with more realistic predictions of fire behavior under variable fuelconditions. However, field validation for specific sites is imperative.
keywords: Arkansas, ecosystem restoration, fire behavior, fire ecology, fire models, Pinus echinata, prescribed burning, shortleaf pine.
Citation: Sparks, J.C., R.E. Masters, D.M. Engle, G.A. Bukenhofer, and M.E. Payton. 2007. Comparison of BEHAVE: fire behaviorprediction and fuel modeling system predictions with observed fire behavior varying by season and frequency. Pages 170–180 in R.E.Masters and K.E.M. Galley (eds.). Proceedings of the 23rd Tall Timbers Fire Ecology Conference: Fire in Grassland and ShrublandEcosystems. Tall Timbers Research Station, Tallahassee, Florida, USA.
INTRODUCTION
Fire is a natural and dynamic force that played amajor role in presettlement landscape development inboth forest and rangeland communities worldwide(Christensen et al. 1981, Gill 1981, Wright and Bailey
1 Current address: Texas Parks and Wildlife Department, 12016FM 848, Tyler, TX 75707, USA.2 Current address: Tall Timbers Research Station, 13093 HenryBeadel Drive, Tallahassee, FL 32312-0913, USA.3 Corresponding author ([email protected]).4 Current address: Iowa State University, Department of NaturalResources Ecology & Management, 339 Science II, Ames, IA50011-3221, USA.
1982, Chandler et al. 1983, Bigalke and Willan 1984,Kruger 1984, Pyne 1984, Sparks and Masters 1996).However, fire control and prevention has altered manyof these fire-derived communities, often causing manyplant and animal species dependent on these commu-nities to decline or become endangered. Land man-agers throughout the world attempt to restore andmaintain relicts of these communities by initiating pre-scribed fire to meet specific objectives such as endan-gered species management, manipulation of commu-nity composition, fire hazard reduction, wildlife habitatimprovement, control of woody or invasive species,and seedbed preparation (Van Lear 1985, Waldrop etal. 1992, Wilson et al. 1995, Masters et al. 1996).
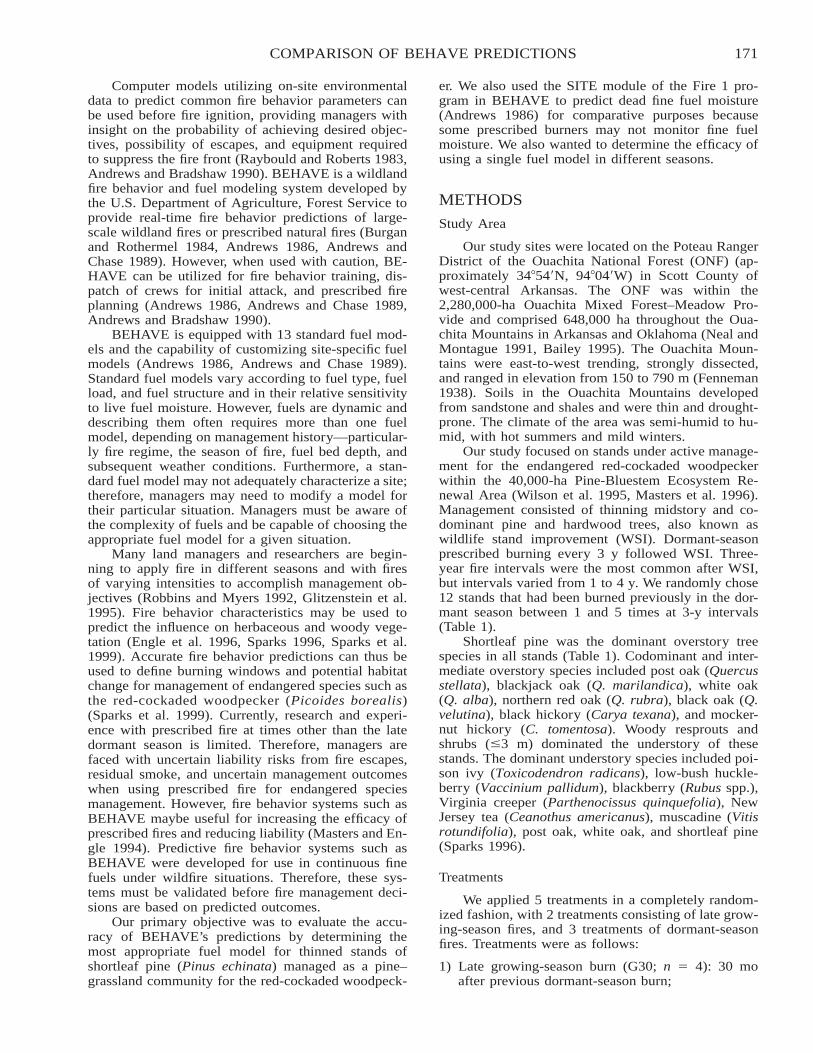
171COMPARISON OF BEHAVE PREDICTIONS
Computer models utilizing on-site environmentaldata to predict common fire behavior parameters canbe used before fire ignition, providing managers withinsight on the probability of achieving desired objec-tives, possibility of escapes, and equipment requiredto suppress the fire front (Raybould and Roberts 1983,Andrews and Bradshaw 1990). BEHAVE is a wildlandfire behavior and fuel modeling system developed bythe U.S. Department of Agriculture, Forest Service toprovide real-time fire behavior predictions of large-scale wildland fires or prescribed natural fires (Burganand Rothermel 1984, Andrews 1986, Andrews andChase 1989). However, when used with caution, BE-HAVE can be utilized for fire behavior training, dis-patch of crews for initial attack, and prescribed fireplanning (Andrews 1986, Andrews and Chase 1989,Andrews and Bradshaw 1990).
BEHAVE is equipped with 13 standard fuel mod-els and the capability of customizing site-specific fuelmodels (Andrews 1986, Andrews and Chase 1989).Standard fuel models vary according to fuel type, fuelload, and fuel structure and in their relative sensitivityto live fuel moisture. However, fuels are dynamic anddescribing them often requires more than one fuelmodel, depending on management history—particular-ly fire regime, the season of fire, fuel bed depth, andsubsequent weather conditions. Furthermore, a stan-dard fuel model may not adequately characterize a site;therefore, managers may need to modify a model fortheir particular situation. Managers must be aware ofthe complexity of fuels and be capable of choosing theappropriate fuel model for a given situation.
Many land managers and researchers are begin-ning to apply fire in different seasons and with firesof varying intensities to accomplish management ob-jectives (Robbins and Myers 1992, Glitzenstein et al.1995). Fire behavior characteristics may be used topredict the influence on herbaceous and woody vege-tation (Engle et al. 1996, Sparks 1996, Sparks et al.1999). Accurate fire behavior predictions can thus beused to define burning windows and potential habitatchange for management of endangered species such asthe red-cockaded woodpecker (Picoides borealis)(Sparks et al. 1999). Currently, research and experi-ence with prescribed fire at times other than the latedormant season is limited. Therefore, managers arefaced with uncertain liability risks from fire escapes,residual smoke, and uncertain management outcomeswhen using prescribed fire for endangered speciesmanagement. However, fire behavior systems such asBEHAVE maybe useful for increasing the efficacy ofprescribed fires and reducing liability (Masters and En-gle 1994). Predictive fire behavior systems such asBEHAVE were developed for use in continuous finefuels under wildfire situations. Therefore, these sys-tems must be validated before fire management deci-sions are based on predicted outcomes.
Our primary objective was to evaluate the accu-racy of BEHAVE’s predictions by determining themost appropriate fuel model for thinned stands ofshortleaf pine (Pinus echinata) managed as a pine–grassland community for the red-cockaded woodpeck-
er. We also used the SITE module of the Fire 1 pro-gram in BEHAVE to predict dead fine fuel moisture(Andrews 1986) for comparative purposes becausesome prescribed burners may not monitor fine fuelmoisture. We also wanted to determine the efficacy ofusing a single fuel model in different seasons.
METHODS
Study Area
Our study sites were located on the Poteau RangerDistrict of the Ouachita National Forest (ONF) (ap-proximately 34�54�N, 94�04�W) in Scott County ofwest-central Arkansas. The ONF was within the2,280,000-ha Ouachita Mixed Forest–Meadow Pro-vide and comprised 648,000 ha throughout the Oua-chita Mountains in Arkansas and Oklahoma (Neal andMontague 1991, Bailey 1995). The Ouachita Moun-tains were east-to-west trending, strongly dissected,and ranged in elevation from 150 to 790 m (Fenneman1938). Soils in the Ouachita Mountains developedfrom sandstone and shales and were thin and drought-prone. The climate of the area was semi-humid to hu-mid, with hot summers and mild winters.
Our study focused on stands under active manage-ment for the endangered red-cockaded woodpeckerwithin the 40,000-ha Pine-Bluestem Ecosystem Re-newal Area (Wilson et al. 1995, Masters et al. 1996).Management consisted of thinning midstory and co-dominant pine and hardwood trees, also known aswildlife stand improvement (WSI). Dormant-seasonprescribed burning every 3 y followed WSI. Three-year fire intervals were the most common after WSI,but intervals varied from 1 to 4 y. We randomly chose12 stands that had been burned previously in the dor-mant season between 1 and 5 times at 3-y intervals(Table 1).
Shortleaf pine was the dominant overstory treespecies in all stands (Table 1). Codominant and inter-mediate overstory species included post oak (Quercusstellata), blackjack oak (Q. marilandica), white oak(Q. alba), northern red oak (Q. rubra), black oak (Q.velutina), black hickory (Carya texana), and mocker-nut hickory (C. tomentosa). Woody resprouts andshrubs (�3 m) dominated the understory of thesestands. The dominant understory species included poi-son ivy (Toxicodendron radicans), low-bush huckle-berry (Vaccinium pallidum), blackberry (Rubus spp.),Virginia creeper (Parthenocissus quinquefolia), NewJersey tea (Ceanothus americanus), muscadine (Vitisrotundifolia), post oak, white oak, and shortleaf pine(Sparks 1996).
Treatments
We applied 5 treatments in a completely random-ized fashion, with 2 treatments consisting of late grow-ing-season fires, and 3 treatments of dormant-seasonfires. Treatments were as follows:
1) Late growing-season burn (G30; n � 4): 30 moafter previous dormant-season burn;
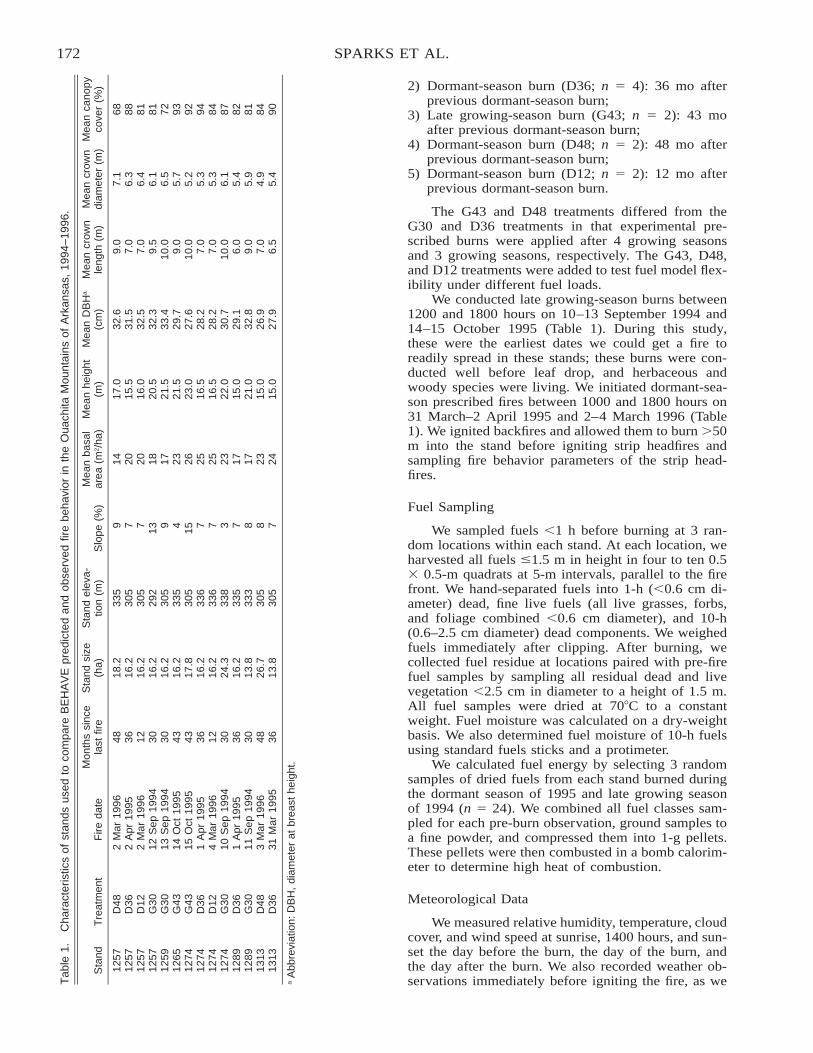
172 SPARKS ET AL.T
able
1.C
hara
cter
istic
sof
stan
dsus
edto
com
pare
BE
HA
VE
pred
icte
dan
dob
serv
edfir
ebe
havi
orin
the
Oua
chita
Mou
ntai
nsof
Ark
ansa
s,19
94–1
996.
Sta
ndT
reat
men
tF
ireda
teM
onth
ssi
nce
last
fire
Sta
ndsi
ze(h
a)S
tand
elev
a-tio
n(m
)S
lope
(%)
Mea
nba
sal
area
(m2/h
a)M
ean
heig
ht(m
)M
ean
DB
Ha
(cm
)M
ean
crow
nle
ngth
(m)
Mea
ncr
own
diam
eter
(m)
Mea
nca
nopy
cove
r(%
)
1257
D48
2M
ar19
9648
18.2
335
914
17.0
32.6
9.0
7.1
6812
57D
362
Apr
1995
3616
.230
57
2015
.531
.57.
06.
388
1257
D12
2M
ar19
9612
16.2
305
720
16.0
32.5
7.0
6.4
8112
57G
3012
Sep
1994
3016
.229
213
1820
.532
.39.
56.
181
1259
G30
13S
ep19
9430
16.2
305
917
21.5
33.4
10.0
6.5
7212
65G
4314
Oct
1995
4316
.233
54
2321
.529
.79.
05.
793
1274
G43
15O
ct19
9543
17.8
305
1526
23.0
27.6
10.0
5.2
9212
74D
361
Apr
1995
3616
.233
67
2516
.528
.27.
05.
394
1274
D12
4M
ar19
9612
16.2
336
725
16.5
28.2
7.0
5.3
8412
74G
3010
Sep
1994
3024
.333
83
2322
.030
.710
.06.
187
1289
D36
1A
pr19
9536
16.2
335
717
15.0
29.1
6.0
5.4
8212
89G
3011
Sep
1994
3013
.833
38
1721
.032
.89.
05.
981
1313
D48
3M
ar19
9648
26.7
305
823
15.0
26.9
7.0
4.9
8413
13D
3631
Mar
1995
3613
.830
57
2415
.027
.96.
55.
490
aA
bbre
viat
ion:
DB
H,
diam
eter
atbr
east
heig
ht.
2) Dormant-season burn (D36; n � 4): 36 mo afterprevious dormant-season burn;
3) Late growing-season burn (G43; n � 2): 43 moafter previous dormant-season burn;
4) Dormant-season burn (D48; n � 2): 48 mo afterprevious dormant-season burn;
5) Dormant-season burn (D12; n � 2): 12 mo afterprevious dormant-season burn.
The G43 and D48 treatments differed from theG30 and D36 treatments in that experimental pre-scribed burns were applied after 4 growing seasonsand 3 growing seasons, respectively. The G43, D48,and D12 treatments were added to test fuel model flex-ibility under different fuel loads.
We conducted late growing-season burns between1200 and 1800 hours on 10–13 September 1994 and14–15 October 1995 (Table 1). During this study,these were the earliest dates we could get a fire toreadily spread in these stands; these burns were con-ducted well before leaf drop, and herbaceous andwoody species were living. We initiated dormant-sea-son prescribed fires between 1000 and 1800 hours on31 March–2 April 1995 and 2–4 March 1996 (Table1). We ignited backfires and allowed them to burn �50m into the stand before igniting strip headfires andsampling fire behavior parameters of the strip head-fires.
Fuel Sampling
We sampled fuels �1 h before burning at 3 ran-dom locations within each stand. At each location, weharvested all fuels �1.5 m in height in four to ten 0.5� 0.5-m quadrats at 5-m intervals, parallel to the firefront. We hand-separated fuels into 1-h (�0.6 cm di-ameter) dead, fine live fuels (all live grasses, forbs,and foliage combined �0.6 cm diameter), and 10-h(0.6–2.5 cm diameter) dead components. We weighedfuels immediately after clipping. After burning, wecollected fuel residue at locations paired with pre-firefuel samples by sampling all residual dead and livevegetation �2.5 cm in diameter to a height of 1.5 m.All fuel samples were dried at 70�C to a constantweight. Fuel moisture was calculated on a dry-weightbasis. We also determined fuel moisture of 10-h fuelsusing standard fuels sticks and a protimeter.
We calculated fuel energy by selecting 3 randomsamples of dried fuels from each stand burned duringthe dormant season of 1995 and late growing seasonof 1994 (n � 24). We combined all fuel classes sam-pled for each pre-burn observation, ground samples toa fine powder, and compressed them into 1-g pellets.These pellets were then combusted in a bomb calorim-eter to determine high heat of combustion.
Meteorological Data
We measured relative humidity, temperature, cloudcover, and wind speed at sunrise, 1400 hours, and sun-set the day before the burn, the day of the burn, andthe day after the burn. We also recorded weather ob-servations immediately before igniting the fire, as we
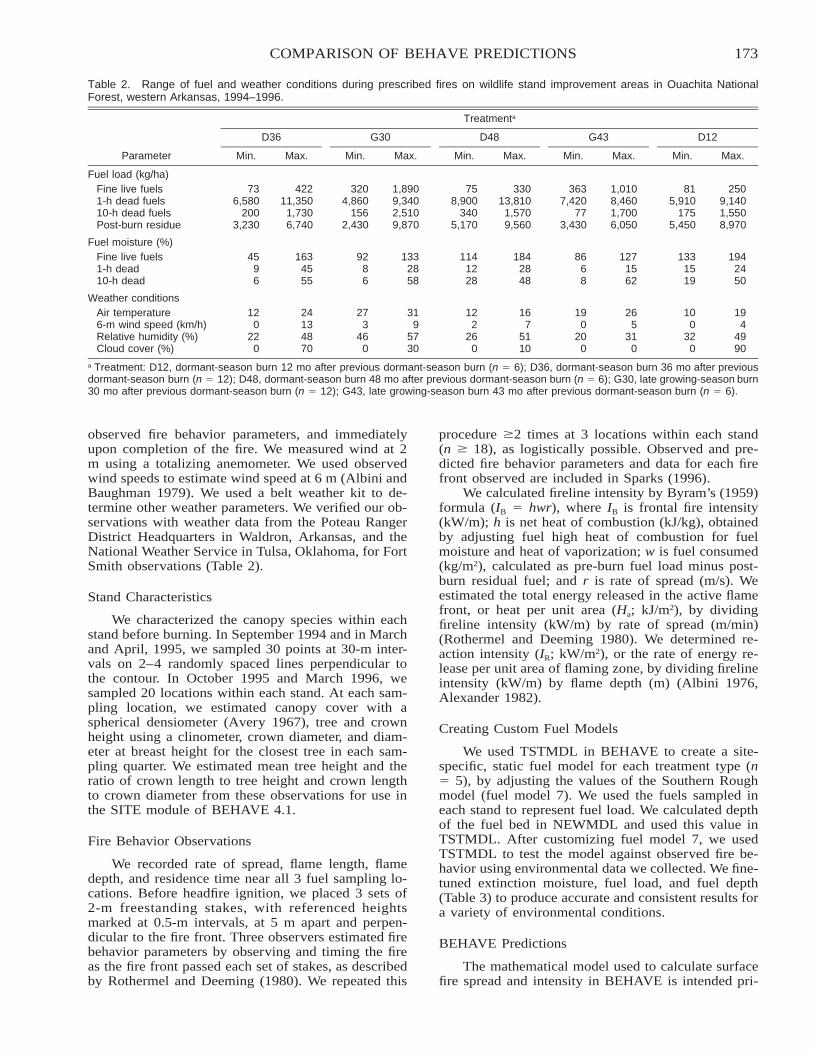
173COMPARISON OF BEHAVE PREDICTIONS
Table 2. Range of fuel and weather conditions during prescribed fires on wildlife stand improvement areas in Ouachita NationalForest, western Arkansas, 1994–1996.
Parameter
Treatmenta
D36
Min. Max.
G30
Min. Max.
D48
Min. Max.
G43
Min. Max.
D12
Min. Max.
Fuel load (kg/ha)Fine live fuels 73 422 320 1,890 75 330 363 1,010 81 2501-h dead fuels 6,580 11,350 4,860 9,340 8,900 13,810 7,420 8,460 5,910 9,14010-h dead fuels 200 1,730 156 2,510 340 1,570 77 1,700 175 1,550Post-burn residue 3,230 6,740 2,430 9,870 5,170 9,560 3,430 6,050 5,450 8,970
Fuel moisture (%)Fine live fuels 45 163 92 133 114 184 86 127 133 1941-h dead 9 45 8 28 12 28 6 15 15 2410-h dead 6 55 6 58 28 48 8 62 19 50
Weather conditionsAir temperature 12 24 27 31 12 16 19 26 10 196-m wind speed (km/h) 0 13 3 9 2 7 0 5 0 4Relative humidity (%) 22 48 46 57 26 51 20 31 32 49Cloud cover (%) 0 70 0 30 0 10 0 0 0 90
a Treatment: D12, dormant-season burn 12 mo after previous dormant-season burn (n � 6); D36, dormant-season burn 36 mo after previousdormant-season burn (n � 12); D48, dormant-season burn 48 mo after previous dormant-season burn (n � 6); G30, late growing-season burn30 mo after previous dormant-season burn (n � 12); G43, late growing-season burn 43 mo after previous dormant-season burn (n � 6).
observed fire behavior parameters, and immediatelyupon completion of the fire. We measured wind at 2m using a totalizing anemometer. We used observedwind speeds to estimate wind speed at 6 m (Albini andBaughman 1979). We used a belt weather kit to de-termine other weather parameters. We verified our ob-servations with weather data from the Poteau RangerDistrict Headquarters in Waldron, Arkansas, and theNational Weather Service in Tulsa, Oklahoma, for FortSmith observations (Table 2).
Stand Characteristics
We characterized the canopy species within eachstand before burning. In September 1994 and in Marchand April, 1995, we sampled 30 points at 30-m inter-vals on 2–4 randomly spaced lines perpendicular tothe contour. In October 1995 and March 1996, wesampled 20 locations within each stand. At each sam-pling location, we estimated canopy cover with aspherical densiometer (Avery 1967), tree and crownheight using a clinometer, crown diameter, and diam-eter at breast height for the closest tree in each sam-pling quarter. We estimated mean tree height and theratio of crown length to tree height and crown lengthto crown diameter from these observations for use inthe SITE module of BEHAVE 4.1.
Fire Behavior Observations
We recorded rate of spread, flame length, flamedepth, and residence time near all 3 fuel sampling lo-cations. Before headfire ignition, we placed 3 sets of2-m freestanding stakes, with referenced heightsmarked at 0.5-m intervals, at 5 m apart and perpen-dicular to the fire front. Three observers estimated firebehavior parameters by observing and timing the fireas the fire front passed each set of stakes, as describedby Rothermel and Deeming (1980). We repeated this
procedure �2 times at 3 locations within each stand(n � 18), as logistically possible. Observed and pre-dicted fire behavior parameters and data for each firefront observed are included in Sparks (1996).
We calculated fireline intensity by Byram’s (1959)formula (IB � hwr), where IB is frontal fire intensity(kW/m); h is net heat of combustion (kJ/kg), obtainedby adjusting fuel high heat of combustion for fuelmoisture and heat of vaporization; w is fuel consumed(kg/m2), calculated as pre-burn fuel load minus post-burn residual fuel; and r is rate of spread (m/s). Weestimated the total energy released in the active flamefront, or heat per unit area (Ha; kJ/m2), by dividingfireline intensity (kW/m) by rate of spread (m/min)(Rothermel and Deeming 1980). We determined re-action intensity (IR; kW/m2), or the rate of energy re-lease per unit area of flaming zone, by dividing firelineintensity (kW/m) by flame depth (m) (Albini 1976,Alexander 1982).
Creating Custom Fuel Models
We used TSTMDL in BEHAVE to create a site-specific, static fuel model for each treatment type (n� 5), by adjusting the values of the Southern Roughmodel (fuel model 7). We used the fuels sampled ineach stand to represent fuel load. We calculated depthof the fuel bed in NEWMDL and used this value inTSTMDL. After customizing fuel model 7, we usedTSTMDL to test the model against observed fire be-havior using environmental data we collected. We fine-tuned extinction moisture, fuel load, and fuel depth(Table 3) to produce accurate and consistent results fora variety of environmental conditions.
BEHAVE Predictions
The mathematical model used to calculate surfacefire spread and intensity in BEHAVE is intended pri-
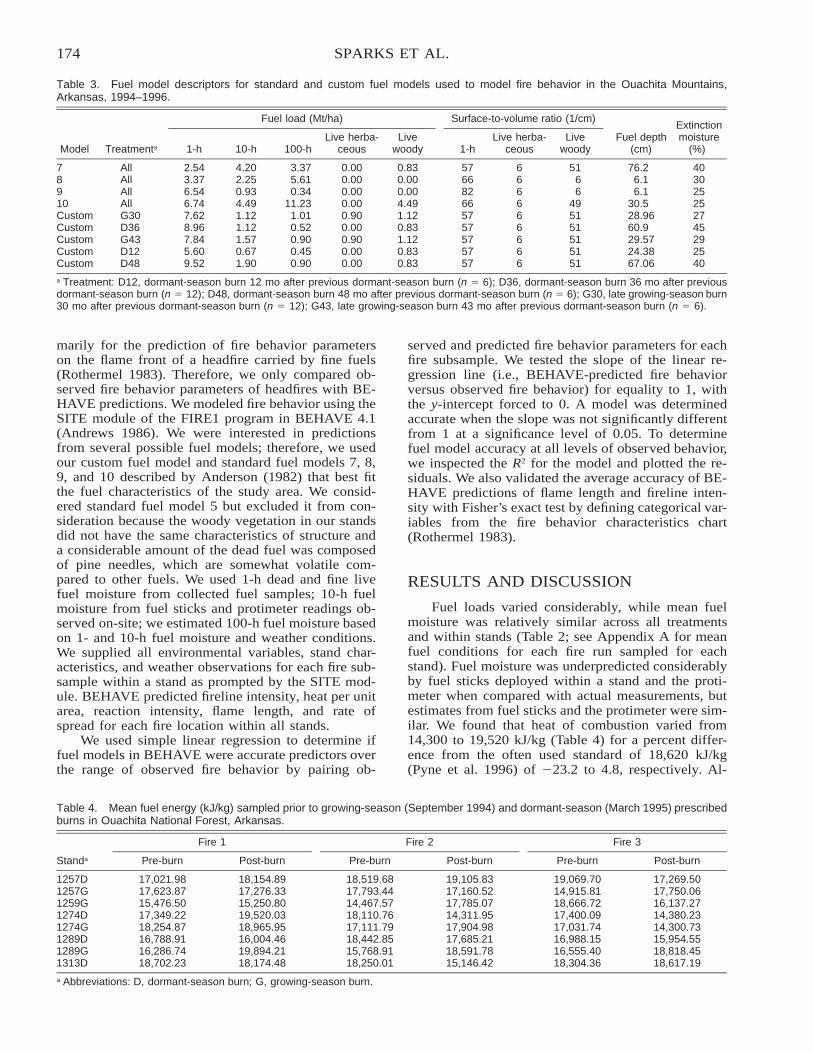
174 SPARKS ET AL.
Table 3. Fuel model descriptors for standard and custom fuel models used to model fire behavior in the Ouachita Mountains,Arkansas, 1994–1996.
Model Treatmenta
Fuel load (Mt/ha)
1-h 10-h 100-hLive herba-
ceousLive
woody
Surface-to-volume ratio (1/cm)
1-hLive herba-
ceousLive
woodyFuel depth
(cm)
Extinctionmoisture
(%)
7 All 2.54 4.20 3.37 0.00 0.83 57 6 51 76.2 408 All 3.37 2.25 5.61 0.00 0.00 66 6 6 6.1 309 All 6.54 0.93 0.34 0.00 0.00 82 6 6 6.1 2510 All 6.74 4.49 11.23 0.00 4.49 66 6 49 30.5 25Custom G30 7.62 1.12 1.01 0.90 1.12 57 6 51 28.96 27Custom D36 8.96 1.12 0.52 0.00 0.83 57 6 51 60.9 45Custom G43 7.84 1.57 0.90 0.90 1.12 57 6 51 29.57 29Custom D12 5.60 0.67 0.45 0.00 0.83 57 6 51 24.38 25Custom D48 9.52 1.90 0.90 0.00 0.83 57 6 51 67.06 40
a Treatment: D12, dormant-season burn 12 mo after previous dormant-season burn (n � 6); D36, dormant-season burn 36 mo after previousdormant-season burn (n � 12); D48, dormant-season burn 48 mo after previous dormant-season burn (n � 6); G30, late growing-season burn30 mo after previous dormant-season burn (n � 12); G43, late growing-season burn 43 mo after previous dormant-season burn (n � 6).
Table 4. Mean fuel energy (kJ/kg) sampled prior to growing-season (September 1994) and dormant-season (March 1995) prescribedburns in Ouachita National Forest, Arkansas.
Standa
Fire 1
Pre-burn Post-burn
Fire 2
Pre-burn Post-burn
Fire 3
Pre-burn Post-burn
1257D 17,021.98 18,154.89 18,519.68 19,105.83 19,069.70 17,269.501257G 17,623.87 17,276.33 17,793.44 17,160.52 14,915.81 17,750.061259G 15,476.50 15,250.80 14,467.57 17,785.07 18,666.72 16,137.271274D 17,349.22 19,520.03 18,110.76 14,311.95 17,400.09 14,380.231274G 18,254.87 18,965.95 17,111.79 17,904.98 17,031.74 14,300.731289D 16,788.91 16,004.46 18,442.85 17,685.21 16,988.15 15,954.551289G 16,286.74 19,894.21 15,768.91 18,591.78 16,555.40 18,818.451313D 18,702.23 18,174.48 18,250.01 15,146.42 18,304.36 18,617.19
a Abbreviations: D, dormant-season burn; G, growing-season burn.
marily for the prediction of fire behavior parameterson the flame front of a headfire carried by fine fuels(Rothermel 1983). Therefore, we only compared ob-served fire behavior parameters of headfires with BE-HAVE predictions. We modeled fire behavior using theSITE module of the FIRE1 program in BEHAVE 4.1(Andrews 1986). We were interested in predictionsfrom several possible fuel models; therefore, we usedour custom fuel model and standard fuel models 7, 8,9, and 10 described by Anderson (1982) that best fitthe fuel characteristics of the study area. We consid-ered standard fuel model 5 but excluded it from con-sideration because the woody vegetation in our standsdid not have the same characteristics of structure anda considerable amount of the dead fuel was composedof pine needles, which are somewhat volatile com-pared to other fuels. We used 1-h dead and fine livefuel moisture from collected fuel samples; 10-h fuelmoisture from fuel sticks and protimeter readings ob-served on-site; we estimated 100-h fuel moisture basedon 1- and 10-h fuel moisture and weather conditions.We supplied all environmental variables, stand char-acteristics, and weather observations for each fire sub-sample within a stand as prompted by the SITE mod-ule. BEHAVE predicted fireline intensity, heat per unitarea, reaction intensity, flame length, and rate ofspread for each fire location within all stands.
We used simple linear regression to determine iffuel models in BEHAVE were accurate predictors overthe range of observed fire behavior by pairing ob-
served and predicted fire behavior parameters for eachfire subsample. We tested the slope of the linear re-gression line (i.e., BEHAVE-predicted fire behaviorversus observed fire behavior) for equality to 1, withthe y-intercept forced to 0. A model was determinedaccurate when the slope was not significantly differentfrom 1 at a significance level of 0.05. To determinefuel model accuracy at all levels of observed behavior,we inspected the R2 for the model and plotted the re-siduals. We also validated the average accuracy of BE-HAVE predictions of flame length and fireline inten-sity with Fisher’s exact test by defining categorical var-iables from the fire behavior characteristics chart(Rothermel 1983).
RESULTS AND DISCUSSION
Fuel loads varied considerably, while mean fuelmoisture was relatively similar across all treatmentsand within stands (Table 2; see Appendix A for meanfuel conditions for each fire run sampled for eachstand). Fuel moisture was underpredicted considerablyby fuel sticks deployed within a stand and the proti-meter when compared with actual measurements, butestimates from fuel sticks and the protimeter were sim-ilar. We found that heat of combustion varied from14,300 to 19,520 kJ/kg (Table 4) for a percent differ-ence from the often used standard of 18,620 kJ/kg(Pyne et al. 1996) of �23.2 to 4.8, respectively. Al-
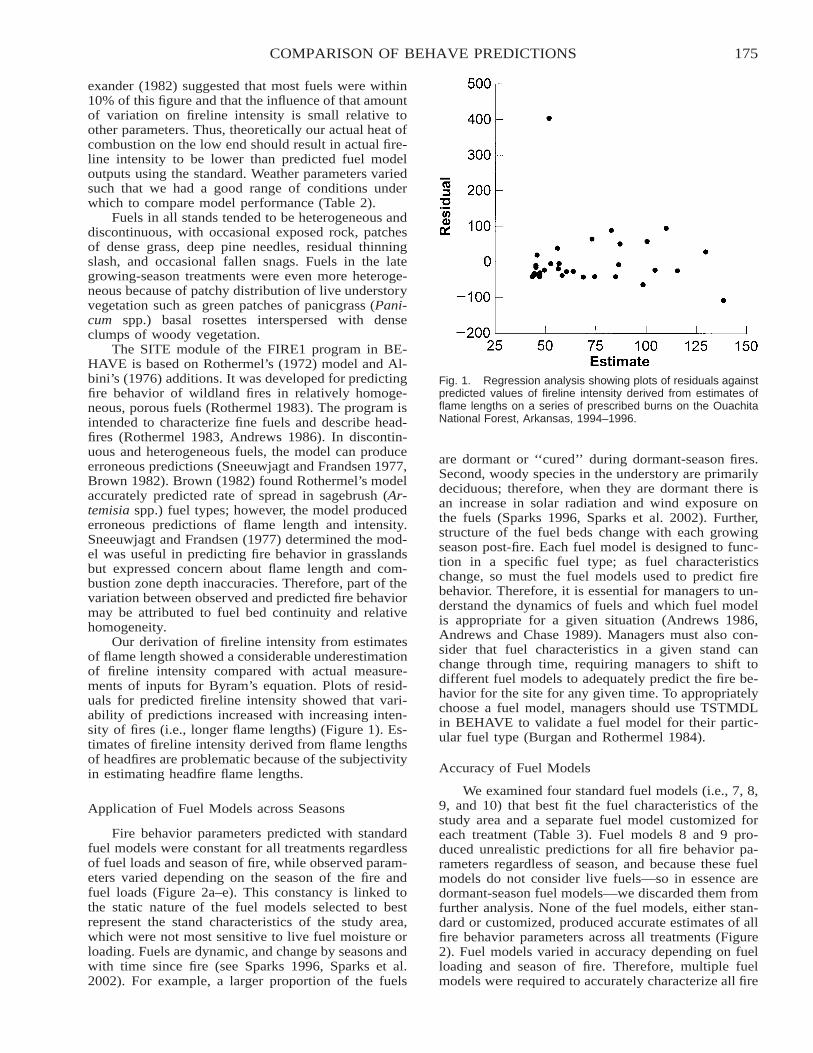
175COMPARISON OF BEHAVE PREDICTIONS
Fig. 1. Regression analysis showing plots of residuals againstpredicted values of fireline intensity derived from estimates offlame lengths on a series of prescribed burns on the OuachitaNational Forest, Arkansas, 1994–1996.
exander (1982) suggested that most fuels were within10% of this figure and that the influence of that amountof variation on fireline intensity is small relative toother parameters. Thus, theoretically our actual heat ofcombustion on the low end should result in actual fire-line intensity to be lower than predicted fuel modeloutputs using the standard. Weather parameters variedsuch that we had a good range of conditions underwhich to compare model performance (Table 2).
Fuels in all stands tended to be heterogeneous anddiscontinuous, with occasional exposed rock, patchesof dense grass, deep pine needles, residual thinningslash, and occasional fallen snags. Fuels in the lategrowing-season treatments were even more heteroge-neous because of patchy distribution of live understoryvegetation such as green patches of panicgrass (Pani-cum spp.) basal rosettes interspersed with denseclumps of woody vegetation.
The SITE module of the FIRE1 program in BE-HAVE is based on Rothermel’s (1972) model and Al-bini’s (1976) additions. It was developed for predictingfire behavior of wildland fires in relatively homoge-neous, porous fuels (Rothermel 1983). The program isintended to characterize fine fuels and describe head-fires (Rothermel 1983, Andrews 1986). In discontin-uous and heterogeneous fuels, the model can produceerroneous predictions (Sneeuwjagt and Frandsen 1977,Brown 1982). Brown (1982) found Rothermel’s modelaccurately predicted rate of spread in sagebrush (Ar-temisia spp.) fuel types; however, the model producederroneous predictions of flame length and intensity.Sneeuwjagt and Frandsen (1977) determined the mod-el was useful in predicting fire behavior in grasslandsbut expressed concern about flame length and com-bustion zone depth inaccuracies. Therefore, part of thevariation between observed and predicted fire behaviormay be attributed to fuel bed continuity and relativehomogeneity.
Our derivation of fireline intensity from estimatesof flame length showed a considerable underestimationof fireline intensity compared with actual measure-ments of inputs for Byram’s equation. Plots of resid-uals for predicted fireline intensity showed that vari-ability of predictions increased with increasing inten-sity of fires (i.e., longer flame lengths) (Figure 1). Es-timates of fireline intensity derived from flame lengthsof headfires are problematic because of the subjectivityin estimating headfire flame lengths.
Application of Fuel Models across Seasons
Fire behavior parameters predicted with standardfuel models were constant for all treatments regardlessof fuel loads and season of fire, while observed param-eters varied depending on the season of the fire andfuel loads (Figure 2a–e). This constancy is linked tothe static nature of the fuel models selected to bestrepresent the stand characteristics of the study area,which were not most sensitive to live fuel moisture orloading. Fuels are dynamic, and change by seasons andwith time since fire (see Sparks 1996, Sparks et al.2002). For example, a larger proportion of the fuels
are dormant or ‘‘cured’’ during dormant-season fires.Second, woody species in the understory are primarilydeciduous; therefore, when they are dormant there isan increase in solar radiation and wind exposure onthe fuels (Sparks 1996, Sparks et al. 2002). Further,structure of the fuel beds change with each growingseason post-fire. Each fuel model is designed to func-tion in a specific fuel type; as fuel characteristicschange, so must the fuel models used to predict firebehavior. Therefore, it is essential for managers to un-derstand the dynamics of fuels and which fuel modelis appropriate for a given situation (Andrews 1986,Andrews and Chase 1989). Managers must also con-sider that fuel characteristics in a given stand canchange through time, requiring managers to shift todifferent fuel models to adequately predict the fire be-havior for the site for any given time. To appropriatelychoose a fuel model, managers should use TSTMDLin BEHAVE to validate a fuel model for their partic-ular fuel type (Burgan and Rothermel 1984).
Accuracy of Fuel Models
We examined four standard fuel models (i.e., 7, 8,9, and 10) that best fit the fuel characteristics of thestudy area and a separate fuel model customized foreach treatment (Table 3). Fuel models 8 and 9 pro-duced unrealistic predictions for all fire behavior pa-rameters regardless of season, and because these fuelmodels do not consider live fuels—so in essence aredormant-season fuel models—we discarded them fromfurther analysis. None of the fuel models, either stan-dard or customized, produced accurate estimates of allfire behavior parameters across all treatments (Figure2). Fuel models varied in accuracy depending on fuelloading and season of fire. Therefore, multiple fuelmodels were required to accurately characterize all fire
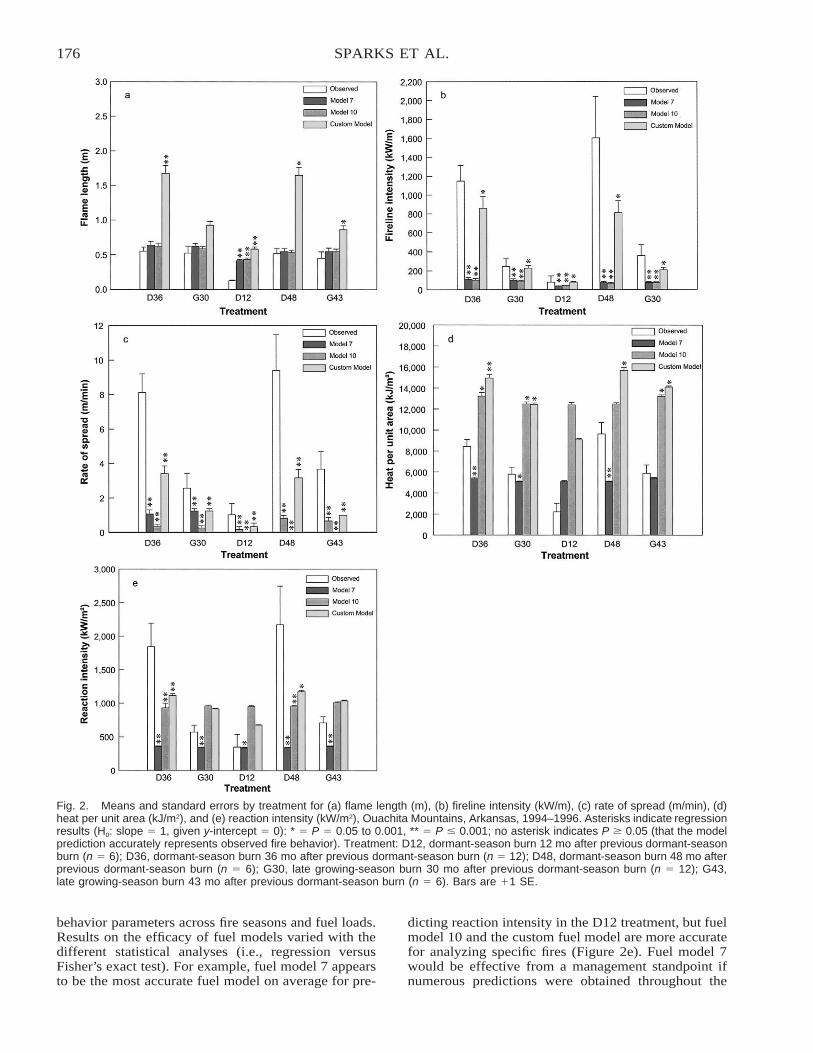
176 SPARKS ET AL.
Fig. 2. Means and standard errors by treatment for (a) flame length (m), (b) fireline intensity (kW/m), (c) rate of spread (m/min), (d)heat per unit area (kJ/m2), and (e) reaction intensity (kW/m2), Ouachita Mountains, Arkansas, 1994–1996. Asterisks indicate regressionresults (H0: slope � 1, given y-intercept � 0): * � P � 0.05 to 0.001, ** � P � 0.001; no asterisk indicates P � 0.05 (that the modelprediction accurately represents observed fire behavior). Treatment: D12, dormant-season burn 12 mo after previous dormant-seasonburn (n � 6); D36, dormant-season burn 36 mo after previous dormant-season burn (n � 12); D48, dormant-season burn 48 mo afterprevious dormant-season burn (n � 6); G30, late growing-season burn 30 mo after previous dormant-season burn (n � 12); G43,late growing-season burn 43 mo after previous dormant-season burn (n � 6). Bars are 1 SE.
behavior parameters across fire seasons and fuel loads.Results on the efficacy of fuel models varied with thedifferent statistical analyses (i.e., regression versusFisher’s exact test). For example, fuel model 7 appearsto be the most accurate fuel model on average for pre-
dicting reaction intensity in the D12 treatment, but fuelmodel 10 and the custom fuel model are more accuratefor analyzing specific fires (Figure 2e). Fuel model 7would be effective from a management standpoint ifnumerous predictions were obtained throughout the
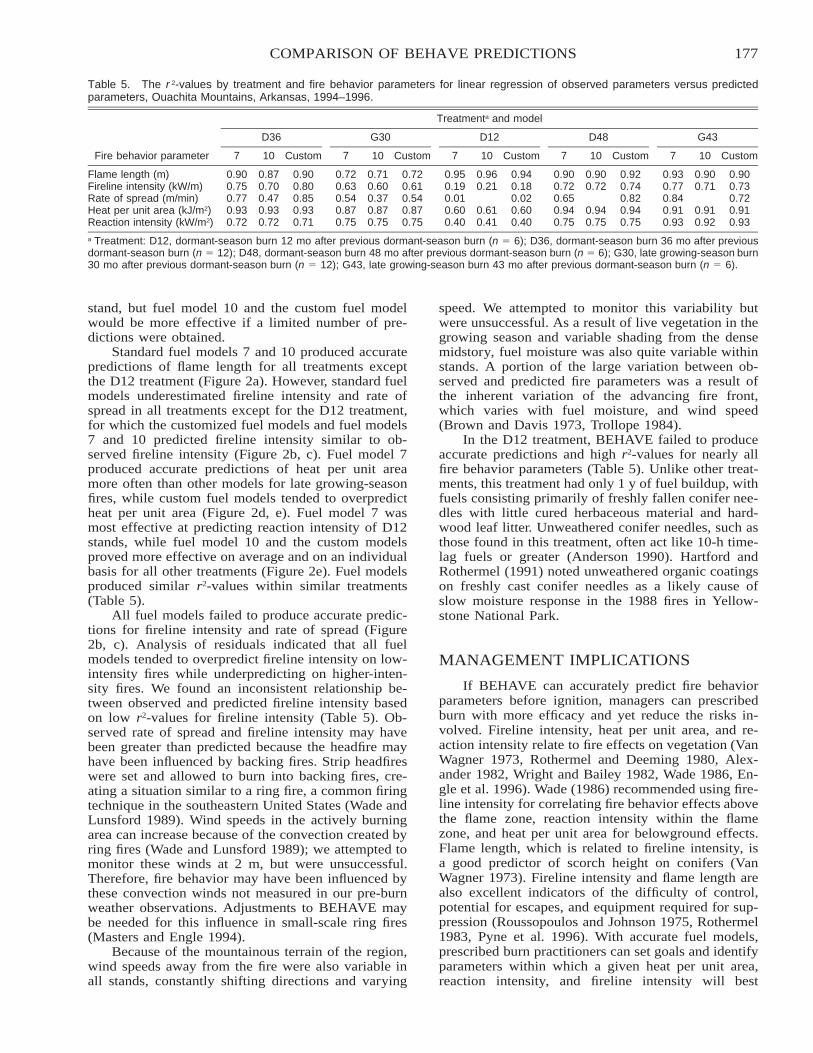
177COMPARISON OF BEHAVE PREDICTIONS
Table 5. The r 2-values by treatment and fire behavior parameters for linear regression of observed parameters versus predictedparameters, Ouachita Mountains, Arkansas, 1994–1996.
Fire behavior parameter
Treatmenta and model
D36
7 10 Custom
G30
7 10 Custom
D12
7 10 Custom
D48
7 10 Custom
G43
7 10 Custom
Flame length (m) 0.90 0.87 0.90 0.72 0.71 0.72 0.95 0.96 0.94 0.90 0.90 0.92 0.93 0.90 0.90Fireline intensity (kW/m) 0.75 0.70 0.80 0.63 0.60 0.61 0.19 0.21 0.18 0.72 0.72 0.74 0.77 0.71 0.73Rate of spread (m/min) 0.77 0.47 0.85 0.54 0.37 0.54 0.01 0.02 0.65 0.82 0.84 0.72Heat per unit area (kJ/m2) 0.93 0.93 0.93 0.87 0.87 0.87 0.60 0.61 0.60 0.94 0.94 0.94 0.91 0.91 0.91Reaction intensity (kW/m2) 0.72 0.72 0.71 0.75 0.75 0.75 0.40 0.41 0.40 0.75 0.75 0.75 0.93 0.92 0.93
a Treatment: D12, dormant-season burn 12 mo after previous dormant-season burn (n � 6); D36, dormant-season burn 36 mo after previousdormant-season burn (n � 12); D48, dormant-season burn 48 mo after previous dormant-season burn (n � 6); G30, late growing-season burn30 mo after previous dormant-season burn (n � 12); G43, late growing-season burn 43 mo after previous dormant-season burn (n � 6).
stand, but fuel model 10 and the custom fuel modelwould be more effective if a limited number of pre-dictions were obtained.
Standard fuel models 7 and 10 produced accuratepredictions of flame length for all treatments exceptthe D12 treatment (Figure 2a). However, standard fuelmodels underestimated fireline intensity and rate ofspread in all treatments except for the D12 treatment,for which the customized fuel models and fuel models7 and 10 predicted fireline intensity similar to ob-served fireline intensity (Figure 2b, c). Fuel model 7produced accurate predictions of heat per unit areamore often than other models for late growing-seasonfires, while custom fuel models tended to overpredictheat per unit area (Figure 2d, e). Fuel model 7 wasmost effective at predicting reaction intensity of D12stands, while fuel model 10 and the custom modelsproved more effective on average and on an individualbasis for all other treatments (Figure 2e). Fuel modelsproduced similar r2-values within similar treatments(Table 5).
All fuel models failed to produce accurate predic-tions for fireline intensity and rate of spread (Figure2b, c). Analysis of residuals indicated that all fuelmodels tended to overpredict fireline intensity on low-intensity fires while underpredicting on higher-inten-sity fires. We found an inconsistent relationship be-tween observed and predicted fireline intensity basedon low r2-values for fireline intensity (Table 5). Ob-served rate of spread and fireline intensity may havebeen greater than predicted because the headfire mayhave been influenced by backing fires. Strip headfireswere set and allowed to burn into backing fires, cre-ating a situation similar to a ring fire, a common firingtechnique in the southeastern United States (Wade andLunsford 1989). Wind speeds in the actively burningarea can increase because of the convection created byring fires (Wade and Lunsford 1989); we attempted tomonitor these winds at 2 m, but were unsuccessful.Therefore, fire behavior may have been influenced bythese convection winds not measured in our pre-burnweather observations. Adjustments to BEHAVE maybe needed for this influence in small-scale ring fires(Masters and Engle 1994).
Because of the mountainous terrain of the region,wind speeds away from the fire were also variable inall stands, constantly shifting directions and varying
speed. We attempted to monitor this variability butwere unsuccessful. As a result of live vegetation in thegrowing season and variable shading from the densemidstory, fuel moisture was also quite variable withinstands. A portion of the large variation between ob-served and predicted fire parameters was a result ofthe inherent variation of the advancing fire front,which varies with fuel moisture, and wind speed(Brown and Davis 1973, Trollope 1984).
In the D12 treatment, BEHAVE failed to produceaccurate predictions and high r2-values for nearly allfire behavior parameters (Table 5). Unlike other treat-ments, this treatment had only 1 y of fuel buildup, withfuels consisting primarily of freshly fallen conifer nee-dles with little cured herbaceous material and hard-wood leaf litter. Unweathered conifer needles, such asthose found in this treatment, often act like 10-h time-lag fuels or greater (Anderson 1990). Hartford andRothermel (1991) noted unweathered organic coatingson freshly cast conifer needles as a likely cause ofslow moisture response in the 1988 fires in Yellow-stone National Park.
MANAGEMENT IMPLICATIONS
If BEHAVE can accurately predict fire behaviorparameters before ignition, managers can prescribedburn with more efficacy and yet reduce the risks in-volved. Fireline intensity, heat per unit area, and re-action intensity relate to fire effects on vegetation (VanWagner 1973, Rothermel and Deeming 1980, Alex-ander 1982, Wright and Bailey 1982, Wade 1986, En-gle et al. 1996). Wade (1986) recommended using fire-line intensity for correlating fire behavior effects abovethe flame zone, reaction intensity within the flamezone, and heat per unit area for belowground effects.Flame length, which is related to fireline intensity, isa good predictor of scorch height on conifers (VanWagner 1973). Fireline intensity and flame length arealso excellent indicators of the difficulty of control,potential for escapes, and equipment required for sup-pression (Roussopoulos and Johnson 1975, Rothermel1983, Pyne et al. 1996). With accurate fuel models,prescribed burn practitioners can set goals and identifyparameters within which a given heat per unit area,reaction intensity, and fireline intensity will best
178 SPARKS ET AL.
achieve their management objectives. Using the firebehavior characteristics chart (Rothermel 1983), prac-titioners can also determine the equipment required tosuppress or maintain the fire fronts.
Headfires with fireline intensity �345 kW/m(flame length �1.2 m) can generally be attacked at thehead by persons using hand tools (Rothermel 1983).Headfires with a fireline intensity �345 kW/m (flamelength �2.5 m) are too intense for direct attack on thehead by persons using hand tools and require equip-ment such as plows, dozers, pumpers, and retardantaircraft (Rothermel 1983). Our fires produced inten-sities and flame lengths in both of these categories(Figure 2a, b). In treatments D48 and D36, fuel models10 and 7 were more accurate than custom fuel modelsat predicting flame length within the correct fire be-havior classification (P � 0.001). However, customfuel models were more accurate than other models atpredicting fireline intensity in treatments D36 and D48(P � 0.001).
CONCLUSIONS
BEHAVE can provide accurate predictions of firebehavior for use in defining prescribed burning win-dows when the proper fuel model is selected. This isparticularly important when managing for endangeredspecies because specific fire behavior parameters maybe used to predict the influence on habitat variables.However, managers must proceed with caution be-cause the appropriate fuel model varies with season offire and fuel loading. Therefore, managers must iden-tify or customize the appropriate fuel model. Further-more, fuel model accuracy varies among fire behaviorparameters, so managers should use more than one fuelmodel to predict relevant fire behavior parameters andto produce a range of fire behavior within which aspecific fire may fall. Because fuels vary widely be-tween seasons, managers should interpret predictionswith caution and perform multiple analyses for eachburn situation. The additional fuel models for a widerrange of fuel conditions in BehavePlus 3.0.2 (Scott andBurgan 2005), plus the greater flexibility for inputs ofactual values for various fuel parameters, show prom-ise in providing managers with more realistic predic-tions of fire behavior under variable fuel conditions.However, field validation for specific sites is impera-tive.
ACKNOWLEDGMENTS
This project was funded by the U.S. Departmentof Agriculture, Forest Service; Department of Forestryat Oklahoma State University; and Oklahoma Coop-erative Extension Service; and was a cooperative effortwith the Oklahoma Agricultural Experiment Station.Appreciation is extended to D. Gay, S. Crockett, M.Crockett, J. Kulbeth, and W. Montague for assistancein burning and collecting data within these stands, toK. Gainey for assistance with word processing, and toJ. Cox for assistance with analysis.
LITERATURE CITEDAlbini, F.A. 1976. Estimating wildfire behavior and effects. Gen-
eral Technical Report INT-30, U.S. Department of Agricul-ture, Forest Service, Intermountain Forest and Range Ex-periment Station, Ogden, UT.
Albini, F.A., and R.G. Baughman. 1979. Estimating wind speedsfor predicting wildland fire behavior. Research Paper INT-221, U.S. Department of Agriculture, Forest Service, Inter-mountain Forest and Range Experiment Station, Ogden, UT.
Alexander, M.E. 1982. Calculating and interpreting forest fireintensities. Canadian Journal of Botany 60:349–357.
Anderson, H.E. 1982. Aids to determining fuel models for es-timating fire behavior. General Technical Report INT-122,U.S. Department of Agriculture, Forest Service, Intermoun-tain Forest and Range Experiment Station, Ogden, UT.
Anderson, H.E. 1990. Moisture diffusivity and response time infine forest fuels. Canadian Journal of Forest Research 20:315–325.
Andrews, P.L. 1986. BEHAVE: fire behavior prediction and fuelmodeling system—BURN subsystem, part 1. General Tech-nical Report INT-194, U.S. Department of Agriculture, For-est Service, Intermountain Forest and Range ExperimentStation, Ogden, UT.
Andrews, P.L., and L.S. Bradshaw. 1990. RXWINDOW: defin-ing windows of acceptable burning conditions based on de-sired fire behavior. General Technical Report INT-273, U.S.Department of Agriculture, Forest Service, IntermountainForest and Range Experiment Station, Ogden, UT.
Andrews, P.L., and C.H. Chase. 1989. BEHAVE: fire behaviorprediction and fuel modeling system—BURN subsystem,part 2. General Technical Report INT-260, U.S. Departmentof Agriculture, Forest Service, Intermountain Forest andRange Experiment Station, Ogden, UT.
Avery, T.E. 1967. Forest measurements. McGraw-Hill, NewYork.
Bailey, R.G. 1995. Description of the ecoregions of the UnitedStates. Second edition. Miscellaneous Publication 1391 (re-vised), U.S. Department of Agriculture, Forest Service,Washington, D.C.
Bigalke, R.C., and K. Willan. 1984. Effects of fire regime onfaunal composition and dynamics. Pages 255–271 in P. deV. Booysen and N.M. Tainton (eds.). Ecological effects offire in South African ecosystems. Springer-Verlag, NewYork.
Brown, A.A., and K.P. Davis. 1973. Forest fire: control and use.Second edition. McGraw-Hill, New York.
Brown, J.K. 1982. Fuel and fire behavior prediction in big sage-brush. Research Paper INT-290, U.S. Department of Agri-culture, Forest Service, Intermountain Forest and Range Ex-periment Station, Ogden, UT.
Burgan, R.E., and R.C. Rothermel. 1984. BEHAVE: fire behav-ior prediction and fuel modeling system—FUEL subsystem.General Technical Report INT-167, U.S. Department of Ag-riculture, Forest Service, Intermountain Forest and RangeExperiment Station, Ogden, UT.
Byram, G.M. 1959. Combustion of forest fuels. Pages 61–89 inK.P. Davis (ed.). Forest fire: control and use. McGraw-Hill,New York.
Chandler, C., P. Cheney, P. Thomas, L. Trabaud, and D. Wil-liams. 1983. Fire in forestry. Volume I: forest fire behaviorand effects. John Wiley and Sons, New York.
Christensen, P., H. Recher, and J. Hoare. 1981. Responses ofopen forest to fire regimes. Pages 367–394 in A.M. Gill,R.H. Groves, and I.R. Noble (eds.). Fire and the Australianbiota. Australian Academy of Science, Canberra, ACT, Aus-tralia.
Engle, D.M., T.G. Bidwell, and R.E. Masters. 1996. RestoringCross Timbers ecosystems with fire. Pages 190–199 in K.G.Wadsworth and R.E. McCabe (eds.). Transactions of the 61st
North American Wildlife and Natural Resources Confer-ence. Wildlife Management Institute, Washington, D.C.
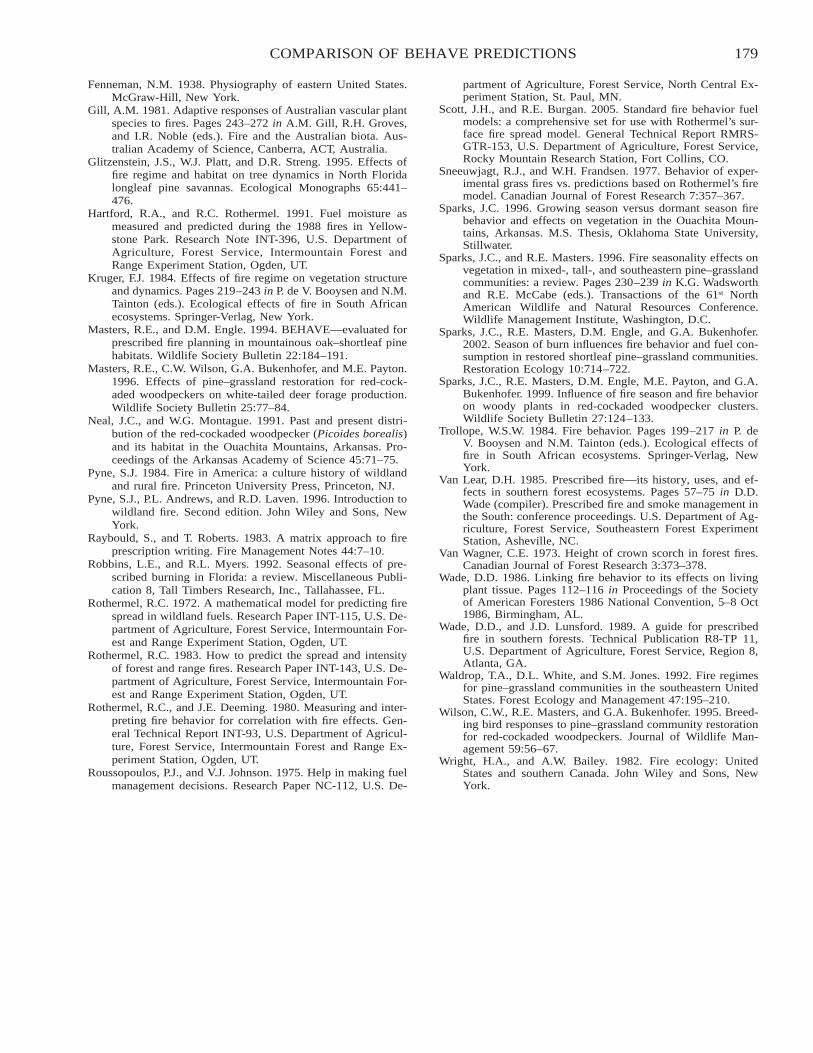
179COMPARISON OF BEHAVE PREDICTIONS
Fenneman, N.M. 1938. Physiography of eastern United States.McGraw-Hill, New York.
Gill, A.M. 1981. Adaptive responses of Australian vascular plantspecies to fires. Pages 243–272 in A.M. Gill, R.H. Groves,and I.R. Noble (eds.). Fire and the Australian biota. Aus-tralian Academy of Science, Canberra, ACT, Australia.
Glitzenstein, J.S., W.J. Platt, and D.R. Streng. 1995. Effects offire regime and habitat on tree dynamics in North Floridalongleaf pine savannas. Ecological Monographs 65:441–476.
Hartford, R.A., and R.C. Rothermel. 1991. Fuel moisture asmeasured and predicted during the 1988 fires in Yellow-stone Park. Research Note INT-396, U.S. Department ofAgriculture, Forest Service, Intermountain Forest andRange Experiment Station, Ogden, UT.
Kruger, F.J. 1984. Effects of fire regime on vegetation structureand dynamics. Pages 219–243 in P. de V. Booysen and N.M.Tainton (eds.). Ecological effects of fire in South Africanecosystems. Springer-Verlag, New York.
Masters, R.E., and D.M. Engle. 1994. BEHAVE—evaluated forprescribed fire planning in mountainous oak–shortleaf pinehabitats. Wildlife Society Bulletin 22:184–191.
Masters, R.E., C.W. Wilson, G.A. Bukenhofer, and M.E. Payton.1996. Effects of pine–grassland restoration for red-cock-aded woodpeckers on white-tailed deer forage production.Wildlife Society Bulletin 25:77–84.
Neal, J.C., and W.G. Montague. 1991. Past and present distri-bution of the red-cockaded woodpecker (Picoides borealis)and its habitat in the Ouachita Mountains, Arkansas. Pro-ceedings of the Arkansas Academy of Science 45:71–75.
Pyne, S.J. 1984. Fire in America: a culture history of wildlandand rural fire. Princeton University Press, Princeton, NJ.
Pyne, S.J., P.L. Andrews, and R.D. Laven. 1996. Introduction towildland fire. Second edition. John Wiley and Sons, NewYork.
Raybould, S., and T. Roberts. 1983. A matrix approach to fireprescription writing. Fire Management Notes 44:7–10.
Robbins, L.E., and R.L. Myers. 1992. Seasonal effects of pre-scribed burning in Florida: a review. Miscellaneous Publi-cation 8, Tall Timbers Research, Inc., Tallahassee, FL.
Rothermel, R.C. 1972. A mathematical model for predicting firespread in wildland fuels. Research Paper INT-115, U.S. De-partment of Agriculture, Forest Service, Intermountain For-est and Range Experiment Station, Ogden, UT.
Rothermel, R.C. 1983. How to predict the spread and intensityof forest and range fires. Research Paper INT-143, U.S. De-partment of Agriculture, Forest Service, Intermountain For-est and Range Experiment Station, Ogden, UT.
Rothermel, R.C., and J.E. Deeming. 1980. Measuring and inter-preting fire behavior for correlation with fire effects. Gen-eral Technical Report INT-93, U.S. Department of Agricul-ture, Forest Service, Intermountain Forest and Range Ex-periment Station, Ogden, UT.
Roussopoulos, P.J., and V.J. Johnson. 1975. Help in making fuelmanagement decisions. Research Paper NC-112, U.S. De-
partment of Agriculture, Forest Service, North Central Ex-periment Station, St. Paul, MN.
Scott, J.H., and R.E. Burgan. 2005. Standard fire behavior fuelmodels: a comprehensive set for use with Rothermel’s sur-face fire spread model. General Technical Report RMRS-GTR-153, U.S. Department of Agriculture, Forest Service,Rocky Mountain Research Station, Fort Collins, CO.
Sneeuwjagt, R.J., and W.H. Frandsen. 1977. Behavior of exper-imental grass fires vs. predictions based on Rothermel’s firemodel. Canadian Journal of Forest Research 7:357–367.
Sparks, J.C. 1996. Growing season versus dormant season firebehavior and effects on vegetation in the Ouachita Moun-tains, Arkansas. M.S. Thesis, Oklahoma State University,Stillwater.
Sparks, J.C., and R.E. Masters. 1996. Fire seasonality effects onvegetation in mixed-, tall-, and southeastern pine–grasslandcommunities: a review. Pages 230–239 in K.G. Wadsworthand R.E. McCabe (eds.). Transactions of the 61st NorthAmerican Wildlife and Natural Resources Conference.Wildlife Management Institute, Washington, D.C.
Sparks, J.C., R.E. Masters, D.M. Engle, and G.A. Bukenhofer.2002. Season of burn influences fire behavior and fuel con-sumption in restored shortleaf pine–grassland communities.Restoration Ecology 10:714–722.
Sparks, J.C., R.E. Masters, D.M. Engle, M.E. Payton, and G.A.Bukenhofer. 1999. Influence of fire season and fire behavioron woody plants in red-cockaded woodpecker clusters.Wildlife Society Bulletin 27:124–133.
Trollope, W.S.W. 1984. Fire behavior. Pages 199–217 in P. deV. Booysen and N.M. Tainton (eds.). Ecological effects offire in South African ecosystems. Springer-Verlag, NewYork.
Van Lear, D.H. 1985. Prescribed fire—its history, uses, and ef-fects in southern forest ecosystems. Pages 57–75 in D.D.Wade (compiler). Prescribed fire and smoke management inthe South: conference proceedings. U.S. Department of Ag-riculture, Forest Service, Southeastern Forest ExperimentStation, Asheville, NC.
Van Wagner, C.E. 1973. Height of crown scorch in forest fires.Canadian Journal of Forest Research 3:373–378.
Wade, D.D. 1986. Linking fire behavior to its effects on livingplant tissue. Pages 112–116 in Proceedings of the Societyof American Foresters 1986 National Convention, 5–8 Oct1986, Birmingham, AL.
Wade, D.D., and J.D. Lunsford. 1989. A guide for prescribedfire in southern forests. Technical Publication R8-TP 11,U.S. Department of Agriculture, Forest Service, Region 8,Atlanta, GA.
Waldrop, T.A., D.L. White, and S.M. Jones. 1992. Fire regimesfor pine–grassland communities in the southeastern UnitedStates. Forest Ecology and Management 47:195–210.
Wilson, C.W., R.E. Masters, and G.A. Bukenhofer. 1995. Breed-ing bird responses to pine–grassland community restorationfor red-cockaded woodpeckers. Journal of Wildlife Man-agement 59:56–67.
Wright, H.A., and A.W. Bailey. 1982. Fire ecology: UnitedStates and southern Canada. John Wiley and Sons, NewYork.
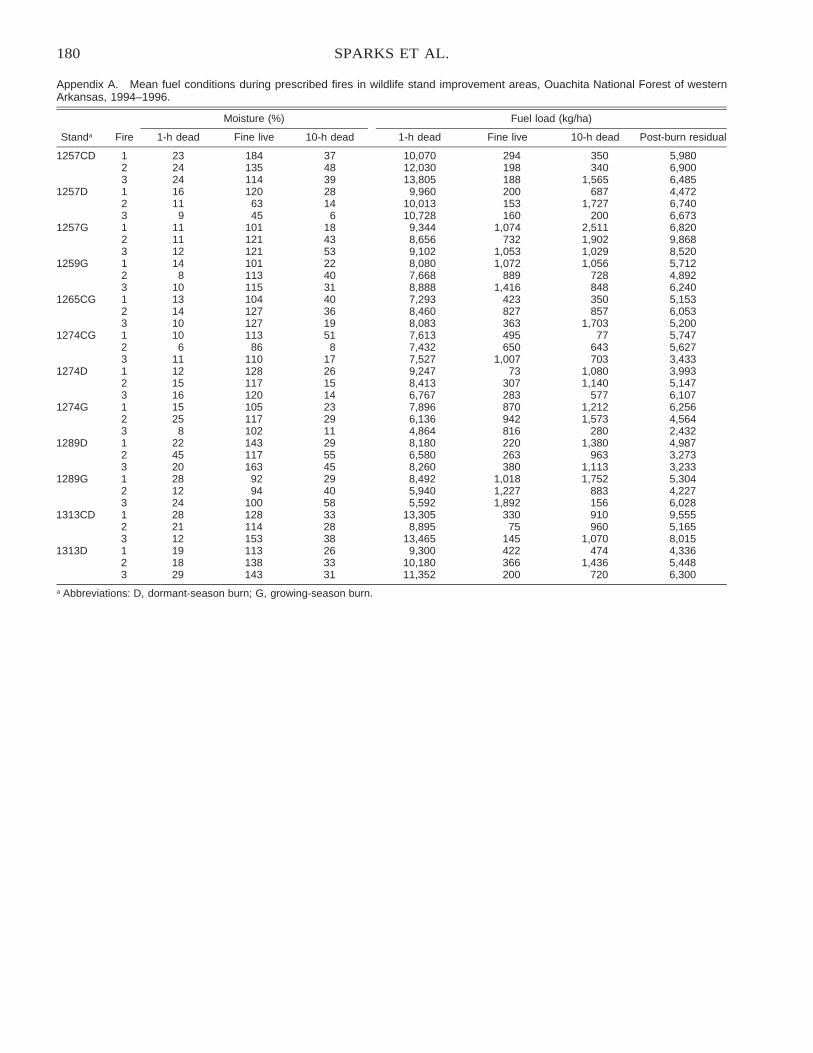
180 SPARKS ET AL.
Appendix A. Mean fuel conditions during prescribed fires in wildlife stand improvement areas, Ouachita National Forest of westernArkansas, 1994–1996.
Standa Fire
Moisture (%)
1-h dead Fine live 10-h dead
Fuel load (kg/ha)
1-h dead Fine live 10-h dead Post-burn residual
1257CD 1 23 184 37 10,070 294 350 5,9802 24 135 48 12,030 198 340 6,9003 24 114 39 13,805 188 1,565 6,485
1257D 1 16 120 28 9,960 200 687 4,4722 11 63 14 10,013 153 1,727 6,7403 9 45 6 10,728 160 200 6,673
1257G 1 11 101 18 9,344 1,074 2,511 6,8202 11 121 43 8,656 732 1,902 9,8683 12 121 53 9,102 1,053 1,029 8,520
1259G 1 14 101 22 8,080 1,072 1,056 5,7122 8 113 40 7,668 889 728 4,8923 10 115 31 8,888 1,416 848 6,240
1265CG 1 13 104 40 7,293 423 350 5,1532 14 127 36 8,460 827 857 6,0533 10 127 19 8,083 363 1,703 5,200
1274CG 1 10 113 51 7,613 495 77 5,7472 6 86 8 7,432 650 643 5,6273 11 110 17 7,527 1,007 703 3,433
1274D 1 12 128 26 9,247 73 1,080 3,9932 15 117 15 8,413 307 1,140 5,1473 16 120 14 6,767 283 577 6,107
1274G 1 15 105 23 7,896 870 1,212 6,2562 25 117 29 6,136 942 1,573 4,5643 8 102 11 4,864 816 280 2,432
1289D 1 22 143 29 8,180 220 1,380 4,9872 45 117 55 6,580 263 963 3,2733 20 163 45 8,260 380 1,113 3,233
1289G 1 28 92 29 8,492 1,018 1,752 5,3042 12 94 40 5,940 1,227 883 4,2273 24 100 58 5,592 1,892 156 6,028
1313CD 1 28 128 33 13,305 330 910 9,5552 21 114 28 8,895 75 960 5,1653 12 153 38 13,465 145 1,070 8,015
1313D 1 19 113 26 9,300 422 474 4,3362 18 138 33 10,180 366 1,436 5,4483 29 143 31 11,352 200 720 6,300
a Abbreviations: D, dormant-season burn; G, growing-season burn.
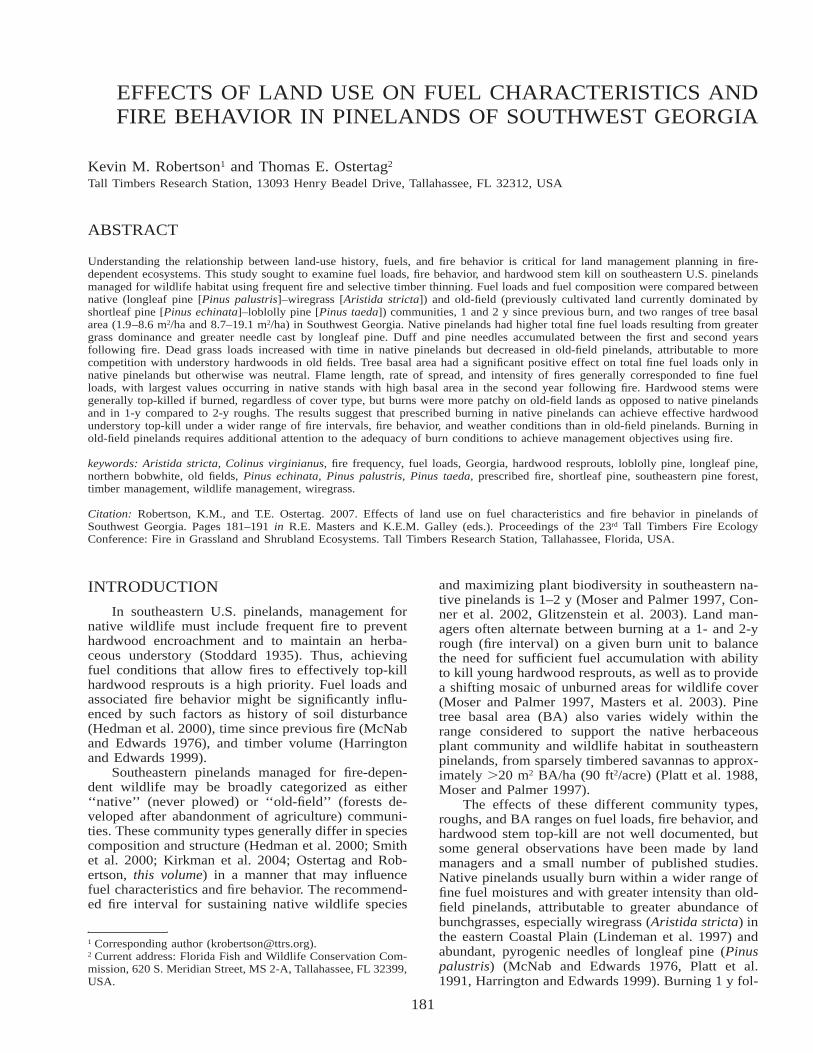
181
EFFECTS OF LAND USE ON FUEL CHARACTERISTICS ANDFIRE BEHAVIOR IN PINELANDS OF SOUTHWEST GEORGIA
Kevin M. Robertson1 and Thomas E. Ostertag2
Tall Timbers Research Station, 13093 Henry Beadel Drive, Tallahassee, FL 32312, USA
ABSTRACT
Understanding the relationship between land-use history, fuels, and fire behavior is critical for land management planning in fire-dependent ecosystems. This study sought to examine fuel loads, fire behavior, and hardwood stem kill on southeastern U.S. pinelandsmanaged for wildlife habitat using frequent fire and selective timber thinning. Fuel loads and fuel composition were compared betweennative (longleaf pine [Pinus palustris]–wiregrass [Aristida stricta]) and old-field (previously cultivated land currently dominated byshortleaf pine [Pinus echinata]–loblolly pine [Pinus taeda]) communities, 1 and 2 y since previous burn, and two ranges of tree basalarea (1.9–8.6 m2/ha and 8.7–19.1 m2/ha) in Southwest Georgia. Native pinelands had higher total fine fuel loads resulting from greatergrass dominance and greater needle cast by longleaf pine. Duff and pine needles accumulated between the first and second yearsfollowing fire. Dead grass loads increased with time in native pinelands but decreased in old-field pinelands, attributable to morecompetition with understory hardwoods in old fields. Tree basal area had a significant positive effect on total fine fuel loads only innative pinelands but otherwise was neutral. Flame length, rate of spread, and intensity of fires generally corresponded to fine fuelloads, with largest values occurring in native stands with high basal area in the second year following fire. Hardwood stems weregenerally top-killed if burned, regardless of cover type, but burns were more patchy on old-field lands as opposed to native pinelandsand in 1-y compared to 2-y roughs. The results suggest that prescribed burning in native pinelands can achieve effective hardwoodunderstory top-kill under a wider range of fire intervals, fire behavior, and weather conditions than in old-field pinelands. Burning inold-field pinelands requires additional attention to the adequacy of burn conditions to achieve management objectives using fire.
keywords: Aristida stricta, Colinus virginianus, fire frequency, fuel loads, Georgia, hardwood resprouts, loblolly pine, longleaf pine,northern bobwhite, old fields, Pinus echinata, Pinus palustris, Pinus taeda, prescribed fire, shortleaf pine, southeastern pine forest,timber management, wildlife management, wiregrass.
Citation: Robertson, K.M., and T.E. Ostertag. 2007. Effects of land use on fuel characteristics and fire behavior in pinelands ofSouthwest Georgia. Pages 181–191 in R.E. Masters and K.E.M. Galley (eds.). Proceedings of the 23rd Tall Timbers Fire EcologyConference: Fire in Grassland and Shrubland Ecosystems. Tall Timbers Research Station, Tallahassee, Florida, USA.
INTRODUCTION
In southeastern U.S. pinelands, management fornative wildlife must include frequent fire to preventhardwood encroachment and to maintain an herba-ceous understory (Stoddard 1935). Thus, achievingfuel conditions that allow fires to effectively top-killhardwood resprouts is a high priority. Fuel loads andassociated fire behavior might be significantly influ-enced by such factors as history of soil disturbance(Hedman et al. 2000), time since previous fire (McNaband Edwards 1976), and timber volume (Harringtonand Edwards 1999).
Southeastern pinelands managed for fire-depen-dent wildlife may be broadly categorized as either‘‘native’’ (never plowed) or ‘‘old-field’’ (forests de-veloped after abandonment of agriculture) communi-ties. These community types generally differ in speciescomposition and structure (Hedman et al. 2000; Smithet al. 2000; Kirkman et al. 2004; Ostertag and Rob-ertson, this volume) in a manner that may influencefuel characteristics and fire behavior. The recommend-ed fire interval for sustaining native wildlife species
1 Corresponding author ([email protected]).2 Current address: Florida Fish and Wildlife Conservation Com-mission, 620 S. Meridian Street, MS 2-A, Tallahassee, FL 32399,USA.
and maximizing plant biodiversity in southeastern na-tive pinelands is 1–2 y (Moser and Palmer 1997, Con-ner et al. 2002, Glitzenstein et al. 2003). Land man-agers often alternate between burning at a 1- and 2-yrough (fire interval) on a given burn unit to balancethe need for sufficient fuel accumulation with abilityto kill young hardwood resprouts, as well as to providea shifting mosaic of unburned areas for wildlife cover(Moser and Palmer 1997, Masters et al. 2003). Pinetree basal area (BA) also varies widely within therange considered to support the native herbaceousplant community and wildlife habitat in southeasternpinelands, from sparsely timbered savannas to approx-imately �20 m2 BA/ha (90 ft2/acre) (Platt et al. 1988,Moser and Palmer 1997).
The effects of these different community types,roughs, and BA ranges on fuel loads, fire behavior, andhardwood stem top-kill are not well documented, butsome general observations have been made by landmanagers and a small number of published studies.Native pinelands usually burn within a wider range offine fuel moistures and with greater intensity than old-field pinelands, attributable to greater abundance ofbunchgrasses, especially wiregrass (Aristida stricta) inthe eastern Coastal Plain (Lindeman et al. 1997) andabundant, pyrogenic needles of longleaf pine (Pinuspalustris) (McNab and Edwards 1976, Platt et al.1991, Harrington and Edwards 1999). Burning 1 y fol-
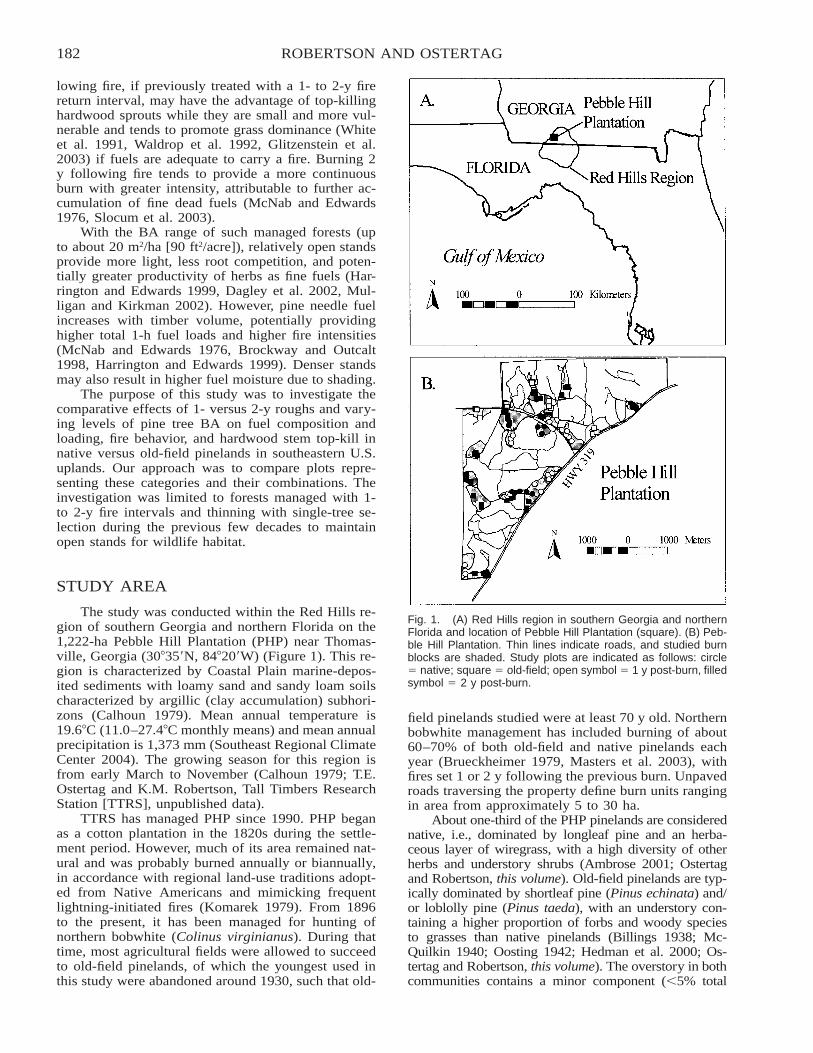
182 ROBERTSON AND OSTERTAG
Fig. 1. (A) Red Hills region in southern Georgia and northernFlorida and location of Pebble Hill Plantation (square). (B) Peb-ble Hill Plantation. Thin lines indicate roads, and studied burnblocks are shaded. Study plots are indicated as follows: circle� native; square � old-field; open symbol � 1 y post-burn, filledsymbol � 2 y post-burn.
lowing fire, if previously treated with a 1- to 2-y firereturn interval, may have the advantage of top-killinghardwood sprouts while they are small and more vul-nerable and tends to promote grass dominance (Whiteet al. 1991, Waldrop et al. 1992, Glitzenstein et al.2003) if fuels are adequate to carry a fire. Burning 2y following fire tends to provide a more continuousburn with greater intensity, attributable to further ac-cumulation of fine dead fuels (McNab and Edwards1976, Slocum et al. 2003).
With the BA range of such managed forests (upto about 20 m2/ha [90 ft2/acre]), relatively open standsprovide more light, less root competition, and poten-tially greater productivity of herbs as fine fuels (Har-rington and Edwards 1999, Dagley et al. 2002, Mul-ligan and Kirkman 2002). However, pine needle fuelincreases with timber volume, potentially providinghigher total 1-h fuel loads and higher fire intensities(McNab and Edwards 1976, Brockway and Outcalt1998, Harrington and Edwards 1999). Denser standsmay also result in higher fuel moisture due to shading.
The purpose of this study was to investigate thecomparative effects of 1- versus 2-y roughs and vary-ing levels of pine tree BA on fuel composition andloading, fire behavior, and hardwood stem top-kill innative versus old-field pinelands in southeastern U.S.uplands. Our approach was to compare plots repre-senting these categories and their combinations. Theinvestigation was limited to forests managed with 1-to 2-y fire intervals and thinning with single-tree se-lection during the previous few decades to maintainopen stands for wildlife habitat.
STUDY AREA
The study was conducted within the Red Hills re-gion of southern Georgia and northern Florida on the1,222-ha Pebble Hill Plantation (PHP) near Thomas-ville, Georgia (30�35�N, 84�20�W) (Figure 1). This re-gion is characterized by Coastal Plain marine-depos-ited sediments with loamy sand and sandy loam soilscharacterized by argillic (clay accumulation) subhori-zons (Calhoun 1979). Mean annual temperature is19.6�C (11.0–27.4�C monthly means) and mean annualprecipitation is 1,373 mm (Southeast Regional ClimateCenter 2004). The growing season for this region isfrom early March to November (Calhoun 1979; T.E.Ostertag and K.M. Robertson, Tall Timbers ResearchStation [TTRS], unpublished data).
TTRS has managed PHP since 1990. PHP beganas a cotton plantation in the 1820s during the settle-ment period. However, much of its area remained nat-ural and was probably burned annually or biannually,in accordance with regional land-use traditions adopt-ed from Native Americans and mimicking frequentlightning-initiated fires (Komarek 1979). From 1896to the present, it has been managed for hunting ofnorthern bobwhite (Colinus virginianus). During thattime, most agricultural fields were allowed to succeedto old-field pinelands, of which the youngest used inthis study were abandoned around 1930, such that old-
field pinelands studied were at least 70 y old. Northernbobwhite management has included burning of about60–70% of both old-field and native pinelands eachyear (Brueckheimer 1979, Masters et al. 2003), withfires set 1 or 2 y following the previous burn. Unpavedroads traversing the property define burn units rangingin area from approximately 5 to 30 ha.
About one-third of the PHP pinelands are considerednative, i.e., dominated by longleaf pine and an herba-ceous layer of wiregrass, with a high diversity of otherherbs and understory shrubs (Ambrose 2001; Ostertagand Robertson, this volume). Old-field pinelands are typ-ically dominated by shortleaf pine (Pinus echinata) and/or loblolly pine (Pinus taeda), with an understory con-taining a higher proportion of forbs and woody speciesto grasses than native pinelands (Billings 1938; Mc-Quilkin 1940; Oosting 1942; Hedman et al. 2000; Os-tertag and Robertson, this volume). The overstory in bothcommunities contains a minor component (�5% total
183FUELS AND FIRE BEHAVIOR IN GEORGIA
BA) of oaks (Quercus spp.), hickories (Carya spp.), andother hardwoods. Native pinelands on PHP are typicallyburned during April and May to promote flowering ofwiregrass (Van Eerden 1988, Platt et al. 1991, Streng etal. 1993) and to maximize hardwood sprout top-kill(Waldrop et al. 1987, Platt et al. 1991, Glitzenstein et al.1995), whereas old fields are burned in March when finefuel moisture is sufficiently low to promote continuousburns. Hardwood resprouts from genetic individuals thatwere top-killed during the previous fire are common inboth community types but usually have a higher fre-quency in old-field pinelands. Timber is managed to pro-mote a multi-aged, naturally regenerating forest with BAof approximately 7–14 m2/ha (30–60 ft2/acre) at theburn-unit scale, although BA may vary widely at smallerscales.
METHODS
Field Sampling and Fire Measurements
In each of the two years of the study (2003 and2004), the 80 upland pine burn units on PHP largerthan approximately 2 ha were categorized as 1) old-field pineland with 1-y rough, 2) old-field pinelandwith 2-y rough, 3) native pineland with 1-y rough, and4) native pineland with 2-y rough. Native areas hadbeen identified in a previous study in which nativeforests were mapped based on the presence of wire-grass and other native indicator species (Ambrose2001). Remaining pinelands were assumed to be oldfields, based on the history of antebellum agricultureon the property and in the region (Paisley 1968,Brueckheimer 1979) and observations in the field toconfirm the absence of native indicator species (Hed-man et al. 2000, Kirkman et al. 2004) and dominanceby shortleaf or loblolly pine.
In 2003, three burn units per community type andrough were randomly selected, and five study plot lo-cations were randomly selected within each burn unit(60 plots total), using the Animal Movement Analysisextension (Hooge 2003) in ArcView 3.2 (Environmen-tal Systems Research Institute 1999). In 2004, five ad-ditional burn units per community type and roughwere randomly selected, and three study plot locationswere randomly selected within each burn unit (60 plotstotal) for a total of 120 study plots, of which sevenwere later lost due to management accidents. Each plotwas marked in the field using a piece of steel rein-forcement bar. Plots were established in January andFebruary in burn units scheduled to be burned inMarch or early April. Within a 2-m radius of the mark-er, two subplots were randomly located. At each sub-plot location, fuels were clipped and hand-collected tothe mineral soil surface within a 0.1-m2 area delineatedby a square frame.
During collection, fuels were separated into duff(loose, partially decayed organic material that is dif-ficult to differentiate), 1-h fuels (dead fuels �0.6-cmthickness), 10-h fuels (dead fuels 0.7- to 2.5-cm thick-ness), and live herbaceous fuels. The 1-h fuels werefurther separated into hardwood leaf litter, pine needle
litter, dead grass, and dead forbs, vines, and hardwoodseedlings combined (as these were difficult to distin-guish in the field). Fuel samples were dried for 48 hat 90�C in a forced-air oven, which was found to besufficient to achieve constant weight, and weighed todetermine fuel load. Average fuel bed height was es-timated at each plot. The fuel bed was considered tobe the matrix of fine fuels sufficiently continuous tolikely carry fire.
All trees �4 cm diameter at breast height (DBH)within a 20-m radius of the plot center were identifiedto species and measured for DBH to determine tree BAsurrounding each study plot. After sampling, tree BAwas used to further categorize study plots as low BA(�8.6 m2/ha; 5.1 m2/ha average) and high BA (�8.6 m2/ha; 15.0 m2/ha average), corresponding to values belowand above the median measurement for all plots.
To test for correlations among fuel loads, fire be-havior, and hardwood resprout top-kill, hardwood stemBA was measured within 2 mo before and 1 mo fol-lowing fire at each plot. All hardwood tree or shrubstems �2 cm DBH within a radius of 1–3 m from theplot center (varied to include at least 10 genets perplot) were measured for stem diameter (nearest milli-meter) at 3 cm above the ground and noted for lifestatus (live, top-killed by the fire). Species includedtrees and large shrubs and excluded very small-stat-ured woody species, such as vines, running oak (Quer-cus pumila), and Darrow’s blueberry (Vaccinium dar-rowii). Percent area burned within each plot was alsoestimated. A 2-m rod marked at 5-cm increments waslaid at two random azimuths from the center of theplot, and percent area burned was estimated as the per-centage of 5-cm segments intercepting burned areas.
In 2004, fire behavior variables were measured ateach plot to interpret their responses to variation infuel loads among the forest community types (native,old field), roughs (1, 2), and tree BA category (high,low). Burn prescriptions required a relative humidity(RH) of 20–40%, temperature (T) of 4–32�C, windspeed (WS) of 2–12 km/h, and 2–10 d since last rain.To assist in estimating flame length, reference markersmade of metal conduit pipes marked at 0.5-m intervalswere erected in a hexagonal pattern centered on eachplot such that opposite pipes were 4 m apart. A stripfire was lit approximately 10 m upwind of the plot,while backing fires were at least 50 m away. Rate ofspread (ROS) was measured between the first refer-ence marker reached by the fire and the opposite pipe.Flaming combustion residence time (RT) was mea-sured at both reference markers and averaged. Resi-dence time was measured in seconds as the durationof flaming combustion at the base of each referencemarker. Flame length (FL) was visually estimated in25-cm increments as the flaming front passed each ref-erence marker and estimates were averaged for eachplot. During each run, wind speed was measured witha handheld weather meter (Kestrel 3000; Kestrel De-sign Group, Minneapolis, MN).
Analyses
Fuel loads were analyzed to determine if they dif-fered significantly between community types, roughs,
184 ROBERTSON AND OSTERTAG
Table 1. Main effects and two-way interaction effects (multi-variate analysis of variance) of community type (native versusold-field pineland), rough (1- versus 2-y), and tree basal area(BA) (below versus above 8.6 m2/ha) on fuel loads in multiplefuel categories in 2003 and 2004 on Pebble Hill Plantation,Georgia.
Factor dfPillai’strace F P
Community 1 0.697 45.1 �0.001Rough 1 0.525 22.8 �0.001Tree BA 1 0.298 8.7 �0.001Community � Rough 1 0.218 5.7 �0.001Community � Tree BA 1 0.232 6.2 �0.001Rough � Tree BA 1 0.042 0.9 0.48Residuals 107
and tree BA ranges to test for interaction effects. Amultivariate analysis of variance (MANOVA) was runusing community type (native or old field), rough (1y or 2 y), and BA range (high or low) as factors, eachof the measured fuel categories as response variables,and fuel load averaged between the two subplots with-in each plot as units of replication (n � 113). Also,full factorial analyses of variance (ANOVAs), Type IVsums of squares (StatSoft 2004), were used to infer theresponse of each fuel type to community, rough, andBA range and their interactions. ANOVAs were sim-ilarly run to test for responses in hardwood sprout BAper hectare, tree BA per hectare, and fuel bed depthto treatment levels. Correlations between tree BA,hardwood stem BA, and fuel loads in each fuel cate-gory were tested (StatSoft 2004) to interpret possibleeffects of forest structure and competitive interactionson fuel loads.
Using data from the 2004 plots (n � 54), the ef-fects of community, year, and tree BA on ROS, FL,RT, and estimated fireline intensity (FI) and reactionintensity (RI) were tested in separate analyses usingfull factorial ANOVAs, Type VI sums of squares(StatSoft 2004). A similar analysis was used to test forvariation among treatments in T, RH, and WS mea-sured during burns to determine whether or not firesoccurred under relatively uniform conditions amongtreatments.
The percentages of hardwood stems burned at thebase and the subset of those top-killed were comparedbetween community types, roughs, and tree BA ranges.Comparisons were qualitative because of the largenumber of plots that had 100% top-kill.
RESULTSTrees �4 cm DBH in native pineland plots were
composed of 75% longleaf pine, 14% shortleaf pine,3% loblolly pine, and 8% hardwoods by BA. In con-trast, old-field pinelands comprised 14% longleaf, 44%shortleaf, 32% loblolly, and 10% hardwoods.
Fuels differed significantly in composition andloading among community types, roughs, and tree BAranges in the studied forests. The MANOVA testingfor the effects of these factors and their interactionson fuel loads showed each factor and two of the threeinteractions to be highly significant (Table 1). Univar-iate ANOVAs revealed that each fuel type, except 10-hfuels, had a significant response to community type,rough, and/or tree BA range (Figure 2).
Native pineland sites were characterized by sig-nificantly higher 1-h fuel loads, including higher nee-dle loads and dead grass loads, as well as higher liveherb loads compared to old-field sites (Figure 2). How-ever, native sites also had lower duff loads. The 2-y-rough plots had significantly higher duff loads, needleloads, forb–woody 1-h fuel loads, and total 1-h fuelsthan 1-y-rough plots (Figure 2). Plots in the high treeBA range had higher needle loads and higher total 1-hfuels overall (Figure 2). Needle loads were signifi-cantly higher in native sites than in old-field sites (Fig-ure 2).
Tree BA was not significantly different betweenthe two community types or between 1- and 2-yroughs (Figure 3), reflecting the timber managementof these forests. In contrast, hardwood resprout BAwas significantly higher in old-field pinelands and in2-y roughs. In old-field plots, hardwood resprout BAwas lower in the high tree BA category. Fuel bedheight responded significantly only to communitytype, with highest levels in the native sites (Figure 3).
Correlations among fuel load types were found tobe qualitatively the same between 1- and 2-y roughs,so results were presented separately for native and old-field pinelands and combined otherwise (Table 2). Innative pinelands, tree BA was correlated with total 1-hfuel and needle litter loads, and hardwood stem BAwas correlated with total 1-h fuel and hardwood leaflitter loads (Table 2). In old-field pinelands, similarrelationships were evident between tree BA and needleloads and hardwood resprout BA and leaf litter loads,respectively, but we did not detect responses in total1-h fuel loads (Table 2).
Weather variables (T, RH, WS) measured duringthe 2004 burns did not vary on average between com-munity types, roughs, and tree BA ranges, with regardto main effects (Table 3). In contrast, fire behaviormeasurements had significant responses to certain fac-tors (Figure 4). Fire behavior was generally more ac-tive (higher FL, ROS, FI, RI, heat per unit area) innative than in old-field plots, and more active in 2-ythan in 1-y roughs in native pinelands (Figure 4). Res-idence times in old-field plots were approximatelytwice those of native plots in a given rough and treeBA range (Figure 4).
A total of 5,971 hardwood resprouts were censusedin the plots (Table 4). The number of stems was lowerin the 2-y-rough plots, while the average basal diameterof stems increased with time since fire (Table 4). Per-centage of stems burned at the base was higher in thenative than in the old-field plots and higher in the 2-ythan in the 1-y rough, while differences between tree BAcategories were not consistent (Table 4).
DISCUSSIONFuel Loads
Fuel loads and corresponding fire behavior varyaccording to soil disturbance history, time since pre-
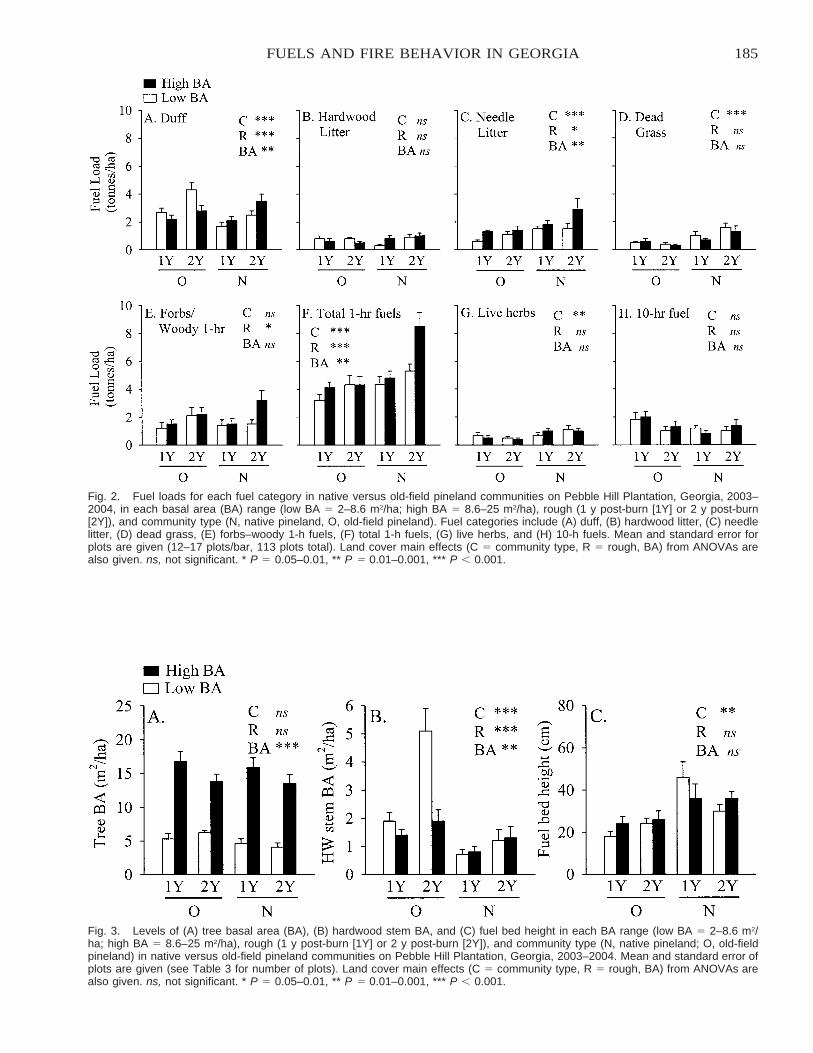
185FUELS AND FIRE BEHAVIOR IN GEORGIA
Fig. 2. Fuel loads for each fuel category in native versus old-field pineland communities on Pebble Hill Plantation, Georgia, 2003–2004, in each basal area (BA) range (low BA � 2–8.6 m2/ha; high BA � 8.6–25 m2/ha), rough (1 y post-burn [1Y] or 2 y post-burn[2Y]), and community type (N, native pineland, O, old-field pineland). Fuel categories include (A) duff, (B) hardwood litter, (C) needlelitter, (D) dead grass, (E) forbs–woody 1-h fuels, (F) total 1-h fuels, (G) live herbs, and (H) 10-h fuels. Mean and standard error forplots are given (12–17 plots/bar, 113 plots total). Land cover main effects (C � community type, R � rough, BA) from ANOVAs arealso given. ns, not significant. * P � 0.05–0.01, ** P � 0.01–0.001, *** P � 0.001.
Fig. 3. Levels of (A) tree basal area (BA), (B) hardwood stem BA, and (C) fuel bed height in each BA range (low BA � 2–8.6 m2/ha; high BA � 8.6–25 m2/ha), rough (1 y post-burn [1Y] or 2 y post-burn [2Y]), and community type (N, native pineland; O, old-fieldpineland) in native versus old-field pineland communities on Pebble Hill Plantation, Georgia, 2003–2004. Mean and standard error ofplots are given (see Table 3 for number of plots). Land cover main effects (C � community type, R � rough, BA) from ANOVAs arealso given. ns, not significant. * P � 0.05–0.01, ** P � 0.01–0.001, *** P � 0.001.
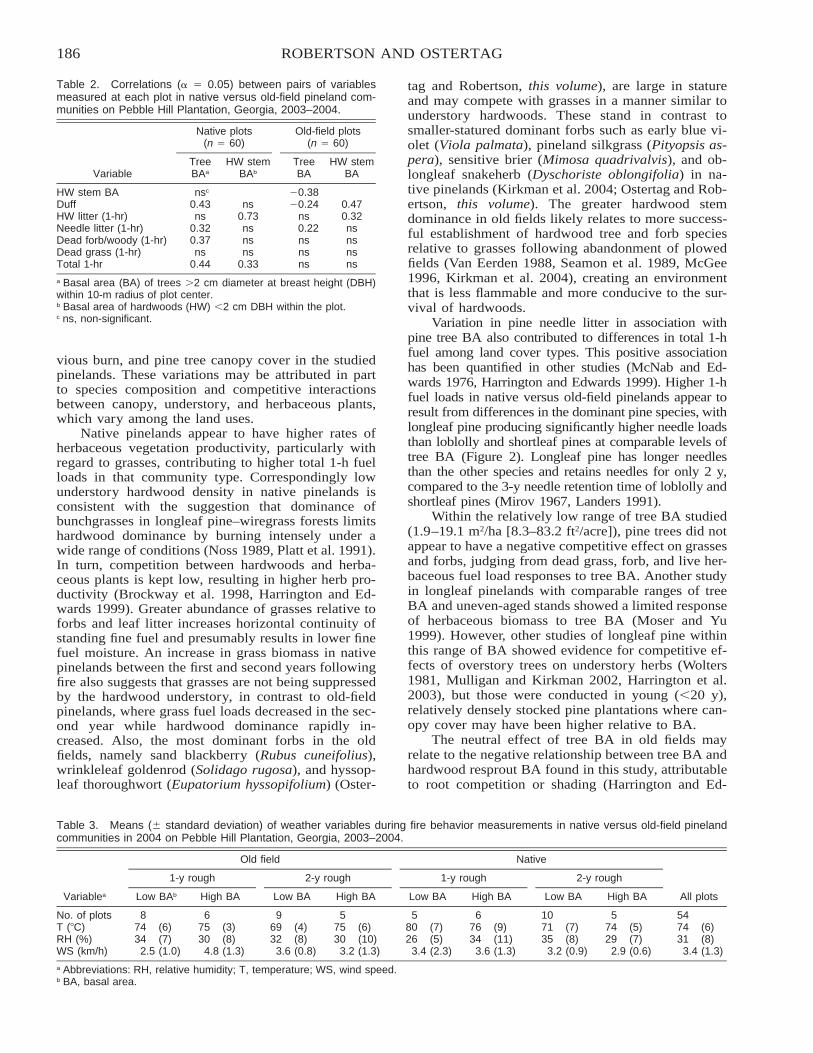
186 ROBERTSON AND OSTERTAG
Table 2. Correlations (� � 0.05) between pairs of variablesmeasured at each plot in native versus old-field pineland com-munities on Pebble Hill Plantation, Georgia, 2003–2004.
Variable
Native plots(n � 60)
TreeBAa
HW stemBAb
Old-field plots(n � 60)
TreeBA
HW stemBA
HW stem BA nsc 0.38Duff 0.43 ns 0.24 0.47HW litter (1-hr) ns 0.73 ns 0.32Needle litter (1-hr) 0.32 ns 0.22 nsDead forb/woody (1-hr) 0.37 ns ns nsDead grass (1-hr) ns ns ns nsTotal 1-hr 0.44 0.33 ns ns
a Basal area (BA) of trees �2 cm diameter at breast height (DBH)within 10-m radius of plot center.b Basal area of hardwoods (HW) �2 cm DBH within the plot.c ns, non-significant.
Table 3. Means ( standard deviation) of weather variables during fire behavior measurements in native versus old-field pinelandcommunities in 2004 on Pebble Hill Plantation, Georgia, 2003–2004.
Variablea
Old field
1-y rough
Low BAb High BA
2-y rough
Low BA High BA
Native
1-y rough
Low BA High BA
2-y rough
Low BA High BA All plots
No. of plots 8 6 9 5 5 6 10 5 54T (�C) 74 (6) 75 (3) 69 (4) 75 (6) 80 (7) 76 (9) 71 (7) 74 (5) 74 (6)RH (%) 34 (7) 30 (8) 32 (8) 30 (10) 26 (5) 34 (11) 35 (8) 29 (7) 31 (8)WS (km/h) 2.5 (1.0) 4.8 (1.3) 3.6 (0.8) 3.2 (1.3) 3.4 (2.3) 3.6 (1.3) 3.2 (0.9) 2.9 (0.6) 3.4 (1.3)
a Abbreviations: RH, relative humidity; T, temperature; WS, wind speed.b BA, basal area.
vious burn, and pine tree canopy cover in the studiedpinelands. These variations may be attributed in partto species composition and competitive interactionsbetween canopy, understory, and herbaceous plants,which vary among the land uses.
Native pinelands appear to have higher rates ofherbaceous vegetation productivity, particularly withregard to grasses, contributing to higher total 1-h fuelloads in that community type. Correspondingly lowunderstory hardwood density in native pinelands isconsistent with the suggestion that dominance ofbunchgrasses in longleaf pine–wiregrass forests limitshardwood dominance by burning intensely under awide range of conditions (Noss 1989, Platt et al. 1991).In turn, competition between hardwoods and herba-ceous plants is kept low, resulting in higher herb pro-ductivity (Brockway et al. 1998, Harrington and Ed-wards 1999). Greater abundance of grasses relative toforbs and leaf litter increases horizontal continuity ofstanding fine fuel and presumably results in lower finefuel moisture. An increase in grass biomass in nativepinelands between the first and second years followingfire also suggests that grasses are not being suppressedby the hardwood understory, in contrast to old-fieldpinelands, where grass fuel loads decreased in the sec-ond year while hardwood dominance rapidly in-creased. Also, the most dominant forbs in the oldfields, namely sand blackberry (Rubus cuneifolius),wrinkleleaf goldenrod (Solidago rugosa), and hyssop-leaf thoroughwort (Eupatorium hyssopifolium) (Oster-
tag and Robertson, this volume), are large in statureand may compete with grasses in a manner similar tounderstory hardwoods. These stand in contrast tosmaller-statured dominant forbs such as early blue vi-olet (Viola palmata), pineland silkgrass (Pityopsis as-pera), sensitive brier (Mimosa quadrivalvis), and ob-longleaf snakeherb (Dyschoriste oblongifolia) in na-tive pinelands (Kirkman et al. 2004; Ostertag and Rob-ertson, this volume). The greater hardwood stemdominance in old fields likely relates to more success-ful establishment of hardwood tree and forb speciesrelative to grasses following abandonment of plowedfields (Van Eerden 1988, Seamon et al. 1989, McGee1996, Kirkman et al. 2004), creating an environmentthat is less flammable and more conducive to the sur-vival of hardwoods.
Variation in pine needle litter in association withpine tree BA also contributed to differences in total 1-hfuel among land cover types. This positive associationhas been quantified in other studies (McNab and Ed-wards 1976, Harrington and Edwards 1999). Higher 1-hfuel loads in native versus old-field pinelands appear toresult from differences in the dominant pine species, withlongleaf pine producing significantly higher needle loadsthan loblolly and shortleaf pines at comparable levels oftree BA (Figure 2). Longleaf pine has longer needlesthan the other species and retains needles for only 2 y,compared to the 3-y needle retention time of loblolly andshortleaf pines (Mirov 1967, Landers 1991).
Within the relatively low range of tree BA studied(1.9–19.1 m2/ha [8.3–83.2 ft2/acre]), pine trees did notappear to have a negative competitive effect on grassesand forbs, judging from dead grass, forb, and live her-baceous fuel load responses to tree BA. Another studyin longleaf pinelands with comparable ranges of treeBA and uneven-aged stands showed a limited responseof herbaceous biomass to tree BA (Moser and Yu1999). However, other studies of longleaf pine withinthis range of BA showed evidence for competitive ef-fects of overstory trees on understory herbs (Wolters1981, Mulligan and Kirkman 2002, Harrington et al.2003), but those were conducted in young (�20 y),relatively densely stocked pine plantations where can-opy cover may have been higher relative to BA.
The neutral effect of tree BA in old fields mayrelate to the negative relationship between tree BA andhardwood resprout BA found in this study, attributableto root competition or shading (Harrington and Ed-
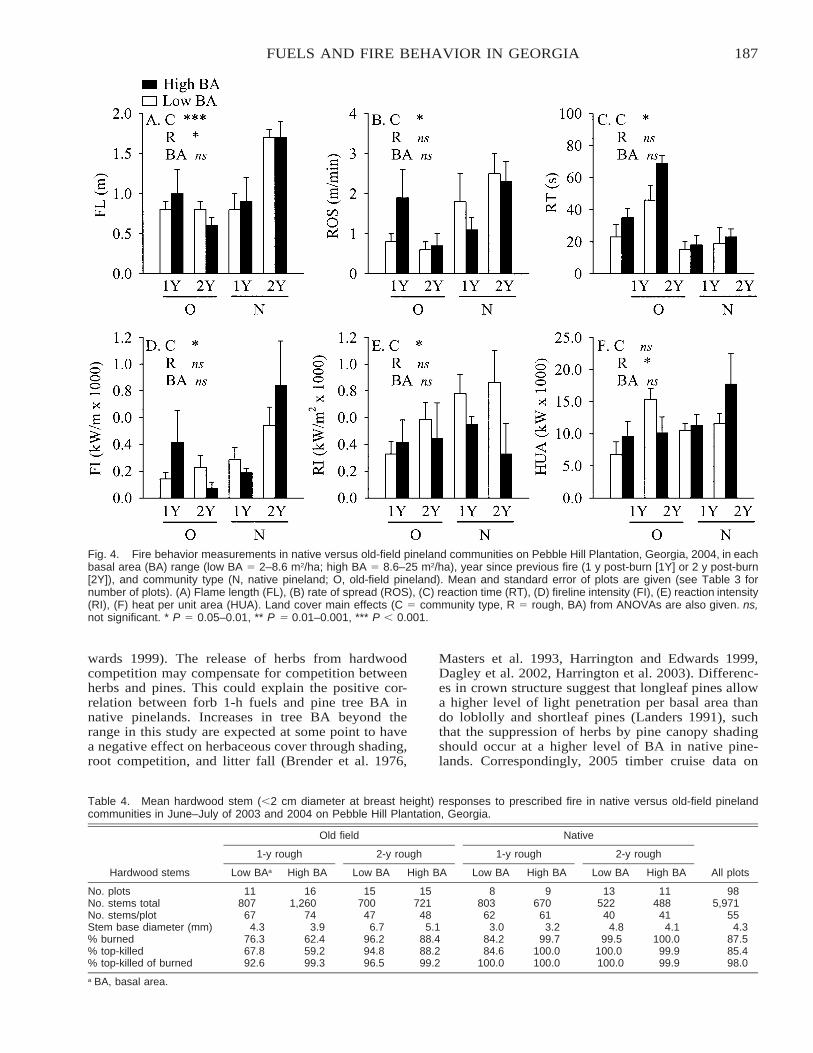
187FUELS AND FIRE BEHAVIOR IN GEORGIA
Fig. 4. Fire behavior measurements in native versus old-field pineland communities on Pebble Hill Plantation, Georgia, 2004, in eachbasal area (BA) range (low BA � 2–8.6 m2/ha; high BA � 8.6–25 m2/ha), year since previous fire (1 y post-burn [1Y] or 2 y post-burn[2Y]), and community type (N, native pineland; O, old-field pineland). Mean and standard error of plots are given (see Table 3 fornumber of plots). (A) Flame length (FL), (B) rate of spread (ROS), (C) reaction time (RT), (D) fireline intensity (FI), (E) reaction intensity(RI), (F) heat per unit area (HUA). Land cover main effects (C � community type, R � rough, BA) from ANOVAs are also given. ns,not significant. * P � 0.05–0.01, ** P � 0.01–0.001, *** P � 0.001.
Table 4. Mean hardwood stem (�2 cm diameter at breast height) responses to prescribed fire in native versus old-field pinelandcommunities in June–July of 2003 and 2004 on Pebble Hill Plantation, Georgia.
Hardwood stems
Old field
1-y rough
Low BAa High BA
2-y rough
Low BA High BA
Native
1-y rough
Low BA High BA
2-y rough
Low BA High BA All plots
No. plots 11 16 15 15 8 9 13 11 98No. stems total 807 1,260 700 721 803 670 522 488 5,971No. stems/plot 67 74 47 48 62 61 40 41 55Stem base diameter (mm) 4.3 3.9 6.7 5.1 3.0 3.2 4.8 4.1 4.3% burned 76.3 62.4 96.2 88.4 84.2 99.7 99.5 100.0 87.5% top-killed 67.8 59.2 94.8 88.2 84.6 100.0 100.0 99.9 85.4% top-killed of burned 92.6 99.3 96.5 99.2 100.0 100.0 100.0 99.9 98.0
a BA, basal area.
wards 1999). The release of herbs from hardwoodcompetition may compensate for competition betweenherbs and pines. This could explain the positive cor-relation between forb 1-h fuels and pine tree BA innative pinelands. Increases in tree BA beyond therange in this study are expected at some point to havea negative effect on herbaceous cover through shading,root competition, and litter fall (Brender et al. 1976,
Masters et al. 1993, Harrington and Edwards 1999,Dagley et al. 2002, Harrington et al. 2003). Differenc-es in crown structure suggest that longleaf pines allowa higher level of light penetration per basal area thando loblolly and shortleaf pines (Landers 1991), suchthat the suppression of herbs by pine canopy shadingshould occur at a higher level of BA in native pine-lands. Correspondingly, 2005 timber cruise data on
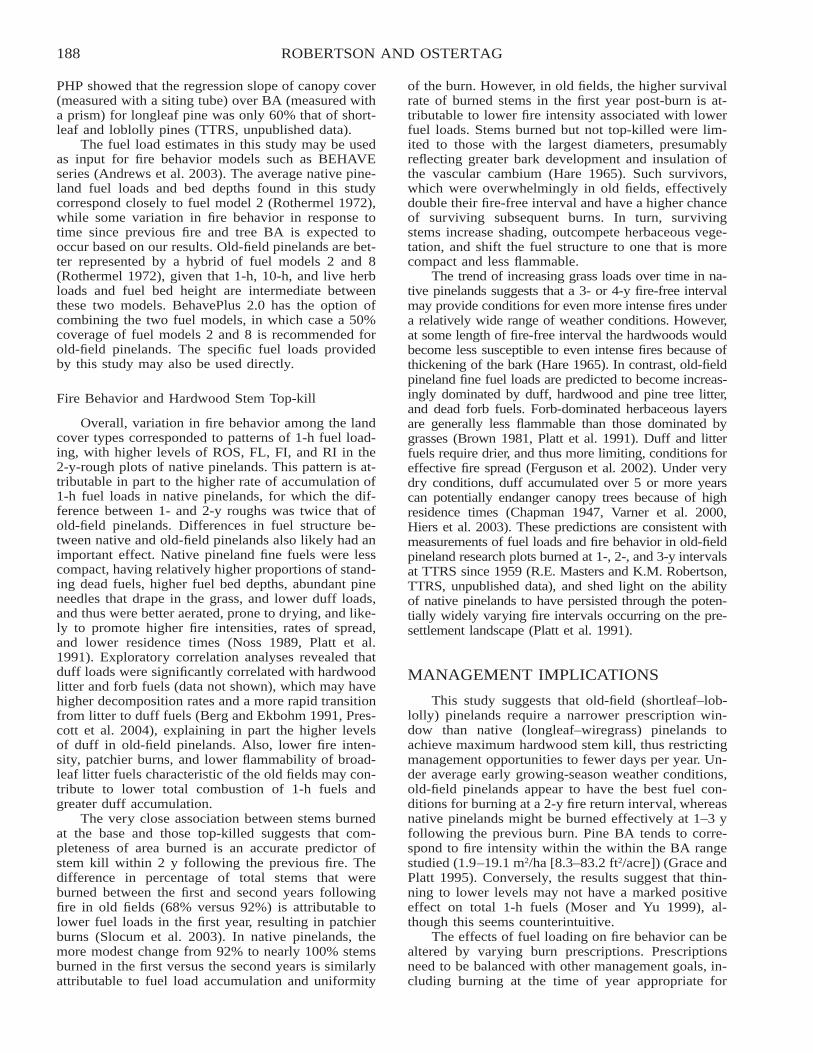
188 ROBERTSON AND OSTERTAG
PHP showed that the regression slope of canopy cover(measured with a siting tube) over BA (measured witha prism) for longleaf pine was only 60% that of short-leaf and loblolly pines (TTRS, unpublished data).
The fuel load estimates in this study may be usedas input for fire behavior models such as BEHAVEseries (Andrews et al. 2003). The average native pine-land fuel loads and bed depths found in this studycorrespond closely to fuel model 2 (Rothermel 1972),while some variation in fire behavior in response totime since previous fire and tree BA is expected tooccur based on our results. Old-field pinelands are bet-ter represented by a hybrid of fuel models 2 and 8(Rothermel 1972), given that 1-h, 10-h, and live herbloads and fuel bed height are intermediate betweenthese two models. BehavePlus 2.0 has the option ofcombining the two fuel models, in which case a 50%coverage of fuel models 2 and 8 is recommended forold-field pinelands. The specific fuel loads providedby this study may also be used directly.
Fire Behavior and Hardwood Stem Top-kill
Overall, variation in fire behavior among the landcover types corresponded to patterns of 1-h fuel load-ing, with higher levels of ROS, FL, FI, and RI in the2-y-rough plots of native pinelands. This pattern is at-tributable in part to the higher rate of accumulation of1-h fuel loads in native pinelands, for which the dif-ference between 1- and 2-y roughs was twice that ofold-field pinelands. Differences in fuel structure be-tween native and old-field pinelands also likely had animportant effect. Native pineland fine fuels were lesscompact, having relatively higher proportions of stand-ing dead fuels, higher fuel bed depths, abundant pineneedles that drape in the grass, and lower duff loads,and thus were better aerated, prone to drying, and like-ly to promote higher fire intensities, rates of spread,and lower residence times (Noss 1989, Platt et al.1991). Exploratory correlation analyses revealed thatduff loads were significantly correlated with hardwoodlitter and forb fuels (data not shown), which may havehigher decomposition rates and a more rapid transitionfrom litter to duff fuels (Berg and Ekbohm 1991, Pres-cott et al. 2004), explaining in part the higher levelsof duff in old-field pinelands. Also, lower fire inten-sity, patchier burns, and lower flammability of broad-leaf litter fuels characteristic of the old fields may con-tribute to lower total combustion of 1-h fuels andgreater duff accumulation.
The very close association between stems burnedat the base and those top-killed suggests that com-pleteness of area burned is an accurate predictor ofstem kill within 2 y following the previous fire. Thedifference in percentage of total stems that wereburned between the first and second years followingfire in old fields (68% versus 92%) is attributable tolower fuel loads in the first year, resulting in patchierburns (Slocum et al. 2003). In native pinelands, themore modest change from 92% to nearly 100% stemsburned in the first versus the second years is similarlyattributable to fuel load accumulation and uniformity
of the burn. However, in old fields, the higher survivalrate of burned stems in the first year post-burn is at-tributable to lower fire intensity associated with lowerfuel loads. Stems burned but not top-killed were lim-ited to those with the largest diameters, presumablyreflecting greater bark development and insulation ofthe vascular cambium (Hare 1965). Such survivors,which were overwhelmingly in old fields, effectivelydouble their fire-free interval and have a higher chanceof surviving subsequent burns. In turn, survivingstems increase shading, outcompete herbaceous vege-tation, and shift the fuel structure to one that is morecompact and less flammable.
The trend of increasing grass loads over time in na-tive pinelands suggests that a 3- or 4-y fire-free intervalmay provide conditions for even more intense fires undera relatively wide range of weather conditions. However,at some length of fire-free interval the hardwoods wouldbecome less susceptible to even intense fires because ofthickening of the bark (Hare 1965). In contrast, old-fieldpineland fine fuel loads are predicted to become increas-ingly dominated by duff, hardwood and pine tree litter,and dead forb fuels. Forb-dominated herbaceous layersare generally less flammable than those dominated bygrasses (Brown 1981, Platt et al. 1991). Duff and litterfuels require drier, and thus more limiting, conditions foreffective fire spread (Ferguson et al. 2002). Under verydry conditions, duff accumulated over 5 or more yearscan potentially endanger canopy trees because of highresidence times (Chapman 1947, Varner et al. 2000,Hiers et al. 2003). These predictions are consistent withmeasurements of fuel loads and fire behavior in old-fieldpineland research plots burned at 1-, 2-, and 3-y intervalsat TTRS since 1959 (R.E. Masters and K.M. Robertson,TTRS, unpublished data), and shed light on the abilityof native pinelands to have persisted through the poten-tially widely varying fire intervals occurring on the pre-settlement landscape (Platt et al. 1991).
MANAGEMENT IMPLICATIONS
This study suggests that old-field (shortleaf–lob-lolly) pinelands require a narrower prescription win-dow than native (longleaf–wiregrass) pinelands toachieve maximum hardwood stem kill, thus restrictingmanagement opportunities to fewer days per year. Un-der average early growing-season weather conditions,old-field pinelands appear to have the best fuel con-ditions for burning at a 2-y fire return interval, whereasnative pinelands might be burned effectively at 1–3 yfollowing the previous burn. Pine BA tends to corre-spond to fire intensity within the within the BA rangestudied (1.9–19.1 m2/ha [8.3–83.2 ft2/acre]) (Grace andPlatt 1995). Conversely, the results suggest that thin-ning to lower levels may not have a marked positiveeffect on total 1-h fuels (Moser and Yu 1999), al-though this seems counterintuitive.
The effects of fuel loading on fire behavior can bealtered by varying burn prescriptions. Prescriptionsneed to be balanced with other management goals, in-cluding burning at the time of year appropriate for
189FUELS AND FIRE BEHAVIOR IN GEORGIA
certain wildlife species (e.g., Hermann et al. 1998,Bishop and Haas 2005) and allowing natural regen-eration of pines (Lindeman et al. 1997). Managing old-field pinelands with fire for their many habitat valuesmay require additional attention to fuel characteristics,time since burn, weather conditions, and competingmanagement needs, in comparison to their nativecounterparts. Based on these results and our manage-ment experience, we recommend that old-field pine-land prescriptions allow for 20–40% RH, 2 or moredays since rain, and 7–10% fine fuel moisture, and thatnative pineland prescriptions allow 35–60% RH, 1 ormore days since rain, and 10–15% fine fuel moisture.
The key variables ultimately distinguishing nativefrom old-field pineland fuels in this study appear to begrass biomass, hardwood abundance, and pine species.Efforts to restore old-field pineland fuel structures tothose found in native longleaf pine forests should fo-cus on some combination of grass reestablishment,hardwood density control, and longleaf pine restora-tion (Harrington and Edwards 1999, Mulligan andKirkman 2002). Many resources for such methods areavailable and have been reviewed elsewhere (Walker1998, Kirkman and Mitchell 2002, Cox et al. 2004,Brockway et al. 2005). Restoration efforts to amelio-rate fuel conditions may reduce long-term manage-ment expenses by resulting in more effective burns,reduced hardwood encroachment, and longer burn sea-sons. However, old-field pinelands are similar enoughin fuel structure, fire behavior, and ecosystem functionto provide habitat for a wide range of fire-dependentwildlife species that have become globally rare, dem-onstrating the feasibility of restoring valuable habitatusing the relatively inexpensive tools of prescribedburning and timber thinning. In conclusion, this studyprovides insight into the tradeoffs between certainland-use decisions and the ability to meet managementobjectives using fire in southeastern U.S. pinelands.
ACKNOWLEDGMENTS
We thank A. Rush for his assistance in measuringfuels and tree basal area in the field, C. Martin for hiscoordination of and assistance with burning as landmanager of Pebble Hill Plantation, and R. Masters, K.Gainey, and 2 anonymous reviewers for helpful com-ments and editing. Funding for the project was pro-vided by Tall Timbers Research Station.
LITERATURE CITED
Ambrose, C.E. 2001. Remnants of a forest: mapping and inven-tory of the longleaf pine ground cover vegetation in the RedHills Region of Southwest Georgia and North Florida—final report to the Turner Foundation. Tall Timbers ResearchStation, Tallahassee, FL.
Andrews, P.L., C.D. Bevins, and S. Roberts. 2003. BehavePlusfire modeling system user’s guide. General Technical ReportRMRS-GTR-106, U.S. Department of Agriculture, ForestService, Rocky Mountain Research Station, Missoula, MT.
Berg, B., and G. Ekbohm. 1991. Litter mass-loss rates and de-composition patterns in some needle and leaf litter types.
Long-term decomposition in a Scots pine forest VII. Ca-nadian Journal of Botany 69:1449–1456.
Billings, W.D. 1938. The structure and development of old fieldshortleaf pine stands and certain associated physical prop-erties of the soil. Ecological Monographs 8:437–499.
Bishop, D.C., and C.A. Haas. 2005. Burning trends and potentialnegative effects of suppressing wetland fires on flatwoodssalamanders. Natural Areas Journal 25:290–294.
Brender, E.V., W.H. McNab, and S.W. Williams. 1976. Fuel ac-cumulations in piedmont loblolly pine plantations. ResearchNote SE-233, U.S. Department of Agriculture, Forest Ser-vice, Southeastern Forest Experiment Station, Asheville,NC.
Brockway, D.G., and K.W. Outcalt. 1998. Gap-phase regenera-tion in longleaf pine wiregrass ecosystems. Forest Ecologyand Management 106:125–139.
Brockway, D.G., K.W. Outcalt, D.J. Tomczak, and E.E. Johnson.2005. Restoration of longleaf pine ecosystems. GeneralTechnical Report SRS-83, U.S. Department of Agriculture,Forest Service, Southern Research Station, Asheville, NC.
Brockway, D.G., K.W. Outcalt, and R.N. Wilkins. 1998. Restor-ing longleaf pine wiregrass ecosystems: plant cover, diver-sity and biomass following low-rate hexazinone applicationon Florida sandhills. Forest Ecology and Management 103:159–175.
Brown, J.K. 1981. Bulk densities of nonuniform surface fuelsand their application to fire modeling. Forest Science 27:667–683.
Brueckheimer, W.R. 1979. The quail plantations of the Thom-asville–Tallahassee–Albany regions. Proceedings of the TallTimbers Ecology and Management Conference 16:141–165.
Calhoun, J.W. 1979. Soil survey of Brooks and Thomas Coun-ties, Georgia. U.S. Department of Agriculture, Soil Conser-vation Service and University of Georgia, College of Ag-riculture, Agriculture Experiment Station, Athens.
Chapman, H.H. 1947. Results of a prescribed fire at Urania, La.,on longleaf pine land. Journal of Forestry 45:121–123.
Conner, R.N., C.E. Shackelford, R.R. Schaefer, D. Saenz, andD.C. Rudolph. 2002. Avian community response to south-ern pine ecosystem restoration for red-cockaded woodpeck-ers. Wilson Bulletin 114:324–332.
Cox, A.C., D.R. Gordon, J.L. Slapcinsky, and G.S. Seamon.2004. Understory restoration in longleaf pine sandhills. Nat-ural Areas Journal 24:4–14.
Dagley, C.M., T.B. Harrington, and M.B. Edwards. 2002. Un-derstory restoration in longleaf pine plantations: overstoryeffects of competition and needlefall. Pages 487–489 inK.W. Outcalt (ed.). Proceedings of the 11th Biennial South-ern Silvicultural Research Conference. General TechnicalReport SRS-48, U.S. Department of Agriculture, Forest Ser-vice, Southern Research Station, Asheville, NC.
Environmental Systems Research Institute. 1999. ArcView GIS.Version 3.2. Environmental Systems Research Institute,Redlands, CA.
Ferguson, S.A., J.E. Ruthford, S.J. McKay, D. Wright, C.Wright, and R. Ottmar. 2002. Measuring moisture dynamicsto predict fire severity in longleaf pine forests. InternationalJournal of Wildland Fire 11:267–279.
Glitzenstein, J.S., W.J. Platt, and D.R. Streng. 1995. Effects offire regime and habitat on tree dynamics in north Floridalongleaf pine savannas. Ecological Monographs 65:441–476.
Glitzenstein, J.S., D.R. Streng, and D.D. Wade. 2003. Fire fre-quency effects on longleaf pine (Pinus palustris P. Miller)vegetation in South Carolina and northeast Florida, USA.Natural Areas Journal 23:22–37.
Grace, S.L., and W.J. Platt. 1995. Effects of adult tree densityand fire on the demography of pregrass stage juvenile long-leaf pine (Pinus palustris Mill.). Journal of Ecology 83:75–86.
Hare, R.C. 1965. Contribution of bark to fire resistance of south-ern trees. Journal of Forestry 63:248–251.
190 ROBERTSON AND OSTERTAG
Harrington, T.B., C.M. Dagley, and M.B. Edwards. 2003.Above- and belowground competition from longleaf pineplantations limits performance of reintroduced herbaceousspecies. Forest Science 49:681–695.
Harrington, T.B., and M.B. Edwards. 1999. Understory vegetation,resource availability, and litterfall responses to pine thinningand woody vegetation control in longleaf pine plantations. Ca-nadian Journal of Forest Research 29:1055–1064.
Hedman, C.W., S.L. Grace, and S.E. King. 2000. Vegetationcomposition and structure of southern coastal plain pine for-est: an ecological comparison. Forest Ecology and Manage-ment 134:233–247.
Hermann, S.M., T. Van Hook, R.W. Flowers, L.A. Brennan, J.S.Glitzenstein, D.R. Streng, J.L. Walker, and R.L. Myers.1998. Fire and biodiversity: studies of vegetation and ar-thropods. Transactions of the North American Wildlife andNatural Resources Conference 63:384–401.
Hiers, J.K., R.D. Ottmar, J.J. O’Brien, J.M. Varner III, F.E. Putz,D. Gordon, and S.A. Ferguson. 2003. Correlates of treemortality resulting from reintroducing fire to long-unburnedlongleaf pine forests [abstract]. Page 121 in Proceedings ofthe Second International Wildland Fire Ecology and FireManagement Congress and Fifth Symposium on Fire andForest Meteorology, 16–20 Nov 2003, Orlando, FL. Amer-ican Meteorological Society, Boston, MA.
Hooge, P.N. 2003. Animal movement analysis ArcView exten-sion. Version 1.0. U.S. Geological Survey, Biological Re-sources Division, Alaska Science Center, Glacier Bay.
Kirkman, L.K., K.L. Coffey, R.J. Mitchell, and E.B. Moser.2004. Ground cover recovery patterns and life-history traits:implications for restoration obstacles and opportunities in aspecies-rich savanna. Journal of Ecology 92:409–421.
Kirkman, L.K., and R.J. Mitchell. 2002. A forest gap approachto restoring longleaf pine–wiregrass ecosystems. EcologicalRestoration 20:50–51.
Komarek, E.V. 1979. The role of the hunting plantation in thedevelopment of game, fire ecology and management. Pro-ceedings of the Tall Timbers Ecology and ManagementConference 16:167–187.
Landers, J.L. 1991. Disturbance influences on pine traits in thesoutheastern United States. Proceedings of the Tall TimbersFire Ecology Conference 17:61–98.
Lindeman, S.T., R.T. Engstrom, W.E. Palmer, and B. Millsap.1997. Landscape restoration research at Tall Timbers Re-search Station using fire and forest management. Proceed-ings of the Society of American Foresters Annual Meeting,4–8 Oct 1997, Memphis, TN.
Masters, R.E., R.L. Lochmiller, and D.M. Engle. 1993. Effectsof timber harvest and prescribed fire on white-tailed deerforage production. Wildlife Society Bulletin 21:401–411.
Masters, R.E., K.M. Robertson, W.E. Palmer, J.A. Cox, K.McGorty, L. Green, and C.E. Ambrose. 2003. Red Hillsforest stewardship guide. Miscellaneous Publication 12, TallTimbers Research, Inc., Tallahassee, FL.
McGee, A.J. 1996. Seed ecology of bunchgrasses of longleaf–pine wiregrass communities at Fort Stewart, Georgia. M.S.Thesis, Georgia Southern University, Statesboro.
McNab, W.H., and M.B. Edwards Jr. 1976. Estimating forest fuelbuildup. Forest Farmer 35(5):6–7.
McQuilkin, W.E. 1940. The natural establishment of pine inabandoned fields in the Piedmont Plateau Region. Ecology2:135–147.
Mirov, N.T. 1967. The genus Pinus. Ronald Press, New York.Moser, W.K., and W.E. Palmer. 1997. Quail habitat and forest
management: What are the opportunities? Forest Landown-er Manual 56(2):56–63.
Moser, W.K., and C.K. Yu. 1999. Relationships between over-story density and understory vegetation of longleaf pine(Pinus palustris Mill.) forests in Okefenokee NWR: impli-cations for uneven-aged management. Pages 227–246 inW.H. Emmingham (ed.). Uneven-aged silviculture: proceed-ings of the IUFRO Interdisciplinary Uneven-Aged Silvi-
culture Symposium, 11–13 Sep 1997, Oregon State Uni-versity, Corvallis.
Mulligan, M.K., and L.K. Kirkman. 2002. Competition effectson wiregrass (Aristida beyrichana) growth and survival.Plant Ecology 163:39–50.
Noss, R.F. 1989. Longleaf pine and wiregrass: keystone com-ponents of an endangered ecosystem. Natural Areas Journal9:211–213.
Oosting, H.J. 1942. An ecological analysis of the plant com-munities of Piedmont, North Carolina. American MidlandNaturalist 28:1–126.
Paisley, C. 1968. From cotton to quail: an agricultural chronicleof Leon County, Florida, 1860–1967. University of FloridaPress, Gainesville.
Platt, W.J., G.W. Evans, and S.L. Rathbun. 1988. The populationdynamics of a long-lived conifer (Pinus palustris). Ameri-can Naturalist 131:491–525.
Platt, W.J., J.S. Glitzenstein, and D.R. Streng. 1991. Evaluatingpyrogenicity and its effects on vegetation in longleaf pinesavannas. Proceedings of the Tall Timbers Fire EcologyConference 17:143–161.
Prescott, C.E., L.L. Blevins, and C. Staley. 2004. Litter decom-position in British Columbia forests: controlling factors andinfluences of forestry activities. BC Journal of Ecosystemsand Management 5(2):44–57.
Rothermel, R.C. 1972. A mathematical model for predicting firespread in wildland fuels. Research Paper INT-115, U.S. De-partment of Agriculture, Forest Service, Intermountain For-est and Range Experiment Station, Ogden, UT.
Seamon, P.A., R.L. Myers, L.E. Robbins, and G.S. Seamon.1989. Wiregrass reproduction and community restoration.Natural Areas Journal 9:264–265.
Slocum, M.G., W.J. Platt, and H.C. Cooley. 2003. Effects ofdifferences in prescribed fire regimes on patchiness and in-tensity of fires in subtropical savannas of Everglades Na-tional Park, Florida. Restoration Ecology 11:91–102.
Smith, G.P., V.B. Shelbourne, and J.L. Walker. 2000. Structureand composition of vegetation on longleaf pine plantationsites compared to natural stands occurring along an envi-ronmental gradient at the Savannah River Site. Pages 481–486 in K.W. Outcalt (ed.). Proceedings of the Eleventh Bi-ennial Silvicultural Research Conference. General TechnicalReport SRS-48, U.S. Department of Agriculture, Forest Ser-vice, Southern Research Station, Asheville, NC.
Southeast Regional Climate Center. 2004. Historical climatesummaries and normals for the Southeast [online]. http://www.dnr.sc.gov/climate/sercc/climateinfo/historical/historical.html [accessed 22 May 2007].
StatSoft. 2004. Statistica. Version 6.1. StatSoft, Tulsa, OK.Stoddard, H.L. 1935. Use of controlled fire in southeastern up-
land game management. Journal of Forestry 33:346–351.Streng, D.R., J.S. Glitzenstein, and W.J. Platt. 1993. Evaluating
season of burn in longleaf pine forests: a critical literaturereview and some results from an ongoing long-term study.Proceedings of the Tall Timbers Fire Ecology Conference18:227–263.
Van Eerden, B.P. 1988. Studies on the reproductive biology ofwiregrass (Aristida stricta Michaux) in the Carolina Sand-hills. M.S. Thesis, University of Georgia, Athens.
Varner, J.M. III, J.S. Kush, and R.S. Meldahl. 2000. Ecologicalrestoration of an old-growth longleaf pine stand utilizingprescribed fire. Proceedings of the Tall Timbers Fire Ecol-ogy Conference 21:216–219.
Waldrop, T.A., D.H. Van Lear, F.T. Lloyd, and W.R. Harms.1987. Long-term studies of prescribed burning in loblollypine forests of the Southeastern Coastal Plain. GeneralTechnical Report SE-45, U.S. Department of Agriculture,Forest Service, Southeastern Forest Experiment Station,Asheville, NC.
Waldrop, T.A., D.L. White, and S.M. Jones. 1992. Fire regimesfor pine–grassland communities in the southeastern UnitedStates. Forest Ecology and Management 47:195–210.

191FUELS AND FIRE BEHAVIOR IN GEORGIA
Walker, J. 1998. Ground layer vegetation in longleaf pine land-scapes: an overview for restoration and management. Pages2–13 in Longleaf Alliance Report 3. The Longleaf Alliance,Auburn, AL.
White, D.L., T.A. Waldrop, and S.M. Jones. 1991. Forty yearsof prescribed burning on the Santee Fire Plots: effects onunderstory vegetation. Pages 51–59 in S.C. Novia and T.A.
Waldrop (eds.). General Technical Report 69, U.S. Depart-ment of Agriculture, Forest Service, Southeast Forest Ex-periment Station, Clemson, SC.
Wolters, G.L. 1981. Timber thinning and prescribed burning asmethods to increase herbage on grazed and protected long-leaf pine ranges. Journal of Range Management 34:494–497.
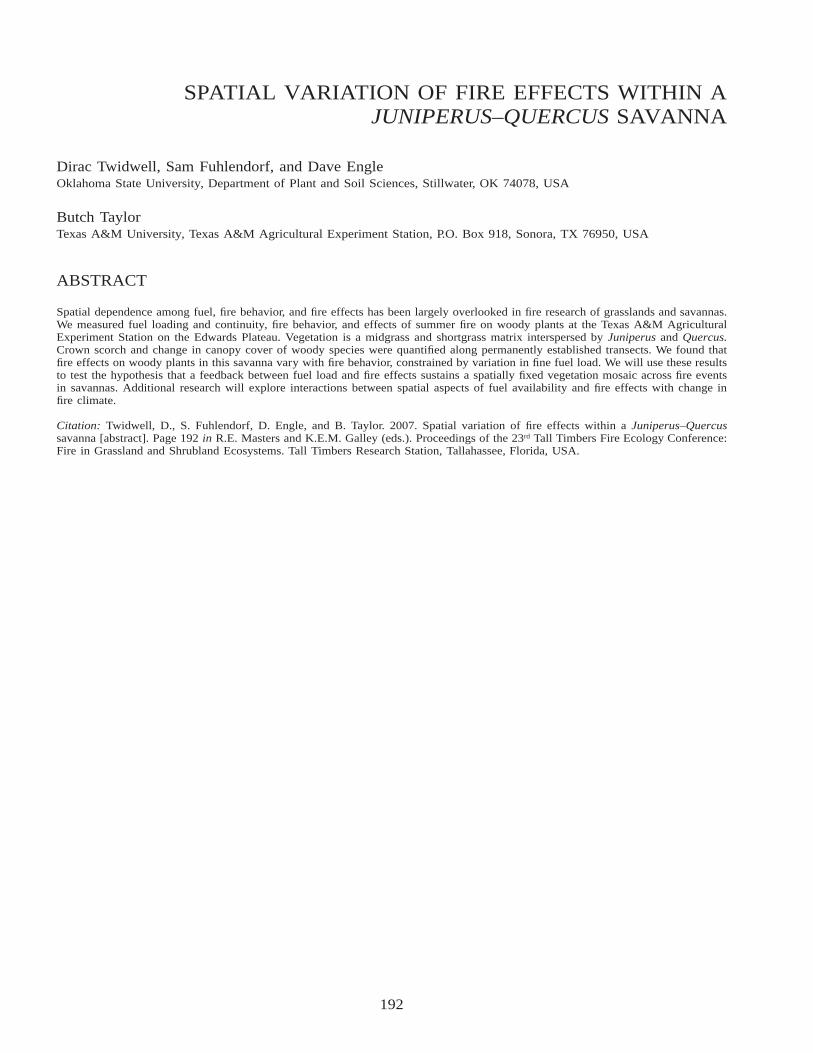
192
SPATIAL VARIATION OF FIRE EFFECTS WITHIN AJUNIPERUS–QUERCUS SAVANNA
Dirac Twidwell, Sam Fuhlendorf, and Dave EngleOklahoma State University, Department of Plant and Soil Sciences, Stillwater, OK 74078, USA
Butch TaylorTexas A&M University, Texas A&M Agricultural Experiment Station, P.O. Box 918, Sonora, TX 76950, USA
ABSTRACT
Spatial dependence among fuel, fire behavior, and fire effects has been largely overlooked in fire research of grasslands and savannas.We measured fuel loading and continuity, fire behavior, and effects of summer fire on woody plants at the Texas A&M AgriculturalExperiment Station on the Edwards Plateau. Vegetation is a midgrass and shortgrass matrix interspersed by Juniperus and Quercus.Crown scorch and change in canopy cover of woody species were quantified along permanently established transects. We found thatfire effects on woody plants in this savanna vary with fire behavior, constrained by variation in fine fuel load. We will use these resultsto test the hypothesis that a feedback between fuel load and fire effects sustains a spatially fixed vegetation mosaic across fire eventsin savannas. Additional research will explore interactions between spatial aspects of fuel availability and fire effects with change infire climate.
Citation: Twidwell, D., S. Fuhlendorf, D. Engle, and B. Taylor. 2007. Spatial variation of fire effects within a Juniperus–Quercussavanna [abstract]. Page 192 in R.E. Masters and K.E.M. Galley (eds.). Proceedings of the 23rd Tall Timbers Fire Ecology Conference:Fire in Grassland and Shrubland Ecosystems. Tall Timbers Research Station, Tallahassee, Florida, USA.
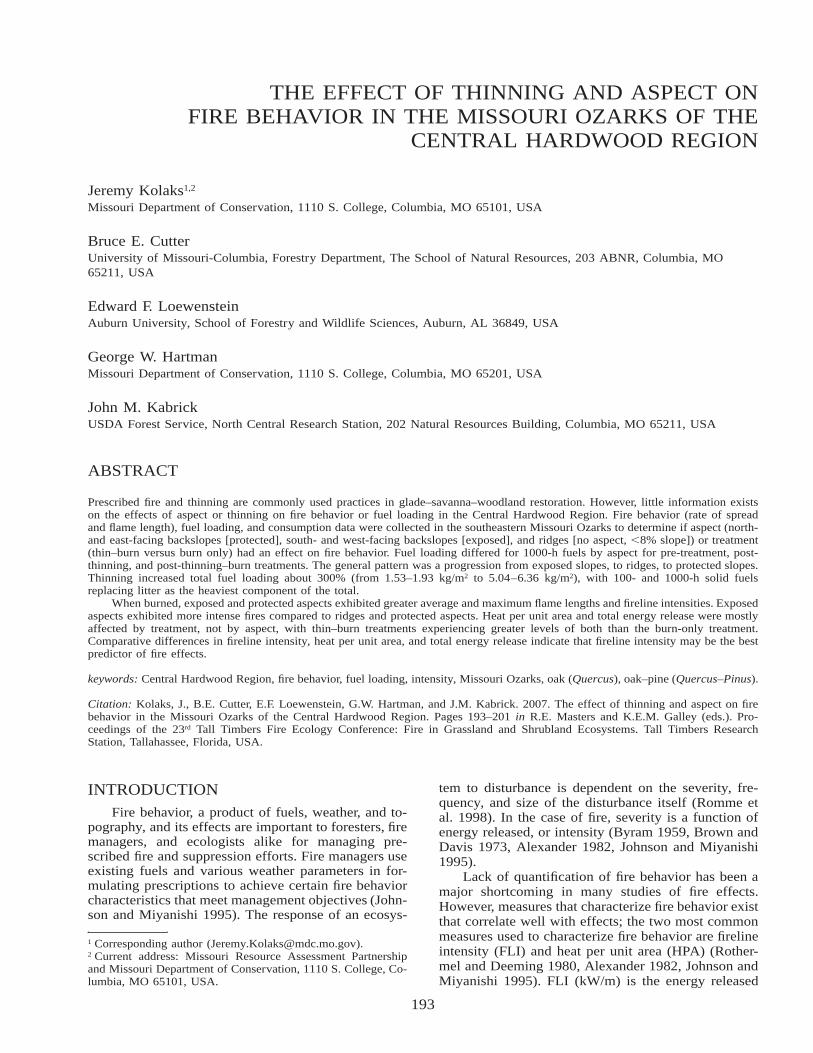
193
THE EFFECT OF THINNING AND ASPECT ONFIRE BEHAVIOR IN THE MISSOURI OZARKS OF THE
CENTRAL HARDWOOD REGION
Jeremy Kolaks1,2
Missouri Department of Conservation, 1110 S. College, Columbia, MO 65101, USA
Bruce E. CutterUniversity of Missouri-Columbia, Forestry Department, The School of Natural Resources, 203 ABNR, Columbia, MO65211, USA
Edward F. LoewensteinAuburn University, School of Forestry and Wildlife Sciences, Auburn, AL 36849, USA
George W. HartmanMissouri Department of Conservation, 1110 S. College, Columbia, MO 65201, USA
John M. KabrickUSDA Forest Service, North Central Research Station, 202 Natural Resources Building, Columbia, MO 65211, USA
ABSTRACT
Prescribed fire and thinning are commonly used practices in glade–savanna–woodland restoration. However, little information existson the effects of aspect or thinning on fire behavior or fuel loading in the Central Hardwood Region. Fire behavior (rate of spreadand flame length), fuel loading, and consumption data were collected in the southeastern Missouri Ozarks to determine if aspect (north-and east-facing backslopes [protected], south- and west-facing backslopes [exposed], and ridges [no aspect, �8% slope]) or treatment(thin–burn versus burn only) had an effect on fire behavior. Fuel loading differed for 1000-h fuels by aspect for pre-treatment, post-thinning, and post-thinning–burn treatments. The general pattern was a progression from exposed slopes, to ridges, to protected slopes.Thinning increased total fuel loading about 300% (from 1.53–1.93 kg/m2 to 5.04–6.36 kg/m2), with 100- and 1000-h solid fuelsreplacing litter as the heaviest component of the total.
When burned, exposed and protected aspects exhibited greater average and maximum flame lengths and fireline intensities. Exposedaspects exhibited more intense fires compared to ridges and protected aspects. Heat per unit area and total energy release were mostlyaffected by treatment, not by aspect, with thin–burn treatments experiencing greater levels of both than the burn-only treatment.Comparative differences in fireline intensity, heat per unit area, and total energy release indicate that fireline intensity may be the bestpredictor of fire effects.
keywords: Central Hardwood Region, fire behavior, fuel loading, intensity, Missouri Ozarks, oak (Quercus), oak–pine (Quercus–Pinus).
Citation: Kolaks, J., B.E. Cutter, E.F. Loewenstein, G.W. Hartman, and J.M. Kabrick. 2007. The effect of thinning and aspect on firebehavior in the Missouri Ozarks of the Central Hardwood Region. Pages 193–201 in R.E. Masters and K.E.M. Galley (eds.). Pro-ceedings of the 23rd Tall Timbers Fire Ecology Conference: Fire in Grassland and Shrubland Ecosystems. Tall Timbers ResearchStation, Tallahassee, Florida, USA.
INTRODUCTIONFire behavior, a product of fuels, weather, and to-
pography, and its effects are important to foresters, firemanagers, and ecologists alike for managing pre-scribed fire and suppression efforts. Fire managers useexisting fuels and various weather parameters in for-mulating prescriptions to achieve certain fire behaviorcharacteristics that meet management objectives (John-son and Miyanishi 1995). The response of an ecosys-
1 Corresponding author ([email protected]).2 Current address: Missouri Resource Assessment Partnershipand Missouri Department of Conservation, 1110 S. College, Co-lumbia, MO 65101, USA.
tem to disturbance is dependent on the severity, fre-quency, and size of the disturbance itself (Romme etal. 1998). In the case of fire, severity is a function ofenergy released, or intensity (Byram 1959, Brown andDavis 1973, Alexander 1982, Johnson and Miyanishi1995).
Lack of quantification of fire behavior has been amajor shortcoming in many studies of fire effects.However, measures that characterize fire behavior existthat correlate well with effects; the two most commonmeasures used to characterize fire behavior are firelineintensity (FLI) and heat per unit area (HPA) (Rother-mel and Deeming 1980, Alexander 1982, Johnson andMiyanishi 1995). FLI (kW/m) is the energy released
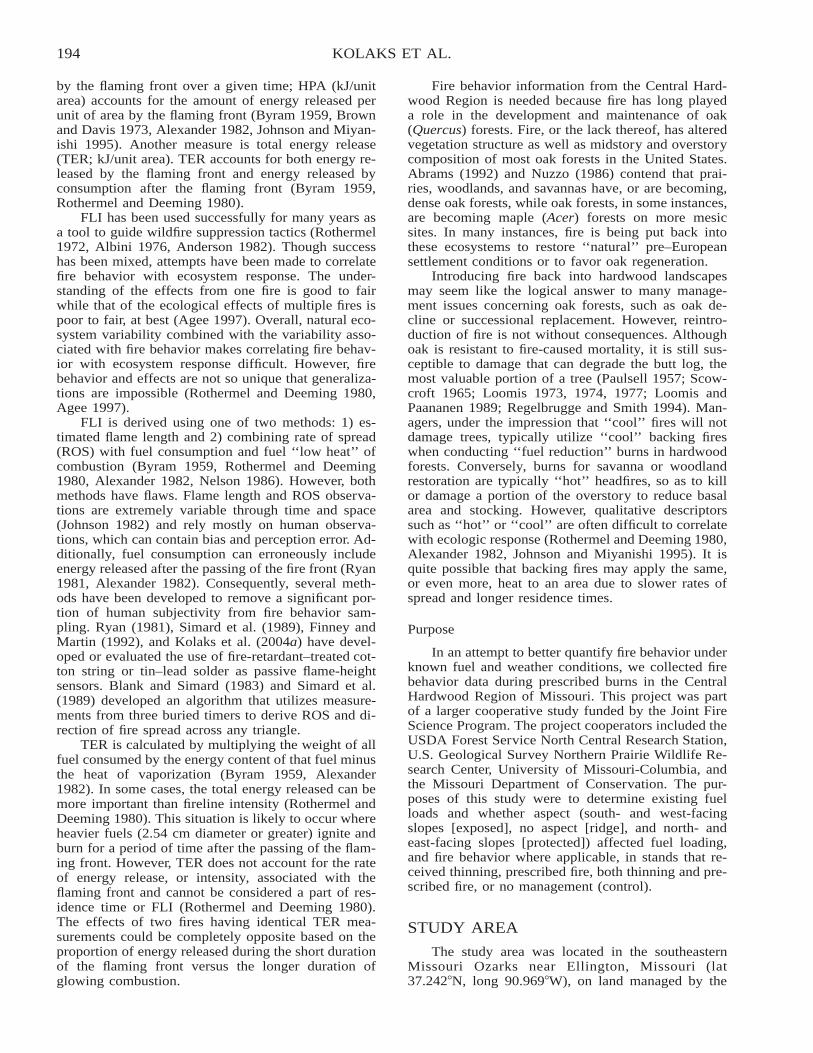
194 KOLAKS ET AL.
by the flaming front over a given time; HPA (kJ/unitarea) accounts for the amount of energy released perunit of area by the flaming front (Byram 1959, Brownand Davis 1973, Alexander 1982, Johnson and Miyan-ishi 1995). Another measure is total energy release(TER; kJ/unit area). TER accounts for both energy re-leased by the flaming front and energy released byconsumption after the flaming front (Byram 1959,Rothermel and Deeming 1980).
FLI has been used successfully for many years asa tool to guide wildfire suppression tactics (Rothermel1972, Albini 1976, Anderson 1982). Though successhas been mixed, attempts have been made to correlatefire behavior with ecosystem response. The under-standing of the effects from one fire is good to fairwhile that of the ecological effects of multiple fires ispoor to fair, at best (Agee 1997). Overall, natural eco-system variability combined with the variability asso-ciated with fire behavior makes correlating fire behav-ior with ecosystem response difficult. However, firebehavior and effects are not so unique that generaliza-tions are impossible (Rothermel and Deeming 1980,Agee 1997).
FLI is derived using one of two methods: 1) es-timated flame length and 2) combining rate of spread(ROS) with fuel consumption and fuel ‘‘low heat’’ ofcombustion (Byram 1959, Rothermel and Deeming1980, Alexander 1982, Nelson 1986). However, bothmethods have flaws. Flame length and ROS observa-tions are extremely variable through time and space(Johnson 1982) and rely mostly on human observa-tions, which can contain bias and perception error. Ad-ditionally, fuel consumption can erroneously includeenergy released after the passing of the fire front (Ryan1981, Alexander 1982). Consequently, several meth-ods have been developed to remove a significant por-tion of human subjectivity from fire behavior sam-pling. Ryan (1981), Simard et al. (1989), Finney andMartin (1992), and Kolaks et al. (2004a) have devel-oped or evaluated the use of fire-retardant–treated cot-ton string or tin–lead solder as passive flame-heightsensors. Blank and Simard (1983) and Simard et al.(1989) developed an algorithm that utilizes measure-ments from three buried timers to derive ROS and di-rection of fire spread across any triangle.
TER is calculated by multiplying the weight of allfuel consumed by the energy content of that fuel minusthe heat of vaporization (Byram 1959, Alexander1982). In some cases, the total energy released can bemore important than fireline intensity (Rothermel andDeeming 1980). This situation is likely to occur whereheavier fuels (2.54 cm diameter or greater) ignite andburn for a period of time after the passing of the flam-ing front. However, TER does not account for the rateof energy release, or intensity, associated with theflaming front and cannot be considered a part of res-idence time or FLI (Rothermel and Deeming 1980).The effects of two fires having identical TER mea-surements could be completely opposite based on theproportion of energy released during the short durationof the flaming front versus the longer duration ofglowing combustion.
Fire behavior information from the Central Hard-wood Region is needed because fire has long playeda role in the development and maintenance of oak(Quercus) forests. Fire, or the lack thereof, has alteredvegetation structure as well as midstory and overstorycomposition of most oak forests in the United States.Abrams (1992) and Nuzzo (1986) contend that prai-ries, woodlands, and savannas have, or are becoming,dense oak forests, while oak forests, in some instances,are becoming maple (Acer) forests on more mesicsites. In many instances, fire is being put back intothese ecosystems to restore ‘‘natural’’ pre–Europeansettlement conditions or to favor oak regeneration.
Introducing fire back into hardwood landscapesmay seem like the logical answer to many manage-ment issues concerning oak forests, such as oak de-cline or successional replacement. However, reintro-duction of fire is not without consequences. Althoughoak is resistant to fire-caused mortality, it is still sus-ceptible to damage that can degrade the butt log, themost valuable portion of a tree (Paulsell 1957; Scow-croft 1965; Loomis 1973, 1974, 1977; Loomis andPaananen 1989; Regelbrugge and Smith 1994). Man-agers, under the impression that ‘‘cool’’ fires will notdamage trees, typically utilize ‘‘cool’’ backing fireswhen conducting ‘‘fuel reduction’’ burns in hardwoodforests. Conversely, burns for savanna or woodlandrestoration are typically ‘‘hot’’ headfires, so as to killor damage a portion of the overstory to reduce basalarea and stocking. However, qualitative descriptorssuch as ‘‘hot’’ or ‘‘cool’’ are often difficult to correlatewith ecologic response (Rothermel and Deeming 1980,Alexander 1982, Johnson and Miyanishi 1995). It isquite possible that backing fires may apply the same,or even more, heat to an area due to slower rates ofspread and longer residence times.
Purpose
In an attempt to better quantify fire behavior underknown fuel and weather conditions, we collected firebehavior data during prescribed burns in the CentralHardwood Region of Missouri. This project was partof a larger cooperative study funded by the Joint FireScience Program. The project cooperators included theUSDA Forest Service North Central Research Station,U.S. Geological Survey Northern Prairie Wildlife Re-search Center, University of Missouri-Columbia, andthe Missouri Department of Conservation. The pur-poses of this study were to determine existing fuelloads and whether aspect (south- and west-facingslopes [exposed], no aspect [ridge], and north- andeast-facing slopes [protected]) affected fuel loading,and fire behavior where applicable, in stands that re-ceived thinning, prescribed fire, both thinning and pre-scribed fire, or no management (control).
STUDY AREA
The study area was located in the southeasternMissouri Ozarks near Ellington, Missouri (lat37.242�N, long 90.969�W), on land managed by the
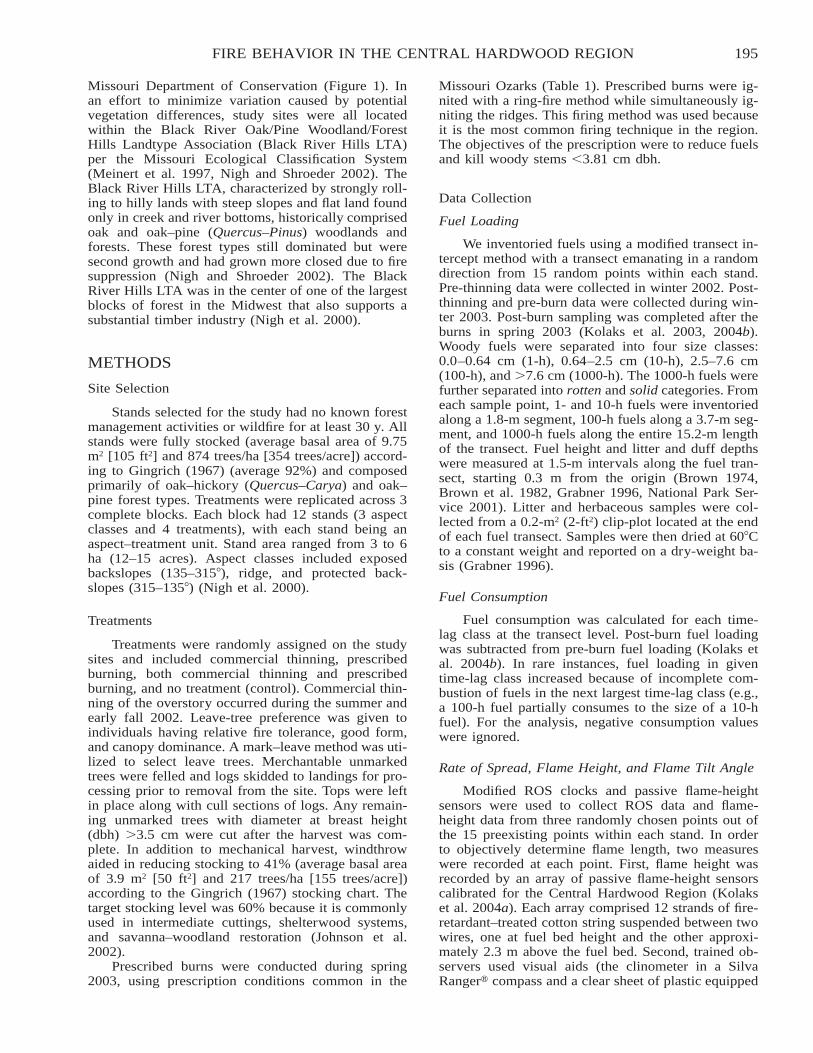
195FIRE BEHAVIOR IN THE CENTRAL HARDWOOD REGION
Missouri Department of Conservation (Figure 1). Inan effort to minimize variation caused by potentialvegetation differences, study sites were all locatedwithin the Black River Oak/Pine Woodland/ForestHills Landtype Association (Black River Hills LTA)per the Missouri Ecological Classification System(Meinert et al. 1997, Nigh and Shroeder 2002). TheBlack River Hills LTA, characterized by strongly roll-ing to hilly lands with steep slopes and flat land foundonly in creek and river bottoms, historically comprisedoak and oak–pine (Quercus–Pinus) woodlands andforests. These forest types still dominated but weresecond growth and had grown more closed due to firesuppression (Nigh and Shroeder 2002). The BlackRiver Hills LTA was in the center of one of the largestblocks of forest in the Midwest that also supports asubstantial timber industry (Nigh et al. 2000).
METHODS
Site Selection
Stands selected for the study had no known forestmanagement activities or wildfire for at least 30 y. Allstands were fully stocked (average basal area of 9.75m2 [105 ft2] and 874 trees/ha [354 trees/acre]) accord-ing to Gingrich (1967) (average 92%) and composedprimarily of oak–hickory (Quercus–Carya) and oak–pine forest types. Treatments were replicated across 3complete blocks. Each block had 12 stands (3 aspectclasses and 4 treatments), with each stand being anaspect–treatment unit. Stand area ranged from 3 to 6ha (12–15 acres). Aspect classes included exposedbackslopes (135–315�), ridge, and protected back-slopes (315–135�) (Nigh et al. 2000).
Treatments
Treatments were randomly assigned on the studysites and included commercial thinning, prescribedburning, both commercial thinning and prescribedburning, and no treatment (control). Commercial thin-ning of the overstory occurred during the summer andearly fall 2002. Leave-tree preference was given toindividuals having relative fire tolerance, good form,and canopy dominance. A mark–leave method was uti-lized to select leave trees. Merchantable unmarkedtrees were felled and logs skidded to landings for pro-cessing prior to removal from the site. Tops were leftin place along with cull sections of logs. Any remain-ing unmarked trees with diameter at breast height(dbh) �3.5 cm were cut after the harvest was com-plete. In addition to mechanical harvest, windthrowaided in reducing stocking to 41% (average basal areaof 3.9 m2 [50 ft2] and 217 trees/ha [155 trees/acre])according to the Gingrich (1967) stocking chart. Thetarget stocking level was 60% because it is commonlyused in intermediate cuttings, shelterwood systems,and savanna–woodland restoration (Johnson et al.2002).
Prescribed burns were conducted during spring2003, using prescription conditions common in the
Missouri Ozarks (Table 1). Prescribed burns were ig-nited with a ring-fire method while simultaneously ig-niting the ridges. This firing method was used becauseit is the most common firing technique in the region.The objectives of the prescription were to reduce fuelsand kill woody stems �3.81 cm dbh.
Data Collection
Fuel Loading
We inventoried fuels using a modified transect in-tercept method with a transect emanating in a randomdirection from 15 random points within each stand.Pre-thinning data were collected in winter 2002. Post-thinning and pre-burn data were collected during win-ter 2003. Post-burn sampling was completed after theburns in spring 2003 (Kolaks et al. 2003, 2004b).Woody fuels were separated into four size classes:0.0–0.64 cm (1-h), 0.64–2.5 cm (10-h), 2.5–7.6 cm(100-h), and �7.6 cm (1000-h). The 1000-h fuels werefurther separated into rotten and solid categories. Fromeach sample point, 1- and 10-h fuels were inventoriedalong a 1.8-m segment, 100-h fuels along a 3.7-m seg-ment, and 1000-h fuels along the entire 15.2-m lengthof the transect. Fuel height and litter and duff depthswere measured at 1.5-m intervals along the fuel tran-sect, starting 0.3 m from the origin (Brown 1974,Brown et al. 1982, Grabner 1996, National Park Ser-vice 2001). Litter and herbaceous samples were col-lected from a 0.2-m2 (2-ft2) clip-plot located at the endof each fuel transect. Samples were then dried at 60�Cto a constant weight and reported on a dry-weight ba-sis (Grabner 1996).
Fuel Consumption
Fuel consumption was calculated for each time-lag class at the transect level. Post-burn fuel loadingwas subtracted from pre-burn fuel loading (Kolaks etal. 2004b). In rare instances, fuel loading in giventime-lag class increased because of incomplete com-bustion of fuels in the next largest time-lag class (e.g.,a 100-h fuel partially consumes to the size of a 10-hfuel). For the analysis, negative consumption valueswere ignored.
Rate of Spread, Flame Height, and Flame Tilt Angle
Modified ROS clocks and passive flame-heightsensors were used to collect ROS data and flame-height data from three randomly chosen points out ofthe 15 preexisting points within each stand. In orderto objectively determine flame length, two measureswere recorded at each point. First, flame height wasrecorded by an array of passive flame-height sensorscalibrated for the Central Hardwood Region (Kolakset al. 2004a). Each array comprised 12 strands of fire-retardant–treated cotton string suspended between twowires, one at fuel bed height and the other approxi-mately 2.3 m above the fuel bed. Second, trained ob-servers used visual aids (the clinometer in a SilvaRanger� compass and a clear sheet of plastic equipped
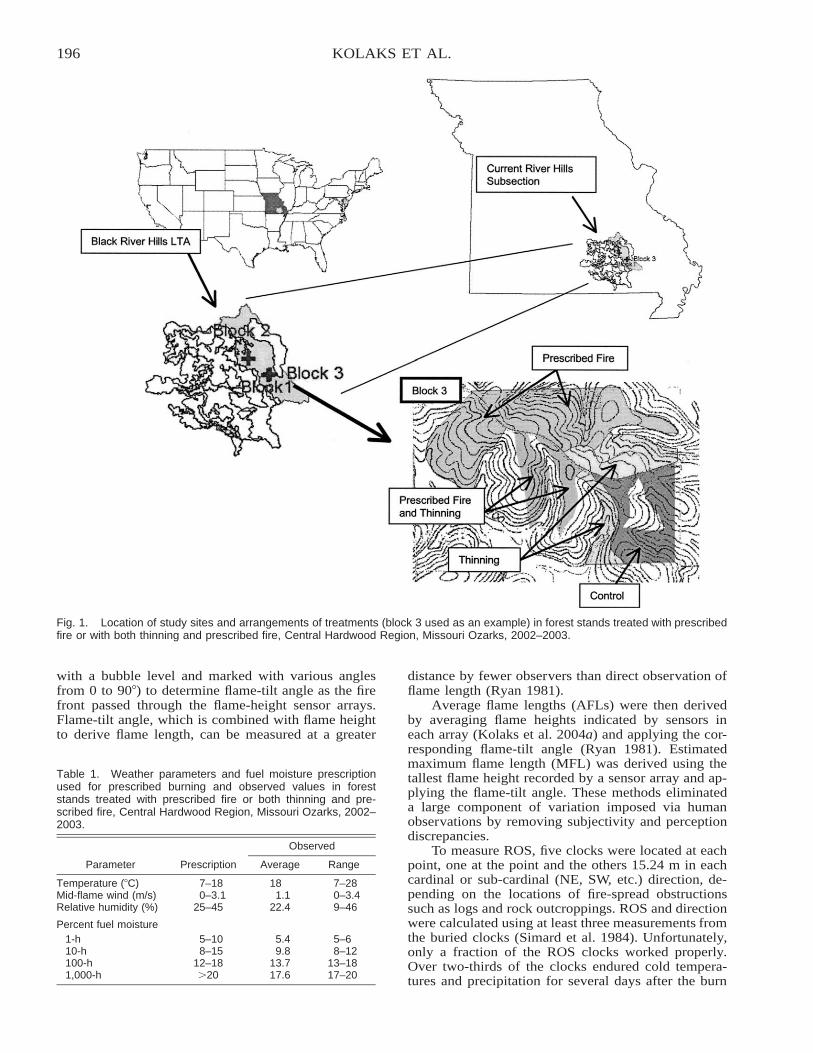
196 KOLAKS ET AL.
Fig. 1. Location of study sites and arrangements of treatments (block 3 used as an example) in forest stands treated with prescribedfire or with both thinning and prescribed fire, Central Hardwood Region, Missouri Ozarks, 2002–2003.
Table 1. Weather parameters and fuel moisture prescriptionused for prescribed burning and observed values in foreststands treated with prescribed fire or both thinning and pre-scribed fire, Central Hardwood Region, Missouri Ozarks, 2002–2003.
Parameter Prescription
Observed
Average Range
Temperature (�C) 7–18 18 7–28Mid-flame wind (m/s) 0–3.1 1.1 0–3.4Relative humidity (%) 25–45 22.4 9–46
Percent fuel moisture1-h 5–10 5.4 5–610-h 8–15 9.8 8–12100-h 12–18 13.7 13–181,000-h �20 17.6 17–20
with a bubble level and marked with various anglesfrom 0 to 90�) to determine flame-tilt angle as the firefront passed through the flame-height sensor arrays.Flame-tilt angle, which is combined with flame heightto derive flame length, can be measured at a greater
distance by fewer observers than direct observation offlame length (Ryan 1981).
Average flame lengths (AFLs) were then derivedby averaging flame heights indicated by sensors ineach array (Kolaks et al. 2004a) and applying the cor-responding flame-tilt angle (Ryan 1981). Estimatedmaximum flame length (MFL) was derived using thetallest flame height recorded by a sensor array and ap-plying the flame-tilt angle. These methods eliminateda large component of variation imposed via humanobservations by removing subjectivity and perceptiondiscrepancies.
To measure ROS, five clocks were located at eachpoint, one at the point and the others 15.24 m in eachcardinal or sub-cardinal (NE, SW, etc.) direction, de-pending on the locations of fire-spread obstructionssuch as logs and rock outcroppings. ROS and directionwere calculated using at least three measurements fromthe buried clocks (Simard et al. 1984). Unfortunately,only a fraction of the ROS clocks worked properly.Over two-thirds of the clocks endured cold tempera-tures and precipitation for several days after the burn
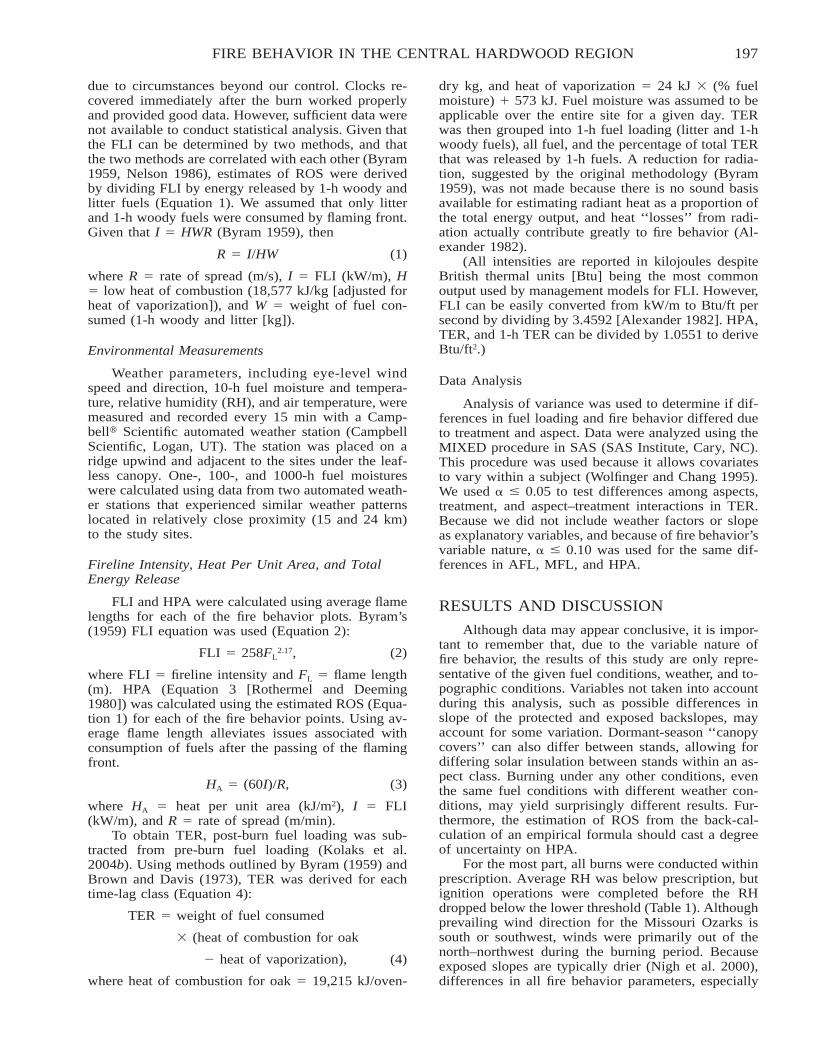
197FIRE BEHAVIOR IN THE CENTRAL HARDWOOD REGION
due to circumstances beyond our control. Clocks re-covered immediately after the burn worked properlyand provided good data. However, sufficient data werenot available to conduct statistical analysis. Given thatthe FLI can be determined by two methods, and thatthe two methods are correlated with each other (Byram1959, Nelson 1986), estimates of ROS were derivedby dividing FLI by energy released by 1-h woody andlitter fuels (Equation 1). We assumed that only litterand 1-h woody fuels were consumed by flaming front.Given that I � HWR (Byram 1959), then
R � I/HW (1)
where R � rate of spread (m/s), I � FLI (kW/m), H� low heat of combustion (18,577 kJ/kg [adjusted forheat of vaporization]), and W � weight of fuel con-sumed (1-h woody and litter [kg]).
Environmental Measurements
Weather parameters, including eye-level windspeed and direction, 10-h fuel moisture and tempera-ture, relative humidity (RH), and air temperature, weremeasured and recorded every 15 min with a Camp-bell� Scientific automated weather station (CampbellScientific, Logan, UT). The station was placed on aridge upwind and adjacent to the sites under the leaf-less canopy. One-, 100-, and 1000-h fuel moistureswere calculated using data from two automated weath-er stations that experienced similar weather patternslocated in relatively close proximity (15 and 24 km)to the study sites.
Fireline Intensity, Heat Per Unit Area, and TotalEnergy Release
FLI and HPA were calculated using average flamelengths for each of the fire behavior plots. Byram’s(1959) FLI equation was used (Equation 2):
FLI � 258FL2.17, (2)
where FLI � fireline intensity and FL � flame length(m). HPA (Equation 3 [Rothermel and Deeming1980]) was calculated using the estimated ROS (Equa-tion 1) for each of the fire behavior points. Using av-erage flame length alleviates issues associated withconsumption of fuels after the passing of the flamingfront.
HA � (60I)/R, (3)
where HA � heat per unit area (kJ/m2), I � FLI(kW/m), and R � rate of spread (m/min).
To obtain TER, post-burn fuel loading was sub-tracted from pre-burn fuel loading (Kolaks et al.2004b). Using methods outlined by Byram (1959) andBrown and Davis (1973), TER was derived for eachtime-lag class (Equation 4):
TER � weight of fuel consumed
� (heat of combustion for oak
� heat of vaporization), (4)
where heat of combustion for oak � 19,215 kJ/oven-
dry kg, and heat of vaporization � 24 kJ � (% fuelmoisture) � 573 kJ. Fuel moisture was assumed to beapplicable over the entire site for a given day. TERwas then grouped into 1-h fuel loading (litter and 1-hwoody fuels), all fuel, and the percentage of total TERthat was released by 1-h fuels. A reduction for radia-tion, suggested by the original methodology (Byram1959), was not made because there is no sound basisavailable for estimating radiant heat as a proportion ofthe total energy output, and heat ‘‘losses’’ from radi-ation actually contribute greatly to fire behavior (Al-exander 1982).
(All intensities are reported in kilojoules despiteBritish thermal units [Btu] being the most commonoutput used by management models for FLI. However,FLI can be easily converted from kW/m to Btu/ft persecond by dividing by 3.4592 [Alexander 1982]. HPA,TER, and 1-h TER can be divided by 1.0551 to deriveBtu/ft2.)
Data Analysis
Analysis of variance was used to determine if dif-ferences in fuel loading and fire behavior differed dueto treatment and aspect. Data were analyzed using theMIXED procedure in SAS (SAS Institute, Cary, NC).This procedure was used because it allows covariatesto vary within a subject (Wolfinger and Chang 1995).We used � 0.05 to test differences among aspects,treatment, and aspect–treatment interactions in TER.Because we did not include weather factors or slopeas explanatory variables, and because of fire behavior’svariable nature, � 0.10 was used for the same dif-ferences in AFL, MFL, and HPA.
RESULTS AND DISCUSSION
Although data may appear conclusive, it is impor-tant to remember that, due to the variable nature offire behavior, the results of this study are only repre-sentative of the given fuel conditions, weather, and to-pographic conditions. Variables not taken into accountduring this analysis, such as possible differences inslope of the protected and exposed backslopes, mayaccount for some variation. Dormant-season ‘‘canopycovers’’ can also differ between stands, allowing fordiffering solar insulation between stands within an as-pect class. Burning under any other conditions, eventhe same fuel conditions with different weather con-ditions, may yield surprisingly different results. Fur-thermore, the estimation of ROS from the back-cal-culation of an empirical formula should cast a degreeof uncertainty on HPA.
For the most part, all burns were conducted withinprescription. Average RH was below prescription, butignition operations were completed before the RHdropped below the lower threshold (Table 1). Althoughprevailing wind direction for the Missouri Ozarks issouth or southwest, winds were primarily out of thenorth–northwest during the burning period. Becauseexposed slopes are typically drier (Nigh et al. 2000),differences in all fire behavior parameters, especially
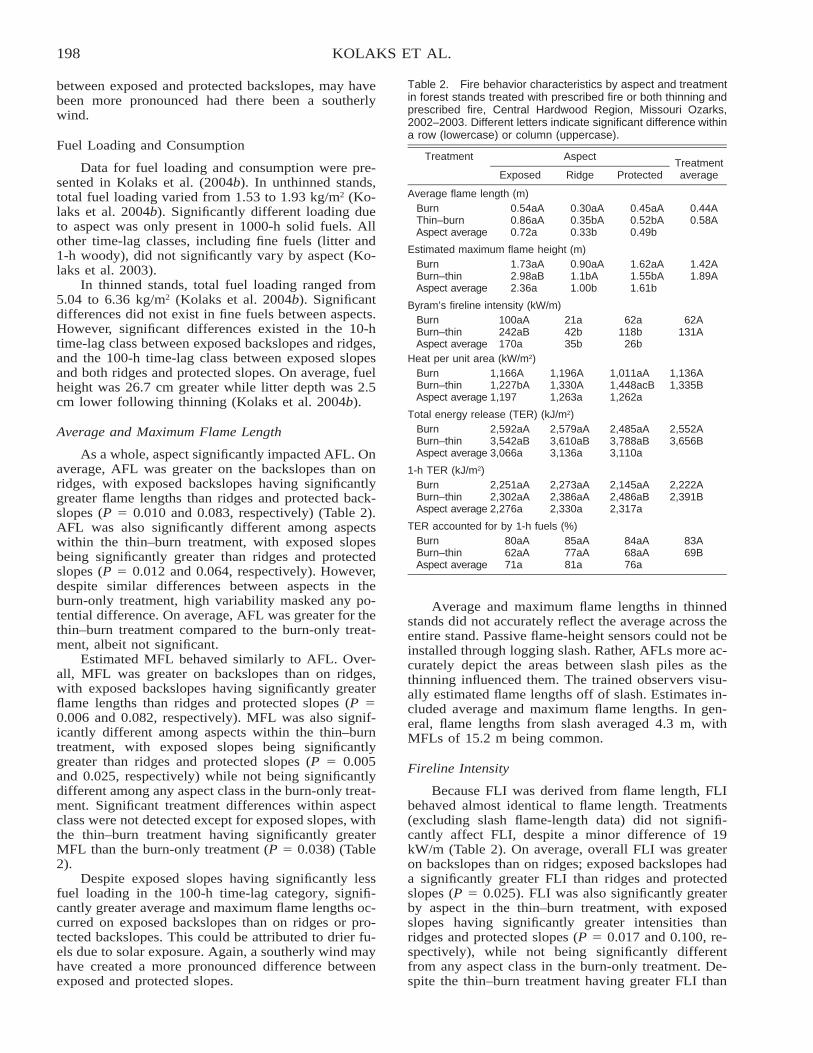
198 KOLAKS ET AL.
Table 2. Fire behavior characteristics by aspect and treatmentin forest stands treated with prescribed fire or both thinning andprescribed fire, Central Hardwood Region, Missouri Ozarks,2002–2003. Different letters indicate significant difference withina row (lowercase) or column (uppercase).
Treatment Aspect
Exposed Ridge ProtectedTreatmentaverage
Average flame length (m)Burn 0.54aA 0.30aA 0.45aA 0.44AThin–burn 0.86aA 0.35bA 0.52bA 0.58AAspect average 0.72a 0.33b 0.49b
Estimated maximum flame height (m)Burn 1.73aA 0.90aA 1.62aA 1.42ABurn–thin 2.98aB 1.1bA 1.55bA 1.89AAspect average 2.36a 1.00b 1.61b
Byram’s fireline intensity (kW/m)Burn 100aA 21a 62a 62ABurn–thin 242aB 42b 118b 131AAspect average 170a 35b 26b
Heat per unit area (kW/m2)Burn 1,166A 1,196A 1,011aA 1,136ABurn–thin 1,227bA 1,330A 1,448acB 1,335BAspect average 1,197 1,263a 1,262a
Total energy release (TER) (kJ/m2)Burn 2,592aA 2,579aA 2,485aA 2,552ABurn–thin 3,542aB 3,610aB 3,788aB 3,656BAspect average 3,066a 3,136a 3,110a
1-h TER (kJ/m2)Burn 2,251aA 2,273aA 2,145aA 2,222ABurn–thin 2,302aA 2,386aA 2,486aB 2,391BAspect average 2,276a 2,330a 2,317a
TER accounted for by 1-h fuels (%)Burn 80aA 85aA 84aA 83ABurn–thin 62aA 77aA 68aA 69BAspect average 71a 81a 76a
between exposed and protected backslopes, may havebeen more pronounced had there been a southerlywind.
Fuel Loading and Consumption
Data for fuel loading and consumption were pre-sented in Kolaks et al. (2004b). In unthinned stands,total fuel loading varied from 1.53 to 1.93 kg/m2 (Ko-laks et al. 2004b). Significantly different loading dueto aspect was only present in 1000-h solid fuels. Allother time-lag classes, including fine fuels (litter and1-h woody), did not significantly vary by aspect (Ko-laks et al. 2003).
In thinned stands, total fuel loading ranged from5.04 to 6.36 kg/m2 (Kolaks et al. 2004b). Significantdifferences did not exist in fine fuels between aspects.However, significant differences existed in the 10-htime-lag class between exposed backslopes and ridges,and the 100-h time-lag class between exposed slopesand both ridges and protected slopes. On average, fuelheight was 26.7 cm greater while litter depth was 2.5cm lower following thinning (Kolaks et al. 2004b).
Average and Maximum Flame Length
As a whole, aspect significantly impacted AFL. Onaverage, AFL was greater on the backslopes than onridges, with exposed backslopes having significantlygreater flame lengths than ridges and protected back-slopes (P � 0.010 and 0.083, respectively) (Table 2).AFL was also significantly different among aspectswithin the thin–burn treatment, with exposed slopesbeing significantly greater than ridges and protectedslopes (P � 0.012 and 0.064, respectively). However,despite similar differences between aspects in theburn-only treatment, high variability masked any po-tential difference. On average, AFL was greater for thethin–burn treatment compared to the burn-only treat-ment, albeit not significant.
Estimated MFL behaved similarly to AFL. Over-all, MFL was greater on backslopes than on ridges,with exposed backslopes having significantly greaterflame lengths than ridges and protected slopes (P �0.006 and 0.082, respectively). MFL was also signif-icantly different among aspects within the thin–burntreatment, with exposed slopes being significantlygreater than ridges and protected slopes (P � 0.005and 0.025, respectively) while not being significantlydifferent among any aspect class in the burn-only treat-ment. Significant treatment differences within aspectclass were not detected except for exposed slopes, withthe thin–burn treatment having significantly greaterMFL than the burn-only treatment (P � 0.038) (Table2).
Despite exposed slopes having significantly lessfuel loading in the 100-h time-lag category, signifi-cantly greater average and maximum flame lengths oc-curred on exposed backslopes than on ridges or pro-tected backslopes. This could be attributed to drier fu-els due to solar exposure. Again, a southerly wind mayhave created a more pronounced difference betweenexposed and protected slopes.
Average and maximum flame lengths in thinnedstands did not accurately reflect the average across theentire stand. Passive flame-height sensors could not beinstalled through logging slash. Rather, AFLs more ac-curately depict the areas between slash piles as thethinning influenced them. The trained observers visu-ally estimated flame lengths off of slash. Estimates in-cluded average and maximum flame lengths. In gen-eral, flame lengths from slash averaged 4.3 m, withMFLs of 15.2 m being common.
Fireline Intensity
Because FLI was derived from flame length, FLIbehaved almost identical to flame length. Treatments(excluding slash flame-length data) did not signifi-cantly affect FLI, despite a minor difference of 19kW/m (Table 2). On average, overall FLI was greateron backslopes than on ridges; exposed backslopes hada significantly greater FLI than ridges and protectedslopes (P � 0.025). FLI was also significantly greaterby aspect in the thin–burn treatment, with exposedslopes having significantly greater intensities thanridges and protected slopes (P � 0.017 and 0.100, re-spectively), while not being significantly differentfrom any aspect class in the burn-only treatment. De-spite the thin–burn treatment having greater FLI than
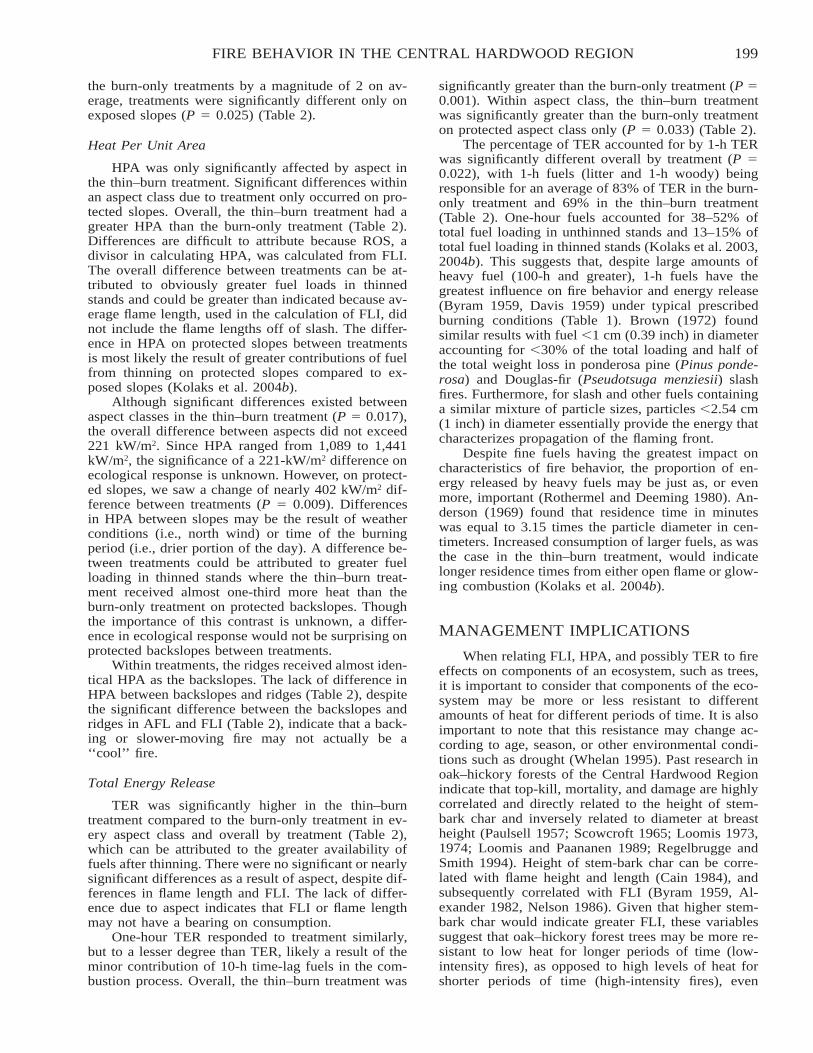
199FIRE BEHAVIOR IN THE CENTRAL HARDWOOD REGION
the burn-only treatments by a magnitude of 2 on av-erage, treatments were significantly different only onexposed slopes (P � 0.025) (Table 2).
Heat Per Unit Area
HPA was only significantly affected by aspect inthe thin–burn treatment. Significant differences withinan aspect class due to treatment only occurred on pro-tected slopes. Overall, the thin–burn treatment had agreater HPA than the burn-only treatment (Table 2).Differences are difficult to attribute because ROS, adivisor in calculating HPA, was calculated from FLI.The overall difference between treatments can be at-tributed to obviously greater fuel loads in thinnedstands and could be greater than indicated because av-erage flame length, used in the calculation of FLI, didnot include the flame lengths off of slash. The differ-ence in HPA on protected slopes between treatmentsis most likely the result of greater contributions of fuelfrom thinning on protected slopes compared to ex-posed slopes (Kolaks et al. 2004b).
Although significant differences existed betweenaspect classes in the thin–burn treatment (P � 0.017),the overall difference between aspects did not exceed221 kW/m2. Since HPA ranged from 1,089 to 1,441kW/m2, the significance of a 221-kW/m2 difference onecological response is unknown. However, on protect-ed slopes, we saw a change of nearly 402 kW/m2 dif-ference between treatments (P � 0.009). Differencesin HPA between slopes may be the result of weatherconditions (i.e., north wind) or time of the burningperiod (i.e., drier portion of the day). A difference be-tween treatments could be attributed to greater fuelloading in thinned stands where the thin–burn treat-ment received almost one-third more heat than theburn-only treatment on protected backslopes. Thoughthe importance of this contrast is unknown, a differ-ence in ecological response would not be surprising onprotected backslopes between treatments.
Within treatments, the ridges received almost iden-tical HPA as the backslopes. The lack of difference inHPA between backslopes and ridges (Table 2), despitethe significant difference between the backslopes andridges in AFL and FLI (Table 2), indicate that a back-ing or slower-moving fire may not actually be a‘‘cool’’ fire.
Total Energy Release
TER was significantly higher in the thin–burntreatment compared to the burn-only treatment in ev-ery aspect class and overall by treatment (Table 2),which can be attributed to the greater availability offuels after thinning. There were no significant or nearlysignificant differences as a result of aspect, despite dif-ferences in flame length and FLI. The lack of differ-ence due to aspect indicates that FLI or flame lengthmay not have a bearing on consumption.
One-hour TER responded to treatment similarly,but to a lesser degree than TER, likely a result of theminor contribution of 10-h time-lag fuels in the com-bustion process. Overall, the thin–burn treatment was
significantly greater than the burn-only treatment (P �0.001). Within aspect class, the thin–burn treatmentwas significantly greater than the burn-only treatmenton protected aspect class only (P � 0.033) (Table 2).
The percentage of TER accounted for by 1-h TERwas significantly different overall by treatment (P �0.022), with 1-h fuels (litter and 1-h woody) beingresponsible for an average of 83% of TER in the burn-only treatment and 69% in the thin–burn treatment(Table 2). One-hour fuels accounted for 38–52% oftotal fuel loading in unthinned stands and 13–15% oftotal fuel loading in thinned stands (Kolaks et al. 2003,2004b). This suggests that, despite large amounts ofheavy fuel (100-h and greater), 1-h fuels have thegreatest influence on fire behavior and energy release(Byram 1959, Davis 1959) under typical prescribedburning conditions (Table 1). Brown (1972) foundsimilar results with fuel �1 cm (0.39 inch) in diameteraccounting for �30% of the total loading and half ofthe total weight loss in ponderosa pine (Pinus ponde-rosa) and Douglas-fir (Pseudotsuga menziesii) slashfires. Furthermore, for slash and other fuels containinga similar mixture of particle sizes, particles �2.54 cm(1 inch) in diameter essentially provide the energy thatcharacterizes propagation of the flaming front.
Despite fine fuels having the greatest impact oncharacteristics of fire behavior, the proportion of en-ergy released by heavy fuels may be just as, or evenmore, important (Rothermel and Deeming 1980). An-derson (1969) found that residence time in minuteswas equal to 3.15 times the particle diameter in cen-timeters. Increased consumption of larger fuels, as wasthe case in the thin–burn treatment, would indicatelonger residence times from either open flame or glow-ing combustion (Kolaks et al. 2004b).
MANAGEMENT IMPLICATIONS
When relating FLI, HPA, and possibly TER to fireeffects on components of an ecosystem, such as trees,it is important to consider that components of the eco-system may be more or less resistant to differentamounts of heat for different periods of time. It is alsoimportant to note that this resistance may change ac-cording to age, season, or other environmental condi-tions such as drought (Whelan 1995). Past research inoak–hickory forests of the Central Hardwood Regionindicate that top-kill, mortality, and damage are highlycorrelated and directly related to the height of stem-bark char and inversely related to diameter at breastheight (Paulsell 1957; Scowcroft 1965; Loomis 1973,1974; Loomis and Paananen 1989; Regelbrugge andSmith 1994). Height of stem-bark char can be corre-lated with flame height and length (Cain 1984), andsubsequently correlated with FLI (Byram 1959, Al-exander 1982, Nelson 1986). Given that higher stem-bark char would indicate greater FLI, these variablessuggest that oak–hickory forest trees may be more re-sistant to low heat for longer periods of time (low-intensity fires), as opposed to high levels of heat forshorter periods of time (high-intensity fires), even
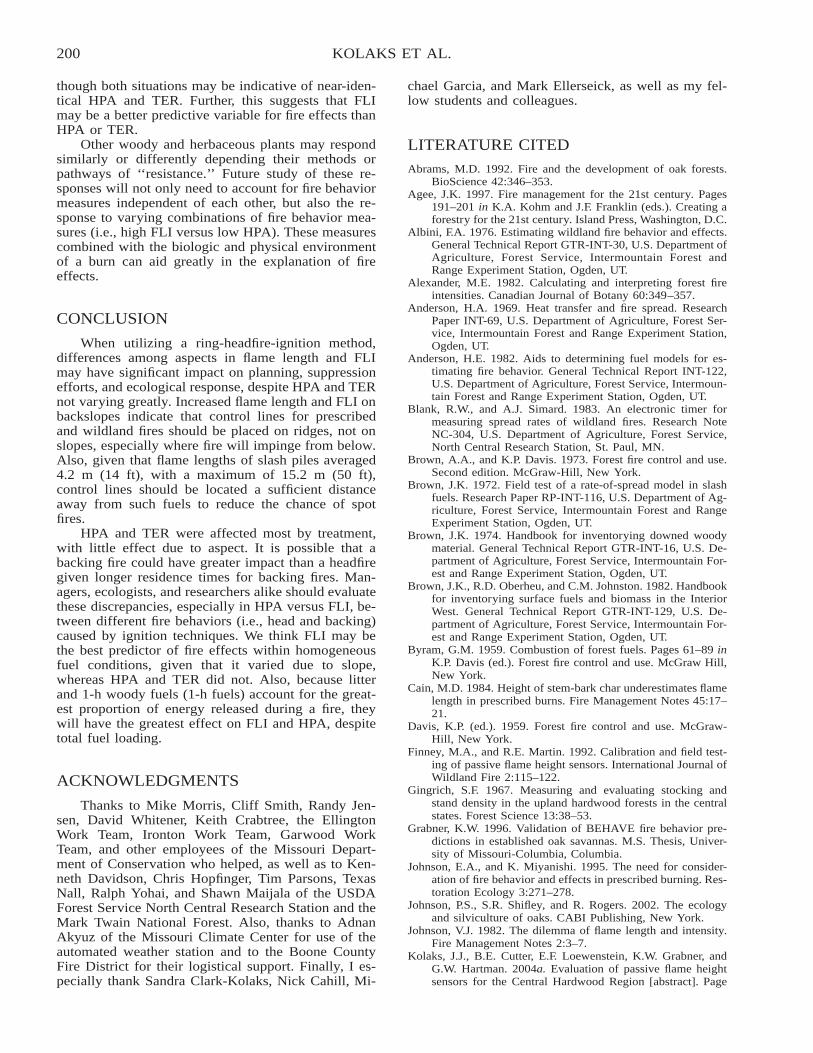
200 KOLAKS ET AL.
though both situations may be indicative of near-iden-tical HPA and TER. Further, this suggests that FLImay be a better predictive variable for fire effects thanHPA or TER.
Other woody and herbaceous plants may respondsimilarly or differently depending their methods orpathways of ‘‘resistance.’’ Future study of these re-sponses will not only need to account for fire behaviormeasures independent of each other, but also the re-sponse to varying combinations of fire behavior mea-sures (i.e., high FLI versus low HPA). These measurescombined with the biologic and physical environmentof a burn can aid greatly in the explanation of fireeffects.
CONCLUSION
When utilizing a ring-headfire-ignition method,differences among aspects in flame length and FLImay have significant impact on planning, suppressionefforts, and ecological response, despite HPA and TERnot varying greatly. Increased flame length and FLI onbackslopes indicate that control lines for prescribedand wildland fires should be placed on ridges, not onslopes, especially where fire will impinge from below.Also, given that flame lengths of slash piles averaged4.2 m (14 ft), with a maximum of 15.2 m (50 ft),control lines should be located a sufficient distanceaway from such fuels to reduce the chance of spotfires.
HPA and TER were affected most by treatment,with little effect due to aspect. It is possible that abacking fire could have greater impact than a headfiregiven longer residence times for backing fires. Man-agers, ecologists, and researchers alike should evaluatethese discrepancies, especially in HPA versus FLI, be-tween different fire behaviors (i.e., head and backing)caused by ignition techniques. We think FLI may bethe best predictor of fire effects within homogeneousfuel conditions, given that it varied due to slope,whereas HPA and TER did not. Also, because litterand 1-h woody fuels (1-h fuels) account for the great-est proportion of energy released during a fire, theywill have the greatest effect on FLI and HPA, despitetotal fuel loading.
ACKNOWLEDGMENTS
Thanks to Mike Morris, Cliff Smith, Randy Jen-sen, David Whitener, Keith Crabtree, the EllingtonWork Team, Ironton Work Team, Garwood WorkTeam, and other employees of the Missouri Depart-ment of Conservation who helped, as well as to Ken-neth Davidson, Chris Hopfinger, Tim Parsons, TexasNall, Ralph Yohai, and Shawn Maijala of the USDAForest Service North Central Research Station and theMark Twain National Forest. Also, thanks to AdnanAkyuz of the Missouri Climate Center for use of theautomated weather station and to the Boone CountyFire District for their logistical support. Finally, I es-pecially thank Sandra Clark-Kolaks, Nick Cahill, Mi-
chael Garcia, and Mark Ellerseick, as well as my fel-low students and colleagues.
LITERATURE CITED
Abrams, M.D. 1992. Fire and the development of oak forests.BioScience 42:346–353.
Agee, J.K. 1997. Fire management for the 21st century. Pages191–201 in K.A. Kohm and J.F. Franklin (eds.). Creating aforestry for the 21st century. Island Press, Washington, D.C.
Albini, F.A. 1976. Estimating wildland fire behavior and effects.General Technical Report GTR-INT-30, U.S. Department ofAgriculture, Forest Service, Intermountain Forest andRange Experiment Station, Ogden, UT.
Alexander, M.E. 1982. Calculating and interpreting forest fireintensities. Canadian Journal of Botany 60:349–357.
Anderson, H.A. 1969. Heat transfer and fire spread. ResearchPaper INT-69, U.S. Department of Agriculture, Forest Ser-vice, Intermountain Forest and Range Experiment Station,Ogden, UT.
Anderson, H.E. 1982. Aids to determining fuel models for es-timating fire behavior. General Technical Report INT-122,U.S. Department of Agriculture, Forest Service, Intermoun-tain Forest and Range Experiment Station, Ogden, UT.
Blank, R.W., and A.J. Simard. 1983. An electronic timer formeasuring spread rates of wildland fires. Research NoteNC-304, U.S. Department of Agriculture, Forest Service,North Central Research Station, St. Paul, MN.
Brown, A.A., and K.P. Davis. 1973. Forest fire control and use.Second edition. McGraw-Hill, New York.
Brown, J.K. 1972. Field test of a rate-of-spread model in slashfuels. Research Paper RP-INT-116, U.S. Department of Ag-riculture, Forest Service, Intermountain Forest and RangeExperiment Station, Ogden, UT.
Brown, J.K. 1974. Handbook for inventorying downed woodymaterial. General Technical Report GTR-INT-16, U.S. De-partment of Agriculture, Forest Service, Intermountain For-est and Range Experiment Station, Ogden, UT.
Brown, J.K., R.D. Oberheu, and C.M. Johnston. 1982. Handbookfor inventorying surface fuels and biomass in the InteriorWest. General Technical Report GTR-INT-129, U.S. De-partment of Agriculture, Forest Service, Intermountain For-est and Range Experiment Station, Ogden, UT.
Byram, G.M. 1959. Combustion of forest fuels. Pages 61–89 inK.P. Davis (ed.). Forest fire control and use. McGraw Hill,New York.
Cain, M.D. 1984. Height of stem-bark char underestimates flamelength in prescribed burns. Fire Management Notes 45:17–21.
Davis, K.P. (ed.). 1959. Forest fire control and use. McGraw-Hill, New York.
Finney, M.A., and R.E. Martin. 1992. Calibration and field test-ing of passive flame height sensors. International Journal ofWildland Fire 2:115–122.
Gingrich, S.F. 1967. Measuring and evaluating stocking andstand density in the upland hardwood forests in the centralstates. Forest Science 13:38–53.
Grabner, K.W. 1996. Validation of BEHAVE fire behavior pre-dictions in established oak savannas. M.S. Thesis, Univer-sity of Missouri-Columbia, Columbia.
Johnson, E.A., and K. Miyanishi. 1995. The need for consider-ation of fire behavior and effects in prescribed burning. Res-toration Ecology 3:271–278.
Johnson, P.S., S.R. Shifley, and R. Rogers. 2002. The ecologyand silviculture of oaks. CABI Publishing, New York.
Johnson, V.J. 1982. The dilemma of flame length and intensity.Fire Management Notes 2:3–7.
Kolaks, J.J., B.E. Cutter, E.F. Loewenstein, K.W. Grabner, andG.W. Hartman. 2004a. Evaluation of passive flame heightsensors for the Central Hardwood Region [abstract]. Page
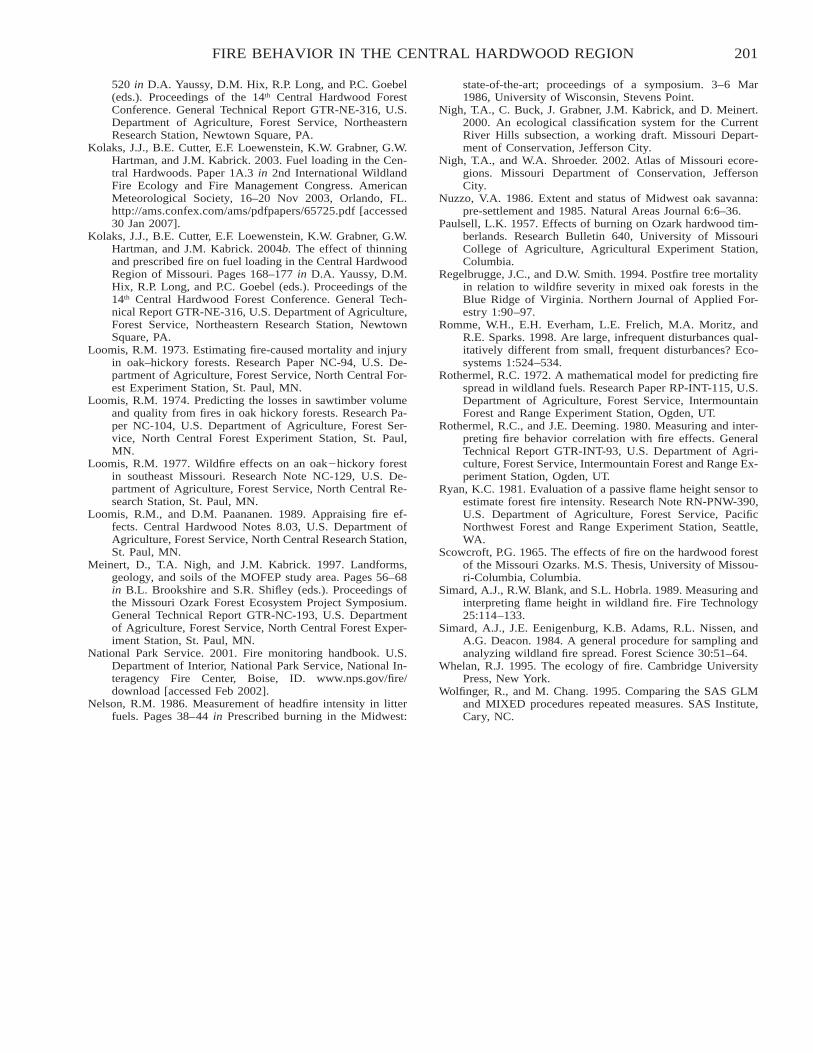
201FIRE BEHAVIOR IN THE CENTRAL HARDWOOD REGION
520 in D.A. Yaussy, D.M. Hix, R.P. Long, and P.C. Goebel(eds.). Proceedings of the 14th Central Hardwood ForestConference. General Technical Report GTR-NE-316, U.S.Department of Agriculture, Forest Service, NortheasternResearch Station, Newtown Square, PA.
Kolaks, J.J., B.E. Cutter, E.F. Loewenstein, K.W. Grabner, G.W.Hartman, and J.M. Kabrick. 2003. Fuel loading in the Cen-tral Hardwoods. Paper 1A.3 in 2nd International WildlandFire Ecology and Fire Management Congress. AmericanMeteorological Society, 16–20 Nov 2003, Orlando, FL.http://ams.confex.com/ams/pdfpapers/65725.pdf [accessed30 Jan 2007].
Kolaks, J.J., B.E. Cutter, E.F. Loewenstein, K.W. Grabner, G.W.Hartman, and J.M. Kabrick. 2004b. The effect of thinningand prescribed fire on fuel loading in the Central HardwoodRegion of Missouri. Pages 168–177 in D.A. Yaussy, D.M.Hix, R.P. Long, and P.C. Goebel (eds.). Proceedings of the14th Central Hardwood Forest Conference. General Tech-nical Report GTR-NE-316, U.S. Department of Agriculture,Forest Service, Northeastern Research Station, NewtownSquare, PA.
Loomis, R.M. 1973. Estimating fire-caused mortality and injuryin oak–hickory forests. Research Paper NC-94, U.S. De-partment of Agriculture, Forest Service, North Central For-est Experiment Station, St. Paul, MN.
Loomis, R.M. 1974. Predicting the losses in sawtimber volumeand quality from fires in oak hickory forests. Research Pa-per NC-104, U.S. Department of Agriculture, Forest Ser-vice, North Central Forest Experiment Station, St. Paul,MN.
Loomis, R.M. 1977. Wildfire effects on an oak�hickory forestin southeast Missouri. Research Note NC-129, U.S. De-partment of Agriculture, Forest Service, North Central Re-search Station, St. Paul, MN.
Loomis, R.M., and D.M. Paananen. 1989. Appraising fire ef-fects. Central Hardwood Notes 8.03, U.S. Department ofAgriculture, Forest Service, North Central Research Station,St. Paul, MN.
Meinert, D., T.A. Nigh, and J.M. Kabrick. 1997. Landforms,geology, and soils of the MOFEP study area. Pages 56–68in B.L. Brookshire and S.R. Shifley (eds.). Proceedings ofthe Missouri Ozark Forest Ecosystem Project Symposium.General Technical Report GTR-NC-193, U.S. Departmentof Agriculture, Forest Service, North Central Forest Exper-iment Station, St. Paul, MN.
National Park Service. 2001. Fire monitoring handbook. U.S.Department of Interior, National Park Service, National In-teragency Fire Center, Boise, ID. www.nps.gov/fire/download [accessed Feb 2002].
Nelson, R.M. 1986. Measurement of headfire intensity in litterfuels. Pages 38–44 in Prescribed burning in the Midwest:
state-of-the-art; proceedings of a symposium. 3–6 Mar1986, University of Wisconsin, Stevens Point.
Nigh, T.A., C. Buck, J. Grabner, J.M. Kabrick, and D. Meinert.2000. An ecological classification system for the CurrentRiver Hills subsection, a working draft. Missouri Depart-ment of Conservation, Jefferson City.
Nigh, T.A., and W.A. Shroeder. 2002. Atlas of Missouri ecore-gions. Missouri Department of Conservation, JeffersonCity.
Nuzzo, V.A. 1986. Extent and status of Midwest oak savanna:pre-settlement and 1985. Natural Areas Journal 6:6–36.
Paulsell, L.K. 1957. Effects of burning on Ozark hardwood tim-berlands. Research Bulletin 640, University of MissouriCollege of Agriculture, Agricultural Experiment Station,Columbia.
Regelbrugge, J.C., and D.W. Smith. 1994. Postfire tree mortalityin relation to wildfire severity in mixed oak forests in theBlue Ridge of Virginia. Northern Journal of Applied For-estry 1:90–97.
Romme, W.H., E.H. Everham, L.E. Frelich, M.A. Moritz, andR.E. Sparks. 1998. Are large, infrequent disturbances qual-itatively different from small, frequent disturbances? Eco-systems 1:524–534.
Rothermel, R.C. 1972. A mathematical model for predicting firespread in wildland fuels. Research Paper RP-INT-115, U.S.Department of Agriculture, Forest Service, IntermountainForest and Range Experiment Station, Ogden, UT.
Rothermel, R.C., and J.E. Deeming. 1980. Measuring and inter-preting fire behavior correlation with fire effects. GeneralTechnical Report GTR-INT-93, U.S. Department of Agri-culture, Forest Service, Intermountain Forest and Range Ex-periment Station, Ogden, UT.
Ryan, K.C. 1981. Evaluation of a passive flame height sensor toestimate forest fire intensity. Research Note RN-PNW-390,U.S. Department of Agriculture, Forest Service, PacificNorthwest Forest and Range Experiment Station, Seattle,WA.
Scowcroft, P.G. 1965. The effects of fire on the hardwood forestof the Missouri Ozarks. M.S. Thesis, University of Missou-ri-Columbia, Columbia.
Simard, A.J., R.W. Blank, and S.L. Hobrla. 1989. Measuring andinterpreting flame height in wildland fire. Fire Technology25:114–133.
Simard, A.J., J.E. Eenigenburg, K.B. Adams, R.L. Nissen, andA.G. Deacon. 1984. A general procedure for sampling andanalyzing wildland fire spread. Forest Science 30:51–64.
Whelan, R.J. 1995. The ecology of fire. Cambridge UniversityPress, New York.
Wolfinger, R., and M. Chang. 1995. Comparing the SAS GLMand MIXED procedures repeated measures. SAS Institute,Cary, NC.
202
TESTING MUTCH’S HYPOTHESIS IN SOUTHEASTQUEENSLAND: PLANT FLAMMABILITY REVISITED
Cuong Tran, Clyde Wild, and Tatia ZubrinichGriffith University, Centre for Innovative Conservation Strategies, School of Environmental and Applied Sciences, Facultyof Environmental Sciences, PMB 50 Gold Coast Mail Centre, Queensland 9726, Australia
ABSTRACT
Mutch’s Hypothesis states that some plants have evolved traits that enhance their own flammability in order to increase the probabilitiesof catastrophic wildfires, in order to eliminate competitors. In addition, these plants have also needed to evolve characteristics thatwould allow the plants to regenerate rapidly after these fires. Other studies have attempted to examine Mutch’s Hypothesis, and recentlysome models have shown that flammability traits can be genetically inherited.
This study investigated the flammability characteristics of foliage and litter collected from subtropical rainforest (considerednonflammable) and sclerophyll forests (considered highly flammable) in southeast Queensland, Australia. Flammability was calculatedusing a specialized combustion chamber that accurately simulated conditions comparable to wildfires experienced in Australia. Flam-mability was assessed using predetermined characteristics such as flame residence time, consumption rate, rate of spread, and ignitionpotential. Heat release rate (or ‘‘sustainability’’) was shown to be an accurate indicator of flammability. Litter accumulation anddecomposition rates in both vegetation communities were also assessed. Additional experiments involving the exchange of litter betweenforest types were also conducted to examine the effect of vegetation community on decomposition rates. Preliminary analysis of theresults indicates a division in the flammability characteristics between flammable and nonflammable plant communities. This is alsodemonstrated in the litter experiments, in which the results indicate similar energy contents but differing rates of decay and accumu-lation. Mutch’s Hypothesis may be able to explain the differences in flammability of vegetation communities that have the sameclimatic and meteorological conditions.
Citation: Tran, C., C. Wild, and T. Zubrinich. 2007. Testing Mutch’s Hypothesis in southeast Queensland: plant flammability revisited[abstract]. Page 202 in R.E. Masters and K.E.M. Galley (eds.). Proceedings of the 23rd Tall Timbers Fire Ecology Conference: Fire inGrassland and Shrubland Ecosystems. Tall Timbers Research Station, Tallahassee, Florida, USA.
203
FUEL BED CHARACTERISTICS AND FIRE BEHAVIOR INCATBRIER SHRUBLANDS
Michael C. Ohman, William A. Patterson III,1 and Julie A. RichburgUniversity of Massachusetts, Department of Natural Resources Conservation, 214 Holdsworth Natural Resources Center,Amherst, MA 01003, USA
ABSTRACT
Invasion of grasslands by woody shrubs can alter existing fire regimes and give rise to problem fire behavior. Invaded areas are likelyto burn less often but with more intensity. Abandoned pastures on the Elizabeth Islands, Massachusetts, that have been invaded by thewoody vine catbrier (Smilax rotundifolia) follow this pattern. We evaluated the usefulness of standard and custom fuel models (CFMs)for predicting fire behavior in a 0.2-ha (0.5-acre) experimental burn. Developing the custom fuel model required characterizing fuelload and fuel bed depth of catbrier fuels, which contain a dense mat of vines with nearly 100% cover and a height of 1 to 2 m. Thiswas done by measuring the height of litter and shrub components of the fuel bed; estimating cover by point-intercept sampling; andharvesting live vines and leaves, woody and non-woody litter, and dead vines from 1-m2 plots. From these data, we developed regressionequations to estimate fuel load using fuel bed depth.
Measured 1-h dead fuel loads (23 t/ha) were greater than that of any standard fuel model. Total (live and dead) 1-h fuel loadswere accurately predicted by shrub height (R2 � 0.82). All standard fuel models (SFMs), including SFM 4 (chaparral), underestimatedflame length observed during an experimental burn conducted in mid-June 2004 following leaf-out, while our custom fuel model moreaccurately predicted these values. Observed flame length was 5 m (17 ft) (CFM prediction 4.9 m [16 ft]) and rate of spread 11 m/min(37 ft/min) (CFM prediction 14 m/min [46 ft/min]). Results of our work will aid in developing fuel reduction programs for managersinterested in restoring early successional habitats, providing guidance for suppressing wildfires, and implementing prescribed firemanagement in catbrier-dominated habitats.
keywords: Atlantic Coastal Plain, BEHAVE, catbrier, fire intensity, fuel loads, fuel models, Massachusetts, shrublands, Smilax rotun-difolia.
Citation: Ohman, M.C., W.A. Patterson III, and J.A. Richburg. 2007. Fuel bed characteristics and fire behavior in catbrier shrublands.Pages 203–209 in R.E. Masters and K.E.M. Galley (eds.). Proceedings of the 23rd Tall Timbers Fire Ecology Conference: Fire inGrassland and Shrubland Ecosystems. Tall Timbers Research Station, Tallahassee, Florida, USA.
INTRODUCTION
Catbrier (Smilax rotundifolia) is a thorny vine thatinvades abandoned pastures, grasslands, and openwoodlands of the Atlantic Coastal Plain. On the Eliz-abeth Island chain southwest of Woods Hole, Massa-chusetts, catbrier has invaded large expanses of mari-time grasslands, forming dense thickets of near 100%cover (Richburg 2005). These thickets reduced nativeplant species diversity, degraded the recreational valueof the land, and altered fire regimes (Schroeder 2002,Richburg 2005; T. Simmons, Massachusetts Divisionof Fisheries and Wildlife, personal communication) onthe islands. Shrubs and woody vines such as catbrierhave several characteristics that can produce extremefire behavior and alter fire regimes. These include theiroften having a higher volatile chemical content thatmakes them more flammable than many other wildlandfuels, a high percentage of dead stems that require lessheat to ignite, and a ratio of fuel to air (packing ratio)that is nearly ideal for promoting fire spread (Miller1994). An example is the invasion of South Africangrasslands by woody plants, which reduced fine fuelsin the understory, resulting in a decrease in fire fre-quency. When the fuels in shrub crowns did ignite,
1 Corresponding author ([email protected]).
fire behavior was more intense than in uninvaded areas(van Wilgen and Richardson 1985).
Resource managers in the Northeast use computer-generated fire behavior models to aid in planning forprescribed fire and wildfire control, and in evaluatingthe potential effectiveness of fuel management options.The most common fire behavior software is the BE-HAVE Fire Behavior Prediction and Fuel ModelingSystem, which utilizes user-defined fuel, weather, andtopographic inputs to predict fire behavior (Andrewsand Bevins 1999). BEHAVE predictions are driven bymathematical algorithms that accurately predict firebehavior characteristics in many fuel types (Rothermel1972). BEHAVE can be used either with standard fuelmodels (Anderson 1982) or with custom fuel modelsdeveloped from parameters entered by the user.
Fuel properties that influence fire behavior includefuel loading, fuel size-class distribution, surface-area-to-volume ratio, packing ratio, fuel continuity, and fuelbed depth. These properties, along with heat contentand live fuel characteristics, are the most importantdeterminants of fire behavior (Miller 1994). Samplingof shrub fuel beds has often focused on fuel size andloading. To simplify collection of these data, basal di-ameters, crown diameters, and shrub heights have beenused as indices of the total weight of stems (or ofspecific components, e.g., leaves, stems of a given size
204 OHMAN ET AL.
class, etc.) (Telfer 1969, Brown 1976, Schlessinger andGill 1978, Gray and Schlesinger 1981, Brown et al.1982). To relate easily measured plant characteristicsto weight of common desert plants, Ludwig et al.(1975) measured canopy height, diameter, and shapeto calculate canopy volume. Plants were then harvest-ed and canopy volume was correlated with oven-driedweight (R2 � 0.90) for many plants. Rittenhouse andSneva (1977) developed predictive equations (R2 �0.90) for aboveground shrub weight by measuringcrown width, crown area, and total plant height.
Although we know, anecdotally, that fires burn in-tensely in catbrier, there has been no attempt to doc-ument how this species alters fuel beds or to quantifyfire behavior in thickets where it dominates. The goalof our research was to quantify the fuel characteristicsand fire behavior that result from catbrier invasion ina coastal grassland. We describe the fuel bed of cat-brier thickets using direct measurements and then usethat information to develop and test a custom fuelmodel to predict its fire behavior.
STUDY AREA
The study area consisted of catbrier thickets in theProtected Field area of Naushon Island, Massachusetts.The 37.5 ha of the Protected Field were historicallymaintained as grassland by sheep and, to a lesser ex-tent, cattle grazing before agricultural activities werelargely abandoned in the early 20th century (Schroeder2002). In its current condition, the Protected Field haslarge, nearly impenetrable monocultures of catbrier in-terrupted by patches of grasses and sedges (chieflyPennsylvania sedge [Carex pensylvanica]), blackhuckleberry (Gaylussacia baccata), and the exoticScotch broom (Cytisus scoparius).
Catbrier is found in 33 U.S. states and in all coun-ties in Massachusetts (Carey 1994, Sorrie and Somers1999). Also known as greenbrier and roundleaf green-brier, this native woody vine with long thorns alongthe entire length of its stem uses tendrils to climb toheights of 3–6 m in invaded woodlands and can spreadover shrubs and herbaceous plants in open areas. Itregenerates vegetatively from rhizomes (sprouting pro-lifically following fire [Richburg 2005]) and can formdense thickets with up to 20,000 stems/ha (48,000stems/acre) (Morong 1894, Niering and Goodwin1962, Carey 1994).
METHODSDescribing and Quantifying the Catbrier Fuel Bed
To determine catbrier fuel bed characteristics (fueldepth and loading, cover, vertical fuel continuity, fuelparticle surface-area-to-volume ratio, and packing ra-tio), we sampled 9 quadrats during the summer of2003. We used a stratified random sampling design oflow (�60 cm), medium (60–120 cm), and high (�120cm) canopy heights to capture the range of fuel loads(Ludwig et al. 1975). Quadrats 1 m2 in area were ran-domly located within each height class and sampled
for percent cover of catbrier and fuel depth (litter andshrub), using point-intercept sampling (10 points/quad-rat; Mueller-Dombois and Ellenburg 1974). Verticalcontinuity (3-dimensional cover) of the fuels was re-corded by noting the heights and types of fuels (aliveor dead, stem or leaf) intersecting each point through-out the fuel column (Ohman 2006). All live and deadvegetation and litter was then harvested from each1-m2 quadrat, collected, and taken to the laboratory forfurther processing. After stems were harvested, stemdensity was tallied by counting the stumps in the quad-rat.
In the laboratory, 20 sections of catbrier, randomlyselected from among the nine sample plots, were mea-sured for diameter to determine fuel class size and sur-face-area-to-volume ratio. All of the material was thensorted into live stem, live leaf, and dead stem com-ponents. Litter samples were sorted into herbaceous(leaf and grass–sedge) and downed woody fuels. Sort-ed fuels were dried at 70�C to constant weight. Pack-ing ratio was determined by entering component fuelloads and depths into the TSTMDL (Test Model) mod-ule of BEHAVEW (DOS-based version).
Predicting Catbrier Fuel Load
Models to predict the weight of catbrier were de-veloped separately using three fuel characteristics: ver-tical continuity (3-dimensional cover), stem density,and shrub height. The strength of predictors was de-termined using linear regression to calculate coeffi-cients of determination (R2).
Custom Fuel Model Development and Evaluation
We modeled fire behavior using BEHAVEW andBEHAVEPLUS3 software. Inputs to the model includ-ed fuel load and depth, surface-area-to-volume ratio,and heat content by fuel size class and category (litter,grass, slash, and shrubs). A preliminary model wasdeveloped using, for the most part, data we collectedon Naushon Island. Standard estimates were used forparameters that we were unable to measure directly.
A prescribed fire was conducted on 13 June 2004on a 0.2-ha (0.5-acre) research plot in the ProtectedField. Eight samples each of litter, live leaves, and livestems were gathered from throughout the plot and re-turned to the laboratory to determine fuel moisture(Ohman 2006). Dead stem fuel moisture was measuredin the field using a protimeter capable of recording fuelmoistures �7%. Key weather parameters were mea-sured before, during, and after the burn, including stateof the weather (an estimate of the degree of cloud cov-er and precipitation status), ambient air temperature,relative humidity, and wind speed and direction. Windspeed was measured at 1.5 and 2 m (5 and 7 ft) abovethe ground (i.e., at approximately midflame height) us-ing a digital anemometer.
The fire was ignited as a headfire with a drip torchand allowed to burn freely without the influence ofbacking or flanking fires. Flame lengths and rates ofspread were compared to 1.2-m (4-ft) iron poles withhorizontal arms at 0.3-m (1-ft) intervals placed at
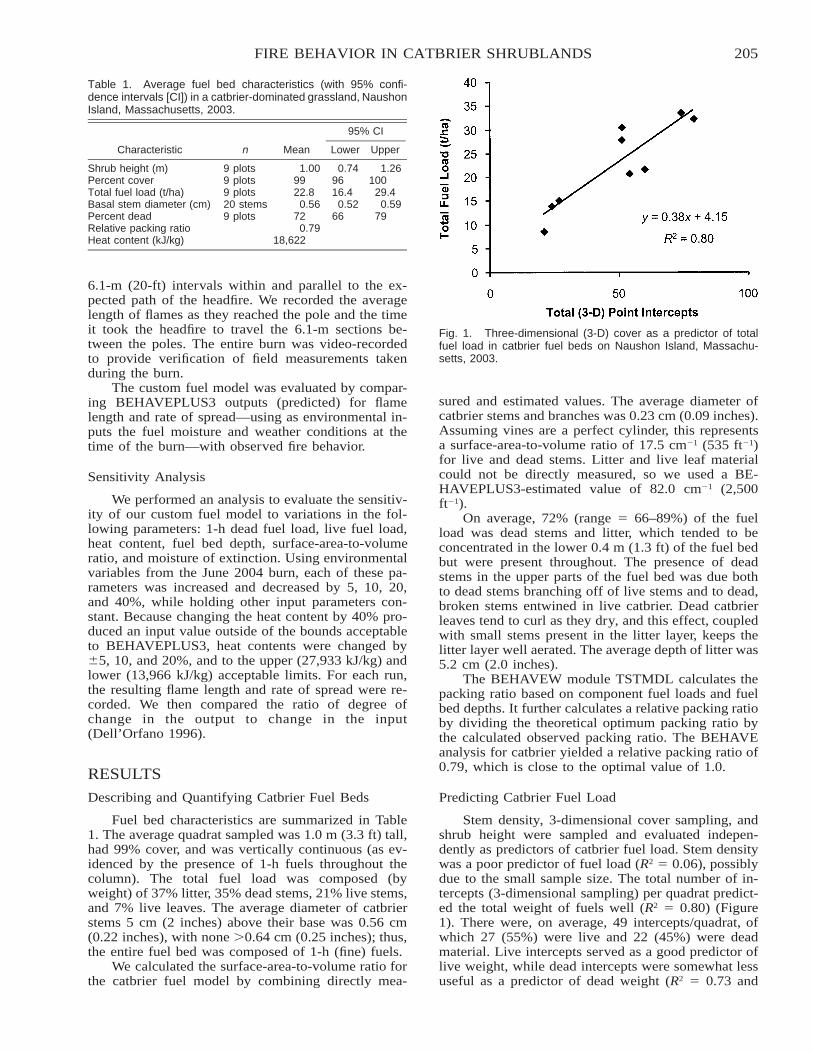
205FIRE BEHAVIOR IN CATBRIER SHRUBLANDS
Table 1. Average fuel bed characteristics (with 95% confi-dence intervals [CI]) in a catbrier-dominated grassland, NaushonIsland, Massachusetts, 2003.
Characteristic n Mean
95% CI
Lower Upper
Shrub height (m) 9 plots 1.00 0.74 1.26Percent cover 9 plots 99 96 100Total fuel load (t/ha) 9 plots 22.8 16.4 29.4Basal stem diameter (cm) 20 stems 0.56 0.52 0.59Percent dead 9 plots 72 66 79Relative packing ratio 0.79Heat content (kJ/kg) 18,622
Fig. 1. Three-dimensional (3-D) cover as a predictor of totalfuel load in catbrier fuel beds on Naushon Island, Massachu-setts, 2003.
6.1-m (20-ft) intervals within and parallel to the ex-pected path of the headfire. We recorded the averagelength of flames as they reached the pole and the timeit took the headfire to travel the 6.1-m sections be-tween the poles. The entire burn was video-recordedto provide verification of field measurements takenduring the burn.
The custom fuel model was evaluated by compar-ing BEHAVEPLUS3 outputs (predicted) for flamelength and rate of spread—using as environmental in-puts the fuel moisture and weather conditions at thetime of the burn—with observed fire behavior.
Sensitivity Analysis
We performed an analysis to evaluate the sensitiv-ity of our custom fuel model to variations in the fol-lowing parameters: 1-h dead fuel load, live fuel load,heat content, fuel bed depth, surface-area-to-volumeratio, and moisture of extinction. Using environmentalvariables from the June 2004 burn, each of these pa-rameters was increased and decreased by 5, 10, 20,and 40%, while holding other input parameters con-stant. Because changing the heat content by 40% pro-duced an input value outside of the bounds acceptableto BEHAVEPLUS3, heat contents were changed by�5, 10, and 20%, and to the upper (27,933 kJ/kg) andlower (13,966 kJ/kg) acceptable limits. For each run,the resulting flame length and rate of spread were re-corded. We then compared the ratio of degree ofchange in the output to change in the input(Dell’Orfano 1996).
RESULTS
Describing and Quantifying Catbrier Fuel Beds
Fuel bed characteristics are summarized in Table1. The average quadrat sampled was 1.0 m (3.3 ft) tall,had 99% cover, and was vertically continuous (as ev-idenced by the presence of 1-h fuels throughout thecolumn). The total fuel load was composed (byweight) of 37% litter, 35% dead stems, 21% live stems,and 7% live leaves. The average diameter of catbrierstems 5 cm (2 inches) above their base was 0.56 cm(0.22 inches), with none �0.64 cm (0.25 inches); thus,the entire fuel bed was composed of 1-h (fine) fuels.
We calculated the surface-area-to-volume ratio forthe catbrier fuel model by combining directly mea-
sured and estimated values. The average diameter ofcatbrier stems and branches was 0.23 cm (0.09 inches).Assuming vines are a perfect cylinder, this representsa surface-area-to-volume ratio of 17.5 cm�1 (535 ft�1)for live and dead stems. Litter and live leaf materialcould not be directly measured, so we used a BE-HAVEPLUS3-estimated value of 82.0 cm�1 (2,500ft�1).
On average, 72% (range � 66–89%) of the fuelload was dead stems and litter, which tended to beconcentrated in the lower 0.4 m (1.3 ft) of the fuel bedbut were present throughout. The presence of deadstems in the upper parts of the fuel bed was due bothto dead stems branching off of live stems and to dead,broken stems entwined in live catbrier. Dead catbrierleaves tend to curl as they dry, and this effect, coupledwith small stems present in the litter layer, keeps thelitter layer well aerated. The average depth of litter was5.2 cm (2.0 inches).
The BEHAVEW module TSTMDL calculates thepacking ratio based on component fuel loads and fuelbed depths. It further calculates a relative packing ratioby dividing the theoretical optimum packing ratio bythe calculated observed packing ratio. The BEHAVEanalysis for catbrier yielded a relative packing ratio of0.79, which is close to the optimal value of 1.0.
Predicting Catbrier Fuel Load
Stem density, 3-dimensional cover sampling, andshrub height were sampled and evaluated indepen-dently as predictors of catbrier fuel load. Stem densitywas a poor predictor of fuel load (R2 � 0.06), possiblydue to the small sample size. The total number of in-tercepts (3-dimensional sampling) per quadrat predict-ed the total weight of fuels well (R2 � 0.80) (Figure1). There were, on average, 49 intercepts/quadrat, ofwhich 27 (55%) were live and 22 (45%) were deadmaterial. Live intercepts served as a good predictor oflive weight, while dead intercepts were somewhat lessuseful as a predictor of dead weight (R2 � 0.73 and
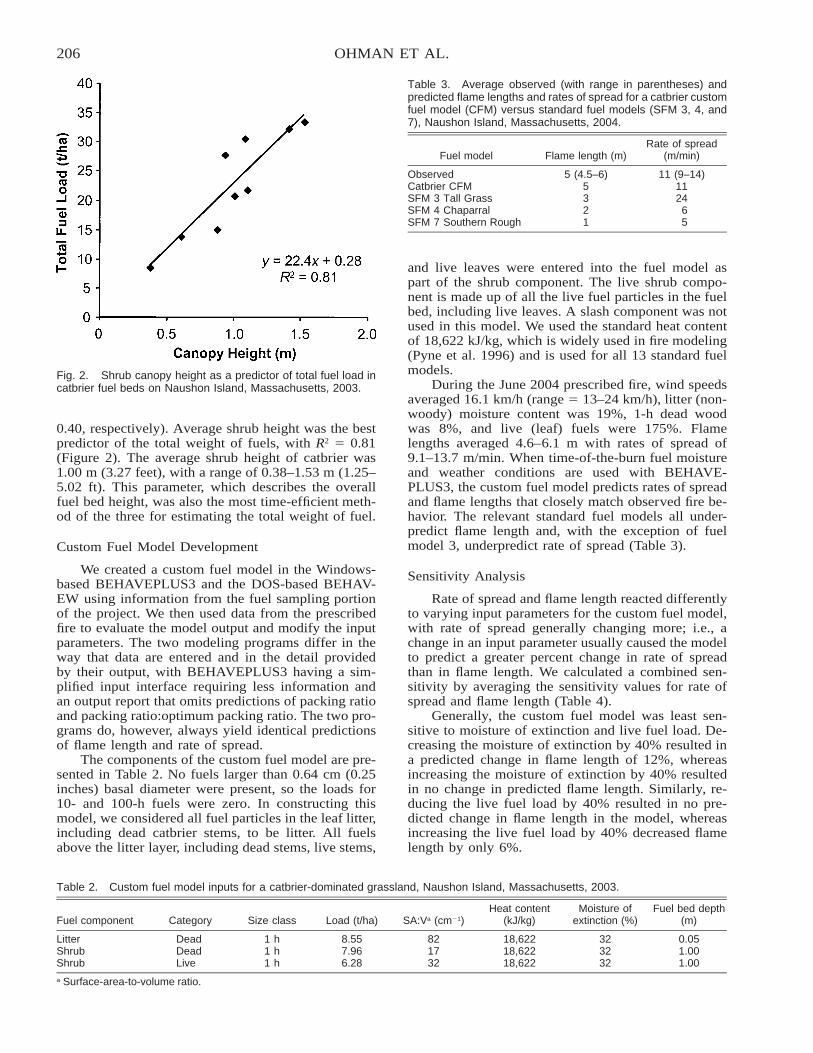
206 OHMAN ET AL.
Fig. 2. Shrub canopy height as a predictor of total fuel load incatbrier fuel beds on Naushon Island, Massachusetts, 2003.
Table 3. Average observed (with range in parentheses) andpredicted flame lengths and rates of spread for a catbrier customfuel model (CFM) versus standard fuel models (SFM 3, 4, and7), Naushon Island, Massachusetts, 2004.
Fuel model Flame length (m)Rate of spread
(m/min)
Observed 5 (4.5–6) 11 (9–14)Catbrier CFM 5 11SFM 3 Tall Grass 3 24SFM 4 Chaparral 2 6SFM 7 Southern Rough 1 5
Table 2. Custom fuel model inputs for a catbrier-dominated grassland, Naushon Island, Massachusetts, 2003.
Fuel component Category Size class Load (t/ha) SA:Va (cm�1)Heat content
(kJ/kg)Moisture of
extinction (%)Fuel bed depth
(m)
Litter Dead 1 h 8.55 82 18,622 32 0.05Shrub Dead 1 h 7.96 17 18,622 32 1.00Shrub Live 1 h 6.28 32 18,622 32 1.00
a Surface-area-to-volume ratio.
0.40, respectively). Average shrub height was the bestpredictor of the total weight of fuels, with R2 � 0.81(Figure 2). The average shrub height of catbrier was1.00 m (3.27 feet), with a range of 0.38–1.53 m (1.25–5.02 ft). This parameter, which describes the overallfuel bed height, was also the most time-efficient meth-od of the three for estimating the total weight of fuel.
Custom Fuel Model Development
We created a custom fuel model in the Windows-based BEHAVEPLUS3 and the DOS-based BEHAV-EW using information from the fuel sampling portionof the project. We then used data from the prescribedfire to evaluate the model output and modify the inputparameters. The two modeling programs differ in theway that data are entered and in the detail providedby their output, with BEHAVEPLUS3 having a sim-plified input interface requiring less information andan output report that omits predictions of packing ratioand packing ratio:optimum packing ratio. The two pro-grams do, however, always yield identical predictionsof flame length and rate of spread.
The components of the custom fuel model are pre-sented in Table 2. No fuels larger than 0.64 cm (0.25inches) basal diameter were present, so the loads for10- and 100-h fuels were zero. In constructing thismodel, we considered all fuel particles in the leaf litter,including dead catbrier stems, to be litter. All fuelsabove the litter layer, including dead stems, live stems,
and live leaves were entered into the fuel model aspart of the shrub component. The live shrub compo-nent is made up of all the live fuel particles in the fuelbed, including live leaves. A slash component was notused in this model. We used the standard heat contentof 18,622 kJ/kg, which is widely used in fire modeling(Pyne et al. 1996) and is used for all 13 standard fuelmodels.
During the June 2004 prescribed fire, wind speedsaveraged 16.1 km/h (range � 13–24 km/h), litter (non-woody) moisture content was 19%, 1-h dead woodwas 8%, and live (leaf) fuels were 175%. Flamelengths averaged 4.6–6.1 m with rates of spread of9.1–13.7 m/min. When time-of-the-burn fuel moistureand weather conditions are used with BEHAVE-PLUS3, the custom fuel model predicts rates of spreadand flame lengths that closely match observed fire be-havior. The relevant standard fuel models all under-predict flame length and, with the exception of fuelmodel 3, underpredict rate of spread (Table 3).
Sensitivity Analysis
Rate of spread and flame length reacted differentlyto varying input parameters for the custom fuel model,with rate of spread generally changing more; i.e., achange in an input parameter usually caused the modelto predict a greater percent change in rate of spreadthan in flame length. We calculated a combined sen-sitivity by averaging the sensitivity values for rate ofspread and flame length (Table 4).
Generally, the custom fuel model was least sen-sitive to moisture of extinction and live fuel load. De-creasing the moisture of extinction by 40% resulted ina predicted change in flame length of 12%, whereasincreasing the moisture of extinction by 40% resultedin no change in predicted flame length. Similarly, re-ducing the live fuel load by 40% resulted in no pre-dicted change in flame length in the model, whereasincreasing the live fuel load by 40% decreased flamelength by only 6%.
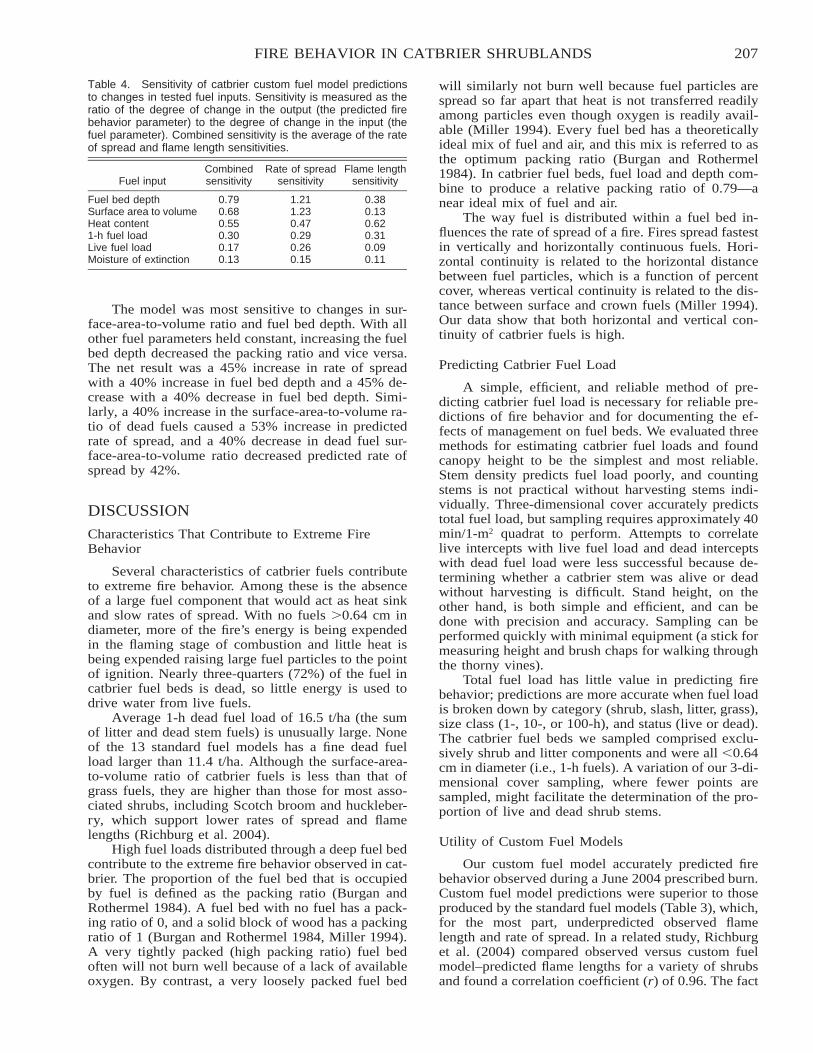
207FIRE BEHAVIOR IN CATBRIER SHRUBLANDS
Table 4. Sensitivity of catbrier custom fuel model predictionsto changes in tested fuel inputs. Sensitivity is measured as theratio of the degree of change in the output (the predicted firebehavior parameter) to the degree of change in the input (thefuel parameter). Combined sensitivity is the average of the rateof spread and flame length sensitivities.
Fuel inputCombinedsensitivity
Rate of spreadsensitivity
Flame lengthsensitivity
Fuel bed depth 0.79 1.21 0.38Surface area to volume 0.68 1.23 0.13Heat content 0.55 0.47 0.621-h fuel load 0.30 0.29 0.31Live fuel load 0.17 0.26 0.09Moisture of extinction 0.13 0.15 0.11
The model was most sensitive to changes in sur-face-area-to-volume ratio and fuel bed depth. With allother fuel parameters held constant, increasing the fuelbed depth decreased the packing ratio and vice versa.The net result was a 45% increase in rate of spreadwith a 40% increase in fuel bed depth and a 45% de-crease with a 40% decrease in fuel bed depth. Simi-larly, a 40% increase in the surface-area-to-volume ra-tio of dead fuels caused a 53% increase in predictedrate of spread, and a 40% decrease in dead fuel sur-face-area-to-volume ratio decreased predicted rate ofspread by 42%.
DISCUSSION
Characteristics That Contribute to Extreme FireBehavior
Several characteristics of catbrier fuels contributeto extreme fire behavior. Among these is the absenceof a large fuel component that would act as heat sinkand slow rates of spread. With no fuels �0.64 cm indiameter, more of the fire’s energy is being expendedin the flaming stage of combustion and little heat isbeing expended raising large fuel particles to the pointof ignition. Nearly three-quarters (72%) of the fuel incatbrier fuel beds is dead, so little energy is used todrive water from live fuels.
Average 1-h dead fuel load of 16.5 t/ha (the sumof litter and dead stem fuels) is unusually large. Noneof the 13 standard fuel models has a fine dead fuelload larger than 11.4 t/ha. Although the surface-area-to-volume ratio of catbrier fuels is less than that ofgrass fuels, they are higher than those for most asso-ciated shrubs, including Scotch broom and huckleber-ry, which support lower rates of spread and flamelengths (Richburg et al. 2004).
High fuel loads distributed through a deep fuel bedcontribute to the extreme fire behavior observed in cat-brier. The proportion of the fuel bed that is occupiedby fuel is defined as the packing ratio (Burgan andRothermel 1984). A fuel bed with no fuel has a pack-ing ratio of 0, and a solid block of wood has a packingratio of 1 (Burgan and Rothermel 1984, Miller 1994).A very tightly packed (high packing ratio) fuel bedoften will not burn well because of a lack of availableoxygen. By contrast, a very loosely packed fuel bed
will similarly not burn well because fuel particles arespread so far apart that heat is not transferred readilyamong particles even though oxygen is readily avail-able (Miller 1994). Every fuel bed has a theoreticallyideal mix of fuel and air, and this mix is referred to asthe optimum packing ratio (Burgan and Rothermel1984). In catbrier fuel beds, fuel load and depth com-bine to produce a relative packing ratio of 0.79—anear ideal mix of fuel and air.
The way fuel is distributed within a fuel bed in-fluences the rate of spread of a fire. Fires spread fastestin vertically and horizontally continuous fuels. Hori-zontal continuity is related to the horizontal distancebetween fuel particles, which is a function of percentcover, whereas vertical continuity is related to the dis-tance between surface and crown fuels (Miller 1994).Our data show that both horizontal and vertical con-tinuity of catbrier fuels is high.
Predicting Catbrier Fuel Load
A simple, efficient, and reliable method of pre-dicting catbrier fuel load is necessary for reliable pre-dictions of fire behavior and for documenting the ef-fects of management on fuel beds. We evaluated threemethods for estimating catbrier fuel loads and foundcanopy height to be the simplest and most reliable.Stem density predicts fuel load poorly, and countingstems is not practical without harvesting stems indi-vidually. Three-dimensional cover accurately predictstotal fuel load, but sampling requires approximately 40min/1-m2 quadrat to perform. Attempts to correlatelive intercepts with live fuel load and dead interceptswith dead fuel load were less successful because de-termining whether a catbrier stem was alive or deadwithout harvesting is difficult. Stand height, on theother hand, is both simple and efficient, and can bedone with precision and accuracy. Sampling can beperformed quickly with minimal equipment (a stick formeasuring height and brush chaps for walking throughthe thorny vines).
Total fuel load has little value in predicting firebehavior; predictions are more accurate when fuel loadis broken down by category (shrub, slash, litter, grass),size class (1-, 10-, or 100-h), and status (live or dead).The catbrier fuel beds we sampled comprised exclu-sively shrub and litter components and were all �0.64cm in diameter (i.e., 1-h fuels). A variation of our 3-di-mensional cover sampling, where fewer points aresampled, might facilitate the determination of the pro-portion of live and dead shrub stems.
Utility of Custom Fuel Models
Our custom fuel model accurately predicted firebehavior observed during a June 2004 prescribed burn.Custom fuel model predictions were superior to thoseproduced by the standard fuel models (Table 3), which,for the most part, underpredicted observed flamelength and rate of spread. In a related study, Richburget al. (2004) compared observed versus custom fuelmodel–predicted flame lengths for a variety of shrubsand found a correlation coefficient (r) of 0.96. The fact
208 OHMAN ET AL.
that these custom fuel models predict fire behaviorwell, coupled with the fact that standard fuel modelpredictions were generally much poorer, supports theuse of custom fuel models for catbrier. The June 2004prescribed fire was useful in confirming the accuracyof the catbrier custom fuel model, and the extreme firebehavior was effective in showing the potential dangerof this fuel condition.
Identifying Important Fuel Bed Characteristics
By evaluating how variations in input values af-fected the flame length and rate of spread predicted byour custom fuel model, we were able to determinewhich fuel bed characteristics were most important inaffecting fire behavior. This knowledge is useful tomanagers wishing to modify fuel beds to reduce firehazard. Both parameters were most sensitive to chang-es in fuel bed depth and least sensitive to moisture ofextinction. The former is easily manipulated in thefield (as by chopping or flail-mowing—see Richburget al. [2004]), whereas moisture of extinction dependsnot only on fuel arrangement but on the thermodynam-ic properties of individual fuel components.
Surface-area-to-volume ratio and heat content bothstrongly influence rate of spread and flame length, butboth are difficult to measure. Although we directlymeasured catbrier stem surface-area-to-volume ratio,we had to approximate the ratio for the litter compo-nent. Additional measurements of catbrier heat contentare needed. The live leaves of catbrier appear waxy,suggesting the presence of volatile compounds thatshould yield a higher heat content than those withoutwaxy leaves (Burgan and Rothermel 1984). Neithersurface-area-to-volume nor heat content are easily ma-nipulated, however, and therefore should not be a fo-cus of management efforts.
Although 1-h size-class fuel load has less effecton rate of spread than most fuel characteristics, it isnext in importance (after heat content and fuel beddepth) in its effect on flame length. Coefficients ofdetermination suggest that we can accurately predict1-h fuel load with both 3-dimensional cover samplingand by measuring shrub heights. High live fuel loads,because of their high moisture content, tend to sup-press fire behavior. This effect is demonstrated by thesensitivity analysis. Increasing the live fuel load in BE-HAVE has the effect of reducing both rate of spreadand flame length, and decreasing live fuel load increas-es fire behavior. But catbrier fuels are unique amongnortheastern U.S. fuel complexes in their ability tosupport extreme fire behavior with live fuel moisturesin excess of 150%, as our June 2004 prescribed burnillustrated.
MANAGEMENT IMPLICATIONS/AREASFOR FURTHER STUDY
Fire managers working in the Atlantic CoastalPlain have long recognized the extreme fire hazard as-sociated with catbrier-dominated landscapes. We have,for the first time, quantitatively described the fuel bed
characteristics associated with this hazard and identi-fied components that might be most effectively manip-ulated to reduce problem fire behavior. Our fuel sam-pling protocol and the custom fuel model we devel-oped will allow managers to more effectively managecatbrier fuels and evaluate outcomes in the context ofaltered fire behavior. Additional sampling in other ar-eas dominated by catbrier is necessary to determine ifthe catbrier fuel bed is similar among sites. Althoughdifficult to implement, additional research prescribedburns in catbrier monocultures will increase ourknowledge of how fire behavior is affected by varia-tions in environmental conditions. Our one researchburn was conducted under moderate fire weather con-ditions during the growing season and resulted in im-pressive fire behavior. To more fully test our customfuel model, we need additional documentation of burnsunder other conditions, especially those in the dormantseason. Only with additional research will we be ableto provide fire managers with the tools that they needto effectively manage this hazardous fuel type.
ACKNOWLEDGMENTS
Our work was supported by a grant from the JointFire Science Program (Project no. 00-1-2-06). Assis-tance in conducting the prescribed burn was providedby the Massachusetts Chapter of The Nature Conser-vancy and fire management personnel of Cape CodNational Seashore. We thank the Naushon Trust forallowing us to conduct research on Naushon Island.
LITERATURE CITED
Anderson, H.E. 1982. Aids to determining fuel models for es-timating fire behavior. General Technical Report INT-122,U.S. Department of Agriculture, Forest Service, Intermoun-tain Rangeland Experiment Station, Ogden, UT.
Andrews, P.L., and C.D. Bevins. 1999. Update and expansion ofthe BEHAVE fire behavior prediction system. Pages 733–740 in Proceedings of the 3rd International Conference onForest Fire Research and the 14th Conference on Fire andForest Meteorology, 16–20 Nov 1998, Luso, Portugal.
Brown, J., R. Oberheu, and C.D. Johnston. 1982. Handbook forinventorying surface fuels and biomass in the Interior West.General Technical Report INT-129, U.S. Department of Ag-riculture, Forest Service, Intermountain Rangeland Experi-ment Station, Ogden, UT.
Brown, J.K. 1976. Estimating shrub biomass from basal stemdiameters. Canadian Journal of Forest Research 6:153–158.
Burgan, R.E., and R.C. Rothermel. 1984. BEHAVE: fire behav-ior prediction and fuel modeling system—FUEL subsystem.General Technical Report INT-167, U.S. Department of Ag-riculture, Forest Service, Intermountain Rangeland Experi-ment Station, Ogden, UT.
Carey, J.H. 1994. Smilax rotundifolia. In Fire Effects Informa-tion System [online]. U.S. Department of Agriculture, For-est Service, Rocky Mountain Research Station. http://www.fs.fed.us/database/feis [accessed 30 Nov 2006].
Dell’Orfano, M.E. 1996. Fire behavior prediction and fuel mod-eling of flammable shrub understories in northeastern pine–oak forests. Technical Report NPS/NESO-RNR/NRTR/96-14, U.S. Department of Interior, National Park Service, NewEngland System Support Office, Boston, MA.
Gray, J.T., and W.H. Schlesinger. 1981. Biomass, production and
209FIRE BEHAVIOR IN CATBRIER SHRUBLANDS
litterfall in the coastal sage scrub of southern California.American Journal of Botany 68:24–33.
Ludwig, J.A., J.F. Reynolds, and P.D. Whitson. 1975. Size–bio-mass relationships of several Chihuahuan desert shrubs.American Midland Naturalist 94:451–455.
Miller, M. 1994. Fuels. Pages III-1–III-28 in M. Miller (ed.).Fire effects guide. NFES 2394, National Wildfire Coordi-nating Group, Boise, ID.
Morong, T. 1894. The Smilacaceae of North and Central Amer-ica. Bulletin of the Torrey Botanical Club 21:419–443.
Mueller-Dombois, D., and H. Ellenburg. 1974. Aims and meth-ods of vegetation ecology. John Wiley and Sons, New York.
Niering, W.A., and R.H. Goodwin. 1962. Ecological studies inthe Connecticut Arboretum Natural Area I. Introduction anda survey of vegetation types. Ecology 43:41–54.
Ohman, M.C. 2006. Characteristics of fuel beds invaded by Smi-lax rotundifolia. M.S. Thesis, University of Massachusetts,Amherst.
Pyne, S.J., P.L. Andrews, and R.D. Laven. 1996. Introduction towildland fire. Second edition. John Wiley and Sons, NewYork.
Richburg, J.A. 2005. Timing treatments to the phenology of rootcarbohydrate reserves to control woody invasive plants.Ph.D. Dissertation, University of Massachusetts, Amherst.
Richburg, J.A., W.A. Patterson III, and M. Ohman. 2004. Firemanagement options for controlling woody invasive plantsin the northeastern and mid-Atlantic U.S. Unpublished final
report submitted to the Joint Fire Science Program. http://www.umass.edu/nrc/nebarrensfuels/publications/pdfs/Richburg�Ohman-Invasives�Fire�final�report.pdf [accessed30 Nov 2006].
Rittenhouse, L.R., and F.A. Sneva. 1977. A technique for esti-mating big sagebrush production. Journal of Range Man-agement 30:4.
Rothermel, R.C. 1972. A mathematical model for predicting firespread in wildland fuels. Research Paper INT-115, U.S. De-partment of Agriculture, Forest Service, IntermountainRangeland Experiment Station, Ogden, UT.
Schlessinger, W.H., and D.S. Gill. 1978. Demographic studies ofthe chaparral shrub, Ceanothus megacarpus, in the SantaYnez Mountains, California. Ecology 59:1256–1263.
Schroeder, N. 2002. A comparison of management strategies andshrub encroachment at two pastures on Naushon Island.M.S. Thesis, Antioch New England Graduate School,Keene, NH.
Sorrie, B.A., and P. Somers. 1999. The vascular plants of Mas-sachusetts: a county checklist. Massachusetts Division ofFisheries and Wildlife, Natural Heritage and EndangeredSpecies Program, Westborough.
Telfer, E.S. 1969. Weight–diameter relationships for 22 woodyplant species. Canadian Journal of Botany 47:1851–1855.
van Wilgen, B.W., and D.M. Richardson. 1985. The effects ofalien shrub invasion on vegetation structure and fire behav-iour in South African fynbos shrublands: a simulation study.Journal of Applied Ecology 22:955–966.
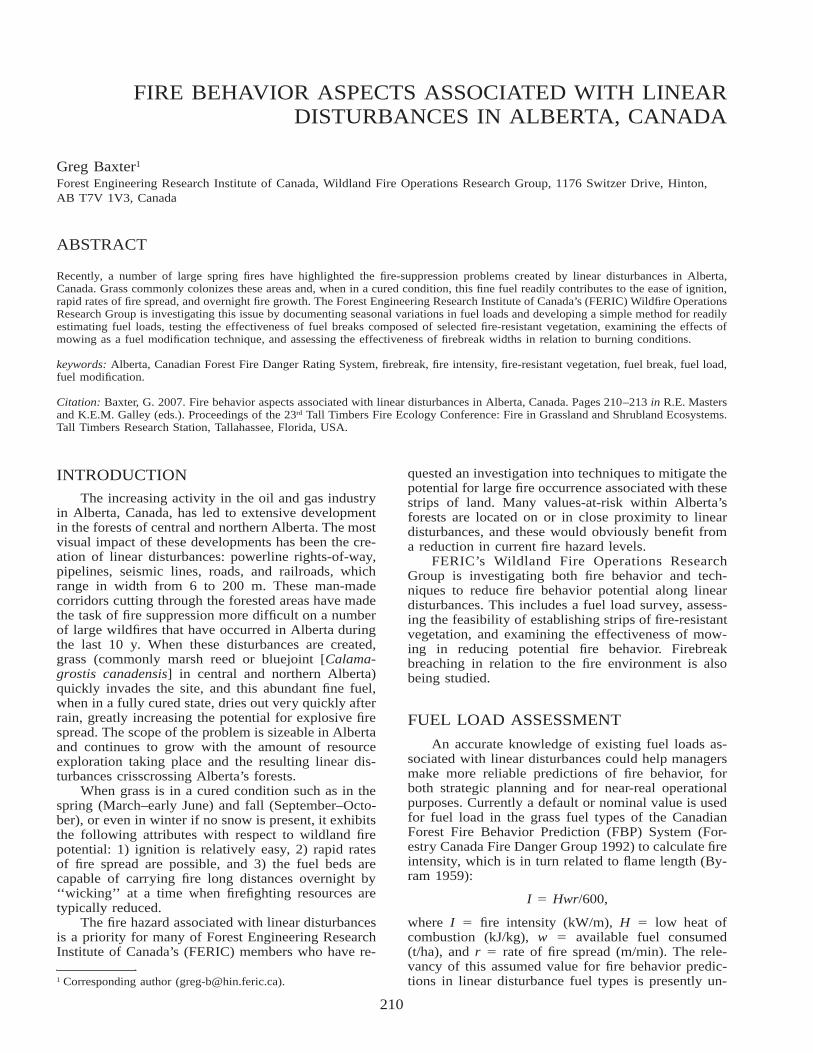
210
FIRE BEHAVIOR ASPECTS ASSOCIATED WITH LINEARDISTURBANCES IN ALBERTA, CANADA
Greg Baxter1
Forest Engineering Research Institute of Canada, Wildland Fire Operations Research Group, 1176 Switzer Drive, Hinton,AB T7V 1V3, Canada
ABSTRACT
Recently, a number of large spring fires have highlighted the fire-suppression problems created by linear disturbances in Alberta,Canada. Grass commonly colonizes these areas and, when in a cured condition, this fine fuel readily contributes to the ease of ignition,rapid rates of fire spread, and overnight fire growth. The Forest Engineering Research Institute of Canada’s (FERIC) Wildfire OperationsResearch Group is investigating this issue by documenting seasonal variations in fuel loads and developing a simple method for readilyestimating fuel loads, testing the effectiveness of fuel breaks composed of selected fire-resistant vegetation, examining the effects ofmowing as a fuel modification technique, and assessing the effectiveness of firebreak widths in relation to burning conditions.
keywords: Alberta, Canadian Forest Fire Danger Rating System, firebreak, fire intensity, fire-resistant vegetation, fuel break, fuel load,fuel modification.
Citation: Baxter, G. 2007. Fire behavior aspects associated with linear disturbances in Alberta, Canada. Pages 210–213 in R.E. Mastersand K.E.M. Galley (eds.). Proceedings of the 23rd Tall Timbers Fire Ecology Conference: Fire in Grassland and Shrubland Ecosystems.Tall Timbers Research Station, Tallahassee, Florida, USA.
INTRODUCTIONThe increasing activity in the oil and gas industry
in Alberta, Canada, has led to extensive developmentin the forests of central and northern Alberta. The mostvisual impact of these developments has been the cre-ation of linear disturbances: powerline rights-of-way,pipelines, seismic lines, roads, and railroads, whichrange in width from 6 to 200 m. These man-madecorridors cutting through the forested areas have madethe task of fire suppression more difficult on a numberof large wildfires that have occurred in Alberta duringthe last 10 y. When these disturbances are created,grass (commonly marsh reed or bluejoint [Calama-grostis canadensis] in central and northern Alberta)quickly invades the site, and this abundant fine fuel,when in a fully cured state, dries out very quickly afterrain, greatly increasing the potential for explosive firespread. The scope of the problem is sizeable in Albertaand continues to grow with the amount of resourceexploration taking place and the resulting linear dis-turbances crisscrossing Alberta’s forests.
When grass is in a cured condition such as in thespring (March–early June) and fall (September–Octo-ber), or even in winter if no snow is present, it exhibitsthe following attributes with respect to wildland firepotential: 1) ignition is relatively easy, 2) rapid ratesof fire spread are possible, and 3) the fuel beds arecapable of carrying fire long distances overnight by‘‘wicking’’ at a time when firefighting resources aretypically reduced.
The fire hazard associated with linear disturbancesis a priority for many of Forest Engineering ResearchInstitute of Canada’s (FERIC) members who have re-
1 Corresponding author ([email protected]).
quested an investigation into techniques to mitigate thepotential for large fire occurrence associated with thesestrips of land. Many values-at-risk within Alberta’sforests are located on or in close proximity to lineardisturbances, and these would obviously benefit froma reduction in current fire hazard levels.
FERIC’s Wildland Fire Operations ResearchGroup is investigating both fire behavior and tech-niques to reduce fire behavior potential along lineardisturbances. This includes a fuel load survey, assess-ing the feasibility of establishing strips of fire-resistantvegetation, and examining the effectiveness of mow-ing in reducing potential fire behavior. Firebreakbreaching in relation to the fire environment is alsobeing studied.
FUEL LOAD ASSESSMENT
An accurate knowledge of existing fuel loads as-sociated with linear disturbances could help managersmake more reliable predictions of fire behavior, forboth strategic planning and for near-real operationalpurposes. Currently a default or nominal value is usedfor fuel load in the grass fuel types of the CanadianForest Fire Behavior Prediction (FBP) System (For-estry Canada Fire Danger Group 1992) to calculate fireintensity, which is in turn related to flame length (By-ram 1959):
I � Hwr/600,
where I � fire intensity (kW/m), H � low heat ofcombustion (kJ/kg), w � available fuel consumed(t/ha), and r � rate of fire spread (m/min). The rele-vancy of this assumed value for fire behavior predic-tions in linear disturbance fuel types is presently un-

211FIRE BEHAVIOR ASPECTS OF LINEAR DISTURBANCES
Fig. 1. Using the grass disk meter to estimate grass fuel loadnear Whitecourt, Alberta, May 2005.
Fig. 2. Relationship between disk height and fuel load for bothspring (March–early June) and fall (September–October) fuelload samples collected in Alberta in 2005.
known. Therefore, FERIC is quantifying the fuel loadsin a study with three primary objectives: 1) create adatabase of fuel loads sampled along various lineardisturbances in central and northern Alberta, 2) deter-mine a mean fuel load for use in predicting fire be-havior in grass fuel beds on linear disturbances in boththe spring and the fall fire seasons, and 3) develop asimple field technique for readily estimating grass fuelloads.
During the summer of 2005, FERIC collected fuelload samples along linear disturbances in central andnorthern Alberta in conjunction with a ‘‘grass disk me-ter’’ sampling technique originally developed and cal-ibrated in South Africa (Trollope and Potgieter 1986).This technique involves correlating the settling heightof the round disk on the grass fuel bed (Figure 1), withthe sampled fuel load compressed by the disk’s weight(Figure 2). The samples were separated into 5-cmheight classes, and mean weights were determined foreach class per Trollope and Potgieter (1986).
A total of 64 grass fuel load samples were col-lected from pipelines, powerline rights-of-way, andseismic lines in May 2005. The locations were record-ed and photographed, and resampled in September2005. The separate fuel load values determined forspring and fall conditions will, in turn, be used to cal-culate fire intensities for use during going wildfireevents or in simulations.
The mean fuel loads during the spring and fallcollections were 3.5 t/ha (SD � 1.7) and 5.4 t/ha (SD� 3.5), respectively. In comparison, the Canadian FBPSystem grass fuel type models use a default value of3.0 t/ha. This 0.5-t/ha fuel load difference in the springcorresponds to a slight increase (12%) in fire intensitybut quite a significant increase (80%) in the fall be-cause the fuel load was nearly double.
FUEL/VEGETATION TYPECONVERSION
One fuel management technique practiced alonglinear disturbances involves the planting of less flam-mable vegetative cover to reduce potential fire ignitionand spread. The use of such fire-resistant plants hasbeen studied in Australia, New Zealand, the UnitedStates, and in Ontario, Canada, for Bell Canada andCP Rail (Hogenbirk 1996). Several large fires in Al-berta in recent years have sparked interest in plantingor seeding less flammable vegetation in strategic lo-cations along linear disturbances to minimize the po-tential for fire spread and, in turn, large fire growth.The goal of this particular FERIC study is to determineif strips of selected vegetative species establishedalong linear disturbances can significantly reduce fireignition and spread potential.
Less flammable vegetation may have certain de-sirable characteristics, but the introduction of nonna-tive species to different locations of the province is aregulated process. The Alberta Department of Sustain-able Resource Development has enforceable guidelineson the use of ‘‘introduced’’ species. Thus, any specieschosen for testing must be native to the province.
Many fire-resistant plant species tend to have sim-ilar physical fuel characteristics. Hogenbirk (1996)found the following traits related to fire resistance, inorder of importance: 1) stem density, 2) radius ofstems, 3) surface-area-to-volume ratio, and 4) moisturecontent. These traits have been measured and their re-lationships to plant ignitability have been determined(Hogenbirk 1996). Surprisingly, moisture content wasrated the fourth most important variable. Hogenbirk(1996) also compiled a list of characteristics of theideal species for ‘‘greenstripping,’’ which is the use ofless flammable plants to reduce fire hazard. Theseplants should 1) reduce the probability of ignitionthroughout the year, 2) reduce fire spread rates, 3) re-main dominant on a site for at least 10 y, and 4) createno additional environmental or safety hazards.
The plants should also 1) grow quickly in thespring, 2) maintain a high moisture content, 3) be lowgrowing, 4) produce small quantities of dead standingcrop, 5) produce small amounts of litter, 6) decomposequickly as litter, 7) out-compete other plants, 8) rees-
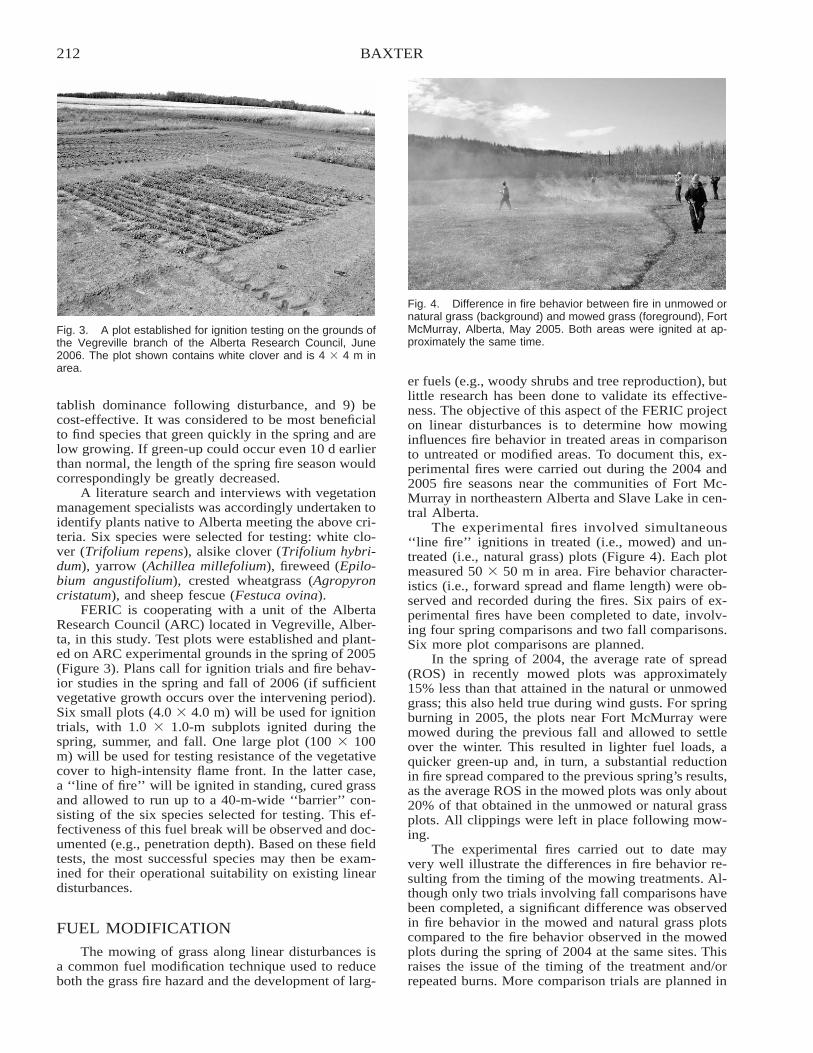
212 BAXTER
Fig. 3. A plot established for ignition testing on the grounds ofthe Vegreville branch of the Alberta Research Council, June2006. The plot shown contains white clover and is 4 � 4 m inarea.
Fig. 4. Difference in fire behavior between fire in unmowed ornatural grass (background) and mowed grass (foreground), FortMcMurray, Alberta, May 2005. Both areas were ignited at ap-proximately the same time.
tablish dominance following disturbance, and 9) becost-effective. It was considered to be most beneficialto find species that green quickly in the spring and arelow growing. If green-up could occur even 10 d earlierthan normal, the length of the spring fire season wouldcorrespondingly be greatly decreased.
A literature search and interviews with vegetationmanagement specialists was accordingly undertaken toidentify plants native to Alberta meeting the above cri-teria. Six species were selected for testing: white clo-ver (Trifolium repens), alsike clover (Trifolium hybri-dum), yarrow (Achillea millefolium), fireweed (Epilo-bium angustifolium), crested wheatgrass (Agropyroncristatum), and sheep fescue (Festuca ovina).
FERIC is cooperating with a unit of the AlbertaResearch Council (ARC) located in Vegreville, Alber-ta, in this study. Test plots were established and plant-ed on ARC experimental grounds in the spring of 2005(Figure 3). Plans call for ignition trials and fire behav-ior studies in the spring and fall of 2006 (if sufficientvegetative growth occurs over the intervening period).Six small plots (4.0 � 4.0 m) will be used for ignitiontrials, with 1.0 � 1.0-m subplots ignited during thespring, summer, and fall. One large plot (100 � 100m) will be used for testing resistance of the vegetativecover to high-intensity flame front. In the latter case,a ‘‘line of fire’’ will be ignited in standing, cured grassand allowed to run up to a 40-m-wide ‘‘barrier’’ con-sisting of the six species selected for testing. This ef-fectiveness of this fuel break will be observed and doc-umented (e.g., penetration depth). Based on these fieldtests, the most successful species may then be exam-ined for their operational suitability on existing lineardisturbances.
FUEL MODIFICATION
The mowing of grass along linear disturbances isa common fuel modification technique used to reduceboth the grass fire hazard and the development of larg-
er fuels (e.g., woody shrubs and tree reproduction), butlittle research has been done to validate its effective-ness. The objective of this aspect of the FERIC projecton linear disturbances is to determine how mowinginfluences fire behavior in treated areas in comparisonto untreated or modified areas. To document this, ex-perimental fires were carried out during the 2004 and2005 fire seasons near the communities of Fort Mc-Murray in northeastern Alberta and Slave Lake in cen-tral Alberta.
The experimental fires involved simultaneous‘‘line fire’’ ignitions in treated (i.e., mowed) and un-treated (i.e., natural grass) plots (Figure 4). Each plotmeasured 50 � 50 m in area. Fire behavior character-istics (i.e., forward spread and flame length) were ob-served and recorded during the fires. Six pairs of ex-perimental fires have been completed to date, involv-ing four spring comparisons and two fall comparisons.Six more plot comparisons are planned.
In the spring of 2004, the average rate of spread(ROS) in recently mowed plots was approximately15% less than that attained in the natural or unmowedgrass; this also held true during wind gusts. For springburning in 2005, the plots near Fort McMurray weremowed during the previous fall and allowed to settleover the winter. This resulted in lighter fuel loads, aquicker green-up and, in turn, a substantial reductionin fire spread compared to the previous spring’s results,as the average ROS in the mowed plots was only about20% of that obtained in the unmowed or natural grassplots. All clippings were left in place following mow-ing.
The experimental fires carried out to date mayvery well illustrate the differences in fire behavior re-sulting from the timing of the mowing treatments. Al-though only two trials involving fall comparisons havebeen completed, a significant difference was observedin fire behavior in the mowed and natural grass plotscompared to the fire behavior observed in the mowedplots during the spring of 2004 at the same sites. Thisraises the issue of the timing of the treatment and/orrepeated burns. More comparison trials are planned in
213FIRE BEHAVIOR ASPECTS OF LINEAR DISTURBANCES
2006 involving both fall and spring mowing in orderto better understand the implications of treatment tim-ing on fire behavior. It is thought that fall precipitationacts to speed the decomposition process, and thus ligh-ter fuel load, and that the winter snowpack compressesthe remaining fuel, thereby reducing the fire spreadand intensity potential. Fuel loads in the plots that hadbeen mowed in the fall were half those of spring mow-ing, which would result in a 50% reduction in fireintensity.
Observed flame lengths on the natural grass plotswere almost 3 times greater than in the mowed plots(Figure 4). This is a critical bit of knowledge, as flamelength is one of the major determinants of the likeli-hood of successful containment by suppression forces(Byram 1959).
FIREBREAK BREACHING
Because spotting in grass fires in Alberta is notcommon, firebreaks are typically able to reduce or haltfire spread. In addition to investigating the use of lessflammable plant species as fuel breaks, FERIC is alsoexamining the optimum width for firebreaks in Alber-ta’s fire environments.
As part of this study, FERIC is attempting to de-termine the minimum firebreak width required to con-trol the development of grass fires in Alberta duringits spring and fall fire seasons. Toward this end, FERICis analyzing historic fire weather databases and hasdeveloped a software package for gauging the effec-tiveness of firebreaks in stopping grassland fires basedon coupling existing models for firebreak breachingdeveloped by Wilson (1988) with the two major mod-ules or subsystems of the Canadian Forest Fire DangerRating System (CFFDRS)—i.e., the Fire Weather In-dex System (Van Wagner 1987) and the FBP System.The rate of fire spread output from the FBP System isbeing combined with the results from the grass fuelload survey carried in central and northern Alberta inorder to estimate fire intensities. Wilson’s (1988) mod-els output the probability of firebreak breaching basedon fire intensity and firebreak width.
Once the optimum width of an effective firebreakor fuel break has been approximated, the next step willbe to apply this knowledge at the landscape level. Asit would be impossible both physically and economi-cally to treat all linear disturbances in the province,
any treatments applied must be strategically placed inorder to be both cost-effective and efficient.
PROMETHEUS, an existing landscape-level firebehavior and growth model based on the CFFDRS(Tymstra 2002), permits the user to alter fuel types andinsert firebreaks or barriers to fire spread of varyingwidths, and then to undertake simulated fire runs overthe landscape. This will allow determination of thebest alignment of firebreaks and fuel breaks in orderto minimize problematic fire behavior associated withlinear disturbances.
CONCLUSIONA wide variety of industrial and other forest users
in northern and central Alberta stand to benefit fromstrategies that reduce problematic fire behavior asso-ciated with linear disturbances and, in turn, contributeto containing wildfires to the smallest size possible.FERIC is currently undertaking research into four fac-ets of fire behavior associated with linear disturbances,with a view to reducing the potential for adverselyimpacting the task of controlling wildfires. As moredefinitive results become available, the findings willbe published in FERIC Advantage Reports and madeavailable for downloading on the Internet (http://fire.feric.ca/36202003/36202003.asp).
LITERATURE CITEDByram, G.M. 1959. Combustion of forest fuels. Pages 61–89 in
K.P. Davis (ed.). Forest fire: control and use. McGraw-Hill,New York.
Forestry Canada Fire Danger Group. 1992. Development andstructure of the Canadian Forest Fire Behavior PredictionSystem. Information Report ST-X-3, Forestry Canada, Ot-tawa, Ontario, Canada.
Hogenbirk, J.C. 1996. The potential role of greenstripping inright-of-way vegetation management. Bell Canada, CP RailSystem, and Laurentian University, Sudbury, Ontario, Can-ada.
Trollope, W.S.W., and A.L.F. Potgieter. 1986. Estimating grassfuel loads with a disc pasture meter in the Kruger NationalPark. Journal of the Grassland Society of Southern Africa3:148–152.
Tymstra, C. 2002. PROMETHEUS—the Canadian wildland firegrowth model. Initial Attack 2002(Spring):8–9.
Van Wagner, C.E. 1987. Development and structure of the Ca-nadian Forest Fire Weather Index System. Forestry Tech-nical Report 35, Canadian Forestry Service, Ottawa, Ontar-io, Canada.
Wilson, A.A.G. 1988. Width of firebreak that is necessary tostop grass fires: some field experiments. Canadian Journalof Forest Research 18:682–687.
214
QUANTIFYING FIRE BEHAVIOR VERSUS SOCIETALBENEFITS OF SOUTHERN CALIFORNIA SHRUBLANDS
AND GRASSLANDS
Christopher A. Dicus1
California Polytechnic State University, Natural Resources Management Department, San Luis Obispo, CA 93407, USA
Maurica A. ZimmermanCalifornia Department of Forestry & Fire Protection, 635 N. Santa Rosa Street, San Luis Obispo, CA 93401, USA
ABSTRACT
Urban sprawl in southern California perpetually threatens native shrublands and grasslands, which intrinsically provide both biophysicaland socioeconomic benefits to society. However, these vegetation types are simultaneously prone to high-intensity wildfires that leadto enormous damage to human interests. After the southern California firestorms of October 2003, new regulations were adopted thatincreased the mandatory vegetation clearance around structures in order to reduce fire risk, which may significantly impact the positivebenefits that grasslands and shrublands provide. To address this apparent conflict, we investigated the tradeoffs between societal benefitsderived from major shrubland, grassland, and woodland vegetation types in southern California versus the potential fire behaviorassociated with each vegetation type.
Two state-of-the-art, geographic information system–based software packages were utilized in the analysis, which focused on SanDiego County, California. For each of the most common grassland, shrubland, and woodland vegetation communities in the area,FARSITE was utilized to assess potential fire behavior under average and extreme weather conditions. The most extreme fire behaviorwas found in nonnative grasslands and scrub oak chaparral communities and least extreme in coast live oak (Quercus agrifolia)communities. Under Santa Ana wind conditions, simulated fires in almost all vegetation types burned over 3 km into a developed areain �1 h. CITYgreen was used to quantify air pollution removal, carbon sequestration, and stormwater retention for each of thevegetation types, but was found to be largely ineffective because it calculated no measurable benefits for any non-tree vegetation types.To ensure sustainable neighborhoods in the wildland–urban interface, diverse stakeholders must create collaborative management plansthat simultaneously reduce fire risk and maximize societal benefits.
keywords: chaparral, CITYgreen, FARSITE, fire behavior modeling, grassland, shrubland, southern California, wildland–urban inter-face.
Citation: Dicus, C.A., and M.A. Zimmerman. 2007. Quantifying fire behavior versus societal benefits of southern California shrublandsand grasslands. Pages 214–220 in R.E. Masters and K.E.M. Galley (eds.). Proceedings of the 23rd Tall Timers Fire Ecology Conference:Fire in Grassland and Shrubland Ecosystems. Tall Timbers Research Station, Tallahassee, Florida, USA.
INTRODUCTION
In the wildland–urban interface, differing vegeta-tion types provide various levels of tangible and in-tangible benefits to society. For example, vegetationnot only enhances community attractiveness, but alsolowers home cooling costs (Taha et al. 1997), reducesair pollution (Taha 1996, Taha et al. 1997) and storm-water runoff (Sanders 1986), and sequesters carbon(Nowak and Rowntree 1991, McPherson et al. 1994).However, vegetation may simultaneously increase therisk to human development because it fuels wildfires.The type and structure of a given vegetation commu-nity will inherently influence both the benefits and therisk to a local development.
This seeming paradox in societal benefits versusfire risk of vegetation is readily exemplified in south-ern California, where a burgeoning population has reg-ularly developed adjacent to and intermixed with high-ly fire-prone shrubland and grassland communities.The population of San Diego, Los Angeles, Orange,
1 Corresponding author ([email protected]).
Riverside, San Bernardino, and Ventura counties insouthern California in 2000 was 20.5 million and isexpected to grow by at least 10% over the next 10 y(data from U.S. Census Bureau), which will continueto cause an enormous conversion of native vegetationto developed areas. For example, from 1985 to 2002,the city of San Diego experienced a 39% increase inurban areas across the landscape, which led to a 32%loss of grasslands, 7% loss of shrublands, and 27% ofloss of tree cover (American Forests 2003).
While the region’s shrubland, grassland, andwoodland communities provide numerous benefits,they are also prone to high-intensity, destructive wild-fires. For example, the 2003 Cedar Fire in San DiegoCounty, the largest and most destructive fire in Cali-fornia’s history, burned across 273,246 acres, killed 24people, and destroyed 4,847 structures (California De-partment of Forestry & Fire Protection 2004). As aresult of the 2003 Fire Siege, California Senate Bill1369 was signed into law in 2004, which amendedPublic Resources Code 4291 to increase mandatoryvegetation clearance around homes from a previousstandard of 9.14 m (30 ft) to a current standard of
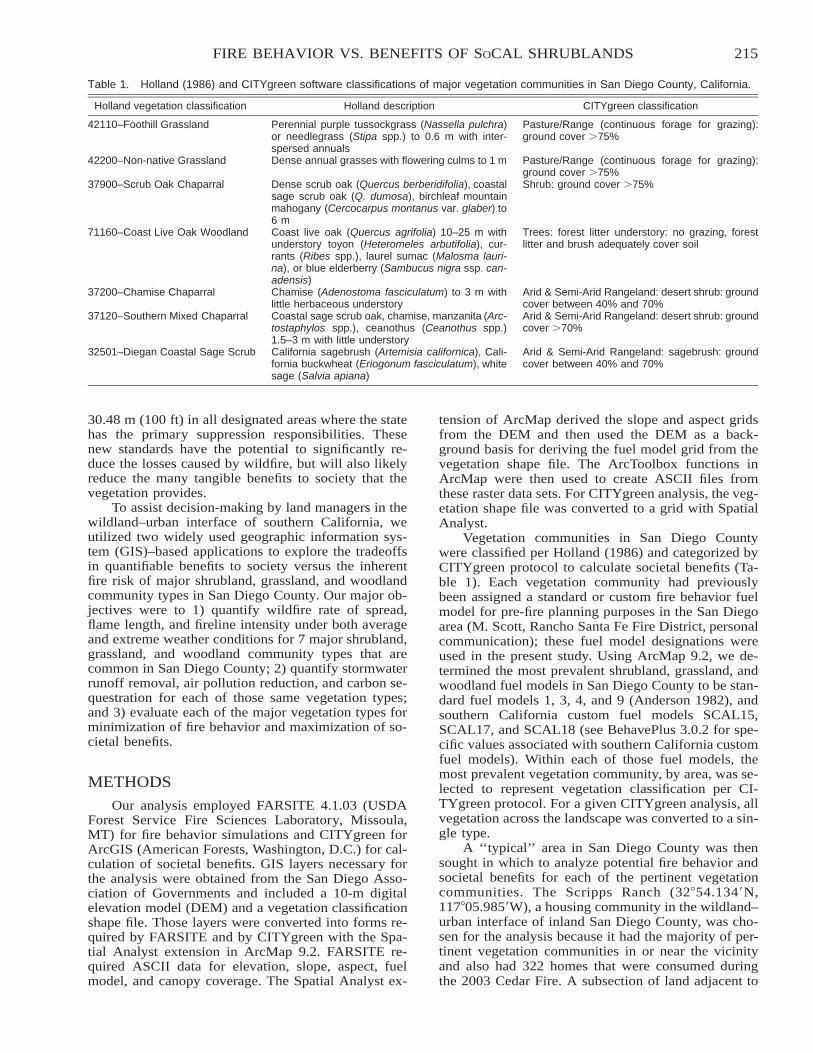
215FIRE BEHAVIOR VS. BENEFITS OF SOCAL SHRUBLANDS
Table 1. Holland (1986) and CITYgreen software classifications of major vegetation communities in San Diego County, California.
Holland vegetation classification Holland description CITYgreen classification
42110–Foothill Grassland Perennial purple tussockgrass (Nassella pulchra)or needlegrass (Stipa spp.) to 0.6 m with inter-spersed annuals
Pasture/Range (continuous forage for grazing):ground cover �75%
42200–Non-native Grassland Dense annual grasses with flowering culms to 1 m Pasture/Range (continuous forage for grazing):ground cover �75%
37900–Scrub Oak Chaparral Dense scrub oak (Quercus berberidifolia), coastalsage scrub oak (Q. dumosa), birchleaf mountainmahogany (Cercocarpus montanus var. glaber) to6 m
Shrub: ground cover �75%
71160–Coast Live Oak Woodland Coast live oak (Quercus agrifolia) 10–25 m withunderstory toyon (Heteromeles arbutifolia), cur-rants (Ribes spp.), laurel sumac (Malosma lauri-na), or blue elderberry (Sambucus nigra ssp. can-adensis)
Trees: forest litter understory: no grazing, forestlitter and brush adequately cover soil
37200–Chamise Chaparral Chamise (Adenostoma fasciculatum) to 3 m withlittle herbaceous understory
Arid & Semi-Arid Rangeland: desert shrub: groundcover between 40% and 70%
37120–Southern Mixed Chaparral Coastal sage scrub oak, chamise, manzanita (Arc-tostaphylos spp.), ceanothus (Ceanothus spp.)1.5–3 m with little understory
Arid & Semi-Arid Rangeland: desert shrub: groundcover �70%
32501–Diegan Coastal Sage Scrub California sagebrush (Artemisia californica), Cali-fornia buckwheat (Eriogonum fasciculatum), whitesage (Salvia apiana)
Arid & Semi-Arid Rangeland: sagebrush: groundcover between 40% and 70%
30.48 m (100 ft) in all designated areas where the statehas the primary suppression responsibilities. Thesenew standards have the potential to significantly re-duce the losses caused by wildfire, but will also likelyreduce the many tangible benefits to society that thevegetation provides.
To assist decision-making by land managers in thewildland–urban interface of southern California, weutilized two widely used geographic information sys-tem (GIS)–based applications to explore the tradeoffsin quantifiable benefits to society versus the inherentfire risk of major shrubland, grassland, and woodlandcommunity types in San Diego County. Our major ob-jectives were to 1) quantify wildfire rate of spread,flame length, and fireline intensity under both averageand extreme weather conditions for 7 major shrubland,grassland, and woodland community types that arecommon in San Diego County; 2) quantify stormwaterrunoff removal, air pollution reduction, and carbon se-questration for each of those same vegetation types;and 3) evaluate each of the major vegetation types forminimization of fire behavior and maximization of so-cietal benefits.
METHODS
Our analysis employed FARSITE 4.1.03 (USDAForest Service Fire Sciences Laboratory, Missoula,MT) for fire behavior simulations and CITYgreen forArcGIS (American Forests, Washington, D.C.) for cal-culation of societal benefits. GIS layers necessary forthe analysis were obtained from the San Diego Asso-ciation of Governments and included a 10-m digitalelevation model (DEM) and a vegetation classificationshape file. Those layers were converted into forms re-quired by FARSITE and by CITYgreen with the Spa-tial Analyst extension in ArcMap 9.2. FARSITE re-quired ASCII data for elevation, slope, aspect, fuelmodel, and canopy coverage. The Spatial Analyst ex-
tension of ArcMap derived the slope and aspect gridsfrom the DEM and then used the DEM as a back-ground basis for deriving the fuel model grid from thevegetation shape file. The ArcToolbox functions inArcMap were then used to create ASCII files fromthese raster data sets. For CITYgreen analysis, the veg-etation shape file was converted to a grid with SpatialAnalyst.
Vegetation communities in San Diego Countywere classified per Holland (1986) and categorized byCITYgreen protocol to calculate societal benefits (Ta-ble 1). Each vegetation community had previouslybeen assigned a standard or custom fire behavior fuelmodel for pre-fire planning purposes in the San Diegoarea (M. Scott, Rancho Santa Fe Fire District, personalcommunication); these fuel model designations wereused in the present study. Using ArcMap 9.2, we de-termined the most prevalent shrubland, grassland, andwoodland fuel models in San Diego County to be stan-dard fuel models 1, 3, 4, and 9 (Anderson 1982), andsouthern California custom fuel models SCAL15,SCAL17, and SCAL18 (see BehavePlus 3.0.2 for spe-cific values associated with southern California customfuel models). Within each of those fuel models, themost prevalent vegetation community, by area, was se-lected to represent vegetation classification per CI-TYgreen protocol. For a given CITYgreen analysis, allvegetation across the landscape was converted to a sin-gle type.
A ‘‘typical’’ area in San Diego County was thensought in which to analyze potential fire behavior andsocietal benefits for each of the pertinent vegetationcommunities. The Scripps Ranch (32�54.134�N,117�05.985�W), a housing community in the wildland–urban interface of inland San Diego County, was cho-sen for the analysis because it had the majority of per-tinent vegetation communities in or near the vicinityand also had 322 homes that were consumed duringthe 2003 Cedar Fire. A subsection of land adjacent to
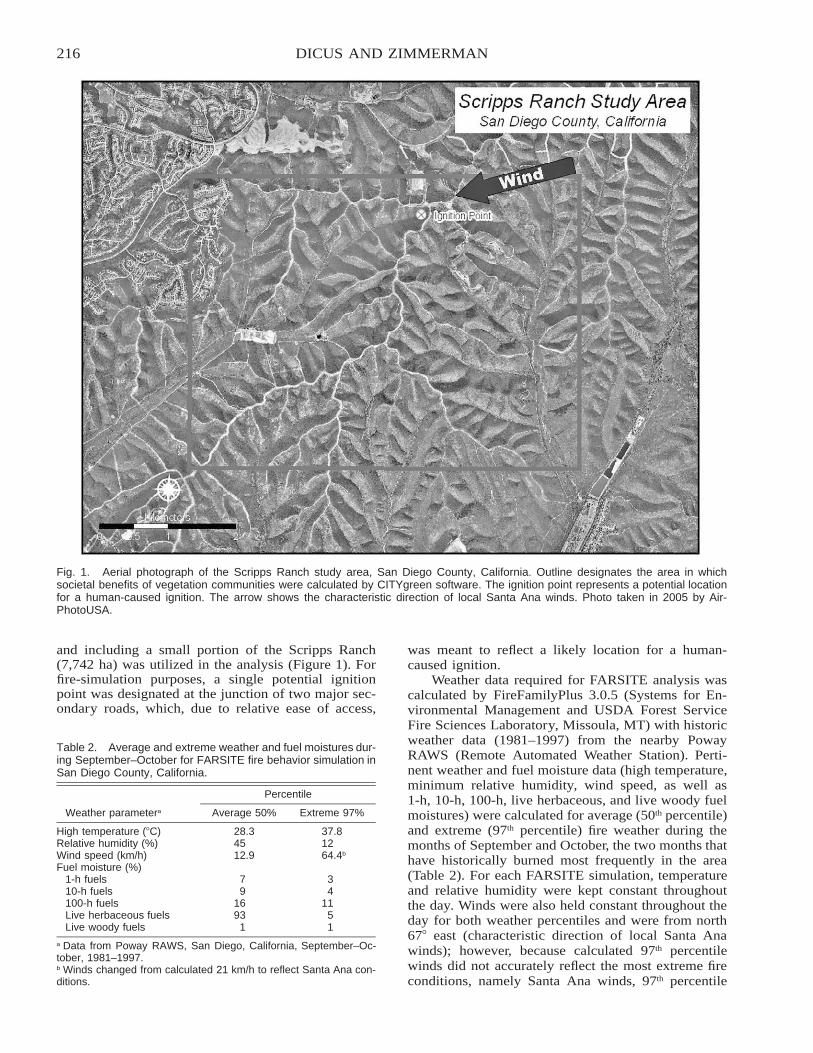
216 DICUS AND ZIMMERMAN
Fig. 1. Aerial photograph of the Scripps Ranch study area, San Diego County, California. Outline designates the area in whichsocietal benefits of vegetation communities were calculated by CITYgreen software. The ignition point represents a potential locationfor a human-caused ignition. The arrow shows the characteristic direction of local Santa Ana winds. Photo taken in 2005 by Air-PhotoUSA.
Table 2. Average and extreme weather and fuel moistures dur-ing September–October for FARSITE fire behavior simulation inSan Diego County, California.
Weather parametera
Percentile
Average 50% Extreme 97%
High temperature (�C) 28.3 37.8Relative humidity (%) 45 12Wind speed (km/h) 12.9 64.4b
Fuel moisture (%)1-h fuels 7 310-h fuels 9 4100-h fuels 16 11Live herbaceous fuels 93 5Live woody fuels 1 1
a Data from Poway RAWS, San Diego, California, September–Oc-tober, 1981–1997.b Winds changed from calculated 21 km/h to reflect Santa Ana con-ditions.
and including a small portion of the Scripps Ranch(7,742 ha) was utilized in the analysis (Figure 1). Forfire-simulation purposes, a single potential ignitionpoint was designated at the junction of two major sec-ondary roads, which, due to relative ease of access,
was meant to reflect a likely location for a human-caused ignition.
Weather data required for FARSITE analysis wascalculated by FireFamilyPlus 3.0.5 (Systems for En-vironmental Management and USDA Forest ServiceFire Sciences Laboratory, Missoula, MT) with historicweather data (1981–1997) from the nearby PowayRAWS (Remote Automated Weather Station). Perti-nent weather and fuel moisture data (high temperature,minimum relative humidity, wind speed, as well as1-h, 10-h, 100-h, live herbaceous, and live woody fuelmoistures) were calculated for average (50th percentile)and extreme (97th percentile) fire weather during themonths of September and October, the two months thathave historically burned most frequently in the area(Table 2). For each FARSITE simulation, temperatureand relative humidity were kept constant throughoutthe day. Winds were also held constant throughout theday for both weather percentiles and were from north67� east (characteristic direction of local Santa Anawinds); however, because calculated 97th percentilewinds did not accurately reflect the most extreme fireconditions, namely Santa Ana winds, 97th percentile
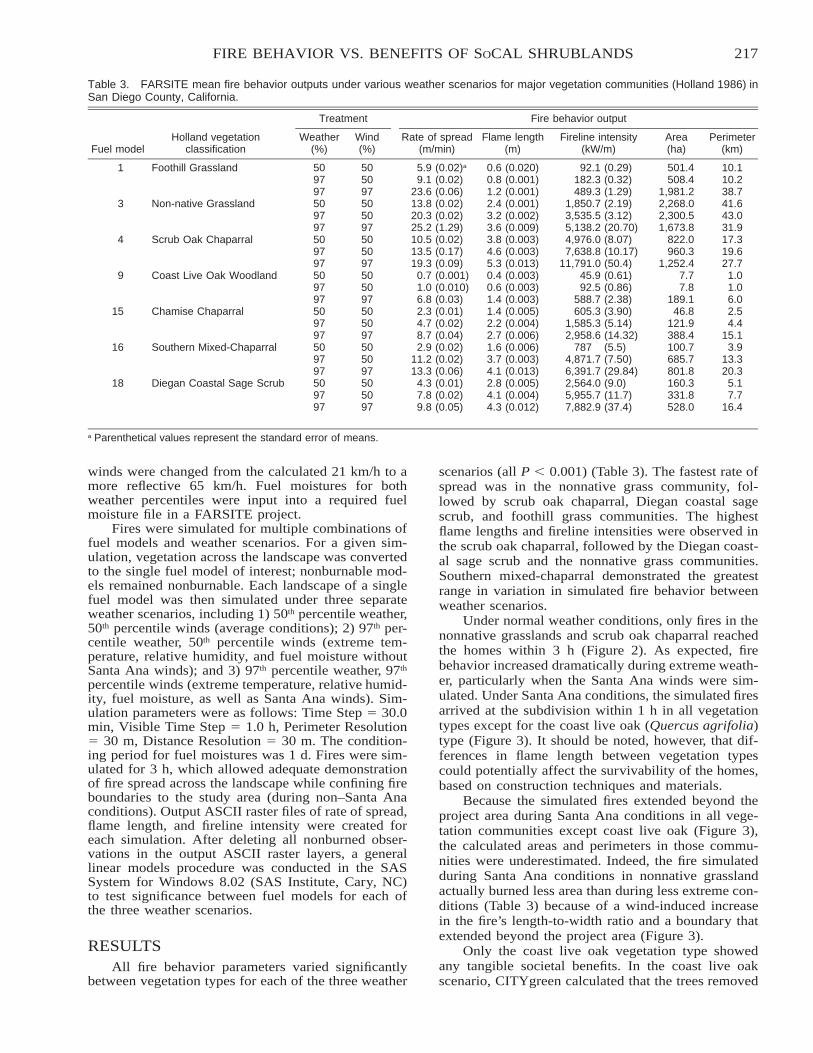
217FIRE BEHAVIOR VS. BENEFITS OF SOCAL SHRUBLANDS
Table 3. FARSITE mean fire behavior outputs under various weather scenarios for major vegetation communities (Holland 1986) inSan Diego County, California.
Fuel modelHolland vegetation
classification
Treatment
Weather(%)
Wind(%)
Fire behavior output
Rate of spread(m/min)
Flame length(m)
Fireline intensity(kW/m)
Area(ha)
Perimeter(km)
1 Foothill Grassland 50 50 5.9 (0.02)a 0.6 (0.020) 92.1 (0.29) 501.4 10.197 50 9.1 (0.02) 0.8 (0.001) 182.3 (0.32) 508.4 10.297 97 23.6 (0.06) 1.2 (0.001) 489.3 (1.29) 1,981.2 38.7
3 Non-native Grassland 50 50 13.8 (0.02) 2.4 (0.001) 1,850.7 (2.19) 2,268.0 41.697 50 20.3 (0.02) 3.2 (0.002) 3,535.5 (3.12) 2,300.5 43.097 97 25.2 (1.29) 3.6 (0.009) 5,138.2 (20.70) 1,673.8 31.9
4 Scrub Oak Chaparral 50 50 10.5 (0.02) 3.8 (0.003) 4,976.0 (8.07) 822.0 17.397 50 13.5 (0.17) 4.6 (0.003) 7,638.8 (10.17) 960.3 19.697 97 19.3 (0.09) 5.3 (0.013) 11,791.0 (50.4) 1,252.4 27.7
9 Coast Live Oak Woodland 50 50 0.7 (0.001) 0.4 (0.003) 45.9 (0.61) 7.7 1.097 50 1.0 (0.010) 0.6 (0.003) 92.5 (0.86) 7.8 1.097 97 6.8 (0.03) 1.4 (0.003) 588.7 (2.38) 189.1 6.0
15 Chamise Chaparral 50 50 2.3 (0.01) 1.4 (0.005) 605.3 (3.90) 46.8 2.597 50 4.7 (0.02) 2.2 (0.004) 1,585.3 (5.14) 121.9 4.497 97 8.7 (0.04) 2.7 (0.006) 2,958.6 (14.32) 388.4 15.1
16 Southern Mixed-Chaparral 50 50 2.9 (0.02) 1.6 (0.006) 787 (5.5) 100.7 3.997 50 11.2 (0.02) 3.7 (0.003) 4,871.7 (7.50) 685.7 13.397 97 13.3 (0.06) 4.1 (0.013) 6,391.7 (29.84) 801.8 20.3
18 Diegan Coastal Sage Scrub 50 50 4.3 (0.01) 2.8 (0.005) 2,564.0 (9.0) 160.3 5.197 50 7.8 (0.02) 4.1 (0.004) 5,955.7 (11.7) 331.8 7.797 97 9.8 (0.05) 4.3 (0.012) 7,882.9 (37.4) 528.0 16.4
a Parenthetical values represent the standard error of means.
winds were changed from the calculated 21 km/h to amore reflective 65 km/h. Fuel moistures for bothweather percentiles were input into a required fuelmoisture file in a FARSITE project.
Fires were simulated for multiple combinations offuel models and weather scenarios. For a given sim-ulation, vegetation across the landscape was convertedto the single fuel model of interest; nonburnable mod-els remained nonburnable. Each landscape of a singlefuel model was then simulated under three separateweather scenarios, including 1) 50th percentile weather,50th percentile winds (average conditions); 2) 97th per-centile weather, 50th percentile winds (extreme tem-perature, relative humidity, and fuel moisture withoutSanta Ana winds); and 3) 97th percentile weather, 97th
percentile winds (extreme temperature, relative humid-ity, fuel moisture, as well as Santa Ana winds). Sim-ulation parameters were as follows: Time Step � 30.0min, Visible Time Step � 1.0 h, Perimeter Resolution� 30 m, Distance Resolution � 30 m. The condition-ing period for fuel moistures was 1 d. Fires were sim-ulated for 3 h, which allowed adequate demonstrationof fire spread across the landscape while confining fireboundaries to the study area (during non–Santa Anaconditions). Output ASCII raster files of rate of spread,flame length, and fireline intensity were created foreach simulation. After deleting all nonburned obser-vations in the output ASCII raster layers, a generallinear models procedure was conducted in the SASSystem for Windows 8.02 (SAS Institute, Cary, NC)to test significance between fuel models for each ofthe three weather scenarios.
RESULTSAll fire behavior parameters varied significantly
between vegetation types for each of the three weather
scenarios (all P � 0.001) (Table 3). The fastest rate ofspread was in the nonnative grass community, fol-lowed by scrub oak chaparral, Diegan coastal sagescrub, and foothill grass communities. The highestflame lengths and fireline intensities were observed inthe scrub oak chaparral, followed by the Diegan coast-al sage scrub and the nonnative grass communities.Southern mixed-chaparral demonstrated the greatestrange in variation in simulated fire behavior betweenweather scenarios.
Under normal weather conditions, only fires in thenonnative grasslands and scrub oak chaparral reachedthe homes within 3 h (Figure 2). As expected, firebehavior increased dramatically during extreme weath-er, particularly when the Santa Ana winds were sim-ulated. Under Santa Ana conditions, the simulated firesarrived at the subdivision within 1 h in all vegetationtypes except for the coast live oak (Quercus agrifolia)type (Figure 3). It should be noted, however, that dif-ferences in flame length between vegetation typescould potentially affect the survivability of the homes,based on construction techniques and materials.
Because the simulated fires extended beyond theproject area during Santa Ana conditions in all vege-tation communities except coast live oak (Figure 3),the calculated areas and perimeters in those commu-nities were underestimated. Indeed, the fire simulatedduring Santa Ana conditions in nonnative grasslandactually burned less area than during less extreme con-ditions (Table 3) because of a wind-induced increasein the fire’s length-to-width ratio and a boundary thatextended beyond the project area (Figure 3).
Only the coast live oak vegetation type showedany tangible societal benefits. In the coast live oakscenario, CITYgreen calculated that the trees removed
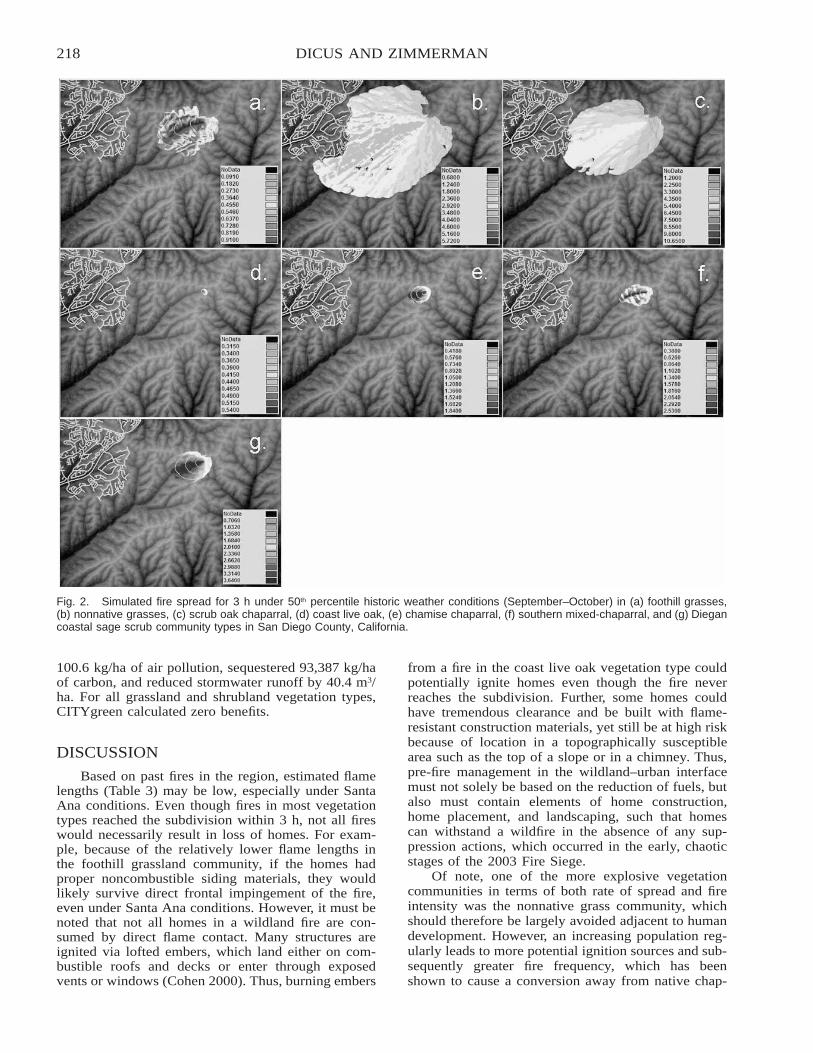
218 DICUS AND ZIMMERMAN
Fig. 2. Simulated fire spread for 3 h under 50th percentile historic weather conditions (September–October) in (a) foothill grasses,(b) nonnative grasses, (c) scrub oak chaparral, (d) coast live oak, (e) chamise chaparral, (f) southern mixed-chaparral, and (g) Diegancoastal sage scrub community types in San Diego County, California.
100.6 kg/ha of air pollution, sequestered 93,387 kg/haof carbon, and reduced stormwater runoff by 40.4 m3/ha. For all grassland and shrubland vegetation types,CITYgreen calculated zero benefits.
DISCUSSION
Based on past fires in the region, estimated flamelengths (Table 3) may be low, especially under SantaAna conditions. Even though fires in most vegetationtypes reached the subdivision within 3 h, not all fireswould necessarily result in loss of homes. For exam-ple, because of the relatively lower flame lengths inthe foothill grassland community, if the homes hadproper noncombustible siding materials, they wouldlikely survive direct frontal impingement of the fire,even under Santa Ana conditions. However, it must benoted that not all homes in a wildland fire are con-sumed by direct flame contact. Many structures areignited via lofted embers, which land either on com-bustible roofs and decks or enter through exposedvents or windows (Cohen 2000). Thus, burning embers
from a fire in the coast live oak vegetation type couldpotentially ignite homes even though the fire neverreaches the subdivision. Further, some homes couldhave tremendous clearance and be built with flame-resistant construction materials, yet still be at high riskbecause of location in a topographically susceptiblearea such as the top of a slope or in a chimney. Thus,pre-fire management in the wildland–urban interfacemust not solely be based on the reduction of fuels, butalso must contain elements of home construction,home placement, and landscaping, such that homescan withstand a wildfire in the absence of any sup-pression actions, which occurred in the early, chaoticstages of the 2003 Fire Siege.
Of note, one of the more explosive vegetationcommunities in terms of both rate of spread and fireintensity was the nonnative grass community, whichshould therefore be largely avoided adjacent to humandevelopment. However, an increasing population reg-ularly leads to more potential ignition sources and sub-sequently greater fire frequency, which has beenshown to cause a conversion away from native chap-
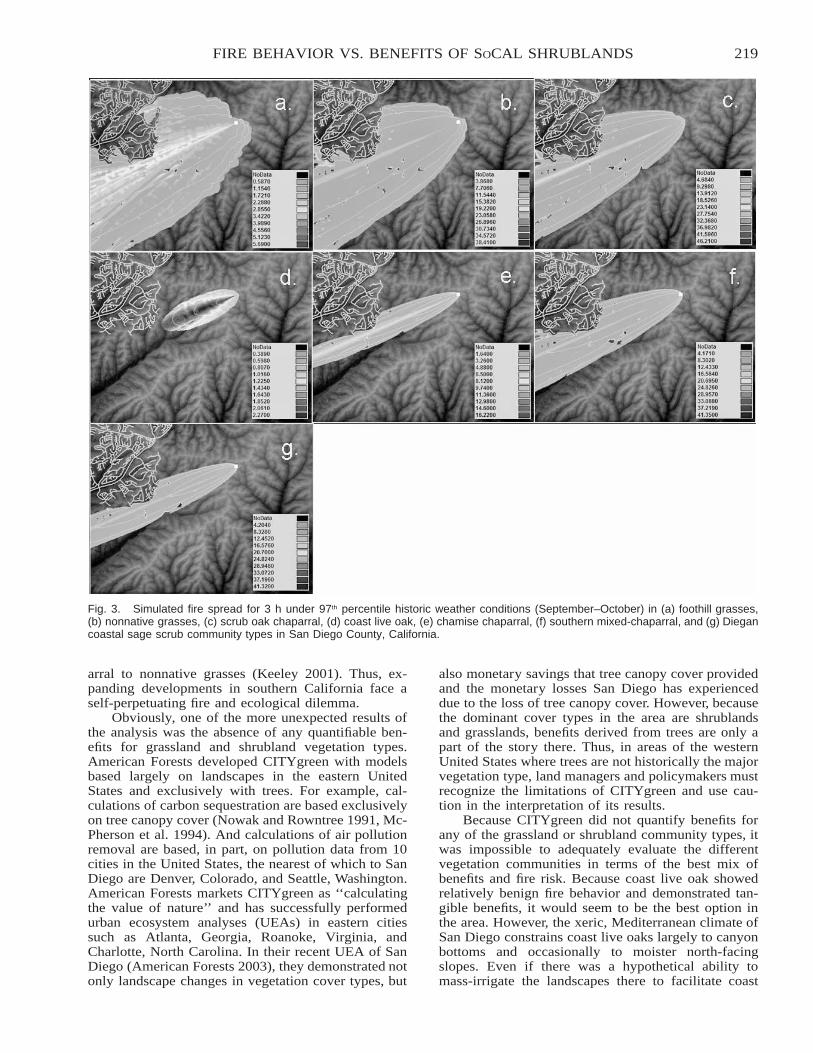
219FIRE BEHAVIOR VS. BENEFITS OF SOCAL SHRUBLANDS
Fig. 3. Simulated fire spread for 3 h under 97th percentile historic weather conditions (September–October) in (a) foothill grasses,(b) nonnative grasses, (c) scrub oak chaparral, (d) coast live oak, (e) chamise chaparral, (f) southern mixed-chaparral, and (g) Diegancoastal sage scrub community types in San Diego County, California.
arral to nonnative grasses (Keeley 2001). Thus, ex-panding developments in southern California face aself-perpetuating fire and ecological dilemma.
Obviously, one of the more unexpected results ofthe analysis was the absence of any quantifiable ben-efits for grassland and shrubland vegetation types.American Forests developed CITYgreen with modelsbased largely on landscapes in the eastern UnitedStates and exclusively with trees. For example, cal-culations of carbon sequestration are based exclusivelyon tree canopy cover (Nowak and Rowntree 1991, Mc-Pherson et al. 1994). And calculations of air pollutionremoval are based, in part, on pollution data from 10cities in the United States, the nearest of which to SanDiego are Denver, Colorado, and Seattle, Washington.American Forests markets CITYgreen as ‘‘calculatingthe value of nature’’ and has successfully performedurban ecosystem analyses (UEAs) in eastern citiessuch as Atlanta, Georgia, Roanoke, Virginia, andCharlotte, North Carolina. In their recent UEA of SanDiego (American Forests 2003), they demonstrated notonly landscape changes in vegetation cover types, but
also monetary savings that tree canopy cover providedand the monetary losses San Diego has experienceddue to the loss of tree canopy cover. However, becausethe dominant cover types in the area are shrublandsand grasslands, benefits derived from trees are only apart of the story there. Thus, in areas of the westernUnited States where trees are not historically the majorvegetation type, land managers and policymakers mustrecognize the limitations of CITYgreen and use cau-tion in the interpretation of its results.
Because CITYgreen did not quantify benefits forany of the grassland or shrubland community types, itwas impossible to adequately evaluate the differentvegetation communities in terms of the best mix ofbenefits and fire risk. Because coast live oak showedrelatively benign fire behavior and demonstrated tan-gible benefits, it would seem to be the best option inthe area. However, the xeric, Mediterranean climate ofSan Diego constrains coast live oaks largely to canyonbottoms and occasionally to moister north-facingslopes. Even if there was a hypothetical ability tomass-irrigate the landscapes there to facilitate coast
220 DICUS AND ZIMMERMAN
live oak, a dilemma in the area is that large trees arecommonly cut down by homeowners because they areperceived to degrade residential views.
MANAGEMENT IMPLICATIONS
Even though simulated fire behavior varied con-siderably by vegetation type in our study, few devel-opments in the wildland–urban interface of southernCalifornia should be considered fire ‘‘safe’’ during ex-treme conditions. Vegetation types and structures, con-struction design, infrastructure, and suppression capa-bilities all play a role in determining the risk to a givenstructure. Thus, vegetation management cannot be re-lied on alone to reduce the risk of wildfire to humandevelopments. Further, fire managers should be awarethat although the new 30.48-m (100-ft) clearance reg-ulation is intended to reduce fire intensity, there maybe potential for unexpected consequences that couldunintentionally increase fire behavior (Dicus and An-derson 2005). For example, thinning some eucalyptus(Eucalyptus spp.) stands in San Diego has been shownto increase the amount of nonnative grasses and shrubsin the understory, which created an even more explo-sive situation than before the thinning occurred (M.Scott, Rancho Santa Fe Fire District, personal com-munication).
Even though we have reported no benefits, nativegrasslands and brushlands provide many societal andecological benefits. Therefore, fire managers must un-derstand the potential benefits of vegetation in an areaand recognize that fire risk can be significantly reducedwithout totally denuding the landscape of vegetation.There is a need in San Diego and throughout southernCalifornia for multidisciplinary collaboration to reducethe cycle of repetitive loss from wildfires while si-multaneously maximizing other societal values. Laud-ably, many interface areas in California have initiatedlocal ‘‘FireSafe Councils,’’ which target diverse stake-holders such as fire personnel, landscapers, insuranceagents, environmentalists, and academics to seek tan-gible ways to reduce the fire risk locally.
Land managers and policymakers should use cau-tion when utilizing CITYgreen and understand its lim-itations. Although a UEA readily shows changes inland use and vegetation, its inability to include non-tree vegetation in its analyses of societal benefitsshould cause users a certain degree of skepticism inareas such as San Diego, where trees are not the dom-inant vegetative cover type.
CONCLUSIONS
Vegetation community types will vary in fire be-havior and, although not shown here, provide variouslevels of benefits based on the species and structure ofthe vegetation on the landscape. Thus, fire managersin the wildland–urban interface should not utilize aone-size-fits-all, clear-at-all-costs mentality in fuels
management. To ensure sustainable developments inthe wildland–urban interface, stakeholders from a di-versity of disciplines and worldviews must collaborateto determine the best management plan for a givenarea that simultaneously reduces fire risk and alsomaximizes the benefits that different vegetation com-munities provide.
ACKNOWLEDGMENTSThis project was funded by the California Agri-
cultural Research Initiative. We are grateful to MikeScott, Urban Fire Forester, Rancho Santa Fe Fire Dis-trict, who provided practical insight into fuel modelsand fire behavior modeling in the San Diego area.Also, we thank Mike Singleton and Mark Carpenterof KTU�A Landscaping Architecture and Planning inSan Diego, who provided data and further insight intocommunity forestry aspects of San Diego.
LITERATURE CITEDAmerican Forests. 2003. Urban ecosystem analysis—San Diego,
California: calculating the value of nature. http://www.americanforests.org/downloads/rea/AF�SanDiego.pdf [ac-cessed 1 Oct 2005].
Anderson, H.E. 1982. Aids to determining fuel models for es-timating fire behavior. General Technical Report INT-122,U.S. Department of Agriculture, Forest Service, Intermoun-tain Forest and Range Experiment Station, Ogden, UT.
California Department of Forestry & Fire Protection. 2004. Cal-ifornia fire siege 2003: the story. http://www.fire.ca.gov/php/downloads/2003FireStoryInternet.pdf [accessed 1 Oct2005].
Cohen, J.D. 2000. Preventing disaster: home ignitability in thewildland–urban interface. Journal of Forestry 98(3):15–21.
Dicus, C.A., and M.P. Anderson. 2005. Benefits versus fire riskof native and invasive vegetation in the Wildland–UrbanInterface. Pages 63–69 in C. Pirosko (ed.). Proceedings ofthe California Invasive Plant Council Symposium 8. 7–9Oct 2004, Ventura, CA.
Holland, R.F. 1986. Preliminary descriptions of the terrestrialnatural communities of California. California Departmentof Fish and Game, Natural Heritage Division, Sacramento.
Keeley, J.E. 2001. Fire and invasive species in Mediterranean-climate ecosystems of California. Pages 81–94 in K.E.M.Galley and T.P. Wilson (eds.). Proceedings of the InvasiveSpecies Workshop: the role of fire in the control and spreadof invasive species. Miscellaneous Publication No. 11, TallTimbers Research Station, Tallahassee, FL.
McPherson, E.G., D.J. Nowak, and R.A. Rowntree (eds.). 1994.Chicago’s urban forest ecosystem: results of the ChicagoUrban Forest Climate Project. General Technical ReportNE-186, U.S. Department of Agriculture, Forest Service,Radnor, PA.
Nowak, D., and R.A. Rowntree. 1991. Quantifying the role ofurban forests in removing atmospheric carbon dioxide.Journal of Arboriculture 17(10):269.
Sanders, R.A. 1986. Urban vegetation impacts on the hydrologyof Dayton, Ohio. Urban Ecology 9(3/4):361–376.
Taha, H. 1996. Modeling impacts of increased urban vegetationon ozone air quality in the South Coast Air Basin. Atmo-spheric Environment 30:3423–3430.
Taha, H., S. Douglas, and J. Haney. 1997. Mesoscale meteoro-logical and air quality impacts of increased urban albedoand vegetation. Energy and Buildings 25:169–177.
221
COMPARISON OF LIVE FUEL MOISTURE SAMPLINGMETHODS FOR BIG SAGEBRUSH IN UTAH
Annie BrownColorado State University, College of Natural Resources, Department of Forest Sciences, Fort Collins, CO 80523, andBureau of Land Management, Utah State Office, P.O. Box 45155, Salt Lake City, UT 84145, USA
Philip N. OmiColorado State University, College of Natural Resources, Department of Forest Sciences, Fort Collins, CO 80523, USA
Jolie PolletBureau of Land Management, Utah State Office, P.O. Box 45155, Salt Lake City, UT 84145, USA
ABSTRACT
Live fuel moisture (LFM) has been identified by managers as well as the scientific literature as a key driver of fire behavior in fueltypes dominated by live vegetation (i.e., shrublands). Recognizing this, fire managers in Utah use LFM values as a factor in makingboth tactical and strategic decisions in fire suppression and prescribed burning. Current methods to quantify LFM through field samplinghave been based on publications developed for fuel types that are very different from those found in the Great Basin. No research hasbeen conducted regarding the most appropriate procedures to follow to obtain accurate and comparable LFM results for sagebrush fueltypes. This proposed research aims to improve local knowledge by determining the most appropriate sampling procedures for assessingLFM in Utah’s big sagebrush (Artemisia tridentata). This will involve analyzing how variability in data collection affects LFM valuesand recommending a methodology. Sampling methods suggested in the literature as well as those most commonly utilized by fieldtechnicians will be compared and statistically analyzed to detect significant differences in resultant LFM values. In addition, finalvalues from each method will be run through the National Fire Danger Rating System to determine if there are differences in firedanger indices and staffing levels using various collection methods. By developing scientifically sound, standardized methods, firemanagers will benefit from improved accuracy and comparability of LFM values.
Citation: Brown, A., P.N. Omi, and J. Pollet. 2007. Comparison of live fuel moisture sampling methods for big sagebrush in Utah[abstract]. Page 221 in R.E. Masters and K.E.M. Galley (eds.). Proceedings of the 23rd Tall Timbers Fire Ecology Conference: Fire inGrassland and Shrubland Ecosystems. Tall Timbers Research Station, Tallahassee, Florida, USA.
222
MONITORING FIRE EFFECTS IN GRASSLANDS ON NATIONALPARK UNITS OF THE NORTHERN GREAT PLAINS
Andy Thorstenson and Cody L. WienkNorthern Great Plains Fire Management Office, Wind Cave National Park, 26611 U.S. Highway 385, Hot Springs, SD57747, USA
ABSTRACT
The Northern Great Plains (NGP) Fire Ecology Program began installing fire effects monitoring plots in national park units of theNGP in 1997. Since then, �200 plots have been installed in forest stands, shrublands, grasslands, and riparian areas of ten park units.The general goal of the NGP Fire Ecology Program is to provide vegetation information to the fire management and resource man-agement programs of these parks. This presentation will focus on 41 grassland plots (27 native prairie and 14 nonnative grass) in sixpark units that have been sampled at least four growing seasons following application of prescribed fire. Prescribed fire has beenapplied to 28 of these plots once and to 13 plots twice. Park units included in this analysis are Badlands National Park, Devils TowerNational Monument, Knife River Indian Villages National Historic Site, Scotts Bluff National Monument, Theodore Roosevelt NationalPark, and Wind Cave National Park. Plot sampling protocols used are standard National Park Service (NPS) protocols outlined in theNPS Fire Monitoring Handbook. Percent cover data were collected using point-intercept method along one 30-m transect at each site.Data will be analyzed to compare pre-burn and 4- or 5-y post-burn values to detect changes in percent cover and relative cover forindividual species and for functional guilds of species. The most common goals of prescribed fire in the NGP parks are to maintainnative prairie and reduce nonnative grass species. We will also assess the success at which prescribed fire has been used to meet thesegoals.
Citation: Thorstenson, A., and C.L. Wienk. 2007. Monitoring fire effects in grasslands on national park units of the northern GreatPlains [abstract]. Page 222 in R.E. Masters and K.E.M. Galley (eds.). Proceedings of the 23rd Tall Timbers Fire Ecology Conference:Fire in Grassland and Shrubland Ecosystems. Tall Timbers Research Station, Tallahassee, Florida, USA.
223
ANALYSIS OF FUEL VARIABILITY WITHIN THE ROCKYMOUNTAIN REGION: INTEGRATION OF FIELD DATA,
GEOSPATIAL INFORMATION, AND SPATIAL STATISTICS
Mohammed A. KalkhanColorado State University, Natural Resources Ecology Laboratory (NESB-B236), Fort Collins, CO 80523, USA
Karl E. BrownCenter for Biological Informatics, P.O. Box 25046, Mail Stop 302, Denver, CO 80225, USA
ABSTRACT
The integration of spatial information (remotely sensed data, geographic information system [GIS], Global Positioning System [GPS]),and spatial statistics are effective for modeling coarse-scale and fine-scale ecological variability and for the prediction of fuel loading,variability, and vegetation characteristics. We proposed new techniques to conduct fuel–vegetation surveys based on pixel nestedsampling (20 � 20-m) designs at different landscape-scale levels at Grand Teton National Park (GRTE)–Bridger Teton National Forest(BTNF), Wyoming, and (15 � 15-m) at Rocky Mountain National Park (ROMO), Colorado. Through geospatial statistical modelingand mapping, fuel loadings will be forecast across the landscape. To predict the fuel parameters and forest characteristics at GRTE–BTNF, we will use a new geospatial statistics model using spatial autocorrelation and cross-correlation statistics, trend-surface analysis,and stepwise regression. This process is based on the ordinary least squares or spatial autoregressive, generalized least squares estimates,and generalized linear models. Field data, environmental characteristics, remote sensing, and GIS data will be integrated with spatialstatistics to estimate coarse-scale variability in vegetation, fuel parameters, and forest characteristics. Modeling of the spatial continuityof fine-scale variability will be based on binary regression classification trees, kriging, and co-kriging. Semi-variogram models will beselected for the lowest values of corrected Akaike Information Criterion statistics when kriging is used. Using this method, we hopeto define a new protocol for fuel modeling and mapping within GRTE–BTNF. The new approach will also provide a cost-effectivetool for identifying areas currently affected or vulnerable to invasion by exotic species, as well as assist with other issues of landscapemanagement (i.e., forest fuel loading, wildfire in relation to weeds occupying the landscape, and other factors of concern to resourcemanagement teams at GRTE–BTNF and ROMO). This research also provides a growing body of knowledge upon which park managersmay base decisions that best preserve the park’s natural richness while allowing its beauty to be enjoyed.
Citation: Kalkhan, M.A., and K.E. Brown. 2007. Analysis of fuel variability within the Rocky Mountain region: integration of fielddata, geospatial information, and spatial statistics [abstract]. Page 223 in R.E. Masters and K.E.M. Galley (eds.). Proceedings of the23rd Tall Timbers Fire Ecology Conference: Fire in Grassland and Shrubland Ecosystems. Tall Timbers Research Station, Tallahassee,Florida, USA.
224
NEW TOOLS FOR ASSESSING LANDSCAPE SCALE OFVEGETATION AND WILDFIRE HAZARDS: A CASE STUDY
FROM THE ROCKY MOUNTAIN REGIONS
Mohammed A. KalkhanColorado State University, Natural Resources Ecology Laboratory (NESB-B236), Fort Collins, CO 80523, USA
ABSTRACT
Integration of spatial information (i.e., remote sensing, geographic information system [GIS], and Global Positioning System [GPS])with geospatial statistics can be used to investigate the spatial relationships among plant diversity, fuels, wildfire severity, and post-fire invasion by exotic plant species through linkage of multiphase sampling design and multiscale nested sampling field plots (pre-and post-fire). This technique provides useful information and new tools for describing and forecasting landscape-scale fire regimes,invasive plants, and ecological and environmental characteristics for the Cerro Grande Fire site, Los Alamos, New Mexico; HaymanFire and High Meadow sites, Colorado; and other areas within the Rocky Mountain regions. Results of trend-surface models thatdescribe the coarse-scale spatial variability to predict the distribution, presence, and patterns of native and exotic species, and fuelloading (tons per hectare) using stepwise multiple regressions based on the ordinary least squares (OLS) and spatial autoregressive(SAR) methods will be presented. Models with small variance were selected. In addition, the residuals from the trend-surface modelbased on the OLS or SAR procedure were modeled using binary regression trees and ordinary kriging for modeling small-scalevariability based on semi-variogram models. All models were selected based on lowest values of standard errors, corrected AkaikeInformation Criterion statistics, and high R2.
Citation: Kalkhan, M.A. 2007. New tools for assessing landscape scale of vegetation and wildfire hazards: a case study from the RockyMountain regions [abstract]. Page 224 in R.E. Masters and K.E.M. Galley (eds.). Proceedings of the 23rd Tall Timbers Fire EcologyConference: Fire in Grassland and Shrubland Ecosystems. Tall Timbers Research Station, Tallahassee, Florida, USA.
225
ECOLOGICAL DIVERSITY IN CHAPARRAL FOLLOWINGPRESCRIBED FIRE AND MASTICATION TREATMENTS
Jennifer Potts and Scott StephensUniversity of California, Forest Science Division, Department of Environmental Science Policy & Management, 145Mulford Hall, Berkeley, CA 94720, USA
ABSTRACT
Chaparral fire management has become increasingly challenging as California’s population expands into the wildland fringes. Fuelmanagement techniques such as out-of-season prescribed fire and mastication (mechanical shredding) are often used to reduce wildfirerisk in chaparral; however, the ecological consequences of these treatments have not been carefully studied. To address this issue, weare investigating the effects of fall, winter, and spring prescribed fire and mastication in northern California chaparral. We are targetingthree questions with our research: 1) Do plant and bird species composition–abundance differ between prescribed fire and mastication?2) Do plant and bird species composition–abundance vary with treatment season (fall, winter, spring)? 3) Does deer herbivory alterplant species composition–cover–abundance? Pre- and post-treatment monitoring of plant and bird recovery has been ongoing since2001 and will continue through 2005. Final data analysis will be available in 2006. With �100 acres of replicated experimentaltreatments, this research project is one of the only fire management studies of its kind. Preliminary results suggest that plant and birdresponses vary significantly after these fuel reduction treatments, particularly in relation to nonnative grass cover and bird abundance.In particular, we are noticing substantially higher abundance and cover of nonnative plant species in all mastication plots. Nonnativegrasses are especially prevalent and will not only dominate resources at the present time, but they will have the advantage of depositingseeds in the soil for future reestablishment. Nonnative grasses also have the potential to increase the ecosystem’s flammability becausethey cure earlier than native grasses and have more extensive cover. We are also noticing substantial trends in bird composition andabundance. To date, we have found 40 bird species and 800� individuals using post-fire habitat compared to 14 species and 60�individuals in post-mastication habitat. Furthermore, fire and mastication plots do not share the same common species. For example,the most common post-fire species are western scrub jay (Aphelocoma californica), spotted towhee (Pipilo maculatus), and Bewick’swren (Thryomanes bewickii). The most common post-mastication species are California quail (Callipepla californica) and dark-eyedjunco (Junco hyemalis). In effect, current chaparral fuel management practices may be significantly altering floral and faunal communitycomposition. These patterns have not been well studied in northern California but clearly need research, especially as fuel reductionbecomes more extensive in order to protect a growing number of homes from wildfire. Existing chaparral fire studies have often beenopportunistic and inadequately replicated to take advantage of post-wildfire conditions. In addition, few comparative studies havefocused on fire versus mastication and their seasonal timing. As a result, this research project aims to provide robust, region-specificinformation to chaparral managers in order to improve the quality of future fuels management.
Citation: Potts, J., and S. Stephens. 2007. Ecological diversity in chaparral following prescribed fire and mastication treatments[abstract]. Page 225 in R.E. Masters and K.E.M. Galley (eds.). Proceedings of the 23rd Tall Timbers Fire Ecology Conference: Fire inGrassland and Shrubland Ecosystems. Tall Timbers Research Station, Tallahassee, Florida, USA.
226
FIRE EFFECTS ON THE STRUCTURE OF WOODYVEGETATION OF CERRADO DENSO, A SAVANNA-LIKE
VEGETATION OF CENTRAL BRAZIL
Margarete Naomi Sato and Heloısa Sinatora MirandaUniversidade de Brasılia, Departamento de Ecologia, 70710-910 Brasılia, DF, Brazil
Philip J. RigganUSDA Forest Service, Pacific Southwest Research Station, Forest Fire Laboratory, 4955 Canyon Crest Drive, Riverside, CA92507, USA
ABSTRACT
The cerrado, a savanna-like vegetation, covers 25% of the Brazilian territory. Cerrado denso is the denser form of cerrado, with treesreaching 8 m in height and an herbaceous layer composed of sparse herbs and grasses that dry out from April to September, whenfires are common in the region. In 1992, at the Instituto Brasileiro de Geografia e Estatıstica Ecological Reserve, 26 km south ofBrasılia, Brazil, three 10-ha plots, protected from fire for 18 y, were selected to investigate the effects of fire on the mortality rate ofthe cerrado denso woody vegetation. The fire regime selected was biennial fires at the beginning (Jun), middle (Aug), and end of thedry season (Sep). Before the fires, there were 2,040 (Jun), 2,188 (Aug), and 1,870 (Sep) live individuals/ha in the plots, distributedamong 59, 62, and 68 species. The estimated aboveground tree biomass was 20.7 t/ha (Jun), 35.3 t/ha (Aug), and 38.7 t/ha (Sep). Inthe herbaceous layer, the biomass was 7.5 t/ha in the June and August plots and 5.4 t/ha in the September plot. In 2001, after fivebiennial prescribed fires, the cumulative mortality was 32% in the June plot, 34% in the August plot, and 41% in the September plot.These numbers increased to 48% (Jun), 54% (Aug), and 74% (Sep) when the numbers of stems destroyed (dead � topkill) areconsidered. The fires resulted in a loss of approximately 26% of the woody aboveground biomass in the June plot, approximately 40%in the August plot, and approximately 45% in the September plot. There was an increase of 1.8 t/ha in the biomass of the herbaceouslayer in the June plot, 1.0 t/ha in the August plot, and 4.9 t/ha in the September plot. The results suggest that the structure of thewoody vegetation in the cerrado denso is highly affected by high fire frequency. The reduction in the number of live stems and theincrease in the herbaceous layer biomass may result in changes in the energy balance of the system, with significant alterations in thecarbon and water fluxes.
Citation: Sato, M.N., H.S. Miranda, and P.J. Riggan. 2007. Fire effects on the structure of woody vegetation of cerrado denso, asavanna-like vegetation of central Brazil. Page 226 in R.E. Masters and K.E.M. Galley (eds.). Proceedings of the 23rd Tall TimbersFire Ecology Conference: Fire in Grassland and Shrubland Ecosystems. Tall Timbers Research Station, Tallahassee, Florida, USA.
227
NONNATIVE INVASIVE PLANTS AND FIRE: LITERATUREREVIEWS AND KNOWLEDGE GAPS
Gregory T. Munger, Kris Zouhar, and Jane Kapler SmithUSDA Forest Service, Rocky Mountain Research Station, Fire Sciences Laboratory, 5775 West U.S. Highway 10, Missoula,MT 59808, USA
ABSTRACT
The Fire Effects Information System (FEIS) provides reviews of the scientific literature regarding basic biology and fire ecology ofnearly 1,000 plant and animal species. Managers use FEIS in planning for post-fire rehabilitation, use of fire in ecosystem maintenanceand restoration, and other management. Scientists and members of the public also use the system. Reviews of 60 nonnative invasiveplant species have recently been revised in or added to FEIS (http://www.fs.fed.us/database/feis/plants/weed/weedpage.html). Most ofthese species occur in grassland or shrubland ecosystems. As reviews were written, gaps in science-based knowledge about therelationships between fire and these 60 nonnative invasive species were systematically identified. Fewer than half of the species studiedhad information on heat tolerance, post-fire establishment, effects of varying fire regimes (severities, seasons, and intervals betweenburns), or long-term effects of fire. Information was generally available, although sometimes incomplete, on biological and ecologicalcharacteristics relating to fire. Most information about species distribution used too coarse a scale or nonsystematic observations,rendering it of little help in assessing invasiveness and susceptibility of ecosystems to invasion, especially in regard to fire. Quantitativeinformation on nonnative plants’ impacts on native plant communities and long-term effects on ecosystems was sparse. Researcherscan improve the knowledge available to managers by applying rigorous scientific methods and reporting the scope of the research, inboth scientific papers and literature reviews. Managers can use this knowledge most effectively by applying scientific findings withcaution appropriate to the scope of the research, monitoring treatment results over the long term, and adapting management techniquesaccording to what is learned.
Citation: Munger, G.T., K. Zouhar, and J.K. Smith. 2007. Nonnative invasive plants and fire: literature reviews and knowledge gaps[abstract]. Page 227 in R.E. Masters and K.E.M. Galley (eds.). Proceedings of the 23rd Tall Timbers Fire Ecology Conference: Fire inGrassland and Shrubland Ecosystems. Tall Timbers Research Station, Tallahassee, Florida, USA.
228
MODIFYING NATIONAL PARK SERVICE FIRE EFFECTSSAMPLING PROTOCOLS TO MEET THE NEEDS OF THE FIRE
ECOLOGY, INVENTORY AND MONITORING, AND EXOTICPLANT MANAGEMENT PROGRAMS
Cody L. WienkNorthern Great Plains Fire Management Office, Wind Cave National Park, RR 1 Box 190, Hot Springs, SD 57747, USA
Amy J. SymstadU.S. Geological Survey, Mount Rushmore National Memorial, 13000 Highway 244, Keystone, SD 57751, USA
Andy ThorstensonNorthern Great Plains Fire Management Office, Wind Cave National Park, RR 1 Box 190, Hot Springs, SD 57747, USA
Dan LichtNorthern Great Plains Inventory & Monitoring Program, Mount Rushmore National Memorial, 13000 Highway 244,Keystone, SD 57751, USA
Chad W. ProsserNorthern Great Plains Exotic Plant Management Team, Theodore Roosevelt National Park, 315 2nd Avenue, Medora, ND58645, USA
ABSTRACT
In 1997, the Northern Great Plains Fire Effects team began monitoring the effects of prescribed fire activities on vegetation in tenNational Park Service (NPS) units as part of the NPS’s national Fire Effects Program. In 1999, as a result of the Natural ResourceChallenge federal legislation, the National Park Service established two new national programs interested in monitoring vegetation.The Exotic Plant Management Program is organized into regional teams (EPMTs) that map the extent of and treat invasive plantspecies, while the Inventory and Monitoring Program is organized into networks charged with tracking the ecosystem health of NPSunits by monitoring indicative ‘‘vital signs.’’ In the northern Great Plains, the geographic overlap and mutual interests of these threeprograms has led to a cooperative effort to design a vegetation-monitoring protocol that will meet the needs of all three programs inways that the individual programs’ monitoring alone could not. We present the results of this effort so far. We focus on 1) thedevelopment of monitoring objectives, 2) overcoming issues in sampling design across space and through time, and 3) the results ofa pilot study designed to compare the efficiency and efficacy of two methods of measuring plant community composition in the majorvegetation types that will be monitored in this region.
Citation: Wienk, C.L., A.J. Symstad, A. Thorstenson, D. Licht, and C.W. Prosser. 2007. Modifying National Park Service fire effectssampling protocols to meet the needs of the Fire Ecology, Inventory and Monitoring, and Exotic Plant Management programs [abstract].Page 228 in R.E. Masters and K.E.M. Galley (eds.). Proceedings of the 23rd Tall Timbers Fire Ecology Conference: Fire in Grasslandand Shrubland Ecosystems. Tall Timbers Research Station, Tallahassee, Florida, USA.
229
THE PUU ANAHULU WILDFIRE MANAGEMENT STUDY:DEVELOPMENT OF ROADSIDE FUELS REDUCTION
TECHNIQUES FOR LEEWARD HAWAI‘I
J. Michael CastilloWest Hawai‘i Wildfire Management Organization, P.O. Box 6213, Kamuela, HI 96743, USA
Miles NakaharaHawai‘i Department of Land and Natural Resources, Division of Forestry and Wildlife, Kamuela State Tree Nursery, 66-1220A Lalamilo Road, Kamuela, HI 96743, USA
David WeiseUSDA Forest Service, Pacific Southwest Research Station, Forest Fire Laboratory, 4955 Canyon Crest Drive, Riverside, CA92507, USA
Robert VihnanekUSDA Forest Service, Pacific Northwest Research Station, Pacific Northwest Fire Laboratory, 400 N. 34th Street, Suite 201,Seattle, WA 98103, USA
Gayland EnriquesU.S. Army, Installation Fire and Safety Office, 851 Wright Avenue, Wheeler AAF, HI 96857, USA
Amanda McAdamsUSDA Forest Service, Dixie and Fishlake National Forests, P.O. Box 80, Panguitch, UT 84759, USA
Lawrence FordUniversity of California–Santa Cruz, Environmental Studies Department, 5984 Plateau Drive, Felton, CA 95018, USA
Rod MoragaAnchor Point Group, 3775 Iris Avenue, Suite 2A, Boulder, CO 80301, USA
Bruce BabbU.S. Fish and Wildlife Service, 911 NE 11th Avenue, Portland, OR 97232, USA
Mark Thorne, Edith Nonner, and Danielle FrohlichUniversity of Hawai‘i at Manoa, Honolulu, HI 96822, USA
ABSTRACT
Invasion of native lowland dry forests and shrublands on the island of Hawai‘i by fountaingrass (Pennisetum setaceum) has created afine fuel bed capable of carrying surface fires at frequent, regular intervals. A corresponding expansion of the human population intoarid leeward areas has resulted in an increase in roadside ignitions. These two factors are contributing to the conversion of native dryforest and shrubland to savanna and grassland, and have resulted in dramatic declines or extinction of �30 endemic plant and animalspecies. The new fire regime also increasingly threatens life and property throughout the northwest region of the island. In an effortto develop and refine roadside fuels management techniques that could break this cycle, we evaluated the effects of single applicationsof prescribed burning, cattle grazing, and aerially applied herbicide, applied alone and in combinations between January and May2004. Fuel loading, vegetation response, and soil seedbank composition were monitored over a 1-y period. Prescribed burns were thefirst burns conducted on state land and entailed extensive cooperative planning and coordination by local state, county, and federalland management and civil service agencies. Burns caused an immediate reduction in fountaingrass fuel load. Cattle grazing was noteffective in reducing fuel loading in this study due to low stocking rates applied. Aerially applied glyphosate herbicide effectivelykilled the grass and initiated a process of decomposition. Glyphosate treatments resulted in a release of the existing and predominantlynonnative soil seedbank. The combined burn � graze � glyphosate treatment resulted in the greatest increase in plant species richness(mean � 5).
Citation: Castillo, J.M., M. Nakahara, D. Weise, R. Vihnanek, G. Enriques, A. McAdams, L. Ford, R. Moraga, B. Babb, M. Thorne,E. Nonner, and D. Frohlich. 2007. The Puu Anahulu wildfire management study: development of roadside fuels reduction techniquesfor leeward Hawai‘i [abstract]. Page 229 in R.E. Masters and K.E.M. Galley (eds.). Proceedings of the 23rd Tall Timbers Fire EcologyConference: Fire in Grassland and Shrubland Ecosystems. Tall Timbers Research Station, Tallahassee, Florida, USA.
230
EFFECTS OF CATTLE GRAZING, GLYPHOSATE, ANDPRESCRIBED BURNING ON FOUNTAINGRASS FUEL
LOADING IN HAWAI‘I
J. Michael CastilloWest Hawai‘i Wildfire Management Organization, P.O. Box 6213, Kamuela, HI 96743-6213, USA
Gayland EnriquesU.S. Army, Installation Fire and Safety Office, 851 Wright Avenue, Wheeler AAF, HI 96857-5000, USA
Miles NakaharaHawai‘i Department of Lands and Natural Resources, Division of Forestry and Wildlife, Kamuela State Tree Nursery, 66-1220A Lalamilo Road, Kamuela, HI 96743, USA
David Weise1
USDA Forest Service, Pacific Southwest Research Station, Forest Fire Lab, 4955 Canyon Crest Drive, Riverside, CA92507, USA
Lawrence FordUniversity of California–Santa Cruz, Environmental Studies Department, 5984 Plateau Drive, Felton, CA 95018-9253, USA
Rodrigo MoragaAnchor Point Group, 3775 Iris Avenue, Suite 2A, Boulder, CO 80301, USA
Robert VihnanekUSDA Forest Service, Pacific Northwest Research Station, Pacific Wildland Fire Sciences Lab, 400 N. 34th Street, Suite201, Seattle, WA 98103, USA
ABSTRACT
Crimson fountaingrass (Pennisetum setaceum) is a nonnative invasive grass that has occupied a significant portion of the western sideof the island of Hawai‘i. As a result, several fires in excess of 4,049 ha have occurred in the area over the past 20 y. We are studyingthe effectiveness of cattle grazing, aerial application of glyphosate herbicide, and prescribed burning to reduce the fuel loading offountaingrass in this dry, tropical setting. Grazing and prescribed burning were applied as whole-plot treatments to plots ranging inarea from 2.4 to 6.5 ha; glyphosate herbicide was aerially applied as a split-plot treatment. Plots were burned in January and February2004, aerially sprayed in March and May 2004, and grazed by cattle in March and April 2004. Fuels were sampled prior to treatmentand at periodic intervals over the first year following treatment. Fuel and fire behavior variables were measured during the prescribedburns. Pre-treatment fuel loading ranged from 9 to 11 Mg/ha and fuel height averaged 0.5 m. Observed dead fuel moistures were 12–16% and live grass fuel moisture was �270% during the prescribed burns. Fire spread rates up to 16.8 m/min and flame heights upto 3.7 m were observed. Prescribed burning and glyphosate reduced fuel loads by 46% and 14%, respectively. Fuel height was reducedby 8–48%. Grazing did not have a significant effect in this study. Fuel height did recover and fuel loads did not recover to pre-treatment levels within 13 mo of the prescribed burns.
keywords: crimson fountaingrass, fire, flame length, fuels reduction, glyphosate, grazing, Hawai‘i, leeward, Pennisetum setaceum, rateof spread.
Citation: Castillo, J.M., G. Enriques, M. Nakahara, D. Weise, L. Ford, R. Moraga, and R. Vihnanek. 2007. Effects of cattle grazing,glyphosate, and prescribed burning on fountaingrass fuel loading in Hawai‘i. Pages 230–239 in R.E. Masters and K.E.M. Galley (eds.).Proceedings of the 23rd Tall Timbers Fire Ecology Conference: Fire in Grassland and Shrubland Ecosystems. Tall Timbers ResearchStation, Tallahassee, Florida, USA.
INTRODUCTION
In the tropics, grass invasions have been observedto cause increased fire frequency (McDonald et al.1988, D’Antonio and Vitousek 1992, Smith and Tun-ison 1992). Grass invasions into dry vegetation com-munities of Hawai‘i have resulted in recurrent wild-fires that reduce woody plant cover and simplify plant
1 Corresponding author ([email protected]).
community structure (Cuddihy and Stone 1990,Hughes et al. 1991, D’Antonio and Vitousek 1992,Castillo 1997). Resultant wildfires provide for in-creased solar radiation, higher near-ground windspeeds, and lower fine fuel moisture (Blackmore andVitousek 2000). These conditions of higher fine fuelloads, lower fine fuel moisture, and higher near-groundwind speeds are conducive to fire ignition and spread(Freifelder et al. 1998).
Crimson fountaingrass (Pennisetum setaceum) was
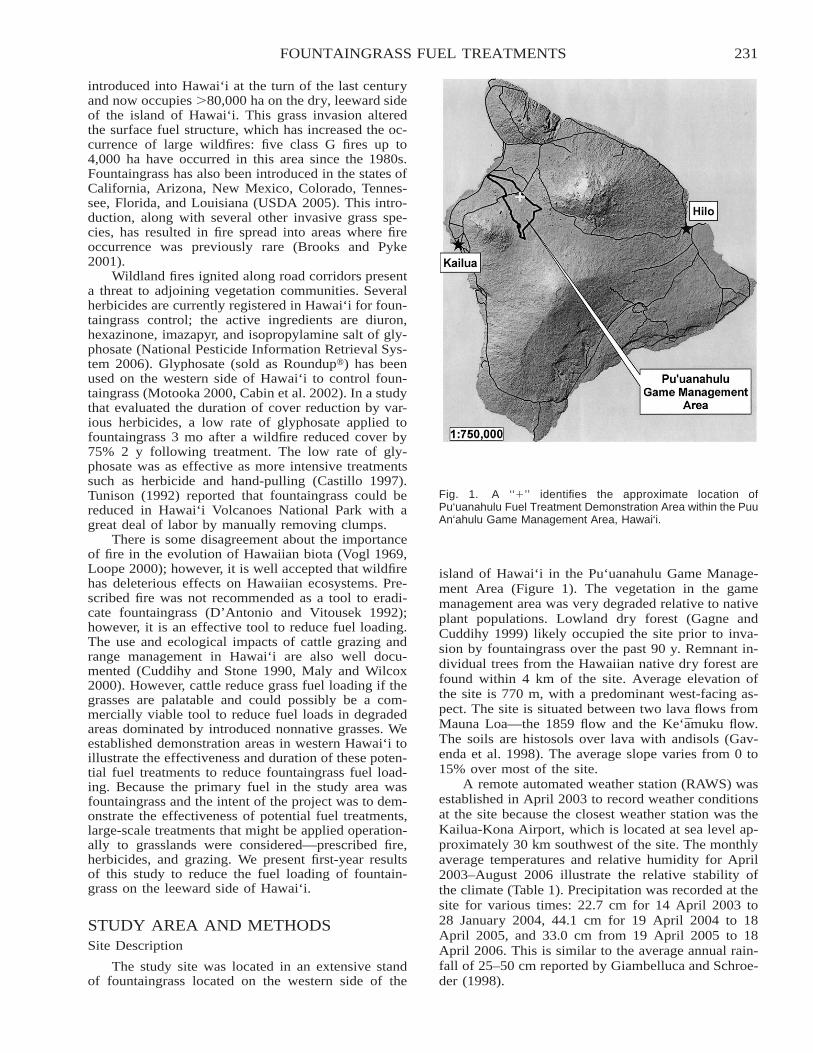
231FOUNTAINGRASS FUEL TREATMENTS
Fig. 1. A ‘‘�’’ identifies the approximate location ofPu‘uanahulu Fuel Treatment Demonstration Area within the PuuAn‘ahulu Game Management Area, Hawai‘i.
introduced into Hawai‘i at the turn of the last centuryand now occupies �80,000 ha on the dry, leeward sideof the island of Hawai‘i. This grass invasion alteredthe surface fuel structure, which has increased the oc-currence of large wildfires: five class G fires up to4,000 ha have occurred in this area since the 1980s.Fountaingrass has also been introduced in the states ofCalifornia, Arizona, New Mexico, Colorado, Tennes-see, Florida, and Louisiana (USDA 2005). This intro-duction, along with several other invasive grass spe-cies, has resulted in fire spread into areas where fireoccurrence was previously rare (Brooks and Pyke2001).
Wildland fires ignited along road corridors presenta threat to adjoining vegetation communities. Severalherbicides are currently registered in Hawai‘i for foun-taingrass control; the active ingredients are diuron,hexazinone, imazapyr, and isopropylamine salt of gly-phosate (National Pesticide Information Retrieval Sys-tem 2006). Glyphosate (sold as Roundup�) has beenused on the western side of Hawai‘i to control foun-taingrass (Motooka 2000, Cabin et al. 2002). In a studythat evaluated the duration of cover reduction by var-ious herbicides, a low rate of glyphosate applied tofountaingrass 3 mo after a wildfire reduced cover by75% 2 y following treatment. The low rate of gly-phosate was as effective as more intensive treatmentssuch as herbicide and hand-pulling (Castillo 1997).Tunison (1992) reported that fountaingrass could bereduced in Hawai‘i Volcanoes National Park with agreat deal of labor by manually removing clumps.
There is some disagreement about the importanceof fire in the evolution of Hawaiian biota (Vogl 1969,Loope 2000); however, it is well accepted that wildfirehas deleterious effects on Hawaiian ecosystems. Pre-scribed fire was not recommended as a tool to eradi-cate fountaingrass (D’Antonio and Vitousek 1992);however, it is an effective tool to reduce fuel loading.The use and ecological impacts of cattle grazing andrange management in Hawai‘i are also well docu-mented (Cuddihy and Stone 1990, Maly and Wilcox2000). However, cattle reduce grass fuel loading if thegrasses are palatable and could possibly be a com-mercially viable tool to reduce fuel loads in degradedareas dominated by introduced nonnative grasses. Weestablished demonstration areas in western Hawai‘i toillustrate the effectiveness and duration of these poten-tial fuel treatments to reduce fountaingrass fuel load-ing. Because the primary fuel in the study area wasfountaingrass and the intent of the project was to dem-onstrate the effectiveness of potential fuel treatments,large-scale treatments that might be applied operation-ally to grasslands were considered—prescribed fire,herbicides, and grazing. We present first-year resultsof this study to reduce the fuel loading of fountain-grass on the leeward side of Hawai‘i.
STUDY AREA AND METHODSSite Description
The study site was located in an extensive standof fountaingrass located on the western side of the
island of Hawai‘i in the Pu‘uanahulu Game Manage-ment Area (Figure 1). The vegetation in the gamemanagement area was very degraded relative to nativeplant populations. Lowland dry forest (Gagne andCuddihy 1999) likely occupied the site prior to inva-sion by fountaingrass over the past 90 y. Remnant in-dividual trees from the Hawaiian native dry forest arefound within 4 km of the site. Average elevation ofthe site is 770 m, with a predominant west-facing as-pect. The site is situated between two lava flows fromMauna Loa—the 1859 flow and the Ke‘amuku flow.The soils are histosols over lava with andisols (Gav-enda et al. 1998). The average slope varies from 0 to15% over most of the site.
A remote automated weather station (RAWS) wasestablished in April 2003 to record weather conditionsat the site because the closest weather station was theKailua-Kona Airport, which is located at sea level ap-proximately 30 km southwest of the site. The monthlyaverage temperatures and relative humidity for April2003–August 2006 illustrate the relative stability ofthe climate (Table 1). Precipitation was recorded at thesite for various times: 22.7 cm for 14 April 2003 to28 January 2004, 44.1 cm for 19 April 2004 to 18April 2005, and 33.0 cm from 19 April 2005 to 18April 2006. This is similar to the average annual rain-fall of 25–50 cm reported by Giambelluca and Schroe-der (1998).
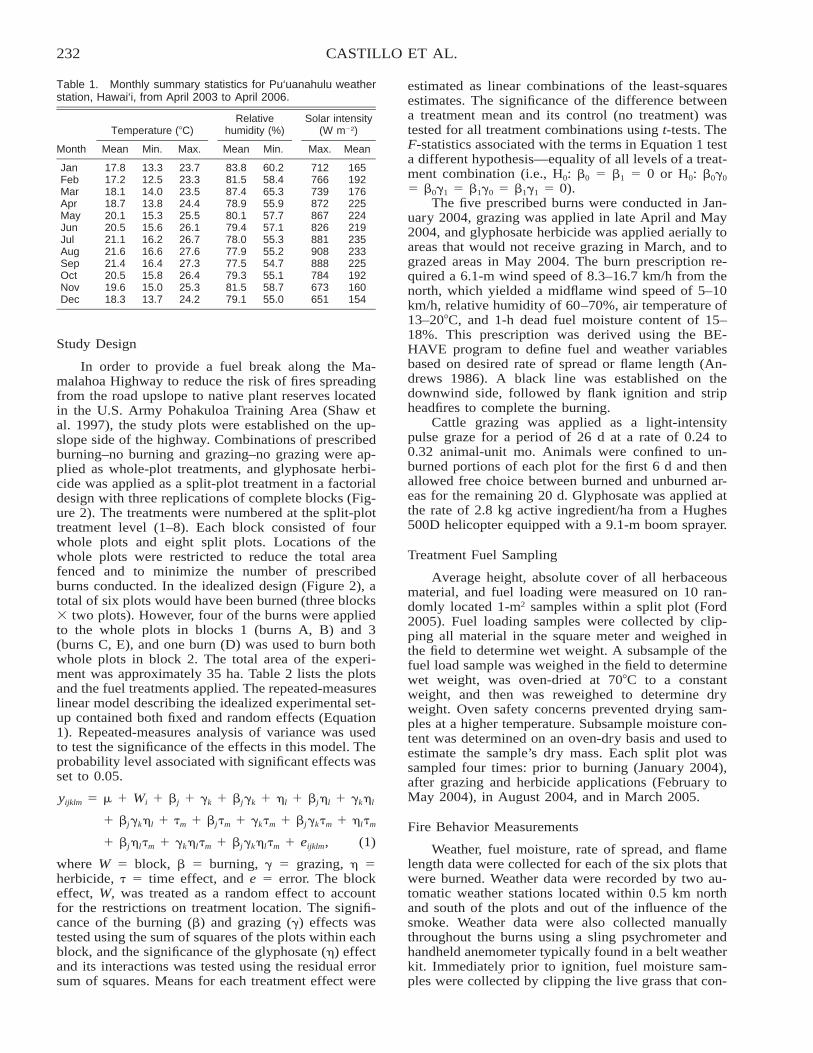
232 CASTILLO ET AL.
Table 1. Monthly summary statistics for Pu‘uanahulu weatherstation, Hawai‘i, from April 2003 to April 2006.
Month
Temperature (�C)
Mean Min. Max.
Relativehumidity (%)
Mean Min.
Solar intensity(W m�2)
Max. Mean
Jan 17.8 13.3 23.7 83.8 60.2 712 165Feb 17.2 12.5 23.3 81.5 58.4 766 192Mar 18.1 14.0 23.5 87.4 65.3 739 176Apr 18.7 13.8 24.4 78.9 55.9 872 225May 20.1 15.3 25.5 80.1 57.7 867 224Jun 20.5 15.6 26.1 79.4 57.1 826 219Jul 21.1 16.2 26.7 78.0 55.3 881 235Aug 21.6 16.6 27.6 77.9 55.2 908 233Sep 21.4 16.4 27.3 77.5 54.7 888 225Oct 20.5 15.8 26.4 79.3 55.1 784 192Nov 19.6 15.0 25.3 81.5 58.7 673 160Dec 18.3 13.7 24.2 79.1 55.0 651 154
Study Design
In order to provide a fuel break along the Ma-malahoa Highway to reduce the risk of fires spreadingfrom the road upslope to native plant reserves locatedin the U.S. Army Pohakuloa Training Area (Shaw etal. 1997), the study plots were established on the up-slope side of the highway. Combinations of prescribedburning–no burning and grazing–no grazing were ap-plied as whole-plot treatments, and glyphosate herbi-cide was applied as a split-plot treatment in a factorialdesign with three replications of complete blocks (Fig-ure 2). The treatments were numbered at the split-plottreatment level (1–8). Each block consisted of fourwhole plots and eight split plots. Locations of thewhole plots were restricted to reduce the total areafenced and to minimize the number of prescribedburns conducted. In the idealized design (Figure 2), atotal of six plots would have been burned (three blocks� two plots). However, four of the burns were appliedto the whole plots in blocks 1 (burns A, B) and 3(burns C, E), and one burn (D) was used to burn bothwhole plots in block 2. The total area of the experi-ment was approximately 35 ha. Table 2 lists the plotsand the fuel treatments applied. The repeated-measureslinear model describing the idealized experimental set-up contained both fixed and random effects (Equation1). Repeated-measures analysis of variance was usedto test the significance of the effects in this model. Theprobability level associated with significant effects wasset to 0.05.
yijklm � � � Wi � j � k � jk � �l � j�l � k�l
� jk�l � �m � j�m � k�m � jk�m � �l�m
� j�l�m � k�l�m � jk�l�m � eijklm, (1)
where W � block, � burning, � grazing, � �herbicide, � � time effect, and e � error. The blockeffect, W, was treated as a random effect to accountfor the restrictions on treatment location. The signifi-cance of the burning () and grazing () effects wastested using the sum of squares of the plots within eachblock, and the significance of the glyphosate (�) effectand its interactions was tested using the residual errorsum of squares. Means for each treatment effect were
estimated as linear combinations of the least-squaresestimates. The significance of the difference betweena treatment mean and its control (no treatment) wastested for all treatment combinations using t-tests. TheF-statistics associated with the terms in Equation 1 testa different hypothesis—equality of all levels of a treat-ment combination (i.e., H0: 0 � 1 � 0 or H0: 00
� 01 � 10 � 11 � 0).The five prescribed burns were conducted in Jan-
uary 2004, grazing was applied in late April and May2004, and glyphosate herbicide was applied aerially toareas that would not receive grazing in March, and tograzed areas in May 2004. The burn prescription re-quired a 6.1-m wind speed of 8.3–16.7 km/h from thenorth, which yielded a midflame wind speed of 5–10km/h, relative humidity of 60–70%, air temperature of13–20�C, and 1-h dead fuel moisture content of 15–18%. This prescription was derived using the BE-HAVE program to define fuel and weather variablesbased on desired rate of spread or flame length (An-drews 1986). A black line was established on thedownwind side, followed by flank ignition and stripheadfires to complete the burning.
Cattle grazing was applied as a light-intensitypulse graze for a period of 26 d at a rate of 0.24 to0.32 animal-unit mo. Animals were confined to un-burned portions of each plot for the first 6 d and thenallowed free choice between burned and unburned ar-eas for the remaining 20 d. Glyphosate was applied atthe rate of 2.8 kg active ingredient/ha from a Hughes500D helicopter equipped with a 9.1-m boom sprayer.
Treatment Fuel Sampling
Average height, absolute cover of all herbaceousmaterial, and fuel loading were measured on 10 ran-domly located 1-m2 samples within a split plot (Ford2005). Fuel loading samples were collected by clip-ping all material in the square meter and weighed inthe field to determine wet weight. A subsample of thefuel load sample was weighed in the field to determinewet weight, was oven-dried at 70�C to a constantweight, and then was reweighed to determine dryweight. Oven safety concerns prevented drying sam-ples at a higher temperature. Subsample moisture con-tent was determined on an oven-dry basis and used toestimate the sample’s dry mass. Each split plot wassampled four times: prior to burning (January 2004),after grazing and herbicide applications (February toMay 2004), in August 2004, and in March 2005.
Fire Behavior Measurements
Weather, fuel moisture, rate of spread, and flamelength data were collected for each of the six plots thatwere burned. Weather data were recorded by two au-tomatic weather stations located within 0.5 km northand south of the plots and out of the influence of thesmoke. Weather data were also collected manuallythroughout the burns using a sling psychrometer andhandheld anemometer typically found in a belt weatherkit. Immediately prior to ignition, fuel moisture sam-ples were collected by clipping the live grass that con-
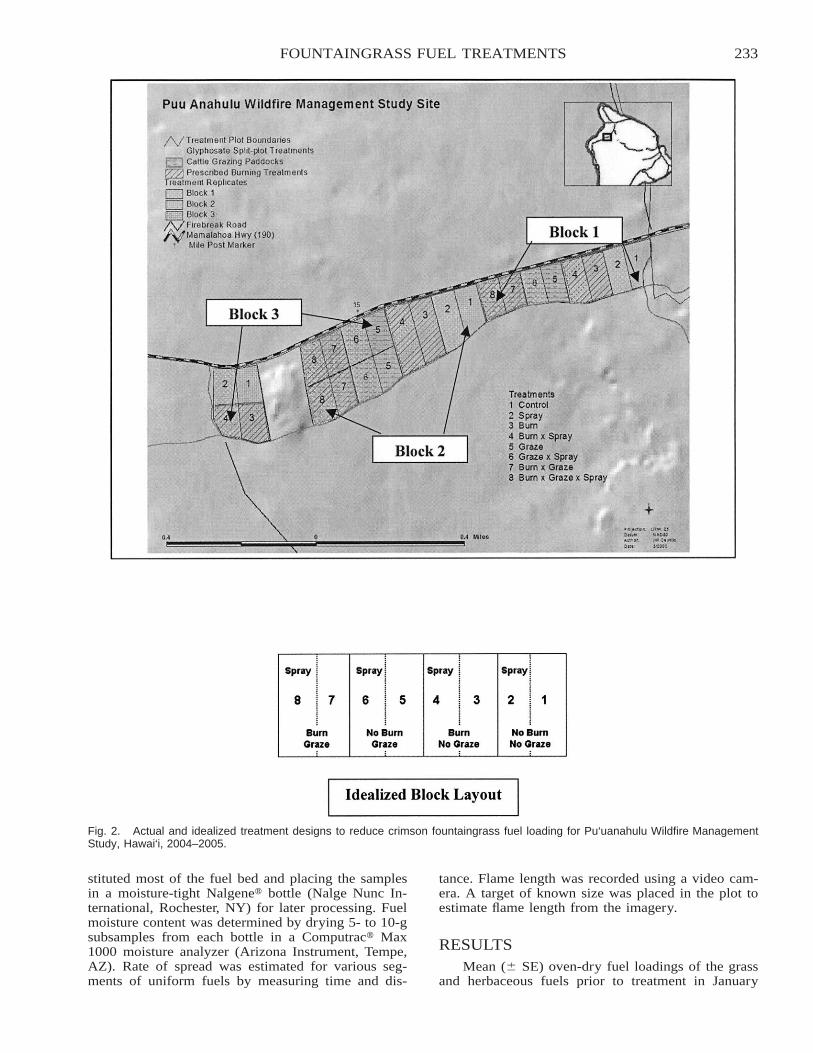
233FOUNTAINGRASS FUEL TREATMENTS
Fig. 2. Actual and idealized treatment designs to reduce crimson fountaingrass fuel loading for Pu‘uanahulu Wildfire ManagementStudy, Hawai‘i, 2004–2005.
stituted most of the fuel bed and placing the samplesin a moisture-tight Nalgene� bottle (Nalge Nunc In-ternational, Rochester, NY) for later processing. Fuelmoisture content was determined by drying 5- to 10-gsubsamples from each bottle in a Computrac� Max1000 moisture analyzer (Arizona Instrument, Tempe,AZ). Rate of spread was estimated for various seg-ments of uniform fuels by measuring time and dis-
tance. Flame length was recorded using a video cam-era. A target of known size was placed in the plot toestimate flame length from the imagery.
RESULTSMean ( SE) oven-dry fuel loadings of the grass
and herbaceous fuels prior to treatment in January
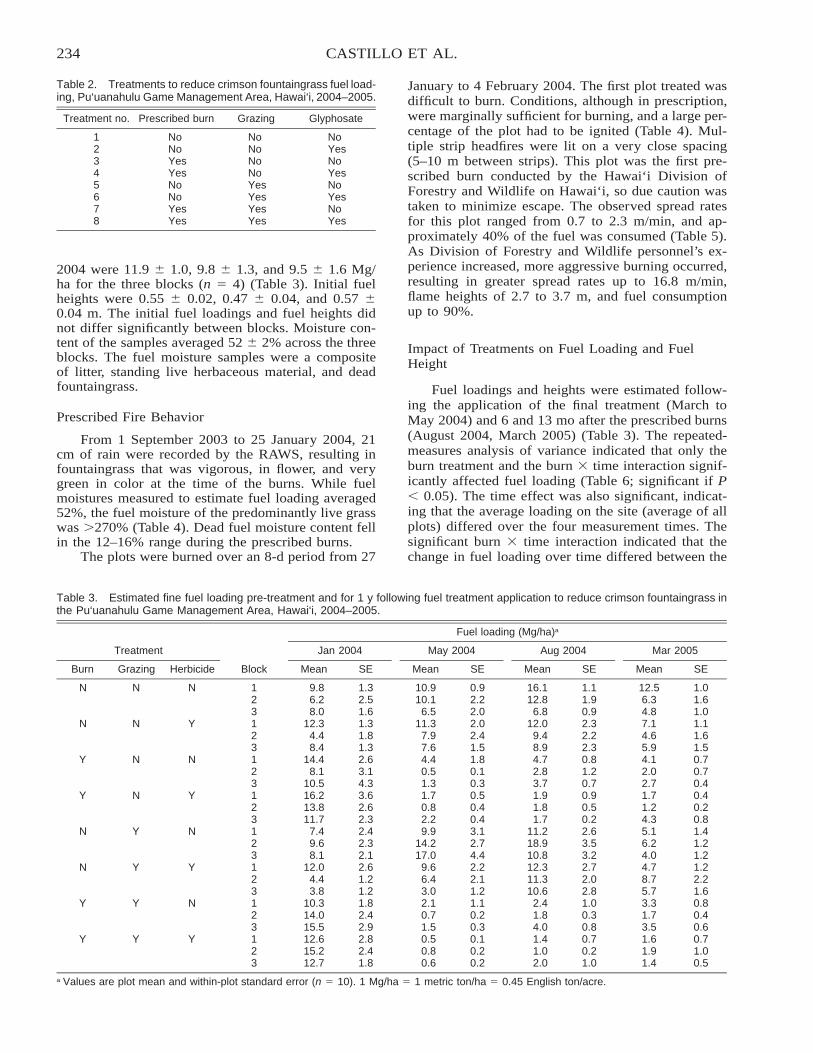
234 CASTILLO ET AL.
Table 2. Treatments to reduce crimson fountaingrass fuel load-ing, Pu‘uanahulu Game Management Area, Hawai‘i, 2004–2005.
Treatment no. Prescribed burn Grazing Glyphosate
1 No No No2 No No Yes3 Yes No No4 Yes No Yes5 No Yes No6 No Yes Yes7 Yes Yes No8 Yes Yes Yes
Table 3. Estimated fine fuel loading pre-treatment and for 1 y following fuel treatment application to reduce crimson fountaingrass inthe Pu‘uanahulu Game Management Area, Hawai‘i, 2004–2005.
Treatment
Burn Grazing Herbicide Block
Fuel loading (Mg/ha)a
Jan 2004
Mean SE
May 2004
Mean SE
Aug 2004
Mean SE
Mar 2005
Mean SE
N N N 1 9.8 1.3 10.9 0.9 16.1 1.1 12.5 1.02 6.2 2.5 10.1 2.2 12.8 1.9 6.3 1.63 8.0 1.6 6.5 2.0 6.8 0.9 4.8 1.0
N N Y 1 12.3 1.3 11.3 2.0 12.0 2.3 7.1 1.12 4.4 1.8 7.9 2.4 9.4 2.2 4.6 1.63 8.4 1.3 7.6 1.5 8.9 2.3 5.9 1.5
Y N N 1 14.4 2.6 4.4 1.8 4.7 0.8 4.1 0.72 8.1 3.1 0.5 0.1 2.8 1.2 2.0 0.73 10.5 4.3 1.3 0.3 3.7 0.7 2.7 0.4
Y N Y 1 16.2 3.6 1.7 0.5 1.9 0.9 1.7 0.42 13.8 2.6 0.8 0.4 1.8 0.5 1.2 0.23 11.7 2.3 2.2 0.4 1.7 0.2 4.3 0.8
N Y N 1 7.4 2.4 9.9 3.1 11.2 2.6 5.1 1.42 9.6 2.3 14.2 2.7 18.9 3.5 6.2 1.23 8.1 2.1 17.0 4.4 10.8 3.2 4.0 1.2
N Y Y 1 12.0 2.6 9.6 2.2 12.3 2.7 4.7 1.22 4.4 1.2 6.4 2.1 11.3 2.0 8.7 2.23 3.8 1.2 3.0 1.2 10.6 2.8 5.7 1.6
Y Y N 1 10.3 1.8 2.1 1.1 2.4 1.0 3.3 0.82 14.0 2.4 0.7 0.2 1.8 0.3 1.7 0.43 15.5 2.9 1.5 0.3 4.0 0.8 3.5 0.6
Y Y Y 1 12.6 2.8 0.5 0.1 1.4 0.7 1.6 0.72 15.2 2.4 0.8 0.2 1.0 0.2 1.9 1.03 12.7 1.8 0.6 0.2 2.0 1.0 1.4 0.5
a Values are plot mean and within-plot standard error (n � 10). 1 Mg/ha � 1 metric ton/ha � 0.45 English ton/acre.
2004 were 11.9 1.0, 9.8 1.3, and 9.5 1.6 Mg/ha for the three blocks (n � 4) (Table 3). Initial fuelheights were 0.55 0.02, 0.47 0.04, and 0.57 0.04 m. The initial fuel loadings and fuel heights didnot differ significantly between blocks. Moisture con-tent of the samples averaged 52 2% across the threeblocks. The fuel moisture samples were a compositeof litter, standing live herbaceous material, and deadfountaingrass.
Prescribed Fire Behavior
From 1 September 2003 to 25 January 2004, 21cm of rain were recorded by the RAWS, resulting infountaingrass that was vigorous, in flower, and verygreen in color at the time of the burns. While fuelmoistures measured to estimate fuel loading averaged52%, the fuel moisture of the predominantly live grasswas �270% (Table 4). Dead fuel moisture content fellin the 12–16% range during the prescribed burns.
The plots were burned over an 8-d period from 27
January to 4 February 2004. The first plot treated wasdifficult to burn. Conditions, although in prescription,were marginally sufficient for burning, and a large per-centage of the plot had to be ignited (Table 4). Mul-tiple strip headfires were lit on a very close spacing(5–10 m between strips). This plot was the first pre-scribed burn conducted by the Hawai‘i Division ofForestry and Wildlife on Hawai‘i, so due caution wastaken to minimize escape. The observed spread ratesfor this plot ranged from 0.7 to 2.3 m/min, and ap-proximately 40% of the fuel was consumed (Table 5).As Division of Forestry and Wildlife personnel’s ex-perience increased, more aggressive burning occurred,resulting in greater spread rates up to 16.8 m/min,flame heights of 2.7 to 3.7 m, and fuel consumptionup to 90%.
Impact of Treatments on Fuel Loading and FuelHeight
Fuel loadings and heights were estimated follow-ing the application of the final treatment (March toMay 2004) and 6 and 13 mo after the prescribed burns(August 2004, March 2005) (Table 3). The repeated-measures analysis of variance indicated that only theburn treatment and the burn � time interaction signif-icantly affected fuel loading (Table 6; significant if P� 0.05). The time effect was also significant, indicat-ing that the average loading on the site (average of allplots) differed over the four measurement times. Thesignificant burn � time interaction indicated that thechange in fuel loading over time differed between the
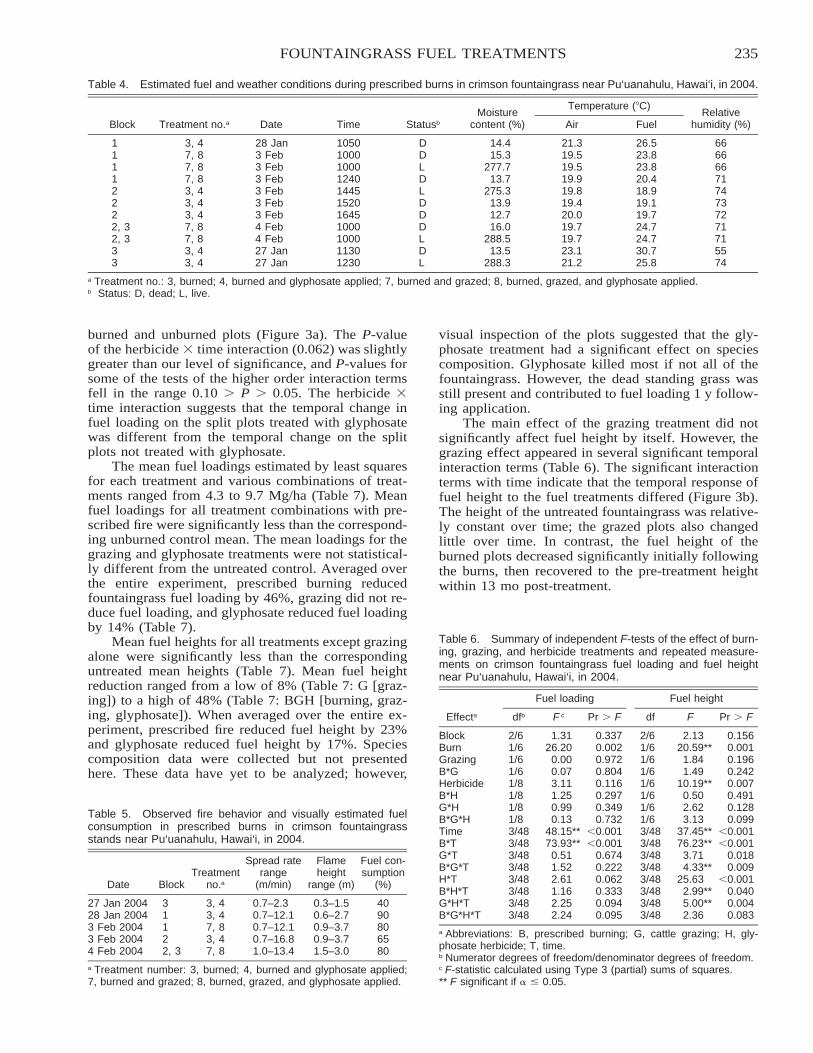
235FOUNTAINGRASS FUEL TREATMENTS
Table 4. Estimated fuel and weather conditions during prescribed burns in crimson fountaingrass near Pu‘uanahulu, Hawai‘i, in 2004.
Block Treatment no.a Date Time Statusb
Moisturecontent (%)
Temperature (�C)
Air FuelRelative
humidity (%)
1 3, 4 28 Jan 1050 D 14.4 21.3 26.5 661 7, 8 3 Feb 1000 D 15.3 19.5 23.8 661 7, 8 3 Feb 1000 L 277.7 19.5 23.8 661 7, 8 3 Feb 1240 D 13.7 19.9 20.4 712 3, 4 3 Feb 1445 L 275.3 19.8 18.9 742 3, 4 3 Feb 1520 D 13.9 19.4 19.1 732 3, 4 3 Feb 1645 D 12.7 20.0 19.7 722, 3 7, 8 4 Feb 1000 D 16.0 19.7 24.7 712, 3 7, 8 4 Feb 1000 L 288.5 19.7 24.7 713 3, 4 27 Jan 1130 D 13.5 23.1 30.7 553 3, 4 27 Jan 1230 L 288.3 21.2 25.8 74
a Treatment no.: 3, burned; 4, burned and glyphosate applied; 7, burned and grazed; 8, burned, grazed, and glyphosate applied.b Status: D, dead; L, live.
Table 5. Observed fire behavior and visually estimated fuelconsumption in prescribed burns in crimson fountaingrassstands near Pu‘uanahulu, Hawai‘i, in 2004.
Date BlockTreatment
no.a
Spread raterange
(m/min)
Flameheight
range (m)
Fuel con-sumption
(%)
27 Jan 2004 3 3, 4 0.7–2.3 0.3–1.5 4028 Jan 2004 1 3, 4 0.7–12.1 0.6–2.7 903 Feb 2004 1 7, 8 0.7–12.1 0.9–3.7 803 Feb 2004 2 3, 4 0.7–16.8 0.9–3.7 654 Feb 2004 2, 3 7, 8 1.0–13.4 1.5–3.0 80
a Treatment number: 3, burned; 4, burned and glyphosate applied;7, burned and grazed; 8, burned, grazed, and glyphosate applied.
Table 6. Summary of independent F-tests of the effect of burn-ing, grazing, and herbicide treatments and repeated measure-ments on crimson fountaingrass fuel loading and fuel heightnear Pu‘uanahulu, Hawai‘i, in 2004.
Effecta
Fuel loading
dfb F c Pr � F
Fuel height
df F Pr � F
Block 2/6 1.31 0.337 2/6 2.13 0.156Burn 1/6 26.20 0.002 1/6 20.59** 0.001Grazing 1/6 0.00 0.972 1/6 1.84 0.196B*G 1/6 0.07 0.804 1/6 1.49 0.242Herbicide 1/8 3.11 0.116 1/6 10.19** 0.007B*H 1/8 1.25 0.297 1/6 0.50 0.491G*H 1/8 0.99 0.349 1/6 2.62 0.128B*G*H 1/8 0.13 0.732 1/6 3.13 0.099Time 3/48 48.15** �0.001 3/48 37.45** �0.001B*T 3/48 73.93** �0.001 3/48 76.23** �0.001G*T 3/48 0.51 0.674 3/48 3.71 0.018B*G*T 3/48 1.52 0.222 3/48 4.33** 0.009H*T 3/48 2.61 0.062 3/48 25.63 �0.001B*H*T 3/48 1.16 0.333 3/48 2.99** 0.040G*H*T 3/48 2.25 0.094 3/48 5.00** 0.004B*G*H*T 3/48 2.24 0.095 3/48 2.36 0.083
a Abbreviations: B, prescribed burning; G, cattle grazing; H, gly-phosate herbicide; T, time.b Numerator degrees of freedom/denominator degrees of freedom.c F-statistic calculated using Type 3 (partial) sums of squares.** F significant if � � 0.05.
burned and unburned plots (Figure 3a). The P-valueof the herbicide � time interaction (0.062) was slightlygreater than our level of significance, and P-values forsome of the tests of the higher order interaction termsfell in the range 0.10 � P � 0.05. The herbicide �time interaction suggests that the temporal change infuel loading on the split plots treated with glyphosatewas different from the temporal change on the splitplots not treated with glyphosate.
The mean fuel loadings estimated by least squaresfor each treatment and various combinations of treat-ments ranged from 4.3 to 9.7 Mg/ha (Table 7). Meanfuel loadings for all treatment combinations with pre-scribed fire were significantly less than the correspond-ing unburned control mean. The mean loadings for thegrazing and glyphosate treatments were not statistical-ly different from the untreated control. Averaged overthe entire experiment, prescribed burning reducedfountaingrass fuel loading by 46%, grazing did not re-duce fuel loading, and glyphosate reduced fuel loadingby 14% (Table 7).
Mean fuel heights for all treatments except grazingalone were significantly less than the correspondinguntreated mean heights (Table 7). Mean fuel heightreduction ranged from a low of 8% (Table 7: G [graz-ing]) to a high of 48% (Table 7: BGH [burning, graz-ing, glyphosate]). When averaged over the entire ex-periment, prescribed fire reduced fuel height by 23%and glyphosate reduced fuel height by 17%. Speciescomposition data were collected but not presentedhere. These data have yet to be analyzed; however,
visual inspection of the plots suggested that the gly-phosate treatment had a significant effect on speciescomposition. Glyphosate killed most if not all of thefountaingrass. However, the dead standing grass wasstill present and contributed to fuel loading 1 y follow-ing application.
The main effect of the grazing treatment did notsignificantly affect fuel height by itself. However, thegrazing effect appeared in several significant temporalinteraction terms (Table 6). The significant interactionterms with time indicate that the temporal response offuel height to the fuel treatments differed (Figure 3b).The height of the untreated fountaingrass was relative-ly constant over time; the grazed plots also changedlittle over time. In contrast, the fuel height of theburned plots decreased significantly initially followingthe burns, then recovered to the pre-treatment heightwithin 13 mo post-treatment.
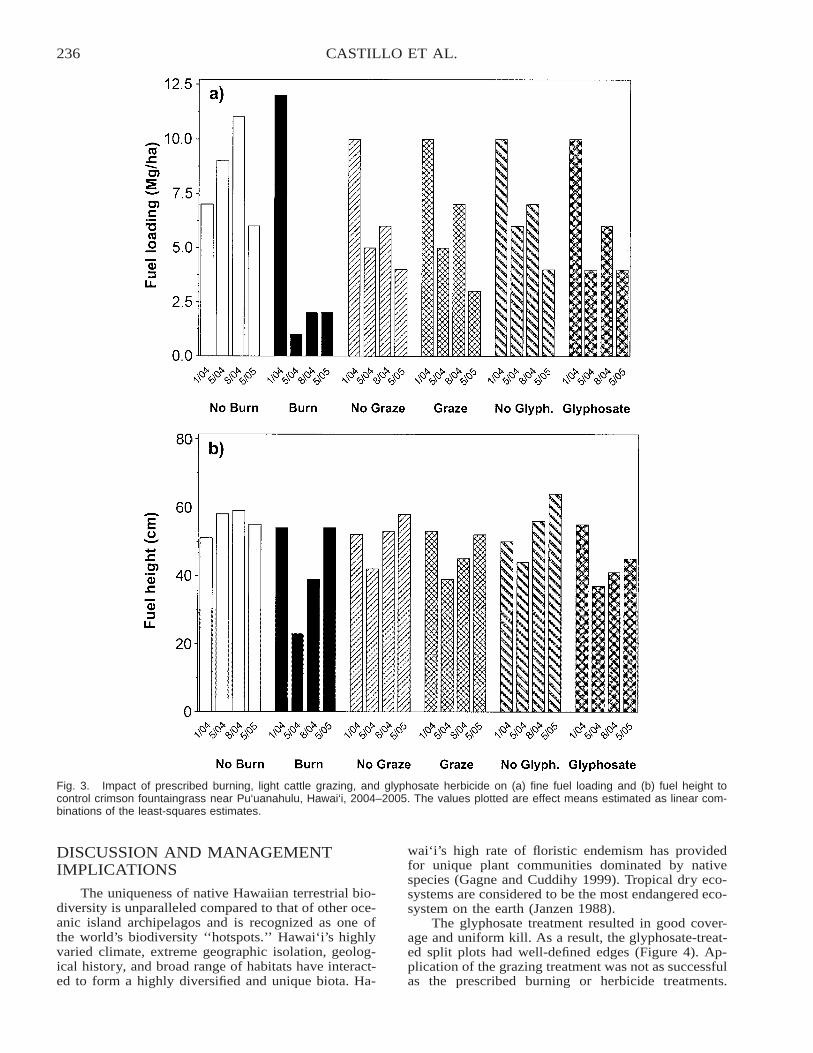
236 CASTILLO ET AL.
Fig. 3. Impact of prescribed burning, light cattle grazing, and glyphosate herbicide on (a) fine fuel loading and (b) fuel height tocontrol crimson fountaingrass near Pu‘uanahulu, Hawai‘i, 2004–2005. The values plotted are effect means estimated as linear com-binations of the least-squares estimates.
DISCUSSION AND MANAGEMENTIMPLICATIONS
The uniqueness of native Hawaiian terrestrial bio-diversity is unparalleled compared to that of other oce-anic island archipelagos and is recognized as one ofthe world’s biodiversity ‘‘hotspots.’’ Hawai‘i’s highlyvaried climate, extreme geographic isolation, geolog-ical history, and broad range of habitats have interact-ed to form a highly diversified and unique biota. Ha-
wai‘i’s high rate of floristic endemism has providedfor unique plant communities dominated by nativespecies (Gagne and Cuddihy 1999). Tropical dry eco-systems are considered to be the most endangered eco-system on the earth (Janzen 1988).
The glyphosate treatment resulted in good cover-age and uniform kill. As a result, the glyphosate-treat-ed split plots had well-defined edges (Figure 4). Ap-plication of the grazing treatment was not as successfulas the prescribed burning or herbicide treatments.
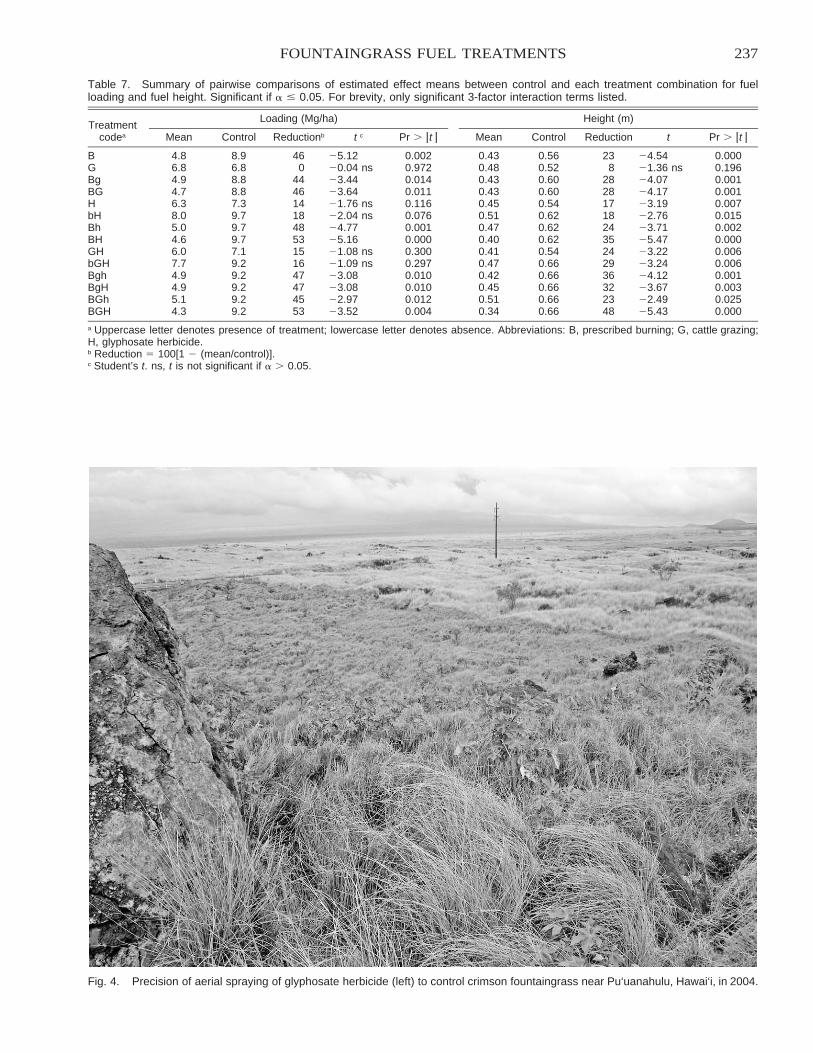
237FOUNTAINGRASS FUEL TREATMENTS
Table 7. Summary of pairwise comparisons of estimated effect means between control and each treatment combination for fuelloading and fuel height. Significant if � � 0.05. For brevity, only significant 3-factor interaction terms listed.
Treatmentcodea
Loading (Mg/ha)
Mean Control Reductionb t c Pr � �t �
Height (m)
Mean Control Reduction t Pr � �t �
B 4.8 8.9 46 �5.12 0.002 0.43 0.56 23 �4.54 0.000G 6.8 6.8 0 �0.04 ns 0.972 0.48 0.52 8 �1.36 ns 0.196Bg 4.9 8.8 44 �3.44 0.014 0.43 0.60 28 �4.07 0.001BG 4.7 8.8 46 �3.64 0.011 0.43 0.60 28 �4.17 0.001H 6.3 7.3 14 �1.76 ns 0.116 0.45 0.54 17 �3.19 0.007bH 8.0 9.7 18 �2.04 ns 0.076 0.51 0.62 18 �2.76 0.015Bh 5.0 9.7 48 �4.77 0.001 0.47 0.62 24 �3.71 0.002BH 4.6 9.7 53 �5.16 0.000 0.40 0.62 35 �5.47 0.000GH 6.0 7.1 15 �1.08 ns 0.300 0.41 0.54 24 �3.22 0.006bGH 7.7 9.2 16 �1.09 ns 0.297 0.47 0.66 29 �3.24 0.006Bgh 4.9 9.2 47 �3.08 0.010 0.42 0.66 36 �4.12 0.001BgH 4.9 9.2 47 �3.08 0.010 0.45 0.66 32 �3.67 0.003BGh 5.1 9.2 45 �2.97 0.012 0.51 0.66 23 �2.49 0.025BGH 4.3 9.2 53 �3.52 0.004 0.34 0.66 48 �5.43 0.000
a Uppercase letter denotes presence of treatment; lowercase letter denotes absence. Abbreviations: B, prescribed burning; G, cattle grazing;H, glyphosate herbicide.b Reduction � 100[1 � (mean/control)].c Student’s t. ns, t is not significant if � � 0.05.
Fig. 4. Precision of aerial spraying of glyphosate herbicide (left) to control crimson fountaingrass near Pu‘uanahulu, Hawai‘i, in 2004.
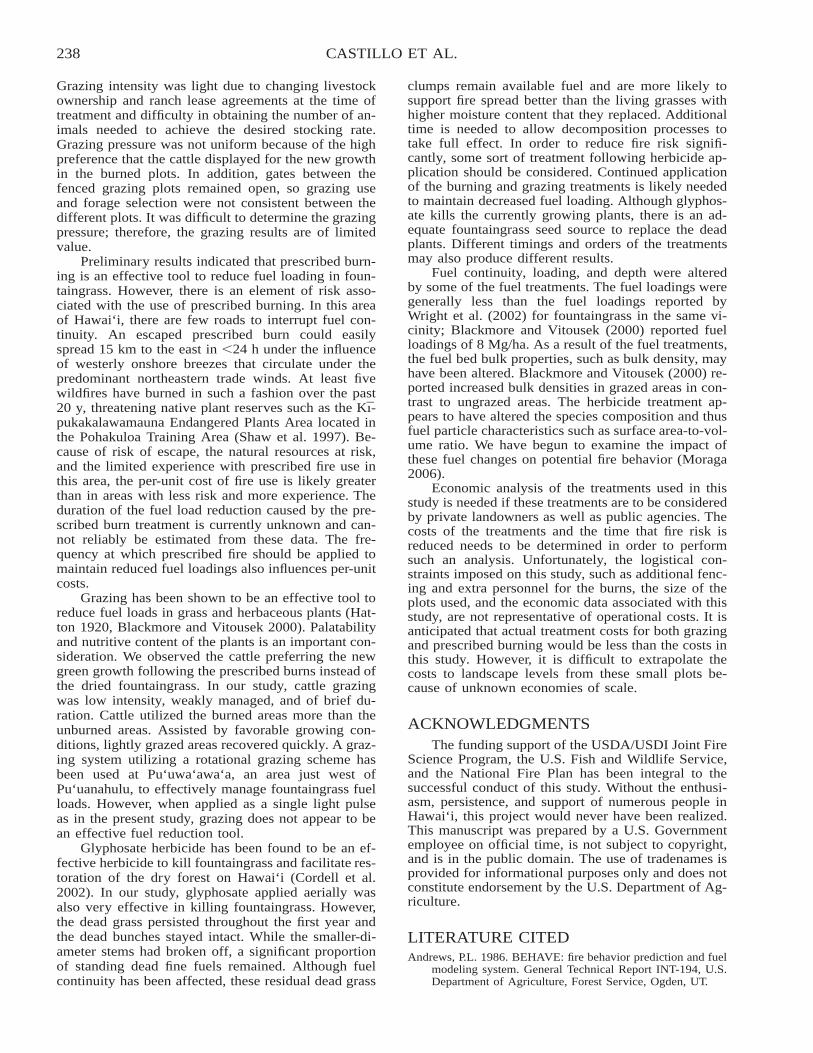
238 CASTILLO ET AL.
Grazing intensity was light due to changing livestockownership and ranch lease agreements at the time oftreatment and difficulty in obtaining the number of an-imals needed to achieve the desired stocking rate.Grazing pressure was not uniform because of the highpreference that the cattle displayed for the new growthin the burned plots. In addition, gates between thefenced grazing plots remained open, so grazing useand forage selection were not consistent between thedifferent plots. It was difficult to determine the grazingpressure; therefore, the grazing results are of limitedvalue.
Preliminary results indicated that prescribed burn-ing is an effective tool to reduce fuel loading in foun-taingrass. However, there is an element of risk asso-ciated with the use of prescribed burning. In this areaof Hawai‘i, there are few roads to interrupt fuel con-tinuity. An escaped prescribed burn could easilyspread 15 km to the east in �24 h under the influenceof westerly onshore breezes that circulate under thepredominant northeastern trade winds. At least fivewildfires have burned in such a fashion over the past20 y, threatening native plant reserves such as the Kı-pukakalawamauna Endangered Plants Area located inthe Pohakuloa Training Area (Shaw et al. 1997). Be-cause of risk of escape, the natural resources at risk,and the limited experience with prescribed fire use inthis area, the per-unit cost of fire use is likely greaterthan in areas with less risk and more experience. Theduration of the fuel load reduction caused by the pre-scribed burn treatment is currently unknown and can-not reliably be estimated from these data. The fre-quency at which prescribed fire should be applied tomaintain reduced fuel loadings also influences per-unitcosts.
Grazing has been shown to be an effective tool toreduce fuel loads in grass and herbaceous plants (Hat-ton 1920, Blackmore and Vitousek 2000). Palatabilityand nutritive content of the plants is an important con-sideration. We observed the cattle preferring the newgreen growth following the prescribed burns instead ofthe dried fountaingrass. In our study, cattle grazingwas low intensity, weakly managed, and of brief du-ration. Cattle utilized the burned areas more than theunburned areas. Assisted by favorable growing con-ditions, lightly grazed areas recovered quickly. A graz-ing system utilizing a rotational grazing scheme hasbeen used at Pu‘uwa‘awa‘a, an area just west ofPu‘uanahulu, to effectively manage fountaingrass fuelloads. However, when applied as a single light pulseas in the present study, grazing does not appear to bean effective fuel reduction tool.
Glyphosate herbicide has been found to be an ef-fective herbicide to kill fountaingrass and facilitate res-toration of the dry forest on Hawai‘i (Cordell et al.2002). In our study, glyphosate applied aerially wasalso very effective in killing fountaingrass. However,the dead grass persisted throughout the first year andthe dead bunches stayed intact. While the smaller-di-ameter stems had broken off, a significant proportionof standing dead fine fuels remained. Although fuelcontinuity has been affected, these residual dead grass
clumps remain available fuel and are more likely tosupport fire spread better than the living grasses withhigher moisture content that they replaced. Additionaltime is needed to allow decomposition processes totake full effect. In order to reduce fire risk signifi-cantly, some sort of treatment following herbicide ap-plication should be considered. Continued applicationof the burning and grazing treatments is likely neededto maintain decreased fuel loading. Although glyphos-ate kills the currently growing plants, there is an ad-equate fountaingrass seed source to replace the deadplants. Different timings and orders of the treatmentsmay also produce different results.
Fuel continuity, loading, and depth were alteredby some of the fuel treatments. The fuel loadings weregenerally less than the fuel loadings reported byWright et al. (2002) for fountaingrass in the same vi-cinity; Blackmore and Vitousek (2000) reported fuelloadings of 8 Mg/ha. As a result of the fuel treatments,the fuel bed bulk properties, such as bulk density, mayhave been altered. Blackmore and Vitousek (2000) re-ported increased bulk densities in grazed areas in con-trast to ungrazed areas. The herbicide treatment ap-pears to have altered the species composition and thusfuel particle characteristics such as surface area-to-vol-ume ratio. We have begun to examine the impact ofthese fuel changes on potential fire behavior (Moraga2006).
Economic analysis of the treatments used in thisstudy is needed if these treatments are to be consideredby private landowners as well as public agencies. Thecosts of the treatments and the time that fire risk isreduced needs to be determined in order to performsuch an analysis. Unfortunately, the logistical con-straints imposed on this study, such as additional fenc-ing and extra personnel for the burns, the size of theplots used, and the economic data associated with thisstudy, are not representative of operational costs. It isanticipated that actual treatment costs for both grazingand prescribed burning would be less than the costs inthis study. However, it is difficult to extrapolate thecosts to landscape levels from these small plots be-cause of unknown economies of scale.
ACKNOWLEDGMENTSThe funding support of the USDA/USDI Joint Fire
Science Program, the U.S. Fish and Wildlife Service,and the National Fire Plan has been integral to thesuccessful conduct of this study. Without the enthusi-asm, persistence, and support of numerous people inHawai‘i, this project would never have been realized.This manuscript was prepared by a U.S. Governmentemployee on official time, is not subject to copyright,and is in the public domain. The use of tradenames isprovided for informational purposes only and does notconstitute endorsement by the U.S. Department of Ag-riculture.
LITERATURE CITEDAndrews, P.L. 1986. BEHAVE: fire behavior prediction and fuel
modeling system. General Technical Report INT-194, U.S.Department of Agriculture, Forest Service, Ogden, UT.
239FOUNTAINGRASS FUEL TREATMENTS
Blackmore, M., and P.M. Vitousek. 2000. Cattle grazing, forestloss, and fuel loading in a dry forest ecosystem at Pu‘uWa‘aWa‘a Ranch, Hawai‘i. Biotropica 32:625–632.
Brooks, M.L., and D.A. Pyke. 2001. Invasive plants and fire inthe deserts of North America. Pages 1–14 in K.E.M. Galleyand T.P Wilson (eds.). Proceedings of the Invasive SpeciesWorkshop: the role of fire in the control and spread of in-vasive species. Miscellaneous Publication No. 11, Tall Tim-bers Research Station, Tallahassee, FL.
Cabin, R.J., S.G. Weller, D.H. Lorence, S. Cordell, L.J. Hadway,R. Montgomery, D. Goo, and A. Urikami. 2002. Effects oflight, alien grass, and native species additions on Hawaiiandry forest restoration. Ecological Applications 12:1595–1610.
Castillo, J.M. 1997. Control of Pennisetum setaceum (Forssk.)Chiov. in native Hawaiian dry upland ecosystems. M.S.Thesis, Colorado State University, Fort Collins.
Cordell, S., R.J. Cabin, S.G. Weller, and D.H. Lorence. 2002.Simple and cost-effective methods control fountaingrass indry forests (Hawaii). Ecological Restoration 20:139–140.
Cuddihy, L.W., and C.P. Stone. 1990. Alteration of the nativeHawaiian vegetation: effects of humans, their activities andintroductions. University of Hawai‘i Press, Honolulu.
D’Antonio, C.M., and P.M. Vitousek. 1992. Biological invasions,the grass fire cycle and global change. Annual Review ofEcology and Systematics 23:63–87.
Ford, L.D. 2005. Puuanahulu fuels management study: site prep-aration and fuels and vegetation sampling 2005 annual sta-tus report: fuel load and vegetation response. Unpublishedreport submitted to U.S. Fish and Wildlife Service, Port-land, OR.
Freifelder, R.R., P.M. Vitousek, and C.M. D’Antonio. 1998. Mi-croclimate change and effect on fire following forest-grassconversion in seasonally dry tropical woodland. Biotropica30:286–297.
Gagne, W.C., and L.W. Cuddihy. 1999. Vegetation. Pages 45–114 in W.L. Wagner, D.R. Herbst, and S.H. Sohmer. Manualof the flowering plants of Hawai‘i. Revised edition. BishopMuseum Special Publication, University of Hawai‘i Press,Honolulu.
Gavenda, R., C. Smith, and N. Vollrath. 1998. Soils. Pages 92–96 in S.P. Juvik and J.O. Juvik (eds.). Atlas of Hawai‘i.Third edition. University of Hawai‘i Press, Honolulu.
Giambelluca, T.W., and T.A. Schroeder. 1998. Climate. Pages49–59 in S.P. Juvik and J.O. Juvik (eds.). Atlas of Hawai‘i.Third edition. University of Hawai‘i Press, Honolulu.
Hatton, J.H. 1920. Live-stock grazing as a factor in fire protec-tion on the national forests. U.S. Department of AgricultureDepartmental Circular 134, Washington, D.C.
Hughes, R.F., P.M. Vitousek, and T. Tunison. 1991. Alien grassinvasion and fire in the seasonal submontane zone of Ha-wai‘i. Ecology 72:743–746.
Janzen, D.H. 1988. Tropical dry forests, the most endangeredmajor tropical ecosystem. Pages 130–144 in E.O. Wilson(ed.). Biodiversity. National Academy Press, Washington,D.C.
Loope, L.L. 2000. Vegetation of the Hawaiian Islands. Pages661–688 in M.G. Barbour and W.D. Billings (eds.). NorthAmerican terrestrial vegetation. Second edition. CambridgeUniversity Press, Cambridge, United Kingdom.
Maly, K., and B.A. Wilcox. 2000. A short history of cattle andrange management in Hawai‘i. Rangelands 22(5):21–23.
McDonald, I.A., D. Graber, S. DeBenedetti, R. Groves, and W.Fuentes. 1988. Introduced species into nature reserves inMediterranean-type climatic regions of the world. Biologi-cal Conservation 44:37–66.
Moraga, R. 2006. Draft final report on fuel model methodologyand results—Puu Anahulu fuels management study. Unpub-lished report prepared for the U.S. Fish and Wildlife Ser-vice, Anchor Point Group, Boulder, CO.
Motooka, P. 2000. Summaries of herbicide trials for pasture,range, and non-cropland weed control—1999. PublicationWC-5, Cooperative Extension Service, College of TropicalAgriculture and Human Resources, University of Hawai‘iat Manoa. http://www.ctahr.hawaii.edu/oc/freepubs/pdf/WC-5.pdf [accessed 16 Aug 2006].
National Pesticide Information Retrieval System. 2006. PurdueUniversity, West Lafayette, IN. http://state.ceris.purdue.edu/ [accessed 16 Aug 2006].
Shaw, R.B., J.M. Castillo, and R.D. Laven. 1997. Impact ofwildfire on vegetation and rare plants within the KipukaKalawamauna Endangered Plant Habitat Area, PohohakuloaTraining Area, Hawaii. Pages 253–264 in J.M. Greenlee(ed.). Proceedings of the first conference on fire effects onrare and endangered species and habitats. International As-sociation of Wildland Fire, Coeur d’Alene, ID.
Smith, C.W., and T. Tunison. 1992. Fire and alien plants in Ha-wai‘i: research and management implications for nativeecosystems. Pages 394–408 in C.P. Stone, C.W. Smith, andT. Tunison (eds.). Alien plant invasion in Hawai‘i: manage-ment and research in native ecosystems. University of Hawai‘iPress, Honolulu. http://www.hear.org/books/apineh1992/pdfs/apineh1992.pdf [accessed 7 Sep 2006].
Tunison, J.T. 1992. Fountain grass control in Hawai‘i VolcanoesNational Park: management considerations and strategies.Pages 376–393 in C.P. Stone, C.W. Smith, and T. Tunison(eds.). Alien plant invasion in Hawai‘i: managementand research in native ecosystems. University of Hawai‘iPress, Honolulu. http://www.hear.org/books/apineh1992/pdfs/apineh1992.pdf [accessed 7 Sep 2006].
USDA [United States Department of Agriculture]. 2005. Pen-nisetum setaceum. In The PLANTS database. United StatesDepartment of Agriculture, Natural Resources ConservationService, National Plant Data Center, Baton Rouge, LA.http://plants.usda.gov/ [accessed 7 Sep 2006].
Vogl, R.J. 1969. The role of fire in the evolution of the Hawaiianflora and vegetation. Proceedings of the Annual Tall Tim-bers Fire Ecology Conference 9:5–60.
Wright, C.S., R.D. Ottmar, R.E. Vihnanek, and D.R. Weise.2002. Stereo photo series for quantifying natural fuels:grassland, shrubland, woodland, and forest types in Hawaii.U.S. Department of Agriculture, Forest Service, GeneralTechnical Report PNW-GTR-545, Portland, OR.
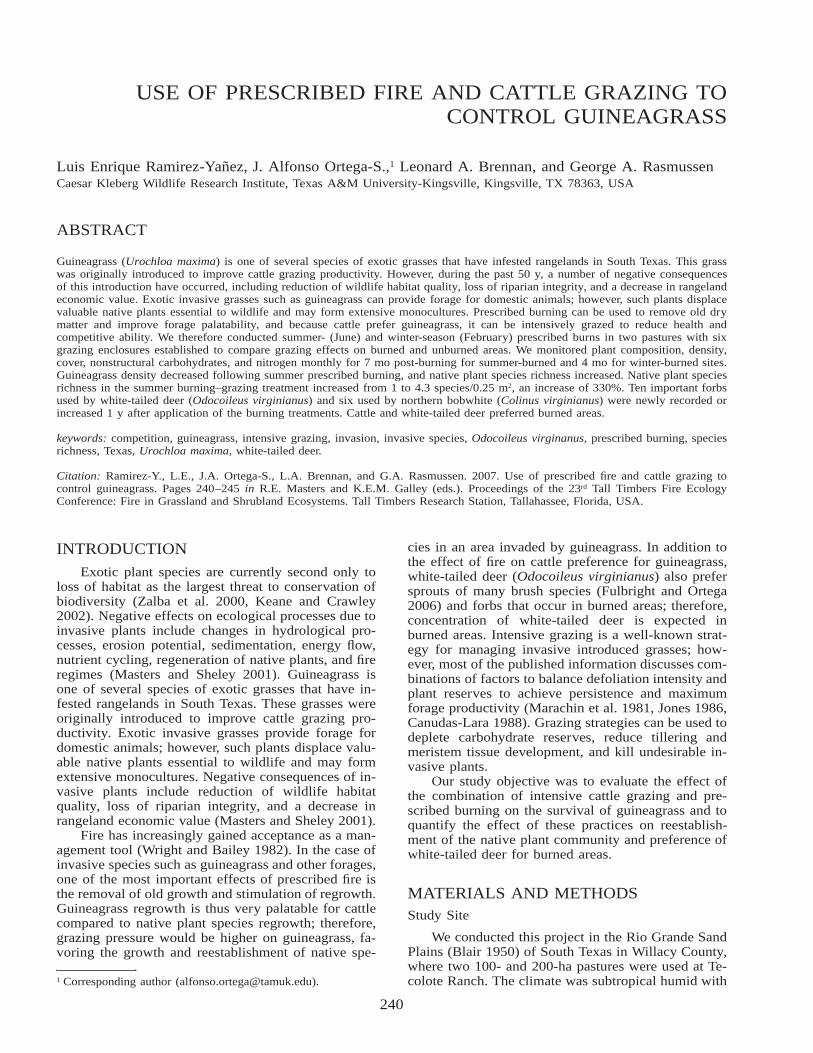
240
USE OF PRESCRIBED FIRE AND CATTLE GRAZING TOCONTROL GUINEAGRASS
Luis Enrique Ramirez-Yanez, J. Alfonso Ortega-S.,1 Leonard A. Brennan, and George A. RasmussenCaesar Kleberg Wildlife Research Institute, Texas A&M University-Kingsville, Kingsville, TX 78363, USA
ABSTRACT
Guineagrass (Urochloa maxima) is one of several species of exotic grasses that have infested rangelands in South Texas. This grasswas originally introduced to improve cattle grazing productivity. However, during the past 50 y, a number of negative consequencesof this introduction have occurred, including reduction of wildlife habitat quality, loss of riparian integrity, and a decrease in rangelandeconomic value. Exotic invasive grasses such as guineagrass can provide forage for domestic animals; however, such plants displacevaluable native plants essential to wildlife and may form extensive monocultures. Prescribed burning can be used to remove old drymatter and improve forage palatability, and because cattle prefer guineagrass, it can be intensively grazed to reduce health andcompetitive ability. We therefore conducted summer- (June) and winter-season (February) prescribed burns in two pastures with sixgrazing enclosures established to compare grazing effects on burned and unburned areas. We monitored plant composition, density,cover, nonstructural carbohydrates, and nitrogen monthly for 7 mo post-burning for summer-burned and 4 mo for winter-burned sites.Guineagrass density decreased following summer prescribed burning, and native plant species richness increased. Native plant speciesrichness in the summer burning–grazing treatment increased from 1 to 4.3 species/0.25 m2, an increase of 330%. Ten important forbsused by white-tailed deer (Odocoileus virginianus) and six used by northern bobwhite (Colinus virginianus) were newly recorded orincreased 1 y after application of the burning treatments. Cattle and white-tailed deer preferred burned areas.
keywords: competition, guineagrass, intensive grazing, invasion, invasive species, Odocoileus virginanus, prescribed burning, speciesrichness, Texas, Urochloa maxima, white-tailed deer.
Citation: Ramirez-Y., L.E., J.A. Ortega-S., L.A. Brennan, and G.A. Rasmussen. 2007. Use of prescribed fire and cattle grazing tocontrol guineagrass. Pages 240–245 in R.E. Masters and K.E.M. Galley (eds.). Proceedings of the 23rd Tall Timbers Fire EcologyConference: Fire in Grassland and Shrubland Ecosystems. Tall Timbers Research Station, Tallahassee, Florida, USA.
INTRODUCTIONExotic plant species are currently second only to
loss of habitat as the largest threat to conservation ofbiodiversity (Zalba et al. 2000, Keane and Crawley2002). Negative effects on ecological processes due toinvasive plants include changes in hydrological pro-cesses, erosion potential, sedimentation, energy flow,nutrient cycling, regeneration of native plants, and fireregimes (Masters and Sheley 2001). Guineagrass isone of several species of exotic grasses that have in-fested rangelands in South Texas. These grasses wereoriginally introduced to improve cattle grazing pro-ductivity. Exotic invasive grasses provide forage fordomestic animals; however, such plants displace valu-able native plants essential to wildlife and may formextensive monocultures. Negative consequences of in-vasive plants include reduction of wildlife habitatquality, loss of riparian integrity, and a decrease inrangeland economic value (Masters and Sheley 2001).
Fire has increasingly gained acceptance as a man-agement tool (Wright and Bailey 1982). In the case ofinvasive species such as guineagrass and other forages,one of the most important effects of prescribed fire isthe removal of old growth and stimulation of regrowth.Guineagrass regrowth is thus very palatable for cattlecompared to native plant species regrowth; therefore,grazing pressure would be higher on guineagrass, fa-voring the growth and reestablishment of native spe-
1 Corresponding author ([email protected]).
cies in an area invaded by guineagrass. In addition tothe effect of fire on cattle preference for guineagrass,white-tailed deer (Odocoileus virginianus) also prefersprouts of many brush species (Fulbright and Ortega2006) and forbs that occur in burned areas; therefore,concentration of white-tailed deer is expected inburned areas. Intensive grazing is a well-known strat-egy for managing invasive introduced grasses; how-ever, most of the published information discusses com-binations of factors to balance defoliation intensity andplant reserves to achieve persistence and maximumforage productivity (Marachin et al. 1981, Jones 1986,Canudas-Lara 1988). Grazing strategies can be used todeplete carbohydrate reserves, reduce tillering andmeristem tissue development, and kill undesirable in-vasive plants.
Our study objective was to evaluate the effect ofthe combination of intensive cattle grazing and pre-scribed burning on the survival of guineagrass and toquantify the effect of these practices on reestablish-ment of the native plant community and preference ofwhite-tailed deer for burned areas.
MATERIALS AND METHODSStudy Site
We conducted this project in the Rio Grande SandPlains (Blair 1950) of South Texas in Willacy County,where two 100- and 200-ha pastures were used at Te-colote Ranch. The climate was subtropical humid with
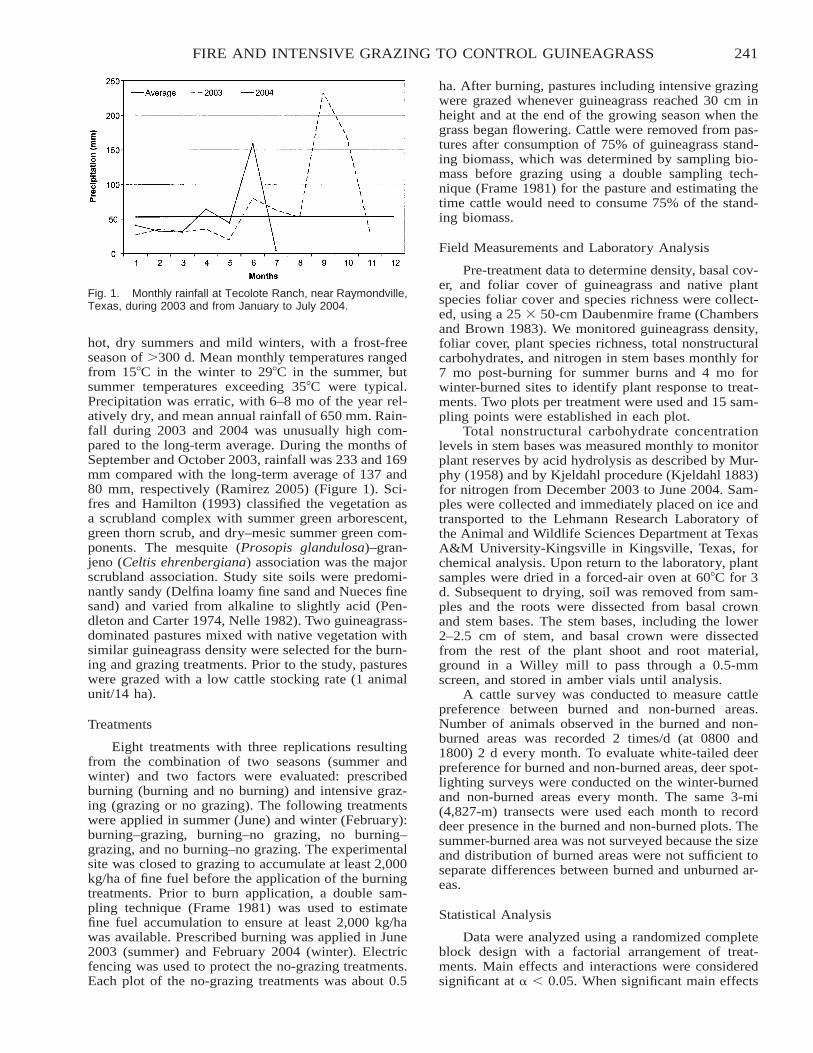
241FIRE AND INTENSIVE GRAZING TO CONTROL GUINEAGRASS
Fig. 1. Monthly rainfall at Tecolote Ranch, near Raymondville,Texas, during 2003 and from January to July 2004.
hot, dry summers and mild winters, with a frost-freeseason of �300 d. Mean monthly temperatures rangedfrom 15�C in the winter to 29�C in the summer, butsummer temperatures exceeding 35�C were typical.Precipitation was erratic, with 6–8 mo of the year rel-atively dry, and mean annual rainfall of 650 mm. Rain-fall during 2003 and 2004 was unusually high com-pared to the long-term average. During the months ofSeptember and October 2003, rainfall was 233 and 169mm compared with the long-term average of 137 and80 mm, respectively (Ramirez 2005) (Figure 1). Sci-fres and Hamilton (1993) classified the vegetation asa scrubland complex with summer green arborescent,green thorn scrub, and dry–mesic summer green com-ponents. The mesquite (Prosopis glandulosa)–gran-jeno (Celtis ehrenbergiana) association was the majorscrubland association. Study site soils were predomi-nantly sandy (Delfina loamy fine sand and Nueces finesand) and varied from alkaline to slightly acid (Pen-dleton and Carter 1974, Nelle 1982). Two guineagrass-dominated pastures mixed with native vegetation withsimilar guineagrass density were selected for the burn-ing and grazing treatments. Prior to the study, pastureswere grazed with a low cattle stocking rate (1 animalunit/14 ha).
Treatments
Eight treatments with three replications resultingfrom the combination of two seasons (summer andwinter) and two factors were evaluated: prescribedburning (burning and no burning) and intensive graz-ing (grazing or no grazing). The following treatmentswere applied in summer (June) and winter (February):burning–grazing, burning–no grazing, no burning–grazing, and no burning–no grazing. The experimentalsite was closed to grazing to accumulate at least 2,000kg/ha of fine fuel before the application of the burningtreatments. Prior to burn application, a double sam-pling technique (Frame 1981) was used to estimatefine fuel accumulation to ensure at least 2,000 kg/hawas available. Prescribed burning was applied in June2003 (summer) and February 2004 (winter). Electricfencing was used to protect the no-grazing treatments.Each plot of the no-grazing treatments was about 0.5
ha. After burning, pastures including intensive grazingwere grazed whenever guineagrass reached 30 cm inheight and at the end of the growing season when thegrass began flowering. Cattle were removed from pas-tures after consumption of 75% of guineagrass stand-ing biomass, which was determined by sampling bio-mass before grazing using a double sampling tech-nique (Frame 1981) for the pasture and estimating thetime cattle would need to consume 75% of the stand-ing biomass.
Field Measurements and Laboratory Analysis
Pre-treatment data to determine density, basal cov-er, and foliar cover of guineagrass and native plantspecies foliar cover and species richness were collect-ed, using a 25 � 50-cm Daubenmire frame (Chambersand Brown 1983). We monitored guineagrass density,foliar cover, plant species richness, total nonstructuralcarbohydrates, and nitrogen in stem bases monthly for7 mo post-burning for summer burns and 4 mo forwinter-burned sites to identify plant response to treat-ments. Two plots per treatment were used and 15 sam-pling points were established in each plot.
Total nonstructural carbohydrate concentrationlevels in stem bases was measured monthly to monitorplant reserves by acid hydrolysis as described by Mur-phy (1958) and by Kjeldahl procedure (Kjeldahl 1883)for nitrogen from December 2003 to June 2004. Sam-ples were collected and immediately placed on ice andtransported to the Lehmann Research Laboratory ofthe Animal and Wildlife Sciences Department at TexasA&M University-Kingsville in Kingsville, Texas, forchemical analysis. Upon return to the laboratory, plantsamples were dried in a forced-air oven at 60�C for 3d. Subsequent to drying, soil was removed from sam-ples and the roots were dissected from basal crownand stem bases. The stem bases, including the lower2–2.5 cm of stem, and basal crown were dissectedfrom the rest of the plant shoot and root material,ground in a Willey mill to pass through a 0.5-mmscreen, and stored in amber vials until analysis.
A cattle survey was conducted to measure cattlepreference between burned and non-burned areas.Number of animals observed in the burned and non-burned areas was recorded 2 times/d (at 0800 and1800) 2 d every month. To evaluate white-tailed deerpreference for burned and non-burned areas, deer spot-lighting surveys were conducted on the winter-burnedand non-burned areas every month. The same 3-mi(4,827-m) transects were used each month to recorddeer presence in the burned and non-burned plots. Thesummer-burned area was not surveyed because the sizeand distribution of burned areas were not sufficient toseparate differences between burned and unburned ar-eas.
Statistical Analysis
Data were analyzed using a randomized completeblock design with a factorial arrangement of treat-ments. Main effects and interactions were consideredsignificant at � � 0.05. When significant main effects
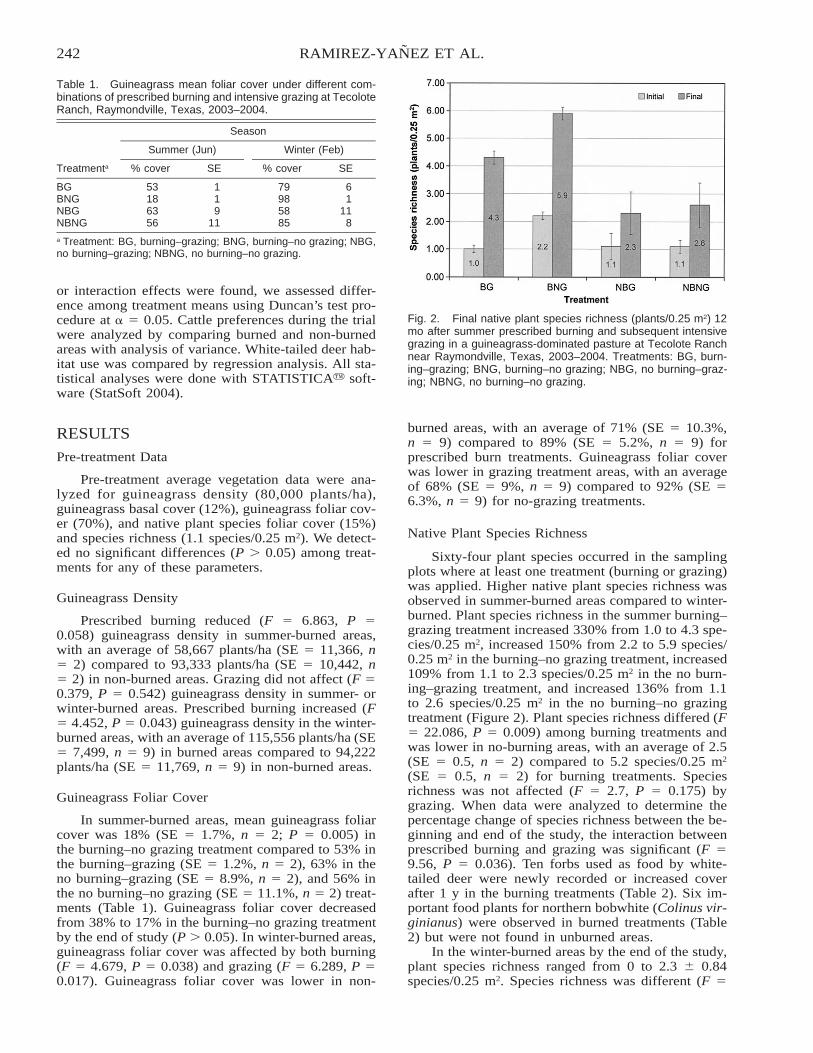
242 RAMIREZ-YANEZ ET AL.
Table 1. Guineagrass mean foliar cover under different com-binations of prescribed burning and intensive grazing at TecoloteRanch, Raymondville, Texas, 2003–2004.
Treatmenta
Season
Summer (Jun)
% cover SE
Winter (Feb)
% cover SE
BG 53 1 79 6BNG 18 1 98 1NBG 63 9 58 11NBNG 56 11 85 8
a Treatment: BG, burning–grazing; BNG, burning–no grazing; NBG,no burning–grazing; NBNG, no burning–no grazing.
Fig. 2. Final native plant species richness (plants/0.25 m2) 12mo after summer prescribed burning and subsequent intensivegrazing in a guineagrass-dominated pasture at Tecolote Ranchnear Raymondville, Texas, 2003–2004. Treatments: BG, burn-ing–grazing; BNG, burning–no grazing; NBG, no burning–graz-ing; NBNG, no burning–no grazing.
or interaction effects were found, we assessed differ-ence among treatment means using Duncan’s test pro-cedure at � � 0.05. Cattle preferences during the trialwere analyzed by comparing burned and non-burnedareas with analysis of variance. White-tailed deer hab-itat use was compared by regression analysis. All sta-tistical analyses were done with STATISTICA� soft-ware (StatSoft 2004).
RESULTS
Pre-treatment Data
Pre-treatment average vegetation data were ana-lyzed for guineagrass density (80,000 plants/ha),guineagrass basal cover (12%), guineagrass foliar cov-er (70%), and native plant species foliar cover (15%)and species richness (1.1 species/0.25 m2). We detect-ed no significant differences (P � 0.05) among treat-ments for any of these parameters.
Guineagrass Density
Prescribed burning reduced (F � 6.863, P �0.058) guineagrass density in summer-burned areas,with an average of 58,667 plants/ha (SE � 11,366, n� 2) compared to 93,333 plants/ha (SE � 10,442, n� 2) in non-burned areas. Grazing did not affect (F �0.379, P � 0.542) guineagrass density in summer- orwinter-burned areas. Prescribed burning increased (F� 4.452, P � 0.043) guineagrass density in the winter-burned areas, with an average of 115,556 plants/ha (SE� 7,499, n � 9) in burned areas compared to 94,222plants/ha (SE � 11,769, n � 9) in non-burned areas.
Guineagrass Foliar Cover
In summer-burned areas, mean guineagrass foliarcover was 18% (SE � 1.7%, n � 2; P � 0.005) inthe burning–no grazing treatment compared to 53% inthe burning–grazing (SE � 1.2%, n � 2), 63% in theno burning–grazing (SE � 8.9%, n � 2), and 56% inthe no burning–no grazing (SE � 11.1%, n � 2) treat-ments (Table 1). Guineagrass foliar cover decreasedfrom 38% to 17% in the burning–no grazing treatmentby the end of study (P � 0.05). In winter-burned areas,guineagrass foliar cover was affected by both burning(F � 4.679, P � 0.038) and grazing (F � 6.289, P �0.017). Guineagrass foliar cover was lower in non-
burned areas, with an average of 71% (SE � 10.3%,n � 9) compared to 89% (SE � 5.2%, n � 9) forprescribed burn treatments. Guineagrass foliar coverwas lower in grazing treatment areas, with an averageof 68% (SE � 9%, n � 9) compared to 92% (SE �6.3%, n � 9) for no-grazing treatments.
Native Plant Species Richness
Sixty-four plant species occurred in the samplingplots where at least one treatment (burning or grazing)was applied. Higher native plant species richness wasobserved in summer-burned areas compared to winter-burned. Plant species richness in the summer burning–grazing treatment increased 330% from 1.0 to 4.3 spe-cies/0.25 m2, increased 150% from 2.2 to 5.9 species/0.25 m2 in the burning–no grazing treatment, increased109% from 1.1 to 2.3 species/0.25 m2 in the no burn-ing–grazing treatment, and increased 136% from 1.1to 2.6 species/0.25 m2 in the no burning–no grazingtreatment (Figure 2). Plant species richness differed (F� 22.086, P � 0.009) among burning treatments andwas lower in no-burning areas, with an average of 2.5(SE � 0.5, n � 2) compared to 5.2 species/0.25 m2
(SE � 0.5, n � 2) for burning treatments. Speciesrichness was not affected (F � 2.7, P � 0.175) bygrazing. When data were analyzed to determine thepercentage change of species richness between the be-ginning and end of the study, the interaction betweenprescribed burning and grazing was significant (F �9.56, P � 0.036). Ten forbs used as food by white-tailed deer were newly recorded or increased coverafter 1 y in the burning treatments (Table 2). Six im-portant food plants for northern bobwhite (Colinus vir-ginianus) were observed in burned treatments (Table2) but were not found in unburned areas.
In the winter-burned areas by the end of the study,plant species richness ranged from 0 to 2.3 � 0.84species/0.25 m2. Species richness was different (F �
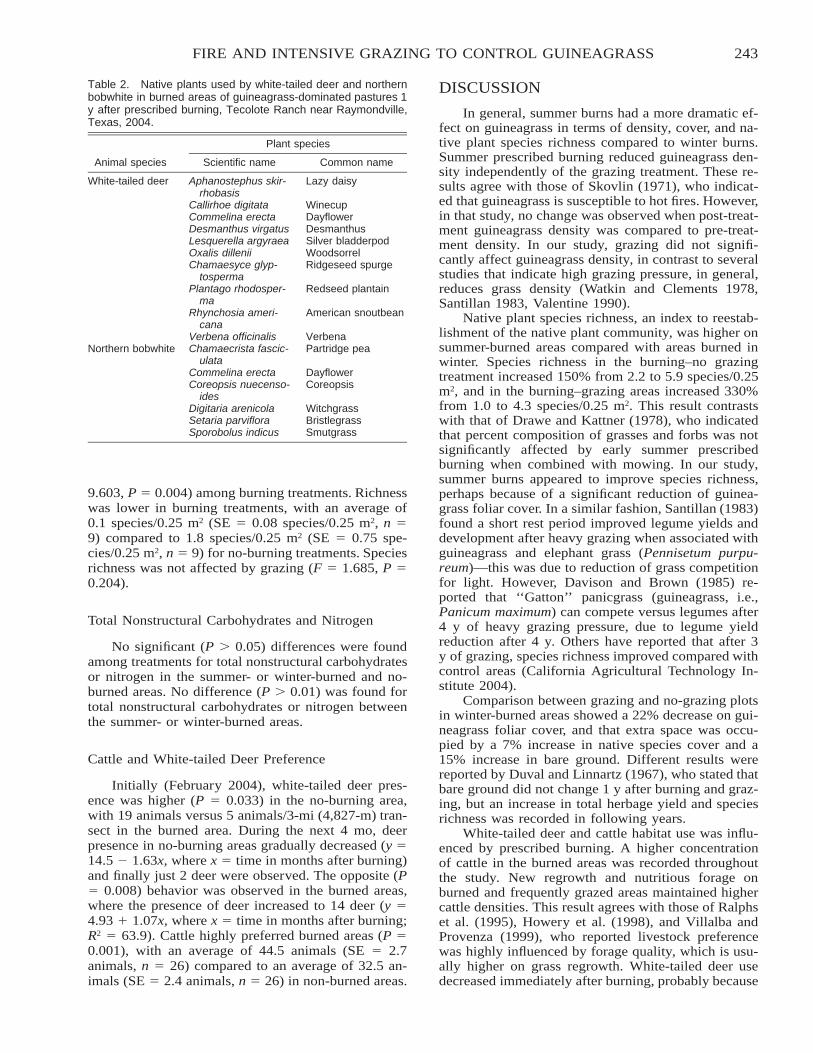
243FIRE AND INTENSIVE GRAZING TO CONTROL GUINEAGRASS
Table 2. Native plants used by white-tailed deer and northernbobwhite in burned areas of guineagrass-dominated pastures 1y after prescribed burning, Tecolote Ranch near Raymondville,Texas, 2004.
Animal species
Plant species
Scientific name Common name
White-tailed deer Aphanostephus skir-rhobasis
Lazy daisy
Callirhoe digitata WinecupCommelina erecta DayflowerDesmanthus virgatus DesmanthusLesquerella argyraea Silver bladderpodOxalis dillenii WoodsorrelChamaesyce glyp-
tospermaRidgeseed spurge
Plantago rhodosper-ma
Redseed plantain
Rhynchosia ameri-cana
American snoutbean
Verbena officinalis VerbenaNorthern bobwhite Chamaecrista fascic-
ulataPartridge pea
Commelina erecta DayflowerCoreopsis nuecenso-
idesCoreopsis
Digitaria arenicola WitchgrassSetaria parviflora BristlegrassSporobolus indicus Smutgrass
9.603, P � 0.004) among burning treatments. Richnesswas lower in burning treatments, with an average of0.1 species/0.25 m2 (SE � 0.08 species/0.25 m2, n �9) compared to 1.8 species/0.25 m2 (SE � 0.75 spe-cies/0.25 m2, n � 9) for no-burning treatments. Speciesrichness was not affected by grazing (F � 1.685, P �0.204).
Total Nonstructural Carbohydrates and Nitrogen
No significant (P � 0.05) differences were foundamong treatments for total nonstructural carbohydratesor nitrogen in the summer- or winter-burned and no-burned areas. No difference (P � 0.01) was found fortotal nonstructural carbohydrates or nitrogen betweenthe summer- or winter-burned areas.
Cattle and White-tailed Deer Preference
Initially (February 2004), white-tailed deer pres-ence was higher (P � 0.033) in the no-burning area,with 19 animals versus 5 animals/3-mi (4,827-m) tran-sect in the burned area. During the next 4 mo, deerpresence in no-burning areas gradually decreased (y �14.5 1.63x, where x � time in months after burning)and finally just 2 deer were observed. The opposite (P� 0.008) behavior was observed in the burned areas,where the presence of deer increased to 14 deer (y �4.93 1.07x, where x � time in months after burning;R2 � 63.9). Cattle highly preferred burned areas (P �0.001), with an average of 44.5 animals (SE � 2.7animals, n � 26) compared to an average of 32.5 an-imals (SE � 2.4 animals, n � 26) in non-burned areas.
DISCUSSION
In general, summer burns had a more dramatic ef-fect on guineagrass in terms of density, cover, and na-tive plant species richness compared to winter burns.Summer prescribed burning reduced guineagrass den-sity independently of the grazing treatment. These re-sults agree with those of Skovlin (1971), who indicat-ed that guineagrass is susceptible to hot fires. However,in that study, no change was observed when post-treat-ment guineagrass density was compared to pre-treat-ment density. In our study, grazing did not signifi-cantly affect guineagrass density, in contrast to severalstudies that indicate high grazing pressure, in general,reduces grass density (Watkin and Clements 1978,Santillan 1983, Valentine 1990).
Native plant species richness, an index to reestab-lishment of the native plant community, was higher onsummer-burned areas compared with areas burned inwinter. Species richness in the burning–no grazingtreatment increased 150% from 2.2 to 5.9 species/0.25m2, and in the burning–grazing areas increased 330%from 1.0 to 4.3 species/0.25 m2. This result contrastswith that of Drawe and Kattner (1978), who indicatedthat percent composition of grasses and forbs was notsignificantly affected by early summer prescribedburning when combined with mowing. In our study,summer burns appeared to improve species richness,perhaps because of a significant reduction of guinea-grass foliar cover. In a similar fashion, Santillan (1983)found a short rest period improved legume yields anddevelopment after heavy grazing when associated withguineagrass and elephant grass (Pennisetum purpu-reum)—this was due to reduction of grass competitionfor light. However, Davison and Brown (1985) re-ported that ‘‘Gatton’’ panicgrass (guineagrass, i.e.,Panicum maximum) can compete versus legumes after4 y of heavy grazing pressure, due to legume yieldreduction after 4 y. Others have reported that after 3y of grazing, species richness improved compared withcontrol areas (California Agricultural Technology In-stitute 2004).
Comparison between grazing and no-grazing plotsin winter-burned areas showed a 22% decrease on gui-neagrass foliar cover, and that extra space was occu-pied by a 7% increase in native species cover and a15% increase in bare ground. Different results werereported by Duval and Linnartz (1967), who stated thatbare ground did not change 1 y after burning and graz-ing, but an increase in total herbage yield and speciesrichness was recorded in following years.
White-tailed deer and cattle habitat use was influ-enced by prescribed burning. A higher concentrationof cattle in the burned areas was recorded throughoutthe study. New regrowth and nutritious forage onburned and frequently grazed areas maintained highercattle densities. This result agrees with those of Ralphset al. (1995), Howery et al. (1998), and Villalba andProvenza (1999), who reported livestock preferencewas highly influenced by forage quality, which is usu-ally higher on grass regrowth. White-tailed deer usedecreased immediately after burning, probably because
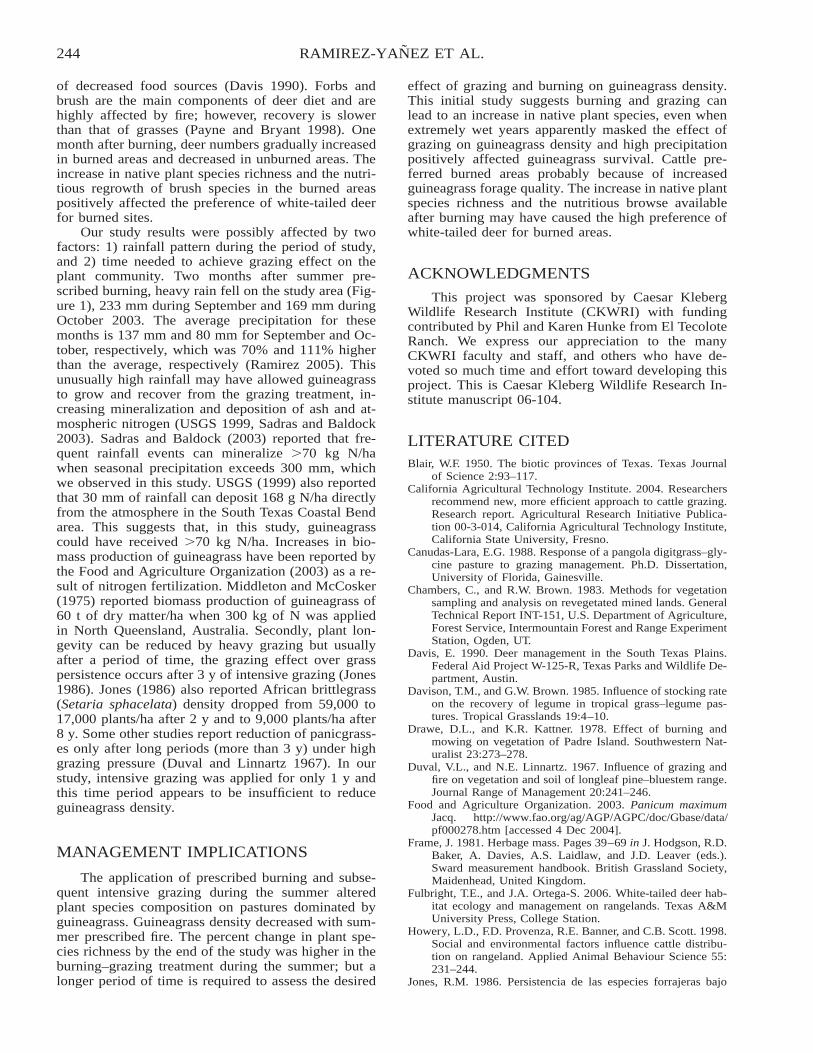
244 RAMIREZ-YANEZ ET AL.
of decreased food sources (Davis 1990). Forbs andbrush are the main components of deer diet and arehighly affected by fire; however, recovery is slowerthan that of grasses (Payne and Bryant 1998). Onemonth after burning, deer numbers gradually increasedin burned areas and decreased in unburned areas. Theincrease in native plant species richness and the nutri-tious regrowth of brush species in the burned areaspositively affected the preference of white-tailed deerfor burned sites.
Our study results were possibly affected by twofactors: 1) rainfall pattern during the period of study,and 2) time needed to achieve grazing effect on theplant community. Two months after summer pre-scribed burning, heavy rain fell on the study area (Fig-ure 1), 233 mm during September and 169 mm duringOctober 2003. The average precipitation for thesemonths is 137 mm and 80 mm for September and Oc-tober, respectively, which was 70% and 111% higherthan the average, respectively (Ramirez 2005). Thisunusually high rainfall may have allowed guineagrassto grow and recover from the grazing treatment, in-creasing mineralization and deposition of ash and at-mospheric nitrogen (USGS 1999, Sadras and Baldock2003). Sadras and Baldock (2003) reported that fre-quent rainfall events can mineralize �70 kg N/hawhen seasonal precipitation exceeds 300 mm, whichwe observed in this study. USGS (1999) also reportedthat 30 mm of rainfall can deposit 168 g N/ha directlyfrom the atmosphere in the South Texas Coastal Bendarea. This suggests that, in this study, guineagrasscould have received �70 kg N/ha. Increases in bio-mass production of guineagrass have been reported bythe Food and Agriculture Organization (2003) as a re-sult of nitrogen fertilization. Middleton and McCosker(1975) reported biomass production of guineagrass of60 t of dry matter/ha when 300 kg of N was appliedin North Queensland, Australia. Secondly, plant lon-gevity can be reduced by heavy grazing but usuallyafter a period of time, the grazing effect over grasspersistence occurs after 3 y of intensive grazing (Jones1986). Jones (1986) also reported African brittlegrass(Setaria sphacelata) density dropped from 59,000 to17,000 plants/ha after 2 y and to 9,000 plants/ha after8 y. Some other studies report reduction of panicgrass-es only after long periods (more than 3 y) under highgrazing pressure (Duval and Linnartz 1967). In ourstudy, intensive grazing was applied for only 1 y andthis time period appears to be insufficient to reduceguineagrass density.
MANAGEMENT IMPLICATIONS
The application of prescribed burning and subse-quent intensive grazing during the summer alteredplant species composition on pastures dominated byguineagrass. Guineagrass density decreased with sum-mer prescribed fire. The percent change in plant spe-cies richness by the end of the study was higher in theburning–grazing treatment during the summer; but alonger period of time is required to assess the desired
effect of grazing and burning on guineagrass density.This initial study suggests burning and grazing canlead to an increase in native plant species, even whenextremely wet years apparently masked the effect ofgrazing on guineagrass density and high precipitationpositively affected guineagrass survival. Cattle pre-ferred burned areas probably because of increasedguineagrass forage quality. The increase in native plantspecies richness and the nutritious browse availableafter burning may have caused the high preference ofwhite-tailed deer for burned areas.
ACKNOWLEDGMENTS
This project was sponsored by Caesar KlebergWildlife Research Institute (CKWRI) with fundingcontributed by Phil and Karen Hunke from El TecoloteRanch. We express our appreciation to the manyCKWRI faculty and staff, and others who have de-voted so much time and effort toward developing thisproject. This is Caesar Kleberg Wildlife Research In-stitute manuscript 06-104.
LITERATURE CITEDBlair, W.F. 1950. The biotic provinces of Texas. Texas Journal
of Science 2:93–117.California Agricultural Technology Institute. 2004. Researchers
recommend new, more efficient approach to cattle grazing.Research report. Agricultural Research Initiative Publica-tion 00-3-014, California Agricultural Technology Institute,California State University, Fresno.
Canudas-Lara, E.G. 1988. Response of a pangola digitgrass–gly-cine pasture to grazing management. Ph.D. Dissertation,University of Florida, Gainesville.
Chambers, C., and R.W. Brown. 1983. Methods for vegetationsampling and analysis on revegetated mined lands. GeneralTechnical Report INT-151, U.S. Department of Agriculture,Forest Service, Intermountain Forest and Range ExperimentStation, Ogden, UT.
Davis, E. 1990. Deer management in the South Texas Plains.Federal Aid Project W-125-R, Texas Parks and Wildlife De-partment, Austin.
Davison, T.M., and G.W. Brown. 1985. Influence of stocking rateon the recovery of legume in tropical grass–legume pas-tures. Tropical Grasslands 19:4–10.
Drawe, D.L., and K.R. Kattner. 1978. Effect of burning andmowing on vegetation of Padre Island. Southwestern Nat-uralist 23:273–278.
Duval, V.L., and N.E. Linnartz. 1967. Influence of grazing andfire on vegetation and soil of longleaf pine–bluestem range.Journal Range of Management 20:241–246.
Food and Agriculture Organization. 2003. Panicum maximumJacq. http://www.fao.org/ag/AGP/AGPC/doc/Gbase/data/pf000278.htm [accessed 4 Dec 2004].
Frame, J. 1981. Herbage mass. Pages 39–69 in J. Hodgson, R.D.Baker, A. Davies, A.S. Laidlaw, and J.D. Leaver (eds.).Sward measurement handbook. British Grassland Society,Maidenhead, United Kingdom.
Fulbright, T.E., and J.A. Ortega-S. 2006. White-tailed deer hab-itat ecology and management on rangelands. Texas A&MUniversity Press, College Station.
Howery, L.D., F.D. Provenza, R.E. Banner, and C.B. Scott. 1998.Social and environmental factors influence cattle distribu-tion on rangeland. Applied Animal Behaviour Science 55:231–244.
Jones, R.M. 1986. Persistencia de las especies forrajeras bajo
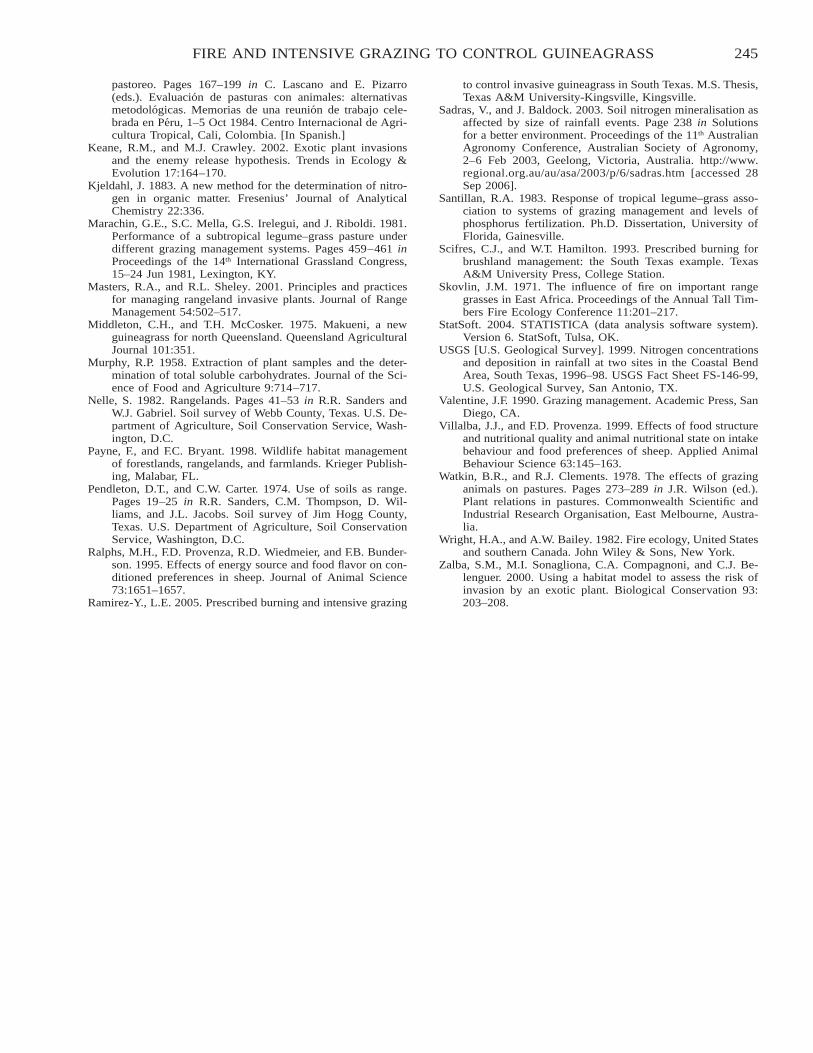
245FIRE AND INTENSIVE GRAZING TO CONTROL GUINEAGRASS
pastoreo. Pages 167–199 in C. Lascano and E. Pizarro(eds.). Evaluacion de pasturas con animales: alternativasmetodologicas. Memorias de una reunion de trabajo cele-brada en Peru, 1–5 Oct 1984. Centro Internacional de Agri-cultura Tropical, Cali, Colombia. [In Spanish.]
Keane, R.M., and M.J. Crawley. 2002. Exotic plant invasionsand the enemy release hypothesis. Trends in Ecology &Evolution 17:164–170.
Kjeldahl, J. 1883. A new method for the determination of nitro-gen in organic matter. Fresenius’ Journal of AnalyticalChemistry 22:336.
Marachin, G.E., S.C. Mella, G.S. Irelegui, and J. Riboldi. 1981.Performance of a subtropical legume–grass pasture underdifferent grazing management systems. Pages 459–461 inProceedings of the 14th International Grassland Congress,15–24 Jun 1981, Lexington, KY.
Masters, R.A., and R.L. Sheley. 2001. Principles and practicesfor managing rangeland invasive plants. Journal of RangeManagement 54:502–517.
Middleton, C.H., and T.H. McCosker. 1975. Makueni, a newguineagrass for north Queensland. Queensland AgriculturalJournal 101:351.
Murphy, R.P. 1958. Extraction of plant samples and the deter-mination of total soluble carbohydrates. Journal of the Sci-ence of Food and Agriculture 9:714–717.
Nelle, S. 1982. Rangelands. Pages 41–53 in R.R. Sanders andW.J. Gabriel. Soil survey of Webb County, Texas. U.S. De-partment of Agriculture, Soil Conservation Service, Wash-ington, D.C.
Payne, F., and F.C. Bryant. 1998. Wildlife habitat managementof forestlands, rangelands, and farmlands. Krieger Publish-ing, Malabar, FL.
Pendleton, D.T., and C.W. Carter. 1974. Use of soils as range.Pages 19–25 in R.R. Sanders, C.M. Thompson, D. Wil-liams, and J.L. Jacobs. Soil survey of Jim Hogg County,Texas. U.S. Department of Agriculture, Soil ConservationService, Washington, D.C.
Ralphs, M.H., F.D. Provenza, R.D. Wiedmeier, and F.B. Bunder-son. 1995. Effects of energy source and food flavor on con-ditioned preferences in sheep. Journal of Animal Science73:1651–1657.
Ramirez-Y., L.E. 2005. Prescribed burning and intensive grazing
to control invasive guineagrass in South Texas. M.S. Thesis,Texas A&M University-Kingsville, Kingsville.
Sadras, V., and J. Baldock. 2003. Soil nitrogen mineralisation asaffected by size of rainfall events. Page 238 in Solutionsfor a better environment. Proceedings of the 11th AustralianAgronomy Conference, Australian Society of Agronomy,2–6 Feb 2003, Geelong, Victoria, Australia. http://www.regional.org.au/au/asa/2003/p/6/sadras.htm [accessed 28Sep 2006].
Santillan, R.A. 1983. Response of tropical legume–grass asso-ciation to systems of grazing management and levels ofphosphorus fertilization. Ph.D. Dissertation, University ofFlorida, Gainesville.
Scifres, C.J., and W.T. Hamilton. 1993. Prescribed burning forbrushland management: the South Texas example. TexasA&M University Press, College Station.
Skovlin, J.M. 1971. The influence of fire on important rangegrasses in East Africa. Proceedings of the Annual Tall Tim-bers Fire Ecology Conference 11:201–217.
StatSoft. 2004. STATISTICA (data analysis software system).Version 6. StatSoft, Tulsa, OK.
USGS [U.S. Geological Survey]. 1999. Nitrogen concentrationsand deposition in rainfall at two sites in the Coastal BendArea, South Texas, 1996–98. USGS Fact Sheet FS-146-99,U.S. Geological Survey, San Antonio, TX.
Valentine, J.F. 1990. Grazing management. Academic Press, SanDiego, CA.
Villalba, J.J., and F.D. Provenza. 1999. Effects of food structureand nutritional quality and animal nutritional state on intakebehaviour and food preferences of sheep. Applied AnimalBehaviour Science 63:145–163.
Watkin, B.R., and R.J. Clements. 1978. The effects of grazinganimals on pastures. Pages 273–289 in J.R. Wilson (ed.).Plant relations in pastures. Commonwealth Scientific andIndustrial Research Organisation, East Melbourne, Austra-lia.
Wright, H.A., and A.W. Bailey. 1982. Fire ecology, United Statesand southern Canada. John Wiley & Sons, New York.
Zalba, S.M., M.I. Sonagliona, C.A. Compagnoni, and C.J. Be-lenguer. 2000. Using a habitat model to assess the risk ofinvasion by an exotic plant. Biological Conservation 93:203–208.
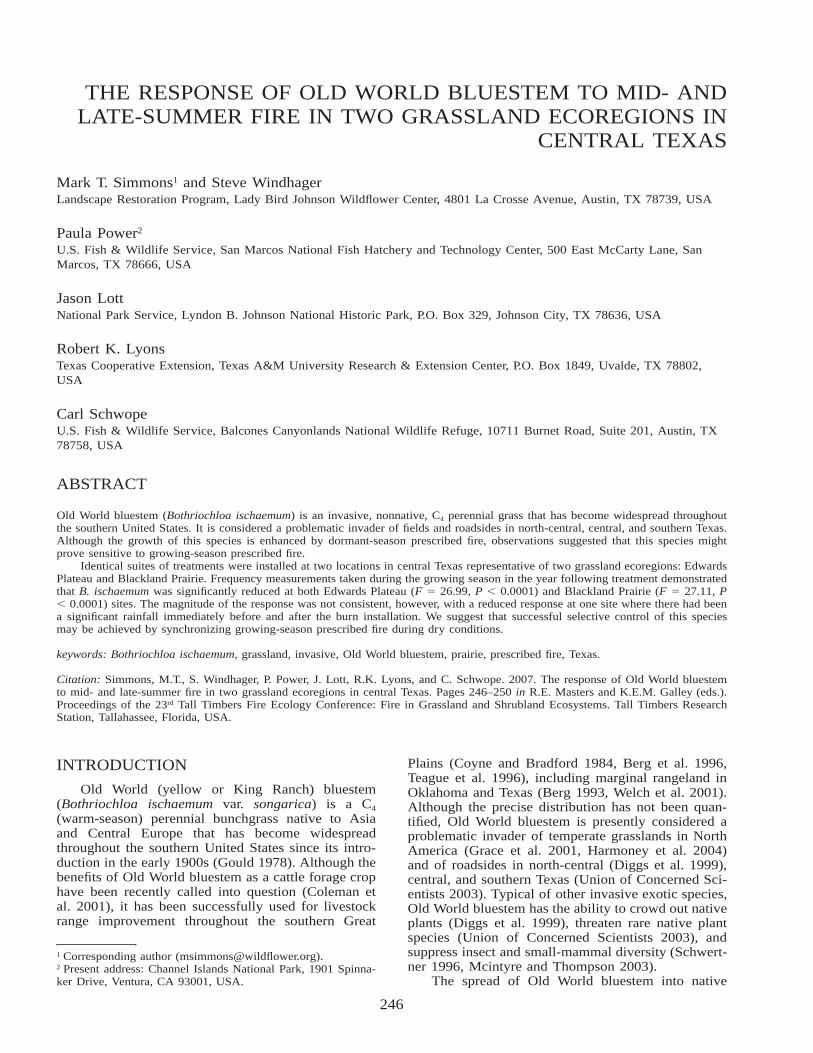
246
THE RESPONSE OF OLD WORLD BLUESTEM TO MID- ANDLATE-SUMMER FIRE IN TWO GRASSLAND ECOREGIONS IN
CENTRAL TEXAS
Mark T. Simmons1 and Steve WindhagerLandscape Restoration Program, Lady Bird Johnson Wildflower Center, 4801 La Crosse Avenue, Austin, TX 78739, USA
Paula Power2
U.S. Fish & Wildlife Service, San Marcos National Fish Hatchery and Technology Center, 500 East McCarty Lane, SanMarcos, TX 78666, USA
Jason LottNational Park Service, Lyndon B. Johnson National Historic Park, P.O. Box 329, Johnson City, TX 78636, USA
Robert K. LyonsTexas Cooperative Extension, Texas A&M University Research & Extension Center, P.O. Box 1849, Uvalde, TX 78802,USA
Carl SchwopeU.S. Fish & Wildlife Service, Balcones Canyonlands National Wildlife Refuge, 10711 Burnet Road, Suite 201, Austin, TX78758, USA
ABSTRACT
Old World bluestem (Bothriochloa ischaemum) is an invasive, nonnative, C4 perennial grass that has become widespread throughoutthe southern United States. It is considered a problematic invader of fields and roadsides in north-central, central, and southern Texas.Although the growth of this species is enhanced by dormant-season prescribed fire, observations suggested that this species mightprove sensitive to growing-season prescribed fire.
Identical suites of treatments were installed at two locations in central Texas representative of two grassland ecoregions: EdwardsPlateau and Blackland Prairie. Frequency measurements taken during the growing season in the year following treatment demonstratedthat B. ischaemum was significantly reduced at both Edwards Plateau (F � 26.99, P � 0.0001) and Blackland Prairie (F � 27.11, P� 0.0001) sites. The magnitude of the response was not consistent, however, with a reduced response at one site where there had beena significant rainfall immediately before and after the burn installation. We suggest that successful selective control of this speciesmay be achieved by synchronizing growing-season prescribed fire during dry conditions.
keywords: Bothriochloa ischaemum, grassland, invasive, Old World bluestem, prairie, prescribed fire, Texas.
Citation: Simmons, M.T., S. Windhager, P. Power, J. Lott, R.K. Lyons, and C. Schwope. 2007. The response of Old World bluestemto mid- and late-summer fire in two grassland ecoregions in central Texas. Pages 246–250 in R.E. Masters and K.E.M. Galley (eds.).Proceedings of the 23rd Tall Timbers Fire Ecology Conference: Fire in Grassland and Shrubland Ecosystems. Tall Timbers ResearchStation, Tallahassee, Florida, USA.
INTRODUCTION
Old World (yellow or King Ranch) bluestem(Bothriochloa ischaemum var. songarica) is a C4
(warm-season) perennial bunchgrass native to Asiaand Central Europe that has become widespreadthroughout the southern United States since its intro-duction in the early 1900s (Gould 1978). Although thebenefits of Old World bluestem as a cattle forage crophave been recently called into question (Coleman etal. 2001), it has been successfully used for livestockrange improvement throughout the southern Great
1 Corresponding author ([email protected]).2 Present address: Channel Islands National Park, 1901 Spinna-ker Drive, Ventura, CA 93001, USA.
Plains (Coyne and Bradford 1984, Berg et al. 1996,Teague et al. 1996), including marginal rangeland inOklahoma and Texas (Berg 1993, Welch et al. 2001).Although the precise distribution has not been quan-tified, Old World bluestem is presently considered aproblematic invader of temperate grasslands in NorthAmerica (Grace et al. 2001, Harmoney et al. 2004)and of roadsides in north-central (Diggs et al. 1999),central, and southern Texas (Union of Concerned Sci-entists 2003). Typical of other invasive exotic species,Old World bluestem has the ability to crowd out nativeplants (Diggs et al. 1999), threaten rare native plantspecies (Union of Concerned Scientists 2003), andsuppress insect and small-mammal diversity (Schwert-ner 1996, Mcintyre and Thompson 2003).
The spread of Old World bluestem into native
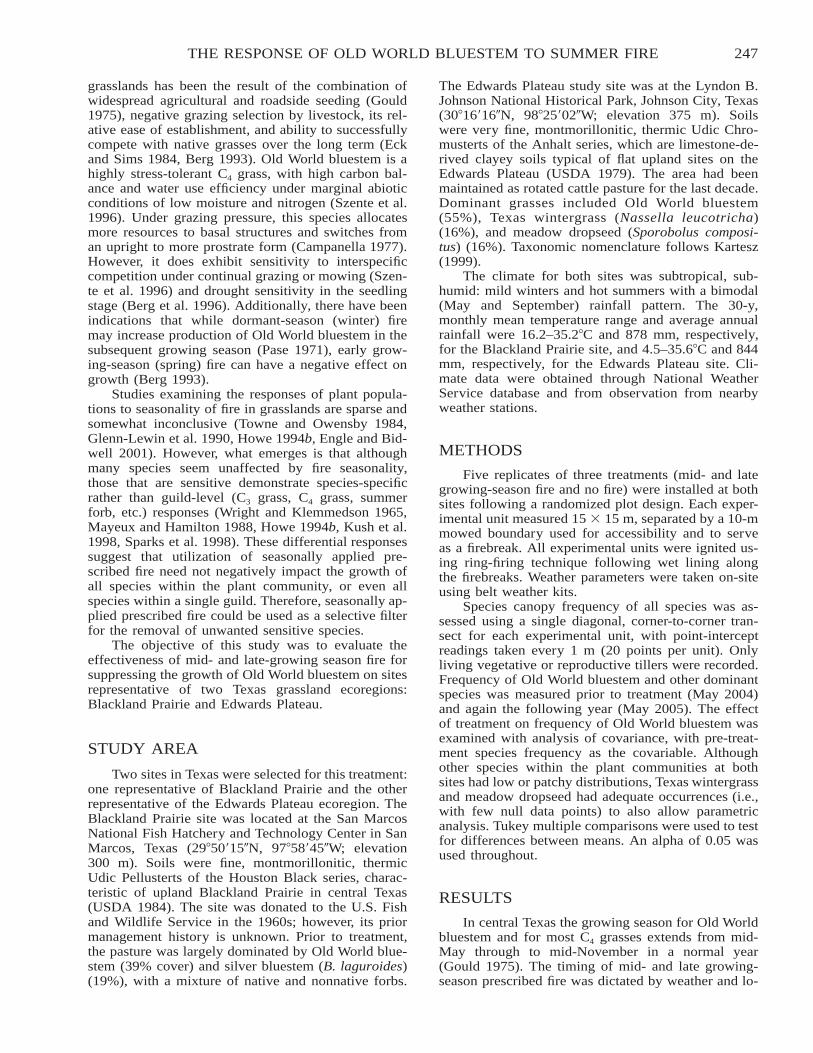
247THE RESPONSE OF OLD WORLD BLUESTEM TO SUMMER FIRE
grasslands has been the result of the combination ofwidespread agricultural and roadside seeding (Gould1975), negative grazing selection by livestock, its rel-ative ease of establishment, and ability to successfullycompete with native grasses over the long term (Eckand Sims 1984, Berg 1993). Old World bluestem is ahighly stress-tolerant C4 grass, with high carbon bal-ance and water use efficiency under marginal abioticconditions of low moisture and nitrogen (Szente et al.1996). Under grazing pressure, this species allocatesmore resources to basal structures and switches froman upright to more prostrate form (Campanella 1977).However, it does exhibit sensitivity to interspecificcompetition under continual grazing or mowing (Szen-te et al. 1996) and drought sensitivity in the seedlingstage (Berg et al. 1996). Additionally, there have beenindications that while dormant-season (winter) firemay increase production of Old World bluestem in thesubsequent growing season (Pase 1971), early grow-ing-season (spring) fire can have a negative effect ongrowth (Berg 1993).
Studies examining the responses of plant popula-tions to seasonality of fire in grasslands are sparse andsomewhat inconclusive (Towne and Owensby 1984,Glenn-Lewin et al. 1990, Howe 1994b, Engle and Bid-well 2001). However, what emerges is that althoughmany species seem unaffected by fire seasonality,those that are sensitive demonstrate species-specificrather than guild-level (C3 grass, C4 grass, summerforb, etc.) responses (Wright and Klemmedson 1965,Mayeux and Hamilton 1988, Howe 1994b, Kush et al.1998, Sparks et al. 1998). These differential responsessuggest that utilization of seasonally applied pre-scribed fire need not negatively impact the growth ofall species within the plant community, or even allspecies within a single guild. Therefore, seasonally ap-plied prescribed fire could be used as a selective filterfor the removal of unwanted sensitive species.
The objective of this study was to evaluate theeffectiveness of mid- and late-growing season fire forsuppressing the growth of Old World bluestem on sitesrepresentative of two Texas grassland ecoregions:Blackland Prairie and Edwards Plateau.
STUDY AREA
Two sites in Texas were selected for this treatment:one representative of Blackland Prairie and the otherrepresentative of the Edwards Plateau ecoregion. TheBlackland Prairie site was located at the San MarcosNational Fish Hatchery and Technology Center in SanMarcos, Texas (29�50�15�N, 97�58�45�W; elevation300 m). Soils were fine, montmorillonitic, thermicUdic Pellusterts of the Houston Black series, charac-teristic of upland Blackland Prairie in central Texas(USDA 1984). The site was donated to the U.S. Fishand Wildlife Service in the 1960s; however, its priormanagement history is unknown. Prior to treatment,the pasture was largely dominated by Old World blue-stem (39% cover) and silver bluestem (B. laguroides)(19%), with a mixture of native and nonnative forbs.
The Edwards Plateau study site was at the Lyndon B.Johnson National Historical Park, Johnson City, Texas(30�16�16�N, 98�25�02�W; elevation 375 m). Soilswere very fine, montmorillonitic, thermic Udic Chro-musterts of the Anhalt series, which are limestone-de-rived clayey soils typical of flat upland sites on theEdwards Plateau (USDA 1979). The area had beenmaintained as rotated cattle pasture for the last decade.Dominant grasses included Old World bluestem(55%), Texas wintergrass (Nassella leucotricha)(16%), and meadow dropseed (Sporobolus composi-tus) (16%). Taxonomic nomenclature follows Kartesz(1999).
The climate for both sites was subtropical, sub-humid: mild winters and hot summers with a bimodal(May and September) rainfall pattern. The 30-y,monthly mean temperature range and average annualrainfall were 16.2–35.2�C and 878 mm, respectively,for the Blackland Prairie site, and 4.5–35.6�C and 844mm, respectively, for the Edwards Plateau site. Cli-mate data were obtained through National WeatherService database and from observation from nearbyweather stations.
METHODS
Five replicates of three treatments (mid- and lategrowing-season fire and no fire) were installed at bothsites following a randomized plot design. Each exper-imental unit measured 15 � 15 m, separated by a 10-mmowed boundary used for accessibility and to serveas a firebreak. All experimental units were ignited us-ing ring-firing technique following wet lining alongthe firebreaks. Weather parameters were taken on-siteusing belt weather kits.
Species canopy frequency of all species was as-sessed using a single diagonal, corner-to-corner tran-sect for each experimental unit, with point-interceptreadings taken every 1 m (20 points per unit). Onlyliving vegetative or reproductive tillers were recorded.Frequency of Old World bluestem and other dominantspecies was measured prior to treatment (May 2004)and again the following year (May 2005). The effectof treatment on frequency of Old World bluestem wasexamined with analysis of covariance, with pre-treat-ment species frequency as the covariable. Althoughother species within the plant communities at bothsites had low or patchy distributions, Texas wintergrassand meadow dropseed had adequate occurrences (i.e.,with few null data points) to also allow parametricanalysis. Tukey multiple comparisons were used to testfor differences between means. An alpha of 0.05 wasused throughout.
RESULTS
In central Texas the growing season for Old Worldbluestem and for most C4 grasses extends from mid-May through to mid-November in a normal year(Gould 1975). The timing of mid- and late growing-season prescribed fire was dictated by weather and lo-
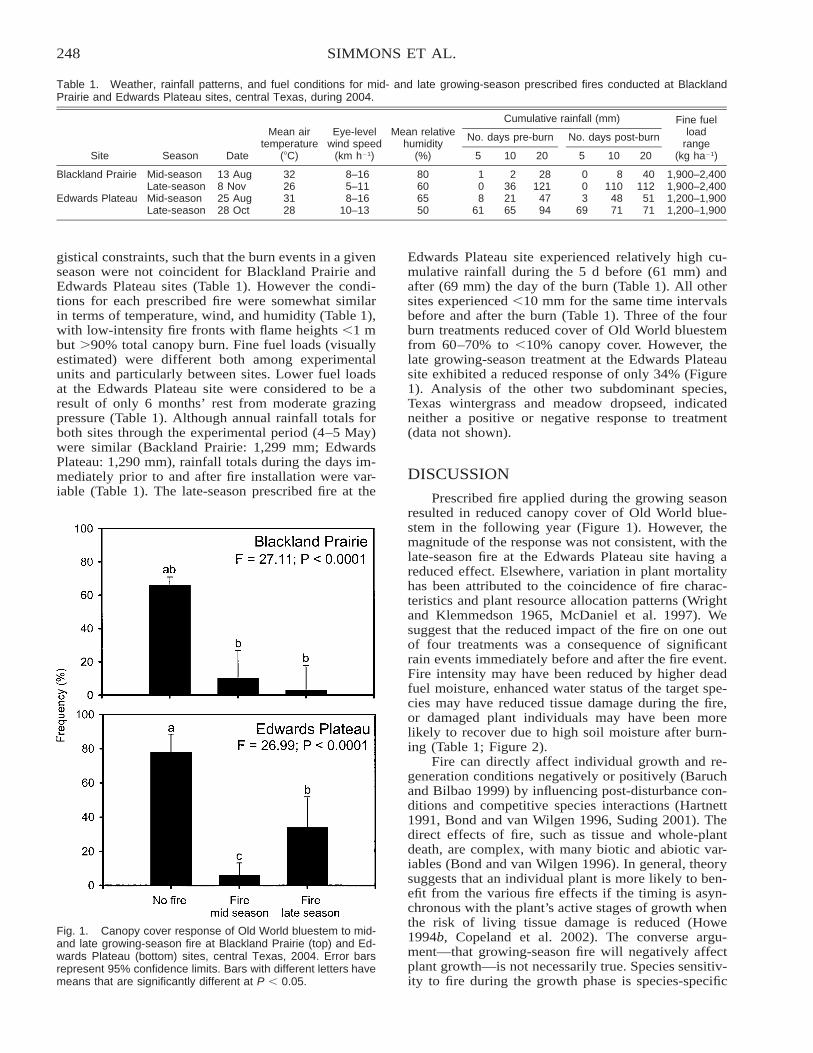
248 SIMMONS ET AL.
Table 1. Weather, rainfall patterns, and fuel conditions for mid- and late growing-season prescribed fires conducted at BlacklandPrairie and Edwards Plateau sites, central Texas, during 2004.
Site Season Date
Mean airtemperature
(�C)
Eye-levelwind speed
(km h�1)
Mean relativehumidity
(%)
Cumulative rainfall (mm)
No. days pre-burn
5 10 20
No. days post-burn
5 10 20
Fine fuelload
range(kg ha�1)
Blackland Prairie Mid-season 13 Aug 32 8–16 80 1 2 28 0 8 40 1,900–2,400Late-season 8 Nov 26 5–11 60 0 36 121 0 110 112 1,900–2,400
Edwards Plateau Mid-season 25 Aug 31 8–16 65 8 21 47 3 48 51 1,200–1,900Late-season 28 Oct 28 10–13 50 61 65 94 69 71 71 1,200–1,900
Fig. 1. Canopy cover response of Old World bluestem to mid-and late growing-season fire at Blackland Prairie (top) and Ed-wards Plateau (bottom) sites, central Texas, 2004. Error barsrepresent 95% confidence limits. Bars with different letters havemeans that are significantly different at P � 0.05.
gistical constraints, such that the burn events in a givenseason were not coincident for Blackland Prairie andEdwards Plateau sites (Table 1). However the condi-tions for each prescribed fire were somewhat similarin terms of temperature, wind, and humidity (Table 1),with low-intensity fire fronts with flame heights �1 mbut 90% total canopy burn. Fine fuel loads (visuallyestimated) were different both among experimentalunits and particularly between sites. Lower fuel loadsat the Edwards Plateau site were considered to be aresult of only 6 months’ rest from moderate grazingpressure (Table 1). Although annual rainfall totals forboth sites through the experimental period (4–5 May)were similar (Backland Prairie: 1,299 mm; EdwardsPlateau: 1,290 mm), rainfall totals during the days im-mediately prior to and after fire installation were var-iable (Table 1). The late-season prescribed fire at the
Edwards Plateau site experienced relatively high cu-mulative rainfall during the 5 d before (61 mm) andafter (69 mm) the day of the burn (Table 1). All othersites experienced �10 mm for the same time intervalsbefore and after the burn (Table 1). Three of the fourburn treatments reduced cover of Old World bluestemfrom 60–70% to �10% canopy cover. However, thelate growing-season treatment at the Edwards Plateausite exhibited a reduced response of only 34% (Figure1). Analysis of the other two subdominant species,Texas wintergrass and meadow dropseed, indicatedneither a positive or negative response to treatment(data not shown).
DISCUSSION
Prescribed fire applied during the growing seasonresulted in reduced canopy cover of Old World blue-stem in the following year (Figure 1). However, themagnitude of the response was not consistent, with thelate-season fire at the Edwards Plateau site having areduced effect. Elsewhere, variation in plant mortalityhas been attributed to the coincidence of fire charac-teristics and plant resource allocation patterns (Wrightand Klemmedson 1965, McDaniel et al. 1997). Wesuggest that the reduced impact of the fire on one outof four treatments was a consequence of significantrain events immediately before and after the fire event.Fire intensity may have been reduced by higher deadfuel moisture, enhanced water status of the target spe-cies may have reduced tissue damage during the fire,or damaged plant individuals may have been morelikely to recover due to high soil moisture after burn-ing (Table 1; Figure 2).
Fire can directly affect individual growth and re-generation conditions negatively or positively (Baruchand Bilbao 1999) by influencing post-disturbance con-ditions and competitive species interactions (Hartnett1991, Bond and van Wilgen 1996, Suding 2001). Thedirect effects of fire, such as tissue and whole-plantdeath, are complex, with many biotic and abiotic var-iables (Bond and van Wilgen 1996). In general, theorysuggests that an individual plant is more likely to ben-efit from the various fire effects if the timing is asyn-chronous with the plant’s active stages of growth whenthe risk of living tissue damage is reduced (Howe1994b, Copeland et al. 2002). The converse argu-ment—that growing-season fire will negatively affectplant growth—is not necessarily true. Species sensitiv-ity to fire during the growth phase is species-specific
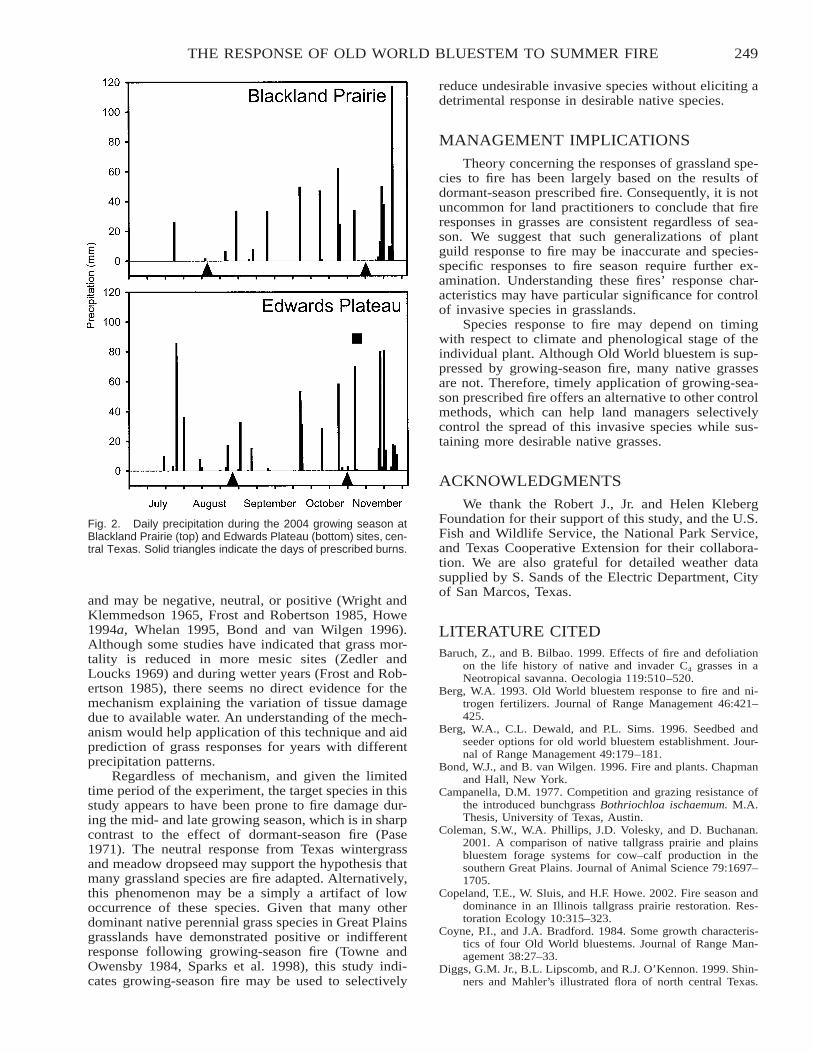
249THE RESPONSE OF OLD WORLD BLUESTEM TO SUMMER FIRE
Fig. 2. Daily precipitation during the 2004 growing season atBlackland Prairie (top) and Edwards Plateau (bottom) sites, cen-tral Texas. Solid triangles indicate the days of prescribed burns.
and may be negative, neutral, or positive (Wright andKlemmedson 1965, Frost and Robertson 1985, Howe1994a, Whelan 1995, Bond and van Wilgen 1996).Although some studies have indicated that grass mor-tality is reduced in more mesic sites (Zedler andLoucks 1969) and during wetter years (Frost and Rob-ertson 1985), there seems no direct evidence for themechanism explaining the variation of tissue damagedue to available water. An understanding of the mech-anism would help application of this technique and aidprediction of grass responses for years with differentprecipitation patterns.
Regardless of mechanism, and given the limitedtime period of the experiment, the target species in thisstudy appears to have been prone to fire damage dur-ing the mid- and late growing season, which is in sharpcontrast to the effect of dormant-season fire (Pase1971). The neutral response from Texas wintergrassand meadow dropseed may support the hypothesis thatmany grassland species are fire adapted. Alternatively,this phenomenon may be a simply a artifact of lowoccurrence of these species. Given that many otherdominant native perennial grass species in Great Plainsgrasslands have demonstrated positive or indifferentresponse following growing-season fire (Towne andOwensby 1984, Sparks et al. 1998), this study indi-cates growing-season fire may be used to selectively
reduce undesirable invasive species without eliciting adetrimental response in desirable native species.
MANAGEMENT IMPLICATIONS
Theory concerning the responses of grassland spe-cies to fire has been largely based on the results ofdormant-season prescribed fire. Consequently, it is notuncommon for land practitioners to conclude that fireresponses in grasses are consistent regardless of sea-son. We suggest that such generalizations of plantguild response to fire may be inaccurate and species-specific responses to fire season require further ex-amination. Understanding these fires’ response char-acteristics may have particular significance for controlof invasive species in grasslands.
Species response to fire may depend on timingwith respect to climate and phenological stage of theindividual plant. Although Old World bluestem is sup-pressed by growing-season fire, many native grassesare not. Therefore, timely application of growing-sea-son prescribed fire offers an alternative to other controlmethods, which can help land managers selectivelycontrol the spread of this invasive species while sus-taining more desirable native grasses.
ACKNOWLEDGMENTSWe thank the Robert J., Jr. and Helen Kleberg
Foundation for their support of this study, and the U.S.Fish and Wildlife Service, the National Park Service,and Texas Cooperative Extension for their collabora-tion. We are also grateful for detailed weather datasupplied by S. Sands of the Electric Department, Cityof San Marcos, Texas.
LITERATURE CITEDBaruch, Z., and B. Bilbao. 1999. Effects of fire and defoliation
on the life history of native and invader C4 grasses in aNeotropical savanna. Oecologia 119:510–520.
Berg, W.A. 1993. Old World bluestem response to fire and ni-trogen fertilizers. Journal of Range Management 46:421–425.
Berg, W.A., C.L. Dewald, and P.L. Sims. 1996. Seedbed andseeder options for old world bluestem establishment. Jour-nal of Range Management 49:179–181.
Bond, W.J., and B. van Wilgen. 1996. Fire and plants. Chapmanand Hall, New York.
Campanella, D.M. 1977. Competition and grazing resistance ofthe introduced bunchgrass Bothriochloa ischaemum. M.A.Thesis, University of Texas, Austin.
Coleman, S.W., W.A. Phillips, J.D. Volesky, and D. Buchanan.2001. A comparison of native tallgrass prairie and plainsbluestem forage systems for cow–calf production in thesouthern Great Plains. Journal of Animal Science 79:1697–1705.
Copeland, T.E., W. Sluis, and H.F. Howe. 2002. Fire season anddominance in an Illinois tallgrass prairie restoration. Res-toration Ecology 10:315–323.
Coyne, P.I., and J.A. Bradford. 1984. Some growth characteris-tics of four Old World bluestems. Journal of Range Man-agement 38:27–33.
Diggs, G.M. Jr., B.L. Lipscomb, and R.J. O’Kennon. 1999. Shin-ners and Mahler’s illustrated flora of north central Texas.
250 SIMMONS ET AL.
Sida, Botanical Miscellany No. 16. Botanical Research In-stitute of Texas, Fort Worth.
Eck, H.V., and P.L. Sims. 1984. Grass species adaptability in theSouthern High Plains—a 36-year assessment. Journal ofRange Management 37:211–217.
Engle, D.M., and T. Bidwell. 2001. The response of centralNorth American prairies to seasonal fire. Journal of RangeManagement 54:2–10.
Frost, P.G.H., and F. Robertson. 1985. Fire: the ecological effectsof fire in savannas. Pages 93–140 in B.H. Walker (ed.).Determinants of tropical savannas. IRL Press, Oxford, Unit-ed Kingdom.
Glenn-Lewin, D.C., L.A. Johnson, T.W. Jurik, A. Akey, M. Leos-chke, and T. Rosburg. 1990. Fire in central North Americangrasslands: vegetative reproduction, seed germination, andseedling establishment. Pages 28–45 in S.L. Collins andL.L. Wallace (eds.). Fire in North American tallgrass prai-rie. University of Oklahoma Press, Norman.
Gould, F.W. 1975. The grasses of Texas. Texas A&M UniversityPress, College Station.
Gould, F.W. 1978. Common Texas grasses. Texas A&M Univer-sity Press, College Station.
Grace, J.B., M.D. Smith, S.L. Grace, S.L. Collins, and T.J. Stohl-gren. 2001. Interactions between fire and invasive plants intemperate grasslands of North America. Pages 40–65 inK.E.M. Galley and T.P. Wilson (eds.). Proceedings of theInvasive Species Workshop: the role of fire in the controland spread of invasive species. Fire Conference 2000: thefirst national congress on fire ecology, prevention and man-agement. Miscellaneous Publication No. 11, Tall TimbersResearch Station, Tallahassee, FL.
Harmoney, K.R., P.W. Stahlman, and K.R. Hickman. 2004. Her-bicide effects on established yellow Old World bluestem(Bothriochloa ischaemum). Weed Technology 18:545–550.
Hartnett, D.C. 1991. Effects of fire in tallgrass prairie on growthand reproduction of prairie coneflower (Ratibida columni-fera: Asteraceae). American Journal of Botany 78:429–435.
Howe, H.F. 1994a. Managing species diversity in tallgrass prai-rie: assumptions and implications. Conservation Biology 8:691–704.
Howe, H.F. 1994b. Response of early- and late-flowering plantsto fire season in experimental prairies. Ecological Appli-cations 4:121–133.
Kartesz, J.T. 1999. A synonymized checklist and atlas with bi-ological attributes for the vascular flora of the United States,Canada, and Greenland. In J.T. Kartesz and C.A. Meacham(eds.). Synthesis of the North American flora. Version 1.0.North Carolina Botanical Garden, Chapel Hill.
Kush, J.S., R.S. Meldahl, and W.D. Boyer. 1998. Understoryplant community response to season of burn in natural long-leaf pine forests. Proceedings of the Tall Timbers Fire Ecol-ogy Conference 21:32–37.
Mayeux, H.S. Jr., and W.T. Hamilton. 1988. Response of false
broomweed and associated species to fire. Journal of RangeManagement 41:2–6.
McDaniel, K.C., C.R. Hart, and D.B. Carroll. 1997. Broomsnakeweed control with fire on New Mexico blue gramarangeland. Journal of Range Management 50:652–659.
McIntyre, N.E., and T.R. Thompson. 2003. A comparison ofConservation Reserve Program habitat plantings with re-spect to arthropod prey for grassland birds. American Mid-land Naturalist 150:291–301.
Pase, C.P. 1971. Effects of a February burn on Lehmann love-grass. Journal of Range Management 24:454–456.
Schwertner, T. 1996. Habitat affinity of small rodents at Kicka-poo Cavern State Park. M.S. Thesis, Southwest Texas StateUniversity, San Marcos.
Sparks, J.C., R.E. Masters, D.M. Engle, M.W. Palmer, and G.A.Bukenhofer. 1998. Effects of late growing-season and latedormant-season prescribed fire on herbaceous vegetation inrestored pine–grassland communities. Journal of VegetationScience 9:133–142.
Suding, K.N. 2001. The effect of spring burning on competitiveranking of prairie species. Journal of Vegetation Science 12:849–856.
Szente, K.N., Z. Tuba, and G. Fekete. 1996. Photosynthesis ofFestuca rupicola and Bothriochloa ischaemum under deg-radation and cutting pressure in a semiarid loess grassland.Photosynthetica 32:399–477.
Teague, W.R., S.L. Dowhower, W.E. Pinchak, D.R. Tolleson, andL.J. Hunt. 1996. Increasing utilization efficiency of contin-uously stocked Old World bluestem pasture. Journal ofRange Management 49:535–540.
Towne, G., and C. Owensby. 1984. Long-term effects of annualburning at different dates in ungrazed Kansas tallgrass prai-rie. Journal of Range Management 37:392–396.
Union of Concerned Scientists. 2003. Invasive species: Texas.Union of Concerned Scientists, Cambridge, MA.
USDA [U.S. Department of Agriculture]. 1979. Soil survey ofBlanco and Burnet counties, Texas. Soil Conservation Ser-vice and Texas Agricultural Experiment Station, Washing-ton, D.C.
USDA [U.S. Department of Agriculture]. 1984. Soil survey ofComal and Hays counties, Texas. Soil Conservation Serviceand Texas Agricultural Experiment Station, Washington,D.C.
Welch, T.G., B. Rector, and M.R. Hafercamp. 2001. Seedingrangeland. Texas Agricultural Experiment Station, CollegeStation.
Whelan, R.J. 1995. The ecology of fire. Cambridge UniversityPress, Cambridge, United Kingdom.
Wright, H.A., and J.O. Klemmedson. 1965. Effect of fire onbunchgrasses of the sagebrush–grass region in SouthernIdaho. Ecology 46:680–688.
Zedler, J., and O. L. Loucks. 1969. Differential burning responseof Poa pratensis fields and Andropogon scoparius prairiesin central Wisconsin. American Midland Naturalist 81:341–352.
251
THE REHABILITATION OF NATIVE VEGETATIONCOMMUNITIES IN AN URBAN SHRUBLAND SETTING:
THE ROLE OF CONTROLLED FIRE REGIMES
Ian BatterleyMacquarie University, Division of Environmental and Life Sciences, Department of Biological Sciences, NSW 2109,Australia
ABSTRACT
Throughout Australia’s biogeographical history, the vegetation over most of the continent has experienced a long and complex evo-lutionary relationship with fire. Many of the vegetative forms that have evolved over time, and which are uniquely Australian, rely onfire to complete one or more stages of their life cycle.
In recent years, changes to the natural fire regimes and the introduction of many new plants throughout Australia have led tochanges in ecosystem functioning and species composition in many Australian shrubland areas. Research was undertaken to determineif regular low-intensity burning of urban shrubland areas can assist in the rehabilitation of native species by imposing a fire regimethat will increase their abundance and diversity and decrease the abundance and diversity of invasive weed species. To test thishypothesis, sampling was undertaken over an 18-mo period in eight sites with four differing fire histories—3, 6, 8, and 10 y since thelast fire. Within each of these sites, species presence and abundance were analyzed along two 100-m transects. Seed bank sampleswere also taken at these sites. Seeds within these samples were exposed to temperatures and smoke products present in a low-intensityburn and then germinated to determine the species composition of the next generation. Nutrient levels were measured to determine ifany changes in species composition could be explained by elevated nutrient levels rather than by a specific fire regime.
The results from this study indicate that there is a peak in native abundance and diversity with an associated decrease in exoticabundance and diversity approximately 6 y after a low-intensity burn. There was no significant difference found in nutrient levelsbetween sites, indicating that elevated nutrient levels did not play a role in the differences in vegetation composition. Seed germinationshowed significant variation in sites with different fire histories, demonstrating that time since last fire plays an important role in thespecies composition of the next generation of vegetation post-fire. This conclusion has many applications in the management of urbanshrubland areas throughout the Sydney region. Determining the optimal frequency and intensity of fires in these areas provides muchneeded information for determining the best possible burning regimes for the ecology of native species.
Citation: Batterley, I. 2007. The rehabilitation of native vegetation communities in an urban shrubland setting: the role of controlledfire regimes [abstract]. Page 251 in R.E. Masters and K.E.M. Galley (eds.). Proceedings of the 23rd Tall Timbers Fire EcologyConference: Fire in Grassland and Shrubland Ecosystems. Tall Timbers Research Station, Tallahassee, Florida, USA.
252
RELATIONSHIPS BETWEEN FIRE, SOIL WATER, ANDINVASION OF SEMIARID SHRUBLAND BY AN EXOTIC FORB
Matthew Germino and Judson HillIdaho State University, Department of Biological Sciences, Pocatello, ID 83209, USA
Jonathan HortonUniversity of North Carolina, Biology Department, Asheville, NC 28804, USA
Steven SeefeldtUSDA Agricultural Research Service, U.S. Sheep Experiment Station, HC 62, Box 2010, Dubois, ID 83423, USA
ABSTRACT
Persistent infestation by exotic forbs is common following fire in sagebrush steppe of southeastern Idaho, and in other cold desertshrublands of the Great Basin, USA. Whereas disturbances such as fire are commonly cited causes of exotic plant invasions, fewstudies clarify how fire alters site conditions to favor long-term persistence of exotic forbs, such as leafy spurge (Euphorbia esula).We hypothesized that fire increases deep soil water by selectively removing deep-rooted woody plants and that increases in theavailability of deep soil water are key to the success of leafy spurge. We measured soil water contents, and depth of water uptake,water status, and photosynthetic water use of leafy spurge and native plants in a replicated set of burns. Soil water increased substantiallybelow about 0.4-m depth in burned compared to control plots, due largely to removal of deep-rooted sagebrush. Spurge had no greaterphotosynthesis or water status than native plants. However, leafy spurge acquired water from deeper depths than native herbs, asrevealed by comparisons of isotopic compositions of water in plants and soil at different depths. Sagebrush also acquired water fromdeeper depths than native herbs, and leafy spurge rarely occurred in unburned plots that had sagebrush. These data suggest that leafyspurge might experience less carbon uptake and water status than native herbs without access to the fire-induced increases in wateravailability in soils beneath rooting zones of native herbs. Many other exotic forbs in semiarid shrub and grasslands of western NorthAmerica have deep roots and other traits in common with leafy spurge, and site resistance to dominance by exotic forbs may beenhanced by fire prescriptions that favor shrub reestablishment (e.g., patch burns) or restoration efforts that promote deep-rooted nativespecies.
Citation: Germino, M., J. Hill, J. Horton, and S. Seefeldt. 2007. Relationships between fire, soil water, and invasion of semiaridshrubland by an exotic forb [abstract]. Page 252 in R.E. Masters and K.E.M. Galley (eds.). Proceedings of the 23rd Tall Timbers FireEcology Conference: Fire in Grassland and Shrubland Ecosystems. Tall Timbers Research Station, Tallahassee, Florida, USA.
253
FIRE LEARNING NETWORK IN THE ARKANSASBLACKLAND ECOSYSTEM
Maria Melnechuk, McRee Anderson, and Mark ClarkThe Nature Conservancy, Arkansas Field Office, 601 North University Avenue, Little Rock, AR 72205, USA
ABSTRACT
The North American Fire Learning Network (FLN), a joint project of The Nature Conservancy’s Global Fire Initiative, the USDAForest Service, and the U.S. Department of the Interior, was created in 2002 to catalyze efforts to reduce hazardous fuels across theUnited States. The primary goal of the FLN is to accelerate on-the-ground fire regime restoration across landscapes by fosteringinnovation and transferring lessons learned via regional learning networks. During its first 2 y, the FLN has engaged more than 250partner agencies, tribes, and private landowners to advance ecologically sound restoration on more than 60 million acres. The south-central FLN is one of seven regional FLNs across the United States focused on collaborative restoration of landscape-scale fire-adaptedecosystems. One project within the south-central FLN is the Arkansas Blackland Ecosystem Restoration. The blackland ecosystem hasbeen identified as one of the most at-risk ecosystems in the southeastern United States, with 600� plant species and 315 animalspecies. A 2002 assessment of the region identified 35,000 acres in public and private ownership as targets for restoration to nativeblackland prairie and woodland. Currently, 6,000 acres are in conservation ownership. Restoration of the historic fire regime is crucialto restoring and maintaining the blackland prairie–woodland ecosystem. Through the FLN, The Nature Conservancy and the ArkansasGame and Fish Commission have developed restoration guidelines and management strategies for lands in various stages of degradation,current and desired future condition descriptions, and an ecological monitoring program to track restoration progress. The FLN hasalso helped in setting short-term and long-term priorities for the project and identifying funding sources for restoration activities. Wepresent the products and accomplishments of the FLN in the blacklands of Arkansas. This presentation furthers the goal of the FLNby sharing successful implementation practices of a landscape-scale fire restoration project with ecologists, managers, and practitioners.
Citation: Melnechuk, M., M. Anderson, and M. Clark. 2007. Fire Learning Network in the Arkansas blackland ecosystem [abstract].Page 253 in R.E. Masters and K.E.M. Galley (eds.). Proceedings of the 23rd Tall Timbers Fire Ecology Conference: Fire in Grasslandand Shrubland Ecosystems. Tall Timbers Research Station, Tallahassee, Florida, USA.
254
SOUTHERN FIRE PORTAL: AN INTERNET-BASED PORTALFOR FIRE SCIENCE AND MANAGEMENT IN THE
SOUTHERN REGION
Penelope MorganUniversity of Idaho, Fire Research and Management Exchange System, Moscow, ID 83844, USA
Cynthia FowlerWofford College, 429 N. Church Street, Spartanburg, SC 29303, USA
Deborah KennardMesa State College, Department of Physical & Environmental Sciences, 1100 North Avenue, Grand Junction, CO 81507,USA
J. Kevin HiersThe Nature Conservancy, 330 N. Broad Street, Suite B, Thomasville, GA 31792, USA
Ronald E. MastersTall Timbers Research Station, 13093 Henry Beadel Drive, Tallahassee, FL 32312, USA
Jennifer PollackU.S. Geological Survey, National Biological Information Infrastructure, P.O. Box 25046, Mailstop 302, Denver FederalCenter, Denver, CO 80225, USA
Greg GollbergUniversity of Idaho, Fire Research and Management Exchange System, Moscow, ID 83844, USA
Ann M. BruceTall Timbers Research Station, 13093 Henry Beadel Drive, Tallahassee, FL 32312, USA
ABSTRACT
The Southern Fire Portal (SFP), http://frames.nbii.gov/southernfire, aims to improve communication and collaboration between scientistsand natural resource managers. The SFP proposes to achieve this goal by synthesizing vast, scattered, and difficult-to-locate fire-relatedinformation, and by providing efficient, free access to the syntheses on a single website. Envisioned as more than a website, SFP willbe a gateway for ongoing information and technology transfer between the fire management and research communities, and theirpublics. Portal users can obtain, compare, and evaluate tools and information for wildland fire and fuels management. Users will beencouraged to give input on the performance and value of tools and information supplied through the portal. The southern region isgeographically defined by the 13 states covered by the Southern Area Coordination Center (SACC), one of 11 geographic centersestablished to manage collaboratively wildland fire and other incident management activities. The SFP supports SACC by providingaccess to consolidated and organized fire research deliverables and other services necessary for effective fire and fuels managementwithin this region. The SFP unifies several sources of fire information including 1) Fire Research and Management Exchange System;2) Encyclopedia of Southern Fire Science; 3) Tall Timbers Research Station’s E.V. Komarek Fire Ecology Database; 4) content beingidentified and collected from the Joint Fire Science Program and the National Fire Plan project by The Nature Conservancy FireNetwork; 5) existing information through the U.S. Geological Survey’s National Biological Information Infrastructure; and 6) keyregional products and tools from state agencies, universities, and nongovernmental organizations. The SFP will provide single pointaccess to fire-related publications, data sets, databases, decision-support tools, models, glossaries, interactive CD-ROMs, videos, andstate-of-the-knowledge literature syntheses in support of fire and natural resource management for the southern United States. Anadvanced search engine and fire thesaurus enables users to quickly find the information they need.
Citation: Morgan, P., C. Fowler, D. Kennard, J.K. Hiers, R.E. Masters, J. Pollack, G. Gollberg, and A.M. Bruce. 2007. Southern FirePortal: an Internet-based portal for fire science and management in the southern region [abstract]. Page 254 in R.E. Masters and K.E.M.Galley (eds.). Proceedings of the 23rd Tall Timbers Fire Ecology Conference: Fire in Grassland and Shrubland Ecosystems. Tall TimbersResearch Station, Tallahassee, Florida, USA.
255
SOUTHEAST FIRE ECOLOGY PARTNERSHIP
Caroline L. NobleNational Park Service, Tall Timbers Research Station, 13093 Henry Beadel Drive, Tallahassee, FL 32312, USA
Bruce DavenportU.S. Forest Service, Tall Timbers Research Station, 13093 Henry Beadel Drive, Tallahassee, FL 32312, USA
David BrownlieU.S. Fish and Wildlife Service, Tall Timbers Research Station, 13093 Henry Beadel Drive, Tallahassee, FL 32312, USA
Paula SeamonThe Nature Conservancy, Tall Timbers Research Station, 13093 Henry Beadel Drive, Tallahassee, FL 32312, USA
Ronald E. Masters and Kevin RobertsonTall Timbers Research Station, 13093 Henry Beadel Drive, Tallahassee, FL 32312, USA
ABSTRACT
The Southeastern Fire Ecology Partnership is composed of fire ecologists from the U.S. Fish and Wildlife Service, USDA ForestService, National Park Service, The Nature Conservancy, and Tall Timbers Research Station. The Southeastern Fire Ecology Partnershipsupports science-based ideas and innovations in land management issues related to fire. This information is widely communicated andaccessible; it is extensively integrated into fire and land management decisions and actions, resulting in diverse, functioning landscapes.The partnership serves as a focal point for fire ecology information transfer, especially with regard to management issues on publiclands and lands managed primarily for ecosystem health. The partnership’s vision is that our efficient, creative, and cooperative effortswill lead to a workforce and society that understand and support the role of fire as a fundamental cultural, social, and ecological force.The mission of this group is to serve as a reference point for fire ecology issues in the southeastern United States and to supportcollaborative research, training, and education efforts within the field of fire ecology. As this partnership develops, it will serve as acentralized reference point known to academic, research, federal, state, and private communities regarding fire ecology issues in theSoutheast. An additional objective is to serve as a clearinghouse for identification and prioritization of cooperative fire ecology–relatedresearch and educational needs. By capitalizing on co-location at Tall Timbers Research Station, we have a unique opportunity to poolresources and realize a synergistic effect based on differing perspectives from all partners.
Citation: Noble, C.L., B. Davenport, D. Brownlie, P. Seamon, R.E. Masters, and K. Robertson. 2007. Southeast Fire Ecology Partnership[abstract]. Page 255 in R.E. Masters and K.E.M. Galley (eds.). Proceedings of the 23rd Tall Timbers Fire Ecology Conference: Fire inGrassland and Shrubland Ecosystems. Tall Timbers Research Station, Tallahassee, Florida, USA.
256
GOT TRUST? NATIONWIDE SURVEY RESULTS CONCERNINGPUBLIC TRUST IN GOVERNMENT FUELS AND FIRE
MANAGEMENT, AND PREFERENCES REGARDING FUELSREDUCTION METHODS
Sandra Rideout-HanzakTexas Tech University, Department of Range, Wildlife and Fisheries, Box 42125, Lubbock, TX 79409, USA
J.M. BowkerUSDA Forest Service, SRS-4901, 320 Green Street, Athens, GA 30602, USA
Siew-Hoon LimUniversity of Georgia, Economics Department, Athens, GA 30602, USA
H. Ken CordellTexas Tech University, Department of Range, Wildlife and Fisheries, Box 42125, Lubbock, TX 79409, USA
Gary T. GreenUniversity of Georgia, Daniel B. Warnell School of Forest Resources, Athens, GA 30602, USA
Cassandra Y. Johnson and Carter J. BetzTexas Tech University, Department of Range, Wildlife and Fisheries, Box 42125, Lubbock, TX 79409, USA
ABSTRACT
Much of the public’s attitude toward wildland fire as an important part of natural processes has been misguided, sometimes throughprograms perpetuating fear and misunderstanding of the vital role of fire in wildlands. Results presented here were part of a largerstudy that focused on the broad topic of public values, attitudes, and behaviors toward wildland fire. More specifically, the study wasintended to contribute to development of a comprehensive understanding of public values, attitudes, and behaviors, and to understandingpublic preferences related to wildland fuels and fire management. Unlike previous research, this study aimed to provide national or‘‘macro’’ level information. A broad-based national fire module was included with the ongoing National Survey on Recreation andthe Environment (NSRE 2000). The survey is telephone-administered via CATI (computer-aided telephone interviewing) programs andrandom digit dialing through the Survey Research Center at the University of Tennessee, Knoxville. A stratified random samplingprocedure was used, resulting in 6,979 completed responses. Results presented here will concern public trust in governments’ abilitiesto manage fuels and fire, and public preferences concerning fuel reduction methods. Results indicate that while there is a general trustin land management officials there are still concerns, particularly regarding ability and capacity to manage for fire in forest andrangelands, use of taxpayers’ money, and long-term forest health. The public also has some fairly clear preferences concerning firemanagement practices on public lands. Prescribed fire was most highly regarded between it, mechanical thinning, and chemicaltreatments. However, its use is not without concern. Harm to fish and wildlife, smoke management, and effects on scenery and recreationopportunities are among public concerns.
Citation: Rideout-Hanzak, S., J.M. Bowker, S.-H. Lim, H.K. Cordell, G.T. Green, C.Y. Johnson, and C.J. Betz. 2007. Got trust?Nationwide survey results concerning public trust in government fuels and fire management, and preferences regarding fuels reductionmethods [abstract]. Page 256 in R.E. Masters and K.E.M. Galley (eds.). Proceedings of the 23rd Tall Timbers Fire Ecology Conference:Fire in Grassland and Shrubland Ecosystems. Tall Timbers Research Station, Tallahassee, Florida, USA.
257
CONFERENCE PARTICIPANTS
Jim AnsleyTexas Agricultural Experiment StationP.O. Box 1658Vernon, TX 76385
Lisa BaggettTall Timbers Research Station13093 Henry Beadel DriveTallahassee, FL 32312
Robert (Bob) BaleThe Nature Conservancy108 Wade RoadLatham, NY 12110
Joanna BateThe Nature Conservancy of New Mexico1001 E. University Avenue, Building GLas Cruces, NM 88001
Ian BatterleyMacquarie University325/38-46 Albany StreetSt. Leonards, NSW 2065, Australia
Greg BaxterFERIC1176 Switzer DriveHinton, AB T7V 1V3, Canada
Neal BeetchU.S. Fish & Wildlife Service2276 Danielle CourtLoveland, CO 80537
Micah-John BeierleStephen F. Austin State UniversityP.O. Box 6109, SFA StationNacogdoches, TX 75962
Carole A. BellThe Nature Conservancy22115 Tenaja RoadMurrieta, CA 92562
Jessica BerrymanUniversity of HawaiiDepartment of Zoology2538 McCarthy MallHonolulu, HI 96822
Terry BidwellOklahoma State UniversityDepartment of Plant and Soil Sciences368 AGHStillwater, OK 74075
John M. BlairKansas State UniversityDivision of Biology232 Ackert HallManhattan, KS 66506
Doug BlexKansas Department of Wildlife & Parks1500 W. 7thP.O. Box 777Chanute, KS 66720
Heather BraggOklahoma Department of Environmental Quality707 N. RobinsonOklahoma City, OK 73102
Thomas B. BraggUniversity of Nebraska at OmahaDepartment of BiologyOmaha, NE 68182
Carlton M. BrittonTexas Tech UniversityDepartment of Range, Wildlife & Fisheries
ManagementMS2125Lubbock, TX 79409
Rebecca Britton2822 22nd StreetLubbock, TX 79410
Annie BrownBureau of Land ManagementUtah State OfficeP.O. Box 45155Salt Lake City, UT 84145
Karl BrownNational Park Service1201 Oakridge Drive, Suite 200Fort Collins, CO 80525
Ann M. BruceTall Timbers Research Station13093 Henry Beadel DriveTallahassee, FL 32312
Stephen BuntingUniversity of IdahoDepartment of Rangeland EcologyMoscow, ID 83844
Ross CarrieRaven Environmental ServicesP.O. Box 6482Huntsville, TX 77342
Mike CastellanoTexas Agricultural Experiment StationP.O. Box 1658Vernon, TX 76385
J. Michael CastilloWest Hawai‘i Wildfire Management OrganizationP.O. Box 6213Kamuela, HI 96743
Stacy ClarkUSDA Forest Service, Southern Research StationAlabama A&M UniversityP.O. Box 1387Normal, AL 35750
Gretel ClarkeArchbold Biological Station123 Main StreetVenus, FL 33960
Bryan CoppedgeOSU/TCC7505 W. 41stTulsa, OK 74063
Doug CramNew Mexico Cooperative Extension ServiceBox 30003, MSC 3AELas Cruces, NM 88003
Greg CreacyTexas Parks and Wildlife Department16955 State Highway 36 SouthSomerville, TX 77879
D. Chad CummingsOklahoma State UniversityDepartment of Plant & Soil Sciences474 Agriculture HallStillwater, OK 74078
Julie Daniels401 South Johnstone AvenueBartlesville, OK 74003
Aminu DaudaDadas Art & Business Inc.Kanda Highway StreetAccra 23321, Ghana
Mike DeBackerNational Park Service6424 W. Farm Road 182Republic, MO 65738
Jim DeCosterNational Park Service601 Riverfront DriveOmaha, NE 68102
Ryan DeSantisMichigan Technological UniversitySchool of Forest Resources & Environmental
SciencesHoughton, MI 49931
Brady DeVilleThe Noble Foundation2510 Sam Noble ParkwayArdmore, OK 73401
Chris DicusCalifornia Polytechnic State UniversityNatural Resources Management DepartmentSan Luis Obispo, CA 93402
David EngleIowa State UniversityDepartment of Natural Resource Ecology &
Management339 Science II, NREMAmes, IA 50011
Bret FlattThe Noble Foundation2510 Sam Noble ParkwayArdmore, OK 73401
Paulette FordUSDA Forest Service, Rocky Mountain Research
Station333 Broadway Street, Suite 115Albuquerque, NM 87102
Samuel D. FuhlendorfOklahoma State UniversityRangeland Ecology & Management368 AGHStillwater, OK 74078
Kaye GaineyTall Timbers Research Station13093 Henry Beadel DriveTallahassee, FL 32312
258 CONFERENCE PARTICIPANTS
Linn GassawayMt. Baker Snoqualmie National Forest21615 78th Avenue #5Edmonds, WA 98026
Matthew GerminoIdaho State University341 S. 9th StreetPocatello, ID 83201
Chan GlidewellSamuel Roberts Noble FoundationP.O. Box 2180Ardmore, OK 73402
Gerald J. GottfriedUSDA Forest Service, Rocky Mountain Research
StationTonto National Forest2324 E. McDowell RoadPhoenix, AZ 85006
Lane GreenTall Timbers Research Station13093 Henry Beadel DriveTallahassee, FL 32312
Susan GreenTall Timbers Research Station13093 Henry Beadel DriveTallahassee, FL 32312
Thomas A. GreeneThe Nature ConservancyP.O. Box 5190Fort Hood, TX 76544
Kristy HajnyKansas State UniversityDivision of BiologyManhattan, KS 66506
Steve HallgrenOklahoma State University008 Ag HallStillwater, OK 74078
Bob HamiltonThe Nature ConservancyTallgrass Prairie PreserveP.O. Box 458Pawhuska, OK 74056
Richy HarrodOkanogan & Wenatchee National Forests215 Melody LaneWenatachee, WA 98801
David C. HartnettKansas State UniversityKonza Prairie Biological Station232 Ackert HallManhattan, KS 66506
Barbi HayesHayes Environmental232 North MainElkhorn, NE 68022
Jana HeislerColorado State UniversityDepartment of Biology1878 Campus DeliveryFort Collins, CO 805231878
Kent HensleyKansas Department of Wildlife & ParksCedar Bluff Wildlife AreaP.O. Box 76AEllis, KS 67637
Karen HickmanOklahoma State UniversityDepartment of Plant & Soil Sciences368 Ag HallStillwater, OK 74078
Chris HiseFour Canyon PreserveThe Nature ConservancyP.O. Box 253Leedey, OK 73654
Bill HolimonArkansas Natural Heritage Commission1500 Tower Building323 Center StreetLittle Rock, AR 72201
John HolmanThe Noble FoundationP.O. Box 2180Ardmore, OK 73402
Grant HugginsResource Stewards, LLC6857 Mt. Washington RoadArdmore, OK 73401
Bruce HunterUniversity of North TexasP.O. Box 310559Denton, TX 76203
Kathy HutsonCook’s Branch Conservancy
Timothy IngalsbeeFirefighters United for Safety, Ethics & EcologyP.O. Box 51016Eugene, OR 97405
Ken IshmaelMiramar Fire Department24920 Via Lopex CourtRamona, CA 92065
Jim JohnsonThe Noble Foundation2510 Sam Noble ParkwayArdmore, OK 73401
David JurneyUSDA Forest Service605 West Main StreetRussellville, AR 72801
Mohammed A. KalkhanColorado State UniversityNatural Resource Ecology LaboratoryNESB-B236Fort Collins, CO 80523
Charles E. KayUtah State UniversityDepartment of Political ScienceLogan, UT 84322
Jonathan KelleyHuber Resources CorporationHC 70 Box 961Antlers, OK 74523
Jay KerbyOklahoma State University368 Ag HallStillwater, OK 74078
Paul KnightBureau of Indian Affairs1635 E. Highway 66El Reno, OK 73036
Jeremy KolaksMissouri Department of ConservationP.O. Box 138West Plains, MO 65775
Rick LarimoreIllinois Natural History Survey607 E. Peabody DriveChampaign, IL 61820
Sherry LeisMissouri Department of ConservationP.O. Box 368Clinton, MO 64735
Larry LevesqueThe Nature Conservancy-Oklahoma ChapterNickel PreserveOne Plaza South, Box 325Tahlequah, OK 74464
Chris MallekUniversity of California, Davis1061 Greene TerraceDavis, CA 95616
Jessica MartinUniversity of Idaho505 Residence StreetMoscow, ID 83843
Ron MastersTall Timbers Research Station13093 Henry Beadel DriveTallahassee, FL 32312
Steve MattaxOklahoma Department of Agriculture, Food &
Forestry2800 N. Lincoln BoulevardOklahoma City, OK 73105
Merlin McDonaldBureau of Indian AffairsOklahoma Fire Center301 NW 6th Street, Suite 311Oklahoma City, OK 73102
Daniel McGlinnOklahoma State UniversityBotany Department117 LSEStillwater, OK 74078
Caren McLemoreUniversity of North TexasDenton, TX 76203
Maria MelnechukThe Nature Conservancy601 N. University AvenueLittle Rock, AR 72205
Tim MenardU.S. Fish & Wildlife Service530 West MapleHartford, KS 66854
Jessica MieselThe Ohio State University300D Aronoff Laboratory318 W. 12th AvenueColumbus, OH 43210
Melanie MillerBLM-NIFC, Missoula Fire Lab5775 U.S. Highway 10 WestMissoula, MT 59808
259CONFERENCE PARTICIPANTS
Heloısa Sinatora MirandaUniversidade de BrasıliaDepartamento de EcologiaC.P. 0445770919–970 Brasılia-Distrito Federal, Brazil
Sarah MitchellHouston Advanced Research Center4800 Research ForestThe Woodlands, TX 77381
Ray MoranzOklahoma State University368 Agriculture HallStillwater, OK 74078
Greg MungerUSDA Forest Service5775 W. U.S. Highway 10Missoula, MT 59808
Shawn NortonThe Noble Foundation2510 Sam Noble ParkwayArdmore, OK 73401
Christopher O’MeiliaU.S. Fish and Wildlife Service222 South Houston Avenue, Suite ATulsa, OK 74127
Poncho OrtegaTexas A&M University-Kingsville700 University Boulevard, MSC 228Kingsville, TX 78363
John OrtmannThe Nature ConservancyNiobrara Project OfficeRoute 1, Box 348Johnstown, NE 69214
Tom OstertagTall Timbers Research Station13093 Henry Beadel DriveTallahassee, FL 32312
Brian OswaldStephen F. Austin State UniversityP.O. Box 6109, SFA StationNacogdoches, TX 75962
George R. ParkerPurdue University3570 Division RoadWest Lafayette, IN 47906
Michael A. PattenUniversity of OklahomaSutton Avian Research CenterP.O. Box 2007Bartlesville, OK 74005
William A. Patterson IIIUniversity of MassachusettsNatural Resources Conservation Forestry
Program214 HoldsworthAmherst, MA 01360
Kristen PeguesTexas Tech UniversityBox 42125Lubbock, TX 79409
Robert PennerThe Nature Conservancy1490 E. Highway 56Ellinwood, KA 67526
Cliff PetersonKansas Department of Wildlife & Parks2577 Pueblo RoadCanton, KS 67428
David W. PetersonUSDA Forest ServicePacific Northwest Research Station1133 N. Western AvenueWenatchee, WA 98801
Anne PhippsThe Farm4300 N. Meridian RoadTallahassee, FL 32312
Colin PhippsThe Farm4300 N. Meridian RoadTallahassee, FL 32312
Ian PhippsThe Farm4300 N. Meridian RoadTallahassee, FL 32312
Mike PorterThe Noble Foundation2510 Sam Noble ParkwayArdmore, OK 73401
Jennifer PottsUniversity of California, Berkeley1263 Gilman StreetBerkeley, CA 94706
Chris PowellUniversity of Idaho505 Residence StreetMoscow, ID 83843
Jay PruettThe Nature Conservancy of Oklahoma2727 E. 21st Street, Suite 102Tulsa, OK 74114
Luis Enrique RamirezTexas A&M University-Kingsville700 University Boulevard, MSC 218Kingsville, TX 78363
Charlotte ReemtsThe Nature ConservancyP.O. Box 5190Fort Hood, TX 76544
Dan ReinkingSutton Avian Research CenterP.O. Box 2007Bartlesville, OK 74005
Marcia RickeyArchbold Biological Station123 Main StreetVenus, FL 33960
Sandra Rideout-HanzakTexas Tech University2995 CR PAbernathy, TX 79311
Kevin M. RobertsonTall Timbers Research Station13093 Henry Beadel DriveTallahassee, FL 32312
Rose RodriguezTall Timbers Research Station13093 Henry Beadel DriveTallahassee, FL 32312
Margarete Naomi SatoUniversidade de BrasıliaDepartamento de EcologiaC.P. 0445770919-970 Brasılia-Distrito Federal, Brazil
Steve SeibertU.S. Fish & Wildlife Service2700 Refuge HQ RoadDecatur, AL 35603
Steve SherrodSutton Research CenterUniversity of OklahomaP.O. Box 2007Bartlesville, OK 74005
Fumiko ShirakuraOklahoma State UniversityBotany Department104 LSEStillwater, OK 74078
Ayn ShliskyThe Nature Conservancy2424 Spruce StreetBoulder, CO 80302
Mark SimmonsLady Bird Johnson Wildflower Center4801 La Crosse AvenueAustin, TX 78739
Jeff SparksNatural Resources CoordinatorTexas Parks & Wildlife Department16955 State Highway 36 S.Somerville, TX 77879
Eric StallerTall Timbers Research Station13093 Henry Beadel DriveTallahassee, FL 32312
Christina StallingsOklahoma Forestry Service2800 N. Lincoln BoulevardOklahoma City, OK 73105
Kenneth SteigmanLewisville Lake Wildlife Management AreaUniversity of North TexasP.O. Box 310559Denton, TX 76203
Scott StephensUniversity of California, BerkeleyDepartment of Environmental Science Policy &
Management139 Mulford HallBerkeley, CA 94720
Rich SterryU.S. Fish & Wildlife Service2150 Centre Avenue, Building EFort Collins, CO 80526
Neil SugiharaUSDA Forest Service3237 Peacekeeper WayMcClellan, CA 95652
Tim SwedbergJoint Fire Science Program3833 South Development AvenueBoise, ID 83705
Andi ThodeUSDA Forest Service3237 Peacekeeper Way, Building 200McClellan, CA 95652
260 CONFERENCE PARTICIPANTS
Andy ThorstensonNational Park ServiceWind Cave National Park26611 U.S. Highway 385Hot Springs, SD 57747
Cuong TranGriffith UniversityFaculty of Environmental SciencesPMB 50 GCMCBundall, Queensland 9726Australia
Lynne TrollopeUniversity of Fort HarePrivate Bag X1314Alice 5700, South Africa
Winston S.W. TrollopeUniversity of Fort HarePrivate Bag X1314Alice 5700, South Africa
Dirac TwidwellOklahoma State University368 Ag HallStillwater, OK 74078
David H. Van LearClemson UniversityDepartment of Forestry & Natural ResourcesClemson, SC 29634
Jan van WagtendonkU.S. Geological Survey, Yosemite Field StationP.O. Box 700El Portal, CA 95318
Lance T. VermeireUSDA-Agricultural Research ServiceFt. Keogh Livestock & Range Research
Laboratory243 Fort Keogh RoadMiles City, MT 59301
Jack WaymireOklahoma Department of WildlifeP.O. Box 397Clayton, OK 74563
Carl WeekleyArchbold Biological StationP.O. Box 2057Lake Placid, FL 33862
John R. WeirOklahoma State University4922 South Coyle RoadStillwater, OK 74074
Gary WeisenbergerP.O. Box 306Toronto, KA 66777
R. Montague Whiting, Jr.Stephen F. Austin State UniversityArthur Temple College of Forestry & AgricultureBox 6109, SFASU StationNacogdoches, TX 75962
Cody WienkNational Park ServiceWind Cave National Park26611 U.S. Highway 385Hot Springs, SD 57747
Robin WillsThe National Park Service1111 Jackson StreetOakland, CA 94607
Chris WilsonThe Nature Conservancy1 Plaza South, Box 325Tahlequah, OK 74464
Gary WilsonNational Park Service314A Biochemistry HallUniversity of NebraskaLincoln, NE 68583
Donald WolfeSutton Avian Research CenterP.O. Box 2007Bartlesville, OK 74005
Michael ZajicKansas Department of Wildlife & ParksWebster State Park1210 Nine RoadStockton, KS 67669
261
LIST OF REVIEWERS
Martin E. AlexanderAlan N. AndersenPatricia L. AndrewsR. James AnsleyDavid J. BrownlieMac A. Callaham, Jr.Susan CordellJim CoxDavid W. Crary, Jr.Bruce DavenportLeonard F. DeBanoDonald D. DeckerJustin DernerDaniel D. DeyPaul S. DoescherPeter W. DunwiddieDavid M. EngleR. Todd EngstromKurt Frederick
A. Malcolm GillDoria GordonRichard GuyetteChristian A. HagenKaren R. HickmanBruce HoaglandJ. A. ‘‘Andy’’ HubbardMarilyn JordanMartin F. JurggensenJay D. KerbyL. Katherine KirkmanSherry LeisRhonda LohGeorgianne W. MooreGreg NewmanThomas E. OstertagM. Keith OwensEvan Peacock
Ross J. PhillipsJennifer PottsMark B. RobbinsKevin M. RobertsonPaul SchmalzerNelson SiefkinTim SimmonsJeffrey C. Sparks*David W. StahleNeil SugiharaCharles A. ‘‘Butch’’ TaylorAndi ThodeJan W. van WagtendonkLinda WallaceJohn R. WeirDavid R. WeisePaul H. ZedlerJoseph D. Zeleznik
*Referee reviewed more than one paper.
Comments, insights, and opinions of reviewers are essential for maintaining the quality and credibility of scientificpublications. We sincerely appreciate the services provided by everyone who reviewed papers for these pro-ceedings.
REM, KEMG