Embed Size (px)
Citation preview

CoBiz Inc. 2005 Annual Report / TAKING SHAPECORPORATE HEADQUARTERS821 Seventeenth StreetDenver, Colorado 80202ph 303 / 312 / 3412fx 303 / 244 / 9700
INVESTOR RELATIONSLyne Andrich / [email protected] Hermann / [email protected]
TRANSFER AGENTComputershare Trust Company350 Indiana Street, Suite 800Golden, CO 80401303 / 262 / 0600
NASDAQ / COBZ
WWW.COBIZINC.COM
Co
Biz Inc. / 2005 A
nn
ual Report

SEVEN INDEPENDENT ENTITIES...
/ COBIZ INC. BOARD OF DIRECTORS Steven Bangert Chairman of the Board and CEO, CoBiz Inc. Chairman of the Board, Colorado Business Bank & Arizona Business Bank
Michael B. Burgamy Investor
Jerry W. Chapman Investor
Morgan Gust President, Giant Industries, Inc.
Thomas M. Longust Chairman and CEO, Longust Distributing, Inc.
Jonathan C. Lorenz Vice Chair, CoBiz Inc. Vice Chair and CEO, Colorado Business Bank & Arizona Business Bank
Evan Makovsky General Partner, Shames-Makovsky Realty Co.
Harold F. Mosanko Vice Chair, Colorado Business Bank & Arizona Business Bank
Howard R. Ross President, H.R. Financial, Inc.
Noel N. Rothman President, NAMTOR, Inc.
Timothy J. Travis President and CEO, Eaton Metal Products
Mary Beth Vitale Co-Founder and Principal, Pellera, LLC
Mary M. White President and CEO, Swedish Medical Center / BANK BOARD OF DIRECTORS Verner W. Averch Investor
Steven Bangert Chairman of the Board, Colorado Business Bank & Arizona Business Bank Chairman of the Board and CEO, CoBiz Inc.
Virginia K. Berkeley President, Colorado Business Bank-Denver
Michael B. Burgamy Investor
Joy S. Burns President and Owner, The Burnsley Hotel President, D.C. Burns Realty & Trust Co.
Thomas J. Chandler CEO, Meadow Homes
Jonathan C. Lorenz Vice Chair and CEO, Colorado Business Bank & Arizona Business Bank Vice Chair, CoBiz Inc.
Evan Makovsky General Partner, Shames-Makovsky Realty Co.
Harold F. Mosanko Vice Chair, Colorado Business Bank and Arizona Business Bank
Howard R. Ross President, H.R. Financial, Inc.
COLORADO BUSINESS BANK
ARIZONA BUSINESS BANK
FINANCIAL DESIGNS LTD.
GREEN MANNING & BUNCH, LTD.
ALEXANDER CAPITAL MANAGEMENT GROUP
COBIZ INSURANCE, INC.
COBIZ PRIVATE ASSET MANAGEMENT

CoBiz Inc. / Annual Report 2005
Taken separately, the basic shapes have a simple elegance; but when you combine them, something remarkable happens. A new design emerges, one with complexity and sophistication where each piece retains its original objective but becomes part of a bigger, richer picture. The independent elements are made better, deeper by being part of the larger whole, and that larger whole wouldn’t be possible if even one of the pieces was missing.
A commercial bank. A property and casualty insurance company. An investment banking fi rm. A provider of wealth transfer and executive and employee benefi ts planning. An investment advisor. These are the “shapes” that have come together to form COBIZ INC., a company uniquely able to meet the complete fi nancial needs of businesses and professionals, a company of sophisticated intersections, complementary strengths and outstanding depth.
CLEARLY, THINGS HAVE TAKEN SHAPE AT COBIZ.
...COME TOGETHER TO MAKE ONE SOPHISTICATED COMPANY.

2
Steven Bangert, CoBiz Inc. chairman and CEO; Jonathan C. Lorenz, CoBiz Inc. vice chair
CoBiz Inc. / Annual Report 2005
3
SHAREHOLDER’S LETTER
Dear Shareholders, Customers, Employees and Friends:
After just 10 years, COBIZ INC. has become a full-fl edged fi nancial services company with $1.93 billion in assets, 18 bank locations and fi ve fee-based companies serving the needs of small to mid-sized businesses and professionals. We spent our fi rst decade assembling a family of great companies; we entered our second with a focus on further improving these already impressive elements while blending them into a seamless full-service fi nancial provider focused on meeting the complete needs of our customers.
Our success is derived from the amazing companies that make up COBIZ. We continue to attract senior-level professionals – leaders in their respective industries – who help position us at the forefront in everything from sophisticated banking products such as hedges and swaps, to wellness programs that are on the leading edge in the employee benefi ts arena. We have the talent, the expertise and the vision to make everyday fi nancial services anything but.
Although our success has been driven by the individual elements of our company, our continuing strength will come from how they have come together. Not only are we able to serve the complete fi nancial lifecycle of our business customers, but our companies are also able to work together to develop a comprehensive solution that doesn’t just meet those needs, but anticipates them.
Is it working? In 2005, we enjoyed another strong year including:
> 14% growth in net income, to $20.0 million from $17.6 million in 2004.> Earnings per share (diluted) of $0.87 from $0.78, a 12% increase.> Maturation of Arizona Business Bank into a real contributor to the company’s bottom line.> Net income growth of 25% from our banks, which continue to drive the company’s results.> 14% asset growth that has taken us to the brink of $2.0 billion.
But, as always, our total success cannot be judged simply by the numbers. It’s important to dig deeper … to witness how we provide high quality fi nancial services within a customer service-focused culture … to observe how each of our companies is driving increased success within the others … to see how things have taken shape at COBIZ.
CoBiz Inc. / Annual Report 2005
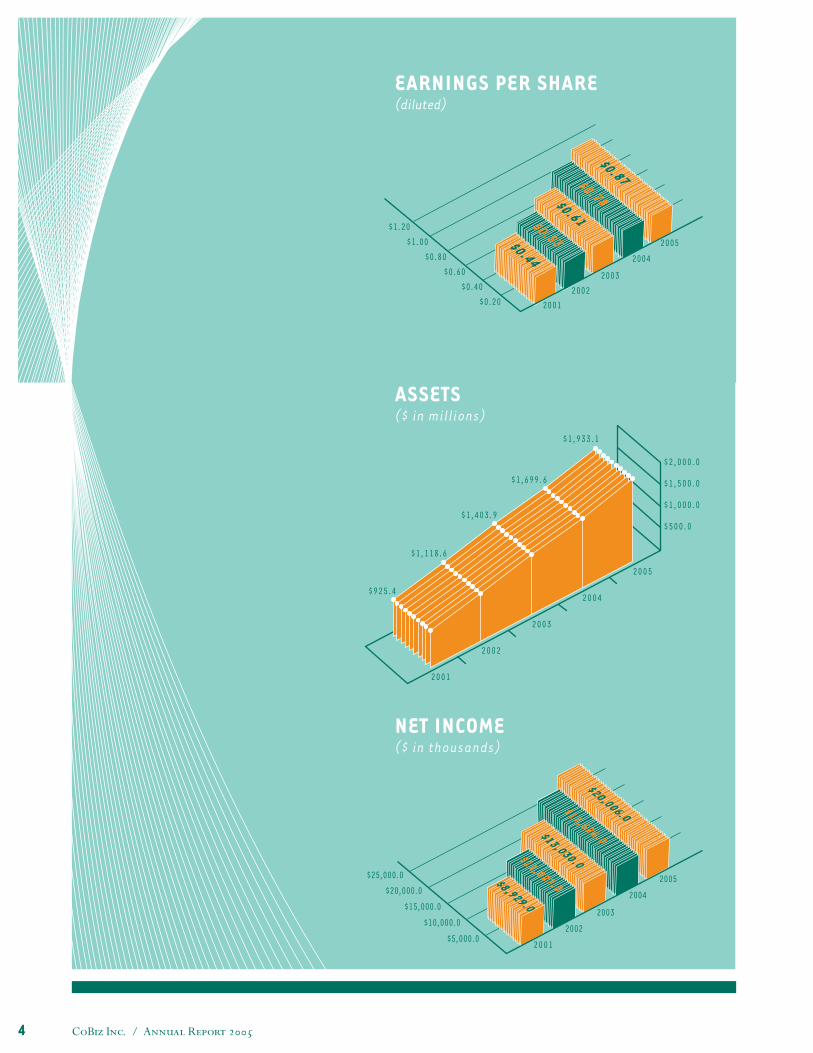
EARNINGS PER SHARE (diluted)
CoBiz Inc. / Annual Report 20054
ASSETS($ in millions)
NET INCOME($ in thousands)
CoBiz Inc. / Annual Report 2005
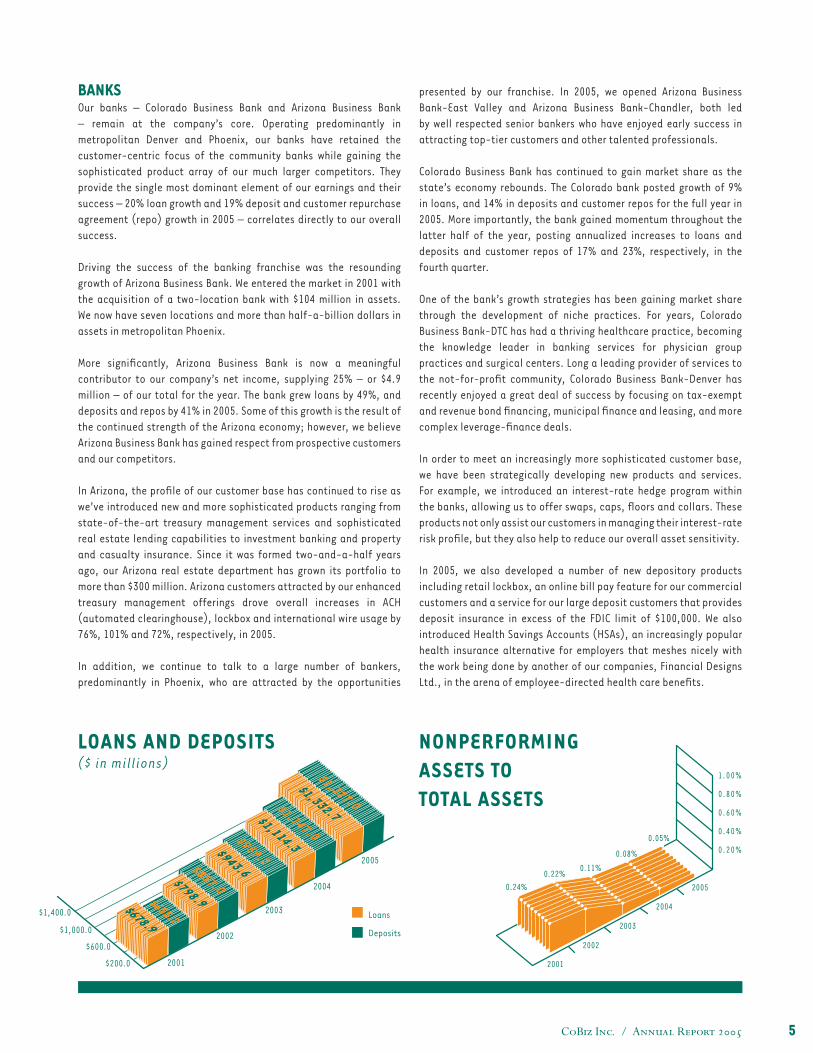
BANKSOur banks – Colorado Business Bank and Arizona Business Bank – remain at the company’s core. Operating predominantly in metropolitan Denver and Phoenix, our banks have retained the customer-centric focus of the community banks while gaining the sophisticated product array of our much larger competitors. They provide the single most dominant element of our earnings and their success – 20% loan growth and 19% deposit and customer repurchase agreement (repo) growth in 2005 – correlates directly to our overall success.
Driving the success of the banking franchise was the resounding growth of Arizona Business Bank. We entered the market in 2001 with the acquisition of a two-location bank with $104 million in assets. We now have seven locations and more than half-a-billion dollars in assets in metropolitan Phoenix.
More signifi cantly, Arizona Business Bank is now a meaningful contributor to our company’s net income, supplying 25% – or $4.9 million – of our total for the year. The bank grew loans by 49%, and deposits and repos by 41% in 2005. Some of this growth is the result of the continued strength of the Arizona economy; however, we believe Arizona Business Bank has gained respect from prospective customers and our competitors.
In Arizona, the profi le of our customer base has continued to rise as we’ve introduced new and more sophisticated products ranging from state-of-the-art treasury management services and sophisticated real estate lending capabilities to investment banking and property and casualty insurance. Since it was formed two-and-a-half years ago, our Arizona real estate department has grown its portfolio to more than $300 million. Arizona customers attracted by our enhanced treasury management offerings drove overall increases in ACH (automated clearinghouse), lockbox and international wire usage by 76%, 101% and 72%, respectively, in 2005.
In addition, we continue to talk to a large number of bankers, predominantly in Phoenix, who are attracted by the opportunities
presented by our franchise. In 2005, we opened Arizona Business Bank-East Valley and Arizona Business Bank-Chandler, both led by well respected senior bankers who have enjoyed early success in attracting top-tier customers and other talented professionals.
Colorado Business Bank has continued to gain market share as the state’s economy rebounds. The Colorado bank posted growth of 9% in loans, and 14% in deposits and customer repos for the full year in 2005. More importantly, the bank gained momentum throughout the latter half of the year, posting annualized increases to loans and deposits and customer repos of 17% and 23%, respectively, in the fourth quarter.
One of the bank’s growth strategies has been gaining market share through the development of niche practices. For years, Colorado Business Bank-DTC has had a thriving healthcare practice, becoming the knowledge leader in banking services for physician group practices and surgical centers. Long a leading provider of services to the not-for-profi t community, Colorado Business Bank-Denver has recently enjoyed a great deal of success by focusing on tax-exempt and revenue bond fi nancing, municipal fi nance and leasing, and more complex leverage-fi nance deals.
In order to meet an increasingly more sophisticated customer base, we have been strategically developing new products and services. For example, we introduced an interest-rate hedge program within the banks, allowing us to offer swaps, caps, fl oors and collars. These products not only assist our customers in managing their interest-rate risk profi le, but they also help to reduce our overall asset sensitivity.
In 2005, we also developed a number of new depository products including retail lockbox, an online bill pay feature for our commercial customers and a service for our large deposit customers that provides deposit insurance in excess of the FDIC limit of $100,000. We also introduced Health Savings Accounts (HSAs), an increasingly popular health insurance alternative for employers that meshes nicely with the work being done by another of our companies, Financial Designs Ltd., in the arena of employee-directed health care benefi ts.
5
NONPERFORMINGASSETS TOTOTAL ASSETS
LOANS AND DEPOSITS($ in millions)
CoBiz Inc. / Annual Report 20056
Of course, one of our hallmarks has been our consistently superior asset quality, which has allowed us to deliver strong earnings since we went public in 1998. Since then, we have maintained our nonperforming assets as a percentage of total assets below 25 basis points; we ended 2005 at 5 basis points. Even as we’ve begun originating larger and more complex loans – particularly in real estate – we’ve been diligent in maintaining our stringent loan review process and underwriting standards.
FEE-BASED BUSINESSESWhen we initially began offering trust and fi duciary services in 1998, it wasn’t exactly revolutionary for a bank to do so. But as we’ve added our other segments – investment banking, insurance, and investment advisory and trust – we have created something unique.
No other fi nancial services company headquartered in Colorado or Arizona is able to offer the depth and breadth of services that we can. No one else is doing it with a disciplined focus on serving the needs of small to mid-sized businesses and professionals. And, without a doubt, no one is doing it as successfully as we are.
We began acquiring fee-based companies that were recognized as market leaders in 2001. Sometimes, we took profi table companies and – for a time – made them less so as we invested in and strengthened their back-offi ce functions to allow them to go to the next level. Our investment has paid off: these companies are now consistently posting very solid results and have been net contributors for the last two years.
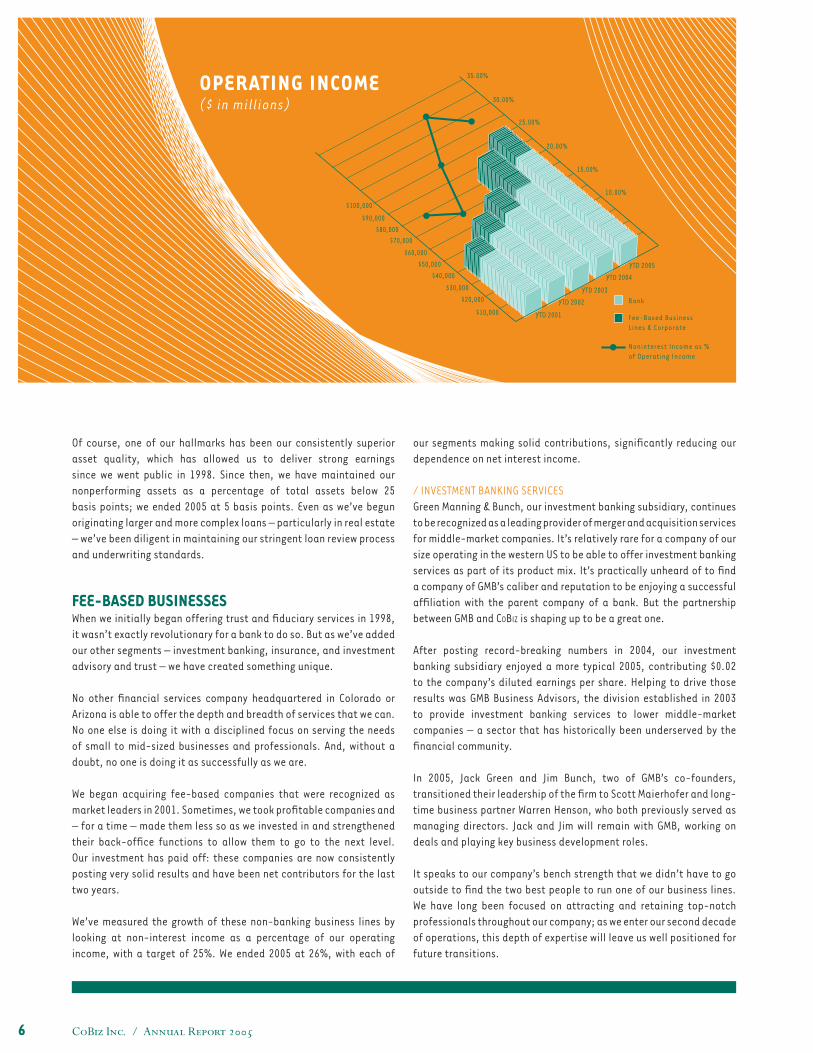
We’ve measured the growth of these non-banking business lines by looking at non-interest income as a percentage of our operating income, with a target of 25%. We ended 2005 at 26%, with each of
our segments making solid contributions, signifi cantly reducing our dependence on net interest income.
/ INVESTMENT BANKING SERVICESGreen Manning & Bunch, our investment banking subsidiary, continues to be recognized as a leading provider of merger and acquisition services for middle-market companies. It’s relatively rare for a company of our size operating in the western US to be able to offer investment banking services as part of its product mix. It’s practically unheard of to fi nd a company of GMB’s caliber and reputation to be enjoying a successful affi liation with the parent company of a bank. But the partnership between GMB and COBIZ is shaping up to be a great one.
After posting record-breaking numbers in 2004, our investment banking subsidiary enjoyed a more typical 2005, contributing $0.02 to the company’s diluted earnings per share. Helping to drive those results was GMB Business Advisors, the division established in 2003 to provide investment banking services to lower middle-market companies – a sector that has historically been underserved by the fi nancial community.
In 2005, Jack Green and Jim Bunch, two of GMB’s co-founders, transitioned their leadership of the fi rm to Scott Maierhofer and long-time business partner Warren Henson, who both previously served as managing directors. Jack and Jim will remain with GMB, working on deals and playing key business development roles.
It speaks to our company’s bench strength that we didn’t have to go outside to fi nd the two best people to run one of our business lines. We have long been focused on attracting and retaining top-notch professionals throughout our company; as we enter our second decade of operations, this depth of expertise will leave us well positioned for future transitions.
OPERATING INCOME($ in millions)
CoBiz Inc. / Annual Report 2005 7
/ INSURANCEOur insurance segment – comprised of Financial Designs Ltd. (FDL) and CoBiz Insurance – is a unique intersection between serving the business and the business owner. Our wealth transfer services area focuses on minimizing taxes and assisting in business succession planning for the owner, while our employee and executive benefi t departments focus on key solutions for the business. Our insurance products preserve both the assets of the business owner and the property of the business.
This segment grew revenues by 13% in 2005, contributing $0.02 to the company’s diluted earnings per share. Much of the growth came from FDL’s employee benefi ts practice and the property and casualty insurance business which increased their revenues by 22% and 21%, respectively, over 2004’s results.
FDL added a dedicated 401(k) consultant to its employee benefi ts division in 2005, better positioning the group to work with middle- and large-case markets. The addition is complemented by the division’s work on employee-directed health care benefi ts and employee wellness programs. These efforts have truly placed FDL at the vanguard of the benefi ts industry, and they have been very well received in the health-conscious markets we serve.
Also in 2005, CoBiz Insurance established operations in Phoenix through the hiring of a senior insurance executive with more than two decades in the industry. We continue to look for opportunities to introduce our full product line in this important marketplace.
/ INVESTMENT ADVISORY AND TRUSTOur investment advisory and trust segment is represented by Alexander Capital Management Group and CoBiz Private Asset Management. Although still a relatively small part of the company, this segment
has grown its discretionary assets under management to over $500 million. Part of their success may be attributed to their investment performance: their large-cap core equity product’s one-, three-, fi ve- and 10-year returns have exceeded that of their benchmark – the S&P 500.
We continue to add to our offerings and ability in this segment, spending much of 2005 building out the segment’s infrastructure and back-offi ce depth. We’re now able to offer a more comprehensive suite of portfolio styles and options that can be tailored to the goals and risk profi les of individual and institutional customers in a very tax-effi cient manner.
In 2005, we launched an important effort to develop a new and enhanced delivery system for our wealth management services. Utilizing an open architecture platform, we are seeking a better approach to delivering all of our products across company lines. This effort will develop the nexus between each of our businesses, the point at which we’re able to deliver complete fi nancial solutions rather than just outstanding products. Although the investment advisory and trust segment is just one part of this effort, we believe it will be instrumental to its success.
OUR COMPANYWe started 2006 full of enthusiasm for the promise this new year holds. With the Arizona economy showing no signs of cooling off and the Colorado economy fi nally shifting from recovery to expansion, we anticipate strong loan growth from both markets. We continue to see interest from senior-level bankers who are attracted to our entrepreneurial model, not to mention our impressive track record of success; with that level of interest we anticipate opening more banks in both Colorado and Arizona. As we look for ways to introduce more of
CoBiz Inc. / Annual Report 20058
our fee-based businesses to the Arizona market, we are also working to build cross referrals throughout the company.
We have always been very conscious of the returns we provide to our shareholders, likely because we are shareholders, too. In 2005, we refi nanced a $20.0 million pooled trust-preferred securities offering at a more attractive rate, resulting in a subsequent improvement to our net income. We are always diligent in ensuring we deploy our capital effi ciently and actively monitor our capital position. To allow us fl exibility, we fi led a universal shelf registration last year that allows us to issue any combination of debt securities, preferred stock, depositary shares, common stock and securities warrants from time to time in one or more offerings up to a total dollar amount of $100.0 million. Although we presently have no intentions of issuing additional capital, the shelf will allow us to react quickly to market conditions and the company’s capital needs.
Early in 2006, we added another member to the COBIZ board of directors. Morgan Gust is president of Giant Industries, Inc., a NYSE-listed independent oil company. His experiences in energy and agriculture add to the expertise of our board, and his familiarity with the Arizona marketplace will be invaluable as we expand our franchise in that state.
One of the great strengths of our company is our ongoing commitment to the communities we serve. Each year, we contribute dollars and volunteer time to benefi t great causes because we believe that our “corporate family” – and our responsibility to it – goes well beyond the reaches of our front doors. As just one example of this commitment, we began our signature fundraising event – the Biz Bash – in Denver just fi ve years ago. Since then, we’ve raised almost $750,000 to benefi t agencies serving at-risk kids. We remain committed to making a difference in the lives of others.
As we enter our second decade, we must give thanks and appreciation to our dedicated employees. We are quickly approaching a staff of 500 and have again been rated one of the best places to work in both Colorado and Arizona. We are proud of the efforts of our employees and recognize that they are our strength, our competitive advantage and the link between our products and our customers. We are successful because they make us so.
Whether you’re new to COBIZ or are well familiar with our outstanding track record, I hope you remain engaged in the ongoing story of our growth and success. We’re pleased to thank our customers, employees, directors and shareholders for your continued support of our company.
Respectfully,
Steven Bangert
Chairman and Chief Executive Offi cer
Jonathan C. Lorenz
Vice Chair
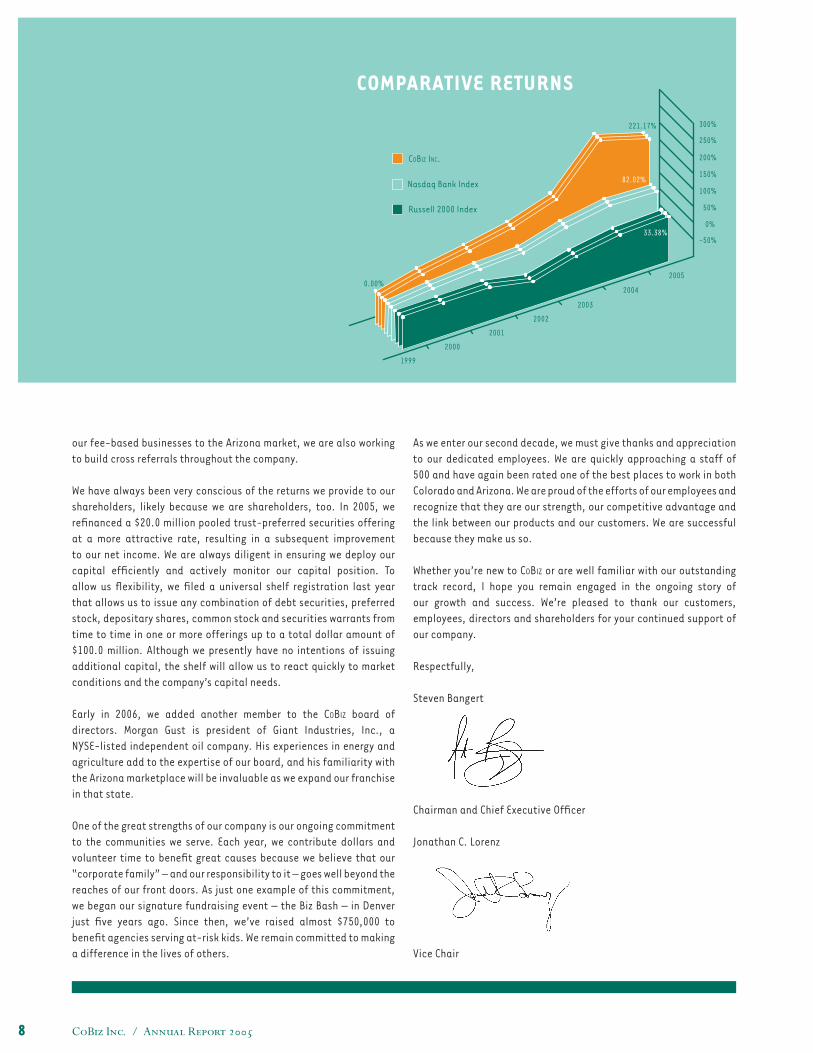
COMPARATIVE RETURNS
CoBiz Inc. / Annual Report 2005 1
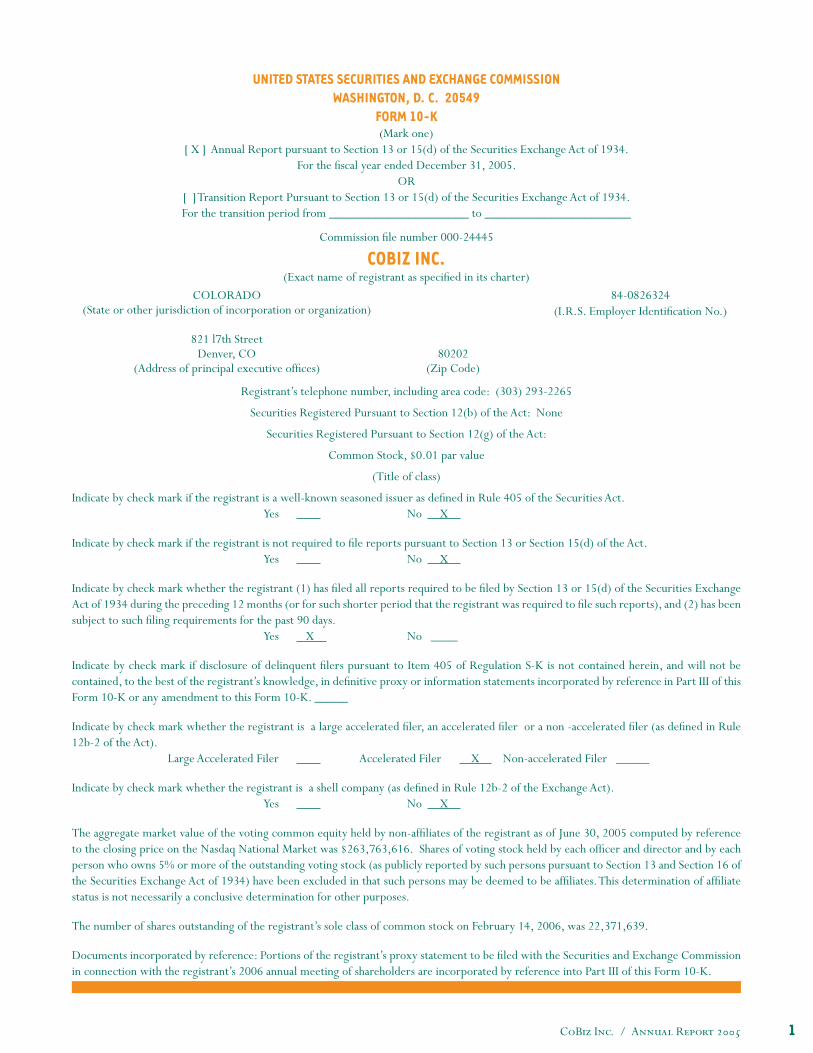
UNITED STATES SECURITIES AND EXCHANGE COMMISSIONWASHINGTON, D. C. 20549
FORM 10-K(Mark one)
[ X ] Annual Report pursuant to Section 13 or 15(d) of the Securities Exchange Act of 1934.For the fi scal year ended December 31, 2005.
OR[ ] Transition Report Pursuant to Section 13 or 15(d) of the Securities Exchange Act of 1934.For the transition period from _____________________ to ______________________
Commission fi le number 000-24445
COBIZ INC.(Exact name of registrant as specifi ed in its charter)
Registrant’s telephone number, including area code: (303) 293-2265
Securities Registered Pursuant to Section 12(b) of the Act: None
Securities Registered Pursuant to Section 12(g) of the Act:
Common Stock, $0.01 par value
(Title of class)
Indicate by check mark if the registrant is a well-known seasoned issuer as defi ned in Rule 405 of the Securities Act. Yes No X
Indicate by check mark if the registrant is not required to fi le reports pursuant to Section 13 or Section 15(d) of the Act. Yes No X
Indicate by check mark whether the registrant (1) has fi led all reports required to be fi led by Section 13 or 15(d) of the Securities Exchange Act of 1934 during the preceding 12 months (or for such shorter period that the registrant was required to fi le such reports), and (2) has been subject to such fi ling requirements for the past 90 days. Yes X No ____
Indicate by check mark if disclosure of delinquent fi lers pursuant to Item 405 of Regulation S-K is not contained herein, and will not be contained, to the best of the registrant’s knowledge, in defi nitive proxy or information statements incorporated by reference in Part III of this Form 10-K or any amendment to this Form 10-K. _____
Indicate by check mark whether the registrant is a large accelerated fi ler, an accelerated fi ler or a non -accelerated fi ler (as defi ned in Rule 12b-2 of the Act).
Large Accelerated Filer Accelerated Filer X Non-accelerated Filer _____
Indicate by check mark whether the registrant is a shell company (as defi ned in Rule 12b-2 of the Exchange Act). Yes No X
The aggregate market value of the voting common equity held by non-affi liates of the registrant as of June 30, 2005 computed by reference to the closing price on the Nasdaq National Market was $263,763,616. Shares of voting stock held by each offi cer and director and by each person who owns 5% or more of the outstanding voting stock (as publicly reported by such persons pursuant to Section 13 and Section 16 of the Securities Exchange Act of 1934) have been excluded in that such persons may be deemed to be affi liates. This determination of affi liate status is not necessarily a conclusive determination for other purposes.
The number of shares outstanding of the registrant’s sole class of common stock on February 14, 2006, was 22,371,639.
Documents incorporated by reference: Portions of the registrant’s proxy statement to be fi led with the Securities and Exchange Commission in connection with the registrant’s 2006 annual meeting of shareholders are incorporated by reference into Part III of this Form 10-K.
COLORADO(State or other jurisdiction of incorporation or organization)
821 l7th StreetDenver, CO
(Address of principal executive offi ces) 80202
(Zip Code)
84-0826324(I.R.S. Employer Identifi cation No.)
CoBiz Inc. / Annual Report 20052
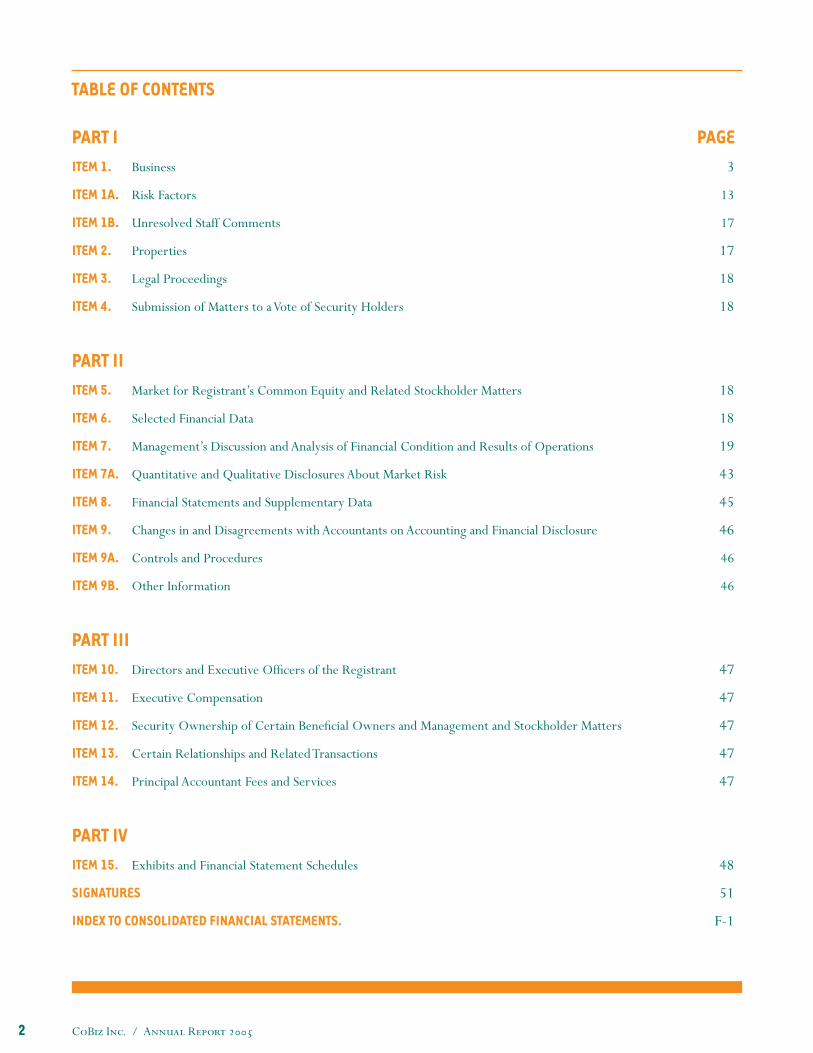
TABLE OF CONTENTS
PART I PAGEITEM 1. Business 3
ITEM 1A. Risk Factors 13
ITEM 1B. Unresolved Staff Comments 17
ITEM 2. Properties 17
ITEM 3. Legal Proceedings 18
ITEM 4. Submission of Matters to a Vote of Security Holders 18
PART IIITEM 5. Market for Registrant’s Common Equity and Related Stockholder Matters 18
ITEM 6. Selected Financial Data 18
ITEM 7. Management’s Discussion and Analysis of Financial Condition and Results of Operations 19
ITEM 7A. Quantitative and Qualitative Disclosures About Market Risk 43
ITEM 8. Financial Statements and Supplementary Data 45
ITEM 9. Changes in and Disagreements with Accountants on Accounting and Financial Disclosure 46
ITEM 9A. Controls and Procedures 46
ITEM 9B. Other Information 46
PART IIIITEM 10. Directors and Executive Offi cers of the Registrant 47
ITEM 11. Executive Compensation 47
ITEM 12. Security Ownership of Certain Benefi cial Owners and Management and Stockholder Matters 47
ITEM 13. Certain Relationships and Related Transactions 47
ITEM 14. Principal Accountant Fees and Services 47
PART IVITEM 15. Exhibits and Financial Statement Schedules 48
SIGNATURES 51
INDEX TO CONSOLIDATED FINANCIAL STATEMENTS. F-1
CoBiz Inc. / Annual Report 2005 3
A WARNING ABOUT FORWARD-LOOKING STATEMENTS
This report contains forward-looking statements that describe CoBiz’s future plans, strategies and expectations. All forward-looking statements are based on assumptions and involve risks and uncertainties, many of which are beyond our control and which may cause our actual results, performance or achievements to differ materially from the results, performance or achievements contemplated by the forward-looking statements. Forward-looking statements can be identifi ed by the fact that they do not relate strictly to historical or current facts. They often include words such as “believe,” “expect,” “anticipate,” “intend,” “plan,” “estimate” or words of similar meaning, or future or conditional verbs such as “will,” “would,” “should,” “could” or “may.” Forward-looking statements speak only as of the date they are made. Important factors that could cause actual results to differ materially from our expectations are disclosed under “Risk Factors” and elsewhere in this report, including, without limitation, in conjunction with the forward-looking statements included in this report.
We undertake no obligation to publicly update or otherwise revise any forward-looking statements, whether as a result of new information, future events or otherwise.
PART I
ITEM 1. BUSINESS/ OVERVIEWCoBiz Inc. (“CoBiz” or the “Company”) is a diversifi ed fi nancial holding company headquartered in Denver, Colorado. We were incorporated in Colorado on February 19, 1980, as Equitable Bancorporation, Inc. Prior to its initial public offering in June 1998, the Company was acquired by a group of private investors in September 1994 who are still current shareholders.
Our wholly owned subsidiary CoBiz Bank, N.A. (the “Bank,” previously named American Business Bank, N.A.), is a full-service business banking institution with 11 Colorado locations, including eight in the Denver metropolitan area, two in Boulder and one just west of Vail, and seven Arizona locations serving the Phoenix metropolitan area and the surrounding area of Maricopa County. The Bank operates in its Colorado market areas under the name Colorado Business Bank and in its Arizona market areas under the name Arizona Business Bank. At December 31, 2005, we had total assets of $1.9 billion, net loans of $1.3 billion, and deposits of $1.3 billion.
Our banking products are complemented by our fee-based business lines which we fi rst introduced in 1998 when we began offering trust and estate administration services. Through a combination of internal growth and acquisitions, our fee-based business lines have grown to include employee benefi ts brokerage and consulting, insurance brokerage, wealth transfer planning, life insurance, investment banking and investment management services.
Support functions for our bank branch and fee-based business offi ces such as accounting, data processing, bookkeeping, credit administration, loan operations, human resources, audit, compliance, loan review, and investment and cash management services are conducted centrally from our downtown Denver offi ce. As a result of this operating approach, we believe we are well positioned to attract and serve our target customers, combining the elements of personalized service found in community banks with sophisticated banking products and services traditionally offered by larger regional banks.
/ 2003 ACQUISITIONSOn April 1, 2003, we acquired Alexander Capital Management Group, Inc., an SEC-registered investment adviser fi rm based in Denver, Colorado. The acquisition was accounted for using the purchase method of accounting, and accordingly, the results of Alexander Capital Management Group, Inc.’s operations have been included in our consolidated fi nancial statements since the date of purchase. The acquisition of Alexander Capital Management Group, Inc. was completed through a merger of Alexander Capital Management Group, Inc. into a wholly owned subsidiary that was formed in order to consummate the transaction and then a subsequent contribution of the assets and liabilities of the merged entity into a newly formed limited liability company called Alexander Capital Management Group, LLC (“ACMG”). The former owners of Alexander Capital Management Group, Inc. have retained a 20% profi ts interest in ACMG.
On April 14, 2003, we acquired Financial Designs Ltd. (“FDL”), a provider of wealth transfer and employee benefi t services based in Denver, Colorado. The acquisition was accounted for using the purchase method of accounting, and accordingly, the results of FDL’s operations have been included in the consolidated fi nancial statements since the date of purchase. The acquisition of FDL was completed through a merger of FDL into CoBiz Connect, Inc., a wholly owned subsidiary of CoBiz that has provided employee benefi ts consulting services since 2000. The surviving corporation continues to use the FDL name.
CoBiz Inc. / Annual Report 20054
/ 2001 ACQUISITIONSOn March 1, 2001, we acquired Milek Insurance Services, Inc. (“Milek”). The agency, which was renamed CoBiz Insurance, Inc., provides commercial and personal property and casualty insurance (“P&C”) brokerage, as well as risk management consulting services to small and medium-sized businesses and individuals. The acquisition was structured as a stock purchase where the shareholders of Milek received shares of CoBiz common stock as consideration for the acquisition. This transaction was accounted for as a pooling of interests.
On March 8, 2001, we acquired First Capital Bank of Arizona (“First Capital”), an Arizona state-chartered commercial bank with two locations serving Phoenix and the surrounding area of Maricopa County, Arizona. The acquisition was structured as a merger between First Capital and a wholly owned subsidiary formed to participate in the merger. As a result of the merger, First Capital shareholders received shares of our common stock and First Capital became our wholly owned subsidiary. The transaction was accounted for as a pooling of interests.
On July 10, 2001, we acquired Green Manning & Bunch, Ltd. (“GMB”), a 13-year-old investment banking fi rm based in Denver, Colorado. The acquisition of GMB, which is a limited partnership, was completed through CoBiz GMB Inc., a wholly owned subsidiary formed to consummate the transaction. In the acquisition: (i) the corporate general partner of GMB was merged into CoBiz GMB, Inc., with the shareholders of the general partner receiving a combination of cash, shares of our common stock and the right to receive future earn-out payments; and (ii) CoBiz GMB, Inc. acquired all of the limited partnership interests of GMB in exchange for cash, shares of CoBiz GMB, Inc. Class B Common Stock (the “CoBiz GMB, Inc. Shares”) and the right to receive future earn-out payments. The CoBiz GMB, Inc. Shares represented a 2% interest in CoBiz GMB, Inc. and had no voting rights. After two years, or sooner under certain circumstances, the holders of the CoBiz GMB, Inc. Shares had the right to require the Company to exchange the CoBiz GMB, Inc. Shares for shares of our common stock. The transaction was accounted for as a purchase. The holders of the CoBiz GMB, Inc. Shares exercised their right to exchange the CoBiz GMB, Inc. Shares for our common stock and such shares were issued on August 2, 2003.
/ OPERATING SEGMENTSWe operate six distinct segments, as follows:
> Business banking in the Colorado market through Colorado Business Bank> Business banking in the Arizona market through Arizona Business Bank> Investment banking services> Investment advisory and trust services> Insurance> Corporate Support and Other
These segments, excluding Corporate Support and Other, consist of various products and activities that are set forth in the following chart:
Business banking throughColorado Business Bank and Arizona Business Bank
• Treasury management services• Commercial and industrial loans• Real estate loans• Consumer loans• Private banking• Internet banking• Lockbox services• Courier services• Deposit services
Investment Banking Services • Merger and acquisition advisory services• Institutional private placements of debt and equity• Strategic fi nancial services
Investment Advisory and Trust Services • Asset management of relative value stock and high-quality bond portfolios for high-net-worth individuals, foundations, endowments, and public and private institutions
• Fiduciary services• Estate planning and administration
Insurance • Wealth preservation• Executive benefi ts• Employee benefi ts• Property and casualty
For a more complete discussion of the segments included in our principal activities and for certain fi nancial information for each segment, see Note 19 to our Consolidated Financial Statements.
CoBiz Inc. / Annual Report 2005 5
/ BUSINESS STRATEGY Our primary strategy is to differentiate ourselves from our competitors by providing our local presidents with substantial decision-making authority, and expanding our products and services to meet the needs of small to medium-sized businesses and high-net-worth individuals. In all areas of our operations, we focus on attracting and retaining the highest quality personnel by maintaining an entrepreneurial culture and decentralized business approach. In order to realize our strategic objectives, we are pursuing the following strategies: Organic Growth. We believe the Colorado and Arizona markets provide us with signifi cant opportunities for internal growth. These markets are currently dominated by a number of large regional and national fi nancial institutions that have acquired locally based banks. We believe this consolidation has created gaps in the banking industry’s ability to serve certain customers in these market areas because small and medium-sized businesses often are not large enough to warrant signifi cant marketing focus and customer service from large banks. In addition, we believe these banks often do not satisfy the needs of high-net-worth individuals who desire personal attention from experienced bankers. Similarly, we believe many of the remaining independent banks in the region do not provide the sophisticated banking products and services such customers require. Through our ability to combine personalized service, experienced personnel who are established in their community, sophisticated technology and a broad product line, we believe we will continue to achieve strong internal growth by attracting customers currently banking at both larger and smaller fi nancial institutions and by expanding our business with existing customers.
The following table details the percentage of deposits held by the Company in Arizona and Colorado, as well as other banks headquartered in our market areas and out-of-state banks as reported by the Federal Deposit Insurance Corporation (“FDIC”) as of June 30, 2005.
(PERCENTAGE OF DEPOSITS) ARIZONA COLORADO
CoBiz Bank, N.A.Other in-state banksOut-of-state banks
0.34%6.08%
93.58%
1.47%38.38%60.15%
Total 100.00% 100.00%
Total state deposits (in thousands) $ 72,806,264 $ 70,409,328
De novo branching. We also intend to continue exploring growth opportunities to expand through de novo branching in areas with high concentrations of our target customers in Colorado, Arizona and other western states. This strategy has been successful in Colorado and is being utilized in the Arizona market. Since the acquisition of the Company by private investors in 1994, we have introduced nine Colorado and fi ve Arizona de novo locations.
Fee-based business lines. We began offering trust and estate administration services in March 1998; employee benefi ts brokerage and consulting in 2000; P&C insurance brokerage and investment banking services in 2001; and high-end life insurance, wealth transfer planning and investment management services in 2003. We believe offering such complementary products allows us to both broaden our relationships with existing customers and attract new customers to our core business. In addition, we believe the fees generated by these services will increase our non-interest income and decrease our dependency on net-interest income. During 2005, we expanded our P&C line in Arizona through the addition of an experienced producer familiar with the market. We are also exploring the expansion of our investment management presence in Arizona. We feel that this strategy, similar to our de novo approach in banking, is a cost-effective way for our fee-based business lines to enter the Arizona market.
The Company also began work in 2005 to develop a new delivery system for its wealth management services that are offered across all business lines. Combining an open architecture approach with a customer-centric focus, the Company is seeking to broaden and deepen its methodology of serving high-net-worth individuals.
Establish strong brand awareness. In late 2005, we began work to clarify and strengthen the CoBiz brand, focusing on the relationship between each of our business lines, our unique breadth of services and our exceptional reputation in the markets we serve. The project, which included extensive customer and market research, seeks to develop a cohesive and comprehensive approach to our internal and external communications efforts while leveraging the power of each subsidiary as part of the larger company. New product lines. We also will seek to grow through the addition of new product lines. Our product development efforts are focused on providing enhanced credit, treasury management, investment, insurance, deposit and trust products to our target customer base.
CoBiz Inc. / Annual Report 20056
In the past few years, we have:
> Greatly expanded our commercial real estate lending department to allow for the origination of larger and more complex real estate loans.
> Implemented a number of new deposit products, including Health Savings Accounts, expanded money market accounts, retail lockbox and an online bill pay feature for our commercial clients. We also began offering a new service for large deposit customers that provides deposit insurance in excess of the FDIC limit of $100,000. The service, Certifi cate of Deposit Account Registry Service (“CDARS”), matches customer funds in excess of the FDIC limit within a network of participating banks so that all participating banks are holding less than the FDIC limit.
> Enhanced our international products to facilitate foreign currency transactions.
> Introduced an interest-rate hedge program to our customers. The interest-rate hedge program allows us to offer derivative products such as swaps, caps, fl oors and collars to assist our customers in managing their interest-rate risk profi le. In order to eliminate the interest-rate risk associated with offering these products, the Company enters into derivative contracts with third parties that are a perfect offset to the customer contracts.
> Created a 401(k) consulting unit within our employee benefi ts group to further enhance the services provided to our customers.
> Formed GMB Business Advisors to focus on investment banking transactions of $2-15 million. GMB Business Advisors, a sub-set of GMB, represents buyers and sellers on transactions that are smaller than those typically serviced by GMB.
Expanding existing banking relationships. We are normally not a transactional lender and typically require that borrowers enter into a multiple-product banking relationship with us, including deposits and treasury management services, in connection with the receipt of credit from the Bank. We believe that such relationships provide us with the opportunity to introduce our customers to a broader array of the products and services offered by us and generate additional non-interest income. In addition, we believe this philosophy aids in customer retention.
Capitalizing on the use of technology. We believe we have been able to distinguish ourselves from traditional community banks operating in our market through the use of technology. Our data-processing system allows us to provide upgraded Internet banking, expanded treasury management products, check and document imaging, as well as a 24-hour voice response system. Other services currently offered by the Bank include controlled disbursement, repurchase agreements and sweep investment accounts. In 2004, we expanded our lockbox product to provide retail service and expanded our treasury management system that provides access to banking services and account information through the Internet. In addition to providing sophisticated services for our customers, we utilize technology extensively in our internal systems and operational support functions to improve customer service, maximize effi ciencies, and provide management with the information and analysis necessary to manage our growth effectively.
Emphasizing high quality customer service. We believe our ability to offer high quality customer service provides us with a competitive advantage over many regional banks that operate in our market areas. We emphasize customer service in all aspects of our operations and identify customer service as an integral component of our employee training programs. Moreover, we are constantly exploring methods to make banking an easier and more convenient process for our customers. For example, we offer a courier service to pick up deposits for customers who are not in close proximity to any of the Bank’s 18 locations or simply do not have the time to go to the Bank.
Maintaining asset quality and controlling interest rate risk. We seek to maintain asset quality through a program that includes regular reviews of loans by responsible loan offi cers and ongoing monitoring of the loan portfolio by a loan review offi cer who reports to the President of the Company but submits reports directly to the audit committee of our board of directors. In addition, to support our Chief Credit Offi cer we added a senior credit offi cer over real estate lending during 2004 to further enhance our credit underwriting process. At December 31, 2005, our ratio of nonperforming loans to total loans was 0.07%, compared to 0.12% at December 31, 2004, which is signifi cantly better than industry averages.
We seek to control our exposure to changing interest rates by attempting to maintain an interest-rate profi le within a narrow range around an earnings neutral position. An important element of this focus has been to emphasize variable-rate loans and investments funded by deposits that also mature or re-price over periods of 12 months or less. We have also enhanced our interest-rate risk modeling through the acquisition of a new asset/liability system in 2004.
Achieving effi ciencies and economies of scale through centralized administrative and support operations. We seek to maximize operational and support effi ciencies in a manner consistent with maintaining high quality customer service. We have consolidated various management and administrative functions, including accounting, data processing, bookkeeping, credit administration, loan operations,
CoBiz Inc. / Annual Report 2005 7
and investment and cash management services at our downtown Denver offi ce. We believe this structure allows our business development professionals to focus on customer service and sales strategies adapted to each community that we serve.
Acquisitions. We intend to continue to explore acquisitions of fi nancial institutions or fi nancial services entities, including opportunities in Colorado, Arizona and other western states. Our approach to expansion is predicated on recruiting key personnel to lead new initiatives. While we normally consider an array of new locations and product lines as potential expansion initiatives, we will generally proceed only upon identifying quality management personnel with a loyal customer following in the community or experienced in the product line that is the target of the initiative. We believe that by focusing on individuals who are established in their communities and experienced in offering sophisticated fi nancial products and services, we enhance our market position and add growth opportunities.
/ MARKET AREAS SERVEDThe Company’s success is dependent to a signifi cant degree on the economic conditions of the two geographical markets we operate in: Colorado and Arizona. Our market areas include the Denver metropolitan area, which is comprised of the counties of Denver, Boulder, Adams, Arapahoe, Douglas, Broomfi eld and Jefferson; the Vail Valley, in Eagle County; and the Phoenix metropolitan area, which is located principally in Maricopa County. The Colorado economy began an economic recovery during 2004 from the recessionary period that started in 2001 and signifi cantly impacted the Denver metropolitan area. Between 2001 and 2003, Colorado lost nearly 4.5% of its employment base; the Denver metropolitan area comprised more than 80% of the state’s total. The unemployment rate at the end of 2003 was 6.4%. By the end of 2005, Colorado had recaptured nearly all of the jobs lost during that period while averaging an unemployment rate of 5.1%. Employment growth for Colorado and the Denver metropolitan area outpaced the national averages for each month of 2005. Denver’s economy has diversifi ed over the years with signifi cant representation in technology, communications, manufacturing, tourism, transportation, aerospace, biomedical and fi nancial services. The Denver metropolitan area is one of the fastest growing regions in the nation, helping to make Colorado the fourteenth and eleventh-fastest growing state in the United States during 2004 and 2005, respectively. The population of this seven-county region had grown to approximately 2.6 million with a workforce of 1.4 million at December 2005.
We have two locations each in downtown Denver, Boulder and Littleton, and one location each in Commerce City, the Denver Technological Center (“DTC”), Golden, Louisville and the Vail Valley. The following is selected additional market data regarding the Colorado markets we serve:
> Downtown Denver and the DTC are the main business centers of metropolitan Denver. The area around the DTC features a high concentration of offi ce parks and businesses. A large number of high-net-worth individuals live and work in the area.
> Boulder has one of the highest concentrations of small businesses and affl uent individuals in the Rocky Mountain region.
> The Commerce City location is uniquely situated to serve Denver’s growing northeast communities due to its position adjacent to the Denver International Airport and Interstate 70, eight miles from downtown Denver.
> The Littleton locations serve a more residential area, including Highlands Ranch, one of the fastest growing communities in the Denver metropolitan area.
> The western metropolitan area served by the Golden location contains a number of newer industrial and offi ce parks.
> The Louisville location serves the growing area between Denver and Boulder, with an estimated 1.5 million people within a 20-mile radius.
> The Vail Valley is anchored by Vail, a prime mountain resort with a vigorous construction market for high-end primary and second homes. Construction activity in this area is fueling growth in other commercial businesses supporting the expanding population base in the market.
Arizona consistently had one of the highest population growth rates in the nation during the latter half of the twentieth century, including being the second-fastest growing state for thirteen consecutive years as of June 2005. This population growth has been the primary driver behind the Arizona economy. For the year ending 2005, Arizona had a 4.1% growth in its nonfarm employment base. The December 2005 unemployment rate for the Phoenix metropolitan area was 3.8%, well below the 5.1% national average. Arizona’s primary economic sectors include trade, manufacturing, mining, agriculture, construction and tourism, with services constituting the largest economic sector. The following is selected additional market data regarding the Arizona markets we serve:
> Our Arizona banks are located in Maricopa County. More than half of Arizona’s population resides in Maricopa County, which includes the cities of Phoenix, Mesa, Scottsdale, Surprise, Sun City, Glendale, Chandler, Tempe and Peoria.
CoBiz Inc. / Annual Report 20058
> Our offi ce in East Valley serves the areas of Mesa and Gilbert, Arizona. The East Valley has over 1.5 million residents and accounts for 42.8% of the Metro Phoenix population.
> Our offi ce in Chandler, a suburb of Phoenix, serves a community that has become home to businesses and industries of all sizes. Chandler is known as the “Silicon Desert” due to its concentration of high-technology jobs. More than 75% of Chandler’s manufacturing sector employs high-technology workers, compared to the national average of 15%.
> Our offi ce in Surprise is strategically located to serve the large population of retired persons living in the suburbs of Phoenix. The customers in this demographic group usually prefer the personal service of a community bank to the more impersonal service of a large fi nancial institution.
> Our offi ce in Scottsdale is located in one of the most desirable areas within metropolitan Phoenix, from both a residential and employment perspective. The Scottsdale area continues to experience faster job growth than population growth.
> Our offi ce in Tempe is located in the center of the Phoenix metropolitan area. Tempe has the highest concentration of businesses in Arizona, with more than 15% of all Arizona high-tech fi rms located in Tempe.
/ COMPETITIONCoBiz and its subsidiaries face competition in all of their principal business activities, not only from other fi nancial holding companies and commercial banks, but also from savings and loan associations, credit unions, fi nance companies, mortgage companies, leasing companies, insurance companies, investment advisors, mutual funds, securities brokers and dealers, investment banks, other domestic and foreign fi nancial institutions, and various nonfi nancial institutions.
By virtue of their larger capital bases or affi liation with larger multi-bank holding companies, many of our competitors have substantially greater capital resources and lending limits than we do and perform functions we offer only through correspondents. Our business, fi nancial condition, results of operations, and cash fl ows may be adversely affected by an increase in competition. Moreover, the Gramm-Leach-Bliley Act has expanded the ability of participants in the banking and thrift industries to engage in other lines of business. This Act could put us at a competitive disadvantage because we may not have the capital to participate in other lines of business to the same extent as more highly capitalized banks and thrift holding companies.
Please see “Risk Factors – Our business and fi nancial condition may be adversely affected by an increase in competition,” below for additional information.
/ EMPLOYEESAt January 31, 2006, we had 467 employees, including 450 full-time equivalent employees. Employees of the Company enjoy a variety of employee benefi t programs, including stock option plans; an employee stock purchase plan; a 401(k) plan; various comprehensive medical, accident and group life insurance plans; and paid vacations. No Company employee is covered by a collective bargaining agreement, and we believe our relationship with our employees to be excellent.
/ SUPERVISION AND REGULATIONCoBiz and the Bank are extensively regulated under federal, Colorado and Arizona law. These laws and regulations are primarily intended to protect depositors and federal deposit insurance funds, not shareholders of CoBiz. The following information summarizes certain material statutes and regulations affecting CoBiz and the Bank, and is qualifi ed in its entirety by reference to the particular statutory and regulatory provisions. Any change in applicable laws, regulations or regulatory policies may have a material adverse effect on the business, fi nancial condition, results of operations and cash fl ows of CoBiz and the Bank. We are unable to predict the nature or extent of the effects that fi scal or monetary policies, economic controls, or new federal or state legislation may have on our business and earnings in the future.
/ THE HOLDING COMPANYGeneral. CoBiz is a fi nancial holding company registered under the Bank Holding Company Act of 1956, as amended (the “BHCA”), and is subject to regulation, supervision and examination by the Board of Governors of the Federal Reserve System (the “FRB”). CoBiz is required to fi le an annual report with the FRB and such other reports as the FRB may require pursuant to the BHCA.
Securities Exchange Act of 1934. CoBiz has a class of securities registered with the Securities and Exchange Commission (“SEC”) under the Securities Exchange Act of 1934. This Act requires the Company to fi le periodic reports with the SEC, governs the Company’s disclosure in proxy solicitations and directs insider trading transactions.
CoBiz Inc. / Annual Report 2005 9
Acquisitions. As a fi nancial holding company, we are required to obtain the prior approval of the FRB before acquiring direct or indirect ownership or control of more than 5% of the voting shares of a bank or bank holding company. The FRB will not approve any acquisition, merger or consolidation that would result in substantial anti-competitive effects, unless the anti-competitive effects of the proposed transaction are outweighed by a greater public interest in meeting the needs and convenience of the public. In reviewing applications for such transactions, the FRB also considers managerial, fi nancial, capital and other factors, including the record of performance of the applicant and the bank or banks to be acquired under the Community Reinvestment Act of 1977, as amended (the “CRA”). See “— The Bank — Community Reinvestment Act” below.
Riegle-Neal Interstate Banking and Branching Effi ciency Act of 1994, as amended (the “1994 Act”). The 1994 Act displaces state laws governing interstate bank acquisitions. Under the 1994 Act, a fi nancial or bank holding company may, subject to some limitations, acquire a bank outside of its home state without regard to local law. Thus, an out-of-state holding company could acquire the Bank, and we can acquire banks outside of Colorado.
All acquisitions pursuant to the 1994 Act require regulatory approval. In reviewing applications under the 1994 Act, an applicant’s record under the CRA must be considered, and a determination must be made that the transaction will not result in any violations of federal or state antitrust laws. In addition, there is a limit of 25% on the amount of deposits in insured depository institutions in both Colorado and Arizona that can be controlled by any bank or bank holding company.
The 1994 Act also permits bank subsidiaries of a fi nancial or bank holding company to act as agents for affi liated institutions by receiving deposits, renewing time deposits, closing loans, servicing loans and receiving payments on loans. As a result, a relatively small Colorado or Arizona bank owned by an out-of-state holding company could make available to customers in Colorado and Arizona some of the services of a larger affi liated institution located in another state.
Gramm-Leach-Bliley Act of 1999 (the “GLB Act”). The GLB Act eliminates many of the restrictions placed on the activities of certain qualifi ed fi nancial or bank holding companies. A “fi nancial holding company” such as CoBiz can expand into a wide variety of fi nancial services, including securities activities, insurance and merchant banking without the prior approval of the FRB.
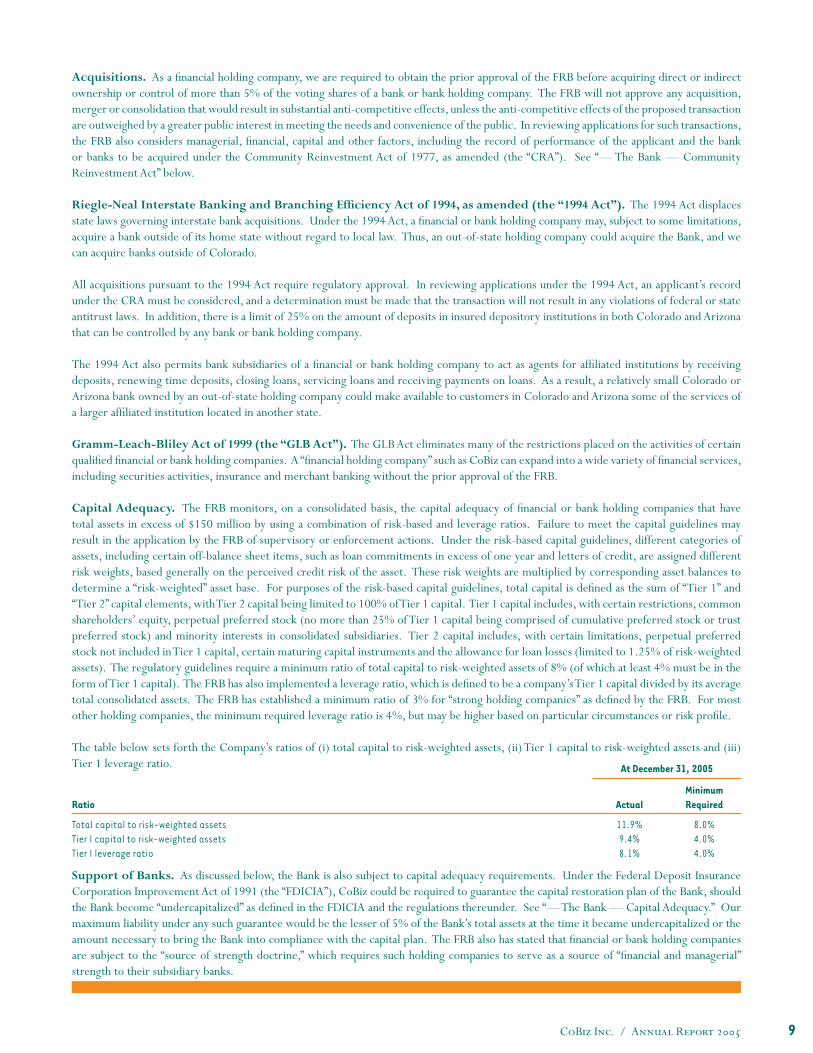
Capital Adequacy. The FRB monitors, on a consolidated basis, the capital adequacy of fi nancial or bank holding companies that have total assets in excess of $150 million by using a combination of risk-based and leverage ratios. Failure to meet the capital guidelines may result in the application by the FRB of supervisory or enforcement actions. Under the risk-based capital guidelines, different categories of assets, including certain off-balance sheet items, such as loan commitments in excess of one year and letters of credit, are assigned different risk weights, based generally on the perceived credit risk of the asset. These risk weights are multiplied by corresponding asset balances to determine a “risk-weighted” asset base. For purposes of the risk-based capital guidelines, total capital is defi ned as the sum of “Tier 1” and “Tier 2” capital elements, with Tier 2 capital being limited to 100% of Tier 1 capital. Tier 1 capital includes, with certain restrictions, common shareholders’ equity, perpetual preferred stock (no more than 25% of Tier 1 capital being comprised of cumulative preferred stock or trust preferred stock) and minority interests in consolidated subsidiaries. Tier 2 capital includes, with certain limitations, perpetual preferred stock not included in Tier 1 capital, certain maturing capital instruments and the allowance for loan losses (limited to 1.25% of risk-weighted assets). The regulatory guidelines require a minimum ratio of total capital to risk-weighted assets of 8% (of which at least 4% must be in the form of Tier 1 capital). The FRB has also implemented a leverage ratio, which is defi ned to be a company’s Tier 1 capital divided by its average total consolidated assets. The FRB has established a minimum ratio of 3% for “strong holding companies” as defi ned by the FRB. For most other holding companies, the minimum required leverage ratio is 4%, but may be higher based on particular circumstances or risk profi le.
The table below sets forth the Company’s ratios of (i) total capital to risk-weighted assets, (ii) Tier 1 capital to risk-weighted assets and (iii) Tier 1 leverage ratio. At December 31, 2005
Ratio ActualMinimumRequired
Total capital to risk-weighted assetsTier I capital to risk-weighted assetsTier I leverage ratio
11.9%9.4%8.1%
8.0%4.0%4.0%
Support of Banks. As discussed below, the Bank is also subject to capital adequacy requirements. Under the Federal Deposit Insurance Corporation Improvement Act of 1991 (the “FDICIA”), CoBiz could be required to guarantee the capital restoration plan of the Bank, should the Bank become “undercapitalized” as defi ned in the FDICIA and the regulations thereunder. See “— The Bank — Capital Adequacy.” Our maximum liability under any such guarantee would be the lesser of 5% of the Bank’s total assets at the time it became undercapitalized or the amount necessary to bring the Bank into compliance with the capital plan. The FRB also has stated that fi nancial or bank holding companies are subject to the “source of strength doctrine,” which requires such holding companies to serve as a source of “fi nancial and managerial” strength to their subsidiary banks.
CoBiz Inc. / Annual Report 200510
The FDICIA requires the federal banking regulators to take “prompt corrective action” with respect to capital-defi cient institutions. In addition to requiring the submission of a capital restoration plan, the FDICIA contains broad restrictions on certain activities of undercapitalized institutions involving asset growth, acquisitions, branch establishment and expansion into new lines of business. With certain exceptions, an insured depository institution is prohibited from making capital distributions, including dividends, and is prohibited from paying management fees to control persons, if the institution would be undercapitalized after any such distribution or payment.
Sarbanes-Oxley Act of 2002 (the “Sarbanes-Oxley Act”). The Sarbanes-Oxley Act is intended to address systemic and structural weaknesses of the capital markets in the United States that were perceived to have contributed to the recent corporate scandals. The Sarbanes-Oxley Act also attempts to enhance the responsibility of corporate management by, among other things, (i) requiring the chief executive offi cer and chief fi nancial offi cer of public companies to provide certain certifi cations in their periodic reports regarding the accuracy of the periodic reports fi led with the SEC, (ii) prohibiting offi cers and directors of public companies from fraudulently infl uencing an accountant engaged in the audit of the company’s fi nancial statements, (iii) requiring chief executive offi cers and chief fi nancial offi cers to forfeit certain bonuses in the event of a restatement of fi nancial results, (iv) prohibiting offi cers and directors found to be unfi t from serving in a similar capacity with other public companies, (v) prohibiting offi cers and directors from trading in the company’s equity securities during pension blackout periods, and (vi) requiring the SEC to issue standards of professional conduct for attorneys representing public companies. In addition, public companies whose securities are listed on a national securities exchange or association must satisfy the following additional requirements: (a) the company’s audit committee must appoint and oversee the company’s auditors; (b) each member of the company’s audit committee must be independent; (c) the company’s audit committee must establish procedures for receiving complaints regarding accounting, internal accounting controls and audit-related matters; (d) the company’s audit committee must have the authority to engage independent advisors; and (e) the company must provide appropriate funding to its audit committee, as determined by the audit committee. The Sarbanes-Oxley Act also requires the registered public accounting fi rm that issues the audit report to issue a report on management’s attestation on internal control over fi nancial reporting.
/ THE BANKGeneral. The Bank is a national banking association, the deposits of which are insured by the Bank Insurance Fund of the FDIC, and is subject to supervision, regulation and examination by the Offi ce of the Comptroller of the Currency (the “OCC”) and by the FDIC. Pursuant to such regulations, the Bank is subject to special restrictions, supervisory requirements and potential enforcement actions. The FRB’s supervisory authority over CoBiz can also affect the Bank.
Community Reinvestment Act. The CRA requires the Bank to adequately meet the credit needs of the communities in which it operates. The CRA allows regulators to reject an applicant seeking, among other things, to make an acquisition or establish a branch, unless it has performed satisfactorily under the CRA. Federal regulators regularly conduct examinations to assess the performance of fi nancial institutions under the CRA. In its most recent CRA examination, the Bank received a satisfactory rating.
USA Patriot Act of 2001. The Uniting and Strengthening America by Providing Appropriate Tools Required to Intercept and Obstruct Terrorism Act of 2001 (the “USA Patriot Act”) is intended to allow the federal government to address terrorist threats through enhanced domestic security measures, expanded surveillance powers, increased information sharing and broadened anti-money-laundering requirements. Title III of the USA Patriot Act takes measures intended to encourage information sharing among bank regulatory agencies and law enforcement bodies. Certain provisions of Title III impose affi rmative obligations on a broad range of fi nancial institutions, including banks, thrifts, brokers, dealers, credit unions, money transfer agents and parties registered under the Commodity Exchange Act.
Among its provisions, the USA Patriot Act requires each fi nancial institution to: (i) establish an anti-money laundering program; (ii) establish due diligence policies, procedures and controls with respect to its private banking accounts and correspondent banking accounts involving foreign individuals and certain foreign banks; and (iii) avoid establishing, maintaining, administering or managing correspondent accounts in the United States for, or on behalf of, a foreign bank that does not have a physical presence in any country. In addition, the USA Patriot Act contains a provision encouraging cooperation among fi nancial institutions, regulatory authorities and law enforcement authorities with respect to individuals, entities and organizations engaged in, or reasonably suspected of engaging in, terrorist acts or money laundering activities. Financial institutions must comply with Section 326 of the Act which provides minimum procedures for identifi cation verifi cation of new customers.
Transactions with Affi liates. The Bank is subject to Section 23A of the Federal Reserve Act which limits the amount of loans to, investments in and certain other transactions with affi liates of the Bank; requires certain levels of collateral for such loans or transactions; and limits the amount of advances to third parties that are collateralized by the securities or obligations of affi liates, unless the affi liate is a bank and is at least 80% owned by the Company. If the affi liate is a bank and is at least 80% owned by the Company, such transactions are generally exempted from these restrictions except as to “low quality” assets as defi ned under the Federal Reserve Act, and transactions not consistent with safe and sound banking practices. In addition, Section 23A generally limits transactions with a single affi liate of the Bank to 10% of the Bank’s capital and surplus and generally limits all transactions with affi liates to 20% of the Bank’s capital and surplus.
CoBiz Inc. / Annual Report 2005 11
Section 23B of the Federal Reserve Act requires that certain transactions between the Bank and any affi liate must be on substantially the same terms, or at least as favorable to the Bank, as those prevailing at the time for comparable transactions with, or involving, non-affi liated companies or, in the absence of comparable transactions, on terms and under circumstances, including credit standards, that in good faith would be offered to, or would apply to, non-affi liated companies. The aggregate amount of the Bank’s loans to its offi cers, directors and principal shareholders (or their affi liates) is limited to the amount of its unimpaired capital and surplus, unless the FDIC determines that a lesser amount is appropriate.
A violation of the restrictions of Section 23A or Section 23B of the Federal Reserve Act may result in the assessment of civil monetary penalties against the Bank or a person participating in the conduct of the affairs of the Bank or the imposition of an order to cease and desist such violation.
Regulation W of the Federal Reserve Act, which became effective on April 1, 2003, addresses the application of Sections 23A and 23B to credit exposure arising out of derivative transactions between an insured institution and its affi liates and intra-day extensions of credit by an insured depository institution to its affi liates. The rule requires institutions to adopt policies and procedures reasonably designed to monitor, manage and control credit exposures arising out of transactions and to clarify that the transactions are subject to Section 23B of the Federal Reserve Act.
Dividend Restrictions. Dividends paid by the Bank and management fees from the Bank and our fee-income business lines provide substantially all of our cash fl ow. The approval of the OCC is required prior to the declaration of any dividend by the Bank if the total of all dividends declared by the Bank in any calendar year exceeds the total of its net profi ts of that year combined with the retained net profi ts for the preceding two years. In addition, the FDICIA provides that the Bank cannot pay a dividend if it will cause the Bank to be “undercapitalized.” See “— The Bank — Capital Adequacy.”
Examinations. The OCC periodically examines and evaluates national banks. Based upon such an evaluation, the examining regulator may revalue the assets of an insured institution and require that it establish specifi c reserves to compensate for the difference between the value determined by the regulator and the book value of such assets.
Capital Adequacy. Federal regulations establish minimum requirements for the capital adequacy of depository institutions that are generally the same as those established for bank holding companies. See “— The Holding Company — Capital Adequacy.” Banks with capital ratios below the required minimum are subject to certain administrative actions, including the termination of deposit insurance and the appointment of a receiver, and may also be subject to signifi cant operating restrictions pursuant to regulations promulgated under the FDICIA. See “— The Holding Company — Support of Banks.”
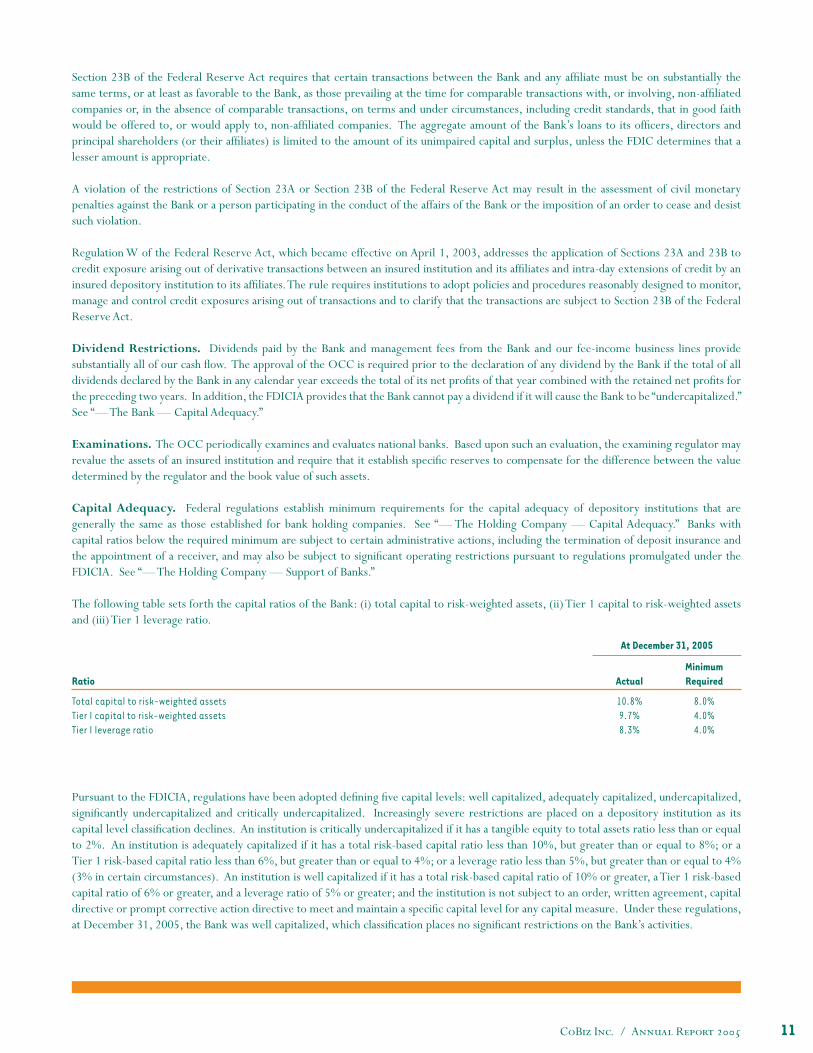
The following table sets forth the capital ratios of the Bank: (i) total capital to risk-weighted assets, (ii) Tier 1 capital to risk-weighted assets and (iii) Tier 1 leverage ratio.
At December 31, 2005
Ratio ActualMinimumRequired
Total capital to risk-weighted assetsTier I capital to risk-weighted assetsTier I leverage ratio
10.8%9.7%8.3%
8.0%4.0%4.0%
Pursuant to the FDICIA, regulations have been adopted defi ning fi ve capital levels: well capitalized, adequately capitalized, undercapitalized, signifi cantly undercapitalized and critically undercapitalized. Increasingly severe restrictions are placed on a depository institution as its capital level classifi cation declines. An institution is critically undercapitalized if it has a tangible equity to total assets ratio less than or equal to 2%. An institution is adequately capitalized if it has a total risk-based capital ratio less than 10%, but greater than or equal to 8%; or a Tier 1 risk-based capital ratio less than 6%, but greater than or equal to 4%; or a leverage ratio less than 5%, but greater than or equal to 4% (3% in certain circumstances). An institution is well capitalized if it has a total risk-based capital ratio of 10% or greater, a Tier 1 risk-based capital ratio of 6% or greater, and a leverage ratio of 5% or greater; and the institution is not subject to an order, written agreement, capital directive or prompt corrective action directive to meet and maintain a specifi c capital level for any capital measure. Under these regulations, at December 31, 2005, the Bank was well capitalized, which classifi cation places no signifi cant restrictions on the Bank’s activities.
CoBiz Inc. / Annual Report 200512
On November 15, 2005, the Basel Committee on Banking Supervision updated the status of the revised draft of the New Basel Capital Accord originally issued in January 2001. The New Accord consists of three pillars that address (1) minimum capital requirements; (2) supervisory review of capital adequacy, which relates to an organization’s capital adequacy and internal assessment processes; and (3) market discipline. The Company continues to monitor developments of the proposed Accord for which United States regulatory authorities are expected to issue proposed implementation rules in the fi rst quarter of 2006. The fi nal rules are not anticipated to be effective until January 2008.
Internal Operating Requirements. Federal regulations promote the safety and soundness of individual institutions by specifi cally addressing, among other things: (1) internal controls, information systems and internal audit systems; (2) loan documentation; (3) credit underwriting; (4) interest rate exposure; (5) asset growth; and (6) compensation and benefi t standards for management offi cials.
Real Estate Lending Evaluations. Federal regulators have adopted uniform standards for the evaluation of loans secured by real estate or made to fi nance improvements to real estate. The Bank is required to establish and maintain written internal real estate lending policies consistent with safe and sound banking practices. The Company has established loan-to-value ratio limitations on real estate loans, which are more stringent than the loan-to-value limitations established by regulatory guidelines.
Deposit Insurance Premiums. Under current regulations, FDIC-insured depository institutions that are members of the FDIC pay insurance premiums at rates based on their assessment risk classifi cation, which is determined, in part, based on the institution’s capital ratios and, in part, on factors that the FDIC deems relevant to determine the risk of loss to the FDIC. Assessment rates range from $0 to $0.27 per $100. This classifi cation for determination of assessment rate may be reviewed semi-annually. The Bank currently does not pay an assessment rate for FDIC deposit insurance. However, all institutions insured by the FDIC Bank Insurance Fund are assessed fees to cover the debt of the Financing Corporation, the successor of the insolvent Federal Savings and Loan Insurance Corporation.
Restrictions on Loans to One Borrower. Under federal law, the aggregate amount of loans that may be made to one borrower by the Bank is generally limited to 15% of its unimpaired capital, surplus, undivided profi ts and allowance for loan losses. The Bank seeks participations to accommodate borrowers whose fi nancing needs exceed the Bank’s lending limits.
/ FEE-BASED BUSINESS LINESACMG is registered with the SEC under the Investment Advisers Act of 1940. The Investment Advisers Act of 1940 imposes numerous obligations on registered investment advisers, including fi duciary duties, recordkeeping requirements, operational requirements and disclosure obligations. Virtually all aspects of ACMG’s investment management business are subject to various federal and state laws and regulations. These laws and regulations generally grant supervisory agencies and bodies broad administrative powers, including the power to limit or restrict ACMG from carrying on its investment management business in the event that it fails to comply with such laws and regulations. In such event, the possible sanctions which may be imposed include the suspension of individual employees, business limitations on ACMG’s engaging in the investment management business for specifi ed periods of time, the revocation of any such company’s registration as an investment adviser, and other censures or fi nes.
GMB is registered as a broker/dealer under the Securities Exchange Act of 1934 and is subject to regulation by the SEC and the National Association of Securities Dealers, Inc. (“NASD”). GMB is subject to the SEC’s net capital rule designed to enforce minimum standards regarding the general fi nancial condition and liquidity of a broker/dealer. Under certain circumstances, this rule limits the ability of the Company to make withdrawals of capital and receive dividends from GMB. GMB’s regulatory net capital consistently exceeded such minimum net capital requirements in fi scal 2005. The securities industry is one of the most highly regulated in the United States, and failure to comply with related laws and regulations can result in the revocation of broker/dealer licenses, the imposition of censures or fi nes, and the suspension or expulsion from the securities business of a fi rm, its offi cers or employees.
FDL provides wealth transfer planning through the use of life insurance products. State governments extensively regulate our life insurance activities. We sell our insurance products in 27 states and the District of Columbia through licensed insurance producers. Insurance laws vary from state to state. Each state has broad powers over licensing, payment of commissions, business practices, policy forms and premium rates. While the federal government does not directly regulate the marketing of most insurance products, securities, including variable life insurance, are subject to federal securities laws. We market these fi nancial products through M Holdings Securities, Inc., a registered broker-dealer and a member of the NASD and Securities Investor Corporation.
CoBiz Insurance, acting as an insurance producer, must obtain and keep in force an insurance producer’s license with the State of Colorado. In order to write insurance in states other than Colorado, they are required to obtain non-resident insurance licenses. All premiums belonging to insurance carriers and all unearned premiums belonging to customers received by the agency must be treated in a fi duciary capacity. Insurance producers in Colorado are required to complete 24 hours biennially of continuing education by attending courses approved by the Commissioner of Insurance.
CoBiz Inc. / Annual Report 2005 13
/ CHANGING REGULATORY STRUCTURERegulation of the activities of national and state banks and their holding companies imposes a heavy burden on the banking industry. The FRB, OCC and FDIC all have extensive authority to police unsafe or unsound practices and violations of applicable laws and regulations by depository institutions and their holding companies. These agencies can assess civil monetary penalties, issue cease and desist or removal orders, seek injunctions, and publicly disclose such actions.
The laws and regulations affecting banks and fi nancial or bank holding companies have changed signifi cantly in recent years, and there is reason to expect changes will continue in the future, although it is diffi cult to predict the outcome of these changes. From time to time, various bills are introduced in the United States Congress with respect to the regulation of fi nancial institutions. Certain of these proposals, if adopted, could signifi cantly change the regulation of banks and the fi nancial services industry.
/ MONETARY POLICYThe monetary policy of the FRB has a signifi cant effect on the operating results of fi nancial or bank holding companies and their subsidiaries. Among the means available to the FRB to affect the money supply are open market transactions in U.S. government securities, changes in the discount rate on member bank borrowings and changes in reserve requirements against member bank deposits. These means are used in varying combinations to infl uence overall growth and distribution of bank loans, investments and deposits, and their use may affect interest rates charged on loans or paid on deposits. FRB monetary policies have materially affected the operations of commercial banks in the past and are expected to continue to do so in the future. The nature of future monetary policies and the effect of such policies on the business and earnings of the Company and its subsidiaries cannot be predicted.
/ WEBSITE AVAILABILITY OF REPORTS FILED WITH THE SECURITIES AND EXCHANGE COMMISSION The Company maintains an Internet website located at www.cobizinc.com on which, among other things, the Company makes available, free of charge, various reports that it fi les with or furnishes to the SEC, including its annual reports, quarterly reports, current reports and proxy statements. These reports are made available as soon as reasonably practicable after they are fi led with or furnished to the SEC. The public may read and copy any materials we fi le with the SEC at the SEC’s Public Reference Room at 450 Fifth Street, NW, Washington, DC 20549. Additional information on the operation of the Public Reference Room may be obtained by calling the SEC at 1-800-SEC-0330. The SEC also maintains a website at www.sec.gov that contains reports, proxy and information statements, and other information regarding issuers that fi le electronically with the SEC. The Company has also made available on its website its Audit, Compensation and Nominating Committee charters and corporate governance guidelines. The content on any website referred to in this fi ling is not incorporated by reference into this fi ling unless expressly noted otherwise.
ITEM 1A. RISK FACTORS/ CHANGES IN ECONOMIC CONDITIONS MAY CAUSE US TO INCUR LOAN LOSSES.The inability of borrowers to repay loans can erode our earnings and capital. Our loan portfolio is somewhat less diversifi ed than that of a traditional community bank because it includes a higher concentration of larger commercial loans. Substantially all of our loans are to businesses and individuals in the Denver and Phoenix metropolitan areas, and any economic decline in these market areas could impact us adversely.
/ OUR ALLOWANCE FOR LOAN LOSSES MAY NOT BE ADEQUATE TO COVER ACTUAL LOAN LOSSES.As a lender, we are exposed to the risk that our customers will be unable to repay their loans according to their terms and that any collateral securing the payment of their loans may not be suffi cient to assure repayment. Credit losses are inherent in the lending business and could have a material adverse effect on our operating results. We make various assumptions and judgments about the collectibility of our loan portfolio and provide an allowance for potential losses based on a number of factors. If our assumptions are wrong, our allowance for loan losses may not be suffi cient to cover our losses, thereby having an adverse effect on our operating results, and may cause us to increase the allowance in the future. In addition, although our level of delinquencies historically has been low, we have been increasing and expect to continue to increase the number and amount of loans we originate, and we cannot assure you that we will not experience an increase in delinquencies and losses as these loans continue to age, particularly if the favorable economic conditions in Colorado and Arizona reverse. The actual amount of future provisions for loan losses cannot now be determined and may exceed the amounts of past provisions. Additions to our allowance for loan losses would decrease our net income.
/ OUR BUSINESS IS SUBJECT TO VARIOUS LENDING RISKS DEPENDING ON THE NATURE OF THE BORROWER’S BUSINESS, ITS CASH FLOW AND OUR COLLATERAL.Our commercial real estate loans involve higher principal amounts than other loans, and repayment of these loans may be dependent on factors outside our control or the control of our borrowers. Commercial real estate lending typically involves higher loan principal amounts, and the repayment of these loans generally is dependent, in large part, on suffi cient income from the properties securing the loans to
CoBiz Inc. / Annual Report 200514
cover operating expenses and debt service. Rental income may not rise suffi ciently over time to meet increases in the loan rate at repricing or increases in operating expenses, such as utilities and taxes. As a result, impaired loans may be more diffi cult to identify without some seasoning. Because payments on loans secured by commercial real estate often depend upon the successful operation and management of the properties, repayment of such loans may be affected by factors outside the borrower’s control, such as adverse conditions in the real estate market or the economy or changes in government regulation. If the cash fl ow from the property is reduced, the borrower’s ability to repay the loan and the value of the security for the loan may be impaired.
Repayment of our commercial loans is often dependent on cash fl ow of the borrower, which may be unpredictable, and collateral securing these loans may fl uctuate in value. Our commercial loans are primarily made based on the cash fl ow of the borrower and secondarily on the underlying collateral provided by the borrower. Most often, this collateral is accounts receivable, inventory, equipment or real estate. In the case of loans secured by accounts receivable, the availability of funds for the repayment of these loans may be substantially dependent on the ability of the borrower to collect amounts due from its customers. Other collateral securing loans may depreciate over time, may be diffi cult to appraise and may fl uctuate in value based on the success of the business.
Our construction loans are based upon estimates of costs to construct and value associated with the completed project. These estimates may be inaccurate. Because of the uncertainties inherent in estimating construction costs, as well as the market value of the completed project and the effects of governmental regulation of real property, it is relatively diffi cult to evaluate accurately the total funds required to complete a project and the related loan-to-value ratio. As a result, construction loans often involve the disbursement of substantial funds with repayment dependent, in part, on the success of the ultimate project and the ability of the borrower to sell or lease the property, rather than the ability of the borrower or guarantor to repay principal and interest. Delays in completing the project may arise from labor problems, material shortages and other unpredictable contingencies. If the estimate of construction costs is inaccurate, we may be required to advance additional funds to complete construction. If our appraisal of the value of the completed project proves to be overstated, we may have inadequate security for the repayment of the loan upon completion of construction of the project.
Our consumer loans generally have a higher risk of default than our other loans. Consumer loans entail greater risk than residential mortgage loans, particularly in the case of consumer loans that are unsecured or secured by rapidly depreciating assets. In such cases, any repossessed collateral for a defaulted consumer loan may not provide an adequate source of repayment of the outstanding loan balance as a result of damage, loss or depreciation. The remaining defi ciency often does not warrant further collection efforts against the borrower beyond obtaining a defi ciency judgment. In addition, consumer loan collections are dependent on the borrower’s continuing fi nancial stability, and thus, are more likely to be adversely affected by job loss, divorce, illness or personal bankruptcy. Furthermore, the application of various federal and state laws, including federal and state bankruptcy and insolvency laws, may limit the amount that can be recovered on such loans.
/ A DOWNTURN IN OUR REAL ESTATE MARKETS COULD HURT OUR BUSINESS. A downturn in our real estate markets could hurt our business because many of our loans are secured by real estate. Real estate values and real estate markets are generally affected by changes in national, regional or local economic conditions, fl uctuations in interest rates and the availability of loans to potential purchasers, changes in tax laws and other governmental statutes, regulations and policies and acts of nature. If real estate prices decline, the value of real estate collateral securing our loans could be reduced. Our ability to recover on defaulted loans by foreclosing and selling the real estate collateral would then be diminished and we would be more likely to suffer losses on defaulted loans. As of December 31, 2005, approximately 51% of the book value of our loan portfolio consisted of loans collateralized by various types of real estate. Substantially all of our real property collateral is located in Arizona and Colorado. Any such downturn could have a material adverse effect on our business, fi nancial condition and results of operations.
/ WE MAY EXPERIENCE DIFFICULTIES IN MANAGING OUR GROWTH. As part of our strategy, we may expand into additional communities or attempt to strengthen our position in our current markets by undertaking additional de novo branch openings or new bank formations. We believe it may take up to eighteen months for new banking facilities to fi rst achieve operational profi tability due to the impact of overhead expenses, and the start-up phase of generating loans and deposits. To the extent that we undertake growth initiatives, we are likely to continue to experience the effects of higher operating expenses relative to operating income from the new operations, which may have an adverse effect on our levels of reported net income, return on average equity and return on average assets.
In addition, we may acquire fi nancial institutions and related businesses that we believe provide a strategic fi t with our business. To the extent that we grow through acquisitions, we cannot assure you that we will be able to adequately and profi tably manage such growth. Acquiring other fi nancial institutions and businesses involves risks commonly associated with acquisitions, including:
> potential exposure to unknown or contingent liabilities of fi nancial institutions and other businesses we acquire;> exposure to potential asset quality issues of the acquired banks or businesses;
CoBiz Inc. / Annual Report 2005 15
> diffi culty and expense of integrating the operations and personnel of banks and businesses we acquire; > potential disruption to our business; > potential diversion of our management’s time and attention; and > the possible loss of key employees and customers of the banks and businesses we acquire.
/ WE RELY HEAVILY ON OUR MANAGEMENT, AND THE LOSS OF ANY OF OUR SENIOR OFFICERS MAY ADVERSELY AFFECT OUR OPERATIONS. Consistent with our policy of focusing growth initiatives on the recruitment of qualifi ed personnel, we are highly dependent on the continued services of a small number of our executive offi cers and key employees. The loss of the services of any of these individuals could adversely affect our business, fi nancial condition, results of operations and cash fl ows. The failure to recruit and retain key personnel could have a material adverse effect on our business, fi nancial condition, results of operations and cash fl ows.
/ CHANGES IN INTEREST RATES MAY AFFECT OUR PROFITABILITY. Our profi tability, is in part, a function of the spread between the interest earned on investments and loans and the interest paid on deposits and other interest-bearing liabilities. Our net interest spread and margin will be affected by general economic conditions and other factors, including fi scal and monetary policies of the federal government, that infl uence market interest rates and our ability to respond to changes in such rates. At any given time, our assets and liabilities will be such that they are affected differently by a change in interest rates. As a result, an increase or decrease in rates, the length of loan terms or the mix of adjustable-and fi xed-rate loans in our portfolio could have a positive or negative effect on our net income, capital and liquidity. We have traditionally managed our assets and liabilities in such a way that we have a positive interest rate gap. As a general rule, banks with positive interest rate gaps are more likely to be susceptible to declines in net interest income in periods of falling interest rates and are more likely to experience increases in net interest income in periods of rising interest rates.
/ OUR BUSINESS AND FINANCIAL CONDITION MAY BE ADVERSELY AFFECTED BY AN INCREASE IN COMPETITION. The banking business in the Denver and Phoenix metropolitan areas is highly competitive and is currently dominated by a number of large regional fi nancial institutions. In addition to these regional banks, there are a number of smaller commercial banks that operate in these areas. We compete for loans and deposits with banks, savings and loan associations, fi nance companies, credit unions, and mortgage bankers. In addition to traditional fi nancial institutions, we also compete for loans with brokerage and investment banking companies, and governmental agencies that make available low-cost or guaranteed loans to certain borrowers. Particularly in times of high interest rates, we also face signifi cant competition for deposits from sellers of short-term money market securities as well as other corporate and government securities.
By virtue of their larger capital bases or affi liation with larger multibank holding companies, many of our competitors have substantially greater capital resources and lending limits than we have and perform other functions that we offer only through correspondents. Interstate banking and unlimited state-wide branch banking are permitted in Colorado and Arizona. As a result, we have experienced, and expect to continue to experience, greater competition in our primary service areas. Our business, fi nancial condition, results of operations and cash fl ows may be adversely affected by an increase in competition. Moreover, recently enacted and proposed legislation has focused on expanding the ability of participants in the banking and thrift industries to engage in other lines of business. The enactment of such legislation could put us at a competitive disadvantage because we may not have the capital to participate in other lines of business to the same extent as more highly capitalized fi nancial service holding companies.
/ WE CONTINUALLY ENCOUNTER TECHNOLOGICAL CHANGE, AND WE MAY HAVE FEWER RESOURCES THAN OUR COMPETITORS TO CONTINUE TO INVEST IN TECHNOLOGICAL IMPROVEMENTS.The fi nancial services industry is undergoing rapid technological changes, with frequent introductions of new technology-driven products and services. In addition to better serving customers, the effective use of technology increases effi ciency and enables fi nancial institutions to reduce costs. Our future success will depend, in part, upon our ability to address the needs of our customers by using technology to provide products and services that will satisfy customer demands for convenience, as well as to create additional effi ciencies in our operations. Many of our competitors have substantially greater resources to invest in technological improvements. We cannot assure you that we will be able to effectively implement new technology-driven products and services or be successful in marketing these products and services to our customers.
/ AN INTERRUPTION IN OR BREACH IN SECURITY OF OUR INFORMATION SYSTEMS MAY RESULT IN A LOSS OF CUSTOMER BUSINESS. We rely heavily on communications and information systems to conduct our business. Any failure or interruptions or breach in security of these systems could result in failures or disruptions in our customer relationship management, general ledger, deposits, servicing or loan
CoBiz Inc. / Annual Report 200516
origination systems. The occurrence of any failures or interruptions could result in a loss of customer business and have a material adverse effect on our results of operations and fi nancial condition.
/ WE MAY BE REQUIRED TO MAKE CAPITAL CONTRIBUTIONS TO THE BANK IF IT BECOMES UNDERCAPITALIZED. Under federal law, a bank holding company may be required to guarantee a capital plan fi led by an undercapitalized bank subsidiary with its primary regulator. If the subsidiary defaults under the plan, the holding company may be required to contribute to the capital of the subsidiary bank in an amount equal to the lesser of 5% of the bank’s assets at the time it became undercapitalized or the amount necessary to bring the bank into compliance with applicable capital standards. Therefore, it is possible that we will be required to contribute capital to our subsidiary bank or any other bank that we may acquire in the event that such bank becomes undercapitalized. If we are required to make such capital contribution at a time when we have other signifi cant capital needs, our business, fi nancial condition, results of operations and cash fl ows could be adversely affected.
/ WE ARE SUBJECT TO SIGNIFICANT GOVERNMENT REGULATION, AND ANY REGULATORY CHANGES MAY ADVERSELY AFFECT US. The banking industry is heavily regulated under both federal and state law. These regulations are primarily intended to protect customers, not our creditors or stockholders. As a fi nancial holding company, we are also subject to extensive regulation by the Federal Reserve Board, in addition to other regulatory and self-regulatory organizations. Regulations affecting banks and fi nancial services companies undergo continuous change, and we cannot predict the ultimate effect of such changes, which could have a material adverse effect on our profi tability or fi nancial condition.
/ IF OUR INTERNAL CONTROLS OVER FINANCIAL REPORTING DO NOT COMPLY WITH THE REQUIREMENTS OF THE SARBANES-OXLEY ACT, OUR BUSINESS COULD BE ADVERSELY AFFECTED. Section 404 of the Sarbanes-Oxley Act of 2002 requires us to evaluate the effectiveness of our internal controls over fi nancial reporting as of the end of each year, and to include a management report assessing the effectiveness of our internal controls over fi nancial reporting in all annual reports. Section 404 also requires our independent registered public accounting fi rm to attest to and report on management’s assessment of our internal controls over fi nancial reporting.
Our management, including our CEO and CFO, does not expect that our internal controls over fi nancial reporting will prevent all error and all fraud. A control system, no matter how well designed and operated, can provide only reasonable, not absolute, assurance that the control system’s objectives will be met. Further, the design of a control system must refl ect the fact that there are resource constraints, and the benefi ts of controls must be considered relative to their costs. Because of the inherent limitations in all control systems, no evaluation of controls can provide absolute assurance that all control issues and instances of fraud, if any, have been or will be detected. These inherent limitations include the realities that judgments in decision making can be faulty and that breakdowns can occur because of simple error or mistake. Controls can also be circumvented by the individual acts of some persons, by collusion of two or more people, or by management override of the controls. The design of any system of controls is based in part on certain assumptions about the likelihood of future events, and we cannot assure you that any design will succeed in achieving its stated goals under all potential future conditions. Over time, controls may become inadequate because of changes in conditions or deterioration in the degree of compliance with policies or procedures. Because of the inherent limitations in a cost-effective control system, misstatements due to error or fraud may occur and not be detected.
Although our management has determined and our independent registered public accounting fi rm has attested that our internal controls over fi nancial reporting were effective as of December 31, 2005, we cannot assure you that we or our independent registered public accounting fi rm will not identify a material weakness in our internal controls in the future. A material weakness in our internal controls over fi nancial reporting would require management and our independent registered public accounting fi rm to evaluate our internal controls as ineffective. If our internal controls over fi nancial reporting are not considered adequate, we may experience a loss of public confi dence, which could have an adverse effect on our business and our stock price.
/ WE MUST EVALUATE WHETHER ANY PORTION OF OUR RECORDED GOODWILL IS IMPAIRED. IMPAIRMENT TESTING MAY RESULT IN A MATERIAL, NON-CASH WRITE-DOWN OF OUR GOODWILL ASSETS AND COULD HAVE A MATERIAL ADVERSE IMPACT ON OUR RESULTS OF OPERATIONS. As of December 31, 2005, goodwill represented approximately 2.0% of our total assets. We have recorded goodwill because we paid more for some of our businesses than the fair market value of the tangible and separately measurable intangible net assets of those businesses. Under Statement of Financial Accounting Standard No. 142, “Goodwill and Other Intangible Assets,” we must test our goodwill and other intangible assets with indefi nite lives for impairment at least annually (or whenever events occur which may indicate possible impairment). Goodwill impairment is determined by comparing the fair value of a reporting unit to its carrying amount, including goodwill. If the fair value of the reporting unit exceeds its carrying amount, goodwill of the reporting unit is not considered impaired. If the fair value of the reporting unit is less than the carrying amount, goodwill is considered impaired. We estimate the fair value of our reporting units using
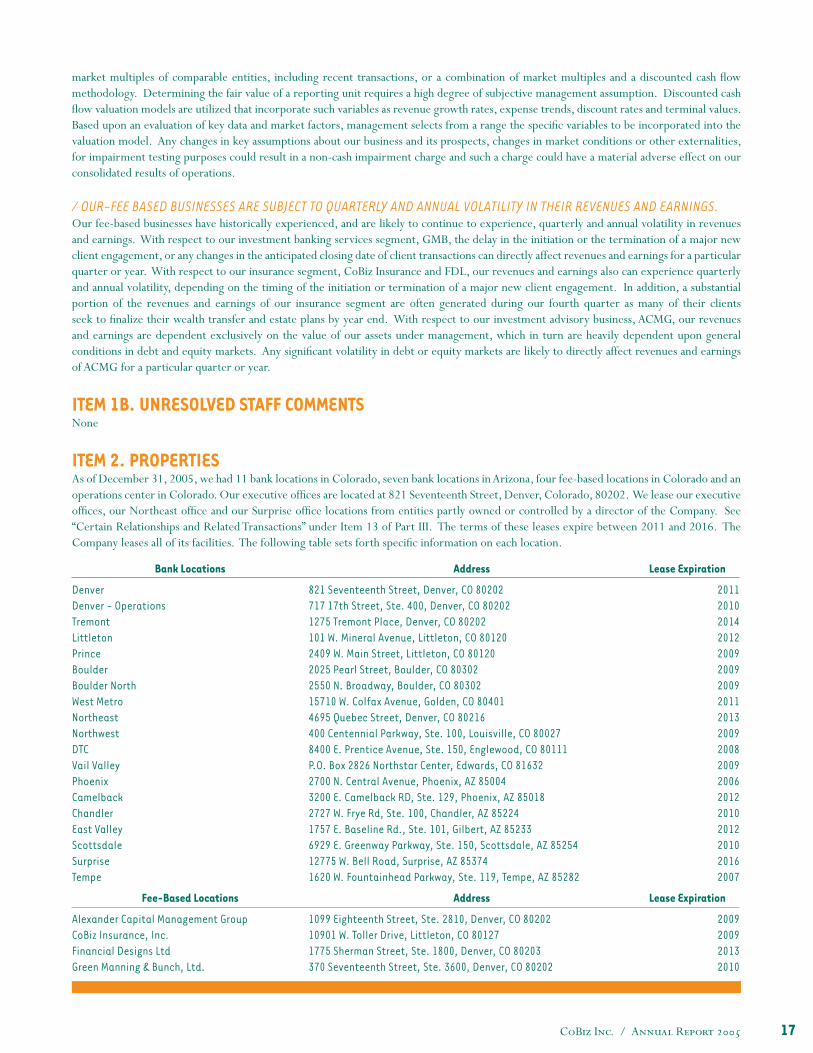
CoBiz Inc. / Annual Report 2005 17
market multiples of comparable entities, including recent transactions, or a combination of market multiples and a discounted cash fl ow methodology. Determining the fair value of a reporting unit requires a high degree of subjective management assumption. Discounted cash fl ow valuation models are utilized that incorporate such variables as revenue growth rates, expense trends, discount rates and terminal values. Based upon an evaluation of key data and market factors, management selects from a range the specifi c variables to be incorporated into the valuation model. Any changes in key assumptions about our business and its prospects, changes in market conditions or other externalities, for impairment testing purposes could result in a non-cash impairment charge and such a charge could have a material adverse effect on our consolidated results of operations.
/ OUR-FEE BASED BUSINESSES ARE SUBJECT TO QUARTERLY AND ANNUAL VOLATILITY IN THEIR REVENUES AND EARNINGS. Our fee-based businesses have historically experienced, and are likely to continue to experience, quarterly and annual volatility in revenues and earnings. With respect to our investment banking services segment, GMB, the delay in the initiation or the termination of a major new client engagement, or any changes in the anticipated closing date of client transactions can directly affect revenues and earnings for a particular quarter or year. With respect to our insurance segment, CoBiz Insurance and FDL, our revenues and earnings also can experience quarterly and annual volatility, depending on the timing of the initiation or termination of a major new client engagement. In addition, a substantial portion of the revenues and earnings of our insurance segment are often generated during our fourth quarter as many of their clients seek to fi nalize their wealth transfer and estate plans by year end. With respect to our investment advisory business, ACMG, our revenues and earnings are dependent exclusively on the value of our assets under management, which in turn are heavily dependent upon general conditions in debt and equity markets. Any signifi cant volatility in debt or equity markets are likely to directly affect revenues and earnings of ACMG for a particular quarter or year.
ITEM 1B. UNRESOLVED STAFF COMMENTSNone
ITEM 2. PROPERTIESAs of December 31, 2005, we had 11 bank locations in Colorado, seven bank locations in Arizona, four fee-based locations in Colorado and an operations center in Colorado. Our executive offi ces are located at 821 Seventeenth Street, Denver, Colorado, 80202. We lease our executive offi ces, our Northeast offi ce and our Surprise offi ce locations from entities partly owned or controlled by a director of the Company. See “Certain Relationships and Related Transactions” under Item 13 of Part III. The terms of these leases expire between 2011 and 2016. The Company leases all of its facilities. The following table sets forth specifi c information on each location.
Bank Locations Address Lease Expiration
DenverDenver - OperationsTremontLittletonPrinceBoulderBoulder NorthWest MetroNortheastNorthwestDTCVail ValleyPhoenixCamelbackChandlerEast ValleyScottsdaleSurpriseTempe
821 Seventeenth Street, Denver, CO 80202717 17th Street, Ste. 400, Denver, CO 802021275 Tremont Place, Denver, CO 80202101 W. Mineral Avenue, Littleton, CO 801202409 W. Main Street, Littleton, CO 801202025 Pearl Street, Boulder, CO 803022550 N. Broadway, Boulder, CO 8030215710 W. Colfax Avenue, Golden, CO 804014695 Quebec Street, Denver, CO 80216400 Centennial Parkway, Ste. 100, Louisville, CO 800278400 E. Prentice Avenue, Ste. 150, Englewood, CO 80111P.O. Box 2826 Northstar Center, Edwards, CO 816322700 N. Central Avenue, Phoenix, AZ 850043200 E. Camelback RD, Ste. 129, Phoenix, AZ 850182727 W. Frye Rd, Ste. 100, Chandler, AZ 852241757 E. Baseline Rd., Ste. 101, Gilbert, AZ 852336929 E. Greenway Parkway, Ste. 150, Scottsdale, AZ 8525412775 W. Bell Road, Surprise, AZ 853741620 W. Fountainhead Parkway, Ste. 119, Tempe, AZ 85282
2011201020142012200920092009201120132009200820092006201220102012201020162007
Fee-Based Locations Address Lease Expiration
Alexander Capital Management GroupCoBiz Insurance, Inc.Financial Designs LtdGreen Manning & Bunch, Ltd.
1099 Eighteenth Street, Ste. 2810, Denver, CO 8020210901 W. Toller Drive, Littleton, CO 801271775 Sherman Street, Ste. 1800, Denver, CO 80203370 Seventeenth Street, Ste. 3600, Denver, CO 80202
2009200920132010
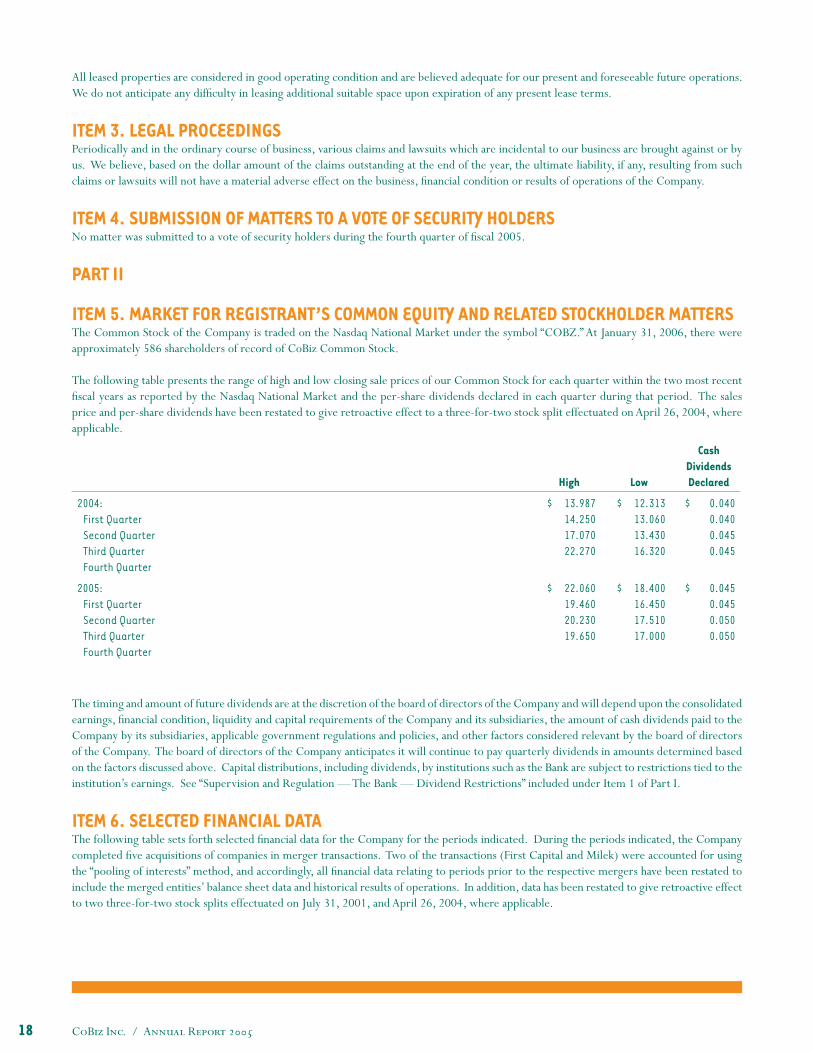
CoBiz Inc. / Annual Report 200518
All leased properties are considered in good operating condition and are believed adequate for our present and foreseeable future operations. We do not anticipate any diffi culty in leasing additional suitable space upon expiration of any present lease terms.
ITEM 3. LEGAL PROCEEDINGSPeriodically and in the ordinary course of business, various claims and lawsuits which are incidental to our business are brought against or by us. We believe, based on the dollar amount of the claims outstanding at the end of the year, the ultimate liability, if any, resulting from such claims or lawsuits will not have a material adverse effect on the business, fi nancial condition or results of operations of the Company.
ITEM 4. SUBMISSION OF MATTERS TO A VOTE OF SECURITY HOLDERSNo matter was submitted to a vote of security holders during the fourth quarter of fi scal 2005.
PART II
ITEM 5. MARKET FOR REGISTRANT’S COMMON EQUITY AND RELATED STOCKHOLDER MATTERS The Common Stock of the Company is traded on the Nasdaq National Market under the symbol “COBZ.” At January 31, 2006, there were approximately 586 shareholders of record of CoBiz Common Stock.
The following table presents the range of high and low closing sale prices of our Common Stock for each quarter within the two most recent fi scal years as reported by the Nasdaq National Market and the per-share dividends declared in each quarter during that period. The sales price and per-share dividends have been restated to give retroactive effect to a three-for-two stock split effectuated on April 26, 2004, where applicable.
High Low
CashDividendsDeclared
2004:First QuarterSecond QuarterThird QuarterFourth Quarter
$ 13.987 14.250 17.070 22.270
$ 12.313 13.060 13.430 16.320
$ 0.040 0.040 0.045 0.045
2005:First QuarterSecond QuarterThird QuarterFourth Quarter
$ 22.060 19.460 20.230 19.650
$ 18.400 16.450 17.510 17.000
$ 0.045 0.045 0.050 0.050
The timing and amount of future dividends are at the discretion of the board of directors of the Company and will depend upon the consolidated earnings, fi nancial condition, liquidity and capital requirements of the Company and its subsidiaries, the amount of cash dividends paid to the Company by its subsidiaries, applicable government regulations and policies, and other factors considered relevant by the board of directors of the Company. The board of directors of the Company anticipates it will continue to pay quarterly dividends in amounts determined based on the factors discussed above. Capital distributions, including dividends, by institutions such as the Bank are subject to restrictions tied to the institution’s earnings. See “Supervision and Regulation — The Bank — Dividend Restrictions” included under Item 1 of Part I.
ITEM 6. SELECTED FINANCIAL DATAThe following table sets forth selected fi nancial data for the Company for the periods indicated. During the periods indicated, the Company completed fi ve acquisitions of companies in merger transactions. Two of the transactions (First Capital and Milek) were accounted for using the “pooling of interests” method, and accordingly, all fi nancial data relating to periods prior to the respective mergers have been restated to include the merged entities’ balance sheet data and historical results of operations. In addition, data has been restated to give retroactive effect to two three-for-two stock splits effectuated on July 31, 2001, and April 26, 2004, where applicable.
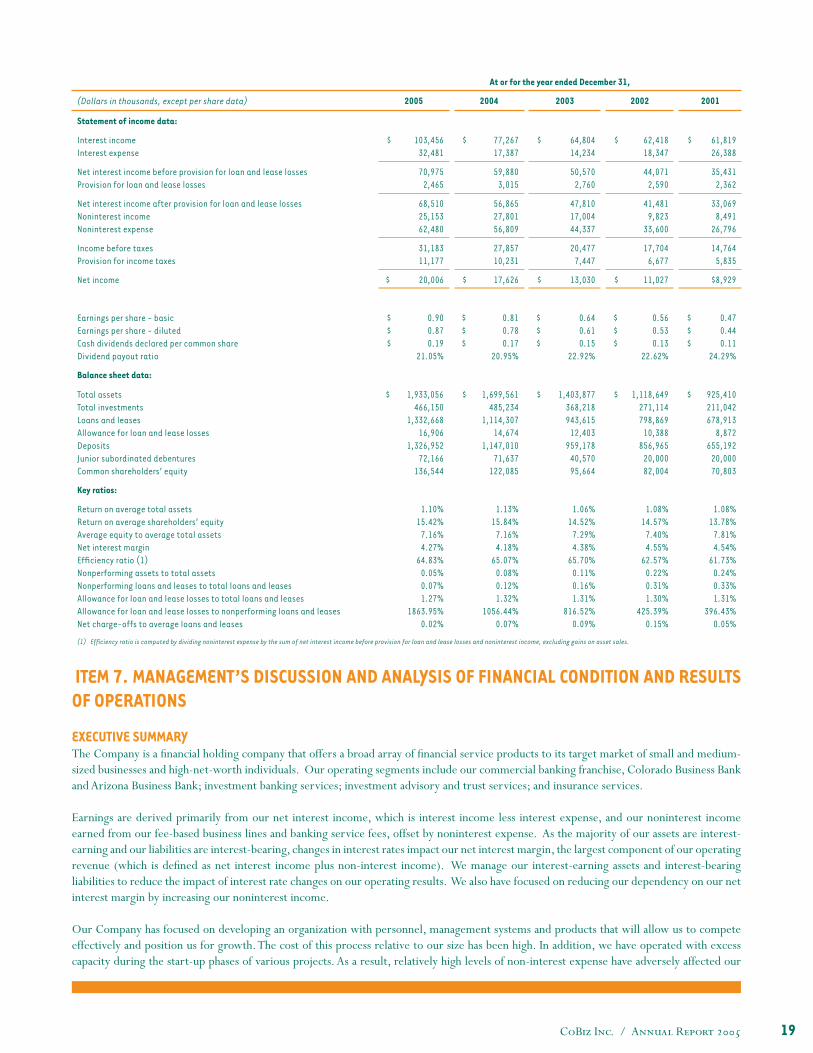
CoBiz Inc. / Annual Report 2005 19
At or for the year ended December 31,
(Dollars in thousands, except per share data) 2005 2004 2003 2002 2001
Statement of income data:
Interest incomeInterest expense
$ 103,456 32,481
$ 77,267 17,387
$ 64,804 14,234
$ 62,418 18,347
$ 61,819 26,388
Net interest income before provision for loan and lease lossesProvision for loan and lease losses
70,975 2,465
59,880 3,015
50,570 2,760
44,071 2,590
35,431 2,362
Net interest income after provision for loan and lease lossesNoninterest incomeNoninterest expense
68,510 25,153 62,480
56,865 27,801 56,809
47,810 17,004 44,337
41,481 9,823
33,600
33,069 8,491
26,796
Income before taxesProvision for income taxes
31,183 11,177
27,857 10,231
20,477 7,447
17,704 6,677
14,764 5,835
Net income $ 20,006 $ 17,626 $ 13,030 $ 11,027 $8,929
Earnings per share - basicEarnings per share - dilutedCash dividends declared per common shareDividend payout ratio
$ 0.90 $ 0.87 $ 0.19
21.05%
$ 0.81 $ 0.78 $ 0.17
20.95%
$ 0.64 $ 0.61 $ 0.15
22.92%
$ 0.56 $ 0.53 $ 0.13
22.62%
$ 0.47 $ 0.44 $ 0.11
24.29%
Balance sheet data:
Total assetsTotal investmentsLoans and leasesAllowance for loan and lease lossesDepositsJunior subordinated debenturesCommon shareholders’ equity
$ 1,933,056 466,150
1,332,668 16,906
1,326,952 72,166
136,544
$ 1,699,561 485,234
1,114,307 14,674
1,147,010 71,637
122,085
$ 1,403,877 368,218 943,615
12,403 959,178
40,570 95,664
$ 1,118,649 271,114 798,869
10,388 856,965
20,000 82,004
$ 925,410 211,042 678,913
8,872 655,192
20,000 70,803
Key ratios:
Return on average total assetsReturn on average shareholders’ equityAverage equity to average total assetsNet interest margin Effi ciency ratio (1)Nonperforming assets to total assetsNonperforming loans and leases to total loans and leasesAllowance for loan and lease losses to total loans and leasesAllowance for loan and lease losses to nonperforming loans and leasesNet charge-offs to average loans and leases
1.10%15.42%
7.16%4.27%
64.83%0.05%0.07%1.27%
1863.95%0.02%
1.13%15.84%
7.16%4.18%
65.07%0.08%0.12%1.32%
1056.44%0.07%
1.06%14.52%
7.29%4.38%
65.70%0.11%0.16%1.31%
816.52%0.09%
1.08%14.57%
7.40%4.55%
62.57%0.22%0.31%1.30%
425.39%0.15%
1.08%13.78%
7.81%4.54%
61.73%0.24%0.33%1.31%
396.43%0.05%
(1) Effi ciency ratio is computed by dividing noninterest expense by the sum of net interest income before provision for loan and lease losses and noninterest income, excluding gains on asset sales.
ITEM 7. MANAGEMENT’S DISCUSSION AND ANALYSIS OF FINANCIAL CONDITION AND RESULTS OF OPERATIONS
EXECUTIVE SUMMARYThe Company is a fi nancial holding company that offers a broad array of fi nancial service products to its target market of small and medium-sized businesses and high-net-worth individuals. Our operating segments include our commercial banking franchise, Colorado Business Bank and Arizona Business Bank; investment banking services; investment advisory and trust services; and insurance services.
Earnings are derived primarily from our net interest income, which is interest income less interest expense, and our noninterest income earned from our fee-based business lines and banking service fees, offset by noninterest expense. As the majority of our assets are interest-earning and our liabilities are interest-bearing, changes in interest rates impact our net interest margin, the largest component of our operating revenue (which is defi ned as net interest income plus non-interest income). We manage our interest-earning assets and interest-bearing liabilities to reduce the impact of interest rate changes on our operating results. We also have focused on reducing our dependency on our net interest margin by increasing our noninterest income.
Our Company has focused on developing an organization with personnel, management systems and products that will allow us to compete effectively and position us for growth. The cost of this process relative to our size has been high. In addition, we have operated with excess capacity during the start-up phases of various projects. As a result, relatively high levels of non-interest expense have adversely affected our
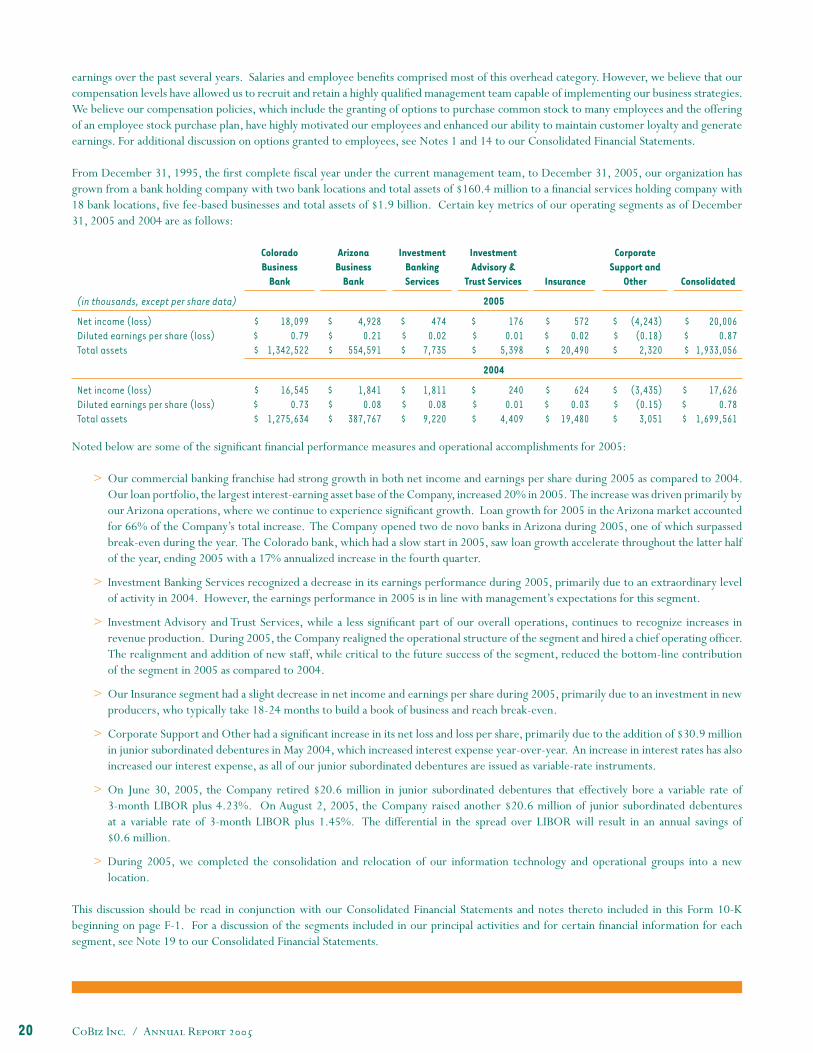
CoBiz Inc. / Annual Report 200520
earnings over the past several years. Salaries and employee benefi ts comprised most of this overhead category. However, we believe that our compensation levels have allowed us to recruit and retain a highly qualifi ed management team capable of implementing our business strategies. We believe our compensation policies, which include the granting of options to purchase common stock to many employees and the offering of an employee stock purchase plan, have highly motivated our employees and enhanced our ability to maintain customer loyalty and generate earnings. For additional discussion on options granted to employees, see Notes 1 and 14 to our Consolidated Financial Statements.
From December 31, 1995, the fi rst complete fi scal year under the current management team, to December 31, 2005, our organization has grown from a bank holding company with two bank locations and total assets of $160.4 million to a fi nancial services holding company with 18 bank locations, fi ve fee-based businesses and total assets of $1.9 billion. Certain key metrics of our operating segments as of December 31, 2005 and 2004 are as follows:
ColoradoBusiness
Bank
ArizonaBusiness
Bank
InvestmentBanking Services
InvestmentAdvisory &
Trust Services Insurance
CorporateSupport and
Other Consolidated
(in thousands, except per share data) 2005
Net income (loss)Diluted earnings per share (loss)Total assets
$ 18,099 $ 0.79 $ 1,342,522
$ 4,928 $ 0.21 $ 554,591
$ 474 $ 0.02 $ 7,735
$ 176 $ 0.01 $ 5,398
$ 572 $ 0.02 $ 20,490
$ (4,243) $ (0.18) $ 2,320
$ 20,006 $ 0.87 $ 1,933,056
2004
Net income (loss)Diluted earnings per share (loss)Total assets
$ 16,545 $ 0.73 $ 1,275,634
$ 1,841 $ 0.08 $ 387,767
$ 1,811 $ 0.08 $ 9,220
$ 240 $ 0.01 $ 4,409
$ 624 $ 0.03 $ 19,480
$ (3,435) $ (0.15) $ 3,051
$ 17,626 $ 0.78 $ 1,699,561
Noted below are some of the signifi cant fi nancial performance measures and operational accomplishments for 2005:
> Our commercial banking franchise had strong growth in both net income and earnings per share during 2005 as compared to 2004. Our loan portfolio, the largest interest-earning asset base of the Company, increased 20% in 2005. The increase was driven primarily by our Arizona operations, where we continue to experience signifi cant growth. Loan growth for 2005 in the Arizona market accounted for 66% of the Company’s total increase. The Company opened two de novo banks in Arizona during 2005, one of which surpassed break-even during the year. The Colorado bank, which had a slow start in 2005, saw loan growth accelerate throughout the latter half of the year, ending 2005 with a 17% annualized increase in the fourth quarter.
> Investment Banking Services recognized a decrease in its earnings performance during 2005, primarily due to an extraordinary level of activity in 2004. However, the earnings performance in 2005 is in line with management’s expectations for this segment.
> Investment Advisory and Trust Services, while a less signifi cant part of our overall operations, continues to recognize increases in revenue production. During 2005, the Company realigned the operational structure of the segment and hired a chief operating offi cer. The realignment and addition of new staff, while critical to the future success of the segment, reduced the bottom-line contribution of the segment in 2005 as compared to 2004.
> Our Insurance segment had a slight decrease in net income and earnings per share during 2005, primarily due to an investment in new producers, who typically take 18-24 months to build a book of business and reach break-even.
> Corporate Support and Other had a signifi cant increase in its net loss and loss per share, primarily due to the addition of $30.9 million in junior subordinated debentures in May 2004, which increased interest expense year-over-year. An increase in interest rates has also increased our interest expense, as all of our junior subordinated debentures are issued as variable-rate instruments.
> On June 30, 2005, the Company retired $20.6 million in junior subordinated debentures that effectively bore a variable rate of 3-month LIBOR plus 4.23%. On August 2, 2005, the Company raised another $20.6 million of junior subordinated debentures at a variable rate of 3-month LIBOR plus 1.45%. The differential in the spread over LIBOR will result in an annual savings of $0.6 million.
> During 2005, we completed the consolidation and relocation of our information technology and operational groups into a new location.
This discussion should be read in conjunction with our Consolidated Financial Statements and notes thereto included in this Form 10-K beginning on page F-1. For a discussion of the segments included in our principal activities and for certain fi nancial information for each segment, see Note 19 to our Consolidated Financial Statements.
CoBiz Inc. / Annual Report 2005 21
/ BANKIn 2005, Arizona Business Bank made its most signifi cant contribution to the Company’s bottom line since the franchise joined the Company in 2001. In the fourth quarter of 2005, they contributed 31% of the Company’s after-tax net income, versus 11% during the fourth quarter of 2004. For the full year, the Arizona bank supplied 25%, or $4.9 million, of the Company’s total net income. By way of comparison, the Company’s Colorado banking franchise, which has historically supplied the majority of the company’s earnings, reported $18.1 million in net income for 2005, compared to $16.5 million for 2004.
The commercial bank franchise as a whole had continued success in attracting core deposits with overall deposits and customer repurchase agreements growing at an annualized pace of 24% for the fourth quarter of 2005, and 19% over the end of 2004. Non-interest-bearing demand accounts grew 23% for the year and represent 33% of the Company’s total deposits, up from 31% a year ago. Arizona Business Bank’s deposits and customer repurchase agreements were up $89.5 million for the year, or 41%. Colorado Business Bank grew deposits and customer repurchase agreements at an annualized rate of 23% during the fourth quarter of 2005, and $150.9 million, or 14%, for the full year.
/ FEE-BASED BUSINESS LINESThe company’s fee-based business lines – investment banking, insurance, and investment advisory and trust – were all accretive for the year. Our ratio of noninterest income to total operating revenues was 26% for 2005 compared to 32% in 2004. This is in line with the Company’s ongoing target of 25% but is down from 2004, a year which saw record revenues from the Company’s investment banking segment.
We believe that through the combination of our commercial banking franchise and our fee-based businesses, we are uniquely situated to service our commercial clients throughout their business lifecycle. We are able to help our customers grow by providing banking services from our bank franchise, capital planning from GMB, and employee and executive benefi ts packages from FDL. We can assist in planning for the future with wealth transfer planning and business succession from FDL. We are able to protect assets with P&C insurance from CoBiz Insurance. We can facilitate exit and retirement strategies with merger and acquisition (“M&A”) services from GMB, and investment management services with ACMG. We are also able to preserve our customers’ wealth with trust and fi duciary services from CoBiz Private Asset Management, investment management services from ACMG, and wealth transfer services from FDL.
/ CRITICAL ACCOUNTING POLICIES The Company’s discussion and analysis of its fi nancial condition and results of operations are based upon the Company’s consolidated fi nancial statements, which have been prepared in accordance with accounting principles generally accepted in the United States of America. The preparation of these fi nancial statements requires the Company to make estimates and judgments that affect the reported amounts of assets, liabilities, revenues and expenses. In making those critical accounting estimates, we are required to make assumptions about matters that are highly uncertain at the time of the estimate. Different estimates we could reasonably have used, or changes in the assumptions that could occur, could have a material effect on our fi nancial condition or results of operations.
/ ALLOWANCE FOR LOAN LOSSESThe allowance for loan losses is a critical accounting policy that requires subjective estimates in the preparation of the consolidated fi nancial statements. The allowance for loan losses is evaluated on a regular basis by management and is based upon management’s periodic review of the collectibilty of loans in light of historical experience, the nature and volume of the loan portfolio, adverse situations that may affect the borrower’s ability to repay, estimated value of any underlying collateral and prevailing economic conditions. This evaluation is inherently subjective as it requires estimates that are susceptible to signifi cant revision as more information becomes available.
We maintain a loan review program independent of the lending function that is designed to reduce and control risk in the lending function. It includes the monitoring of lending activities with respect to underwriting and processing new loans, preventing insider abuse, and timely follow-up and corrective action for loans showing signs of deterioration in quality. We also have a systematic process to evaluate individual loans and pools of loans within our loan portfolio. We maintain a loan grading system whereby each loan is assigned a grade between 1 and 8, with 1 representing the highest quality credit, 7 representing a non-accrual loan where collection or liquidation in full is highly questionable and improbable, and 8 representing a loss that has been or will be charged-off. Grades are assigned based upon the degree of risk associated with repayment of a loan in the normal course of business pursuant to the original terms. Loans above a certain dollar amount that are adversely graded are reported to the Loan Committee and the Chief Credit Offi cer along with current fi nancial information, a collateral analysis and an action plan. Individual loans that are deemed to be impaired are evaluated in accordance with Statement of Financial Accounting Standards (“SFAS”) No. 114 “Accounting by Creditors for Impairment of a Loan.”
In determining the appropriate level of the allowance for loan losses, we analyze the various components of the loan portfolio, including all signifi cant credits, on an individual basis. When analyzing the adequacy, we segment the loan portfolio into components with similar characteristics, such as risk classifi cation, past due status, type of loan, industry or collateral. Possible factors that may impact the allowance
CoBiz Inc. / Annual Report 200522
for loan losses include, but are not limited to:
> Changes in lending policies and procedures, including underwriting standards as well as collection, charge-off and recovery practices.> Changes in national and local economic and business conditions and developments, including the condition of various market segments.> Changes in the nature and volume of the portfolio.> Changes in the experience, ability, and depth of lending management and staff.> Changes in the trend of the volume and severity of past-due and classifi ed loans; and trends in the volume of non-accrual loans, troubled debt restructurings, and other loan modifi cations.> The existence and effect of any concentrations of credit, and changes in the level of such concentrations.> The effect of external factors such as competition and legal and regulatory requirements on the level of estimated credit losses in the current portfolio.
Refer to the Provision and Allowance for Loan Losses section under Results of Operations below for further discussion on management’s methodology.
/ RECOVERABILITY OF GOODWILLSFAS No. 142 “Goodwill and Other Intangible Assets,” requires that we evaluate on an annual basis (or whenever events occur which may indicate possible impairment) whether any portion of our recorded goodwill is impaired. The recoverability of goodwill is a critical accounting policy that requires subjective estimates in the preparation of the consolidated fi nancial statements. Goodwill impairment is determined by comparing the fair value of a reporting unit to its carrying amount, including goodwill. If the fair value of the reporting unit exceeds its carrying amount, goodwill of the reporting unit is not considered impaired. If the fair value of the reporting unit is less than the carrying amount, goodwill is considered impaired. We estimate the fair value of our reporting units using market multiples of comparable entities, including recent transactions, or a combination of market multiples and a discounted cash fl ow methodology.
Determining the fair value of a reporting unit requires a high degree of subjective management assumption. Discounted cash fl ow valuation models are utilized that incorporate such variables as revenue growth rates, expense trends, discount rates and terminal values. Based upon an evaluation of key data and market factors, management selects from a range the specifi c variables to be incorporated into the valuation model.
We conducted our annual evaluation of our reporting units as of December 31, 2005. As discussed in Note 6 to our Consolidated Financial Statements, for the period ending December 31, 2005, the estimated fair value of all reporting units exceeded their carrying values and goodwill impairment was not deemed to exist. The fair value calculations were also tested for sensitivity to refl ect reasonable variations, including keeping all other variables constant and reducing projected revenue growth and projected cost savings. Using this sensitivity approach, there was no impairment identifi ed in any reporting unit.
We also have other policies that we consider to be key accounting policies; however, these policies, which are disclosed in Note 1 of Notes to Consolidated Financial Statements, do not meet the defi nition of critical accounting policies because they do not generally require us to make estimates or judgments that are diffi cult or subjective.
/ RECENT ACCOUNTING PRONOUNCEMENTSIn December 2004, the Financial Accounting Standards Board (“FASB”) issued SFAS No. 123 (revised 2004), “Share-Based Payment.” SFAS 123(R) requires that the compensation cost relating to share-based payment transactions, including grants of employee stock options, be recognized in fi nancial statements. That cost will be measured based on the fair value of the equity or liability instruments issued. SFAS 123(R) covers a wide range of share-based compensation arrangements including stock options, restricted share plans, performance-based awards, share appreciation rights and employee stock purchase plans.
SFAS 123(R) specifi es that the fair value of an employee stock option must be based on an observable market price of an option with the same or similar terms and conditions if one is available or, if an observable market price is not available, the fair value must be estimated using a valuation technique that (1) is applied in a manner consistent with the fair value measurement objective and the other requirements of the Statement, (2) is based on established principles of fi nancial economic theory and generally applied to that fi eld, and (3) refl ects all substantive characteristics of the instrument. SFAS 123(R) permits entities to use any option-pricing model that meets the fair value objective in the Statement.
In March 2005, the SEC issued Staff Accounting Bulletin No. 107, “TOPIC 14: Share-Based Payment” (“SAB 107”) which was effective immediately. SAB 107 addresses the interaction between SFAS 123(R) and certain SEC rules and regulations and provides views regarding the valuation
CoBiz Inc. / Annual Report 2005 23
of share-based payment arrangements for public companies. The Company does not expect the requirements of SAB 107 to have a material impact on its consolidated fi nancial statements.
In April 2005, the SEC amended Rule 4-01(a) of Regulation S-X regarding the compliance date for SFAS 123(R). The amendment postpones the effective date for the Company to January 1, 2006. As of the effective date, the Company will apply SFAS 123(R) using a modifi ed version of prospective application. Under that transition method, compensation cost is recognized for (1) all awards granted after the required effective date and to awards modifi ed, cancelled, or repurchased after that date and (2) the portion of prior awards for which the requisite service has not yet been rendered, based on the grant-date fair value of those awards calculated for either recognition or pro forma disclosures under SFAS 123. Currently, the Company offers several stock option plans and an employee stock purchase plan that will be impacted by this Statement.
Based on the non-vested stock-based compensation awards outstanding as of December 31, 2005, the Company estimates the quantitative impact of SFAS 123(R) on a pre-tax basis will be $749,000. The future impact of SFAS 123(R) will depend upon various factors, among them being the Company’s issuance of additional stock-based compensation awards, cancellations and modifi cations of existing awards, and the cost of the Company’s Employee Stock Purchase Plan which is dependent on the Company’s stock price and employee participation.
In May 2005, the FASB issued SFAS No. 154, “Accounting Changes and Error Corrections – A Replacement of APB No. 20 and FASB Statement No. 3.” SFAS No. 154 establishes, unless impractible, retrospective application as the required method for reporting a change in accounting principle. SFAS 154 carried forward the guidance contained in APB Opinion 20 for reporting the correction of an error in previously issued fi nancial statements and a change in accounting estimate. SFAS 154 is effective for accounting changes and error corrections made in fi scal years beginning after December 15, 2005. The Company does not expect the requirements of SFAS No. 154 to have a material impact on its consolidated fi nancial statements.
In November 2005, the FASB issued FSP FAS 115-1 and FAS 124-1, “The Meaning of Other-Than-Temporary Impairment and Its Application to Certain Investments” (“FSP 115-1 and 124-1”), which clarifi es when an investment is considered impaired, whether the impairment is other than temporary, and the measurement of an impairment loss. It also includes accounting considerations subsequent to the recognition of an other-than-temporary impairment and requires certain disclosures about unrealized losses that have not been recognized as other-than-temporary impairments. FSP 115-1 and 124-1 are effective for all reporting periods beginning after December 15, 2005. The Company does not expect the requirements of FSP 115-1 and 124-1 to have a material impact on its consolidated fi nancial statements.
/ FINANCIAL CONDITIONThe acquisition of Milek and First Capital were both accounted for as a pooling of interests. Accordingly, the Company’s fi nancial statements for all years presented in this report give retroactive effect to those acquisitions and combine the assets, liabilities, shareholders’ equity, income and expenses of the Company and the acquired entities at all dates and for all periods covered by the fi nancial statements. All of the comparative information contained in the following sections of this report also gives retroactive effect to those acquisitions as though the Company and the acquired entities had been combined at both dates or for both periods being compared. The acquisitions of ACMG, FDL and GMB were accounted for as purchases and the assets, liabilities, income and expenses of the acquired entities are included in the Company’s fi nancial statements only for periods following the closing of the acquisitions. For a summary of the contributions of the operations formerly conducted by our acquisitions to the assets and income of the Company during each period reported, see the segment information in Note 19 to our Consolidated Financial Statements.
/ LENDING ACTIVITIESGeneral. We provide a broad range of commercial and retail lending services, including commercial loans, commercial and residential real estate construction loans, commercial and residential real estate mortgage loans, consumer loans, revolving lines of credit, and equipment lease fi nancing. Our primary lending focus is commercial and real estate lending to small and medium-sized businesses with annual sales of $5.0 million to $75.0 million, and businesses and individuals with borrowing requirements of $250,000 to $10.0 million. At December 31, 2005, substantially all of our outstanding loans were to customers within Colorado and Arizona. Interest rates charged on loans vary with the degree of risk, maturity, underwriting and servicing costs, principal amount, and extent of other banking relationships with the customer, and are further subject to competitive pressures, money market rates, availability of funds, and government regulations. See “Net Interest Income” for an analysis of the interest rates on our loans.
Credit Procedures and Review. We address credit risk through internal credit policies and procedures, including underwriting criteria, offi cer and customer lending limits, a multi-layered loan approval process for larger loans, periodic document examination, justifi cation for any exceptions to credit policies, loan review and concentration monitoring. In addition, we provide ongoing loan offi cer training and review. We have a continuous loan review process designed to promote early identifi cation of credit quality problems, assisted by a dedicated Chief Credit Offi cer. During 2004, the Company established a new senior credit offi cer position to oversee the real estate portfolio. All loan
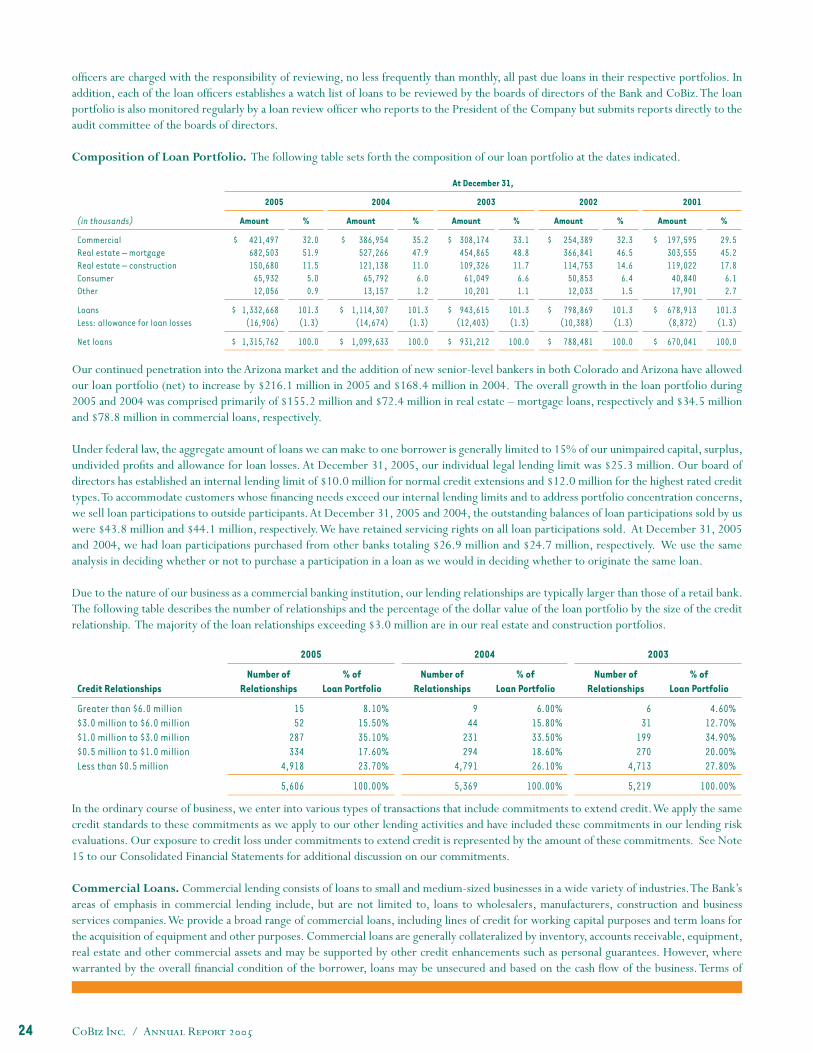
CoBiz Inc. / Annual Report 200524
offi cers are charged with the responsibility of reviewing, no less frequently than monthly, all past due loans in their respective portfolios. In addition, each of the loan offi cers establishes a watch list of loans to be reviewed by the boards of directors of the Bank and CoBiz. The loan portfolio is also monitored regularly by a loan review offi cer who reports to the President of the Company but submits reports directly to the audit committee of the boards of directors.
Composition of Loan Portfolio. The following table sets forth the composition of our loan portfolio at the dates indicated.
At December 31,
2005 2004 2003 2002 2001
(in thousands) Amount % Amount % Amount % Amount % Amount %
Commercial Real estate – mortgageReal estate – construction Consumer Other
$ 421,497 682,503 150,680
65,932 12,056
32.0 51.9 11.5
5.0 0.9
$ 386,954 527,266 121,138
65,792 13,157
35.2 47.9 11.0
6.0 1.2
$ 308,174 454,865 109,326
61,049 10,201
33.1 48.8 11.7
6.6 1.1
$ 254,389 366,841 114,753
50,853 12,033
32.3 46.5 14.6
6.4 1.5
$ 197,595 303,555 119,022
40,840 17,901
29.5 45.2 17.8
6.1 2.7
LoansLess: allowance for loan losses
$ 1,332,668 (16,906)
101.3 (1.3)
$ 1,114,307 (14,674)
101.3 (1.3)
$ 943,615 (12,403)
101.3 (1.3)
$ 798,869 (10,388)
101.3 (1.3)
$ 678,913 (8,872)
101.3 (1.3)
Net loans $ 1,315,762 100.0 $ 1,099,633 100.0 $ 931,212 100.0 $ 788,481 100.0 $ 670,041 100.0
Our continued penetration into the Arizona market and the addition of new senior-level bankers in both Colorado and Arizona have allowed our loan portfolio (net) to increase by $216.1 million in 2005 and $168.4 million in 2004. The overall growth in the loan portfolio during 2005 and 2004 was comprised primarily of $155.2 million and $72.4 million in real estate – mortgage loans, respectively and $34.5 million and $78.8 million in commercial loans, respectively.
Under federal law, the aggregate amount of loans we can make to one borrower is generally limited to 15% of our unimpaired capital, surplus, undivided profi ts and allowance for loan losses. At December 31, 2005, our individual legal lending limit was $25.3 million. Our board of directors has established an internal lending limit of $10.0 million for normal credit extensions and $12.0 million for the highest rated credit types. To accommodate customers whose fi nancing needs exceed our internal lending limits and to address portfolio concentration concerns, we sell loan participations to outside participants. At December 31, 2005 and 2004, the outstanding balances of loan participations sold by us were $43.8 million and $44.1 million, respectively. We have retained servicing rights on all loan participations sold. At December 31, 2005 and 2004, we had loan participations purchased from other banks totaling $26.9 million and $24.7 million, respectively. We use the same analysis in deciding whether or not to purchase a participation in a loan as we would in deciding whether to originate the same loan.
Due to the nature of our business as a commercial banking institution, our lending relationships are typically larger than those of a retail bank. The following table describes the number of relationships and the percentage of the dollar value of the loan portfolio by the size of the credit relationship. The majority of the loan relationships exceeding $3.0 million are in our real estate and construction portfolios.
2005 2004 2003
Credit RelationshipsNumber of
Relationships% of
Loan PortfolioNumber of
Relationships% of
Loan PortfolioNumber of
Relationships% of
Loan Portfolio
Greater than $6.0 million$3.0 million to $6.0 million $1.0 million to $3.0 million $0.5 million to $1.0 millionLess than $0.5 million
15 52
287 334
4,918
8.10%15.50%35.10%17.60%23.70%
9 44
231 294
4,791
6.00%15.80%33.50%18.60%26.10%
6 31
199 270
4,713
4.60%12.70%34.90%20.00%27.80%
5,606 100.00% 5,369 100.00% 5,219 100.00%
In the ordinary course of business, we enter into various types of transactions that include commitments to extend credit. We apply the same credit standards to these commitments as we apply to our other lending activities and have included these commitments in our lending risk evaluations. Our exposure to credit loss under commitments to extend credit is represented by the amount of these commitments. See Note 15 to our Consolidated Financial Statements for additional discussion on our commitments.
Commercial Loans. Commercial lending consists of loans to small and medium-sized businesses in a wide variety of industries. The Bank’s areas of emphasis in commercial lending include, but are not limited to, loans to wholesalers, manufacturers, construction and business services companies. We provide a broad range of commercial loans, including lines of credit for working capital purposes and term loans for the acquisition of equipment and other purposes. Commercial loans are generally collateralized by inventory, accounts receivable, equipment, real estate and other commercial assets and may be supported by other credit enhancements such as personal guarantees. However, where warranted by the overall fi nancial condition of the borrower, loans may be unsecured and based on the cash fl ow of the business. Terms of
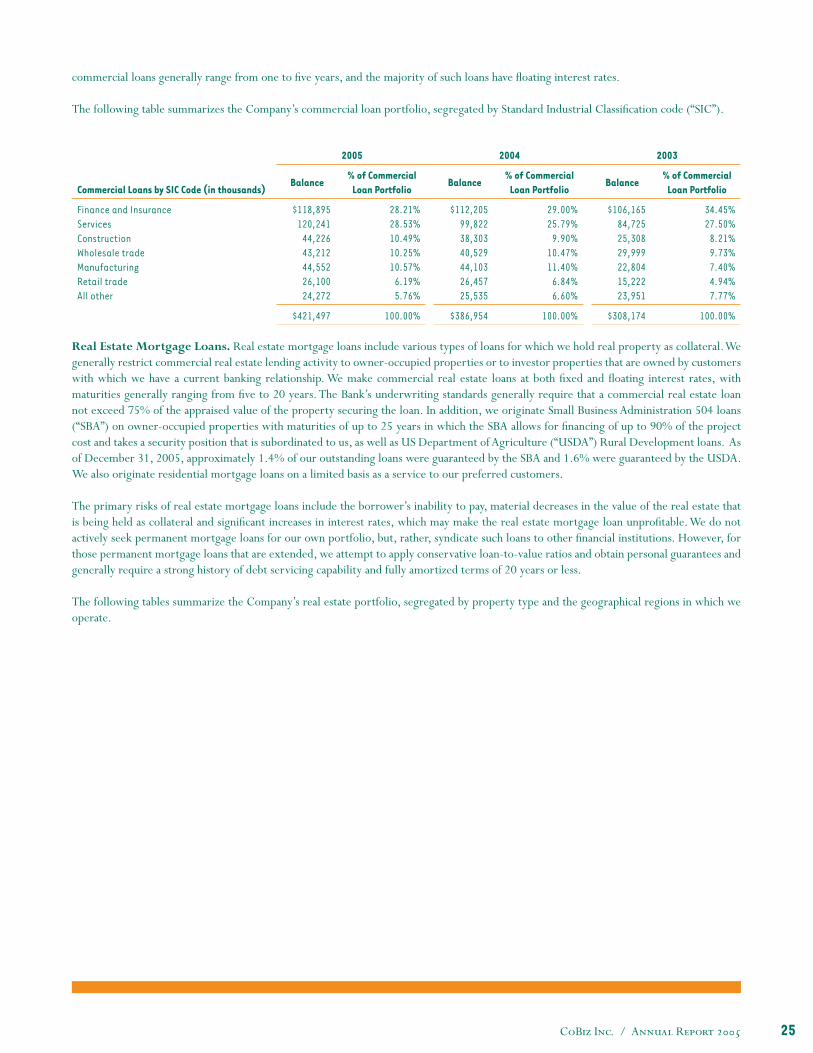
CoBiz Inc. / Annual Report 2005 25
commercial loans generally range from one to fi ve years, and the majority of such loans have fl oating interest rates.
The following table summarizes the Company’s commercial loan portfolio, segregated by Standard Industrial Classifi cation code (“SIC”).
Real Estate Mortgage Loans. Real estate mortgage loans include various types of loans for which we hold real property as collateral. We generally restrict commercial real estate lending activity to owner-occupied properties or to investor properties that are owned by customers with which we have a current banking relationship. We make commercial real estate loans at both fi xed and fl oating interest rates, with maturities generally ranging from fi ve to 20 years. The Bank’s underwriting standards generally require that a commercial real estate loan not exceed 75% of the appraised value of the property securing the loan. In addition, we originate Small Business Administration 504 loans (“SBA”) on owner-occupied properties with maturities of up to 25 years in which the SBA allows for fi nancing of up to 90% of the project cost and takes a security position that is subordinated to us, as well as US Department of Agriculture (“USDA”) Rural Development loans. As of December 31, 2005, approximately 1.4% of our outstanding loans were guaranteed by the SBA and 1.6% were guaranteed by the USDA. We also originate residential mortgage loans on a limited basis as a service to our preferred customers.
The primary risks of real estate mortgage loans include the borrower’s inability to pay, material decreases in the value of the real estate that is being held as collateral and signifi cant increases in interest rates, which may make the real estate mortgage loan unprofi table. We do not actively seek permanent mortgage loans for our own portfolio, but, rather, syndicate such loans to other fi nancial institutions. However, for those permanent mortgage loans that are extended, we attempt to apply conservative loan-to-value ratios and obtain personal guarantees and generally require a strong history of debt servicing capability and fully amortized terms of 20 years or less.
The following tables summarize the Company’s real estate portfolio, segregated by property type and the geographical regions in which we operate.
2005 2004 2003
Commercial Loans by SIC Code (in thousands) Balance
% of Commercial Loan Portfolio
Balance % of Commercial
Loan Portfolio Balance
% of Commercial Loan Portfolio
Finance and InsuranceServicesConstructionWholesale tradeManufacturingRetail tradeAll other
$118,895 120,241
44,226 43,212 44,552 26,100 24,272
28.21%28.53%10.49%10.25%10.57%
6.19%5.76%
$112,205 99,822 38,303 40,529 44,103 26,457 25,535
29.00%25.79%
9.90%10.47%11.40%
6.84%6.60%
$106,165 84,725 25,308 29,999 22,804 15,222 23,951
34.45%27.50%
8.21%9.73%7.40%4.94%7.77%
$421,497 100.00% $386,954 100.00% $308,174 100.00%
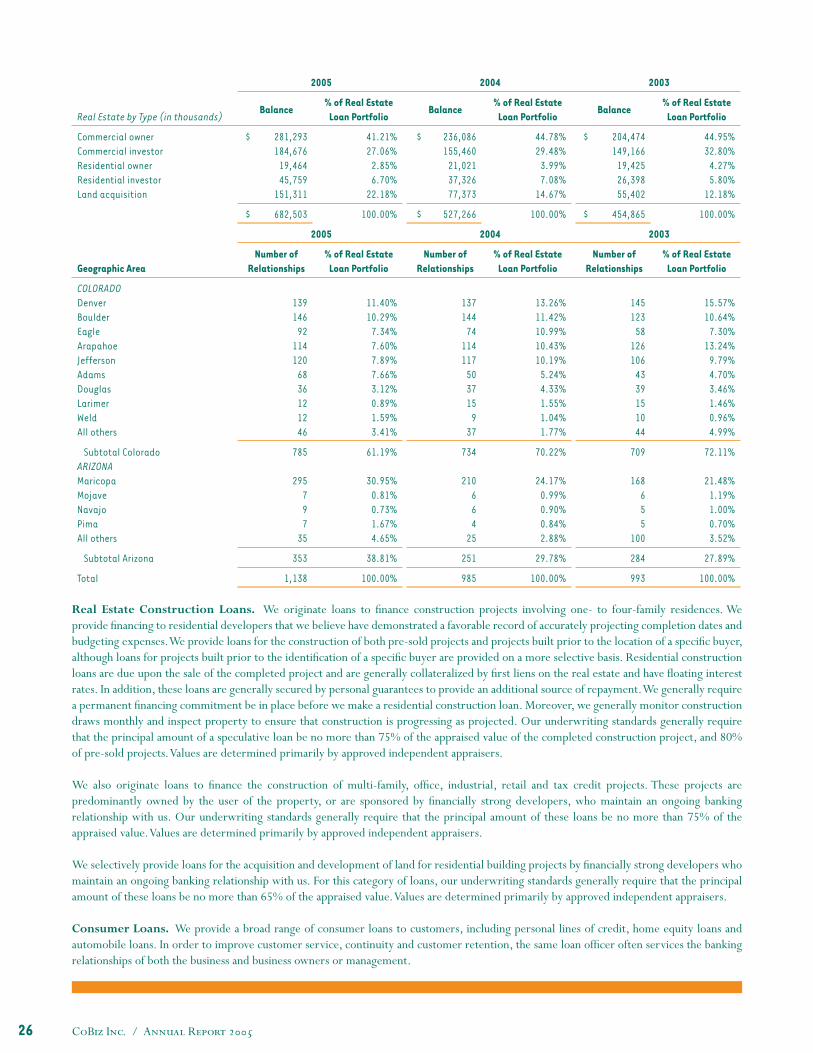
CoBiz Inc. / Annual Report 200526
Real Estate Construction Loans. We originate loans to fi nance construction projects involving one- to four-family residences. We provide fi nancing to residential developers that we believe have demonstrated a favorable record of accurately projecting completion dates and budgeting expenses. We provide loans for the construction of both pre-sold projects and projects built prior to the location of a specifi c buyer, although loans for projects built prior to the identifi cation of a specifi c buyer are provided on a more selective basis. Residential construction loans are due upon the sale of the completed project and are generally collateralized by fi rst liens on the real estate and have fl oating interest rates. In addition, these loans are generally secured by personal guarantees to provide an additional source of repayment. We generally require a permanent fi nancing commitment be in place before we make a residential construction loan. Moreover, we generally monitor construction draws monthly and inspect property to ensure that construction is progressing as projected. Our underwriting standards generally require that the principal amount of a speculative loan be no more than 75% of the appraised value of the completed construction project, and 80% of pre-sold projects. Values are determined primarily by approved independent appraisers.
We also originate loans to fi nance the construction of multi-family, offi ce, industrial, retail and tax credit projects. These projects are predominantly owned by the user of the property, or are sponsored by fi nancially strong developers, who maintain an ongoing banking relationship with us. Our underwriting standards generally require that the principal amount of these loans be no more than 75% of the appraised value. Values are determined primarily by approved independent appraisers.
We selectively provide loans for the acquisition and development of land for residential building projects by fi nancially strong developers who maintain an ongoing banking relationship with us. For this category of loans, our underwriting standards generally require that the principal amount of these loans be no more than 65% of the appraised value. Values are determined primarily by approved independent appraisers.
Consumer Loans. We provide a broad range of consumer loans to customers, including personal lines of credit, home equity loans and automobile loans. In order to improve customer service, continuity and customer retention, the same loan offi cer often services the banking relationships of both the business and business owners or management.
2005 2004 2003
Real Estate by Type (in thousands) Balance
% of Real Estate Loan Portfolio
Balance % of Real Estate
Loan Portfolio Balance
% of Real Estate Loan Portfolio
Commercial ownerCommercial investorResidential ownerResidential investorLand acquisition
$ 281,293 184,676
19,464 45,759
151,311
41.21%27.06%
2.85%6.70%
22.18%
$ 236,086 155,460
21,021 37,326 77,373
44.78%29.48%
3.99%7.08%
14.67%
$ 204,474 149,166
19,425 26,398 55,402
44.95%32.80%
4.27%5.80%
12.18%
$ 682,503 100.00% $ 527,266 100.00% $ 454,865 100.00%
2005 2004 2003
Geographic Area Number of
Relationships % of Real Estate
Loan Portfolio Number of
Relationships % of Real Estate
Loan Portfolio Number of
Relationships % of Real Estate
Loan Portfolio
COLORADODenverBoulderEagleArapahoeJeffersonAdamsDouglasLarimerWeldAll others
139 146
92 114 120
68 36 12 12 46
11.40%10.29%
7.34%7.60%7.89%7.66%3.12%0.89%1.59%3.41%
137 144
74 114 117
50 37 15
9 37
13.26%11.42%10.99%10.43%10.19%
5.24%4.33%1.55%1.04%1.77%
145 123
58 126 106
43 39 15 10 44
15.57%10.64%
7.30%13.24%
9.79%4.70%3.46%1.46%0.96%4.99%
Subtotal ColoradoARIZONAMaricopaMojaveNavajoPimaAll others
785
295 7 9 7
35
61.19%
30.95%0.81%0.73%1.67%4.65%
734
210 6 6 4
25
70.22%
24.17%0.99%0.90%0.84%2.88%
709
168 6 5 5
100
72.11%
21.48%1.19%1.00%0.70%3.52%
Subtotal Arizona 353 38.81% 251 29.78% 284 27.89%
Total 1,138 100.00% 985 100.00% 993 100.00%
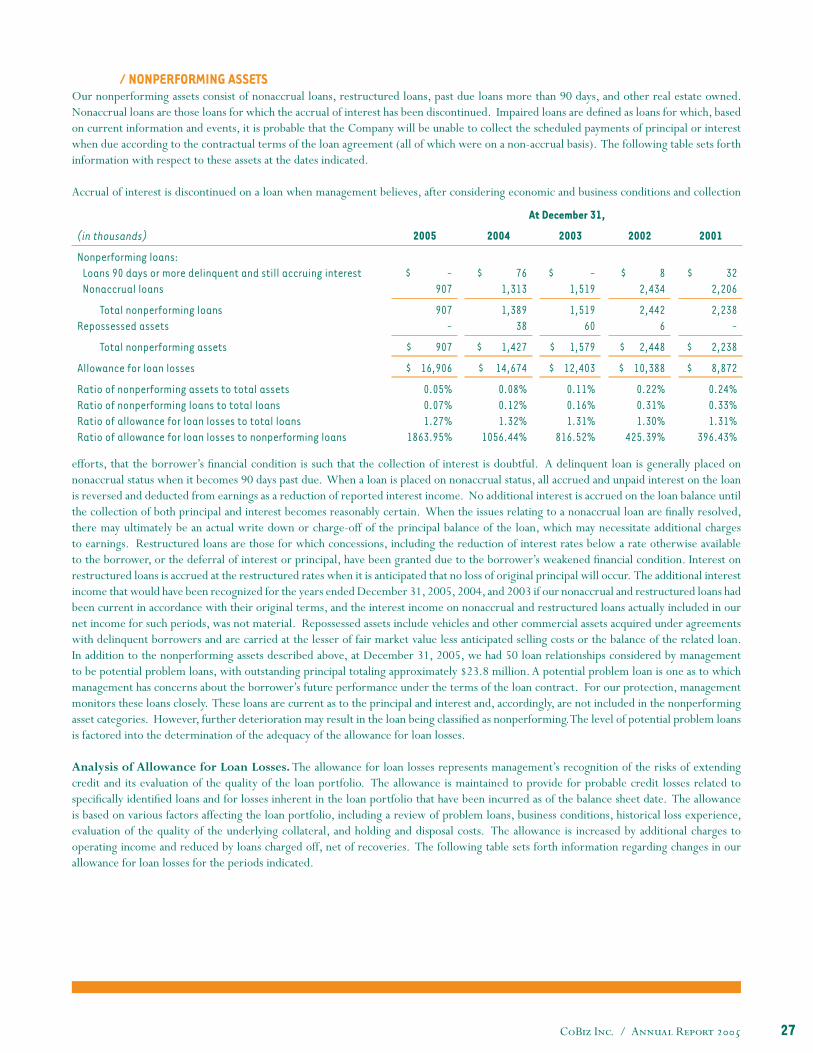
CoBiz Inc. / Annual Report 2005 27
/ NONPERFORMING ASSETSOur nonperforming assets consist of nonaccrual loans, restructured loans, past due loans more than 90 days, and other real estate owned. Nonaccrual loans are those loans for which the accrual of interest has been discontinued. Impaired loans are defi ned as loans for which, based on current information and events, it is probable that the Company will be unable to collect the scheduled payments of principal or interest when due according to the contractual terms of the loan agreement (all of which were on a non-accrual basis). The following table sets forth information with respect to these assets at the dates indicated.
Accrual of interest is discontinued on a loan when management believes, after considering economic and business conditions and collection
At December 31,
(in thousands) 2005 2004 2003 2002 2001
Nonperforming loans:Loans 90 days or more delinquent and still accruing interestNonaccrual loans
$ - 907
$ 76 1,313
$ - 1,519
$ 8 2,434
$ 32 2,206
Total nonperforming loansRepossessed assets
907 -
1,389 38
1,519 60
2,442 6
2,238 -
Total nonperforming assets $ 907 $ 1,427 $ 1,579 $ 2,448 $ 2,238
Allowance for loan losses $ 16,906 $ 14,674 $ 12,403 $ 10,388 $ 8,872
Ratio of nonperforming assets to total assetsRatio of nonperforming loans to total loansRatio of allowance for loan losses to total loansRatio of allowance for loan losses to nonperforming loans
0.05%0.07%1.27%
1863.95%
0.08%0.12%1.32%
1056.44%
0.11%0.16%1.31%
816.52%
0.22%0.31%1.30%
425.39%
0.24%0.33%1.31%
396.43%
efforts, that the borrower’s fi nancial condition is such that the collection of interest is doubtful. A delinquent loan is generally placed on nonaccrual status when it becomes 90 days past due. When a loan is placed on nonaccrual status, all accrued and unpaid interest on the loan is reversed and deducted from earnings as a reduction of reported interest income. No additional interest is accrued on the loan balance until the collection of both principal and interest becomes reasonably certain. When the issues relating to a nonaccrual loan are fi nally resolved, there may ultimately be an actual write down or charge-off of the principal balance of the loan, which may necessitate additional charges to earnings. Restructured loans are those for which concessions, including the reduction of interest rates below a rate otherwise available to the borrower, or the deferral of interest or principal, have been granted due to the borrower’s weakened fi nancial condition. Interest on restructured loans is accrued at the restructured rates when it is anticipated that no loss of original principal will occur. The additional interest income that would have been recognized for the years ended December 31, 2005, 2004, and 2003 if our nonaccrual and restructured loans had been current in accordance with their original terms, and the interest income on nonaccrual and restructured loans actually included in our net income for such periods, was not material. Repossessed assets include vehicles and other commercial assets acquired under agreements with delinquent borrowers and are carried at the lesser of fair market value less anticipated selling costs or the balance of the related loan. In addition to the nonperforming assets described above, at December 31, 2005, we had 50 loan relationships considered by management to be potential problem loans, with outstanding principal totaling approximately $23.8 million. A potential problem loan is one as to which management has concerns about the borrower’s future performance under the terms of the loan contract. For our protection, management monitors these loans closely. These loans are current as to the principal and interest and, accordingly, are not included in the nonperforming asset categories. However, further deterioration may result in the loan being classifi ed as nonperforming. The level of potential problem loans is factored into the determination of the adequacy of the allowance for loan losses.
Analysis of Allowance for Loan Losses. The allowance for loan losses represents management’s recognition of the risks of extending credit and its evaluation of the quality of the loan portfolio. The allowance is maintained to provide for probable credit losses related to specifi cally identifi ed loans and for losses inherent in the loan portfolio that have been incurred as of the balance sheet date. The allowance is based on various factors affecting the loan portfolio, including a review of problem loans, business conditions, historical loss experience, evaluation of the quality of the underlying collateral, and holding and disposal costs. The allowance is increased by additional charges to operating income and reduced by loans charged off, net of recoveries. The following table sets forth information regarding changes in our allowance for loan losses for the periods indicated.
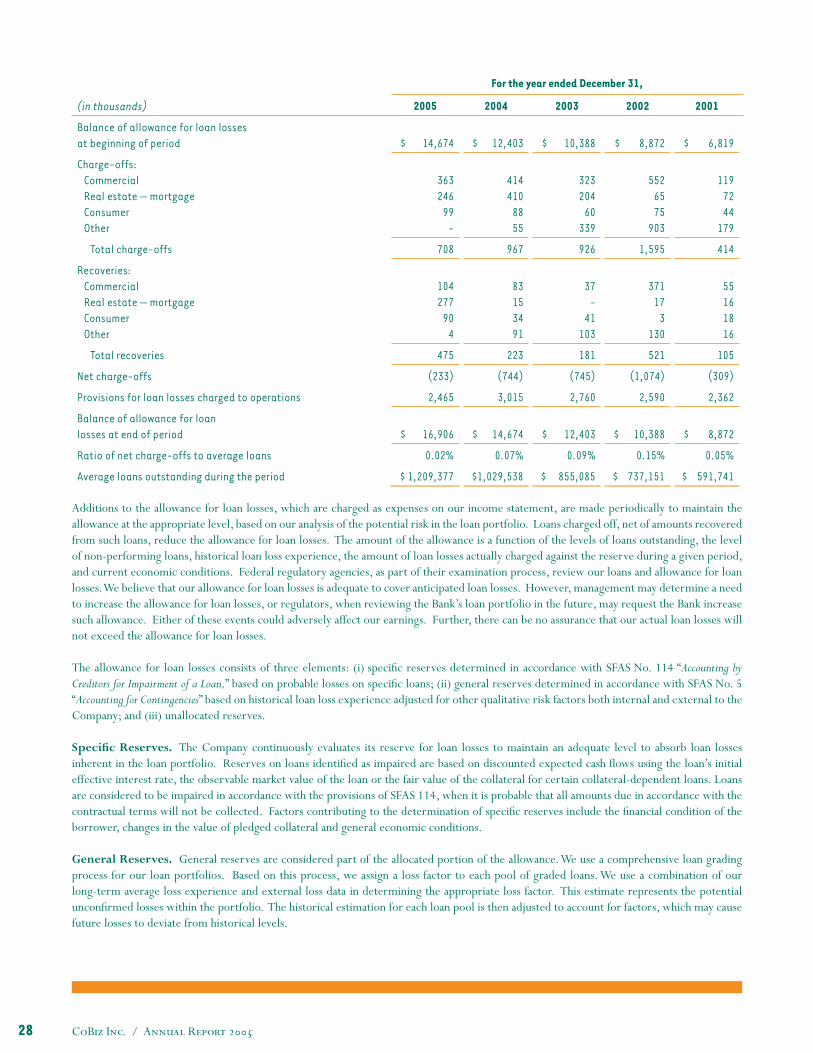
CoBiz Inc. / Annual Report 200528
Additions to the allowance for loan losses, which are charged as expenses on our income statement, are made periodically to maintain the allowance at the appropriate level, based on our analysis of the potential risk in the loan portfolio. Loans charged off, net of amounts recovered from such loans, reduce the allowance for loan losses. The amount of the allowance is a function of the levels of loans outstanding, the level of non-performing loans, historical loan loss experience, the amount of loan losses actually charged against the reserve during a given period, and current economic conditions. Federal regulatory agencies, as part of their examination process, review our loans and allowance for loan losses. We believe that our allowance for loan losses is adequate to cover anticipated loan losses. However, management may determine a need to increase the allowance for loan losses, or regulators, when reviewing the Bank’s loan portfolio in the future, may request the Bank increase such allowance. Either of these events could adversely affect our earnings. Further, there can be no assurance that our actual loan losses will not exceed the allowance for loan losses.
The allowance for loan losses consists of three elements: (i) specifi c reserves determined in accordance with SFAS No. 114 “Accounting by Creditors for Impairment of a Loan,” based on probable losses on specifi c loans; (ii) general reserves determined in accordance with SFAS No. 5 “Accounting for Contingencies” based on historical loan loss experience adjusted for other qualitative risk factors both internal and external to the Company; and (iii) unallocated reserves.
Specifi c Reserves. The Company continuously evaluates its reserve for loan losses to maintain an adequate level to absorb loan losses inherent in the loan portfolio. Reserves on loans identifi ed as impaired are based on discounted expected cash fl ows using the loan’s initial effective interest rate, the observable market value of the loan or the fair value of the collateral for certain collateral-dependent loans. Loans are considered to be impaired in accordance with the provisions of SFAS 114, when it is probable that all amounts due in accordance with the contractual terms will not be collected. Factors contributing to the determination of specifi c reserves include the fi nancial condition of the borrower, changes in the value of pledged collateral and general economic conditions.
General Reserves. General reserves are considered part of the allocated portion of the allowance. We use a comprehensive loan grading process for our loan portfolios. Based on this process, we assign a loss factor to each pool of graded loans. We use a combination of our long-term average loss experience and external loss data in determining the appropriate loss factor. This estimate represents the potential unconfi rmed losses within the portfolio. The historical estimation for each loan pool is then adjusted to account for factors, which may cause future losses to deviate from historical levels.
For the year ended December 31,
(in thousands) 2005 2004 2003 2002 2001
Balance of allowance for loan losses at beginning of period $ 14,674 $ 12,403 $ 10,388 $ 8,872 $ 6,819
Charge-offs:Commercial Real estate — mortgage ConsumerOther
363 246
99 -
414 410
88 55
323 204
60 339
552 65 75
903
119 72 44
179
Total charge-offs 708 967 926 1,595 414
Recoveries:CommercialReal estate — mortgage Consumer Other
104 277
90 4
83 15 34 91
37 -
41 103
371 17
3 130
55 16 18 16
Total recoveries 475 223 181 521 105
Net charge-offs (233) (744) (745) (1,074) (309)
Provisions for loan losses charged to operations 2,465 3,015 2,760 2,590 2,362
Balance of allowance for loan losses at end of period
$ 16,906 $ 14,674 $ 12,403 $ 10,388 $ 8,872
Ratio of net charge-offs to average loans 0.02% 0.07% 0.09% 0.15% 0.05%
Average loans outstanding during the period $ 1,209,377 $1,029,538 $ 855,085 $ 737,151 $ 591,741
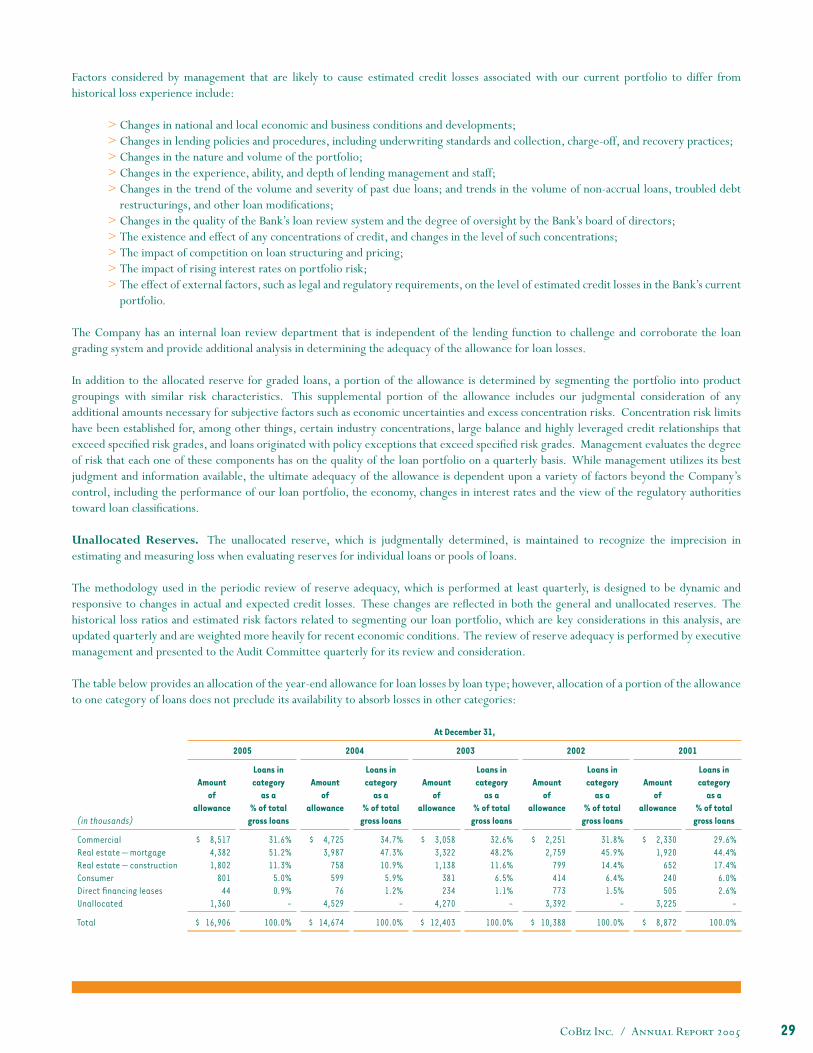
CoBiz Inc. / Annual Report 2005 29
Factors considered by management that are likely to cause estimated credit losses associated with our current portfolio to differ from historical loss experience include:
> Changes in national and local economic and business conditions and developments;> Changes in lending policies and procedures, including underwriting standards and collection, charge-off, and recovery practices;> Changes in the nature and volume of the portfolio;> Changes in the experience, ability, and depth of lending management and staff;> Changes in the trend of the volume and severity of past due loans; and trends in the volume of non-accrual loans, troubled debt restructurings, and other loan modifi cations;> Changes in the quality of the Bank’s loan review system and the degree of oversight by the Bank’s board of directors;> The existence and effect of any concentrations of credit, and changes in the level of such concentrations;> The impact of competition on loan structuring and pricing; > The impact of rising interest rates on portfolio risk;> The effect of external factors, such as legal and regulatory requirements, on the level of estimated credit losses in the Bank’s current portfolio.
The Company has an internal loan review department that is independent of the lending function to challenge and corroborate the loan grading system and provide additional analysis in determining the adequacy of the allowance for loan losses.
In addition to the allocated reserve for graded loans, a portion of the allowance is determined by segmenting the portfolio into product groupings with similar risk characteristics. This supplemental portion of the allowance includes our judgmental consideration of any additional amounts necessary for subjective factors such as economic uncertainties and excess concentration risks. Concentration risk limits have been established for, among other things, certain industry concentrations, large balance and highly leveraged credit relationships that exceed specifi ed risk grades, and loans originated with policy exceptions that exceed specifi ed risk grades. Management evaluates the degree of risk that each one of these components has on the quality of the loan portfolio on a quarterly basis. While management utilizes its best judgment and information available, the ultimate adequacy of the allowance is dependent upon a variety of factors beyond the Company’s control, including the performance of our loan portfolio, the economy, changes in interest rates and the view of the regulatory authorities toward loan classifi cations.
Unallocated Reserves. The unallocated reserve, which is judgmentally determined, is maintained to recognize the imprecision in estimating and measuring loss when evaluating reserves for individual loans or pools of loans. The methodology used in the periodic review of reserve adequacy, which is performed at least quarterly, is designed to be dynamic and responsive to changes in actual and expected credit losses. These changes are refl ected in both the general and unallocated reserves. The historical loss ratios and estimated risk factors related to segmenting our loan portfolio, which are key considerations in this analysis, are updated quarterly and are weighted more heavily for recent economic conditions. The review of reserve adequacy is performed by executive management and presented to the Audit Committee quarterly for its review and consideration.
The table below provides an allocation of the year-end allowance for loan losses by loan type; however, allocation of a portion of the allowance to one category of loans does not preclude its availability to absorb losses in other categories:
At December 31,
2005 2004 2003 2002 2001
(in thousands)
Amount of
allowance
Loans incategory
as a% of total
gross loans
Amount of
allowance
Loans incategory
as a% of total
gross loans
Amount of
allowance
Loans incategory
as a% of total
gross loans
Amount of
allowance
Loans incategory
as a% of total
gross loans
Amount of
allowance
Loans incategory
as a% of total
gross loans
CommercialReal estate — mortgageReal estate — construction Consumer Direct fi nancing leases Unallocated
$ 8,517 4,382 1,802
801 44
1,360
31.6%51.2%11.3%
5.0%0.9%
-
$ 4,725 3,987
758 599
76 4,529
34.7%47.3%10.9%
5.9%1.2%
-
$ 3,058 3,322 1,138
381 234
4,270
32.6%48.2%11.6%
6.5%1.1%
-
$ 2,251 2,759
799 414 773
3,392
31.8%45.9%14.4%
6.4%1.5%
-
$ 2,330 1,920
652 240 505
3,225
29.6%44.4%17.4%
6.0%2.6%
-
Total $ 16,906 100.0% $ 14,674 100.0% $ 12,403 100.0% $ 10,388 100.0% $ 8,872 100.0%
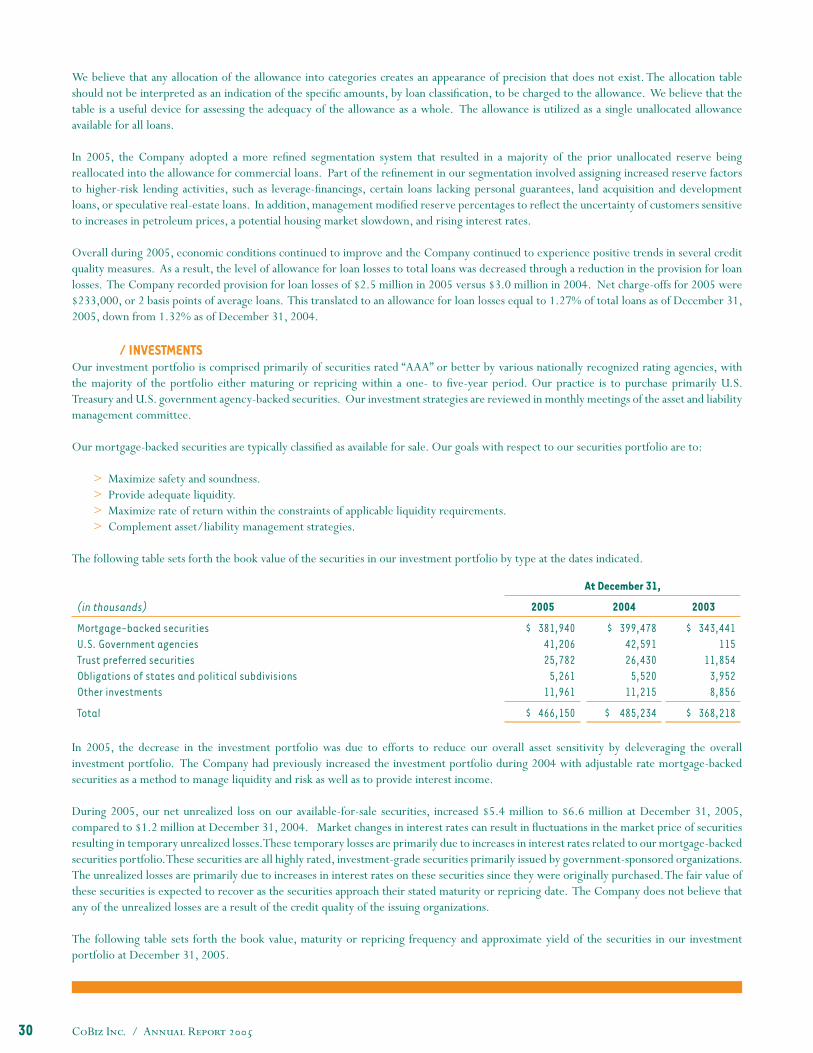
CoBiz Inc. / Annual Report 200530
We believe that any allocation of the allowance into categories creates an appearance of precision that does not exist. The allocation table should not be interpreted as an indication of the specifi c amounts, by loan classifi cation, to be charged to the allowance. We believe that the table is a useful device for assessing the adequacy of the allowance as a whole. The allowance is utilized as a single unallocated allowance available for all loans. In 2005, the Company adopted a more refi ned segmentation system that resulted in a majority of the prior unallocated reserve being reallocated into the allowance for commercial loans. Part of the refi nement in our segmentation involved assigning increased reserve factors to higher-risk lending activities, such as leverage-fi nancings, certain loans lacking personal guarantees, land acquisition and development loans, or speculative real-estate loans. In addition, management modifi ed reserve percentages to refl ect the uncertainty of customers sensitive to increases in petroleum prices, a potential housing market slowdown, and rising interest rates.
Overall during 2005, economic conditions continued to improve and the Company continued to experience positive trends in several credit quality measures. As a result, the level of allowance for loan losses to total loans was decreased through a reduction in the provision for loan losses. The Company recorded provision for loan losses of $2.5 million in 2005 versus $3.0 million in 2004. Net charge-offs for 2005 were $233,000, or 2 basis points of average loans. This translated to an allowance for loan losses equal to 1.27% of total loans as of December 31, 2005, down from 1.32% as of December 31, 2004.
/ INVESTMENTSOur investment portfolio is comprised primarily of securities rated “AAA” or better by various nationally recognized rating agencies, with the majority of the portfolio either maturing or repricing within a one- to fi ve-year period. Our practice is to purchase primarily U.S. Treasury and U.S. government agency-backed securities. Our investment strategies are reviewed in monthly meetings of the asset and liability management committee.
Our mortgage-backed securities are typically classifi ed as available for sale. Our goals with respect to our securities portfolio are to:
> Maximize safety and soundness.> Provide adequate liquidity.> Maximize rate of return within the constraints of applicable liquidity requirements.> Complement asset/liability management strategies.
The following table sets forth the book value of the securities in our investment portfolio by type at the dates indicated.
At December 31,
(in thousands) 2005 2004 2003
Mortgage-backed securities U.S. Government agenciesTrust preferred securitiesObligations of states and political subdivisionsOther investments
$ 381,940 41,206 25,782
5,261 11,961
$ 399,478 42,591 26,430
5,520 11,215
$ 343,441 115
11,854 3,952 8,856
Total $ 466,150 $ 485,234 $ 368,218
In 2005, the decrease in the investment portfolio was due to efforts to reduce our overall asset sensitivity by deleveraging the overall investment portfolio. The Company had previously increased the investment portfolio during 2004 with adjustable rate mortgage-backed securities as a method to manage liquidity and risk as well as to provide interest income.
During 2005, our net unrealized loss on our available-for-sale securities, increased $5.4 million to $6.6 million at December 31, 2005, compared to $1.2 million at December 31, 2004. Market changes in interest rates can result in fl uctuations in the market price of securities resulting in temporary unrealized losses. These temporary losses are primarily due to increases in interest rates related to our mortgage-backed securities portfolio. These securities are all highly rated, investment-grade securities primarily issued by government-sponsored organizations. The unrealized losses are primarily due to increases in interest rates on these securities since they were originally purchased. The fair value of these securities is expected to recover as the securities approach their stated maturity or repricing date. The Company does not believe that any of the unrealized losses are a result of the credit quality of the issuing organizations.
The following table sets forth the book value, maturity or repricing frequency and approximate yield of the securities in our investment portfolio at December 31, 2005.
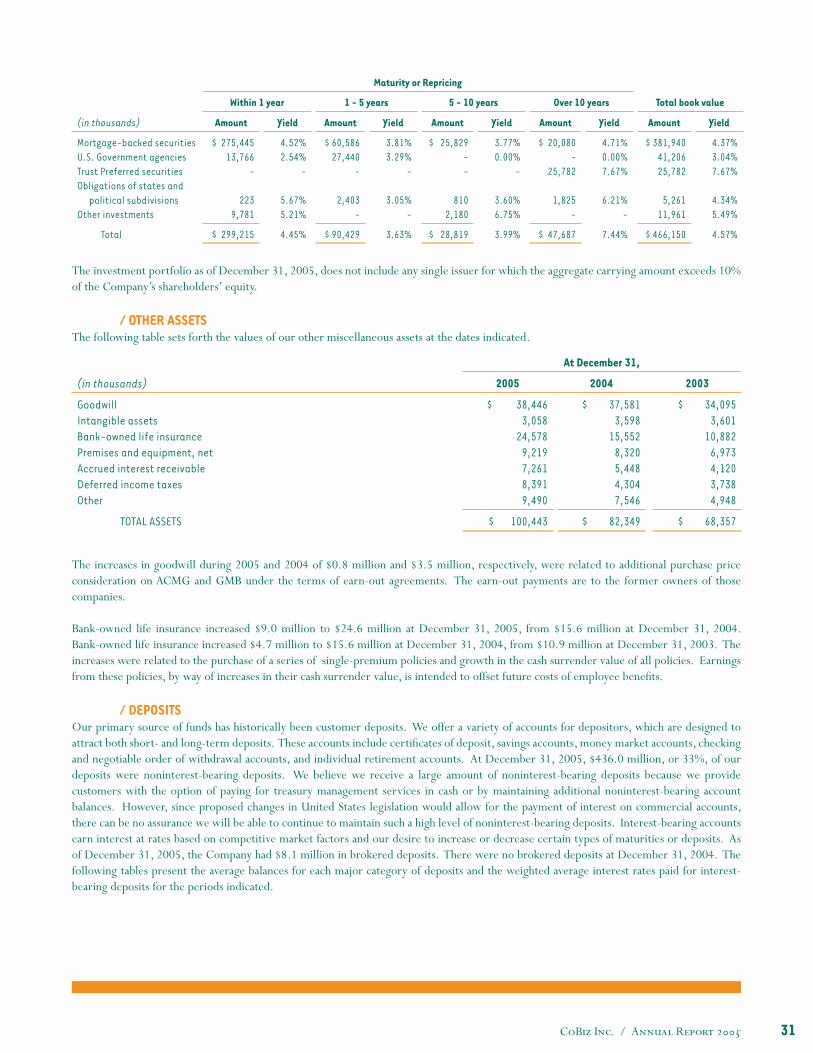
CoBiz Inc. / Annual Report 2005 31
The investment portfolio as of December 31, 2005, does not include any single issuer for which the aggregate carrying amount exceeds 10% of the Company’s shareholders’ equity.
/ OTHER ASSETSThe following table sets forth the values of our other miscellaneous assets at the dates indicated.
Maturity or Repricing
Within 1 year 1 - 5 years 5 - 10 years Over 10 years Total book value
(in thousands) Amount Yield Amount Yield Amount Yield Amount Yield Amount Yield
Mortgage-backed securitiesU.S. Government agenciesTrust Preferred securitiesObligations of states and
political subdivisionsOther investments
$ 275,445 13,766
-
223 9,781
4.52%2.54%
-
5.67%5.21%
$ 60,586 27,440
-
2,403 -
3.81%3.29%
-
3.05% -
$ 25,829 - -
810 2,180
3.77%0.00%
-
3.60%6.75%
$ 20,080 -
25,782
1,825 -
4.71%0.00%7.67%
6.21% -
$ 381,940 41,206 25,782
5,261
11,961
4.37%3.04%7.67%
4.34%5.49%
Total $ 299,215 4.45% $ 90,429 3.63% $ 28,819 3.99% $ 47,687 7.44% $ 466,150 4.57%
At December 31,
(in thousands) 2005 2004 2003
GoodwillIntangible assetsBank-owned life insurancePremises and equipment, netAccrued interest receivableDeferred income taxesOther
$ 38,446 3,058
24,578 9,219 7,261 8,391 9,490
$ 37,581 3,598
15,552 8,320 5,448 4,304 7,546
$ 34,095 3,601
10,882 6,973 4,120 3,738 4,948
TOTAL ASSETS $ 100,443 $ 82,349 $ 68,357
The increases in goodwill during 2005 and 2004 of $0.8 million and $3.5 million, respectively, were related to additional purchase price consideration on ACMG and GMB under the terms of earn-out agreements. The earn-out payments are to the former owners of those companies.
Bank-owned life insurance increased $9.0 million to $24.6 million at December 31, 2005, from $15.6 million at December 31, 2004. Bank-owned life insurance increased $4.7 million to $15.6 million at December 31, 2004, from $10.9 million at December 31, 2003. The increases were related to the purchase of a series of single-premium policies and growth in the cash surrender value of all policies. Earnings from these policies, by way of increases in their cash surrender value, is intended to offset future costs of employee benefi ts.
/ DEPOSITSOur primary source of funds has historically been customer deposits. We offer a variety of accounts for depositors, which are designed to attract both short- and long-term deposits. These accounts include certifi cates of deposit, savings accounts, money market accounts, checking and negotiable order of withdrawal accounts, and individual retirement accounts. At December 31, 2005, $436.0 million, or 33%, of our deposits were noninterest-bearing deposits. We believe we receive a large amount of noninterest-bearing deposits because we provide customers with the option of paying for treasury management services in cash or by maintaining additional noninterest-bearing account balances. However, since proposed changes in United States legislation would allow for the payment of interest on commercial accounts, there can be no assurance we will be able to continue to maintain such a high level of noninterest-bearing deposits. Interest-bearing accounts earn interest at rates based on competitive market factors and our desire to increase or decrease certain types of maturities or deposits. As of December 31, 2005, the Company had $8.1 million in brokered deposits. There were no brokered deposits at December 31, 2004. The following tables present the average balances for each major category of deposits and the weighted average interest rates paid for interest-bearing deposits for the periods indicated.
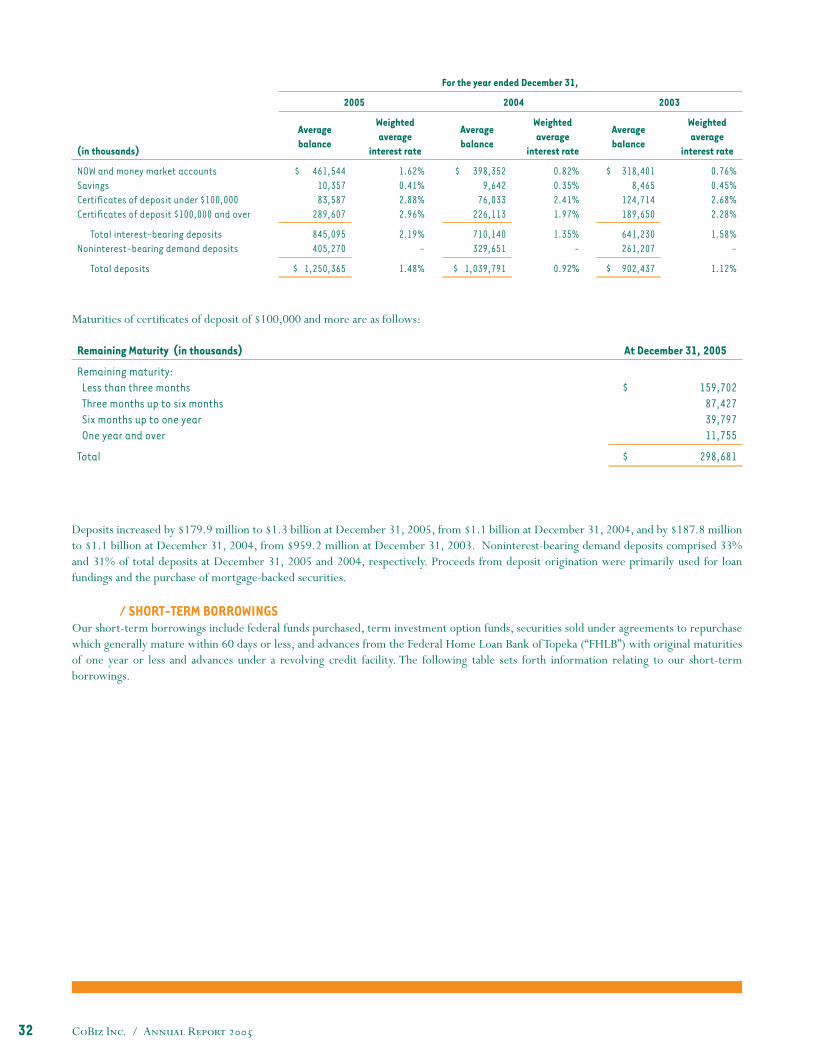
CoBiz Inc. / Annual Report 200532
Maturities of certifi cates of deposit of $100,000 and more are as follows:
Deposits increased by $179.9 million to $1.3 billion at December 31, 2005, from $1.1 billion at December 31, 2004, and by $187.8 million to $1.1 billion at December 31, 2004, from $959.2 million at December 31, 2003. Noninterest-bearing demand deposits comprised 33% and 31% of total deposits at December 31, 2005 and 2004, respectively. Proceeds from deposit origination were primarily used for loan fundings and the purchase of mortgage-backed securities.
/ SHORT-TERM BORROWINGSOur short-term borrowings include federal funds purchased, term investment option funds, securities sold under agreements to repurchase which generally mature within 60 days or less, and advances from the Federal Home Loan Bank of Topeka (“FHLB”) with original maturities of one year or less and advances under a revolving credit facility. The following table sets forth information relating to our short-term borrowings.
For the year ended December 31,
2005 2004 2003
(in thousands)
Averagebalance
Weightedaverage
interest rate
Averagebalance
Weightedaverage
interest rate
Averagebalance
Weightedaverage
interest rate
NOW and money market accounts Savings Certifi cates of deposit under $100,000 Certifi cates of deposit $100,000 and over
$ 461,544 10,357 83,587
289,607
1.62%0.41%2.88%2.96%
$ 398,352 9,642
76,033 226,113
0.82%0.35%2.41%1.97%
$ 318,401 8,465
124,714 189,650
0.76%0.45%2.68%2.28%
Total interest-bearing depositsNoninterest-bearing demand deposits
845,095 405,270
2.19% -
710,140 329,651
1.35% -
641,230 261,207
1.58% -
Total deposits $ 1,250,365 1.48% $ 1,039,791 0.92% $ 902,437 1.12%
Remaining Maturity (in thousands) At December 31, 2005
Remaining maturity: Less than three months Three months up to six months Six months up to one year One year and over
$ 159,702 87,427 39,797 11,755
Total $ 298,681
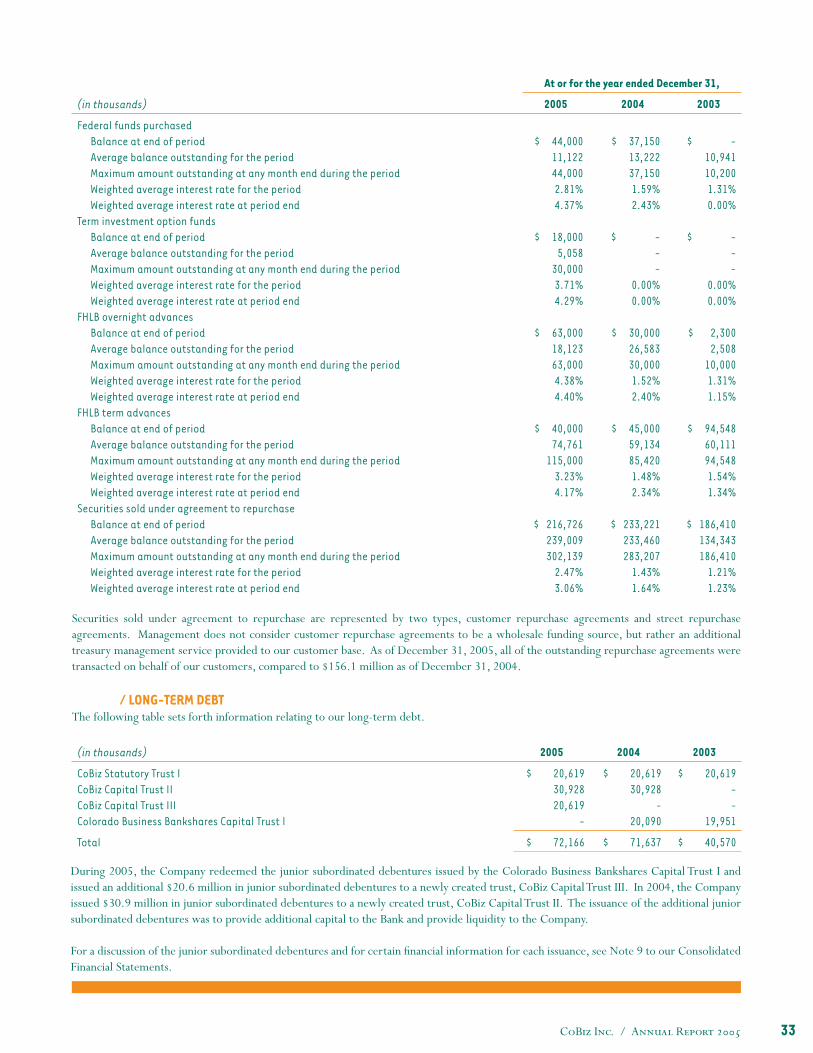
CoBiz Inc. / Annual Report 2005 33
Securities sold under agreement to repurchase are represented by two types, customer repurchase agreements and street repurchase agreements. Management does not consider customer repurchase agreements to be a wholesale funding source, but rather an additional treasury management service provided to our customer base. As of December 31, 2005, all of the outstanding repurchase agreements were transacted on behalf of our customers, compared to $156.1 million as of December 31, 2004.
/ LONG-TERM DEBTThe following table sets forth information relating to our long-term debt.
At or for the year ended December 31,
(in thousands) 2005 2004 2003
Federal funds purchasedBalance at end of periodAverage balance outstanding for the period Maximum amount outstanding at any month end during the period Weighted average interest rate for the periodWeighted average interest rate at period end
Term investment option fundsBalance at end of periodAverage balance outstanding for the period Maximum amount outstanding at any month end during the period Weighted average interest rate for the periodWeighted average interest rate at period end
FHLB overnight advancesBalance at end of periodAverage balance outstanding for the period Maximum amount outstanding at any month end during the period Weighted average interest rate for the periodWeighted average interest rate at period end
FHLB term advancesBalance at end of period Average balance outstanding for the periodMaximum amount outstanding at any month end during the period Weighted average interest rate for the periodWeighted average interest rate at period end
Securities sold under agreement to repurchaseBalance at end of periodAverage balance outstanding for the period Maximum amount outstanding at any month end during the period Weighted average interest rate for the periodWeighted average interest rate at period end
$ 44,000 11,122 44,000
2.81%4.37%
$ 18,000 5,058
30,000 3.71%4.29%
$ 63,000
18,123 63,000
4.38%4.40%
$ 40,000 74,761
115,000 3.23%4.17%
$ 216,726 239,009 302,139
2.47%3.06%
$ 37,150 13,222 37,150
1.59%2.43%
$ - - -
0.00%0.00%
$ 30,000 26,583 30,000
1.52%2.40%
$ 45,000 59,134 85,420 1.48%2.34%
$ 233,221 233,460 283,207
1.43%1.64%
$ - 10,941 10,200
1.31%0.00%
$ - - -
0.00%0.00%
$ 2,300 2,508
10,000 1.31%1.15%
$ 94,548 60,111 94,548
1.54%1.34%
$ 186,410 134,343 186,410
1.21%1.23%
(in thousands) 2005 2004 2003
CoBiz Statutory Trust ICoBiz Capital Trust IICoBiz Capital Trust IIIColorado Business Bankshares Capital Trust I
$ 20,619 30,928 20,619
-
$ 20,619 30,928
- 20,090
$ 20,619 - -
19,951
Total $ 72,166 $ 71,637 $ 40,570
During 2005, the Company redeemed the junior subordinated debentures issued by the Colorado Business Bankshares Capital Trust I and issued an additional $20.6 million in junior subordinated debentures to a newly created trust, CoBiz Capital Trust III. In 2004, the Company issued $30.9 million in junior subordinated debentures to a newly created trust, CoBiz Capital Trust II. The issuance of the additional junior subordinated debentures was to provide additional capital to the Bank and provide liquidity to the Company.
For a discussion of the junior subordinated debentures and for certain fi nancial information for each issuance, see Note 9 to our Consolidated Financial Statements.
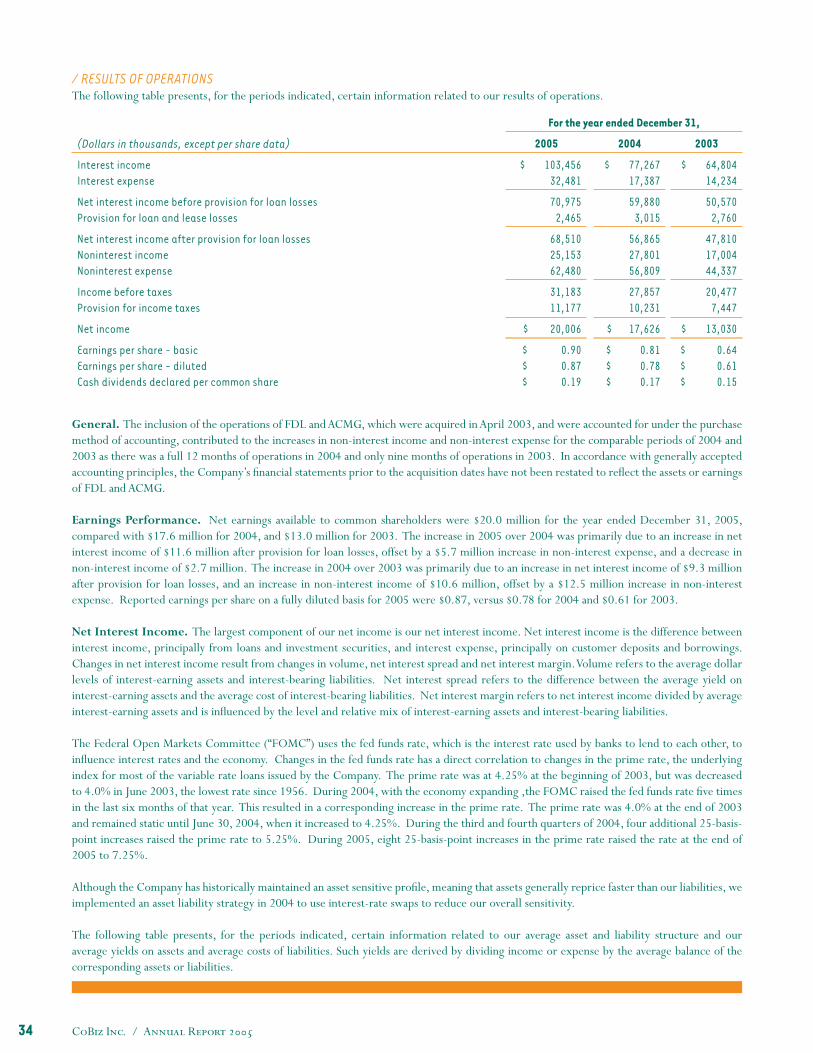
CoBiz Inc. / Annual Report 200534
For the year ended December 31,
(Dollars in thousands, except per share data) 2005 2004 2003
Interest incomeInterest expense
$ 103,456 32,481
$ 77,267 17,387
$ 64,804 14,234
Net interest income before provision for loan lossesProvision for loan and lease losses
70,975 2,465
59,880 3,015
50,570 2,760
Net interest income after provision for loan lossesNoninterest incomeNoninterest expense
68,510 25,153 62,480
56,865 27,801 56,809
47,810 17,004 44,337
Income before taxesProvision for income taxes
31,183 11,177
27,857 10,231
20,477 7,447
Net income $ 20,006 $ 17,626 $ 13,030
Earnings per share - basicEarnings per share - dilutedCash dividends declared per common share
$ 0.90 $ 0.87 $ 0.19
$ 0.81 $ 0.78 $ 0.17
$ 0.64 $ 0.61 $ 0.15
/ RESULTS OF OPERATIONSThe following table presents, for the periods indicated, certain information related to our results of operations.
General. The inclusion of the operations of FDL and ACMG, which were acquired in April 2003, and were accounted for under the purchase method of accounting, contributed to the increases in non-interest income and non-interest expense for the comparable periods of 2004 and 2003 as there was a full 12 months of operations in 2004 and only nine months of operations in 2003. In accordance with generally accepted accounting principles, the Company’s fi nancial statements prior to the acquisition dates have not been restated to refl ect the assets or earnings of FDL and ACMG.
Earnings Performance. Net earnings available to common shareholders were $20.0 million for the year ended December 31, 2005, compared with $17.6 million for 2004, and $13.0 million for 2003. The increase in 2005 over 2004 was primarily due to an increase in net interest income of $11.6 million after provision for loan losses, offset by a $5.7 million increase in non-interest expense, and a decrease in non-interest income of $2.7 million. The increase in 2004 over 2003 was primarily due to an increase in net interest income of $9.3 million after provision for loan losses, and an increase in non-interest income of $10.6 million, offset by a $12.5 million increase in non-interest expense. Reported earnings per share on a fully diluted basis for 2005 were $0.87, versus $0.78 for 2004 and $0.61 for 2003.
Net Interest Income. The largest component of our net income is our net interest income. Net interest income is the difference between interest income, principally from loans and investment securities, and interest expense, principally on customer deposits and borrowings. Changes in net interest income result from changes in volume, net interest spread and net interest margin. Volume refers to the average dollar levels of interest-earning assets and interest-bearing liabilities. Net interest spread refers to the difference between the average yield on interest-earning assets and the average cost of interest-bearing liabilities. Net interest margin refers to net interest income divided by average interest-earning assets and is infl uenced by the level and relative mix of interest-earning assets and interest-bearing liabilities.
The Federal Open Markets Committee (“FOMC”) uses the fed funds rate, which is the interest rate used by banks to lend to each other, to infl uence interest rates and the economy. Changes in the fed funds rate has a direct correlation to changes in the prime rate, the underlying index for most of the variable rate loans issued by the Company. The prime rate was at 4.25% at the beginning of 2003, but was decreased to 4.0% in June 2003, the lowest rate since 1956. During 2004, with the economy expanding ,the FOMC raised the fed funds rate fi ve times in the last six months of that year. This resulted in a corresponding increase in the prime rate. The prime rate was 4.0% at the end of 2003 and remained static until June 30, 2004, when it increased to 4.25%. During the third and fourth quarters of 2004, four additional 25-basis-point increases raised the prime rate to 5.25%. During 2005, eight 25-basis-point increases in the prime rate raised the rate at the end of 2005 to 7.25%.
Although the Company has historically maintained an asset sensitive profi le, meaning that assets generally reprice faster than our liabilities, we implemented an asset liability strategy in 2004 to use interest-rate swaps to reduce our overall sensitivity.
The following table presents, for the periods indicated, certain information related to our average asset and liability structure and our average yields on assets and average costs of liabilities. Such yields are derived by dividing income or expense by the average balance of the corresponding assets or liabilities.
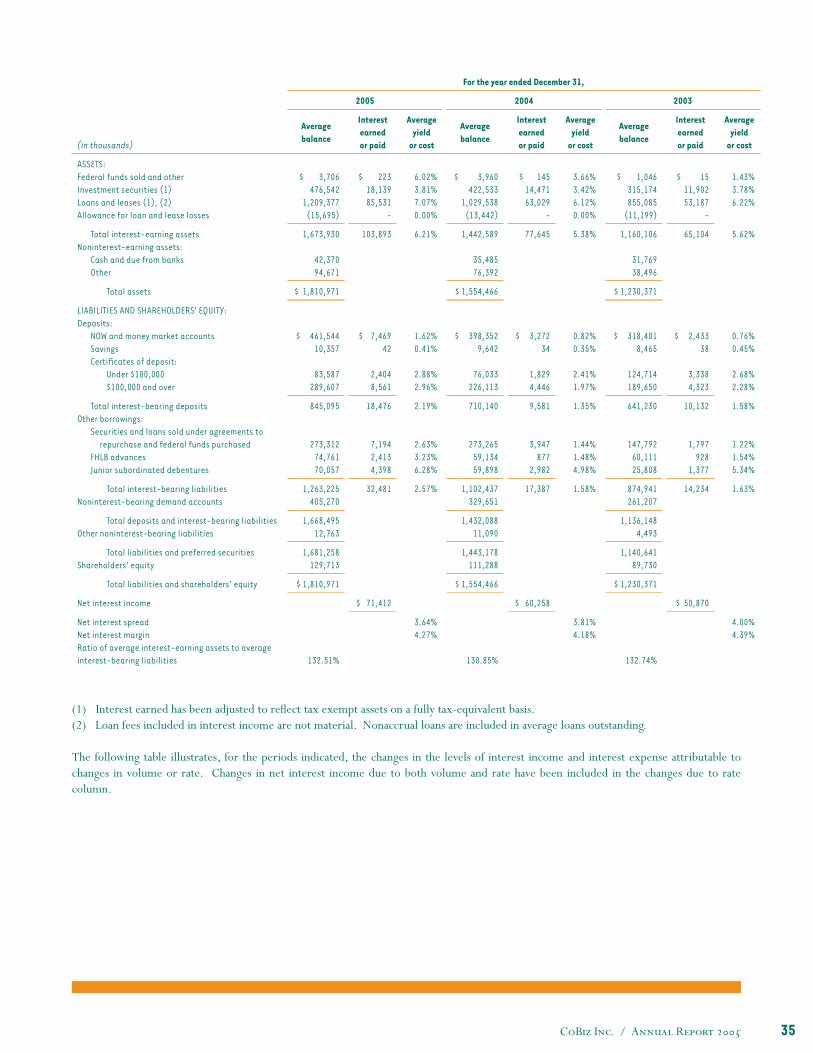
CoBiz Inc. / Annual Report 2005 35
(1) Interest earned has been adjusted to refl ect tax exempt assets on a fully tax-equivalent basis.(2) Loan fees included in interest income are not material. Nonaccrual loans are included in average loans outstanding.
The following table illustrates, for the periods indicated, the changes in the levels of interest income and interest expense attributable to changes in volume or rate. Changes in net interest income due to both volume and rate have been included in the changes due to rate column.
(in thousands)
For the year ended December 31,
2005 2004 2003
Averagebalance
Interestearnedor paid
Averageyield
or cost
Averagebalance
Interestearnedor paid
Averageyield
or cost
Averagebalance
Interestearnedor paid
Averageyield
or cost
ASSETS:Federal funds sold and otherInvestment securities (1)Loans and leases (1), (2)Allowance for loan and lease losses
$ 3,706 476,542
1,209,377 (15,695)
$ 223 18,139 85,531
-
6.02%3.81%7.07%0.00%
$ 3,960 422,533
1,029,538 (13,442)
$ 145 14,471 63,029
-
3.66%3.42%6.12%0.00%
$ 1,046 315,174 855,085
(11,199)
$ 15 11,902 53,187
-
1.43%3.78%6.22%
Total interest-earning assetsNoninterest-earning assets:
Cash and due from banksOther
1,673,930
42,370 94,671
103,893 6.21% 1,442,589
35,485 76,392
77,645 5.38% 1,160,106
31,769 38,496
65,104 5.62%
Total assets $ 1,810,971 $ 1,554,466 $ 1,230,371
LIABILITIES AND SHAREHOLDERS’ EQUITY:Deposits:
NOW and money market accountsSavingsCertifi cates of deposit:
Under $100,000$100,000 and over
$ 461,544 10,357
83,587 289,607
$ 7,469 42
2,404 8,561
1.62%0.41%
2.88%2.96%
$ 398,352 9,642
76,033 226,113
$ 3,272 34
1,829 4,446
0.82%0.35%
2.41%1.97%
$ 318,401 8,465
124,714 189,650
$ 2,433 38
3,338 4,323
0.76%0.45%
2.68%2.28%
Total interest-bearing depositsOther borrowings:
Securities and loans sold under agreements torepurchase and federal funds purchased
FHLB advancesJunior subordinated debentures
845,095
273,312 74,761 70,057
18,476
7,194 2,413 4,398
2.19%
2.63%3.23%6.28%
710,140
273,265 59,134 59,898
9,581
3,947 877
2,982
1.35%
1.44%1.48%4.98%
641,230
147,792 60,111 25,808
10,132
1,797 928
1,377
1.58%
1.22%1.54%5.34%
Total interest-bearing liabilitiesNoninterest-bearing demand accounts
1,263,225 405,270
32,481 2.57% 1,102,437 329,651
17,387 1.58% 874,941 261,207
14,234 1.63%
Total deposits and interest-bearing liabilitiesOther noninterest-bearing liabilities
1,668,495 12,763
1,432,088 11,090
1,136,148 4,493
Total liabilities and preferred securitiesShareholders’ equity
1,681,258 129,713
1,443,178 111,288
1,140,641 89,730
Total liabilities and shareholders’ equity $ 1,810,971 $ 1,554,466 $ 1,230,371
Net interest income $ 71,412 $ 60,258 $ 50,870
Net interest spreadNet interest marginRatio of average interest-earning assets to average interest-bearing liabilities 132.51%
3.64%4.27%
130.85%
3.81%4.18%
132.74%
4.00%4.39%
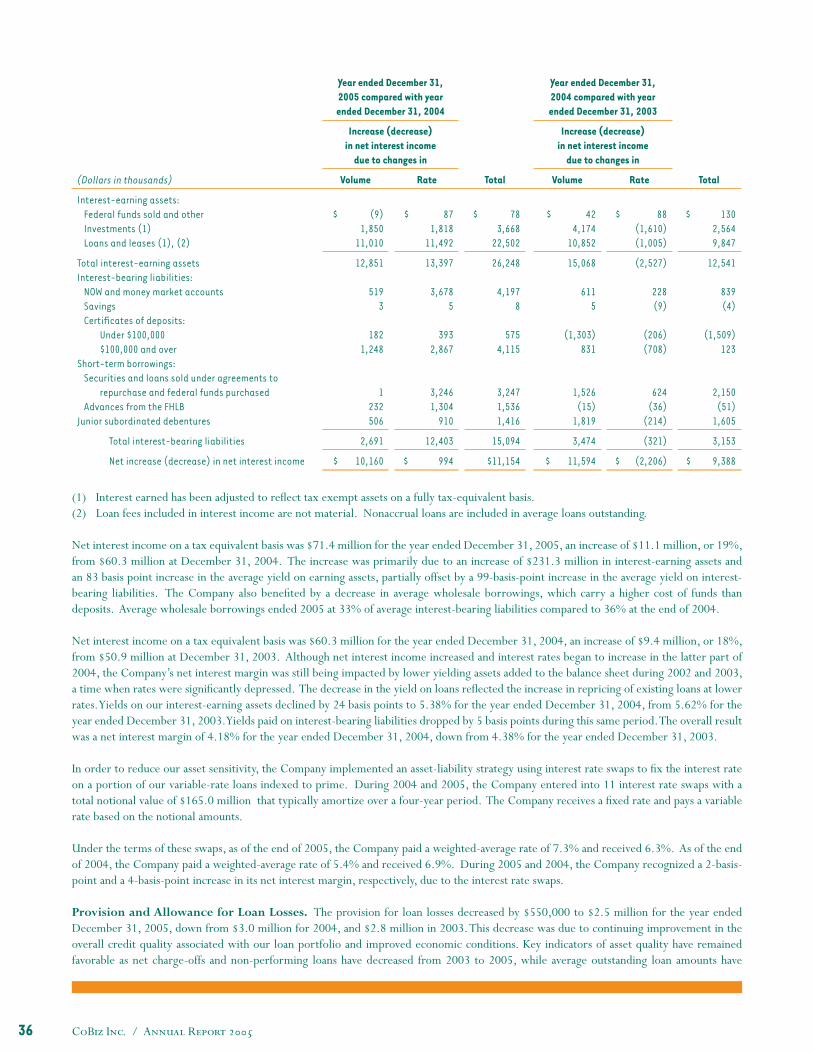
CoBiz Inc. / Annual Report 200536
(1) Interest earned has been adjusted to refl ect tax exempt assets on a fully tax-equivalent basis.(2) Loan fees included in interest income are not material. Nonaccrual loans are included in average loans outstanding.
Net interest income on a tax equivalent basis was $71.4 million for the year ended December 31, 2005, an increase of $11.1 million, or 19%, from $60.3 million at December 31, 2004. The increase was primarily due to an increase of $231.3 million in interest-earning assets and an 83 basis point increase in the average yield on earning assets, partially offset by a 99-basis-point increase in the average yield on interest-bearing liabilities. The Company also benefi ted by a decrease in average wholesale borrowings, which carry a higher cost of funds than deposits. Average wholesale borrowings ended 2005 at 33% of average interest-bearing liabilities compared to 36% at the end of 2004.
Net interest income on a tax equivalent basis was $60.3 million for the year ended December 31, 2004, an increase of $9.4 million, or 18%, from $50.9 million at December 31, 2003. Although net interest income increased and interest rates began to increase in the latter part of 2004, the Company’s net interest margin was still being impacted by lower yielding assets added to the balance sheet during 2002 and 2003, a time when rates were signifi cantly depressed. The decrease in the yield on loans refl ected the increase in repricing of existing loans at lower rates. Yields on our interest-earning assets declined by 24 basis points to 5.38% for the year ended December 31, 2004, from 5.62% for the year ended December 31, 2003. Yields paid on interest-bearing liabilities dropped by 5 basis points during this same period. The overall result was a net interest margin of 4.18% for the year ended December 31, 2004, down from 4.38% for the year ended December 31, 2003.
In order to reduce our asset sensitivity, the Company implemented an asset-liability strategy using interest rate swaps to fi x the interest rate on a portion of our variable-rate loans indexed to prime. During 2004 and 2005, the Company entered into 11 interest rate swaps with a total notional value of $165.0 million that typically amortize over a four-year period. The Company receives a fi xed rate and pays a variable rate based on the notional amounts.
Under the terms of these swaps, as of the end of 2005, the Company paid a weighted-average rate of 7.3% and received 6.3%. As of the end of 2004, the Company paid a weighted-average rate of 5.4% and received 6.9%. During 2005 and 2004, the Company recognized a 2-basis-point and a 4-basis-point increase in its net interest margin, respectively, due to the interest rate swaps.
Provision and Allowance for Loan Losses. The provision for loan losses decreased by $550,000 to $2.5 million for the year ended December 31, 2005, down from $3.0 million for 2004, and $2.8 million in 2003. This decrease was due to continuing improvement in the overall credit quality associated with our loan portfolio and improved economic conditions. Key indicators of asset quality have remained favorable as net charge-offs and non-performing loans have decreased from 2003 to 2005, while average outstanding loan amounts have
Year ended December 31,2005 compared with yearended December 31, 2004
Year ended December 31,2004 compared with yearended December 31, 2003
Increase (decrease)in net interest income
due to changes in
Increase (decrease)in net interest income
due to changes in
(Dollars in thousands) Volume Rate Total Volume Rate Total
Interest-earning assets:Federal funds sold and otherInvestments (1)Loans and leases (1), (2)
$ (9) 1,850
11,010
$ 87 1,818
11,492
$ 78 3,668
22,502
$ 42 4,174
10,852
$ 88 (1,610) (1,005)
$ 130 2,564 9,847
Total interest-earning assetsInterest-bearing liabilities:
NOW and money market accountsSavingsCertifi cates of deposits:
Under $100,000$100,000 and over
Short-term borrowings:Securities and loans sold under agreements to
repurchase and federal funds purchasedAdvances from the FHLB
Junior subordinated debentures
12,851
519 3
182 1,248
1 232 506
13,397
3,678 5
393 2,867
3,246 1,304
910
26,248
4,197 8
575 4,115
3,247 1,536 1,416
15,068
611 5
(1,303) 831
1,526 (15)
1,819
(2,527)
228 (9)
(206) (708)
624 (36)
(214)
12,541
839 (4)
(1,509) 123
2,150 (51)
1,605
Total interest-bearing liabilities 2,691 12,403 15,094 3,474 (321) 3,153
Net increase (decrease) in net interest income $ 10,160 $ 994 $11,154 $ 11,594 $ (2,206) $ 9,388
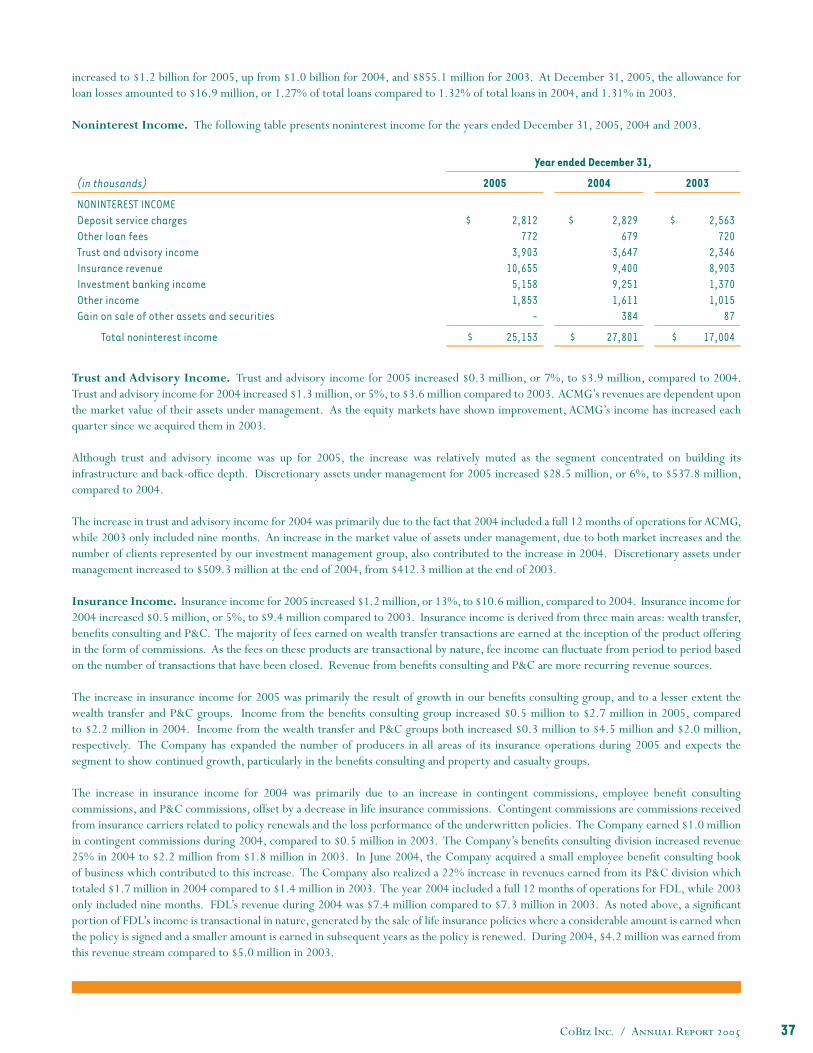
CoBiz Inc. / Annual Report 2005 37
increased to $1.2 billion for 2005, up from $1.0 billion for 2004, and $855.1 million for 2003. At December 31, 2005, the allowance for loan losses amounted to $16.9 million, or 1.27% of total loans compared to 1.32% of total loans in 2004, and 1.31% in 2003.
Noninterest Income. The following table presents noninterest income for the years ended December 31, 2005, 2004 and 2003.
Year ended December 31,
(in thousands) 2005 2004 2003
NONINTEREST INCOMEDeposit service chargesOther loan feesTrust and advisory incomeInsurance revenueInvestment banking incomeOther incomeGain on sale of other assets and securities
$ 2,812 772
3,903 10,655
5,158 1,853
-
$ 2,829 679
3,647 9,400 9,251 1,611
384
$ 2,563 720
2,346 8,903 1,370 1,015
87
Total noninterest income $ 25,153 $ 27,801 $ 17,004
Trust and Advisory Income. Trust and advisory income for 2005 increased $0.3 million, or 7%, to $3.9 million, compared to 2004. Trust and advisory income for 2004 increased $1.3 million, or 5%, to $3.6 million compared to 2003. ACMG’s revenues are dependent upon the market value of their assets under management. As the equity markets have shown improvement, ACMG’s income has increased each quarter since we acquired them in 2003.
Although trust and advisory income was up for 2005, the increase was relatively muted as the segment concentrated on building its infrastructure and back-offi ce depth. Discretionary assets under management for 2005 increased $28.5 million, or 6%, to $537.8 million, compared to 2004.
The increase in trust and advisory income for 2004 was primarily due to the fact that 2004 included a full 12 months of operations for ACMG, while 2003 only included nine months. An increase in the market value of assets under management, due to both market increases and the number of clients represented by our investment management group, also contributed to the increase in 2004. Discretionary assets under management increased to $509.3 million at the end of 2004, from $412.3 million at the end of 2003.
Insurance Income. Insurance income for 2005 increased $1.2 million, or 13%, to $10.6 million, compared to 2004. Insurance income for 2004 increased $0.5 million, or 5%, to $9.4 million compared to 2003. Insurance income is derived from three main areas: wealth transfer, benefi ts consulting and P&C. The majority of fees earned on wealth transfer transactions are earned at the inception of the product offering in the form of commissions. As the fees on these products are transactional by nature, fee income can fl uctuate from period to period based on the number of transactions that have been closed. Revenue from benefi ts consulting and P&C are more recurring revenue sources.
The increase in insurance income for 2005 was primarily the result of growth in our benefi ts consulting group, and to a lesser extent the wealth transfer and P&C groups. Income from the benefi ts consulting group increased $0.5 million to $2.7 million in 2005, compared to $2.2 million in 2004. Income from the wealth transfer and P&C groups both increased $0.3 million to $4.5 million and $2.0 million, respectively. The Company has expanded the number of producers in all areas of its insurance operations during 2005 and expects the segment to show continued growth, particularly in the benefi ts consulting and property and casualty groups.
The increase in insurance income for 2004 was primarily due to an increase in contingent commissions, employee benefi t consulting commissions, and P&C commissions, offset by a decrease in life insurance commissions. Contingent commissions are commissions received from insurance carriers related to policy renewals and the loss performance of the underwritten policies. The Company earned $1.0 million in contingent commissions during 2004, compared to $0.5 million in 2003. The Company’s benefi ts consulting division increased revenue 25% in 2004 to $2.2 million from $1.8 million in 2003. In June 2004, the Company acquired a small employee benefi t consulting book of business which contributed to this increase. The Company also realized a 22% increase in revenues earned from its P&C division which totaled $1.7 million in 2004 compared to $1.4 million in 2003. The year 2004 included a full 12 months of operations for FDL, while 2003 only included nine months. FDL’s revenue during 2004 was $7.4 million compared to $7.3 million in 2003. As noted above, a signifi cant portion of FDL’s income is transactional in nature, generated by the sale of life insurance policies where a considerable amount is earned when the policy is signed and a smaller amount is earned in subsequent years as the policy is renewed. During 2004, $4.2 million was earned from this revenue stream compared to $5.0 million in 2003.
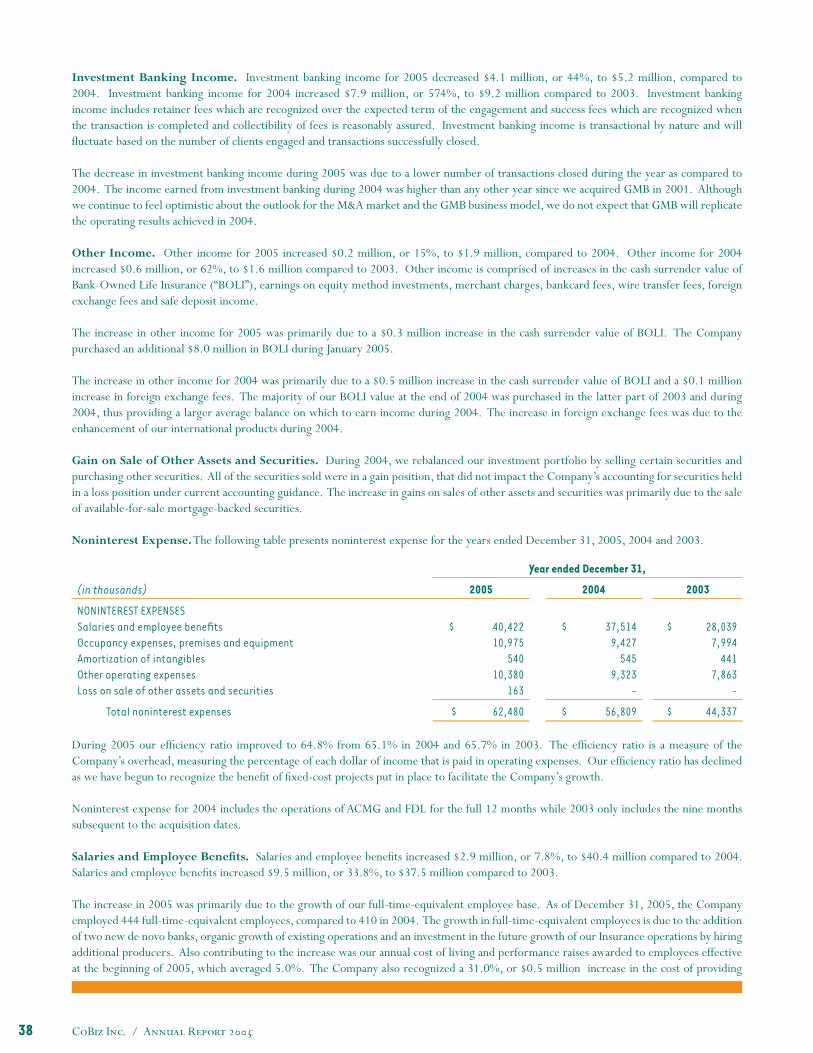
CoBiz Inc. / Annual Report 200538
Investment Banking Income. Investment banking income for 2005 decreased $4.1 million, or 44%, to $5.2 million, compared to 2004. Investment banking income for 2004 increased $7.9 million, or 574%, to $9.2 million compared to 2003. Investment banking income includes retainer fees which are recognized over the expected term of the engagement and success fees which are recognized when the transaction is completed and collectibility of fees is reasonably assured. Investment banking income is transactional by nature and will fl uctuate based on the number of clients engaged and transactions successfully closed.
The decrease in investment banking income during 2005 was due to a lower number of transactions closed during the year as compared to 2004. The income earned from investment banking during 2004 was higher than any other year since we acquired GMB in 2001. Although we continue to feel optimistic about the outlook for the M&A market and the GMB business model, we do not expect that GMB will replicate the operating results achieved in 2004.
Other Income. Other income for 2005 increased $0.2 million, or 15%, to $1.9 million, compared to 2004. Other income for 2004 increased $0.6 million, or 62%, to $1.6 million compared to 2003. Other income is comprised of increases in the cash surrender value of Bank-Owned Life Insurance (“BOLI”), earnings on equity method investments, merchant charges, bankcard fees, wire transfer fees, foreign exchange fees and safe deposit income.
The increase in other income for 2005 was primarily due to a $0.3 million increase in the cash surrender value of BOLI. The Company purchased an additional $8.0 million in BOLI during January 2005.
The increase in other income for 2004 was primarily due to a $0.5 million increase in the cash surrender value of BOLI and a $0.1 million increase in foreign exchange fees. The majority of our BOLI value at the end of 2004 was purchased in the latter part of 2003 and during 2004, thus providing a larger average balance on which to earn income during 2004. The increase in foreign exchange fees was due to the enhancement of our international products during 2004.
Gain on Sale of Other Assets and Securities. During 2004, we rebalanced our investment portfolio by selling certain securities and purchasing other securities. All of the securities sold were in a gain position, that did not impact the Company’s accounting for securities held in a loss position under current accounting guidance. The increase in gains on sales of other assets and securities was primarily due to the sale of available-for-sale mortgage-backed securities.
Noninterest Expense. The following table presents noninterest expense for the years ended December 31, 2005, 2004 and 2003.
Year ended December 31,
(in thousands) 2005 2004 2003
NONINTEREST EXPENSESSalaries and employee benefi tsOccupancy expenses, premises and equipmentAmortization of intangiblesOther operating expensesLoss on sale of other assets and securities
$ 40,422 10,975
540 10,380
163
$ 37,514 9,427
545 9,323
-
$ 28,039 7,994
441 7,863
-
Total noninterest expenses $ 62,480 $ 56,809 $ 44,337
During 2005 our effi ciency ratio improved to 64.8% from 65.1% in 2004 and 65.7% in 2003. The effi ciency ratio is a measure of the Company’s overhead, measuring the percentage of each dollar of income that is paid in operating expenses. Our effi ciency ratio has declined as we have begun to recognize the benefi t of fi xed-cost projects put in place to facilitate the Company’s growth.
Noninterest expense for 2004 includes the operations of ACMG and FDL for the full 12 months while 2003 only includes the nine months subsequent to the acquisition dates.
Salaries and Employee Benefi ts. Salaries and employee benefi ts increased $2.9 million, or 7.8%, to $40.4 million compared to 2004. Salaries and employee benefi ts increased $9.5 million, or 33.8%, to $37.5 million compared to 2003.
The increase in 2005 was primarily due to the growth of our full-time-equivalent employee base. As of December 31, 2005, the Company employed 444 full-time-equivalent employees, compared to 410 in 2004. The growth in full-time-equivalent employees is due to the addition of two new de novo banks, organic growth of existing operations and an investment in the future growth of our Insurance operations by hiring additional producers. Also contributing to the increase was our annual cost of living and performance raises awarded to employees effective at the beginning of 2005, which averaged 5.0%. The Company also recognized a 31.0%, or $0.5 million increase in the cost of providing
CoBiz Inc. / Annual Report 2005 39
medical insurance, as medical costs for all industries have continued to rise rapidly. The increase in normal wages was offset by a $2.0 million decrease in bonus compensation, due to the decrease in revenue from investment banking.
The increase in 2004 was due to higher staffi ng levels to accommodate the growth of the franchise, annual merit increases, and increases in health insurance and other benefi t costs. There was also a substantial increase in the bonuses paid from our investment banking subsidiary to match the increase in their operating results. In recognition of our operating results, the Board of Directors approved an additional bonus to all of our employees during 2004 that was not paid in 2003. The Company also introduced a supplemental employee retirement plan for certain key executives during 2004.
Occupancy Costs. Occupancy costs increased $1.5 million, or 16.4%, to $11.0 million compared to 2004. Occupancy costs increased $1.4 million, or 17.9%, to $9.4 million compared to 2003.
The increase in occupancy costs in 2005 was primarily the result of depreciation expense ($0.7 million), rent expense ($0.4 million), and utilities ($0.2 million). Occupancy costs have increased due to the additions of one Colorado and three Arizona bank locations subsequent to the fourth quarter of 2004, as well as the addition of a new operations center. Beginning in the fourth quarter of 2004, the Company began centralizing its information technology and operational areas in a new leased location. The move was fi nalized in the fi rst quarter of 2005 to the new location that includes 24,000 square feet of offi ce and data center space. This move, as well as our new de novos, has increased rent, depreciation and maintenance expense.
The increase in 2004 was due to the aforementioned acquisitions of FDL and ACMG, the additions of the Northwest and Camelback locations during 2004, and the inclusion of the Tempe and Northeast bank locations for their fi rst full year. An ongoing commitment to providing the highest level of technological service to our customers also increased our depreciation and maintenance expense.
Other Operating Expenses. Other operating expenses increased $1.1 million, or 11.3%, to $10.4 million compared to 2004. In 2004, other operating expenses increased $1.5 million, or 18.6%, to $9.3 million compared to 2003.
The increase in 2005 was primarily due to professional services ($0.4 million), marketing ($0.3 million), and operational losses ($0.2 million). Professional services increased primarily due to third-party referral fees paid on investment banking transactions. Marketing has increased as the Company increases its community donations as operating results improve, and as a result of our growth initiatives as we attempt to increase our loan and deposit bases and grow our fee-based business lines. The operational losses relate primarily to deposit fraud losses incurred by our bank franchise and a loss associated with the termination of an interest-rate hedge.
The increase in 2004 was primarily in the areas of marketing, correspondent bank and federal reserve charges, OCC assessments, and miscellaneous operational losses. Our correspondent bank and federal reserve charges increased as we grew and serviced high-volume customers, which increased our correspondent and federal reserve activity. Professional services increased as we implemented and explored new IT initiatives, and an increase in external accountant and consulting fees, which was partly due to the implementation of the provisions of the Sarbanes-Oxley Act of 2002. Our operational losses are generally lower than industry average, but in 2004 we recognized a loss related to a bank robbery for which we recognized a loss equal $0.2 million.
Federal Income Taxes. The provision for income taxes totaled $11.2 million during 2005, compared to $10.2 million in 2004, and $7.4 million in 2003. The effective tax rates for 2005, 2004 and 2003 were 35.8%, 36.7% and 36.4%, respectively.
/ LIQUIDITY AND CAPITAL RESOURCESOur liquidity management objective is to ensure our ability to satisfy the cash fl ow requirements of depositors and borrowers, and to allow us to sustain our operations. Historically, our primary source of funds has been customer deposits. Scheduled loan repayments are a relatively stable source of funds, while deposit infl ows and unscheduled loan prepayments – which are infl uenced by fl uctuations in the general level of interest rates, returns available on other investments, competition, economic conditions, and other factors – are less predictable. In addition, the Company has commitments to extend credit under lines of credit and stand-by letters of credit. The Company has also committed to investing in certain partnerships. See Note 15 to our Consolidated Financial Statements for additional discussion on these commitments. Borrowings may be used on a short-term basis to compensate for reductions in other sources of funds (such as deposit infl ows at less than projected levels). Borrowings may also be used on a longer-term basis to support expanded lending activities and to match the maturity or repricing intervals of assets. The Company is required under federal banking regulations to maintain suffi cient reserves to fund deposit withdrawals, loan commitments and expenses. We monitor our cash position on a daily basis in order to meet these requirements.
We use various forms of short-term borrowings for cash management and liquidity purposes on a limited basis. These forms of borrowings include federal funds purchased, securities sold under agreements to repurchase, the State of Colorado Treasury’s Time Deposit program
CoBiz Inc. / Annual Report 200540
and borrowings from the FHLB. The Bank has approved federal funds purchase lines with seven other banks with an aggregate credit line of $162.0 million as well as credit lines of $145.0 million with three fi rms to transact repurchase agreements. In addition, the Bank may apply for up to $53.2 million of State of Colorado time deposits. The Bank also has a line of credit from the FHLB that is limited by the amount of eligible collateral available to secure the borrowings. Borrowings under the FHLB line are required to be secured by unpledged securities and qualifying loans. At December 31, 2005, we had $170.8 million in unpledged securities and qualifying loans available to collateralize FHLB borrowings and securities sold under agreements to repurchase. During the second quarter of 2005, we began participating in the U.S. Treasury’s Term Investment Option (“TIO”) program for Treasury Tax and Loan participants. The TIO program allows us to obtain additional short-term funds at a rate determined through an auction process that is limited by the amount of eligible collateral available to secure it.
At the holding company level, our primary source of funds are dividends paid from the Bank and our fee-based business lines, management fees assessed to the Bank and the fee-based business lines, proceeds from the issuance of common stock, and other capital markets activity. The main use of this liquidity is the quarterly payment of dividends on our common stock, quarterly interest payments on the junior subordinated debentures, payments for merger and acquisition activity (including potential earn-out payments), and payments for the salaries and benefi ts for the employees of the holding company. The approval of the Offi ce of the Comptroller of the Currency is required prior to the declaration of any dividend by the Bank if the total of all dividends declared by the Bank in any calendar year exceeds the total of its net profi ts for that year combined with the retained net profi ts for the preceding two years. In addition, the Federal Deposit Insurance Corporation Improvement Act of 1991 provides that the Bank cannot pay a dividend if it will cause the Bank to be “undercapitalized.” The Company’s ability to pay dividends on its common stock depends upon the availability of dividends from the Bank and earnings from its fee-based businesses, as well as the Company’s compliance with the capital adequacy guidelines of the FRB. See Item 1 “Business – Supervision and Regulation” and Note 16 to our Consolidated Financial Statements for an analysis of the compliance of the Bank and CoBiz with applicable capital adequacy guidelines.
Maintaining adequate capital levels is integral to providing stability to the Company, resources to achieve the Company’s growth objectives, and returns to the shareholders in the form of dividends. In addition, as described above in “Business – Supervision and Regulation,” federal regulations establish minimum requirements for the capital adequacy of the Company and the Bank. We continually monitor existing and alternative fi nancing sources to support our capital and liquidity needs, including but not limited to, debt issuance, common stock issuance and deposit funding sources. Based on our current fi nancial condition and our results of operations, we believe that the Company will be able to raise adequate capital through one of these fi nancing sources, as needed.
The Company has issued a total of $70.0 million of trust preferred securities through statutory trusts that are not included in the Company’s consolidated fi nancial statements. Although the accounts of the trusts are not included in the Company’s consolidated fi nancial statements, $47.0 million of the $70.0 million in trust preferred securities issued by the trusts are included in Tier 1 capital for regulatory capital purposes as allowed by the Federal Reserve Board. On February 28, 2005, the Federal Reserve Board fi nalized a rule that would continue to allow the inclusion of trust preferred securities issued by unconsolidated subsidiary trusts in Tier 1 capital, but with stricter quantitative and qualitative standards. Under the rule, after a transition period ending on March 31, 2009, the aggregate amount of trust preferred securities and certain other capital elements would be limited to 25% of Tier 1 capital elements, net of goodwill that has been reduced by any associated deferred tax liability. The amount of trust preferred securities and certain other elements in excess of the limit could be included in Tier 2 capital, subject to restrictions. Based on the fi nal rule, the Company’s allowable trust preferred securities in Tier 1 capital would decrease to $30.0 million if it had been in effect at December 31, 2005. The additional amount excluded from Tier 1 capital would be included in Tier 2 capital and the Company would still be “Well Capitalized” under prompt corrective action provisions.
On November 2, 2005, the Company fi led a universal shelf registration that allows the Company to issue any combination of debt securities, preferred stock, depositary shares, common stock and securities warrants from time to time in one or more offerings up to a total dollar amount of $100.0 million. While the Company has no present intention to issue securities under the registration statement, the Company will be able to issue these securities in response to market conditions and the Company’s capital needs.
/ COMPARISON FOR THE YEARS ENDED DECEMBER 31, 2005 AND 2004Net cash provided by operating activities totaled $24.1 million and $25.1 million for the years ended December 31, 2005 and 2004, respectively. Net cash provided by operating activities is comprised of the Company’s net income, adjusted for non-cash charges and changes in operating assets and liabilities. Our cash uses for operations continue to grow as we deploy our de novo strategy and grow our fee-based business lines.
Net cash used in investing activities totaled $219.8 million and $305.7 million for the years ended December 31, 2005 and 2004, respectively. The decrease in cash used in investing activities is primarily related to a decrease in net additions to the investment portfolio, primarily mortgage-backed securities ($127.4 million) that the Company uses to manage liquidity and interest-rate risk as the company deleverages our investment portfolio; and a decrease in cash paid for acquisitions due to the earn-out payments related to ACMG and FDL ($7.7 million). These decreases were offset by increases in the net loan originations and repayments ($46.6 million) due to the growth of the Company, and
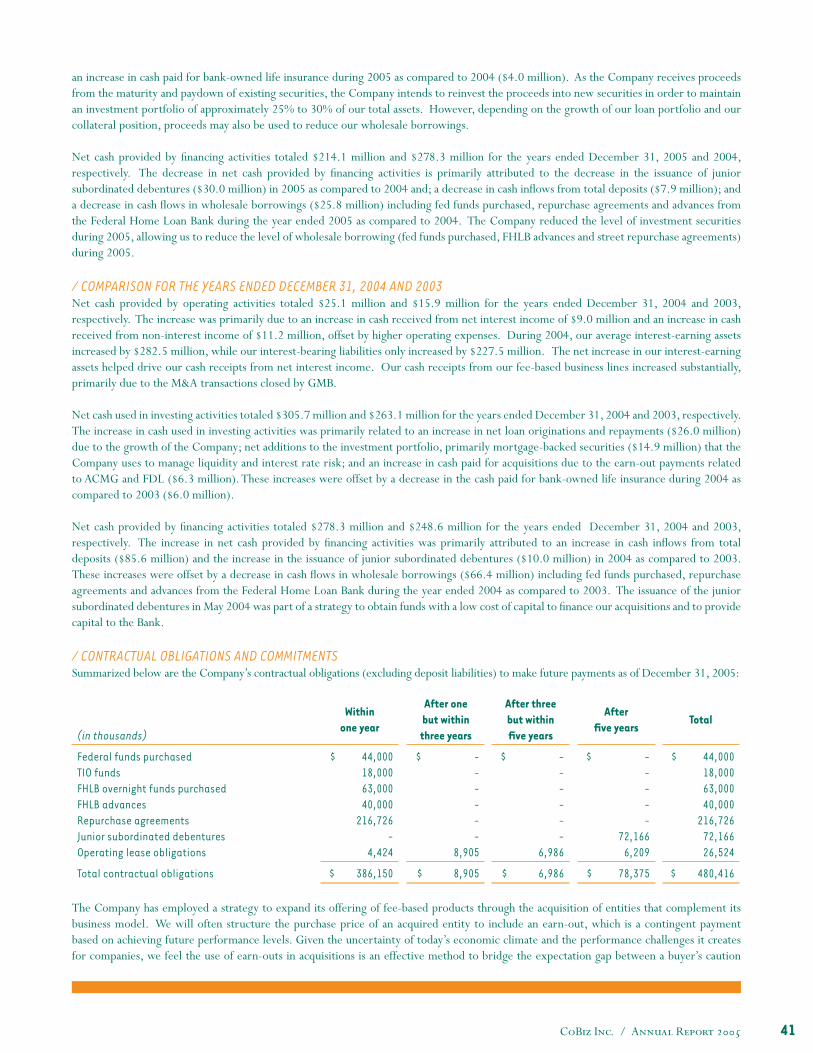
CoBiz Inc. / Annual Report 2005 41
an increase in cash paid for bank-owned life insurance during 2005 as compared to 2004 ($4.0 million). As the Company receives proceeds from the maturity and paydown of existing securities, the Company intends to reinvest the proceeds into new securities in order to maintain an investment portfolio of approximately 25% to 30% of our total assets. However, depending on the growth of our loan portfolio and our collateral position, proceeds may also be used to reduce our wholesale borrowings.
Net cash provided by fi nancing activities totaled $214.1 million and $278.3 million for the years ended December 31, 2005 and 2004, respectively. The decrease in net cash provided by fi nancing activities is primarily attributed to the decrease in the issuance of junior subordinated debentures ($30.0 million) in 2005 as compared to 2004 and; a decrease in cash infl ows from total deposits ($7.9 million); and a decrease in cash fl ows in wholesale borrowings ($25.8 million) including fed funds purchased, repurchase agreements and advances from the Federal Home Loan Bank during the year ended 2005 as compared to 2004. The Company reduced the level of investment securities during 2005, allowing us to reduce the level of wholesale borrowing (fed funds purchased, FHLB advances and street repurchase agreements) during 2005.
/ COMPARISON FOR THE YEARS ENDED DECEMBER 31, 2004 AND 2003Net cash provided by operating activities totaled $25.1 million and $15.9 million for the years ended December 31, 2004 and 2003, respectively. The increase was primarily due to an increase in cash received from net interest income of $9.0 million and an increase in cash received from non-interest income of $11.2 million, offset by higher operating expenses. During 2004, our average interest-earning assets increased by $282.5 million, while our interest-bearing liabilities only increased by $227.5 million. The net increase in our interest-earning assets helped drive our cash receipts from net interest income. Our cash receipts from our fee-based business lines increased substantially, primarily due to the M&A transactions closed by GMB.
Net cash used in investing activities totaled $305.7 million and $263.1 million for the years ended December 31, 2004 and 2003, respectively. The increase in cash used in investing activities was primarily related to an increase in net loan originations and repayments ($26.0 million) due to the growth of the Company; net additions to the investment portfolio, primarily mortgage-backed securities ($14.9 million) that the Company uses to manage liquidity and interest rate risk; and an increase in cash paid for acquisitions due to the earn-out payments related to ACMG and FDL ($6.3 million). These increases were offset by a decrease in the cash paid for bank-owned life insurance during 2004 as compared to 2003 ($6.0 million).
Net cash provided by fi nancing activities totaled $278.3 million and $248.6 million for the years ended December 31, 2004 and 2003, respectively. The increase in net cash provided by fi nancing activities was primarily attributed to an increase in cash infl ows from total deposits ($85.6 million) and the increase in the issuance of junior subordinated debentures ($10.0 million) in 2004 as compared to 2003. These increases were offset by a decrease in cash fl ows in wholesale borrowings ($66.4 million) including fed funds purchased, repurchase agreements and advances from the Federal Home Loan Bank during the year ended 2004 as compared to 2003. The issuance of the junior subordinated debentures in May 2004 was part of a strategy to obtain funds with a low cost of capital to fi nance our acquisitions and to provide capital to the Bank.
/ CONTRACTUAL OBLIGATIONS AND COMMITMENTSSummarized below are the Company’s contractual obligations (excluding deposit liabilities) to make future payments as of December 31, 2005:
(in thousands)
Withinone year
After onebut withinthree years
After threebut withinfi ve years
Afterfi ve years
Total
Federal funds purchasedTIO fundsFHLB overnight funds purchasedFHLB advancesRepurchase agreementsJunior subordinated debenturesOperating lease obligations
$ 44,000 18,000 63,000 40,000
216,726 -
4,424
$ - - - - - -
8,905
$ - - - - - -
6,986
$ - - - - -
72,166 6,209
$ 44,000 18,000 63,000 40,000
216,726 72,166 26,524
Total contractual obligations $ 386,150 $ 8,905 $ 6,986 $ 78,375 $ 480,416
The Company has employed a strategy to expand its offering of fee-based products through the acquisition of entities that complement its business model. We will often structure the purchase price of an acquired entity to include an earn-out, which is a contingent payment based on achieving future performance levels. Given the uncertainty of today’s economic climate and the performance challenges it creates for companies, we feel the use of earn-outs in acquisitions is an effective method to bridge the expectation gap between a buyer’s caution
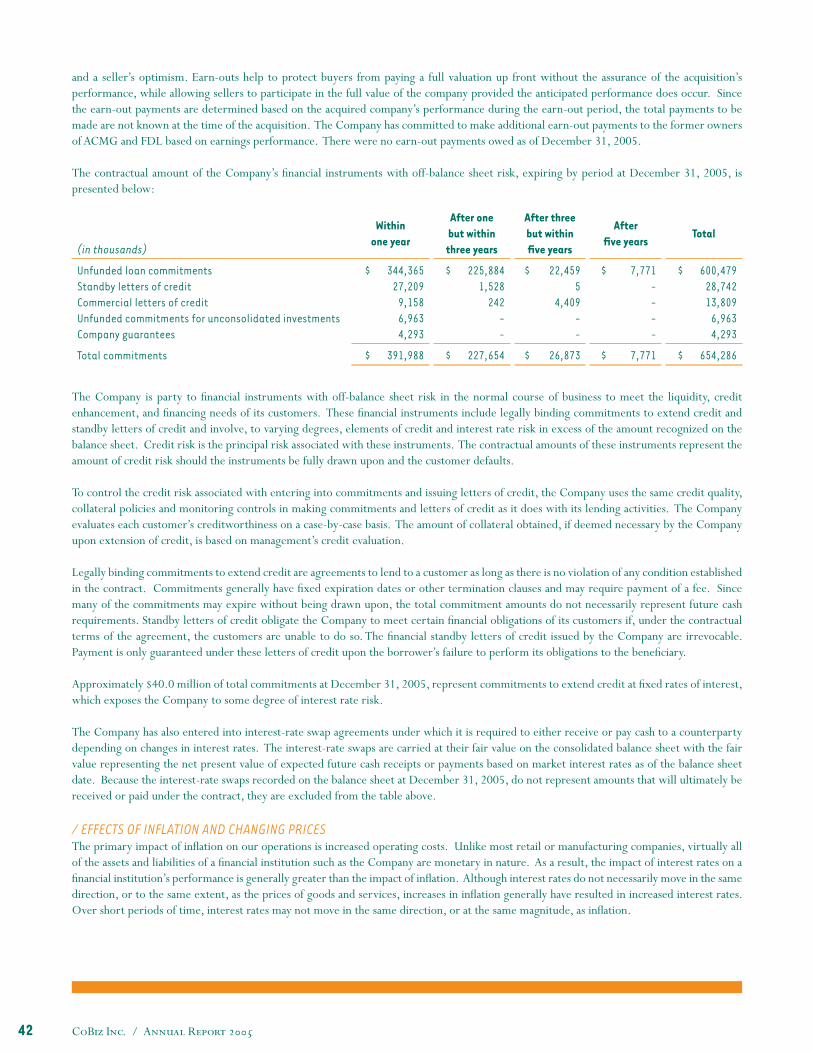
CoBiz Inc. / Annual Report 200542
and a seller’s optimism. Earn-outs help to protect buyers from paying a full valuation up front without the assurance of the acquisition’s performance, while allowing sellers to participate in the full value of the company provided the anticipated performance does occur. Since the earn-out payments are determined based on the acquired company’s performance during the earn-out period, the total payments to be made are not known at the time of the acquisition. The Company has committed to make additional earn-out payments to the former owners of ACMG and FDL based on earnings performance. There were no earn-out payments owed as of December 31, 2005.
The contractual amount of the Company’s fi nancial instruments with off-balance sheet risk, expiring by period at December 31, 2005, is presented below:
(in thousands)
Withinone year
After onebut withinthree years
After threebut withinfi ve years
Afterfi ve years
Total
Unfunded loan commitmentsStandby letters of creditCommercial letters of creditUnfunded commitments for unconsolidated investmentsCompany guarantees
$ 344,365 27,209
9,158 6,963 4,293
$ 225,884 1,528
242 - -
$ 22,459 5
4,409 - -
$ 7,771 - - - -
$ 600,479 28,742 13,809
6,963 4,293
Total commitments $ 391,988 $ 227,654 $ 26,873 $ 7,771 $ 654,286
The Company is party to fi nancial instruments with off-balance sheet risk in the normal course of business to meet the liquidity, credit enhancement, and fi nancing needs of its customers. These fi nancial instruments include legally binding commitments to extend credit and standby letters of credit and involve, to varying degrees, elements of credit and interest rate risk in excess of the amount recognized on the balance sheet. Credit risk is the principal risk associated with these instruments. The contractual amounts of these instruments represent the amount of credit risk should the instruments be fully drawn upon and the customer defaults.
To control the credit risk associated with entering into commitments and issuing letters of credit, the Company uses the same credit quality, collateral policies and monitoring controls in making commitments and letters of credit as it does with its lending activities. The Company evaluates each customer’s creditworthiness on a case-by-case basis. The amount of collateral obtained, if deemed necessary by the Company upon extension of credit, is based on management’s credit evaluation.
Legally binding commitments to extend credit are agreements to lend to a customer as long as there is no violation of any condition established in the contract. Commitments generally have fi xed expiration dates or other termination clauses and may require payment of a fee. Since many of the commitments may expire without being drawn upon, the total commitment amounts do not necessarily represent future cash requirements. Standby letters of credit obligate the Company to meet certain fi nancial obligations of its customers if, under the contractual terms of the agreement, the customers are unable to do so. The fi nancial standby letters of credit issued by the Company are irrevocable. Payment is only guaranteed under these letters of credit upon the borrower’s failure to perform its obligations to the benefi ciary.
Approximately $40.0 million of total commitments at December 31, 2005, represent commitments to extend credit at fi xed rates of interest, which exposes the Company to some degree of interest rate risk.
The Company has also entered into interest-rate swap agreements under which it is required to either receive or pay cash to a counterparty depending on changes in interest rates. The interest-rate swaps are carried at their fair value on the consolidated balance sheet with the fair value representing the net present value of expected future cash receipts or payments based on market interest rates as of the balance sheet date. Because the interest-rate swaps recorded on the balance sheet at December 31, 2005, do not represent amounts that will ultimately be received or paid under the contract, they are excluded from the table above.
/ EFFECTS OF INFLATION AND CHANGING PRICESThe primary impact of infl ation on our operations is increased operating costs. Unlike most retail or manufacturing companies, virtually all of the assets and liabilities of a fi nancial institution such as the Company are monetary in nature. As a result, the impact of interest rates on a fi nancial institution’s performance is generally greater than the impact of infl ation. Although interest rates do not necessarily move in the same direction, or to the same extent, as the prices of goods and services, increases in infl ation generally have resulted in increased interest rates. Over short periods of time, interest rates may not move in the same direction, or at the same magnitude, as infl ation.
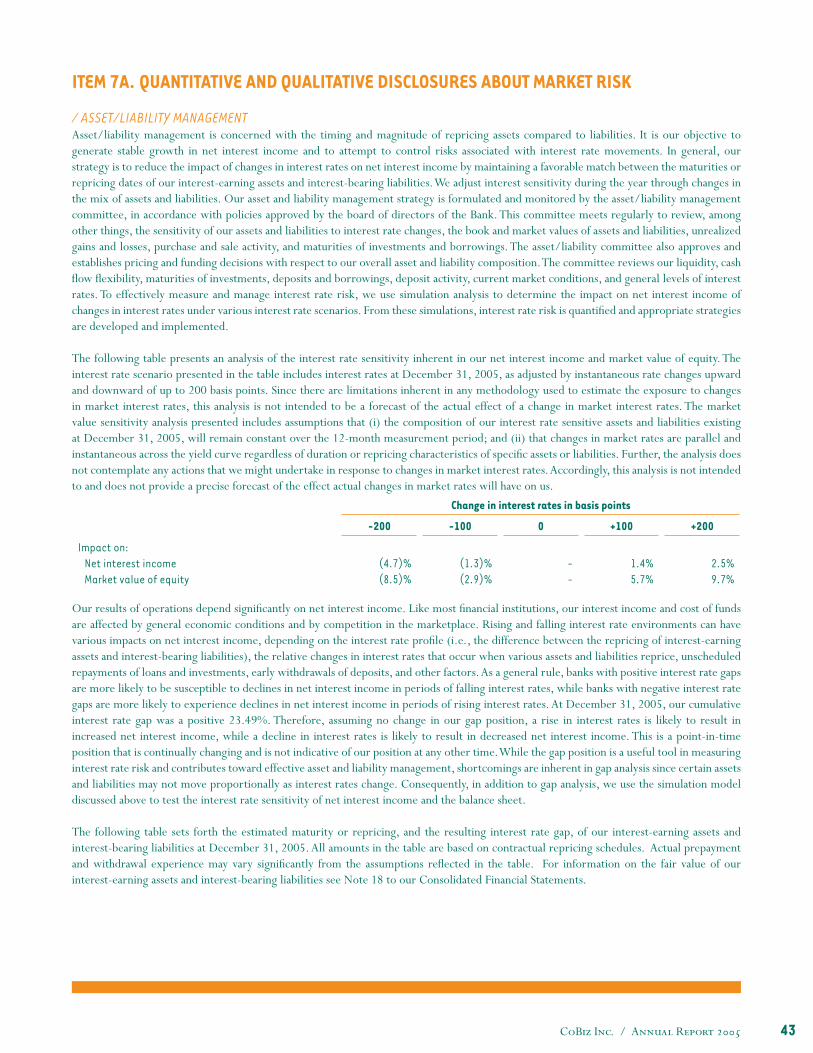
CoBiz Inc. / Annual Report 2005 43
ITEM 7A. QUANTITATIVE AND QUALITATIVE DISCLOSURES ABOUT MARKET RISK
/ ASSET/LIABILITY MANAGEMENTAsset/liability management is concerned with the timing and magnitude of repricing assets compared to liabilities. It is our objective to generate stable growth in net interest income and to attempt to control risks associated with interest rate movements. In general, our strategy is to reduce the impact of changes in interest rates on net interest income by maintaining a favorable match between the maturities or repricing dates of our interest-earning assets and interest-bearing liabilities. We adjust interest sensitivity during the year through changes in the mix of assets and liabilities. Our asset and liability management strategy is formulated and monitored by the asset/liability management committee, in accordance with policies approved by the board of directors of the Bank. This committee meets regularly to review, among other things, the sensitivity of our assets and liabilities to interest rate changes, the book and market values of assets and liabilities, unrealized gains and losses, purchase and sale activity, and maturities of investments and borrowings. The asset/liability committee also approves and establishes pricing and funding decisions with respect to our overall asset and liability composition. The committee reviews our liquidity, cash fl ow fl exibility, maturities of investments, deposits and borrowings, deposit activity, current market conditions, and general levels of interest rates. To effectively measure and manage interest rate risk, we use simulation analysis to determine the impact on net interest income of changes in interest rates under various interest rate scenarios. From these simulations, interest rate risk is quantifi ed and appropriate strategies are developed and implemented.
The following table presents an analysis of the interest rate sensitivity inherent in our net interest income and market value of equity. The interest rate scenario presented in the table includes interest rates at December 31, 2005, as adjusted by instantaneous rate changes upward and downward of up to 200 basis points. Since there are limitations inherent in any methodology used to estimate the exposure to changes in market interest rates, this analysis is not intended to be a forecast of the actual effect of a change in market interest rates. The market value sensitivity analysis presented includes assumptions that (i) the composition of our interest rate sensitive assets and liabilities existing at December 31, 2005, will remain constant over the 12-month measurement period; and (ii) that changes in market rates are parallel and instantaneous across the yield curve regardless of duration or repricing characteristics of specifi c assets or liabilities. Further, the analysis does not contemplate any actions that we might undertake in response to changes in market interest rates. Accordingly, this analysis is not intended to and does not provide a precise forecast of the effect actual changes in market rates will have on us.
Change in interest rates in basis points
-200 -100 0 +100 +200
Impact on:Net interest incomeMarket value of equity
(4.7)%(8.5)%
(1.3)%(2.9)%
- -
1.4%5.7%
2.5%9.7%
Our results of operations depend signifi cantly on net interest income. Like most fi nancial institutions, our interest income and cost of funds are affected by general economic conditions and by competition in the marketplace. Rising and falling interest rate environments can have various impacts on net interest income, depending on the interest rate profi le (i.e., the difference between the repricing of interest-earning assets and interest-bearing liabilities), the relative changes in interest rates that occur when various assets and liabilities reprice, unscheduled repayments of loans and investments, early withdrawals of deposits, and other factors. As a general rule, banks with positive interest rate gaps are more likely to be susceptible to declines in net interest income in periods of falling interest rates, while banks with negative interest rate gaps are more likely to experience declines in net interest income in periods of rising interest rates. At December 31, 2005, our cumulative interest rate gap was a positive 23.49%. Therefore, assuming no change in our gap position, a rise in interest rates is likely to result in increased net interest income, while a decline in interest rates is likely to result in decreased net interest income. This is a point-in-time position that is continually changing and is not indicative of our position at any other time. While the gap position is a useful tool in measuring interest rate risk and contributes toward effective asset and liability management, shortcomings are inherent in gap analysis since certain assets and liabilities may not move proportionally as interest rates change. Consequently, in addition to gap analysis, we use the simulation model discussed above to test the interest rate sensitivity of net interest income and the balance sheet.
The following table sets forth the estimated maturity or repricing, and the resulting interest rate gap, of our interest-earning assets and interest-bearing liabilities at December 31, 2005. All amounts in the table are based on contractual repricing schedules. Actual prepayment and withdrawal experience may vary signifi cantly from the assumptions refl ected in the table. For information on the fair value of our interest-earning assets and interest-bearing liabilities see Note 18 to our Consolidated Financial Statements.
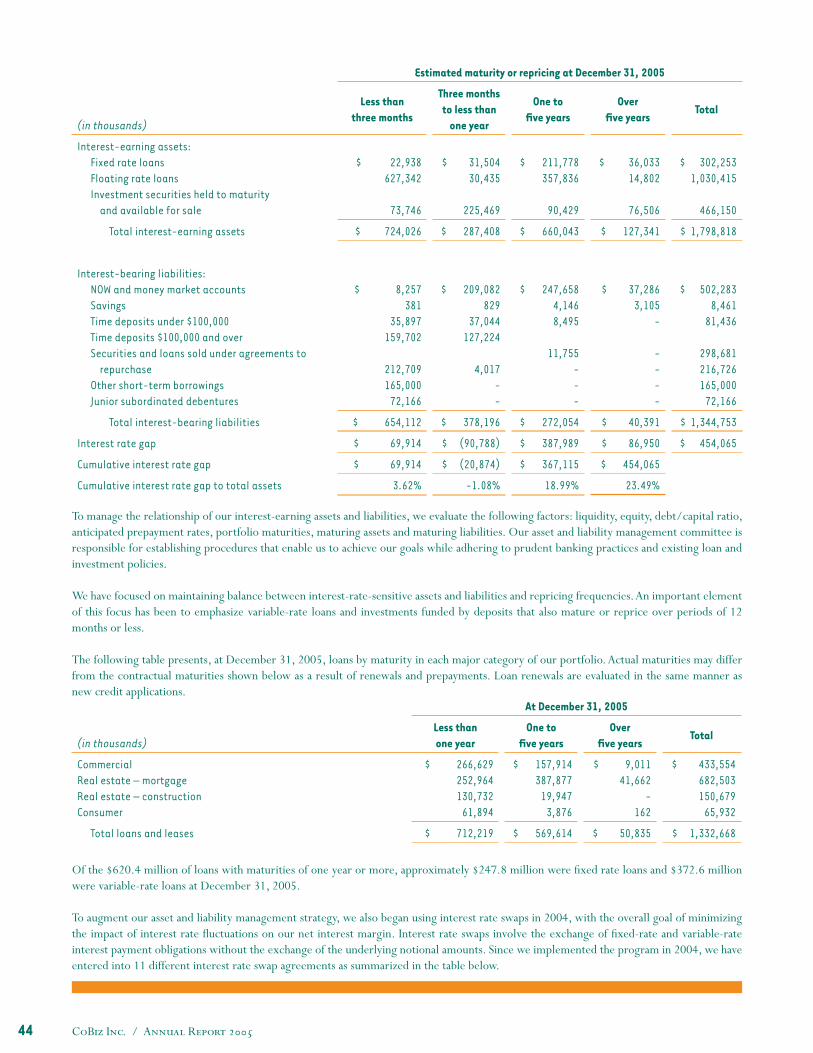
CoBiz Inc. / Annual Report 200544
To manage the relationship of our interest-earning assets and liabilities, we evaluate the following factors: liquidity, equity, debt/capital ratio, anticipated prepayment rates, portfolio maturities, maturing assets and maturing liabilities. Our asset and liability management committee is responsible for establishing procedures that enable us to achieve our goals while adhering to prudent banking practices and existing loan and investment policies.
We have focused on maintaining balance between interest-rate-sensitive assets and liabilities and repricing frequencies. An important element of this focus has been to emphasize variable-rate loans and investments funded by deposits that also mature or reprice over periods of 12 months or less.
The following table presents, at December 31, 2005, loans by maturity in each major category of our portfolio. Actual maturities may differ from the contractual maturities shown below as a result of renewals and prepayments. Loan renewals are evaluated in the same manner as new credit applications.
(in thousands)
Estimated maturity or repricing at December 31, 2005
Less thanthree months
Three monthsto less than
one year
One tofi ve years
Overfi ve years
Total
Interest-earning assets:Fixed rate loansFloating rate loansInvestment securities held to maturity
and available for sale
$ 22,938 627,342
73,746
$ 31,504 30,435
225,469
$ 211,778 357,836
90,429
$ 36,033 14,802
76,506
$ 302,253 1,030,415
466,150
Total interest-earning assets $ 724,026 $ 287,408 $ 660,043 $ 127,341 $ 1,798,818
Interest-bearing liabilities:NOW and money market accountsSavingsTime deposits under $100,000Time deposits $100,000 and overSecurities and loans sold under agreements to
repurchaseOther short-term borrowingsJunior subordinated debentures
$ 8,257 381
35,897 159,702
212,709 165,000
72,166
$ 209,082 829
37,044 127,224
4,017 - -
$ 247,658 4,146 8,495
11,755 - - -
$ 37,286 3,105
-
- - - -
$ 502,283 8,461
81,436
298,681 216,726 165,000
72,166
Total interest-bearing liabilities $ 654,112 $ 378,196 $ 272,054 $ 40,391 $ 1,344,753
Interest rate gap $ 69,914 $ (90,788) $ 387,989 $ 86,950 $ 454,065
Cumulative interest rate gap $ 69,914 $ (20,874) $ 367,115 $ 454,065
Cumulative interest rate gap to total assets 3.62% -1.08% 18.99% 23.49%
At December 31, 2005
(in thousands)Less thanone year
One tofi ve years
Overfi ve years
Total
CommercialReal estate – mortgageReal estate – constructionConsumer
$ 266,629 252,964 130,732
61,894
$ 157,914 387,877
19,947 3,876
$ 9,011 41,662
- 162
$ 433,554 682,503 150,679
65,932
Total loans and leases $ 712,219 $ 569,614 $ 50,835 $ 1,332,668
Of the $620.4 million of loans with maturities of one year or more, approximately $247.8 million were fi xed rate loans and $372.6 million were variable-rate loans at December 31, 2005.
To augment our asset and liability management strategy, we also began using interest rate swaps in 2004, with the overall goal of minimizing the impact of interest rate fl uctuations on our net interest margin. Interest rate swaps involve the exchange of fi xed-rate and variable-rate interest payment obligations without the exchange of the underlying notional amounts. Since we implemented the program in 2004, we have entered into 11 different interest rate swap agreements as summarized in the table below.
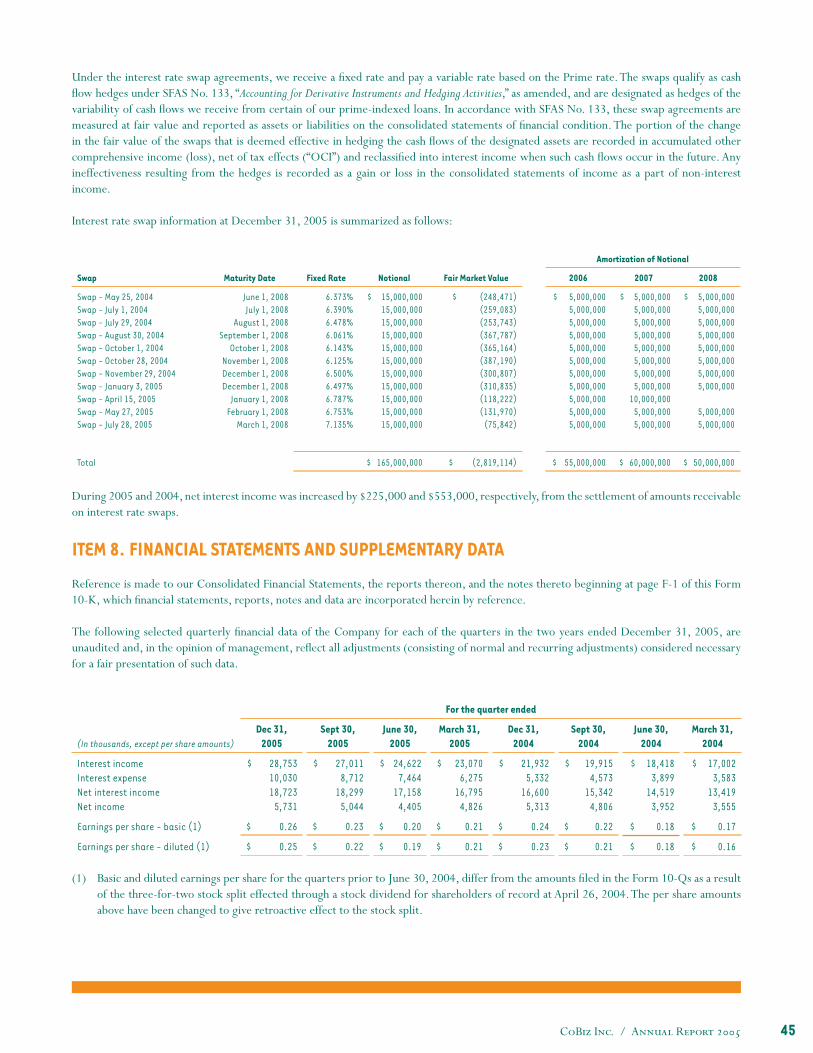
CoBiz Inc. / Annual Report 2005 45
Amortization of Notional
Swap Maturity Date Fixed Rate Notional Fair Market Value 2006 2007 2008
Swap - May 25, 2004Swap - July 1, 2004Swap - July 29, 2004Swap - August 30, 2004Swap - October 1, 2004Swap - October 28, 2004Swap - November 29, 2004Swap - January 3, 2005Swap - April 15, 2005Swap - May 27, 2005Swap - July 28, 2005
June 1, 2008July 1, 2008
August 1, 2008September 1, 2008
October 1, 2008November 1, 2008December 1, 2008December 1, 2008
January 1, 2008February 1, 2008
March 1, 2008
6.373%6.390%6.478%6.061%6.143%6.125%6.500%6.497%6.787%6.753%7.135%
$ 15,000,000 15,000,000 15,000,000 15,000,000 15,000,000 15,000,000 15,000,000 15,000,000 15,000,000 15,000,000 15,000,000
$ (248,471) (259,083) (253,743) (367,787) (365,164) (387,190) (300,807) (310,835) (118,222) (131,970)
(75,842)
$ 5,000,000 5,000,000 5,000,000 5,000,000 5,000,000 5,000,000 5,000,000 5,000,000 5,000,000 5,000,000 5,000,000
$ 5,000,000 5,000,000 5,000,000 5,000,000 5,000,000 5,000,000 5,000,000 5,000,000
10,000,000 5,000,000 5,000,000
$ 5,000,000 5,000,000 5,000,000 5,000,000 5,000,000 5,000,000 5,000,000 5,000,000
5,000,000 5,000,000
Total $ 165,000,000 $ (2,819,114) $ 55,000,000 $ 60,000,000 $ 50,000,000
Under the interest rate swap agreements, we receive a fi xed rate and pay a variable rate based on the Prime rate. The swaps qualify as cash fl ow hedges under SFAS No. 133, “Accounting for Derivative Instruments and Hedging Activities,” as amended, and are designated as hedges of the variability of cash fl ows we receive from certain of our prime-indexed loans. In accordance with SFAS No. 133, these swap agreements are measured at fair value and reported as assets or liabilities on the consolidated statements of fi nancial condition. The portion of the change in the fair value of the swaps that is deemed effective in hedging the cash fl ows of the designated assets are recorded in accumulated other comprehensive income (loss), net of tax effects (“OCI”) and reclassifi ed into interest income when such cash fl ows occur in the future. Any ineffectiveness resulting from the hedges is recorded as a gain or loss in the consolidated statements of income as a part of non-interest income.
Interest rate swap information at December 31, 2005 is summarized as follows:
For the quarter ended
(In thousands, except per share amounts)Dec 31,
2005Sept 30,
2005June 30,
2005March 31,
2005Dec 31,
2004Sept 30,
2004June 30,
2004March 31,
2004
Interest incomeInterest expenseNet interest incomeNet income
$ 28,753 10,030 18,723
5,731
$ 27,011 8,712
18,299 5,044
$ 24,622 7,464
17,158 4,405
$ 23,070 6,275
16,795 4,826
$ 21,932 5,332
16,600 5,313
$ 19,915 4,573
15,342 4,806
$ 18,418 3,899
14,519 3,952
$ 17,002 3,583
13,419 3,555
Earnings per share - basic (1) $ 0.26 $ 0.23 $ 0.20 $ 0.21 $ 0.24 $ 0.22 $ 0.18 $ 0.17
Earnings per share - diluted (1) $ 0.25 $ 0.22 $ 0.19 $ 0.21 $ 0.23 $ 0.21 $ 0.18 $ 0.16
During 2005 and 2004, net interest income was increased by $225,000 and $553,000, respectively, from the settlement of amounts receivable on interest rate swaps.
ITEM 8. FINANCIAL STATEMENTS AND SUPPLEMENTARY DATA
Reference is made to our Consolidated Financial Statements, the reports thereon, and the notes thereto beginning at page F-1 of this Form 10-K, which fi nancial statements, reports, notes and data are incorporated herein by reference.
The following selected quarterly fi nancial data of the Company for each of the quarters in the two years ended December 31, 2005, are unaudited and, in the opinion of management, refl ect all adjustments (consisting of normal and recurring adjustments) considered necessary for a fair presentation of such data.
(1) Basic and diluted earnings per share for the quarters prior to June 30, 2004, differ from the amounts fi led in the Form 10-Qs as a result of the three-for-two stock split effected through a stock dividend for shareholders of record at April 26, 2004. The per share amounts above have been changed to give retroactive effect to the stock split.
CoBiz Inc. / Annual Report 200546
ITEM 9. CHANGES IN AND DISAGREEMENTS WITH ACCOUNTANTS ON ACCOUNTING AND FINANCIAL DISCLOSURENone.
ITEM 9A. CONTROLS AND PROCEDURES
The Company carried out an evaluation, under the supervision and with the participation of the Company’s management, including the Company’s Chief Executive Offi cer and the Company’s Chief Financial Offi cer, of the effectiveness of the design and operation of the Company’s disclosure controls and procedures as of the end of the period covered by this report pursuant to Securities Exchange Act Rule 13a-15. Based upon that evaluation, the Company’s Chief Executive Offi cer and Chief Financial Offi cer concluded the Company’s disclosure controls and procedures are effective in timely alerting them to material information relating to the Company (including its consolidated subsidiaries) required to be included in the Company’s periodic SEC fi lings. In addition, during the fourth quarter of 2005 no change in the Company’s internal control over fi nancial reporting was identifi ed in connection with this evaluation that has materially affected or is reasonably likely to materially affect internal control over fi nancial reporting.
Disclosure controls and procedures are controls and other procedures that are designed to ensure that information required to be disclosed by us in the reports that we fi le or submit under the Exchange Act is recorded, processed, summarized and reported within the time periods specifi ed in SEC’s rules and forms. Disclosure controls and procedures include, without limitation, controls and procedures designed to ensure information required to be disclosed by us in the reports we fi le under the Exchange Act is accumulated and communicated to our management, including our Chief Executive Offi cer and Chief Financial Offi cer, as appropriate to allow timely decisions regarding required disclosure.
Management’s Report on Internal Control over Financial Reporting and the Report of Independent Registered Public Accounting Firm are set forth in our Consolidated Financial Statements and the reports thereon beginning at page F-1.
ITEM 9B. OTHER INFORMATIONNone.
CoBiz Inc. / Annual Report 2005 47
PART III
ITEM 10. DIRECTORS AND EXECUTIVE OFFICERS OF THE REGISTRANTInformation concerning the Company’s directors and offi cers called for by this item will be included under the captions “Election of Directors” and “Management – Executive Offi cers” in the Company’s defi nitive Proxy Statement prepared in connection with the 2006 Annual Meeting of Shareholders (the “2006 Proxy Statement”) and is incorporated herein by reference. Information regarding audit committee fi nancial experts and the audit committee appearing under the caption “Committees of the Board of Directors – Audit Committee” will be included in our 2006 Proxy Statement and is hereby incorporated by reference. Information regarding disclosure of compliance with Section 16(a) of the Securities Exchange Act appearing under the caption “Section 16(a) Benefi cial Ownership Reporting Compliance” will be included in our 2006 Proxy Statement and is hereby incorporated by reference.
The Company has adopted a Code of Conduct and Ethics (“Code of Conduct”) that applies to the Company’s offi cers, directors and employees, including the Company’s principal executive offi cer, principal fi nancial offi cer, principal accounting offi cer or controller (collectively “Company Associates”), or persons performing similar functions. The Company has posted the Code of Conduct and will post any changes in or waivers of the Code of Conduct applicable to any Company associate on its website at www.cobizinc.com.
ITEM 11. EXECUTIVE COMPENSATIONInformation concerning the compensation of Company executives called for by this item will be included in the 2006 Proxy Statement under the captions “Director Compensation”, “Executive Compensation”, “Stock Option Plans”, “Supplemental Executive Retirement Plan and Split Dollar Benefi ts”, and “Employment Agreements” and is incorporated herein by reference.
ITEM 12. SECURITY OWNERSHIP OF CERTAIN BENEFICIAL OWNERS AND MANAGEMENT AND RELATED STOCKHOLDER MATTERSInformation concerning security ownership of certain benefi cial owners and management called for by this item will be included in the Company’s 2006 Proxy under the caption “Principal Shareholders.” and is incorporated herein by reference. Information regarding securities authorized for issuance under equity compensation plans appearing under the caption “Stock Option Plans” will be included in our 2006 Proxy Statement and is hereby incorporated by reference.
ITEM 13. CERTAIN RELATIONSHIPS AND RELATED TRANSACTIONS OF COBIZInformation concerning certain relationships and transactions between CoBiz and its affi liates called for by this item will be included in the Company’s 2006 Proxy Statement under the captions “Certain Relationships and Transactions” and “Compensation Committee Interlocks and Insider Participation” and is incorporated herein by reference.
ITEM 14. PRINCIPAL ACCOUNTANT FEES AND SERVICESInformation required by this Item will be included under the caption “Relationship with Independent Public Accountants” and “Audit Committee Report” in the Company’s 2006 Proxy and is incorporated herein by reference.
CoBiz Inc. / Annual Report 200548
PART IV
ITEM 15. EXHIBITS AND FINANCIAL STATEMENT SCHEDULES (a)(1) The following documents are fi led as part of this Annual Report on Form 10-K:
Management’s Report on Internal Control Over Financial Reporting
Reports of Independent Registered Public Accounting Firm
Consolidated Balance Sheets as of December 31, 2005 and 2004.
Consolidated Statements of Income and Comprehensive Income for the Years Ended December 31, 2005, 2004 and 2003. Consolidated Statements of Shareholders’ Equity for the Years Ended December 31, 2005, 2004 and 2003. Consolidated Statements of Cash Flows for the Years Ended December 31, 2005, 2004 and 2003. Notes to Consolidated Financial Statements.
(2) All fi nancial statement schedules are omitted because they are not required or because the required information is included in the
fi nancial statements and/or related notes. (3) Exhibits and Index of Exhibits.
(1) (2) 2 Amended and Restated Agreement and Plan of Merger dated November 28, 2000.
(2) 3.1 Amended and Restated Articles of Incorporation of the Registrant.
(3) 3.2 Amendment to Articles of Incorporation
(8) 3.3 Amendment to Articles of Incorporation. (4) 3.4 Amendment to Articles of Incorporation.
(2) 3.5 Amended and Restated Bylaws of the Registrant.
(8) 3.6 Amendment to Bylaws.
(2) 10.1 CoBiz Inc. 1998 Stock Incentive Plan.
(2) 10.2 Amended and Restated CoBiz Inc. 1997 Incentive Stock Option Plan.
(2) 10.3 Amended and Restated CoBiz Inc. 1995 Incentive Stock Option Plan. +(2) 10.4 License Agreement, dated at November 19, 1997, by and between Jack Henry & Associates, Inc. and Colorado Business Bank, N.A.
+(2) 10.5 Contract Modifi cation, dated at November 19, 1997, by and between Jack Henry & Associates, Inc. and Colorado Business Bank, N.A.
+(2) 10.6 Computer Software Maintenance Agreement, dated at November 19, 1997, by and between Jack Henry & Associates, Inc. and Colorado Business Bank, N.A.
(2) 10.7 Employment Agreement, dated at March 1, 1995, by and between Equitable Bankshares of Colorado, Inc. and Jonathan C. Lorenz.
CoBiz Inc. / Annual Report 2005 49
(2) 10.8 Employment Agreement, dated at January 3, 1998, by and between Colorado Business Bankshares, Inc. and Richard J. Dalton.
(5) 10.9 Lease Agreement between Kesef, LLC and Colorado Business Bankshares, Inc. dated May 1, 1992
(6) 10.10 First Amendment to Lease Agreement between Kesef, LLC and Colorado Business Bankshares, Inc. dated August 1, 2000.
(7) 10.11 2000 Employee Stock Purchase Plan.
(8) 10.12 2002 Equity Incentive Plan.
(10) 10.13 Employment Agreement, dated August 12, 2003, by and between CoBiz Inc. and Lyne B. Andrich.
(11) 10.14 Lease Agreement between Za’hav and First Capital Bank of Arizona dated June 15, 2001.
(11) 10.15 Lease Agreement between Dorit, LLC and Colorado Business Bank, N.A. dated March 31, 2003.
(11) 10.16 Employment Agreement, dated March 8, 2001, by and between First Capital Bank of Arizona and Harold F. Mosanko.
(12) 10.17 Employment Agreement, dated November 19, 2004, by and between CoBiz Inc. and Steven Bangert.
(13) 10.18 Supplemental Executive Retirement Plan
(4) 10.19 2005 Equity Incentive Plan.
(11) 14 Code of Conduct and Ethics.
21 List of subsidiaries.
23 Consent of Registered Public Accounting fi rm.
31.1 Rule 13a-14(a)/15d-14(a) Certifi cation of the Chief Executive Offi cer.
31.2 Rule 13a-14(a)/15d-14(a) Certifi cation of the Chief Financial Offi cer.
32.1 Section 1350 Certifi cation of the Chief Executive Offi cer.
32.2 Section 1350 Certifi cation of the Chief Financial Offi cer.____________
CoBiz Inc. / Annual Report 200550
(1) Incorporated herein by reference from the Registrant’s Registration Statement on Form S-4 (File No. 333-51866).
(2) Incorporated herein by reference from the Registrant’s Registration Statement on Form SB-2 (File No. 333-50037).
(3) Incorporated herein by reference from the Registrant’s Current Report on Form 8-K, as fi led on March 23, 2001.
(4) Incorporated herein by reference from the Registrant’s Defi nitive Proxy Statement on Schedule 14A as fi led on April 14, 2005
(5) Incorporated herein by reference from the Registrant’s Quarterly Report on Form 10-QSB for the quarter ended September 30, 1998, as fi led on November 13, 1998.
(6) Incorporated herein by reference from the Registrant’s Quarterly Report on Form 10-Q for the quarter ended September 30, 2000, as fi led on November 14, 2000.
(7) Incorporated herein by reference from the Registrant’s Proxy Statement fi led in connection with its 2000 annual meeting of shareholders, as fi led on April 19, 2000.
(8) Incorporated herein by reference from the Registrant’s Quarterly Report on Form 10-Q for the quarter ended June 30, 2002, as fi led on August 14, 2002.
(9) Incorporated herein by reference from the Registrant’s Quarterly Report on Form 10-Q for the quarter ended March 31, 2003, as fi led on May 14, 2003.
(10) Incorporated herein by reference from the Registrant’s Quarterly Report on Form 10-Q for the quarter ended September 30, 2003, as fi led on November 13, 2003.
(11) Incorporated herein by reference from the Registrant’s Annual Report on Form 10-K for the year ended December 31, 2004, as fi led on March 12, 2004.
(12) Incorporated herein by reference from the Registrant’s Periodic Report on Form 8-K, as fi led on November 24, 2004.
(13) Incorporated herein by reference from the Registrant’s Annual Report on Form 10-K for the year ended December 31, 2005, as fi led on March 14, 2005.
+ Confi dential treatment has been granted by the Securities and Exchange Commission as to certain portions of exhibit. Such portions have been redacted.____________
(b) Exhibits - See exhibit index included in Item 15(a)(3) of this Annual Report on Form 10-K.(c) Financial Statement Schedules - See Item 15(a)(2) of this Annual Report on Form 10-K.
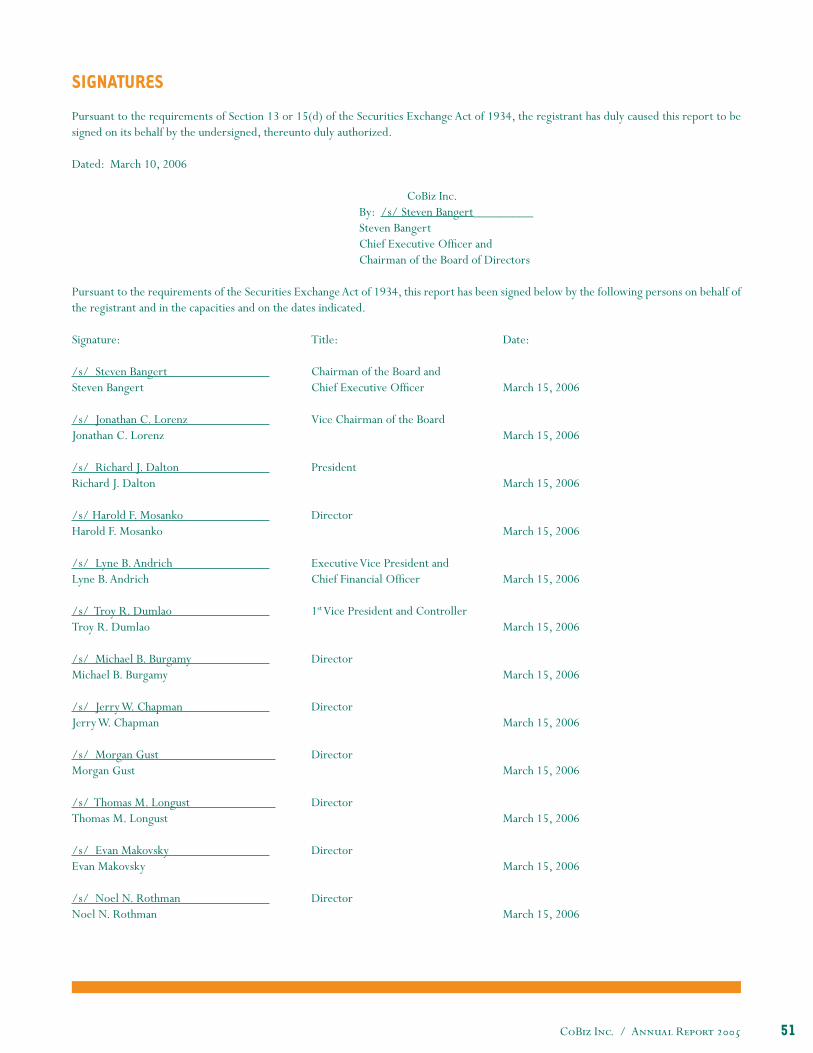
CoBiz Inc. / Annual Report 2005 51
SIGNATURES
Pursuant to the requirements of Section 13 or 15(d) of the Securities Exchange Act of 1934, the registrant has duly caused this report to be signed on its behalf by the undersigned, thereunto duly authorized.
Dated: March 10, 2006
CoBiz Inc. By: /s/ Steven Bangert_________
Steven Bangert Chief Executive Offi cer and
Chairman of the Board of Directors
Pursuant to the requirements of the Securities Exchange Act of 1934, this report has been signed below by the following persons on behalf of the registrant and in the capacities and on the dates indicated.
Signature: Title: Date:
/s/ Steven Bangert Chairman of the Board andSteven Bangert Chief Executive Offi cer March 15, 2006
/s/ Jonathan C. Lorenz Vice Chairman of the Board Jonathan C. Lorenz March 15, 2006
/s/ Richard J. Dalton President Richard J. Dalton March 15, 2006
/s/ Harold F. Mosanko Director Harold F. Mosanko March 15, 2006
/s/ Lyne B. Andrich Executive Vice President andLyne B. Andrich Chief Financial Offi cer March 15, 2006
/s/ Troy R. Dumlao 1st Vice President and ControllerTroy R. Dumlao March 15, 2006
/s/ Michael B. Burgamy DirectorMichael B. Burgamy March 15, 2006
/s/ Jerry W. Chapman Director Jerry W. Chapman March 15, 2006
/s/ Morgan Gust Director Morgan Gust March 15, 2006
/s/ Thomas M. Longust Director Thomas M. Longust March 15, 2006
/s/ Evan Makovsky DirectorEvan Makovsky March 15, 2006
/s/ Noel N. Rothman Director Noel N. Rothman March 15, 2006

CoBiz Inc. / Annual Report 200552
/s/ Howard R. Ross Director Howard R. Ross March 15, 2006
/s/ Timothy J. Travis DirectorTimothy J. Travis March 15, 2006
/s/ Mary Beth Vitale DirectorMary Beth Vitale March 15, 2006
/s/ Mary M. White DirectorMary M. White March 15, 2006
CoBiz Inc. / Annual Report 2005 F / 1
INDEX TO CONSOLIDATED FINANCIAL STATEMENTS
Management’s Report on Internal Control Over Financial Reporting F-2Reports of Independent Registered Public Accounting Firm F-3Consolidated Balance Sheets at December 31, 2005 and 2004 F-6Consolidated Statements of Income and Comprehensive Income for the Years Ended
December 31, 2005, 2004, and 2003 F-8Consolidated Statements of Shareholders’ Equity for the Years Ended
December 31, 2005, 2004, and 2003 F-9Consolidated Statements of Cash Flows for the Years Ended
December 31, 2005, 2004, and 2003 F-10Notes to Consolidated Financial Statements for the Years Ended
December 31, 2005, 2004, and 2003 F-11
CoBiz Inc. / Annual Report 2005F / 2
MANAGEMENT’S REPORT ON INTERNAL CONTROL OVER FINANCIAL REPORTING
Management of CoBiz Inc., together with its consolidated subsidiaries (the “Company”), is responsible for establishing and maintaining adequate internal control over fi nancial reporting. The Company’s internal control over fi nancial reporting is a process designed under the supervision of the Company’s Chief Executive Offi cer and Chief Financial Offi cer to provide reasonable assurance regarding the reliability of fi nancial reporting and the preparation of the Company’s fi nancial statements for external reporting purposes in accordance with accounting principles generally accepted in the United States of America.
As of December 31, 2005, management conducted an assessment of the effectiveness of the Company’s internal control over fi nancial report-ing based on the framework established in Internal Control — Integrated Framework issued by the Committee of Sponsoring Organizations of the Treadway Commission (COSO). Based on this assessment, management has determined that the Company’s internal control over fi nancial reporting as of December 31, 2005, is effective.
Our internal control over fi nancial reporting includes policies and procedures that pertain to the maintenance of records that, in reasonable detail, accurately and fairly refl ect transactions and dispositions of assets; provide reasonable assurances that transactions are recorded as necessary to permit preparation of fi nancial statements in accordance with accounting principles generally accepted in the United States of America, and that receipts and expenditures are being made only in accordance with authorizations of management and the directors of the Company; and provide reasonable assurance regarding prevention or timely detection of unauthorized acquisition, use or disposition of the Company’s assets that could have a material effect on our fi nancial statements.
Management’s assessment of the effectiveness of the Company’s internal control over fi nancial reporting as of December 31, 2005 has been audited by Deloitte & Touche LLP, an independent registered public accounting fi rm, as stated in their report appearing under the heading “Report of Independent Registered Public Accounting Firm,” which expresses unqualifi ed opinions on management’s assessment and on the effectiveness of the Company’s internal control over fi nancial reporting as of December 31, 2005.
/s/ Steven Bangert /s/ Lyne B. Andrich Chief Executive Offi cer and Chairman of the Board of Directors Executive Vice President and Chief Financial Offi cer
March 10, 2006
CoBiz Inc. / Annual Report 2005 F / 3
REPORT OF INDEPENDENT REGISTERED PUBLIC ACCOUNTING FIRM
Board of Directors and ShareholdersCoBiz Inc.Denver, Colorado
We have audited management’s assessment, included in the accompanying management’s report on internal control over fi nancial reporting, that CoBiz Inc. and Subsidiaries (the “Company”) maintained effective internal control over fi nancial reporting as of December 31, 2005, based on criteria established in Internal Control — Integrated Framework issued by the Committee of Sponsoring Organizations of the Treadway Commission. Because management’s assessment and our audit were conducted to meet the reporting requirements of Section 112 of the Federal Deposit Insurance Corporation Improvement Act (FDICIA), management’s assessment and our audit of the Company’s internal con-trol over fi nancial reporting included controls over the preparation of the schedules equivalent to the basic fi nancial statements in accordance with the instructions for the Consolidated Financial Statements for Bank Holding Companies (Form FR Y-9C). The Company’s management is responsible for maintaining effective internal control over fi nancial reporting and for its assessment of the effectiveness of internal control over fi nancial reporting. Our responsibility is to express an opinion on management’s assessment and an opinion on the effectiveness of the Company’s internal control over fi nancial reporting based on our audit.
We conducted our audit in accordance with the standards of the Public Company Accounting Oversight Board (United States). Those stan-dards require that we plan and perform the audit to obtain reasonable assurance about whether effective internal control over fi nancial re-porting was maintained in all material respects. Our audit included obtaining an understanding of internal control over fi nancial reporting, evaluating management’s assessment, testing, and evaluating the design and operating effectiveness of internal control, and performing such other procedures as we considered necessary in the circumstances. We believe that our audit provides a reasonable basis for our opinions.
A company’s internal control over fi nancial reporting is a process designed by, or under the supervision of, the company’s principal executive and principal fi nancial offi cers, or persons performing similar functions, and effected by the company’s board of directors, management, and other personnel to provide reasonable assurance regarding the reliability of fi nancial reporting and the preparation of fi nancial statements for external purposes in accordance with generally accepted accounting principles. A company’s internal control over fi nancial reporting includes those policies and procedures that (1) pertain to the maintenance of records that, in reasonable detail, accurately and fairly refl ect the transactions and dispositions of the assets of the company; (2) provide reasonable assurance that transactions are recorded as necessary to permit preparation of fi nancial statements in accordance with generally accepted accounting principles, and that receipts and expenditures of the company are being made only in accordance with authorizations of management and directors of the company; and (3) provide reasonable assurance regarding prevention or timely detection of unauthorized acquisition, use, or disposition of the company’s assets that could have a material effect on the fi nancial statements.
Because of the inherent limitations of internal control over fi nancial reporting, including the possibility of collusion or improper management override of controls, material misstatements due to error or fraud may not be prevented or detected on a timely basis. Also, projections of any evaluation of the effectiveness of the internal control over fi nancial reporting to future periods are subject to the risk that the controls may become inadequate because of changes in conditions, or that the degree of compliance with the policies or procedures may deteriorate.
In our opinion, management’s assessment that the Company maintained effective internal control over fi nancial reporting as of December 31, 2005, is fairly stated, in all material respects, based on the criteria established in Internal Control — Integrated Framework issued by the Com-mittee of Sponsoring Organizations of the Treadway Commission. Also, in our opinion, the Company maintained, in all material respects, effective internal control over fi nancial reporting as of December 31, 2005, based on the criteria established in Internal Control — Integrated Framework issued by the Committee of Sponsoring Organizations of the Treadway Commission.
We have not examined and, accordingly, we do not express an opinion or any other form of assurance on management’s statement referring to compliance with laws and regulations.
We have also audited, in accordance with the standards of the Public Company Accounting Oversight Board (United States), the consolidated
CoBiz Inc. / Annual Report 2005F / 4
balance sheets as of December 31, 2005 and 2004, and the related consolidated statements of income and comprehensive income, sharehold-ers’ equity, and cash fl ows for each of the three years in the period ended December 31, 2005, of the Company and our report dated March 10, 2006, expressed an unqualifi ed opinion on those fi nancial statements.
DELOITTE & TOUCHE LLPDenver, ColoradoMarch 10, 2006
CoBiz Inc. / Annual Report 2005 F / 5
REPORT OF INDEPENDENT REGISTERED PUBLIC ACCOUNTING FIRM
Board of Directors and ShareholdersCoBiz Inc.Denver, Colorado
We have audited the accompanying consolidated balance sheets of CoBiz Inc. and Subsidiaries (the Company”) as of December 31, 2005 and 2004, and the related consolidated statements of income and comprehensive income, shareholders’ equity, and cash fl ows for each of the three years in the period ended December 31, 2005. These fi nancial statements are the responsibility of the Company’s management. Our responsibility is to express an opinion on these fi nancial statements based on our audits.
We conducted our audits in accordance with the standards of the Public Company Accounting Oversight Board (United States). Those stan-dards require that we plan and perform the audit to obtain reasonable assurance about whether the fi nancial statements are free of material misstatement. An audit includes examining, on a test basis, evidence supporting the amounts and disclosures in the fi nancial statements. An audit also includes assessing the accounting principles used and signifi cant estimates made by management, as well as evaluating the overall fi nancial statement presentation. We believe that our audits provide a reasonable basis for our opinion.
In our opinion, such consolidated fi nancial statements present fairly, in all material respects, the fi nancial position of CoBiz Inc. and subsidiar-ies as of December 31, 2005 and 2004, and the results of their operations and their cash fl ows for each of the three years in the period ended December 31, 2005, in conformity with accounting principles generally accepted in the United States of America.
We have also audited, in accordance with the standards of the Public Company Accounting Oversight Board (United States), the effectiveness of the Company’s internal control over fi nancial reporting as of December 31, 2005, based on the criteria established in Internal Control — In-tegrated Framework issued by the Committee of Sponsoring Organizations of the Treadway Commission and our report dated March 10, 2006, expressed an unqualifi ed opinion on management’s assessment of the effectiveness of the Company’s internal control over fi nancial reporting and an unqualifi ed opinion on the effectiveness of the Company’s internal control over fi nancial reporting.
DELOITTE & TOUCHE LLPDenver, ColoradoMarch 10, 2006
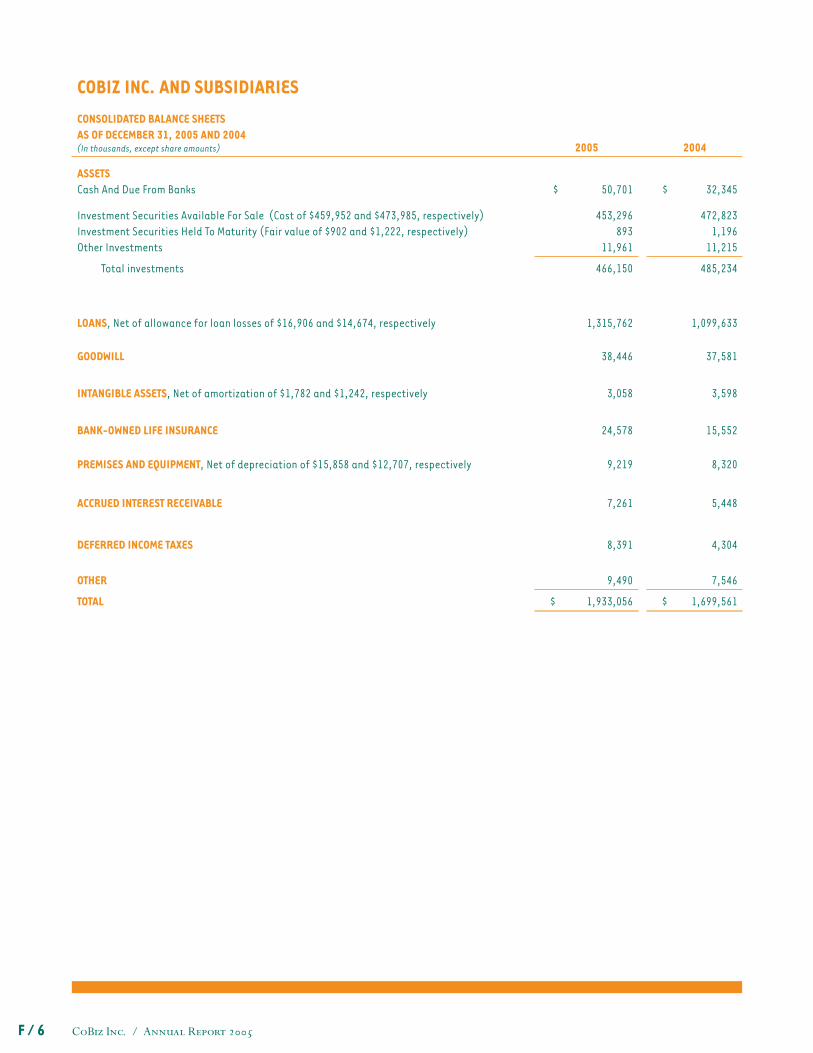
CoBiz Inc. / Annual Report 2005F / 6
COBIZ INC. AND SUBSIDIARIESCONSOLIDATED BALANCE SHEETSAS OF DECEMBER 31, 2005 AND 2004 (In thousands, except share amounts) 2005 2004
ASSETSCash And Due From Banks $ 50,701 $ 32,345
Investment Securities Available For Sale (Cost of $459,952 and $473,985, respectively)Investment Securities Held To Maturity (Fair value of $902 and $1,222, respectively)Other Investments
453,296 893
11,961
472,823 1,196
11,215
Total investments 466,150 485,234
LOANS, Net of allowance for loan losses of $16,906 and $14,674, respectively 1,315,762 1,099,633
GOODWILL 38,446 37,581
INTANGIBLE ASSETS, Net of amortization of $1,782 and $1,242, respectively
3,058
3,598
BANK-OWNED LIFE INSURANCE
24,578
15,552
PREMISES AND EQUIPMENT, Net of depreciation of $15,858 and $12,707, respectively 9,219 8,320
ACCRUED INTEREST RECEIVABLE 7,261 5,448
DEFERRED INCOME TAXES 8,391 4,304
OTHER 9,490 7,546
TOTAL $ 1,933,056 $ 1,699,561
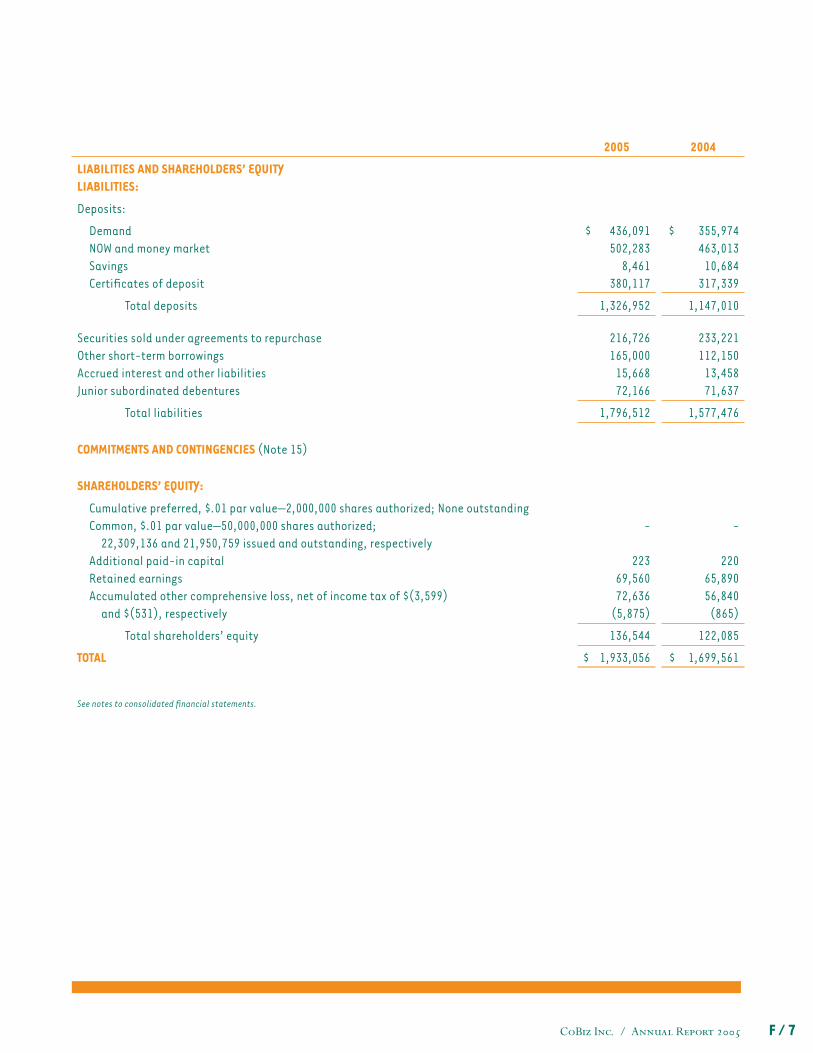
CoBiz Inc. / Annual Report 2005 F / 7
2005 2004
LIABILITIES AND SHAREHOLDERS’ EQUITYLIABILITIES:
Deposits:
DemandNOW and money marketSavingsCertifi cates of deposit
$ 436,091 502,283
8,461 380,117
$ 355,974 463,013
10,684 317,339
Total deposits 1,326,952 1,147,010
Securities sold under agreements to repurchaseOther short-term borrowingsAccrued interest and other liabilitiesJunior subordinated debentures
216,726 165,000
15,668 72,166
233,221 112,150
13,458 71,637
Total liabilities 1,796,512 1,577,476
COMMITMENTS AND CONTINGENCIES (Note 15)
SHAREHOLDERS’ EQUITY:
Cumulative preferred, $.01 par value—2,000,000 shares authorized; None outstanding Common, $.01 par value—50,000,000 shares authorized;
22,309,136 and 21,950,759 issued and outstanding, respectivelyAdditional paid-in capitalRetained earningsAccumulated other comprehensive loss, net of income tax of $(3,599)
and $(531), respectively
-
223 69,560 72,636 (5,875)
-
220 65,890 56,840
(865)
Total shareholders’ equity 136,544 122,085
TOTAL $ 1,933,056 $ 1,699,561
See notes to consolidated fi nancial statements.
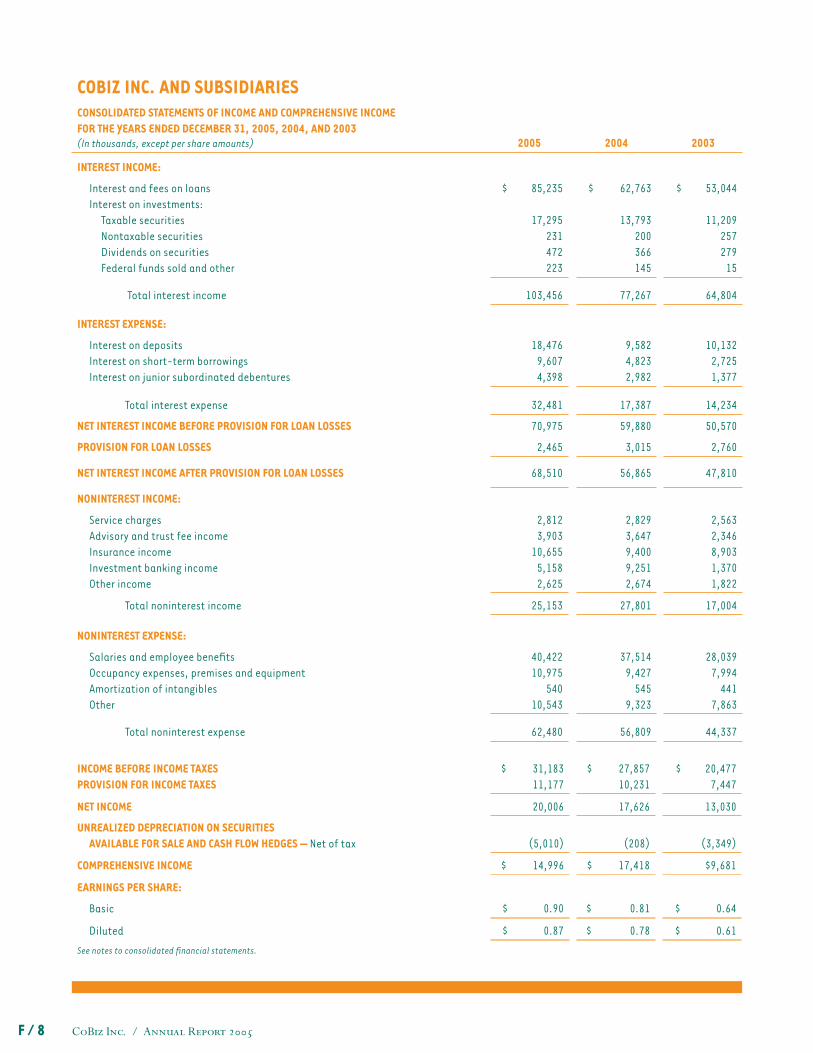
CoBiz Inc. / Annual Report 2005F / 8
COBIZ INC. AND SUBSIDIARIESCONSOLIDATED STATEMENTS OF INCOME AND COMPREHENSIVE INCOMEFOR THE YEARS ENDED DECEMBER 31, 2005, 2004, AND 2003 (In thousands, except per share amounts) 2005 2004 2003
INTEREST INCOME:
Interest and fees on loansInterest on investments:
Taxable securitiesNontaxable securitiesDividends on securitiesFederal funds sold and other
$ 85,235
17,295 231 472 223
$ 62,763
13,793 200 366 145
$ 53,044
11,209 257 279
15
Total interest income 103,456 77,267 64,804
INTEREST EXPENSE:
Interest on depositsInterest on short-term borrowings Interest on junior subordinated debentures
18,476 9,607 4,398
9,582 4,823 2,982
10,132 2,725 1,377
Total interest expense 32,481 17,387 14,234
NET INTEREST INCOME BEFORE PROVISION FOR LOAN LOSSES 70,975 59,880 50,570
PROVISION FOR LOAN LOSSES 2,465 3,015 2,760
NET INTEREST INCOME AFTER PROVISION FOR LOAN LOSSES 68,510 56,865 47,810
NONINTEREST INCOME:
Service chargesAdvisory and trust fee incomeInsurance incomeInvestment banking incomeOther income
2,812 3,903
10,655 5,158 2,625
2,829 3,647 9,400 9,251 2,674
2,563 2,346 8,903 1,370 1,822
Total noninterest income 25,153 27,801 17,004
NONINTEREST EXPENSE:
Salaries and employee benefi tsOccupancy expenses, premises and equipmentAmortization of intangiblesOther
40,422 10,975
540 10,543
37,514 9,427
545 9,323
28,039 7,994
441 7,863
Total noninterest expense 62,480 56,809 44,337
INCOME BEFORE INCOME TAXESPROVISION FOR INCOME TAXES
$ 31,183 11,177
$ 27,857 10,231
$ 20,477 7,447
NET INCOME 20,006 17,626 13,030
UNREALIZED DEPRECIATION ON SECURITIES AVAILABLE FOR SALE AND CASH FLOW HEDGES — Net of tax (5,010) (208) (3,349)
COMPREHENSIVE INCOME $ 14,996 $ 17,418 $9,681
EARNINGS PER SHARE:
Basic $ 0.90 $ 0.81 $ 0.64
Diluted $ 0.87 $ 0.78 $ 0.61
See notes to consolidated fi nancial statements.
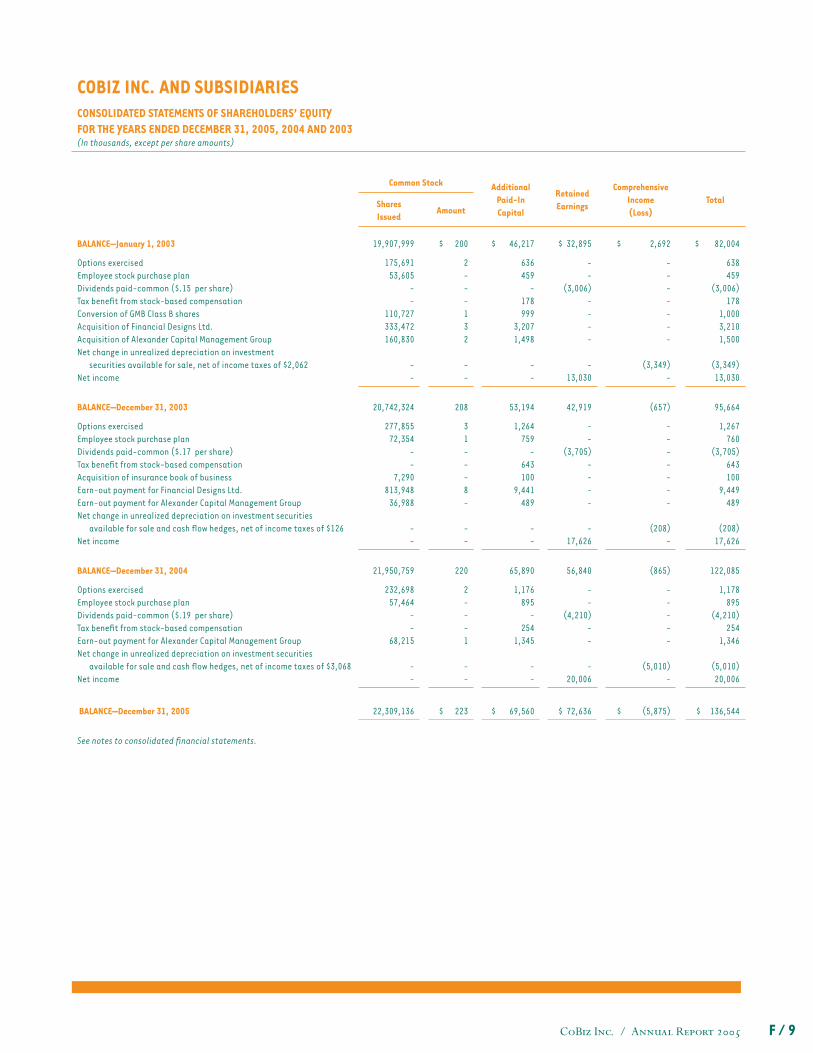
CoBiz Inc. / Annual Report 2005 F / 9
COBIZ INC. AND SUBSIDIARIESCONSOLIDATED STATEMENTS OF SHAREHOLDERS’ EQUITYFOR THE YEARS ENDED DECEMBER 31, 2005, 2004 AND 2003 (In thousands, except per share amounts)
Common Stock AdditionalPaid-InCapital
RetainedEarnings
ComprehensiveIncome(Loss)
TotalSharesIssued
Amount
BALANCE—January 1, 2003 19,907,999 $ 200 $ 46,217 $ 32,895 $ 2,692 $ 82,004
Options exercisedEmployee stock purchase planDividends paid-common ($.15 per share)Tax benefi t from stock-based compensationConversion of GMB Class B sharesAcquisition of Financial Designs Ltd.Acquisition of Alexander Capital Management GroupNet change in unrealized depreciation on investment
securities available for sale, net of income taxes of $2,062Net income
175,691 53,605
- -
110,727 333,472 160,830
- -
2 - - - 1 3 2
- -
636 459
- 178 999
3,207 1,498
- -
- -
(3,006) - - - -
-
13,030
- - - - - - -
(3,349)
-
638 459
(3,006) 178
1,000 3,210 1,500
(3,349) 13,030
BALANCE—December 31, 2003 20,742,324 208 53,194 42,919 (657) 95,664
Options exercisedEmployee stock purchase planDividends paid-common ($.17 per share)Tax benefi t from stock-based compensationAcquisition of insurance book of businessEarn-out payment for Financial Designs Ltd.Earn-out payment for Alexander Capital Management GroupNet change in unrealized depreciation on investment securities
available for sale and cash fl ow hedges, net of income taxes of $126Net income
277,855 72,354
- -
7,290 813,948
36,988
- -
3 1 - - - 8 -
-
-
1,264 759
- 643 100
9,441 489
-
-
- -
(3,705) - - - -
-
17,626
- - - - - - -
(208) -
1,267 760
(3,705) 643 100
9,449 489
(208)
17,626
BALANCE—December 31, 2004 21,950,759 220 65,890 56,840 (865) 122,085
Options exercisedEmployee stock purchase planDividends paid-common ($.19 per share)Tax benefi t from stock-based compensationEarn-out payment for Alexander Capital Management GroupNet change in unrealized depreciation on investment securities
available for sale and cash fl ow hedges, net of income taxes of $3,068Net income
232,698 57,464
- -
68,215
- -
2 - - - 1
-
-
1,176 895
- 254
1,345
- -
- -
(4,210) - - -
20,006
- - - - -
(5,010) -
1,178 895
(4,210) 254
1,346
(5,010) 20,006
BALANCE—December 31, 2005 22,309,136 $ 223 $ 69,560 $ 72,636 $ (5,875) $ 136,544
See notes to consolidated fi nancial statements.
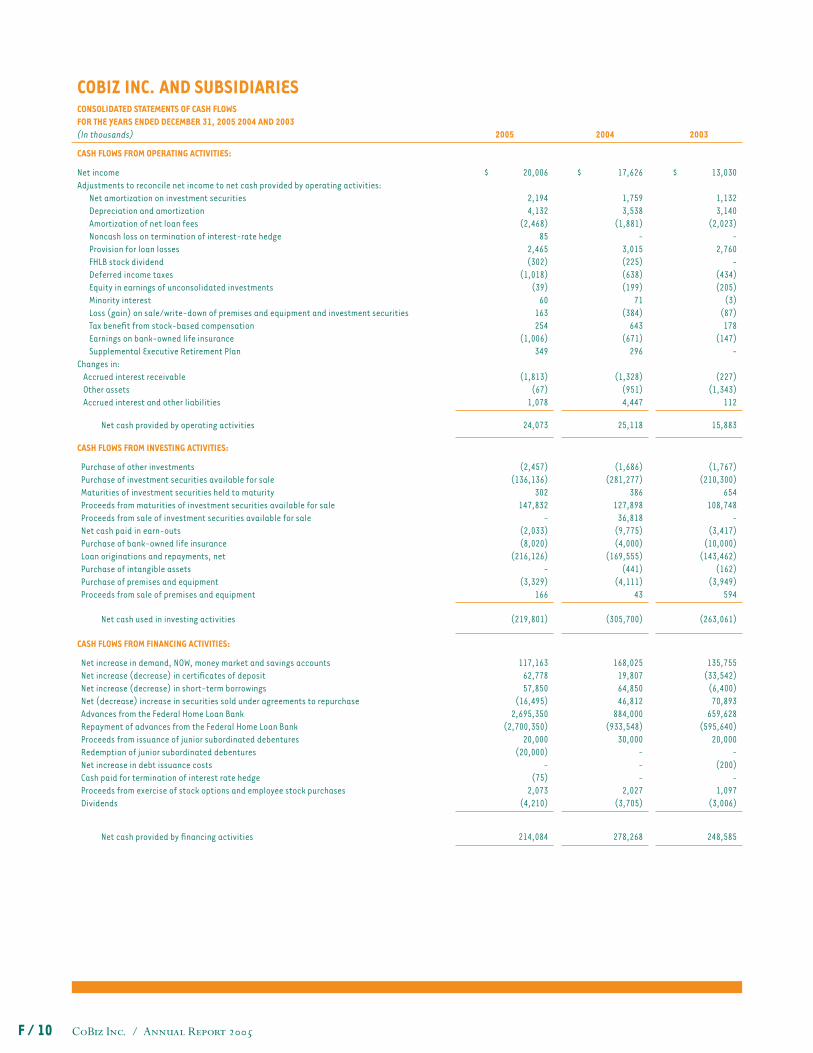
CoBiz Inc. / Annual Report 2005F / 10
COBIZ INC. AND SUBSIDIARIESCONSOLIDATED STATEMENTS OF CASH FLOWSFOR THE YEARS ENDED DECEMBER 31, 2005 2004 AND 2003 (In thousands) 2005 2004 2003
CASH FLOWS FROM OPERATING ACTIVITIES:
Net incomeAdjustments to reconcile net income to net cash provided by operating activities:
Net amortization on investment securitiesDepreciation and amortizationAmortization of net loan feesNoncash loss on termination of interest-rate hedgeProvision for loan lossesFHLB stock dividendDeferred income taxesEquity in earnings of unconsolidated investmentsMinority interestLoss (gain) on sale/write-down of premises and equipment and investment securitiesTax benefi t from stock-based compensationEarnings on bank-owned life insuranceSupplemental Executive Retirement Plan
Changes in:Accrued interest receivableOther assetsAccrued interest and other liabilities
$ 20,006
2,194 4,132
(2,468) 85
2,465 (302)
(1,018) (39)
60 163 254
(1,006) 349
(1,813)
(67) 1,078
$ 17,626
1,759 3,538
(1,881) -
3,015 (225) (638) (199)
71 (384)
643 (671)
296
(1,328) (951) 4,447
$ 13,030
1,132 3,140
(2,023) -
2,760 -
(434) (205)
(3) (87) 178
(147) -
(227) (1,343)
112
Net cash provided by operating activities 24,073 25,118 15,883
CASH FLOWS FROM INVESTING ACTIVITIES:
Purchase of other investments Purchase of investment securities available for sale Maturities of investment securities held to maturity Proceeds from maturities of investment securities available for sale Proceeds from sale of investment securities available for sale Net cash paid in earn-outs Purchase of bank-owned life insurance Loan originations and repayments, net Purchase of intangible assets Purchase of premises and equipment Proceeds from sale of premises and equipment
(2,457) (136,136)
302 147,832
- (2,033) (8,020)
(216,126) -
(3,329) 166
(1,686) (281,277)
386 127,898
36,818 (9,775) (4,000)
(169,555) (441)
(4,111) 43
(1,767) (210,300)
654 108,748
- (3,417)
(10,000) (143,462)
(162) (3,949)
594
Net cash used in investing activities (219,801) (305,700) (263,061)
CASH FLOWS FROM FINANCING ACTIVITIES:
Net increase in demand, NOW, money market and savings accounts Net increase (decrease) in certifi cates of deposit Net increase (decrease) in short-term borrowings Net (decrease) increase in securities sold under agreements to repurchase Advances from the Federal Home Loan Bank Repayment of advances from the Federal Home Loan Bank Proceeds from issuance of junior subordinated debentures Redemption of junior subordinated debentures Net increase in debt issuance costs Cash paid for termination of interest rate hedge Proceeds from exercise of stock options and employee stock purchases Dividends
117,163 62,778 57,850
(16,495) 2,695,350
(2,700,350) 20,000
(20,000) -
(75) 2,073
(4,210)
168,025 19,807 64,850 46,812
884,000 (933,548)
30,000 - - -
2,027 (3,705)
135,755 (33,542)
(6,400) 70,893
659,628 (595,640)
20,000 -
(200) -
1,097 (3,006)
Net cash provided by fi nancing activities 214,084 278,268 248,585
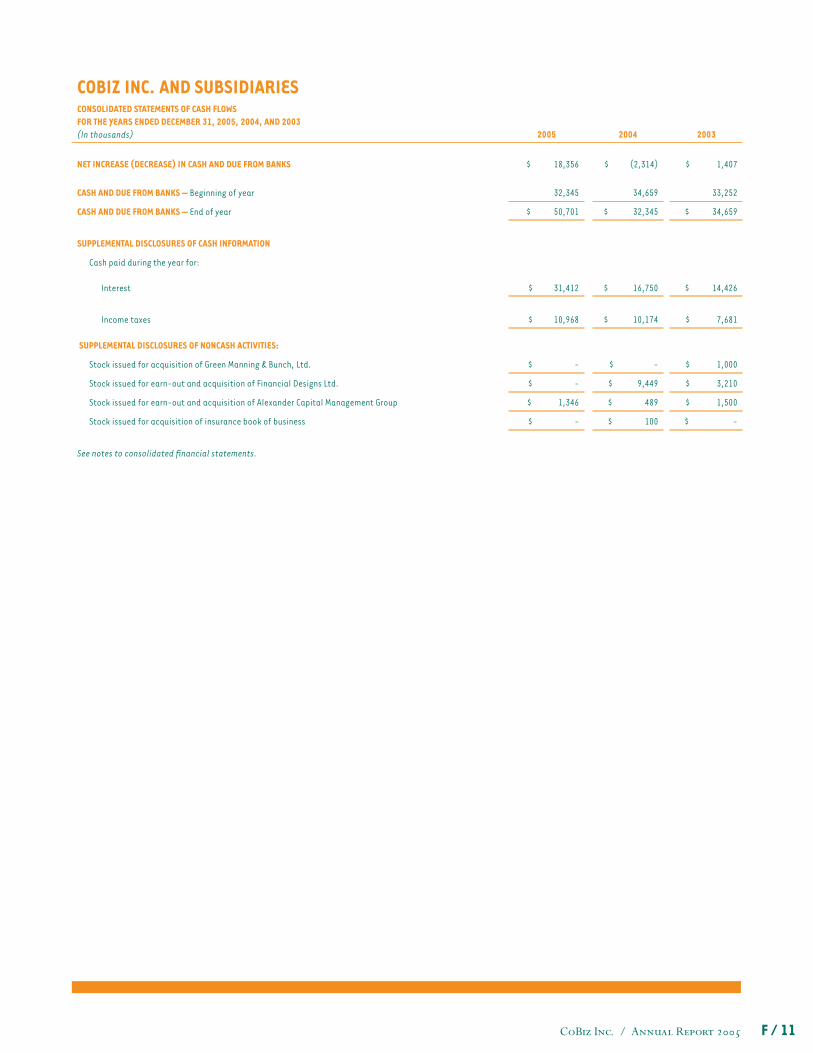
CoBiz Inc. / Annual Report 2005 F / 11
COBIZ INC. AND SUBSIDIARIESCONSOLIDATED STATEMENTS OF CASH FLOWSFOR THE YEARS ENDED DECEMBER 31, 2005, 2004, AND 2003 (In thousands) 2005 2004 2003
NET INCREASE (DECREASE) IN CASH AND DUE FROM BANKS $ 18,356 $ (2,314) $ 1,407
CASH AND DUE FROM BANKS — Beginning of year 32,345 34,659 33,252
CASH AND DUE FROM BANKS — End of year $ 50,701 $ 32,345 $ 34,659
SUPPLEMENTAL DISCLOSURES OF CASH INFORMATION
Cash paid during the year for:
Interest
$ 31,412
$ 16,750
$ 14,426
Income taxes $ 10,968 $ 10,174 $ 7,681
SUPPLEMENTAL DISCLOSURES OF NONCASH ACTIVITIES:
Stock issued for acquisition of Green Manning & Bunch, Ltd. $ - $ - $ 1,000
Stock issued for earn-out and acquisition of Financial Designs Ltd. $ - $ 9,449 $ 3,210
Stock issued for earn-out and acquisition of Alexander Capital Management Group $ 1,346 $ 489 $ 1,500
Stock issued for acquisition of insurance book of business $ - $ 100 $ -
See notes to consolidated fi nancial statements.
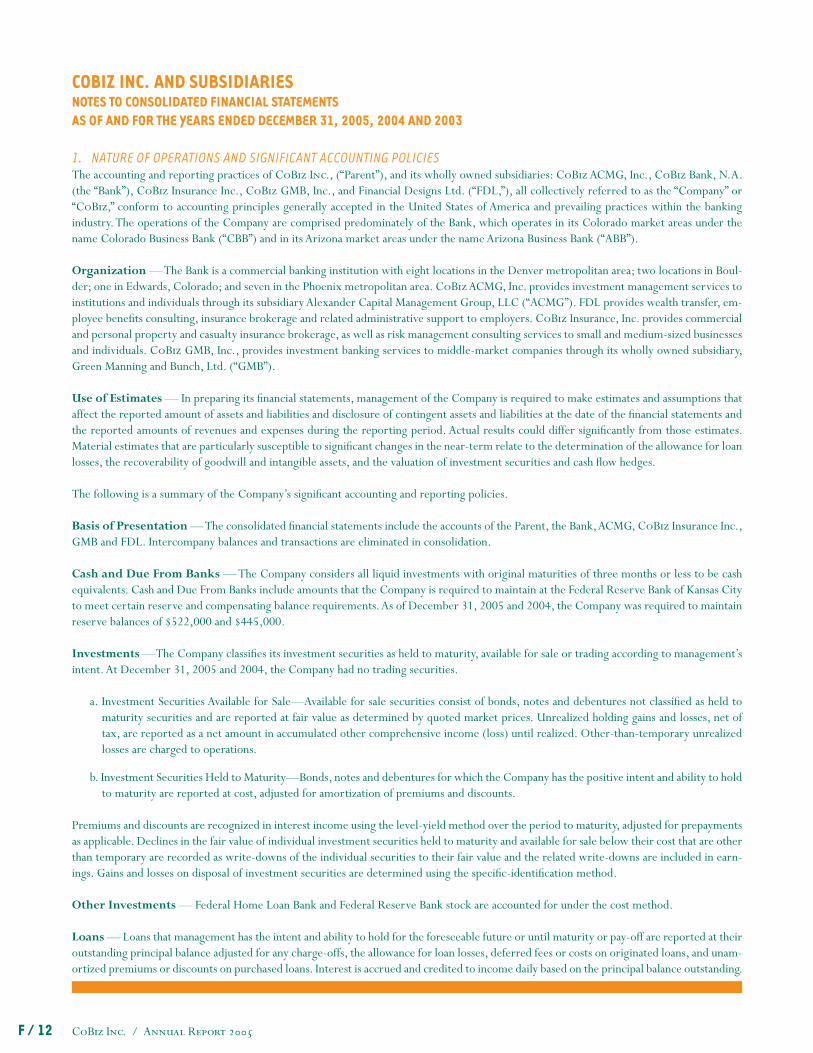
CoBiz Inc. / Annual Report 2005F / 12
COBIZ INC. AND SUBSIDIARIESNOTES TO CONSOLIDATED FINANCIAL STATEMENTSAS OF AND FOR THE YEARS ENDED DECEMBER 31, 2005, 2004 AND 2003
1. NATURE OF OPERATIONS AND SIGNIFICANT ACCOUNTING POLICIESThe accounting and reporting practices of CoBiz Inc., (“Parent”), and its wholly owned subsidiaries: CoBiz ACMG, Inc., CoBiz Bank, N.A. (the “Bank”), CoBiz Insurance Inc., CoBiz GMB, Inc., and Financial Designs Ltd. (“FDL,”), all collectively referred to as the “Company” or “CoBiz,” conform to accounting principles generally accepted in the United States of America and prevailing practices within the banking industry. The operations of the Company are comprised predominately of the Bank, which operates in its Colorado market areas under the name Colorado Business Bank (“CBB”) and in its Arizona market areas under the name Arizona Business Bank (“ABB”).
Organization — The Bank is a commercial banking institution with eight locations in the Denver metropolitan area; two locations in Boul-der; one in Edwards, Colorado; and seven in the Phoenix metropolitan area. CoBiz ACMG, Inc. provides investment management services to institutions and individuals through its subsidiary Alexander Capital Management Group, LLC (“ACMG”). FDL provides wealth transfer, em-ployee benefi ts consulting, insurance brokerage and related administrative support to employers. CoBiz Insurance, Inc. provides commercial and personal property and casualty insurance brokerage, as well as risk management consulting services to small and medium-sized businesses and individuals. CoBiz GMB, Inc., provides investment banking services to middle-market companies through its wholly owned subsidiary, Green Manning and Bunch, Ltd. (“GMB”).
Use of Estimates — In preparing its fi nancial statements, management of the Company is required to make estimates and assumptions that affect the reported amount of assets and liabilities and disclosure of contingent assets and liabilities at the date of the fi nancial statements and the reported amounts of revenues and expenses during the reporting period. Actual results could differ signifi cantly from those estimates. Material estimates that are particularly susceptible to signifi cant changes in the near-term relate to the determination of the allowance for loan losses, the recoverability of goodwill and intangible assets, and the valuation of investment securities and cash fl ow hedges.
The following is a summary of the Company’s signifi cant accounting and reporting policies.
Basis of Presentation — The consolidated fi nancial statements include the accounts of the Parent, the Bank, ACMG, CoBiz Insurance Inc., GMB and FDL. Intercompany balances and transactions are eliminated in consolidation.
Cash and Due From Banks — The Company considers all liquid investments with original maturities of three months or less to be cash equivalents. Cash and Due From Banks include amounts that the Company is required to maintain at the Federal Reserve Bank of Kansas City to meet certain reserve and compensating balance requirements. As of December 31, 2005 and 2004, the Company was required to maintain reserve balances of $522,000 and $445,000.
Investments —The Company classifi es its investment securities as held to maturity, available for sale or trading according to management’s intent. At December 31, 2005 and 2004, the Company had no trading securities.
a. Investment Securities Available for Sale—Available for sale securities consist of bonds, notes and debentures not classifi ed as held to maturity securities and are reported at fair value as determined by quoted market prices. Unrealized holding gains and losses, net of tax, are reported as a net amount in accumulated other comprehensive income (loss) until realized. Other-than-temporary unrealized losses are charged to operations.
b. Investment Securities Held to Maturity—Bonds, notes and debentures for which the Company has the positive intent and ability to hold to maturity are reported at cost, adjusted for amortization of premiums and discounts.
Premiums and discounts are recognized in interest income using the level-yield method over the period to maturity, adjusted for prepayments as applicable. Declines in the fair value of individual investment securities held to maturity and available for sale below their cost that are other than temporary are recorded as write-downs of the individual securities to their fair value and the related write-downs are included in earn-ings. Gains and losses on disposal of investment securities are determined using the specifi c-identifi cation method.
Other Investments — Federal Home Loan Bank and Federal Reserve Bank stock are accounted for under the cost method.
Loans — Loans that management has the intent and ability to hold for the foreseeable future or until maturity or pay-off are reported at their outstanding principal balance adjusted for any charge-offs, the allowance for loan losses, deferred fees or costs on originated loans, and unam-ortized premiums or discounts on purchased loans. Interest is accrued and credited to income daily based on the principal balance outstanding.
CoBiz Inc. / Annual Report 2005 F / 13
The accrual of interest income is generally discontinued when a loan becomes 90 days past due as to principal and interest. When a loan is designated as nonaccrual, the current period’s accrued interest receivable is charged against current earnings while any portions applicable to prior periods are charged against the allowance for loan losses. Interest payments received on nonaccrual loans are applied to the principal balance of the loan. Management may elect to continue the accrual of interest when the loan is in the process of collection and the realizable value of collateral is suffi cient to cover the principal balance and accrued interest.
Loan Origination Fees and Costs — Loan fees and certain costs of originating loans are deferred and the net amount is amortized over the contractual life of the related loans in accordance with Statement of Financial Accounting Standards (“SFAS”) No. 91 Accounting for Nonre-fundable Fees and Costs Associated with Originating or Acquiring Loans and Initial Direct Costs of Leases.
Allowance for Loan Losses — The allowance for loan losses is established as losses are estimated to have occurred through a provision for loan losses charged to earnings. Loan losses are charged against the allowance when management believes the uncollectibility of a loan balance is confi rmed. Subsequent recoveries, if any, are credited to the allowance.
The allowance for loan losses is evaluated on a regular basis by management and is based upon management’s periodic review of the collectibil-ity of the loans in light of historical experience, the nature and volume of the loan portfolio, adverse situations that may affect the borrower’s ability to repay, estimated value of any underlying collateral, and prevailing economic conditions. This evaluation is inherently subjective as it requires estimates that are susceptible to signifi cant revision as new information becomes available.
Impaired loans, with the exception of groups of smaller-balance homogenous loans that are collectively evaluated for impairment, are de-fi ned as loans for which, based on current information and events, it is probable that the Company will be unable to collect the scheduled payments of principal or interest when due according to the contractual terms of the loan agreement. Factors considered by management in determining impairment include payment status, collateral value, and the probability of collecting scheduled principal and interest payments when due. Loans that experience insignifi cant payment delays and payment shortfalls generally are not classifi ed as impaired. Management determines the signifi cance of payment delays and payment shortfalls on a case-by-case basis, taking into consideration all of the circumstances surrounding the loan and the borrower, including the length of the delay, the reasons for the delay, the borrower’s prior payment record, and the amount of the shortfall in relation to the principal and interest owed. Impairment is measured on a loan-by-loan basis by the present value of expected future cash fl ows discounted at the loan’s effective interest rate, the loan’s obtainable market price or the fair value of the collateral if the loan is collateral dependent.
Goodwill and Intangible Assets — Goodwill represents the excess purchase price over the fair value of net identifi able assets acquired in business combinations. Goodwill is not amortized but is reviewed for impairment at least annually. Intangible assets, primarily consisting of customer contracts and relationships, are being amortized by the straight-line method over 3–15 years.
Premises and Equipment — Premises and equipment are stated at cost less accumulated depreciation and amortization, which is calculat-ed by the straight-line method over the estimated useful lives of three to fi ve years. Leasehold improvements are capitalized and amortized us-ing the straight-line method over the terms of the respective leases or the estimated useful lives of the improvements, whichever is shorter.
Bank-Owned Life Insurance (“BOLI”) — The Bank invested in Bank-Owned Life Insurance policies to fund certain future employee benefi t costs and are recorded at net realizable value. Changes in the cash surrender value are recorded in the Consolidated Statements of Income under the caption “Other Income.”
Other Assets — Included in other assets are certain investments where the Company has the ability to exercise signifi cant infl uence or has ownership between 20% and 50% that are accounted for under the equity method.
Foreclosed Assets — Assets acquired through, or in lieu of, loan foreclosures are held for sale and initially recorded at the lower of carrying amount or estimated fair value at the date of foreclosure, establishing a new cost basis. Subsequent to foreclosure, valuations are periodically performed by management and the assets are carried at the lower of carrying amount or fair value less costs to sell. There were no foreclosed assets at December 31, 2005. As of December 31, 2004, $38,000 of foreclosed assets were held by the Company. Such amounts are included in the Consolidated Balance Sheets under the caption “Other.”
Real Estate Acquired Through Foreclosure — Assets acquired by foreclosure or in settlement of debt held for sale, and are valued at the lower of carrying amount or estimated fair value as of the date of foreclosure, and a related valuation allowance is provided for estimated costs to sell the assets. Management periodically evaluates the value of foreclosed assets held for sale and increases the valuation allowance for any subsequent declines in fair value less selling costs. Subsequent declines in value are charged to operations. As of December 31, 2005 and 2004, there was no real estate acquired through foreclosure.
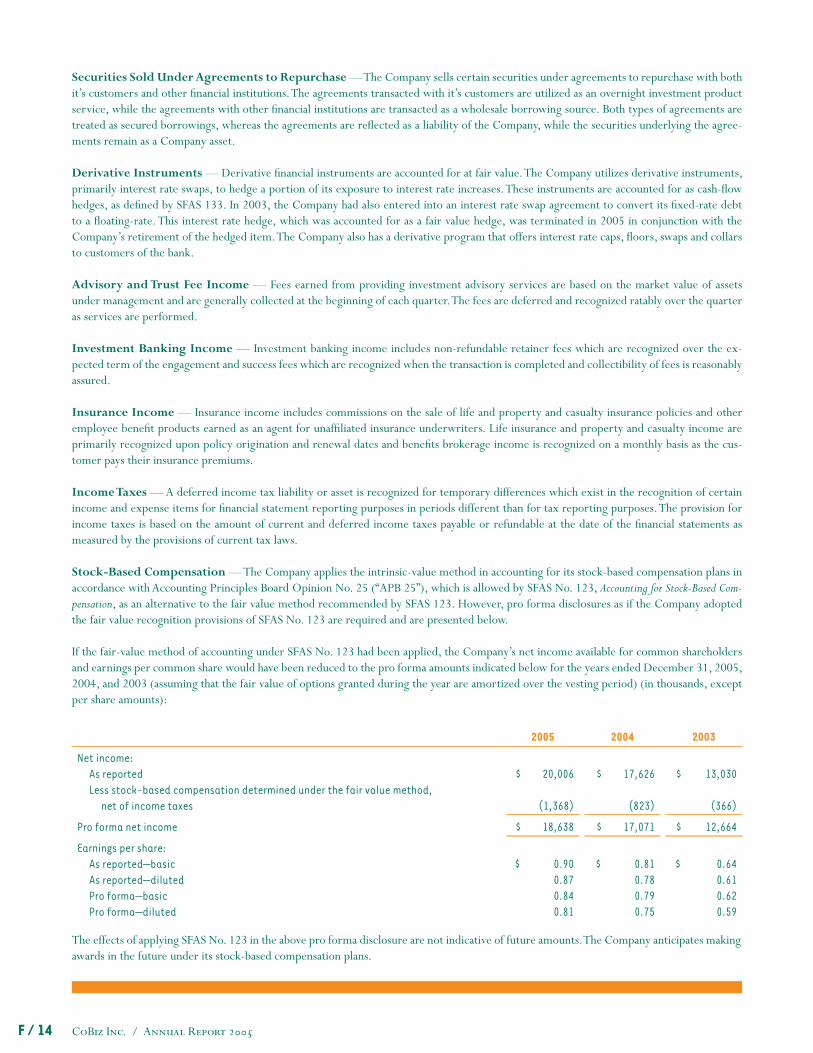
CoBiz Inc. / Annual Report 2005F / 14
Securities Sold Under Agreements to Repurchase — The Company sells certain securities under agreements to repurchase with both it’s customers and other fi nancial institutions. The agreements transacted with it’s customers are utilized as an overnight investment product service, while the agreements with other fi nancial institutions are transacted as a wholesale borrowing source. Both types of agreements are treated as secured borrowings, whereas the agreements are refl ected as a liability of the Company, while the securities underlying the agree-ments remain as a Company asset.
Derivative Instruments — Derivative fi nancial instruments are accounted for at fair value. The Company utilizes derivative instruments, primarily interest rate swaps, to hedge a portion of its exposure to interest rate increases. These instruments are accounted for as cash-fl ow hedges, as defi ned by SFAS 133. In 2003, the Company had also entered into an interest rate swap agreement to convert its fi xed-rate debt to a fl oating-rate. This interest rate hedge, which was accounted for as a fair value hedge, was terminated in 2005 in conjunction with the Company’s retirement of the hedged item. The Company also has a derivative program that offers interest rate caps, fl oors, swaps and collars to customers of the bank.
Advisory and Trust Fee Income — Fees earned from providing investment advisory services are based on the market value of assets under management and are generally collected at the beginning of each quarter. The fees are deferred and recognized ratably over the quarter as services are performed.
Investment Banking Income — Investment banking income includes non-refundable retainer fees which are recognized over the ex-pected term of the engagement and success fees which are recognized when the transaction is completed and collectibility of fees is reasonably assured.
Insurance Income — Insurance income includes commissions on the sale of life and property and casualty insurance policies and other employee benefi t products earned as an agent for unaffi liated insurance underwriters. Life insurance and property and casualty income are primarily recognized upon policy origination and renewal dates and benefi ts brokerage income is recognized on a monthly basis as the cus-tomer pays their insurance premiums.
Income Taxes — A deferred income tax liability or asset is recognized for temporary differences which exist in the recognition of certain income and expense items for fi nancial statement reporting purposes in periods different than for tax reporting purposes. The provision for income taxes is based on the amount of current and deferred income taxes payable or refundable at the date of the fi nancial statements as measured by the provisions of current tax laws.
Stock-Based Compensation — The Company applies the intrinsic-value method in accounting for its stock-based compensation plans in accordance with Accounting Principles Board Opinion No. 25 (“APB 25”), which is allowed by SFAS No. 123, Accounting for Stock-Based Com-pensation, as an alternative to the fair value method recommended by SFAS 123. However, pro forma disclosures as if the Company adopted the fair value recognition provisions of SFAS No. 123 are required and are presented below.
If the fair-value method of accounting under SFAS No. 123 had been applied, the Company’s net income available for common shareholders and earnings per common share would have been reduced to the pro forma amounts indicated below for the years ended December 31, 2005, 2004, and 2003 (assuming that the fair value of options granted during the year are amortized over the vesting period) (in thousands, except per share amounts):
The effects of applying SFAS No. 123 in the above pro forma disclosure are not indicative of future amounts. The Company anticipates making awards in the future under its stock-based compensation plans.
2005 2004 2003
Net income: As reportedLess stock-based compensation determined under the fair value method,
net of income taxes
$ 20,006
(1,368)
$ 17,626
(823)
$ 13,030
(366)
Pro forma net income $ 18,638 $ 17,071 $ 12,664
Earnings per share:As reported—basicAs reported—dilutedPro forma—basicPro forma—diluted
$ 0.90
0.87 0.84 0.81
$ 0.81 0.78 0.79 0.75
$ 0.64
0.61 0.62 0.59
CoBiz Inc. / Annual Report 2005 F / 15
Earnings Per Share — Basic earnings per share is based on net income divided by the weighted average number of common shares out-standing during the period. The weighted average number of shares outstanding used to compute diluted earnings per share include the number of additional common shares that would be outstanding if the potential dilutive common shares and common share equivalents had been issued at the beginning of the period.
Segment Information — The Company has disclosed separately the results of operations relating to its segments in Note 19 to the con-solidated fi nancial statements.
Reclassifi cations — Certain reclassifi cations have been made to the 2004 and 2003 fi nancial statements to conform to the 2005 presentation.
Recent Accounting Pronouncements — In December 2004, the Financial Accounting Standards Board (“FASB”) issued SFAS No. 123 (revised 2004), Share-Based Payment. SFAS 123(R) requires that the compensation cost relating to share-based payment transactions, including grants of employee stock options, be recognized in fi nancial statements. That cost will be measured based on the fair value of the equity or liability instruments issued. SFAS 123(R) covers a wide range of share-based compensation arrangements including stock options, restricted share plans, performance-based awards, share appreciation rights, and employee stock purchase plans.
SFAS 123(R) specifi es that the fair value of an employee stock option must be based on an observable market price of an option with the same or similar terms and conditions if one is available or, if an observable market price is not available, the fair value must be estimated using a valuation technique that (1) is applied in a manner consistent with the fair value measurement objective and the other requirements of the Statement, (2) is based on established principles of fi nancial economic theory and generally applied to that fi eld, and (3) refl ects all substan-tive characteristics of the instrument. SFAS 123(R) permits entities to use any option-pricing model that meets the fair value objective in the Statement.
In March 2005, the SEC issued Staff Accounting Bulletin No. 107, “TOPIC 14: Share-Based Payment” (“SAB 107”) which was effective imme-diately. SAB 107 addresses the interaction between SFAS 123(R) and certain SEC rules and regulations and provides views regarding the valuation of share-based payment arrangements for public companies. The Company does not expect the requirements of SAB 107 to have a material impact on its consolidated fi nancial statements.
In April 2005, the SEC amended Rule 4-01(a) of Regulation S-X regarding the compliance date for SFAS 123(R). The amendment postpones the effective date for the Company to January 1, 2006. As of the effective date, the Company will apply SFAS 123(R) using a modifi ed ver-sion of prospective application. Under that transition method, compensation cost is recognized for (1) all awards granted after the required effective date and to awards modifi ed, cancelled, or repurchased after that date and (2) the portion of prior awards for which the requisite service has not yet been rendered, based on the grant-date fair value of those awards calculated for either recognition or pro forma disclosures under SFAS 123. Currently, the Company offers several stock option plans and an employee stock purchase plan that will be impacted by this Statement.
Based on the non-vested stock-based compensation awards outstanding as of December 31, 2005, the Company estimates the quantitative impact of SFAS 123(R) on a pre-tax basis will be $749,000 in 2006. The future impact of SFAS 123(R) will depend upon various factors, among them being the Company’s issuance of additional stock-based compensation awards, cancellations and modifi cations of existing awards, and the cost of the Company’s Employee Stock Purchase Plan which is dependent on the Company’s stock price and employee participation.
In May 2005, the FASB issued SFAS No. 154, Accounting Changes and Error Corrections – A Replacement of APB No. 20 and FASB Statement No. 3. SFAS No. 154 establishes, unless impractible, retrospective application as the required method for reporting a change in accounting principle. SFAS 154 carried forward the guidance contained in APB Opinion 20 for reporting the correction of an error in previously issued fi nancial statements and a change in accounting estimate. SFAS 154 is effective for accounting changes and error corrections made in fi scal years begin-ning after December 15, 2005. The Company does not expect the requirements of SFAS No. 154 to have a material impact on its consolidated fi nancial statements.
In November 2005, the FASB issued FSP FAS 115-1 and FAS 124-1, The Meaning of Other-Than-Temporary Impairment and Its Application to Cer-tain Investments (“FSP 115-1 and 124-1”), which clarifi es when an investment is considered impaired, whether the impairment is other than temporary, and the measurement of an impairment loss. It also includes accounting considerations subsequent to the recognition of an other-than-temporary impairment and requires certain disclosures about unrealized losses that have not been recognized as other-than-temporary impairments. FSP 115-1 and 124-1 are effective for all reporting periods beginning after December 15, 2005. The Company does not expect the requirements of FSP 115-1 and 124-1 to have a material impact on its consolidated fi nancial statements.
CoBiz Inc. / Annual Report 2005F / 16
2. EARN-OUT ARRANGEMENTSGeneral — Earn-out payments for the GMB, ACMG and FDL transactions are treated as additional costs of the acquisitions and recorded as goodwill in accordance with EITF 95-08 “Accounting for Contingent Consideration Paid to the Shareholders of an Acquired Enterprise in a Purchase Business Combination.” Goodwill arising from these transactions is allocated between the operating segments expected to benefi t from the ac-quisitions. See Note 6 “Goodwill and Intangible Assets” for the amount of goodwill allocated to each operating segment.
Green Manning and Bunch, Ltd. — On July 10, 2001, the Company acquired GMB, an investment banking fi rm based in Denver, Colo-rado. In the acquisition: (i) the corporate general partner of GMB was merged into CoBiz GMB, Inc., with the shareholders of the general partner receiving a combination of cash, shares of CoBiz common stock, and the right to receive future earn-out payments; and (ii) CoBiz GMB, Inc. acquired all of the limited partnership interests of GMB in exchange for cash, shares of CoBiz GMB, Inc. Class B Common Stock (the “CoBiz GMB, Inc. Shares”), and the right to receive future earn-out payments for the fi scal years 2001 through 2005. Pursuant to the merger agreement, the earn-out payments for each of the years 2002 through 2005 shall equal a percentage of the excess of GMB’s earnings before interest, taxes, depreciation, and amortization as defi ned in the GMB merger agreement (“GMB EBITDA”) for the year over a set hurdle rate. The earn-out payments will be paid in cash to the former owners of GMB in proportion to their respective ownership immediately prior to the acquisition.
The merger agreement does not provide for a minimum earn-out, nor does it cap the total amount that may be paid. No earn-out payments were required for the years 2001 through 2003 because GMB EBITDA did not exceed the hurdle rate in those years. For the earn-out period ending December 31, 2004, the Company paid $1,136,000 based on GMB EBITDA of $3,373,000, which was paid in the fi rst quarter of 2005. No earn-out payment was required for the year 2005 because GMB EBITDA did not exceed the hurdle rate.
Alexander Capital Management Group, LLC — On April 1, 2003, the Company acquired ACMG, an SEC-registered investment advisory fi rm based in Denver, Colorado. The acquisition was accounted for using the purchase method of accounting, and accordingly, the results of ACMG’s operations have been included in the consolidated fi nancial statements since the date of purchase. The acquisition of ACMG was completed through a merger of ACMG into a wholly owned subsidiary that was formed in order to consummate the transaction and then a subsequent contribution of the assets and liabilities of the merged entity into a newly formed limited liability company called Alexander Capital Management Group, LLC.
The aggregate purchase price was $3,131,000, consisting of 160,830 shares of CoBiz Inc. common stock valued at $1,500,000; $1,277,000 in cash; $264,000 in net liabilities assumed; and $90,000 in direct acquisition costs (consisting primarily of external legal fees). Goodwill of $2,916,000, which is not expected to be deductible for tax purposes, was recorded as part of the purchase price allocation. Intangible assets consisting of customer account relationships, employment agreements and non-solicitation agreements totaling $346,000 were also recorded with an average useful life of 14 years.
The terms of the ACMG merger agreement provide for additional earn-out payments for each of the twelve months ended on March 31, 2004, 2005, and 2006 to be paid to the former shareholders of Alexander Capital Management Group, Inc. in proportion to their respective ownership immediately prior to the acquisition. All earn-out payments shall be made 40% in cash and 60% in CoBiz common stock.
The earn-out payment for the 12 months ended March 31, 2004, was equal to a multiple of ACMG’s earnings before interest, taxes, depre-ciation, and amortization as defi ned in the ACMG merger agreement (“ACMG EBITDA”). The earn-out payment for the 12 months ended March 31, 2005, was equal to a multiple of the excess of the ACMG EBITDA for 2005 over the ACMG EBITDA for 2004. The earn-out pay-ment for 2006 will be equal to a multiple of the excess, if any, of that year’s ACMG EBITDA over the ACMG EBITDA for the previous year. During 2004, the Company paid $815,000 for the earn-out period ended on March 31, 2004 based on ACMG EBITDA of $163,000. The payment consisted of $326,000 in cash and 36,988 shares of CoBiz stock valued at $489,000. During 2005, the Company paid $2,243,000 for the earn-out period ended on March 31, 2005, based on ACMG EBITDA of $611,000. The payment consisted of $897,000 in cash and 68,215 shares of CoBiz stock valued at $1,346,000. An earn-out payment will be due for the period ending March 31, 2006 only if the ACMG EBITDA for that period exceeds $611,000. At the end of the earn-out period, if the total earn-out payments are less than 2.08 times the total aggregate ACMG EBITDA during the three-year earn-out period, an additional earn-out payment will be made equal to such defi ciency. Management estimates that the 2006 earn-out payment, which is the fi nal year of the agreement, may range from $0 to $200,000.
In addition to the earn-out, the former shareholders of Alexander Capital Management Group, Inc. were issued 200,000 Profi ts Interest Units pursuant to a Unitholders’ Agreement, representing a 20% interest in the profi ts and losses of ACMG in periods following the acquisition (but no interest in the value of ACMG as of the date of the acquisition), which is refl ected in the accompanying consolidated balance sheets as a minority interest as a component of “Accrued interest and other liabilities” and is included in “Other” noninterest expense in the consolidated statements of income and comprehensive income. Unlike the earn-out payments, which are based on a multiple of earnings for a specifi ed pe-riod of time, the Profi ts Interest Units entitle the holders to share in the earnings of ACMG for as long as they are held. Pursuant to the terms
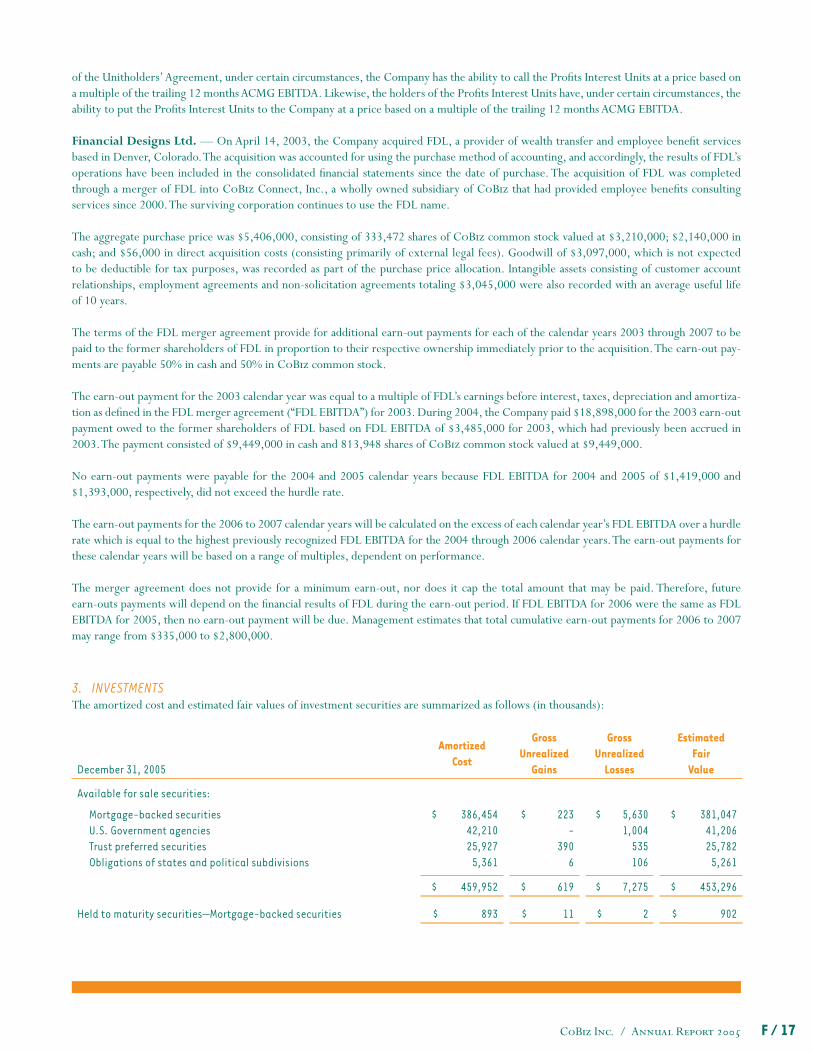
CoBiz Inc. / Annual Report 2005 F / 17
of the Unitholders’ Agreement, under certain circumstances, the Company has the ability to call the Profi ts Interest Units at a price based on a multiple of the trailing 12 months ACMG EBITDA. Likewise, the holders of the Profi ts Interest Units have, under certain circumstances, the ability to put the Profi ts Interest Units to the Company at a price based on a multiple of the trailing 12 months ACMG EBITDA.
Financial Designs Ltd. — On April 14, 2003, the Company acquired FDL, a provider of wealth transfer and employee benefi t services based in Denver, Colorado. The acquisition was accounted for using the purchase method of accounting, and accordingly, the results of FDL’s operations have been included in the consolidated fi nancial statements since the date of purchase. The acquisition of FDL was completed through a merger of FDL into CoBiz Connect, Inc., a wholly owned subsidiary of CoBiz that had provided employee benefi ts consulting services since 2000. The surviving corporation continues to use the FDL name.
The aggregate purchase price was $5,406,000, consisting of 333,472 shares of CoBiz common stock valued at $3,210,000; $2,140,000 in cash; and $56,000 in direct acquisition costs (consisting primarily of external legal fees). Goodwill of $3,097,000, which is not expected to be deductible for tax purposes, was recorded as part of the purchase price allocation. Intangible assets consisting of customer account relationships, employment agreements and non-solicitation agreements totaling $3,045,000 were also recorded with an average useful life of 10 years.
The terms of the FDL merger agreement provide for additional earn-out payments for each of the calendar years 2003 through 2007 to be paid to the former shareholders of FDL in proportion to their respective ownership immediately prior to the acquisition. The earn-out pay-ments are payable 50% in cash and 50% in CoBiz common stock.
The earn-out payment for the 2003 calendar year was equal to a multiple of FDL’s earnings before interest, taxes, depreciation and amortiza-tion as defi ned in the FDL merger agreement (“FDL EBITDA”) for 2003. During 2004, the Company paid $18,898,000 for the 2003 earn-out payment owed to the former shareholders of FDL based on FDL EBITDA of $3,485,000 for 2003, which had previously been accrued in 2003. The payment consisted of $9,449,000 in cash and 813,948 shares of CoBiz common stock valued at $9,449,000.
No earn-out payments were payable for the 2004 and 2005 calendar years because FDL EBITDA for 2004 and 2005 of $1,419,000 and $1,393,000, respectively, did not exceed the hurdle rate.
The earn-out payments for the 2006 to 2007 calendar years will be calculated on the excess of each calendar year’s FDL EBITDA over a hurdle rate which is equal to the highest previously recognized FDL EBITDA for the 2004 through 2006 calendar years. The earn-out payments for these calendar years will be based on a range of multiples, dependent on performance.
The merger agreement does not provide for a minimum earn-out, nor does it cap the total amount that may be paid. Therefore, future earn-outs payments will depend on the fi nancial results of FDL during the earn-out period. If FDL EBITDA for 2006 were the same as FDL EBITDA for 2005, then no earn-out payment will be due. Management estimates that total cumulative earn-out payments for 2006 to 2007 may range from $335,000 to $2,800,000.
3. INVESTMENTSThe amortized cost and estimated fair values of investment securities are summarized as follows (in thousands):
December 31, 2005
AmortizedCost
GrossUnrealized
Gains
GrossUnrealized
Losses
EstimatedFair
Value
Available for sale securities:
Mortgage-backed securitiesU.S. Government agenciesTrust preferred securitiesObligations of states and political subdivisions
$ 386,454 42,210 25,927
5,361
$ 223 -
390 6
$ 5,630 1,004
535 106
$ 381,047 41,206 25,782
5,261
$ 459,952 $ 619 $ 7,275 $ 453,296
Held to maturity securities—Mortgage-backed securities $ 893 $ 11 $ 2 $ 902
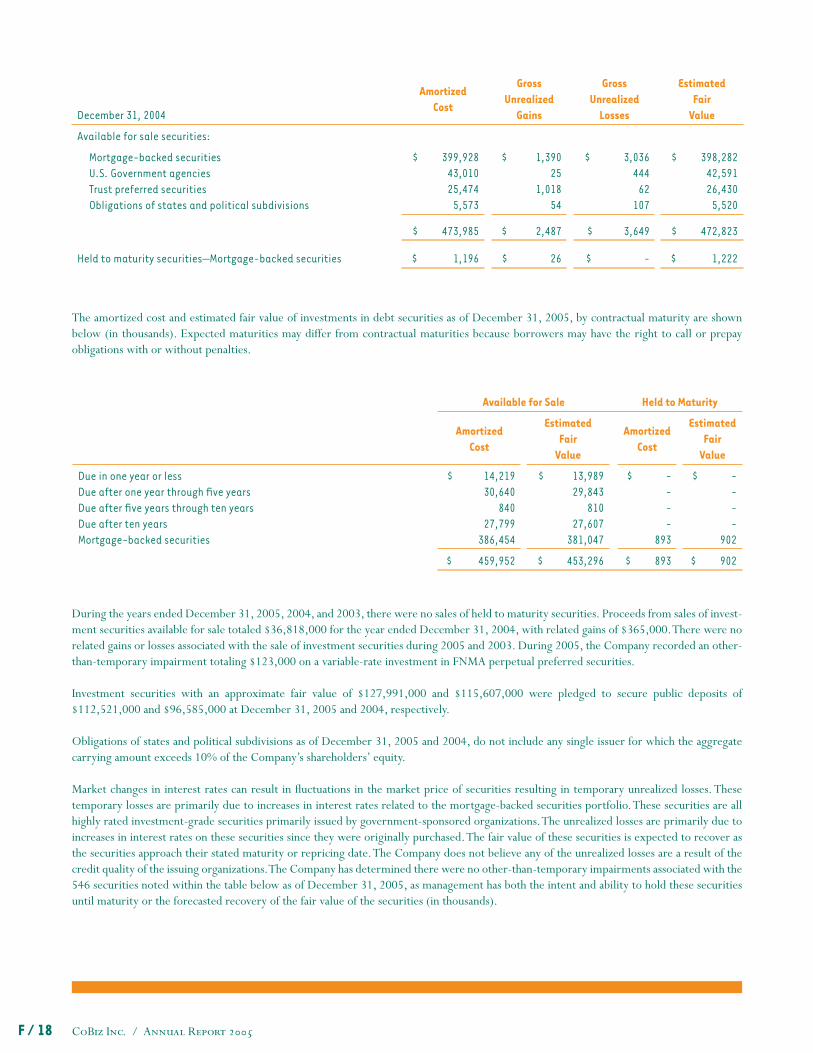
CoBiz Inc. / Annual Report 2005F / 18
December 31, 2004
AmortizedCost
GrossUnrealized
Gains
GrossUnrealized
Losses
EstimatedFair
Value
Available for sale securities:
Mortgage-backed securitiesU.S. Government agenciesTrust preferred securitiesObligations of states and political subdivisions
$ 399,928 43,010 25,474 5,573
$ 1,390 25
1,018 54
$ 3,036 444
62 107
$ 398,282 42,591 26,430
5,520
$ 473,985 $ 2,487 $ 3,649 $ 472,823
Held to maturity securities—Mortgage-backed securities $ 1,196 $ 26 $ - $ 1,222
The amortized cost and estimated fair value of investments in debt securities as of December 31, 2005, by contractual maturity are shown below (in thousands). Expected maturities may differ from contractual maturities because borrowers may have the right to call or prepay obligations with or without penalties.
During the years ended December 31, 2005, 2004, and 2003, there were no sales of held to maturity securities. Proceeds from sales of invest-ment securities available for sale totaled $36,818,000 for the year ended December 31, 2004, with related gains of $365,000. There were no related gains or losses associated with the sale of investment securities during 2005 and 2003. During 2005, the Company recorded an other-than-temporary impairment totaling $123,000 on a variable-rate investment in FNMA perpetual preferred securities.
Investment securities with an approximate fair value of $127,991,000 and $115,607,000 were pledged to secure public deposits of $112,521,000 and $96,585,000 at December 31, 2005 and 2004, respectively.
Obligations of states and political subdivisions as of December 31, 2005 and 2004, do not include any single issuer for which the aggregate carrying amount exceeds 10% of the Company’s shareholders’ equity.
Market changes in interest rates can result in fl uctuations in the market price of securities resulting in temporary unrealized losses. These temporary losses are primarily due to increases in interest rates related to the mortgage-backed securities portfolio. These securities are all highly rated investment-grade securities primarily issued by government-sponsored organizations. The unrealized losses are primarily due to increases in interest rates on these securities since they were originally purchased. The fair value of these securities is expected to recover as the securities approach their stated maturity or repricing date. The Company does not believe any of the unrealized losses are a result of the credit quality of the issuing organizations. The Company has determined there were no other-than-temporary impairments associated with the 546 securities noted within the table below as of December 31, 2005, as management has both the intent and ability to hold these securities until maturity or the forecasted recovery of the fair value of the securities (in thousands).
Available for Sale Held to Maturity
AmortizedCost
EstimatedFair
Value
AmortizedCost
EstimatedFair
Value
Due in one year or lessDue after one year through fi ve yearsDue after fi ve years through ten yearsDue after ten yearsMortgage-backed securities
$ 14,219 30,640
840 27,799
386,454
$ 13,989 29,843
810 27,607
381,047
$ - - - -
893
$ - - - -
902
$ 459,952 $ 453,296 $ 893 $ 902
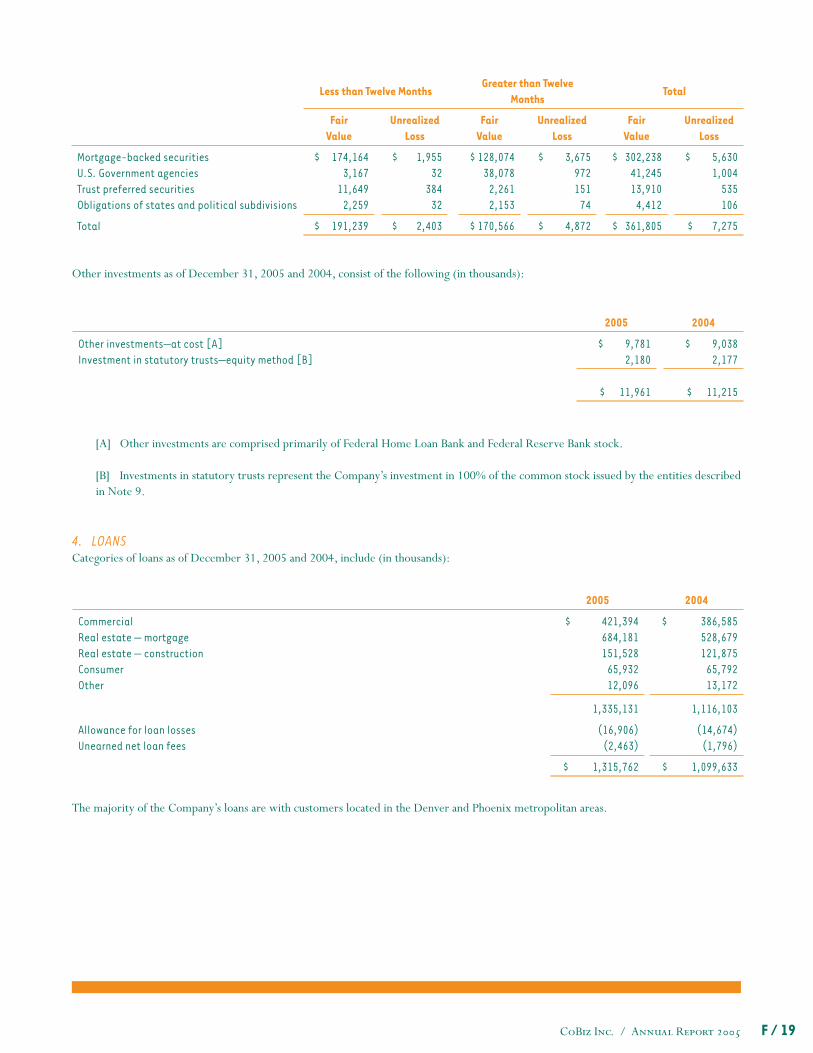
CoBiz Inc. / Annual Report 2005 F / 19
Other investments as of December 31, 2005 and 2004, consist of the following (in thousands):
Less than Twelve Months
Greater than Twelve Months
Total
Fair Value
UnrealizedLoss
FairValue
UnrealizedLoss
FairValue
UnrealizedLoss
Mortgage-backed securitiesU.S. Government agenciesTrust preferred securitiesObligations of states and political subdivisions
$ 174,164 3,167
11,649 2,259
$ 1,955 32
384 32
$ 128,074 38,078
2,261 2,153
$ 3,675 972 151
74
$ 302,238 41,245 13,910
4,412
$ 5,630 1,004
535 106
Total $ 191,239 $ 2,403 $ 170,566 $ 4,872 $ 361,805 $ 7,275
2005 2004
Other investments—at cost [A]Investment in statutory trusts—equity method [B]
$ 9,781 2,180
$ 9,038 2,177
$ 11,961 $ 11,215
[A] Other investments are comprised primarily of Federal Home Loan Bank and Federal Reserve Bank stock.
[B] Investments in statutory trusts represent the Company’s investment in 100% of the common stock issued by the entities described in Note 9.
4. LOANS Categories of loans as of December 31, 2005 and 2004, include (in thousands):
2005 2004
CommercialReal estate — mortgageReal estate — constructionConsumerOther
$ 421,394 684,181 151,528
65,932 12,096
$ 386,585 528,679 121,875
65,792 13,172
1,335,131 1,116,103
Allowance for loan lossesUnearned net loan fees
(16,906) (2,463)
(14,674) (1,796)
$ 1,315,762 $ 1,099,633
The majority of the Company’s loans are with customers located in the Denver and Phoenix metropolitan areas.
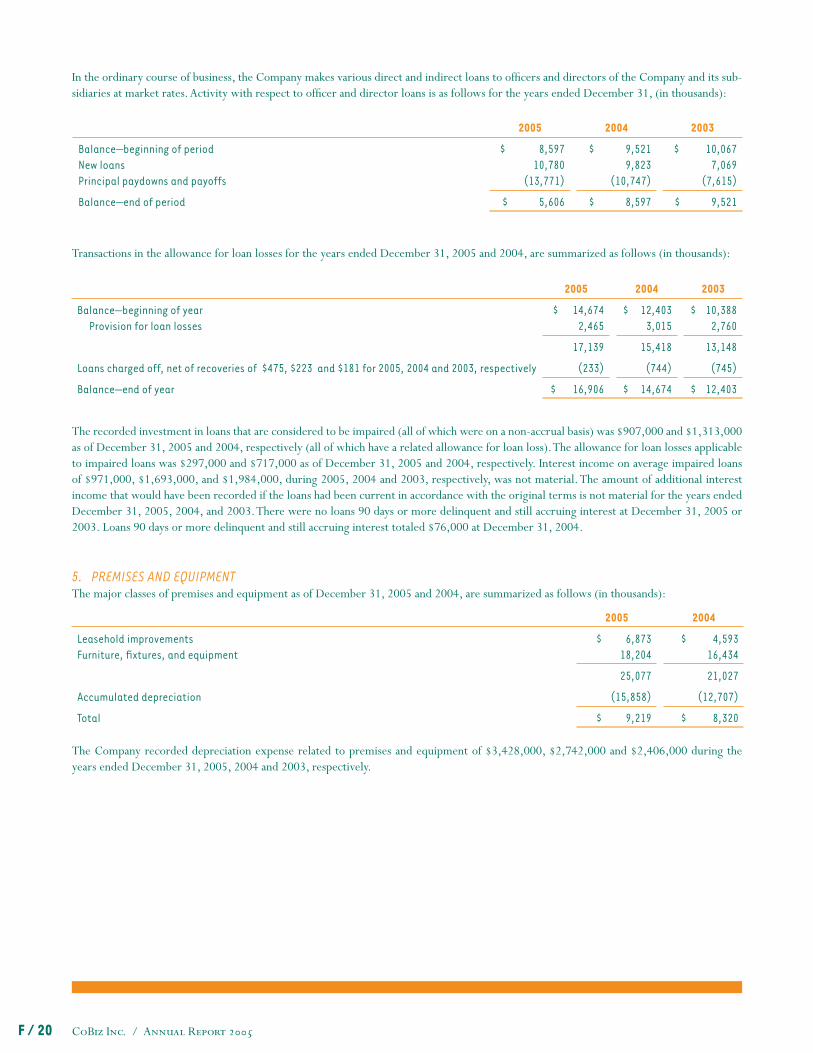
CoBiz Inc. / Annual Report 2005F / 20
In the ordinary course of business, the Company makes various direct and indirect loans to offi cers and directors of the Company and its sub-sidiaries at market rates. Activity with respect to offi cer and director loans is as follows for the years ended December 31, (in thousands):
2005 2004 2003
Balance—beginning of periodNew loansPrincipal paydowns and payoffs
$ 8,597 10,780
(13,771)
$ 9,521 9,823
(10,747)
$ 10,067 7,069
(7,615)
Balance—end of period $ 5,606 $ 8,597 $ 9,521
2005 2004 2003
Balance—beginning of yearProvision for loan losses
$ 14,674 2,465
$ 12,403 3,015
$ 10,388 2,760
17,139 15,418 13,148
Loans charged off, net of recoveries of $475, $223 and $181 for 2005, 2004 and 2003, respectively (233) (744) (745)
Balance—end of year $ 16,906 $ 14,674 $ 12,403
The recorded investment in loans that are considered to be impaired (all of which were on a non-accrual basis) was $907,000 and $1,313,000 as of December 31, 2005 and 2004, respectively (all of which have a related allowance for loan loss). The allowance for loan losses applicable to impaired loans was $297,000 and $717,000 as of December 31, 2005 and 2004, respectively. Interest income on average impaired loans of $971,000, $1,693,000, and $1,984,000, during 2005, 2004 and 2003, respectively, was not material. The amount of additional interest income that would have been recorded if the loans had been current in accordance with the original terms is not material for the years ended December 31, 2005, 2004, and 2003. There were no loans 90 days or more delinquent and still accruing interest at December 31, 2005 or 2003. Loans 90 days or more delinquent and still accruing interest totaled $76,000 at December 31, 2004.
5. PREMISES AND EQUIPMENTThe major classes of premises and equipment as of December 31, 2005 and 2004, are summarized as follows (in thousands):
2005 2004
Leasehold improvementsFurniture, fi xtures, and equipment
$ 6,873 18,204
$ 4,593 16,434
25,077 21,027
Accumulated depreciation (15,858) (12,707)
Total $ 9,219 $ 8,320 The Company recorded depreciation expense related to premises and equipment of $3,428,000, $2,742,000 and $2,406,000 during the years ended December 31, 2005, 2004 and 2003, respectively.
Transactions in the allowance for loan losses for the years ended December 31, 2005 and 2004, are summarized as follows (in thousands):
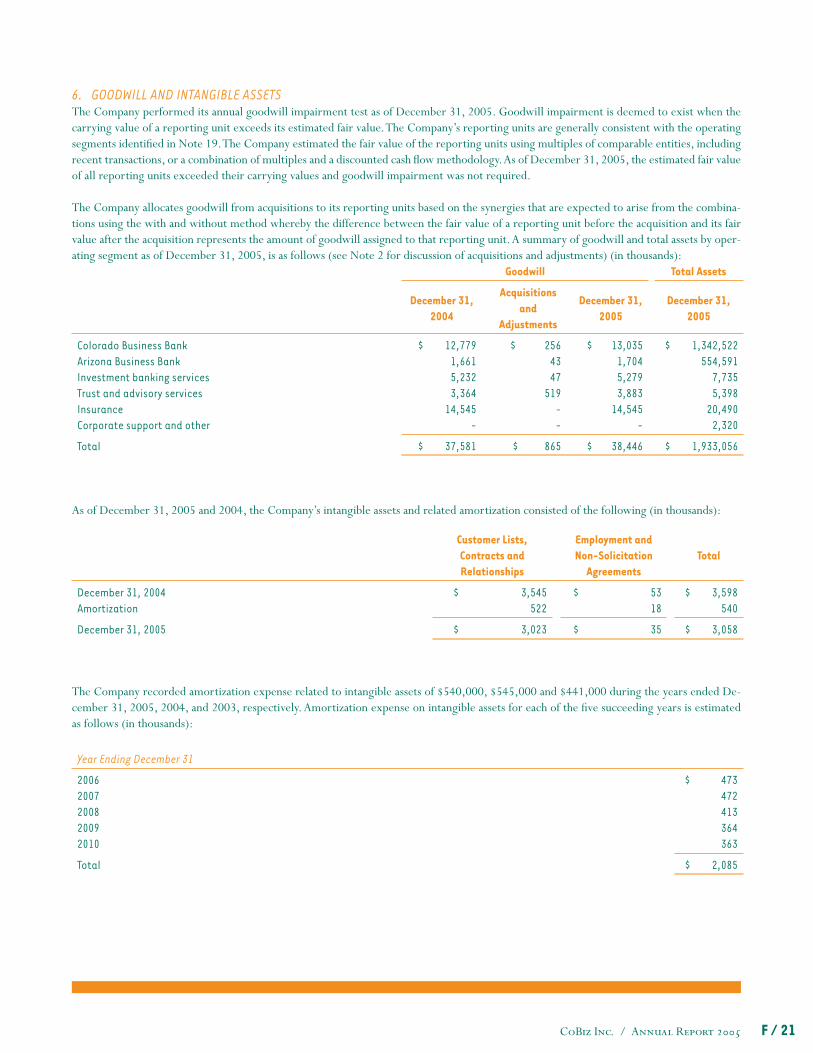
CoBiz Inc. / Annual Report 2005 F / 21
6. GOODWILL AND INTANGIBLE ASSETSThe Company performed its annual goodwill impairment test as of December 31, 2005. Goodwill impairment is deemed to exist when the carrying value of a reporting unit exceeds its estimated fair value. The Company’s reporting units are generally consistent with the operating segments identifi ed in Note 19. The Company estimated the fair value of the reporting units using multiples of comparable entities, including recent transactions, or a combination of multiples and a discounted cash fl ow methodology. As of December 31, 2005, the estimated fair value of all reporting units exceeded their carrying values and goodwill impairment was not required.
The Company allocates goodwill from acquisitions to its reporting units based on the synergies that are expected to arise from the combina-tions using the with and without method whereby the difference between the fair value of a reporting unit before the acquisition and its fair value after the acquisition represents the amount of goodwill assigned to that reporting unit. A summary of goodwill and total assets by oper-ating segment as of December 31, 2005, is as follows (see Note 2 for discussion of acquisitions and adjustments) (in thousands):
Goodwill Total Assets
December 31,2004
Acquisitions and
Adjustments
December 31,2005
December 31,2005
Colorado Business BankArizona Business BankInvestment banking servicesTrust and advisory servicesInsuranceCorporate support and other
$ 12,779 1,661 5,232 3,364
14,545 -
$ 256 43 47
519 - -
$ 13,035 1,704 5,279 3,883
14,545 -
$ 1,342,522 554,591
7,735 5,398
20,490 2,320
Total $ 37,581 $ 865 $ 38,446 $ 1,933,056
As of December 31, 2005 and 2004, the Company’s intangible assets and related amortization consisted of the following (in thousands):
Customer Lists,Contracts andRelationships
Employment andNon-Solicitation
AgreementsTotal
December 31, 2004Amortization
$ 3,545 522
$ 53 18
$ 3,598 540
December 31, 2005 $ 3,023 $ 35 $ 3,058
The Company recorded amortization expense related to intangible assets of $540,000, $545,000 and $441,000 during the years ended De-cember 31, 2005, 2004, and 2003, respectively. Amortization expense on intangible assets for each of the fi ve succeeding years is estimated as follows (in thousands):
Year Ending December 31
20062007200820092010
$ 473 472 413 364 363
Total $ 2,085
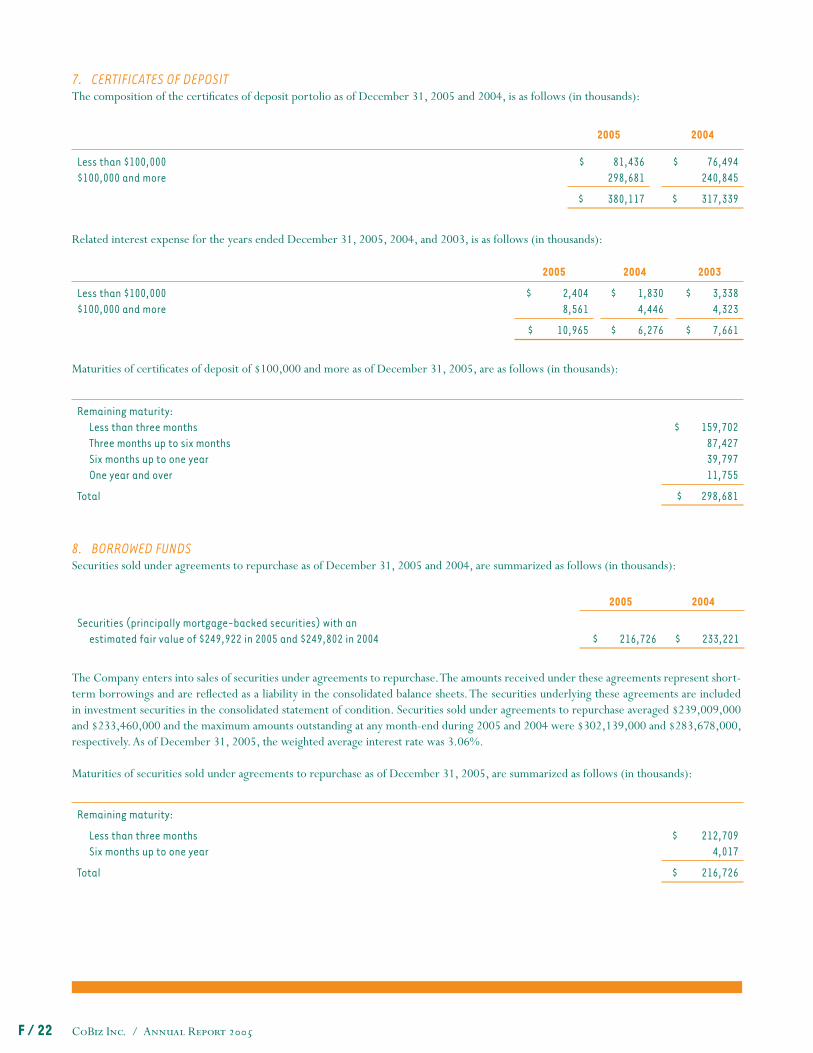
CoBiz Inc. / Annual Report 2005F / 22
7. CERTIFICATES OF DEPOSITThe composition of the certifi cates of deposit portolio as of December 31, 2005 and 2004, is as follows (in thousands):
2005 2004
Less than $100,000$100,000 and more
$ 81,436 298,681
$ 76,494 240,845
$ 380,117 $ 317,339
2005 2004 2003
Less than $100,000$100,000 and more
$ 2,404 8,561
$ 1,830 4,446
$ 3,338 4,323
$ 10,965 $ 6,276 $ 7,661
Remaining maturity:Less than three monthsThree months up to six monthsSix months up to one yearOne year and over
$ 159,702 87,427 39,797 11,755
Total $ 298,681
2005 2004
Securities (principally mortgage-backed securities) with an estimated fair value of $249,922 in 2005 and $249,802 in 2004 $ 216,726 $ 233,221
Related interest expense for the years ended December 31, 2005, 2004, and 2003, is as follows (in thousands):
Maturities of certifi cates of deposit of $100,000 and more as of December 31, 2005, are as follows (in thousands):
8. BORROWED FUNDSSecurities sold under agreements to repurchase as of December 31, 2005 and 2004, are summarized as follows (in thousands):
The Company enters into sales of securities under agreements to repurchase. The amounts received under these agreements represent short-term borrowings and are refl ected as a liability in the consolidated balance sheets. The securities underlying these agreements are included in investment securities in the consolidated statement of condition. Securities sold under agreements to repurchase averaged $239,009,000 and $233,460,000 and the maximum amounts outstanding at any month-end during 2005 and 2004 were $302,139,000 and $283,678,000, respectively. As of December 31, 2005, the weighted average interest rate was 3.06%.
Maturities of securities sold under agreements to repurchase as of December 31, 2005, are summarized as follows (in thousands):
Remaining maturity:
Less than three monthsSix months up to one year
$ 212,709 4,017
Total $ 216,726
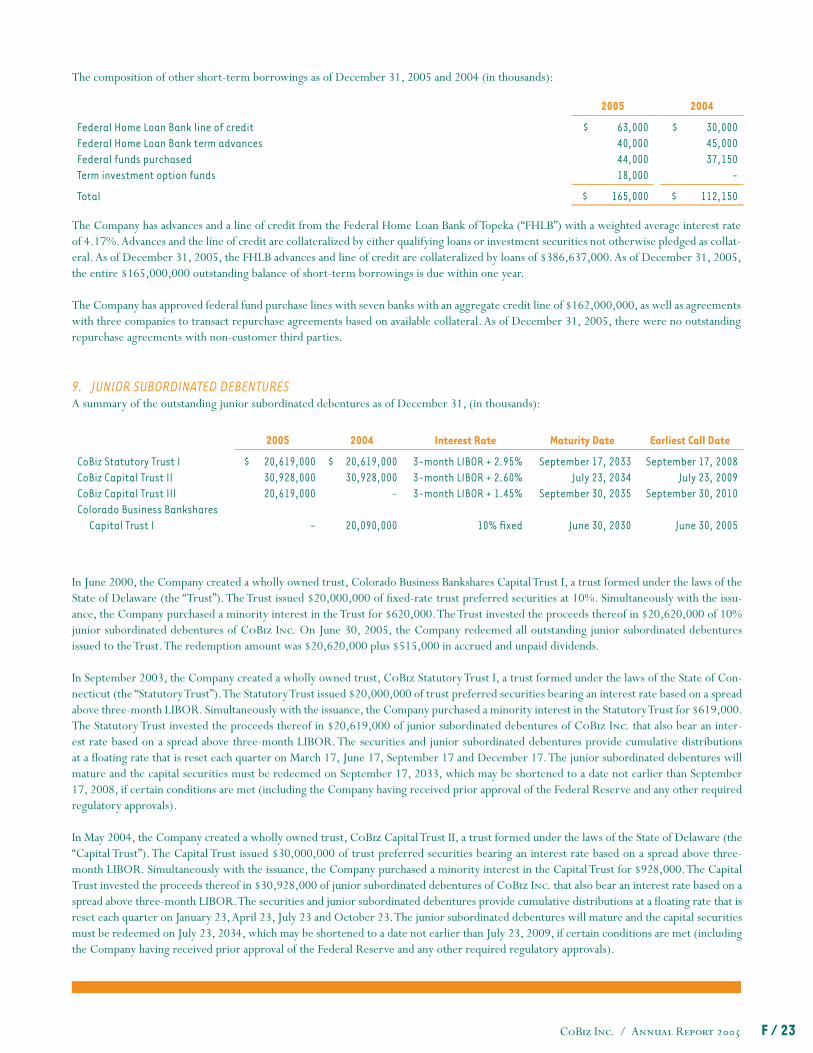
CoBiz Inc. / Annual Report 2005 F / 23
The composition of other short-term borrowings as of December 31, 2005 and 2004 (in thousands):
2005 2004
Federal Home Loan Bank line of creditFederal Home Loan Bank term advancesFederal funds purchasedTerm investment option funds
$ 63,000 40,000 44,000 18,000
$ 30,000 45,000 37,150
-
Total $ 165,000 $ 112,150
The Company has advances and a line of credit from the Federal Home Loan Bank of Topeka (“FHLB”) with a weighted average interest rate of 4.17%. Advances and the line of credit are collateralized by either qualifying loans or investment securities not otherwise pledged as collat-eral. As of December 31, 2005, the FHLB advances and line of credit are collateralized by loans of $386,637,000. As of December 31, 2005, the entire $165,000,000 outstanding balance of short-term borrowings is due within one year.
The Company has approved federal fund purchase lines with seven banks with an aggregate credit line of $162,000,000, as well as agreements with three companies to transact repurchase agreements based on available collateral. As of December 31, 2005, there were no outstanding repurchase agreements with non-customer third parties.
9. JUNIOR SUBORDINATED DEBENTURESA summary of the outstanding junior subordinated debentures as of December 31, (in thousands):
2005 2004 Interest Rate Maturity Date Earliest Call Date
CoBiz Statutory Trust ICoBiz Capital Trust IICoBiz Capital Trust IIIColorado Business Bankshares
Capital Trust I
$ 20,619,000 30,928,000 20,619,000
-
$ 20,619,000 30,928,000
-
20,090,000
3-month LIBOR + 2.95%3-month LIBOR + 2.60%3-month LIBOR + 1.45%
10% fi xed
September 17, 2033July 23, 2034
September 30, 2035
June 30, 2030
September 17, 2008July 23, 2009
September 30, 2010
June 30, 2005
In June 2000, the Company created a wholly owned trust, Colorado Business Bankshares Capital Trust I, a trust formed under the laws of the State of Delaware (the “Trust”). The Trust issued $20,000,000 of fi xed-rate trust preferred securities at 10%. Simultaneously with the issu-ance, the Company purchased a minority interest in the Trust for $620,000. The Trust invested the proceeds thereof in $20,620,000 of 10% junior subordinated debentures of CoBiz Inc. On June 30, 2005, the Company redeemed all outstanding junior subordinated debentures issued to the Trust. The redemption amount was $20,620,000 plus $515,000 in accrued and unpaid dividends.
In September 2003, the Company created a wholly owned trust, CoBiz Statutory Trust I, a trust formed under the laws of the State of Con-necticut (the “Statutory Trust”). The Statutory Trust issued $20,000,000 of trust preferred securities bearing an interest rate based on a spread above three-month LIBOR. Simultaneously with the issuance, the Company purchased a minority interest in the Statutory Trust for $619,000. The Statutory Trust invested the proceeds thereof in $20,619,000 of junior subordinated debentures of CoBiz Inc. that also bear an inter-est rate based on a spread above three-month LIBOR. The securities and junior subordinated debentures provide cumulative distributions at a fl oating rate that is reset each quarter on March 17, June 17, September 17 and December 17. The junior subordinated debentures will mature and the capital securities must be redeemed on September 17, 2033, which may be shortened to a date not earlier than September 17, 2008, if certain conditions are met (including the Company having received prior approval of the Federal Reserve and any other required regulatory approvals).
In May 2004, the Company created a wholly owned trust, CoBiz Capital Trust II, a trust formed under the laws of the State of Delaware (the “Capital Trust”). The Capital Trust issued $30,000,000 of trust preferred securities bearing an interest rate based on a spread above three-month LIBOR. Simultaneously with the issuance, the Company purchased a minority interest in the Capital Trust for $928,000. The Capital Trust invested the proceeds thereof in $30,928,000 of junior subordinated debentures of CoBiz Inc. that also bear an interest rate based on a spread above three-month LIBOR. The securities and junior subordinated debentures provide cumulative distributions at a fl oating rate that is reset each quarter on January 23, April 23, July 23 and October 23. The junior subordinated debentures will mature and the capital securities must be redeemed on July 23, 2034, which may be shortened to a date not earlier than July 23, 2009, if certain conditions are met (including the Company having received prior approval of the Federal Reserve and any other required regulatory approvals).
CoBiz Inc. / Annual Report 2005F / 24
In August 2005, the Company created a wholly owned trust, CoBiz Capital Trust III, a trust formed under the laws of the State of Delaware (the “Capital Trust III”). The Capital Trust III issued $20,000,000 of trust preferred securities bearing an interest rate based on a spread above three-month LIBOR. Simultaneously with the issuance, the Company purchased a minority interest in the Capital Trust III for $619,000. The Capital Trust invested the proceeds thereof in $20,619,000 of junior subordinated debentures of CoBiz Inc. that also bear an interest rate based on a spread above three-month LIBOR. The securities and junior subordinated debentures provide cumulative distributions at a fl oating rate that is reset each quarter on March 30, June 30, September 30, and December 30. The junior subordinated debentures will mature and the capital securities must be redeemed on September 30, 2035, which may be shortened to a date not earlier than September 30, 2010, if certain conditions are met (including the Company having received prior approval of the Federal Reserve and any other required regulatory approvals).
The Company records the distributions of the junior subordinated debentures in interest expense on the consolidated statement of income. All of the outstanding junior subordinated debentures may be prepaid if certain events occur, including a change in tax status or regulatory capital treatment of trust preferred securities. In each case, redemption will be made at par, plus the accrued and unpaid distributions thereon through the redemption date.
Although the accounts of the Statutory Trust, Capital Trust and Capital Trust III are not included in the Company’s consolidated fi nancial state-ments, $47,000,000 of the $70,000,000 in trust preferred securities issued by the trusts are included in Tier 1 capital for regulatory capital purposes as allowed by the Federal Reserve Board. On February 28, 2005, the Federal Reserve Board fi nalized a rule that would continue to allow the inclusion of trust preferred securities issued by unconsolidated subsidiary trusts in Tier 1 capital, but with stricter quantitative and qualitative standards. Under the rule, after a transition period ending on March 31, 2009, the aggregate amount of trust preferred securities and certain other capital elements would be limited to 25% of Tier 1 capital elements, net of goodwill that has been reduced by any associated deferred tax liability. The amount of trust preferred securities and certain other elements in excess of the limit could be included in Tier 2 capital, subject to restrictions. Based on the fi nal rule, the Company’s allowable trust preferred securities in Tier 1 capital would decrease to $30,000,000 if it had been in effect at December 31, 2005. The additional amount excluded from Tier 1 capital would be included in Tier 2 capital and the Company would still be “Well Capitalized” under prompt corrective action provisions.
10. DERIVATIVESAsset/Liability Management Hedges — As part of its overall risk management, the Company pursues various asset and liability man-agement strategies, which may include obtaining derivative fi nancial instruments to mitigate the impact of interest-rate fl uctuations on the Company’s net interest margin.
In January 2003, the Company entered into an interest-rate swap agreement with a notional amount of $20,000,000. The swap effectively converted the Company’s fi xed-interest-rate obligation under the 10% junior subordinated debentures to a variable-interest-rate obligation, decreasing the asset sensitivity of the Company’s statement of condition by more closely matching variable-rate assets with variable-rate liabilities. The swap had the same payment dates, maturity date and call provisions as the related 10% junior subordinated debentures. In conjunction with the Company’s exercise of its right to call the 10% junior subordinated debentures during the second quarter of 2005, the Company terminated the swap at fair value. The termination resulted in the Company recognizing a loss totaling $160,000.
The Company has entered into several interest-rate swap agreements for the purpose of minimizing the asset sensitivity of the Company’s fi nancial statements and the impact from interest rate fl uctuations. Under these interest-rate swap agreements, the Company receives a fi xed rate and pays a variable rate based on the prime rate (“Prime”). These swaps qualify as cash fl ow hedges of the variability of cash fl ows the Company receives from certain variable-rate loans indexed to Prime. The portion of the change in the fair value of the swaps that are deemed effective in hedging the cash fl ows of the designated assets are recorded in accumulated other comprehensive income and reclassifi ed into in-terest income when such cash fl ows occur in the future. The estimated amount of existing expense that will be reclassifi ed into earnings during the next 12 months is $1,675,000. Any ineffectiveness resulting from the hedges are recorded as a gain or loss in the consolidated statement of income as part of noninterest income. In order to qualify for hedge accounting, the Company must comply with detailed rules and strict documentation requirements prior to beginning hedge accounting, and thereafter, including periodic assessment of hedge effectiveness. The Company assesses the effectiveness of each of its individual hedges on a quarterly basis.
Customer Accommodation Derivatives — The Company offers an interest-rate hedge program that includes derivative products such as swaps, caps, fl oors and collars to assist its customers in managing their interest-rate risk profi le. In order to eliminate the interest-rate risk associated with offering these products, the Company enters into derivative contracts with third parties to offset the customer contracts.
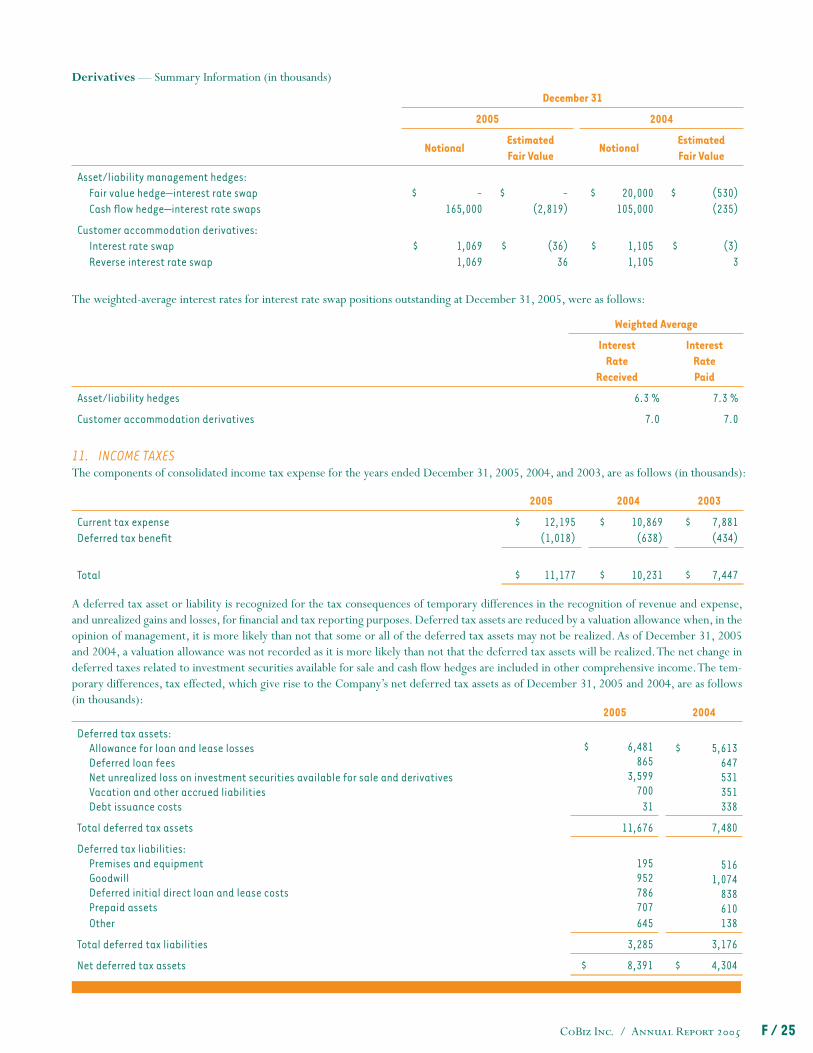
CoBiz Inc. / Annual Report 2005 F / 25
Derivatives — Summary Information (in thousands) December 31
2005 2004
NotionalEstimatedFair Value
NotionalEstimatedFair Value
Asset/liability management hedges:Fair value hedge—interest rate swapCash fl ow hedge—interest rate swaps
$ - 165,000
$ - (2,819)
$ 20,000 105,000
$ (530) (235)
Customer accommodation derivatives:Interest rate swapReverse interest rate swap
$ 1,069
1,069 $ (36)
36
$ 1,105
1,105 $ (3)
3
Weighted Average
InterestRate
Received
InterestRatePaid
Asset/liability hedges 6.3 % 7.3 %
Customer accommodation derivatives 7.0 7.0
The weighted-average interest rates for interest rate swap positions outstanding at December 31, 2005, were as follows:
11. INCOME TAXESThe components of consolidated income tax expense for the years ended December 31, 2005, 2004, and 2003, are as follows (in thousands):
2005 2004 2003
Current tax expenseDeferred tax benefi t
$ 12,195 (1,018)
$ 10,869 (638)
$ 7,881 (434)
Total
$ 11,177
$ 10,231
$ 7,447
A deferred tax asset or liability is recognized for the tax consequences of temporary differences in the recognition of revenue and expense, and unrealized gains and losses, for fi nancial and tax reporting purposes. Deferred tax assets are reduced by a valuation allowance when, in the opinion of management, it is more likely than not that some or all of the deferred tax assets may not be realized. As of December 31, 2005 and 2004, a valuation allowance was not recorded as it is more likely than not that the deferred tax assets will be realized. The net change in deferred taxes related to investment securities available for sale and cash fl ow hedges are included in other comprehensive income. The tem-porary differences, tax effected, which give rise to the Company’s net deferred tax assets as of December 31, 2005 and 2004, are as follows (in thousands): 2005 2004
Deferred tax assets:Allowance for loan and lease lossesDeferred loan feesNet unrealized loss on investment securities available for sale and derivativesVacation and other accrued liabilitiesDebt issuance costs
$ 6,481 865
3,599 700
31
$ 5,613 647 531 351 338
Total deferred tax assets 11,676 7,480
Deferred tax liabilities:Premises and equipmentGoodwillDeferred initial direct loan and lease costsPrepaid assetsOther
195 952 786 707 645
516 1,074
838 610 138
Total deferred tax liabilities 3,285 3,176
Net deferred tax assets $ 8,391 $ 4,304
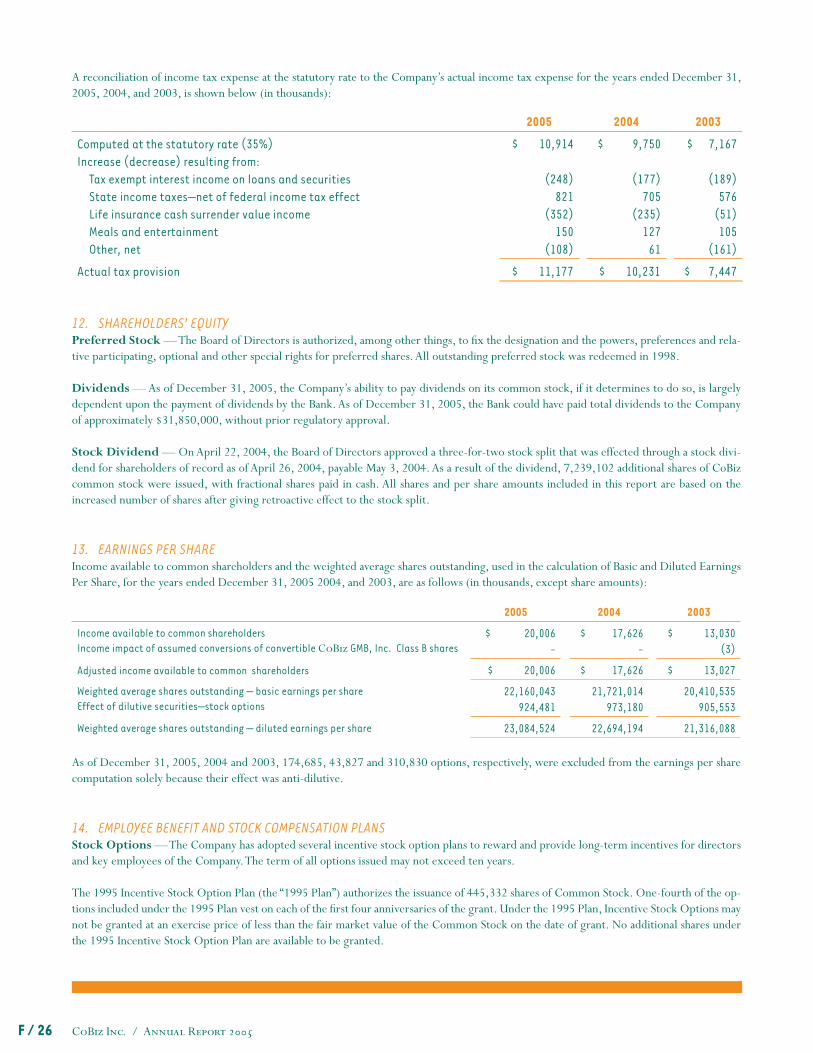
CoBiz Inc. / Annual Report 2005F / 26
A reconciliation of income tax expense at the statutory rate to the Company’s actual income tax expense for the years ended December 31, 2005, 2004, and 2003, is shown below (in thousands):
2005 2004 2003
Computed at the statutory rate (35%)Increase (decrease) resulting from:
Tax exempt interest income on loans and securitiesState income taxes—net of federal income tax effectLife insurance cash surrender value incomeMeals and entertainmentOther, net
$ 10,914
(248) 821
(352) 150
(108)
$ 9,750
(177) 705
(235) 127
61
$ 7,167
(189) 576
(51) 105
(161)
Actual tax provision $ 11,177 $ 10,231 $ 7,447
12. SHAREHOLDERS’ EQUITYPreferred Stock — The Board of Directors is authorized, among other things, to fi x the designation and the powers, preferences and rela-tive participating, optional and other special rights for preferred shares. All outstanding preferred stock was redeemed in 1998.
Dividends — As of December 31, 2005, the Company’s ability to pay dividends on its common stock, if it determines to do so, is largely dependent upon the payment of dividends by the Bank. As of December 31, 2005, the Bank could have paid total dividends to the Company of approximately $31,850,000, without prior regulatory approval.
Stock Dividend — On April 22, 2004, the Board of Directors approved a three-for-two stock split that was effected through a stock divi-dend for shareholders of record as of April 26, 2004, payable May 3, 2004. As a result of the dividend, 7,239,102 additional shares of CoBiz common stock were issued, with fractional shares paid in cash. All shares and per share amounts included in this report are based on the increased number of shares after giving retroactive effect to the stock split.
13. EARNINGS PER SHAREIncome available to common shareholders and the weighted average shares outstanding, used in the calculation of Basic and Diluted Earnings Per Share, for the years ended December 31, 2005 2004, and 2003, are as follows (in thousands, except share amounts):
2005 2004 2003
Income available to common shareholdersIncome impact of assumed conversions of convertible CoBiz GMB, Inc. Class B shares
$ 20,006 -
$ 17,626 -
$ 13,030 (3)
Adjusted income available to common shareholders $ 20,006 $ 17,626 $ 13,027
Weighted average shares outstanding — basic earnings per shareEffect of dilutive securities—stock options
22,160,043 924,481
21,721,014 973,180
20,410,535 905,553
Weighted average shares outstanding — diluted earnings per share 23,084,524 22,694,194 21,316,088
As of December 31, 2005, 2004 and 2003, 174,685, 43,827 and 310,830 options, respectively, were excluded from the earnings per share computation solely because their effect was anti-dilutive.
14. EMPLOYEE BENEFIT AND STOCK COMPENSATION PLANSStock Options — The Company has adopted several incentive stock option plans to reward and provide long-term incentives for directors and key employees of the Company. The term of all options issued may not exceed ten years.
The 1995 Incentive Stock Option Plan (the “1995 Plan”) authorizes the issuance of 445,332 shares of Common Stock. One-fourth of the op-tions included under the 1995 Plan vest on each of the fi rst four anniversaries of the grant. Under the 1995 Plan, Incentive Stock Options may not be granted at an exercise price of less than the fair market value of the Common Stock on the date of grant. No additional shares under the 1995 Incentive Stock Option Plan are available to be granted.
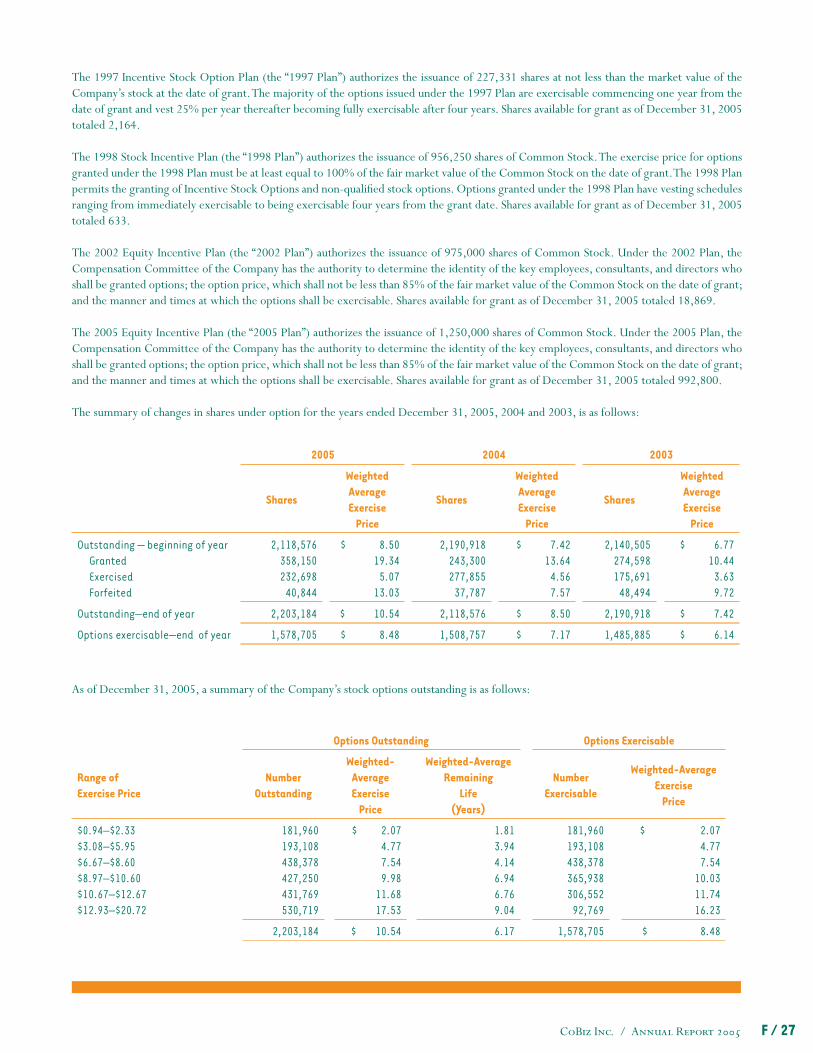
CoBiz Inc. / Annual Report 2005 F / 27
The 1997 Incentive Stock Option Plan (the “1997 Plan”) authorizes the issuance of 227,331 shares at not less than the market value of the Company’s stock at the date of grant. The majority of the options issued under the 1997 Plan are exercisable commencing one year from the date of grant and vest 25% per year thereafter becoming fully exercisable after four years. Shares available for grant as of December 31, 2005 totaled 2,164.
The 1998 Stock Incentive Plan (the “1998 Plan”) authorizes the issuance of 956,250 shares of Common Stock. The exercise price for options granted under the 1998 Plan must be at least equal to 100% of the fair market value of the Common Stock on the date of grant. The 1998 Plan permits the granting of Incentive Stock Options and non-qualifi ed stock options. Options granted under the 1998 Plan have vesting schedules ranging from immediately exercisable to being exercisable four years from the grant date. Shares available for grant as of December 31, 2005 totaled 633.
The 2002 Equity Incentive Plan (the “2002 Plan”) authorizes the issuance of 975,000 shares of Common Stock. Under the 2002 Plan, the Compensation Committee of the Company has the authority to determine the identity of the key employees, consultants, and directors who shall be granted options; the option price, which shall not be less than 85% of the fair market value of the Common Stock on the date of grant; and the manner and times at which the options shall be exercisable. Shares available for grant as of December 31, 2005 totaled 18,869.
The 2005 Equity Incentive Plan (the “2005 Plan”) authorizes the issuance of 1,250,000 shares of Common Stock. Under the 2005 Plan, the Compensation Committee of the Company has the authority to determine the identity of the key employees, consultants, and directors who shall be granted options; the option price, which shall not be less than 85% of the fair market value of the Common Stock on the date of grant; and the manner and times at which the options shall be exercisable. Shares available for grant as of December 31, 2005 totaled 992,800.
The summary of changes in shares under option for the years ended December 31, 2005, 2004 and 2003, is as follows:
2005 2004 2003
Shares
WeightedAverageExercise
Price
Shares
WeightedAverageExercise
Price
Shares
WeightedAverageExercise
Price
Outstanding — beginning of yearGrantedExercisedForfeited
2,118,576 358,150 232,698
40,844
$ 8.50 19.34
5.07 13.03
2,190,918 243,300 277,855
37,787
$ 7.42 13.64
4.56 7.57
2,140,505 274,598 175,691
48,494
$ 6.77 10.44
3.63 9.72
Outstanding—end of year 2,203,184 $ 10.54 2,118,576 $ 8.50 2,190,918 $ 7.42
Options exercisable—end of year 1,578,705 $ 8.48 1,508,757 $ 7.17 1,485,885 $ 6.14
Options Outstanding Options Exercisable
Range ofExercise Price
NumberOutstanding
Weighted-AverageExercise
Price
Weighted-AverageRemaining
Life(Years)
NumberExercisable
Weighted-AverageExercise
Price
$0.94–$2.33$3.08–$5.95$6.67–$8.60$8.97–$10.60$10.67–$12.67$12.93–$20.72
181,960 193,108 438,378 427,250 431,769 530,719
$ 2.07 4.77 7.54 9.98
11.68 17.53
1.81 3.94 4.14 6.94 6.76 9.04
181,960 193,108 438,378 365,938 306,552
92,769
$ 2.07 4.77 7.54
10.03 11.74 16.23
2,203,184 $ 10.54 6.17 1,578,705 $ 8.48
As of December 31, 2005, a summary of the Company’s stock options outstanding is as follows:
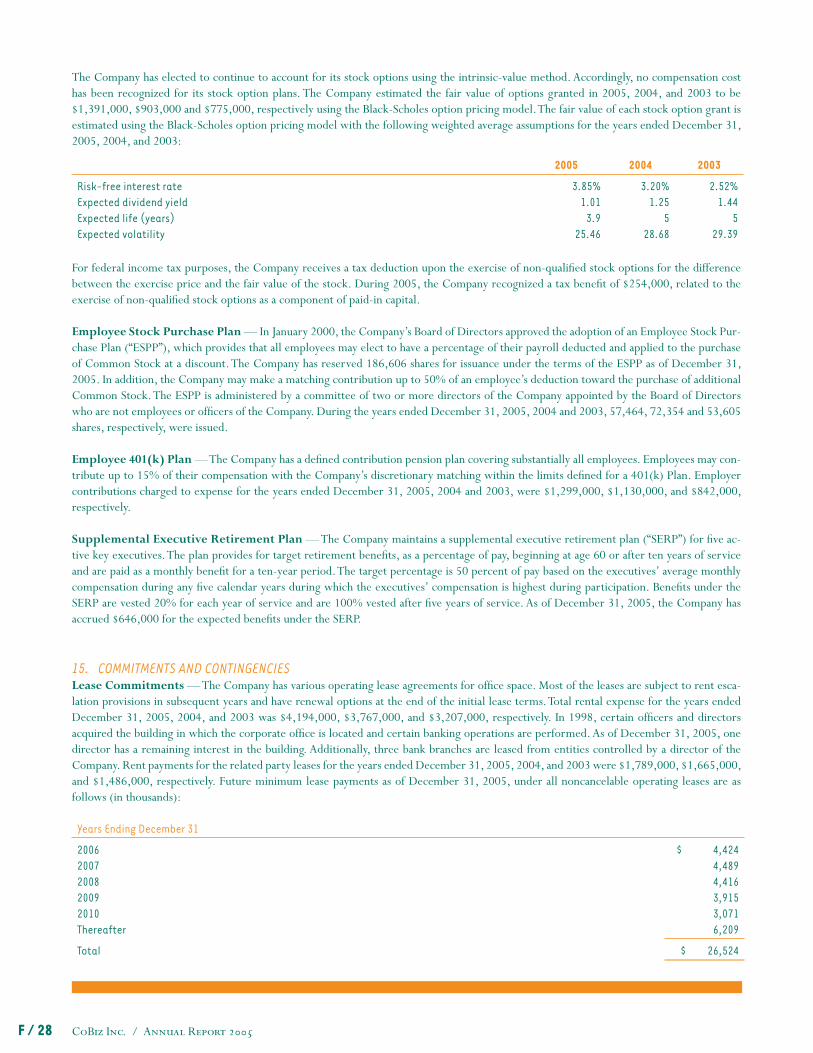
CoBiz Inc. / Annual Report 2005F / 28
The Company has elected to continue to account for its stock options using the intrinsic-value method. Accordingly, no compensation cost has been recognized for its stock option plans. The Company estimated the fair value of options granted in 2005, 2004, and 2003 to be $1,391,000, $903,000 and $775,000, respectively using the Black-Scholes option pricing model. The fair value of each stock option grant is estimated using the Black-Scholes option pricing model with the following weighted average assumptions for the years ended December 31, 2005, 2004, and 2003:
2005 2004 2003
Risk-free interest rateExpected dividend yieldExpected life (years)Expected volatility
3.85% 1.01
3.9 25.46
3.20% 1.25
5 28.68
2.52% 1.44
5 29.39
For federal income tax purposes, the Company receives a tax deduction upon the exercise of non-qualifi ed stock options for the difference between the exercise price and the fair value of the stock. During 2005, the Company recognized a tax benefi t of $254,000, related to the exercise of non-qualifi ed stock options as a component of paid-in capital.
Employee Stock Purchase Plan — In January 2000, the Company’s Board of Directors approved the adoption of an Employee Stock Pur-chase Plan (“ESPP”), which provides that all employees may elect to have a percentage of their payroll deducted and applied to the purchase of Common Stock at a discount. The Company has reserved 186,606 shares for issuance under the terms of the ESPP as of December 31, 2005. In addition, the Company may make a matching contribution up to 50% of an employee’s deduction toward the purchase of additional Common Stock. The ESPP is administered by a committee of two or more directors of the Company appointed by the Board of Directors who are not employees or offi cers of the Company. During the years ended December 31, 2005, 2004 and 2003, 57,464, 72,354 and 53,605 shares, respectively, were issued.
Employee 401(k) Plan — The Company has a defi ned contribution pension plan covering substantially all employees. Employees may con-tribute up to 15% of their compensation with the Company’s discretionary matching within the limits defi ned for a 401(k) Plan. Employer contributions charged to expense for the years ended December 31, 2005, 2004 and 2003, were $1,299,000, $1,130,000, and $842,000, respectively.
Supplemental Executive Retirement Plan — The Company maintains a supplemental executive retirement plan (“SERP”) for fi ve ac-tive key executives. The plan provides for target retirement benefi ts, as a percentage of pay, beginning at age 60 or after ten years of service and are paid as a monthly benefi t for a ten-year period. The target percentage is 50 percent of pay based on the executives’ average monthly compensation during any fi ve calendar years during which the executives’ compensation is highest during participation. Benefi ts under the SERP are vested 20% for each year of service and are 100% vested after fi ve years of service. As of December 31, 2005, the Company has accrued $646,000 for the expected benefi ts under the SERP.
15. COMMITMENTS AND CONTINGENCIESLease Commitments — The Company has various operating lease agreements for offi ce space. Most of the leases are subject to rent esca-lation provisions in subsequent years and have renewal options at the end of the initial lease terms. Total rental expense for the years ended December 31, 2005, 2004, and 2003 was $4,194,000, $3,767,000, and $3,207,000, respectively. In 1998, certain offi cers and directors acquired the building in which the corporate offi ce is located and certain banking operations are performed. As of December 31, 2005, one director has a remaining interest in the building. Additionally, three bank branches are leased from entities controlled by a director of the Company. Rent payments for the related party leases for the years ended December 31, 2005, 2004, and 2003 were $1,789,000, $1,665,000, and $1,486,000, respectively. Future minimum lease payments as of December 31, 2005, under all noncancelable operating leases are as follows (in thousands):
Years Ending December 31
20062007200820092010Thereafter
$ 4,424 4,489 4,416 3,915 3,071 6,209
Total $ 26,524
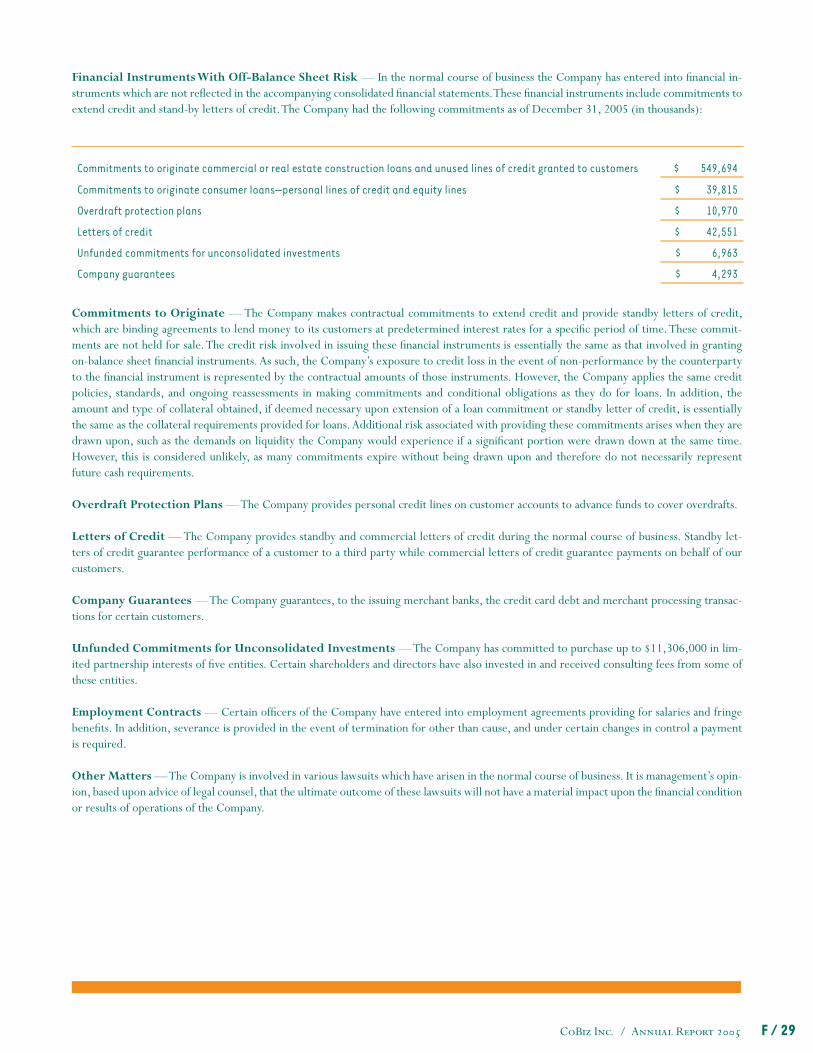
CoBiz Inc. / Annual Report 2005 F / 29
Financial Instruments With Off-Balance Sheet Risk — In the normal course of business the Company has entered into fi nancial in-struments which are not refl ected in the accompanying consolidated fi nancial statements. These fi nancial instruments include commitments to extend credit and stand-by letters of credit. The Company had the following commitments as of December 31, 2005 (in thousands):
Commitments to originate commercial or real estate construction loans and unused lines of credit granted to customers $ 549,694
Commitments to originate consumer loans—personal lines of credit and equity lines $ 39,815
Overdraft protection plans $ 10,970
Letters of credit $ 42,551
Unfunded commitments for unconsolidated investments $ 6,963
Company guarantees $ 4,293
Commitments to Originate — The Company makes contractual commitments to extend credit and provide standby letters of credit, which are binding agreements to lend money to its customers at predetermined interest rates for a specifi c period of time. These commit-ments are not held for sale. The credit risk involved in issuing these fi nancial instruments is essentially the same as that involved in granting on-balance sheet fi nancial instruments. As such, the Company’s exposure to credit loss in the event of non-performance by the counterparty to the fi nancial instrument is represented by the contractual amounts of those instruments. However, the Company applies the same credit policies, standards, and ongoing reassessments in making commitments and conditional obligations as they do for loans. In addition, the amount and type of collateral obtained, if deemed necessary upon extension of a loan commitment or standby letter of credit, is essentially the same as the collateral requirements provided for loans. Additional risk associated with providing these commitments arises when they are drawn upon, such as the demands on liquidity the Company would experience if a signifi cant portion were drawn down at the same time. However, this is considered unlikely, as many commitments expire without being drawn upon and therefore do not necessarily represent future cash requirements.
Overdraft Protection Plans — The Company provides personal credit lines on customer accounts to advance funds to cover overdrafts.
Letters of Credit — The Company provides standby and commercial letters of credit during the normal course of business. Standby let-ters of credit guarantee performance of a customer to a third party while commercial letters of credit guarantee payments on behalf of our customers.
Company Guarantees — The Company guarantees, to the issuing merchant banks, the credit card debt and merchant processing transac-tions for certain customers.
Unfunded Commitments for Unconsolidated Investments — The Company has committed to purchase up to $11,306,000 in lim-ited partnership interests of fi ve entities. Certain shareholders and directors have also invested in and received consulting fees from some of these entities.
Employment Contracts — Certain offi cers of the Company have entered into employment agreements providing for salaries and fringe benefi ts. In addition, severance is provided in the event of termination for other than cause, and under certain changes in control a payment is required.
Other Matters — The Company is involved in various lawsuits which have arisen in the normal course of business. It is management’s opin-ion, based upon advice of legal counsel, that the ultimate outcome of these lawsuits will not have a material impact upon the fi nancial condition or results of operations of the Company.
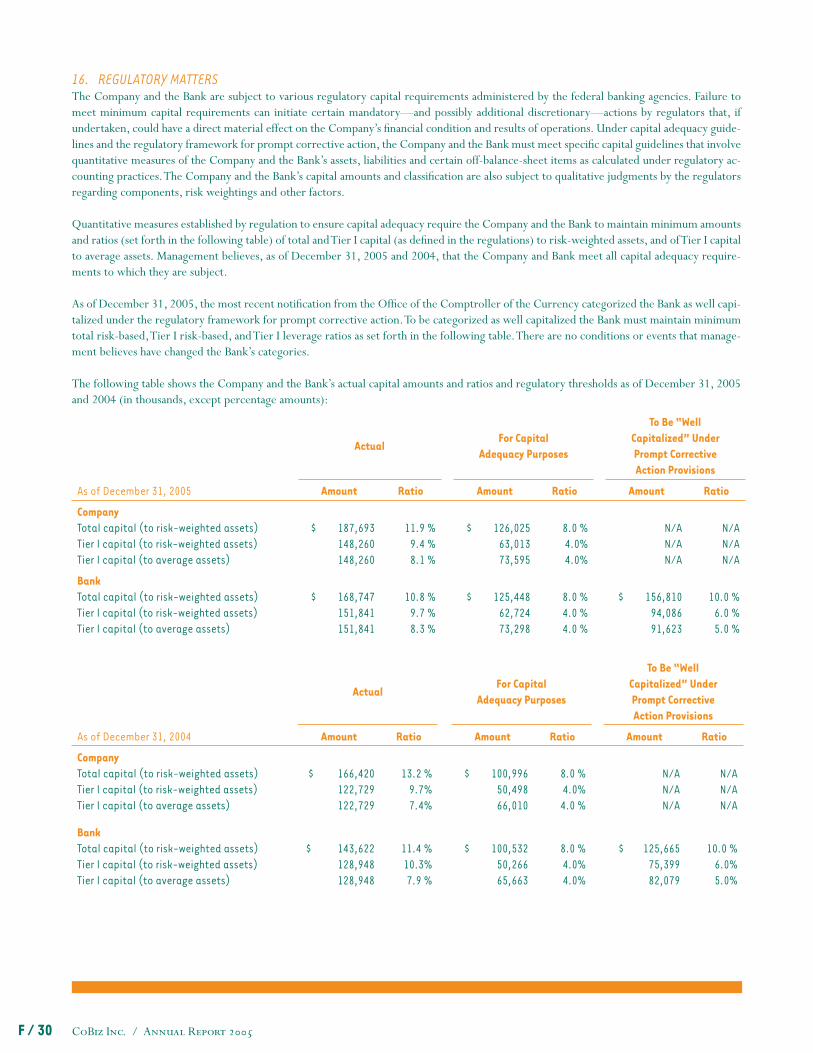
CoBiz Inc. / Annual Report 2005F / 30
16. REGULATORY MATTERSThe Company and the Bank are subject to various regulatory capital requirements administered by the federal banking agencies. Failure to meet minimum capital requirements can initiate certain mandatory—and possibly additional discretionary—actions by regulators that, if undertaken, could have a direct material effect on the Company’s fi nancial condition and results of operations. Under capital adequacy guide-lines and the regulatory framework for prompt corrective action, the Company and the Bank must meet specifi c capital guidelines that involve quantitative measures of the Company and the Bank’s assets, liabilities and certain off-balance-sheet items as calculated under regulatory ac-counting practices. The Company and the Bank’s capital amounts and classifi cation are also subject to qualitative judgments by the regulators regarding components, risk weightings and other factors.
Quantitative measures established by regulation to ensure capital adequacy require the Company and the Bank to maintain minimum amounts and ratios (set forth in the following table) of total and Tier I capital (as defi ned in the regulations) to risk-weighted assets, and of Tier I capital to average assets. Management believes, as of December 31, 2005 and 2004, that the Company and Bank meet all capital adequacy require-ments to which they are subject.
As of December 31, 2005, the most recent notifi cation from the Offi ce of the Comptroller of the Currency categorized the Bank as well capi-talized under the regulatory framework for prompt corrective action. To be categorized as well capitalized the Bank must maintain minimum total risk-based, Tier I risk-based, and Tier I leverage ratios as set forth in the following table. There are no conditions or events that manage-ment believes have changed the Bank’s categories.
The following table shows the Company and the Bank’s actual capital amounts and ratios and regulatory thresholds as of December 31, 2005 and 2004 (in thousands, except percentage amounts):
As of December 31, 2005
ActualFor Capital
Adequacy Purposes
To Be “WellCapitalized” UnderPrompt CorrectiveAction Provisions
Amount Ratio Amount Ratio Amount Ratio
CompanyTotal capital (to risk-weighted assets)Tier I capital (to risk-weighted assets)Tier I capital (to average assets)
$ 187,693
148,260 148,260
11.9 % 9.4 % 8.1 %
$ 126,025
63,013 73,595
8.0 % 4.0% 4.0%
N/A N/A N/A
N/A
N/A N/A
BankTotal capital (to risk-weighted assets)Tier I capital (to risk-weighted assets)Tier I capital (to average assets)
$ 168,747
151,841 151,841
10.8 % 9.7 % 8.3 %
$ 125,448
62,724 73,298
8.0 % 4.0 % 4.0 %
$ 156,810
94,086 91,623
10.0 % 6.0 % 5.0 %
As of December 31, 2004
ActualFor Capital
Adequacy Purposes
To Be “WellCapitalized” UnderPrompt CorrectiveAction Provisions
Amount Ratio Amount Ratio Amount Ratio
CompanyTotal capital (to risk-weighted assets)Tier I capital (to risk-weighted assets)Tier I capital (to average assets)
$ 166,420
122,729 122,729
13.2 %
9.7%7.4%
$ 100,996
50,498 66,010
8.0 % 4.0%4.0 %
N/A
N/A N/A
N/A N/A
N/A
BankTotal capital (to risk-weighted assets)Tier I capital (to risk-weighted assets)Tier I capital (to average assets)
$ 143,622
128,948 128,948
11.4 % 10.3% 7.9 %
$ 100,532
50,266 65,663
8.0 % 4.0% 4.0%
$ 125,665
75,399 82,079
10.0 % 6.0%
5.0%
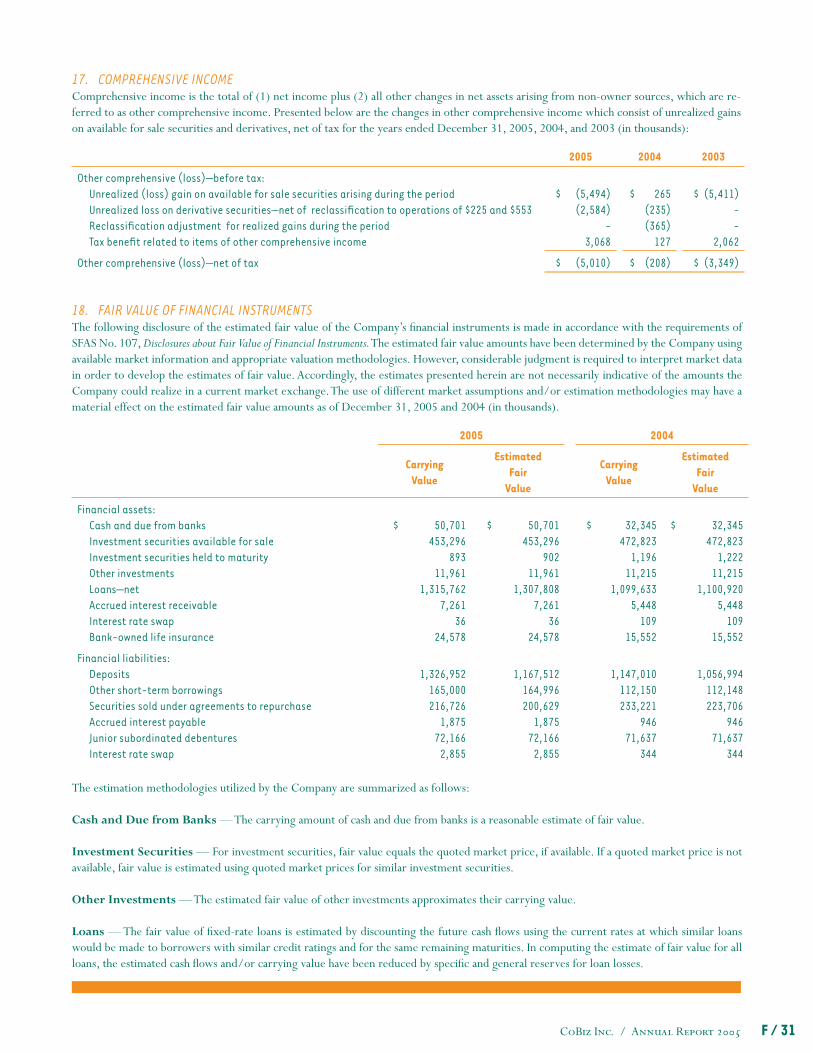
CoBiz Inc. / Annual Report 2005 F / 31
18. FAIR VALUE OF FINANCIAL INSTRUMENTSThe following disclosure of the estimated fair value of the Company’s fi nancial instruments is made in accordance with the requirements of SFAS No. 107, Disclosures about Fair Value of Financial Instruments. The estimated fair value amounts have been determined by the Company using available market information and appropriate valuation methodologies. However, considerable judgment is required to interpret market data in order to develop the estimates of fair value. Accordingly, the estimates presented herein are not necessarily indicative of the amounts the Company could realize in a current market exchange. The use of different market assumptions and/or estimation methodologies may have a material effect on the estimated fair value amounts as of December 31, 2005 and 2004 (in thousands).
2005 2004 2003
Other comprehensive (loss)—before tax:Unrealized (loss) gain on available for sale securities arising during the periodUnrealized loss on derivative securities—net of reclassifi cation to operations of $225 and $553Reclassifi cation adjustment for realized gains during the periodTax benefi t related to items of other comprehensive income
$ (5,494) (2,584)
- 3,068
$ 265 (235) (365)
127
$ (5,411) - -
2,062
Other comprehensive (loss)—net of tax $ (5,010) $ (208) $ (3,349)
2005 2004
CarryingValue
EstimatedFair
Value
CarryingValue
EstimatedFair
Value
Financial assets:Cash and due from banksInvestment securities available for sale Investment securities held to maturity Other investmentsLoans—netAccrued interest receivable Interest rate swapBank-owned life insurance
$ 50,701 453,296
893 11,961
1,315,762 7,261
36 24,578
$ 50,701 453,296
902 11,961
1,307,808 7,261
36 24,578
$ 32,345 472,823
1,196 11,215
1,099,633 5,448
109 15,552
$ 32,345
472,823 1,222
11,215 1,100,920
5,448 109
15,552
Financial liabilities:DepositsOther short-term borrowingsSecurities sold under agreements to repurchase Accrued interest payableJunior subordinated debenturesInterest rate swap
1,326,952 165,000 216,726
1,875 72,166
2,855
1,167,512
164,996 200,629
1,875 72,166
2,855
1,147,010
112,150 233,221
946 71,637
344
1,056,994 112,148 223,706
946 71,637
344
17. COMPREHENSIVE INCOME Comprehensive income is the total of (1) net income plus (2) all other changes in net assets arising from non-owner sources, which are re-ferred to as other comprehensive income. Presented below are the changes in other comprehensive income which consist of unrealized gains on available for sale securities and derivatives, net of tax for the years ended December 31, 2005, 2004, and 2003 (in thousands):
The estimation methodologies utilized by the Company are summarized as follows:
Cash and Due from Banks — The carrying amount of cash and due from banks is a reasonable estimate of fair value.
Investment Securities — For investment securities, fair value equals the quoted market price, if available. If a quoted market price is not available, fair value is estimated using quoted market prices for similar investment securities.
Other Investments — The estimated fair value of other investments approximates their carrying value.
Loans — The fair value of fi xed-rate loans is estimated by discounting the future cash fl ows using the current rates at which similar loans would be made to borrowers with similar credit ratings and for the same remaining maturities. In computing the estimate of fair value for all loans, the estimated cash fl ows and/or carrying value have been reduced by specifi c and general reserves for loan losses.
CoBiz Inc. / Annual Report 2005F / 32
Accrued Interest Receivable/Payable — The carrying amount of accrued interest receivable/payable is a reasonable estimate of fair value due to the short-term nature of these amounts.
Bank-Owned Life Insurance—The carrying amount of bank-owned life insurance is based on the cash surrender value of the policies.
Deposits — The fair value of demand deposits, NOW and money market deposits, savings accounts and certifi cates of deposit, is estimated by discounting the expected life of each deposit category at an index of the U.S. Treasury curve.
Short-term Borrowings — The estimated fair value of variable-rate short-term borrowings approximates their carrying value.
Securities Sold Under Agreements to Repurchase and Advances From the Federal Home Loan Bank — Estimated fair value is based on discounting cash fl ows for comparable instruments.
Junior Subordinated Debentures — The fair value of junior subordinated debentures is calculated at the quoted market price.
Interest Rate Swap — The fair value of interest rate swaps is based on the estimated cost if the Company were to terminate the swap.
Commitments to Extend Credit and Standby Letters of Credit — The Company’s off-balance sheet commitments are funded at current market rates at the date they are drawn upon. It is management’s opinion that the fair value of these commitments would approximate their carrying value, if drawn upon.
The fair value estimates presented herein are based on pertinent information available to management as of December 31, 2005 and 2004. Although management is not aware of any factors that would signifi cantly affect the estimated fair value amounts, such amounts have not been comprehensively revalued for purposes of these fi nancial statements since that date and, therefore, current estimates of fair value may differ signifi cantly from the amounts presented herein.
19. SEGMENTSThe Company’s principal areas of activity consist of commercial banking, investment banking, investment advisory and trust services, insur-ance, and corporate support and other.
The Company distinguishes its commercial banking segments based on geographic markets served. Currently, reportable commercial banking segments are CBB and ABB. CBB is a full-service business bank with eleven Colorado locations, including eight in the Denver metropolitan area, two locations in Boulder and one in Edwards, just west of Vail. ABB is also a full-service business bank with seven locations in the Phoenix metropolitan area.
The investment banking segment consists of the operations of GMB, which provides middle-market companies with merger and acquisition advisory services, institutional private placements of debt and equity, and other strategic fi nancial advisory services.
The investment advisory and trust segment consists of the operations of ACMG and CoBiz Private Asset Management. ACMG is an SEC-registered investment management fi rm that manages stock and bond portfolios for individuals and institutions. CoBiz Private Asset Manage-ment offers wealth management and investment advisory services, fi duciary (trust) services, and estate administration services.
The insurance segment includes the activities of FDL and CoBiz Insurance, Inc. FDL provides employee benefi ts consulting and brokerage, wealth transfer planning and preservation for high-net-worth individuals, and executive benefi ts and compensation planning. FDL represents individuals and companies in the acquisition of institutionally priced life insurance products to meet wealth transfer and business needs. Employee benefi t services include assisting companies in creating and managing benefi t programs such as medical, dental, vision, 401(k), disability, life and cafeteria plans. CoBiz Insurance, Inc. provides commercial and personal property and casualty insurance brokerage, as well as risk management consulting services to individuals and small and medium-sized businesses. The majority of the revenue for both FDL and CoBiz Insurance is derived from insurance product sales and referrals, and are paid by third-party insurance carriers. Insurance commissions are normally calculated as a percentage of the premium paid by our clients to the insurance carrier, and are paid to us by the insurance carrier for distributing and servicing their insurance products.
Corporate support and other consists of activities that are not directly attributable to the other reportable segments. Included in this category are the activities of leasing, centralized bank operations, the Company’s treasury function (i.e., investment management and wholesale fund-ing), and activities of the Parent.
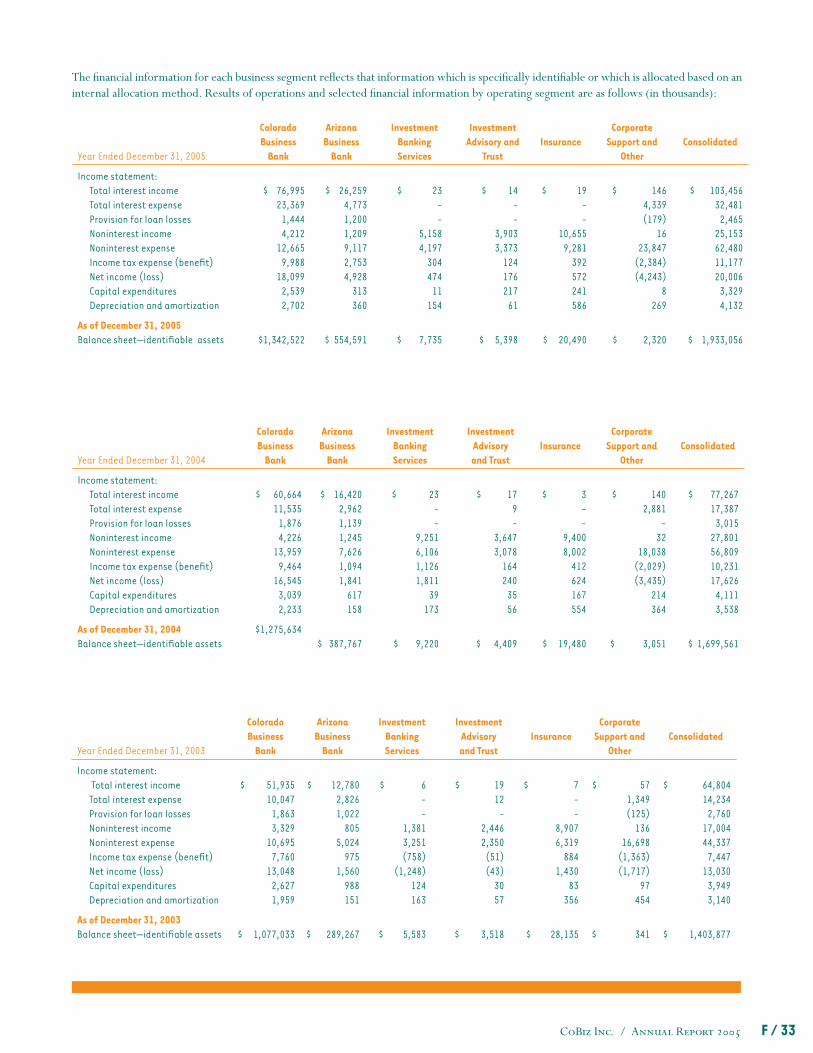
CoBiz Inc. / Annual Report 2005 F / 33
The fi nancial information for each business segment refl ects that information which is specifi cally identifi able or which is allocated based on an internal allocation method. Results of operations and selected fi nancial information by operating segment are as follows (in thousands):
Year Ended December 31, 2005
ColoradoBusiness
Bank
ArizonaBusiness
Bank
InvestmentBankingServices
InvestmentAdvisory and
TrustInsurance
CorporateSupport and
OtherConsolidated
Income statement:Total interest incomeTotal interest expenseProvision for loan lossesNoninterest incomeNoninterest expenseIncome tax expense (benefi t)Net income (loss)Capital expendituresDepreciation and amortization
$ 76,995
23,369 1,444 4,212
12,665 9,988
18,099 2,539 2,702
$ 26,259
4,773 1,200 1,209 9,117 2,753 4,928
313 360
$ 23
- -
5,158 4,197
304 474
11 154
$ 14
- -
3,903 3,373
124 176 217
61
$ 19
- -
10,655 9,281
392 572 241 586
$ 146
4,339 (179)
16 23,847
(2,384) (4,243)
8 269
$ 103,456
32,481 2,465
25,153 62,480 11,177 20,006
3,329 4,132
As of December 31, 2005Balance sheet—identifi able assets $1,342,522
$ 554,591
$ 7,735
$ 5,398
$ 20,490
$ 2,320
$ 1,933,056
Year Ended December 31, 2004
ColoradoBusiness
Bank
ArizonaBusiness
Bank
InvestmentBankingServices
InvestmentAdvisoryand Trust
InsuranceCorporate
Support andOther
Consolidated
Income statement:Total interest incomeTotal interest expenseProvision for loan lossesNoninterest incomeNoninterest expenseIncome tax expense (benefi t)Net income (loss)Capital expendituresDepreciation and amortization
$ 60,664
11,535 1,876 4,226
13,959 9,464
16,545 3,039 2,233
$ 16,420
2,962 1,139 1,245 7,626 1,094 1,841
617 158
$ 23
- -
9,251 6,106 1,126 1,811
39 173
$ 17
9 -
3,647 3,078
164 240
35 56
$ 3
- -
9,400 8,002
412 624 167 554
$ 140
2,881 -
32 18,038
(2,029) (3,435)
214 364
$ 77,267
17,387 3,015
27,801 56,809 10,231 17,626
4,111 3,538
As of December 31, 2004Balance sheet—identifi able assets
$1,275,634 $ 387,767 $ 9,220
$ 4,409
$ 19,480
$ 3,051
$ 1,699,561
Year Ended December 31, 2003
ColoradoBusiness
Bank
ArizonaBusiness
Bank
InvestmentBankingServices
InvestmentAdvisoryand Trust
InsuranceCorporate
Support andOther
Consolidated
Income statement: Total interest incomeTotal interest expenseProvision for loan lossesNoninterest incomeNoninterest expenseIncome tax expense (benefi t)Net income (loss)Capital expendituresDepreciation and amortization
$ 51,935
10,047 1,863 3,329
10,695 7,760
13,048 2,627 1,959
$ 12,780
2,826 1,022
805 5,024
975 1,560
988 151
$ 6
- -
1,381 3,251 (758)
(1,248) 124 163
$ 19
12 -
2,446 2,350
(51) (43)
30 57
$ 7
- -
8,907 6,319
884 1,430
83 356
$ 57
1,349 (125)
136 16,698
(1,363) (1,717)
97 454
$ 64,804
14,234 2,760
17,004 44,337
7,447 13,030
3,949 3,140
As of December 31, 2003Balance sheet—identifi able assets
$ 1,077,033
$ 289,267
$ 5,583
$ 3,518
$ 28,135
$ 341
$ 1,403,877
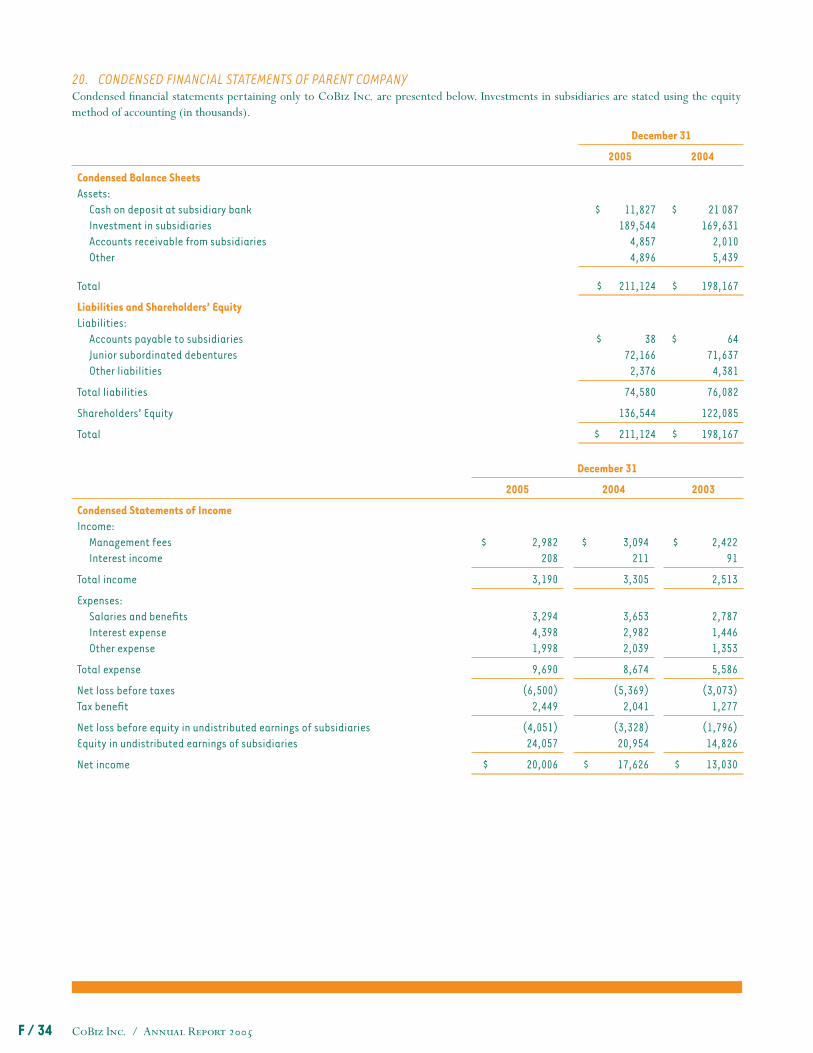
CoBiz Inc. / Annual Report 2005F / 34
20. CONDENSED FINANCIAL STATEMENTS OF PARENT COMPANYCondensed fi nancial statements pertaining only to CoBiz Inc. are presented below. Investments in subsidiaries are stated using the equity method of accounting (in thousands).
December 31
2005 2004
Condensed Balance SheetsAssets:
Cash on deposit at subsidiary bankInvestment in subsidiariesAccounts receivable from subsidiariesOther
$ 11,827 189,544
4,857 4,896
$ 21 087 169,631
2,010 5,439
Total $ 211,124 $ 198,167
Liabilities and Shareholders’ EquityLiabilities:
Accounts payable to subsidiariesJunior subordinated debenturesOther liabilities
$ 38 72,166
2,376
$ 64 71,637
4,381
Total liabilities 74,580 76,082
Shareholders’ Equity 136,544 122,085
Total $ 211,124 $ 198,167
December 31
2005 2004 2003
Condensed Statements of IncomeIncome:
Management feesInterest income
$ 2,982 208
$ 3,094 211
$ 2,422 91
Total income 3,190 3,305 2,513
Expenses:Salaries and benefi tsInterest expenseOther expense
3,294 4,398 1,998
3,653
2,982 2,039
2,787
1,446 1,353
Total expense 9,690 8,674 5,586
Net loss before taxesTax benefi t
(6,500) 2,449
(5,369) 2,041
(3,073) 1,277
Net loss before equity in undistributed earnings of subsidiariesEquity in undistributed earnings of subsidiaries
(4,051) 24,057
(3,328) 20,954
(1,796) 14,826
Net income $ 20,006 $ 17,626 $ 13,030
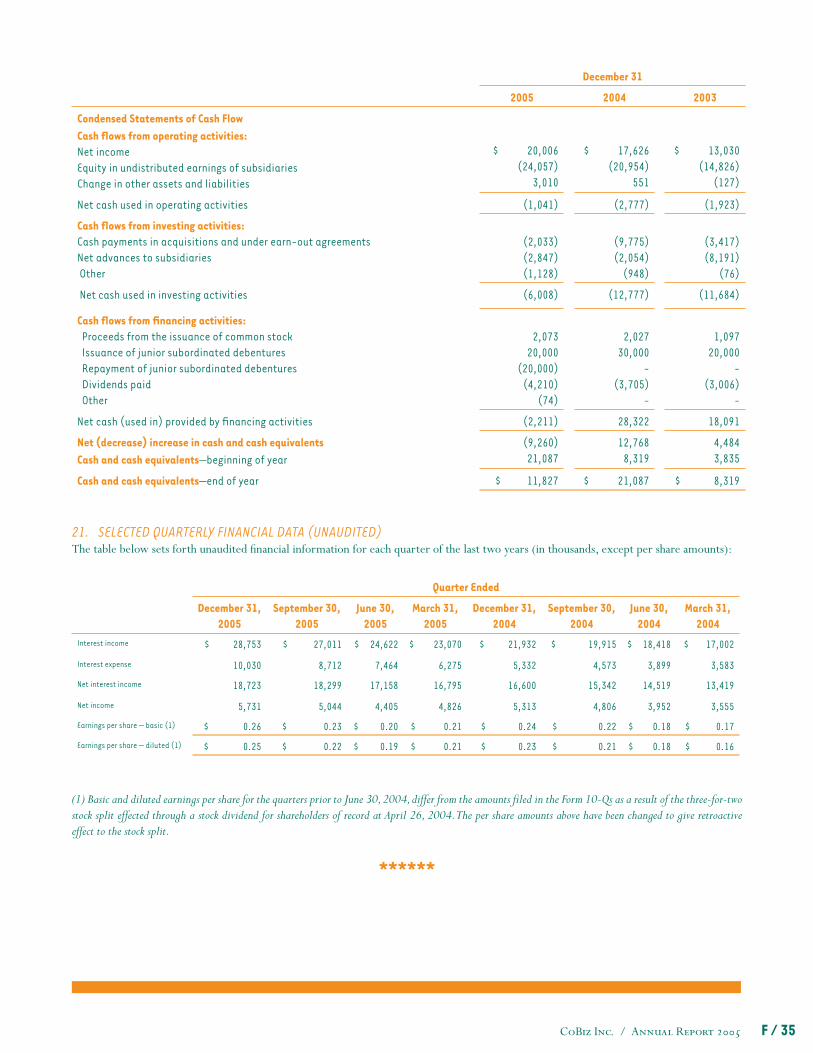
CoBiz Inc. / Annual Report 2005 F / 35
Quarter Ended
December 31,2005
September 30,2005
June 30,2005
March 31,2005
December 31,2004
September 30,2004
June 30,2004
March 31,2004
Interest income $ 28,753 $ 27,011 $ 24,622 $ 23,070 $ 21,932 $ 19,915 $ 18,418 $ 17,002
Interest expense 10,030 8,712 7,464 6,275 5,332 4,573 3,899 3,583
Net interest income 18,723 18,299 17,158 16,795 16,600 15,342 14,519 13,419
Net income 5,731 5,044 4,405 4,826 5,313 4,806 3,952 3,555
Earnings per share — basic (1) $ 0.26 $ 0.23 $ 0.20 $ 0.21 $ 0.24 $ 0.22 $ 0.18 $ 0.17
Earnings per share — diluted (1) $ 0.25 $ 0.22 $ 0.19 $ 0.21 $ 0.23 $ 0.21 $ 0.18 $ 0.16
December 31
2005 2004 2003
Condensed Statements of Cash FlowCash fl ows from operating activities:Net incomeEquity in undistributed earnings of subsidiariesChange in other assets and liabilities
$ 20,006 (24,057)
3,010
$ 17,626 (20,954)
551
$ 13,030 (14,826)
(127)
Net cash used in operating activities (1,041) (2,777) (1,923)
Cash fl ows from investing activities:Cash payments in acquisitions and under earn-out agreementsNet advances to subsidiaries Other
(2,033)
(2,847) (1,128)
(9,775) (2,054)
(948)
(3,417)
(8,191) (76)
Net cash used in investing activities (6,008) (12,777) (11,684)
Cash fl ows from fi nancing activities: Proceeds from the issuance of common stock Issuance of junior subordinated debentures Repayment of junior subordinated debentures Dividends paid Other
2,073
20,000 (20,000)
(4,210) (74)
2,027
30,000 -
(3,705) -
1,097
20,000 -
(3,006) -
Net cash (used in) provided by fi nancing activities (2,211) 28,322 18,091
Net (decrease) increase in cash and cash equivalents Cash and cash equivalents—beginning of year
(9,260) 21,087
12,768 8,319
4,484 3,835
Cash and cash equivalents—end of year $ 11,827 $ 21,087 $ 8,319
21. SELECTED QUARTERLY FINANCIAL DATA (UNAUDITED)The table below sets forth unaudited fi nancial information for each quarter of the last two years (in thousands, except per share amounts):
(1) Basic and diluted earnings per share for the quarters prior to June 30, 2004, differ from the amounts fi led in the Form 10-Qs as a result of the three-for-two stock split effected through a stock dividend for shareholders of record at April 26, 2004. The per share amounts above have been changed to give retroactive effect to the stock split.
******
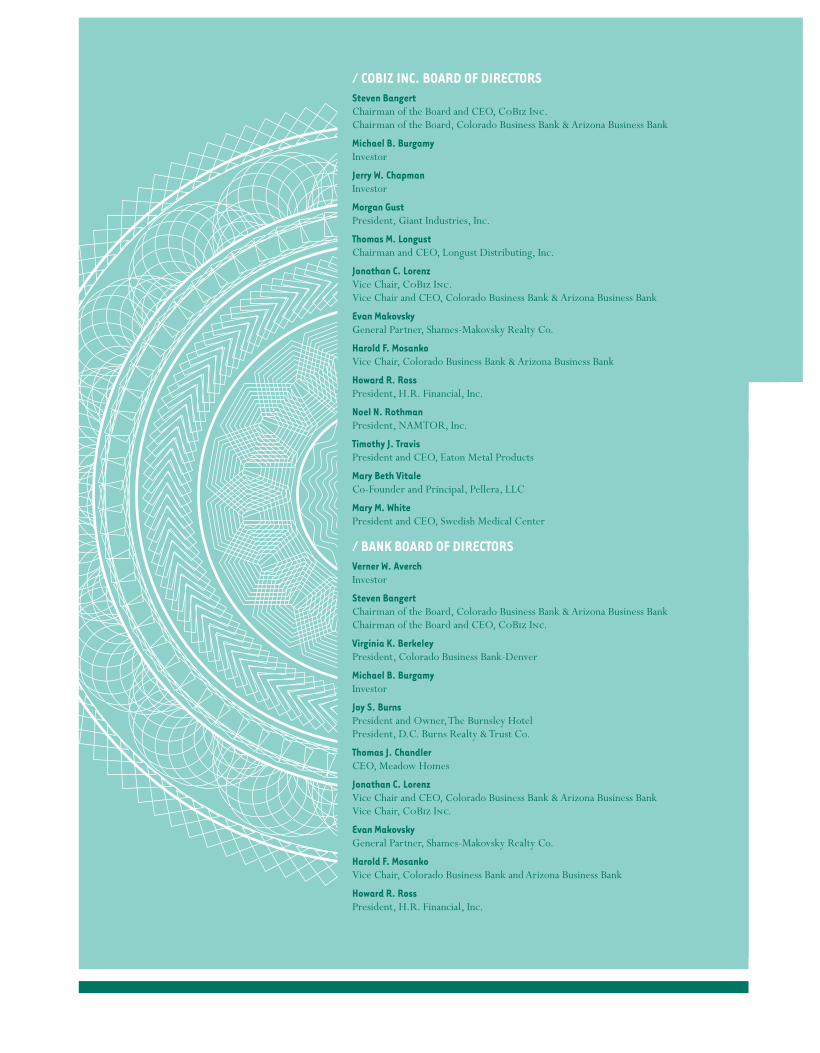
SEVEN INDEPENDENT ENTITIES...
/ COBIZ INC. BOARD OF DIRECTORS Steven Bangert Chairman of the Board and CEO, CoBiz Inc. Chairman of the Board, Colorado Business Bank & Arizona Business Bank
Michael B. Burgamy Investor
Jerry W. Chapman Investor
Morgan Gust President, Giant Industries, Inc.
Thomas M. Longust Chairman and CEO, Longust Distributing, Inc.
Jonathan C. Lorenz Vice Chair, CoBiz Inc. Vice Chair and CEO, Colorado Business Bank & Arizona Business Bank
Evan Makovsky General Partner, Shames-Makovsky Realty Co.
Harold F. Mosanko Vice Chair, Colorado Business Bank & Arizona Business Bank
Howard R. Ross President, H.R. Financial, Inc.
Noel N. Rothman President, NAMTOR, Inc.
Timothy J. Travis President and CEO, Eaton Metal Products
Mary Beth Vitale Co-Founder and Principal, Pellera, LLC
Mary M. White President and CEO, Swedish Medical Center / BANK BOARD OF DIRECTORS Verner W. Averch Investor
Steven Bangert Chairman of the Board, Colorado Business Bank & Arizona Business Bank Chairman of the Board and CEO, CoBiz Inc.
Virginia K. Berkeley President, Colorado Business Bank-Denver
Michael B. Burgamy Investor
Joy S. Burns President and Owner, The Burnsley Hotel President, D.C. Burns Realty & Trust Co.
Thomas J. Chandler CEO, Meadow Homes
Jonathan C. Lorenz Vice Chair and CEO, Colorado Business Bank & Arizona Business Bank Vice Chair, CoBiz Inc.
Evan Makovsky General Partner, Shames-Makovsky Realty Co.
Harold F. Mosanko Vice Chair, Colorado Business Bank and Arizona Business Bank
Howard R. Ross President, H.R. Financial, Inc.
COLORADO BUSINESS BANK
ARIZONA BUSINESS BANK
FINANCIAL DESIGNS LTD.
GREEN MANNING & BUNCH, LTD.
ALEXANDER CAPITAL MANAGEMENT GROUP
COBIZ INSURANCE, INC.
COBIZ PRIVATE ASSET MANAGEMENT

CoBiz Inc. 2005 Annual Report / TAKING SHAPECORPORATE HEADQUARTERS821 Seventeenth StreetDenver, Colorado 80202ph 303 / 312 / 3412fx 303 / 244 / 9700
INVESTOR RELATIONSLyne Andrich / [email protected] Hermann / [email protected]
TRANSFER AGENTComputershare Trust Company350 Indiana Street, Suite 800Golden, CO 80401303 / 262 / 0600
NASDAQ / COBZ
WWW.COBIZINC.COM
Co
Biz Inc. / 2005 A
nn
ual Report