Embed Size (px)
Citation preview

American Economic Journal: Applied Economics 2020, 12(2): 250–277 https://doi.org/10.1257/app.20180438
250
Taken by Storm: Hurricanes, Migrant Networks, and US Immigration†
By Parag Mahajan and Dean Yang*
Do negative shocks in origin countries encourage or inhibit inter-national migration? What roles do networks play in modifying out-migration responses? The answers to these questions are not theoretically obvious, and past empirical findings are equivocal. We examine the impact of hurricanes on a quarter century of interna-tional migration to the United States. Hurricanes increase migra-tion to the United States, with the effect’s magnitude increasing in the size of prior migrant stocks. We provide new insights into how networks facilitate legal, permanent US immigration in response to origin country shocks, a matter of growing importance as climate change increases natural disaster impacts. (JEL F22, J15, Q54, Z13)
Moving away from one’s country of origin is among the most consequential decisions a person can make. A substantial number of people migrate inter-
nationally: estimates of migration over the periods of 1990–1995 and 2006–2010 range from 34 to 41 million international migrants, or roughly 0.6 percent of world population (Abel and Sander 2014). Substantially larger numbers—more than 600 million adults—express a desire to move permanently to another country (Torres and Pelham 2008). Labor migration to the developed world leads to large income gains for migrants (McKenzie, Stillman, and Gibson 2010), which benefits not only the migrants themselves but also those remaining in origin countries. Remittances sent by migrants to their home countries amounted to $432 billion in 2015, far exceeding
* Mahajan: Department of Economics and Gerald R. Ford School of Public Policy, University of Michigan, Weill Hall, 735 S. State Street, Ann Arbor, MI 48104 (email: [email protected]); Yang: Department of Economics and Gerald R. Ford School of Public Policy, University of Michigan, 3315 Weill Hall, 735 S. State Street, Ann Arbor, MI 48104, NBER, and BREAD (email: [email protected]). Seema Jayachandran was coeditor for this article. We sincerely thank J. Clint Carter of the Michigan Research Data Center (MRDC) for his invaluable help and support. We appreciate feedback from seminar participants at U. Pompeu Fabra, LSE, Notre Dame, UC San Diego, U. Michigan, U. Philippines (Diliman), the CReAM/RWI Migration Workshop (Essen), the Centro Studi Luca d’Agliano/Colegio Carlo Alberto/FIERI Migration Conference (Turin), and the OECD-CEPII Immigration Conference (Paris). Jared Stolove and Colin Case provided excellent research assistance. Jarcy Zee provided excel-lent data visualization assistance. Any opinions and conclusions expressed herein are those of the authors and do not necessarily represent the views of the US Census Bureau. All results have been reviewed to ensure that no confidential information is disclosed.
† Go to https://doi.org/10.1257/app.20180438 to visit the article page for additional materials and author disclosure statement(s) or to comment in the online discussion forum.
VOL. 12 NO. 2 251MAHAJAN AND YANG: TAKEN BY STORM
official development assistance (World Bank Group 2018), with substantial benefits for recipient households.1
It is also important to understand the economic impact of natural disasters and how those affected cope in their aftermath. Natural disasters cause extensive human loss and economic damage worldwide. Hurricanes are among the most damaging, accounting for roughly 40 percent of deaths and 38 percent of mon-etary damages caused by all natural disasters from 1995 to 2015 (CRED 2015). Migration in response to a natural disaster can help affected populations escape worsened living conditions in their home areas (Piguet, Pécoud, and Guchteneire 2011). Understanding the effects of weather-related disasters becomes additionally important due to climate change. Anthropogenic warming of the climate has been linked to increased frequency and intensity of Atlantic hurricanes from the 1970s to the present (Walsh et al. 2016). Climate models predict increased frequency of hur-ricanes and intense accompanying rainfall as the planet continues to warm (Kossin et al. 2017). A better understanding of the impacts of hurricanes on migration, and the extent to which such impacts are heterogeneous across storm-affected areas, can be an important input into estimates of the economic and human impacts of climate change.
In this context, a number of interrelated questions emerge. Do negative shocks in migrant-origin countries encourage or inhibit international migration? What roles do prior migrant networks play in facilitating the out-migration response to ori-gin-country shocks? If the effect on migration is positive, does it occur via legal or illegal (undocumented) channels? To what extent is any resulting migration tempo-rary or permanent? None of these questions have obvious answers from a theoretical standpoint, and past empirical findings are either nonexistent or point in different directions across studies.
We estimate the impact of hurricanes on international migration to the United States from 159 origin areas over a quarter century, examine how this response is moderated by the existence of prior migrant networks, and assess the extent to which migration responses operate via legal or illegal (undocumented) channels. Theoretically, the impact of hurricanes on migration, and the extent to which the effect of hurricanes is heterogeneous with respect to prior migrant networks, is unclear. Consider individuals choosing whether to stay in home locations or to bear a fixed cost and migrate to a more attractive destination. Home-location negative shocks have an ambiguous effect on migration; while they raise the return to migra-tion, they also can raise the fixed cost of migration (or make it more difficult to finance migration fixed costs). In addition, the extent to which prior migrant net-works stimulate additional migration in response to home-country shocks is unclear. On the one hand, prior migrant networks can reduce the fixed cost of migrating, making migration more responsive to negative shocks at home. On the other hand, insurance provided by prior migrants (remittances sent in the wake of shocks) can reduce the desire to migrate.
1 Studies include Yang and Martinez (2006); Yang (2006); Yang (2008b); Gibson, McKenzie, and Rohorua (2014); Ambler, Aycinena, and Yang (2015); Clemens and Tiongson (2017); and Theoharides (2018).

252 AMERICAN ECONOMIC JOURNAL: APPLIED ECONOMICS APRIL 2020
Our empirical work aims to resolve these theoretical ambiguities in an important international migration context. Our outcome of interest is annual US immigration rates from 1980 to 2004 for each observable origin location, as constructed from US Census data. We exploit exogenous variation in the returns to migration, as well as substantial cross-sectional variation in a key determinant of the fixed cost of migration. Variation over time in the return to migration from home locations is generated by hurricanes, which exogenously lowers the attractiveness of remaining at home.2 Variation in the fixed cost of migration is generated by the size of migrant networks in the United States (the stock of previous migrants). We examine whether increases in the returns to migration driven by origin-country hurricanes have larger impacts on migration from countries that have larger preexisting migrant networks in the United States.
We find that hurricanes cause immediate and substantial increases in US immi-gration on average. A one-standard-deviation increase in our measure of hurri-cane affectedness increases migration to the United States (as a share of the home country population) by 0.021 percent, which is 11.8 percent of the sample mean annual migration rate. This effect is magnified among origin countries with larger preexisting stocks of US immigrants. The effect of hurricanes on migration is posi-tive for countries with a migrant stock in the United States (as share of 1980 popu-lation) of at least 0.86 percent—roughly the seventieth percentile across countries.3 For a country at the ninetieth percentile of the prior migrant stock (5.6 percent of origin population), a one-standard-deviation increase in our measure of hurricane affectedness causes an inflow amounting to 0.029 percent of the origin population.
A key question is whether the migrant stock should be interpreted primarily as affecting migration-related fixed costs, or whether it stands in for some other omit-ted variable. We take two approaches to address this issue. First, we seek evidence for mechanisms behind the heterogeneous effect. We find that a key role played by migrant stocks is formally sponsoring relatives for legal, permanent immigration. If we replace our dependent variable of interest with legal immigration counts from the US Department of Homeland Security (DHS), our coefficient estimates are very similar in magnitude. There is clearly a substantial legal, permanent immigration response to hurricanes. This legal, permanent immigration is driven primarily by different forms of family sponsorship. These findings strongly suggest that migrant stocks reduce the fixed cost of migration by facilitating legal immigration.
Our second approach to addressing omitted-variable concerns is to gauge the sta-bility of our key parameter, the coefficient on the hurricane-migrant stock interaction term, to the inclusion of additional control variables for other origin country char-acteristics, such as per capita GDP, distance from the United States, and land area.4 We show that the coefficient on our interaction term of interest is highly robust to
2 Yang (2008a); Noy (2009); Strobl (2011); Imberman, Kugler, and Sacerdote (2012); Hsiang and Jina (2014); Boustan et al. (2019); and Franklin and Labonne (2019), among others.
3 In the regression where the effect of hurricanes is allowed to vary with respect to the size of a country’s prior US migrant stock, the main effect of hurricanes is negative (although statistically not significantly different from zero).
4 Because our coefficient of interest is on an interaction term with hurricanes, these predetermined control vari-ables must also be included as interaction terms in the same way.

VOL. 12 NO. 2 253MAHAJAN AND YANG: TAKEN BY STORM
inclusion of interaction terms with these country characteristics. Hurricanes appear to have heterogeneous effects across countries due to migrant stocks themselves, and not some other origin-country characteristic correlated with migrant stocks.
This paper presents a set of interrelated empirical findings that, to our knowledge, are new to the literature. It is among the first to test whether the migration response to negative home-country shocks is larger when the stock of prior migrant compa-triots is larger. Previous work has examined the relationship between migration and prior migrant stocks,5 on the one hand, or between migration and home-country shocks, on the other, but not the interaction (how the migration response to shocks is affected by prior migrant stocks).6 This is an important question whose answer is not theoretically obvious. Our findings help us better understand the risk-coping role of prior migrant stocks. They can also help policy makers predict how migra-tion may respond to future shocks, as populations of potential migrants, as such responses will vary with the size of their prior migrant stocks.
While prior research highlights multiple ways in which migrant networks might facilitate new migration, our work contributes by providing clear evidence of a par-ticular mode of assistance: a less costly, legal route to immigration through family reunification immigration policies. This was not obvious ex ante; prior studies have highlighted other factors such as financial assistance, information provision, and social support.7 In addition, no prior work has shed light on the extent to which shock-induced migrants enter via legal or undocumented channels, or shown that home-country shocks affect new migration on both permanent (green card) and tem-porary (nonimmigrant visa) margins.
Another distinguishing feature of our work is that our focus is the United States, the world’s largest migration destination country. Migration to the United States accounted for 18.5 percent of international migration flows from 1990 to 2010 (Abel and Sander 2014). Our US focus reduces concern about external validity of the find-ings. One of our empirical results that is not as new or unique takes on added rele-vance due to the importance of the United States as a migration destination. While other studies have estimated how negative shocks in home areas affect out-migra-tion, it is important to know that, on average across all origin countries, a very important type of negative shock (hurricanes) increases migration to the world’s largest migration destination.8
5 Studies using “shift-share” instruments (e.g., Card 2001 and many others) have established that aggregate immigration inflows tend to be apportioned to subnational locations based on the geographic distribution of previ-ous migrants. In contrast to most studies using shift-share instruments, we examine an aggregate shifter, hurricanes, which is clearly exogenous. That said, in this paper we are not instrumenting for total immigration into particular labor markets. Hurricanes are not likely to provide sufficient statistical power for analyzing impacts of immigration on local labor market outcomes.
6 Clemens (2017) finds that previous migration facilitates new migration of Central Americans in response to violence in home localities.
7 Key references include Hatton and Williamson (1994); Massey (1988); Orrenius (1999); Munshi (2003); Amuedo-Dorantes and Mundra (2007); Dolfin and Genicot (2010); Beaman (2012); Docquier, Peri, and Ruyssen (2018); and Blumenstock, Chi, and Tan (2018). None of these other factors are ruled out, of course, and our study is not well-positioned to shed light on these other factors.
8 Focusing on the United States also has the advantage of providing us considerable cross-sectional and tempo-ral variation across countries in hurricane-induced shocks to migration returns, as well as cross-sectional variation in migrant networks across origin locations.

254 AMERICAN ECONOMIC JOURNAL: APPLIED ECONOMICS APRIL 2020
This study also makes advances related to data. To our knowledge, this is the first empirical analysis of US immigration that uses restricted-access US Census data to construct country-by-year inflow estimates. Based on 1-in-6 long-form US Census responses, our migration measures are more precise than any previous survey-based estimates used to examine the causal determinants of US immigration. Relatedly, we are able to analyze migration flows from a larger sample of countries than is avail-able in the public US Census data. This provides additional identifying variation because many small countries (e.g., island nations) are also hurricane-prone. We supplement these data with administrative immigration data from the DHS, which are also rarely used in economic analyses of migration. Finally, we construct hur-ricane-affectedness measures from satellite-based meteorological data, which are less prone to measurement error and biases than other disaster data sources (Yang 2008a).
Our work is related to research on migratory responses to the returns to migra-tion, and in particular to work emphasizing causal identification. Past studies have found that increases in the returns to migration, driven by shocks in either sending or receiving areas, do increase net out-migration. In some studies the identifying variation comes from shocks in the source locations,9 while in others the variation in returns is generated by shocks in destination locations.10 Other studies have found the opposite—that increases in the returns to migration driven by negative shocks in home areas lead to less out-migration (Halliday 2006, Yang and Choi 2007, Yang 2008c)—which may reflect the importance of migration fixed costs in combination with liquidity or credit constraints.11
We proceed next to Section I, where we outline a simple theoretical framework to guide the interpretation of our findings. Section II provides an overview of rele-vant US immigration policy. Section III describes the data used in the analyses, and Section IV reports empirical results. Section V concludes.
I. Conceptual Matters
We first take a moment to consider theoretically how hurricanes might affect out-migration decisions, and how the effects of hurricanes might differ with respect to the size of prior migrant networks. We discuss these issues qualitatively here, and provide a simple theoretical framework in the online Appendix.
9 For example, Hatton and Williamson (1993); Munshi (2003); Hanson and McIntosh (2012); Hornbeck (2012); Marchiori, Maystadt, and Schumacher (2012); Bohra-Mishra, Oppenheimer, and Hsiang (2014); Gröger and Zylberberg (2016); Abarcar (2017); Baez et al. (2017); Boustan et al. (2019); Clemens (2017); Kleemans and Magruder (2018); and Minale (2018).
10 For example, Yang (2006); Wozniak (2010); McKenzie, Theoharides, and Yang (2014); Bertoli, Fernández-Huertas Moraga, and Keita (2017); Fajardo, Gutiérrez, and Larreguy (2017).
11 Consistent with liquidity constraints inhibiting migration, Ardington, Case, and Hosegood (2009); Bryan, Chowdhury, and Mobarak (2014); and Angelucci (2015) find that cash transfers increase migration. Chernina, Dower, and Markevich (2014) similarly find that the easing of liquidity constraints generated by titling reforms in early twentieth-century Russia facilitated out-migration. Stecklov et al. (2005) and Imbert and Papp (2018) find contrary results to these. Bazzi (2017) finds that positive income shocks in origin areas in Indonesia lead to less migration in wealthier areas and more in poorer ones. Boustan et al. (2019) find that hurricanes in the United States lead to more internal migration, particularly among those with higher incomes.

VOL. 12 NO. 2 255MAHAJAN AND YANG: TAKEN BY STORM
Consider individuals in a migrant-origin area choosing whether to stay in home locations or to bear a fixed cost and migrate to a more attractive destination (which, in practice, we will take to be the United States). The fixed cost of migration is a function of the size of a migrant’s network. Prior research suggests that the fixed cost of migration is lower when an individual has a larger migrant network (e.g., Bauer et al. 2005) for a number of potential reasons. Networks could help reduce search and information costs (e.g., costs related to legal and illegal modes of entry, employment, housing, etc.), provide social support during adjustment (a reduction in psychic costs), and sponsor relatives for legal immigration (allowing migrants to avoid costlier illegal entry routes and wait times imposed by quotas).12
Now consider a negative shock to economic conditions in the home country, such as a hurricane, which makes the destination country more attractive in relative terms. If the negative home-country shock has no effect on migration costs, the prediction is straightforward: migration will increase.
However, the hurricane’s effect becomes ambiguous if the negative shock to the home country does affect migration costs. It is most plausible that negative home-country shocks would raise migration costs. Increased demand for legal migration assistance as well as illegal migration services (migration smugglers or coyotes) could raise equilibrium prices for those services. In addition, loss of assets due to hurricanes could make it more difficult for credit-constrained households to pay fixed migration costs. Negative shocks at home could make it more diffi-cult to obtain credit to pay for the fixed costs of migration (Yang 2008c), or could raise the opportunity cost of departure (Halliday 2006). Negative aggregate shocks could also have general equilibrium effects that make it more difficult to pay fixed migration costs, such as reductions in asset prices (Rosenzweig and Wolpin 1993) or wages (Jayachandran 2006).
So far, we have emphasized migrant networks helping those in the home country respond to shocks by helping them migrate. But migrants can, of course, also assist in other ways. Migrants’ geographic separation means their shocks are less correlated with those in the home area, and so they are valued as members of the informal insurance network.13 Migrants are therefore in a good position to provide insur-ance, by sending financial assistance (remittances) in response to negative shocks at home.14 Better insurance at home can reduce the impact of home-area shocks on migration, because those affected by a shock can cope “in place” without migrating to escape the consequences (Morten 2019). The extent of insurance (the fraction of the loss replaced) is likely to be larger when the migrant network is larger (as a share of home-country population); when migrant networks are larger, more individuals in the home country should have a migrant social network member, and the financial
12 These points have been emphasized by Massey (1988), Jasso and Rosenzweig (1989), Orrenius (1999), Orrenius and Zavodny (2005), Dolfin and Genicot (2010), and Comola and Mendola (2015). Networks could also provide financial assistance with paying fixed migration costs, which would be important in contexts where poten-tial migrants are liquidity or credit constrained.
13 There is a large body of work on how households in developing countries cope with risk (Morduch 1995). Lucas and Stark (1985), Rosenzweig and Stark (1989), and Munshi and Rosenzweig (2016) have emphasized the role of migration and remittances for informal risk-coping strategies.
14 Jayachandran (2006); Yang and Choi (2007); Yang (2008a); Jack and Suri (2014); Blumenstock, Eagle, and Fafchamps (2016); De Weerdt and Hirvonen (2016); and Clemens (2017).

256 AMERICAN ECONOMIC JOURNAL: APPLIED ECONOMICS APRIL 2020
burden of supporting disaster-affected home-country residents can be spread across more migrants. Therefore, the possibility of migrants sending shock-coping remit-tances attenuates the effect of shocks on new migration.
In sum, the theoretical predictions are ambiguous: negative shocks to economic conditions in the home country could increase migration by increasing the return to migration. It is also possible for negative home-country shocks to reduce migra-tion, if such shocks themselves increase the fixed costs of migration or reduce the ability to pay migration fixed costs. Even if the shocks themselves do not make it more difficult to pay migration fixed costs, the extent to which migrant networks facilitate migration in response to shocks is unclear, because prior migrants can send remittances to those in the home country instead of helping them migrate in response to shocks. To resolve these theoretical ambiguities, we turn to empirical tests in Section IV.
II. Immigration Policy during the Sample Frame
Before moving to our analysis, we summarize US immigration policy from 1980 to 2004. The workings of US immigration policy help us highlight features of immi-grant stock networks that have the potential to facilitate immigration.
The outline of today’s US immigration policy has its origins in the 1965 Immigration and Nationality Act. This legislation abolished preferential treatment for Europeans and created a system in which a majority of visas were allocated to relatives of US citizens or residents. It was also the first law to distinguish between immediate relatives (spouses, children under age 21, and parents) of US citizens, who became exempt from quotas, and other types of immigrants who fell into one of seven new preference tiers subject to numerical limitations (Kandel 2018). Further, by 1979, all country-specific quotas were abandoned in favor of an over-all quota. In 1981, the overall quota stood at 270,000 for all those subject to the cap (Clark, Hatton, and Williamson 2007). Among the capped tiers, first preference goes to unmarried adult sons and daughters of US citizens, second preference goes to spouses and children of green card holders (LPRs), third preference goes to mar-ried sons and daughters of US citizens, and fourth preference goes to siblings of US citizens. Thus, while green card holders can sponsor a limited set of relatives from home, they are substantially constrained in this ability relative to naturalized immigrants.
The major change to policy that occurred during our sample period was the Immigration Act of 1990, which increased allowable total immigration to 675,000 and increased the limit of family-based immigrants subject to quotas from 290,000 to 480,000 (Kandel 2018). Technically, immediate relatives of US citizens came under this 480,000 cap for the first time, but in practice, the cap is “permeable” and inflows of such migrants remain de facto uncapped to the present day. The remaining 195,000 allotments are slotted for employment visas (140,000) and a new category of “diversity” visas (55,000) allocated to countries that did not send many migrants to the United States between 1965 and 1990 (Clark, Hatton, and Williamson 2007).
An additional change that occurred during our sample period was the 1986 Immigration Reform and Control Act (IRCA), which granted legal status to mil-

VOL. 12 NO. 2 257MAHAJAN AND YANG: TAKEN BY STORM
lions of undocumented workers. While this legislation had many consequences, it mainly affects our results through its disproportionate legalization of migrants from certain countries, perhaps creating a positive shock in the effective stock of network capital in the United States for these countries. This is especially true given how important legal status and citizenship are to being able to serve as a beachhead for compatriots under the current policy. A more minor point is that the legal permanent resident (LPR) status granted to these previously undocumented workers clearly did not result from new entries into the United States. We will thus subtract these “inflows” from our overall measure of LPR admissions in the DHS data.
III. Data
A. Sample Definition
Our sample consists of foreign territories listed in Table 1. Given how often many of these areas are hit by hurricanes and because of the level of detail our data affords us, we treat many nonsovereign territories as separate countries (e.g., Guadeloupe or Martinique).15 We drop countries that are US territories because of their pref-erential treatment in immigration policy. We also drop countries from the former Soviet Union and the European land mass.16 North Korea and Eritrea are excluded because of a lack of reliable migration information for the entire sample period. Additionally, some countries that contain inconsistent migration information due to border redefinition are combined to retain consistency throughout the sample period. These include the Netherlands Antilles minus Aruba,17 Sudan,18 and Guadeloupe.19 Finally, we also drop any country without an immigrant stock estimate from the 1980 US Census. This left us with a balanced panel of 159 countries.
B. Hurricane Index
Hurricanes are storms that originate over tropical oceans with wind speeds above 33 knots.20 These severe storms create damages through storm surges, strong winds, and flooding, and their radius of impact can be anywhere from 60 to 900 miles. Thus, depending on the severity of the storm, there is a wide scope for hurricanes to inflict extensive damage, particularly when infrastructure is weak and production is agriculture-oriented. Hurricanes occur in six basins: Atlantic, East Pacific, West Pacific, South Pacific, South Indian, and North Indian. Yang (2008a) provides a more detailed definition of hurricanes and their architecture.
15 From this point forward, use of the word “country” includes these nonsovereign territories.16 The splitting of the Soviet Union does not enable us to have reliable migration information for these countries
throughout the sample period. Europe is rarely hit by hurricanes, and because it contains mostly developed coun-tries is not likely to provide a useful migration counterfactual.
17 Curacao, Bonaire, Saba, St. Eustatius, and Sint Maarten. The Netherlands Antilles was not dissolved until 2010.
18 South Sudan and Sudan. South Sudan broke off from Sudan in 2011.19 Guadeloupe and St. Barthelemy. St. Barthelemy broke off from Guadeloupe in 2003.20 Hurricanes are also known in different regions as typhoons and cyclones. For simplicity, in this paper hurri-
canes, typhoons, and cyclones will all be referred to as hurricanes.

258 AMERICAN ECONOMIC JOURNAL: APPLIED ECONOMICS APRIL 2020
We construct a hurricane index representing the average hurricane exposure of residents in a given country-year following Yang (2008a). This index uses data from meteorological records rather than impact estimates compiled from news reports, governments, or other similar sources due to concerns about measurement error and potential misreporting of hurricane damages (motivated, for example, by a desire
Table 1—List of Countries in Sample
Afghanistan French Polynesia NigeriaAlgeria Gabon NiueAngola Gambia OmanAnguilla Ghana PakistanAntigua and Barbuda Grenada PanamaArgentina Guadeloupe Papua New GuineaAruba Guatemala ParaguayAustralia Guinea PeruBahamas Guinea-Bissau PhilippinesBahrain Guyana QatarBangladesh Haiti ReunionBarbados Honduras RwandaBelize Hong Kong SamoaBenin India Sao Tome and PrincipeBermuda Indonesia Saudi ArabiaBhutan Iran SenegalBolivia Iraq SeychellesBotswana Israel Sierra LeoneBrazil Ivory Coast SingaporeBritish Virgin Islands Jamaica Solomon IslandsBrunei Japan SomaliaBurkina Faso Jordan South AfricaBurma (Myanmar) Kenya South KoreaBurundi Kiribati Sri LankaCambodia Kuwait St. HelenaCameroon Laos St. Kitts-NevisCanada Lebanon St. LuciaCape Verde Lesotho St. Vincent and the GrenadinesCayman Islands Liberia SudanCentral African Republic Libya SurinameChad Macau SwazilandChile Madagascar SyriaChina Malawi TaiwanColombia Malaysia TanzaniaComoros Maldives ThailandCongo Mali TogoCook Islands Martinique TokelauCosta Rica Mauritania TongaCuba Mauritius Trinidad and TobagoCyprus Mexico TunisiaDemocratic Republic of Congo (Zaire) Micronesia TurkeyDjibouti Mongolia Turks and Caicos IslandsDominica Montserrat UgandaDominican Republic Morocco United Arab EmiratesEast Timor Mozambique UruguayEcuador Namibia VanuatuEgypt Nauru VenezuelaEl Salvador Nepal VietnamEquatorial Guinea Netherlands Antilles Wallis and Futuna IslandsEthiopia New Caledonia Western SaharaFalkland Islands New Zealand YemenFiji Nicaragua ZambiaFrench Guiana Niger Zimbabwe
Note: See Section III for details on sample selection.

VOL. 12 NO. 2 259MAHAJAN AND YANG: TAKEN BY STORM
to attract greater international disaster assistance). The meteorological data on hur-ricanes consists of “best tracks” compiled by Unisys from the National Oceanic and Atmospheric Administration’s Tropical Prediction Center (for the Atlantic and East Pacific hurricane basins) and the Joint Typhoon Warning Center (for the West Pacific, South Pacific, South Indian, and North Indian hurricane basins). The best tracks contain information on the hurricane’s maximum wind speed and the geo-graphic coordinates of its center (or “eye”) at six-hour intervals. Figure 1 displays all hurricane best tracks from 1980 through 2004.
The best track data naturally take hurricanes as the unit of analysis, and so in their raw form give no indication of countries affected. The online Appendix describes in detail how we turn this best track data into a country-by-year index. Other papers have utilized similar hurricane indices to study their impacts on various outcomes on land masses (Belasen and Polachek 2009, Hsiang 2010, Strobl 2011, Hsiang and Jina 2014). All use a model based on best tracks to simulate the wind speed faced by geographical areas a certain distance away from the best track line.21
The resulting index can be described as “intensity-weighted hurricane events per capita,” in which intensity is a nonlinear function of hurricane-force wind speed. The key features of this index are that it measures the average “affectedness” by hurricanes for residents of a country in a given year. The index rises in the number of hurricanes affecting a country, the share of the population affected, and in the
21 Strobl (2011) uses population weights when measuring the effect of hurricanes on economic activity, while Hsiang and Jina (2014) do not.
Figure 1. Hurricane Best Tracks: 1980–2004
Source: Unisys Weather data. Raw data available upon request.

260 AMERICAN ECONOMIC JOURNAL: APPLIED ECONOMICS APRIL 2020
intensity (wind speed) of the hurricanes to which people were exposed. In Table 2 we provide basic summary statistics of the hurricane index. Out of 3,895 coun-try-year observations, 641 have nonzero values of the index. The standard deviation of the nonzero values is 0.0542.
C. Immigrants in the United States: Stocks and Inflows
US Census Bureau.—The primary source for our immigration data is confidential data provided by the US Census Bureau, who granted us access to the full set of responses from the 1980 and 2000 Census long-form questionnaires along with the 2005 through 2015 American Community Survey (ACS) 1-year files. The 1980 and 2000 Census long-form questionnaires provide 1 in 6 counts of all persons living in the United States along with demographic information.22 The ACS 1-year files pro-vide a one percent sample of all persons living in the United States in a given year. The online Appendix describes how we utilize these data sources to construct two
22 In 1970, the US Census Bureau began sending both a short-form and long-form questionnaire to households. The long form is sent to roughly 1 in 6 households, and remaining households are sent the short form. Many demo-graphic variables of interest are only contained in the responses to long-form questionnaires—the recent contro-versy surrounding a 2020 citizenship question on the short-form questionnaire notwithstanding. Most importantly here, the 1980 Census long-form questionnaire contained questions on place of birth and citizenship, while the 1980 Census short-form questionnaire did not.
Table 2—Summary Statistics
Percentile
Mean SD 10 25 50 75 90 N Source
Hurricane index 0.00402 0.02373 0 0 0 0 0.00064 3,895 UnisysHurricane index (if > 0) 0.02451 0.05417 0.00001 0.00014 0.00190 0.01903 0.07709 639 Unisys1980 population (thousands) 21,627 96,379 60 250 3,027 11,095 38,124 159 UN and Census
IDBAs a proportion of 1980 population:Annual migrants 0.00183 0.00296 0.00004 0.00010 0.00039 0.00210 0.00625 2,200 IPUMS a Annual immigrants 0.00144 0.00340 0.00001 0.00005 0.00022 0.00125 0.00456 2,573 DHSAnnual nonimmigrant entries 0.06144 0.22257 0.00019 0.00059 0.00418 0.02109 0.11090 2,208 DHSAnnual immediate family immigrants
0.00051 0.00109 0 0.00002 0.00009 0.00046 0.00174 2,573 DHS
Annual family-sponsored immigrants
0.00047 0.00138 0 0 0.00003 0.00030 0.00147 1,476 DHS
1980 stock of immigrants 0.01594 0.03100 0.00020 0.00037 0.00250 0.01573 0.06160 150 a IPUMS a 1980 stock of citizen immigrants 0.00615 0.01471 0.00004 0.00009 0.00068 0.00469 0.02099 150 a IPUMS a 1980 stock of noncitizen immigrants
0.00979 0.01746 0.00012 0.00029 0.00165 0.01113 0.03320 150 a IPUMS a
Notes: See the online Appendix for details on the creation of the hurricane index. The second row shows summary statistics for the hurricane index conditional on it being greater than zero. “Immediate family” refers to parents, children, or spouses of US citizens—these admissions are uncapped. “Family-sponsored” immigrants are those whose admissions are capped, but who enter through family sponsorship.
a Statistics constructed using Census public-use microdata obtained from IPUMS-USA (Ruggles et al. 2019) rather than RDC data to avoid confidentiality issues, which explains the loss in sample size. These are not the data used in regression model estimation.
Sources: DHS data obtained from electronic copies of the Yearbook of Immigration Statistics for 1996–2004 and the Statistical Yearbook of the Immigration and Naturalization Service for prior to 1996. UN data obtained from the United Nations Population Division (Department of Economic and Social Affairs 2017). Census IDB data obtained from the Census Bureau’s International Data Base (2017).

VOL. 12 NO. 2 261MAHAJAN AND YANG: TAKEN BY STORM
key variables: sending-country-by-year estimates of migration inflow rates ( m jt ) and sending-country estimates of 1980 US immigrant stocks ( s j,1980 ).
Department of Homeland Security (DHS).—Our second source of migration inflow data comes from the DHS. In addition to producing the annual Yearbook of Immigration Statistics (1996–2004), the DHS houses the records of the former Immigration and Naturalization Service (INS), who produced similar publications for past years titled the Statistical Yearbook of the Immigration and Naturalization Service (prior to 1996). Starting in 1982, these annual publications contain counts of legal permanent residence (LPR) statuses granted by country of last residence, which we use to construct an alternate measure of migration inflows. They also con-tain information on nonimmigrant entries into the United States by country of birth and class of admission starting in 1983, which we use to construct a new panel that measures potentially temporary migration.23 Data through 1996 are available only as hard copy portable documents. We thus double-entered and cross-checked each relevant table to ensure accuracy in these outcome variables.24
The DHS data provides some important advantages over our confidential US Census data beyond their use as a robustness check. First, the counts were all taken officially during the year of a given immigrant’s receipt of LPR status or nonimmi-grant entry and thus do not suffer from attrition due to death or return migration. Second, in the case of LPR entries, country of last residence provides a more direct indicator of hurricane-induced migration than country of birth. Third, the DHS data allow us to separate classes of LPR admission, such as uncapped family reunifica-tion, capped family sponsorship, and refugees. This allows us to examine whether eligibility for immigration due to family-reunification policies is a mechanism through which our effects operate.
Finally, the nonimmigrant entry panel allows us to understand two additional facets of hurricane-induced migration into the United States. First, it helps us assess whether there is a component of such migration that is potentially tempo-rary. Second, it helps us elucidate the phenomenon of conditional entry followed by either a switch of status or an overstay on a temporary visa, a process through which much legal and illegal permanent migration occurs.
There are, however, also drawbacks to the DHS data that highlight its complemen-tarity with our estimates from the confidential US Census data. First, the DHS LPR measures do not distinguish between new inflows and changes in status from tempo-rary to permanent residence. Second and relatedly, backlogs and backlog reduction efforts create uncertainty around how reliably the DHS estimates can be used to measure changes in actual entries over time—as compared to switches in status from temporary to permanent. Third, the DHS data cannot shed light on undocumented entries, while these may be captured by the US Census and ACS surveys (which
23 According to the DHS Office of Immigration Statistics, nonimmigrant data are not available in 1997 due to concerns about data quality in that year.
24 The hard copies are available at the US Citizenship and Immigration Services (USCIS) Historical Library’s General Collection.

262 AMERICAN ECONOMIC JOURNAL: APPLIED ECONOMICS APRIL 2020
purposely do not inquire about legal status).25 Fourth, while it contains information about class of admission, the DHS does not allow us to examine many other import-ant demographic characteristics of migrants, such as age. Finally, neither the US Census nor the DHS data can correct for migrants who still live abroad but obtain a green card (LPR status) to engage in repeated circular migration.
IV. Analysis
A. Specification
In order to test the theoretical implications described in Section I, we exploit the exogeneity of our objective hurricane index and conduct reduced-form analyses that test its impact on migration inflows to the United States. For this purpose, we rely primarily on two specifications:
(1) y jt = β 0 + β 1 H jt + η j + δ t + ϕ j t + ε jt ,
(2) y jt = γ 0 + γ 1 H jt + γ 2 ( H jt × s j,1980 ) + η j + δ t + ϕ j t + ε jt ,
where y jt is an outcome and t runs from 1980 through 2004. Our primary results are for y jt = m jt where m jt is the number of immigrants from country j to the United States in year t as a proportion of country j ’s population in 1980. Analogously, s j,1980 is the stock of immigrants from country j already in the United States in 1980 as a proportion of country j ’s population in 1980. Including stocks as a proportion of 1980 population also allows us to interpret s j,1980 as a rough measure of likelihood a given migrant knows someone in the United States. The variable H jt is the hurricane index for country j in year t .
The inclusion of year fixed effects ( δ t ) accounts for time-varying changes in the overall ability of foreigners to migrate to the United States. Common issues such as changing demand in the US economy and backlogs in the immigration system that are not country-specific are important components of δ t . Country fixed effects ( η j ) control for fixed factors that affect how likely denizens of country j are to migrate to the United States, such as distance. They also absorb the main effect of s j,1980 . We also allow for differential country-specific linear time trends with the inclusion of ϕ j t , which account for long-run linear trends in migration from country j to the United States. Standard errors are clustered at the country level.
A key coefficient of interest is β 1 , the average effect of hurricanes across all origin countries. In addition, we are interested in γ 1 and γ 2 ; γ 1 is the effect of hurricanes on migration in countries with zero prior migrant stock; γ 2 captures the heterogeneity in the effect of hurricanes on migration with respect to a country’s prior migrant stock. As discussed in Section I, the signs of all these coefficients are theoretically ambiguous, motivating our empirical analysis.
25 Individuals who are captured in the DHS nonimmigrant data may enter legally and then later overstay their visas, becoming undocumented.

VOL. 12 NO. 2 263MAHAJAN AND YANG: TAKEN BY STORM
B. Results
In the online Appendix, we first establish that our hurricane index captures events that create economically relevant losses in potential sending countries. In the con-text of our theoretical framework from Section I, we interpret these losses as an increase in the return to migration to the United States by generating asset losses, personal harm, and longer-run declines in economic growth. We focus here on our primary results, with m jt —immigrant inflows from country j in year t as a propor-tion of country j ’s 1980 population—as the outcome of interest. As described in the online Appendix, m jt is created using access to confidential data from the US Census Bureau. These data allow us to create accurate counts of immigrant inflows to the United States, even for small countries that often go overlooked in such studies.
Primary Results on Migration.—Table 3 presents the results of estimating equa-tions (1) and (2) with m jt as the outcome. Column 1 of panel A demonstrates that, on the whole, hurricanes induce positive levels of migration across our sample of 159 countries ( β 1 > 0 , statistically significantly different from zero at the 5 per-cent level). Column 2 illustrates that this effect operates largely through the stock channel, γ 2 > 0 (statistically significantly different from zero at the 5 percent level), suggesting that the ability of sending-country denizens to use migration as an ex post response to hurricanes relies heavily on the presence of an established network. This indicates a potentially crucial role for family reunification and other forms of sponsorship from within the United States in response to natural disasters abroad, motivating further investigation along these margins below.
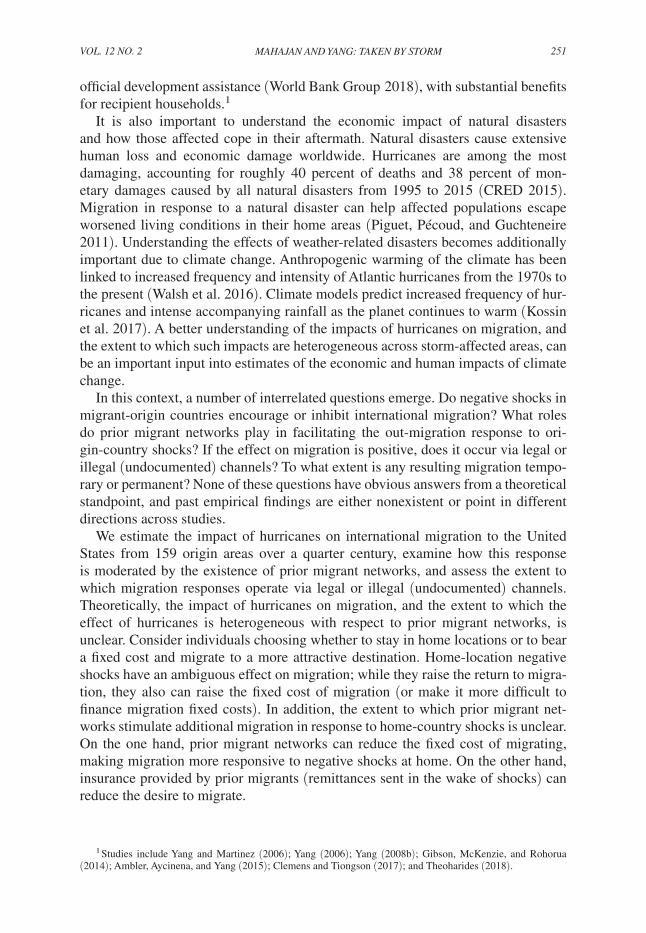
We further split m jt into separate age bins to investigate the characteristics of these hurricane-induced migrants. Table 4 shows that the youngest migrants (aged 0 to 12) as well as prime-aged migrants (aged 18 to 44) account for the majority of the effect seen in Table 3. Qualitatively, this aligns with the notion that working-aged adults and their children are most likely to respond to the combined impetus of an income shock and the preexistence of a migration network.
The average effect of hurricanes in the first column implies that a one-standard-deviation hurricane (0.054) would increase migration to the United
Table 3—The Effect of Hurricanes on Migration, 1980–2004
As a proportion of 1980 population
Migrants( t ) Migrants( t )(1) (2)
Hurricane index( t ) 0.0040 −0.0010(0.0020) (0.0010)
Hurricane index( t ) × 1980 proportional immigrant stock 0.1163(0.0451)
Country-years 3,900 3,900 R 2 0.4319 0.4409Countries 159 159
Notes: Each column refers to an OLS specification with a constant term, country fixed effects, year fixed effects, and country-specific time trends, along with the variables displayed. Standard errors clustered at the country level. See equations (1) and (2). “Migrants” and “1980 proportional immigrant stock” are constructed using restricted-ac-cess data from the US Census Bureau’s Research Data Center.
264 AMERICAN ECONOMIC JOURNAL: APPLIED ECONOMICS APRIL 2020
States by 0.00022 as a share of the home-country population (22 individuals per 100,000, or 0.022 percent). This is a substantial effect compared to sample statistics of the annual migration rate (Table 2), amounting to 11.8 percent of the sample mean (0.00183), 7.3 percent of the standard deviation (0.00296), and 10.8 percent of the interquartile range (0.002).
Column 2 of Table 3 reveals that the effect of hurricanes is magnified among ori-gin countries with larger preexisting stocks of US immigrants. In this regression, the main effect of hurricanes is negative (but not statistically significantly different from zero at conventional levels). The effect of hurricanes on migration becomes positive for countries with a migrant stock in the United States (as share of 1980 population) of at least 0.86 percent—roughly the seventieth percentile across countries. For a country at the ninetieth percentile of the prior migrant stock (6.1 percent of origin population), a one-standard-deviation increase in our measure of hurricane affect-edness causes an inflow amounting to 0.033 percent of the origin population. This is also a substantial effect compared to sample statistics of the annual migration rate. It is 18.2 percent of the sample mean, 11.2 percent of the standard deviation, and 16.7 percent of the interquartile range.
Table 4—The Effect of Hurricanes on Migration by Age Group, 1980–2004
Panel A. Children As a proportion of 1980 population
Age group of migrants( t ): 0 to 12 0 to 12 13 to 17 13 to 17
Hurricane index( t ) 0.0014 −0.0007 0.0006 0.0004(0.0007) (0.0004) (0.0005) (0.0006)
Hurricane index( t ) 0.0481 0.0057 × 1980 proportional immigrant stock (0.0138) (0.0076)Country-years 3,900 3,900 3,900 3,900 R 2 0.2293 0.2461 0.1794 0.1798Countries 159 159 159 159
Panel B. Prime-agedAge group of migrants( t ): 18 to 24 18 to 24 25 to 44 25 to 44
Hurricane index( t ) 0.0009 −0.0005 0.0010 −0.0004(0.0007) (0.0003) (0.0007) (0.0004)
Hurricane index( t ) 0.0329 0.0306 × 1980 proportional immigrant stock (0.0185) (0.0150)Country-years 3,900 3,900 3,900 3,900 R 2 0.2953 0.3010 0.3123 0.3155Countries 159 159 159 159
Panel C. OlderAge group of migrants( t ): 45 to 64 45 to 64 65 and older 65 and older
Hurricane index( t ) 0.0002 0.0006 −0.0001 −0.0005(0.0004) (0.0006) (0.0002) (0.0004)
Hurricane index( t ) −0.0083 0.0072 × 1980 proportional immigrant stock (0.0076) (0.0047)Country-years 3,900 3,900 3,900 3,900 R 2 0.1884 0.1906 0.1359 0.1403Countries 159 159 159 159
Notes: Each column within a panel refers to an OLS specification with a constant term, country fixed effects, year fixed effects, and country-specific time trends, along with the variables displayed. Standard errors clustered at the country level. See equations (1) and (2). “Migrants” and “1980 proportional immigrant stock” constructed using restricted-access data from the US Census Bureau’s Research Data Center.

VOL. 12 NO. 2 265MAHAJAN AND YANG: TAKEN BY STORM
Citizenship Status of Stock.—To begin exploring how these networks operate, we exploit the fact that the citizenship of respondents was recorded in the long-form 1980 Census. We thus examine how the citizenship status of the 1980 stock affects the response to hurricanes. Differences in the ability of citizens versus non-citizens to promote immigration allow us to roughly distinguish between different types of migrant network benefits. While both citizens and noncitizens can provide informational, financial, or psychic benefits, prior migrants who are citizens have the greatest ability to sponsor relatives for legal immigration (legally enshrined in the 1965 Amendments to the Immigration and Nationality Act). For example, in 2004, 42.9 percent of the 946,142 legal immigrants admitted to the United States were able to bypass numerical quotas because they were immediate relatives of US citizens. Another 12 percent were subject to numerical limitations, but also gained entry due to family sponsorship by a US citizen (Department of Homeland Security 2018).26 Thus, in the specification
(3) m jt = π 0 + π 1 H jt + π 2 ( H jt × s j,1980 citizen ) + π 3 ( H jt × s j,1980
non-cit ) + η j + δ t + ϕ j t + ε jt
we expect π 2 > π 3 . Table 5 shows evidence for this differential effect: only the interaction term on the US-citizen portion of the migrant stock has a positive and statistically significant coefficient. This motivates a deeper look into how different classes of legal entrants respond to natural disasters.
DHS Results.—For this purpose, we turn to data from the DHS Yearbook of Immigration Statistics and the former Immigration and Naturalization Service’s
26 Note that these “admissions” include new arrivals and changes of status.
Table 5—The Effect of Hurricanes on Migration by Citizenship of Stock, 1980–2004
As a proportion of 1980 population
Migrants( t ) Migrants( t )
Hurricane index( t ) −0.0010 −0.0005(0.0010) (0.0009)
Hurricane index( t ) × 1980 proportional immigrant stock 0.1163(0.0451)
Hurricane index( t ) × 1980 proportional immigrant citizen stock 0.4044(0.2245)
Hurricane index( t ) × 1980 proportional immigrant noncitizen stock −0.1444(0.1661)
Country-years 3,900 3,900 R 2 0.4409 0.4429Countries 159 159 p -value: equal interaction effect 0.1540
Notes: Each column refers to an OLS specification with a constant term, country fixed effects, year fixed effects, and country-specific time trends, along with the variables displayed. Standard errors clustered at the country level. See equations (2) and (3). “Hurricane index” refers to the hurricane index for a given country in year t . “Migrants,” “1980 proportional immigrant stock,” “1980 proportional immigrant citizen stock,” and “1980 proportional immi-grant noncitizen stock” constructed using restricted-access data from the US Census Bureau’s Research Data Center.
266 AMERICAN ECONOMIC JOURNAL: APPLIED ECONOMICS APRIL 2020
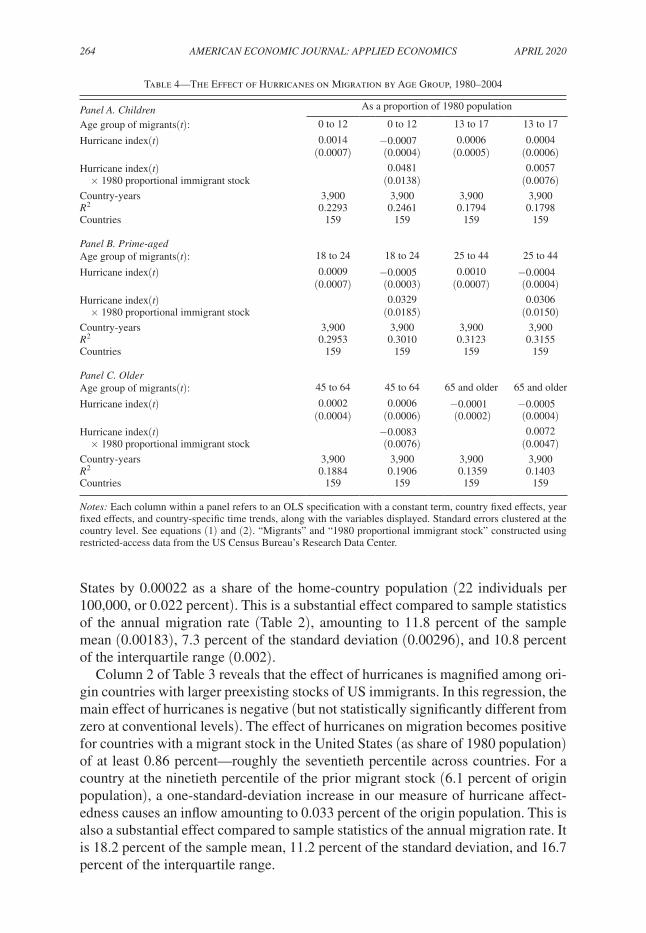
annual Statistical Yearbook of the Immigration and Naturalization Service, which allow us to separately examine entries of legal permanent residents (LPR) and legal nonimmigrants—those who are only granted temporary visas. This generates two new outcome variables, m jt
DHS where DHS = {LPR, non-imm} . Our specification remains largely the same, with one exception. The DHS data do not allow us to distinguish between new entries and changes of status. Well-known backlogs in the immigration processing system can therefore create lag between shocks in sending countries and the enumeration of a migrants who gain LPR status if they first enter as temporary residents. In 2013, for example, 54 percent of family-based immi-grants adjusted status from temporary to LPR compared to 46 percent who actually represented new entries (Kandel 2016). We therefore increase the lag order in our specification by taking a simple average of H jt and H j,t−1 , which we denote H j,t,t−1 . Our modified specifications become:
(4) m jt DHS = β 0 + β 1 H j,t,t−1 + η j + δ t + ϕ j t + ε jt ,
(5) m jt DHS = γ 0 + γ 1 H j,t,t−1 + γ 2 ( H j,t,t−1 × s j,1980 ) + η j + δ t + ϕ j t + ε jt .
The results from these models are presented in Table 6, where panel A presents the results using our restricted-access estimates of migration inflows for comparison.27
There is a robust, positive effect of the stock interaction term on legal migra-tion: γ 2 is estimated to be positive for both immigrant and nonimmigrant entries.
In the row titled “Proportion of census inflows” of each panel, we calculate the proportion of inflows implied by the second column, produced by restricted-access migration counts m jt in panel A, that can be explained by inflows reflected in panels B and C, produced by data from the DHS ( m jt
DHS ) . This is done by obtaining pre-dicted values from equation (5), then multiplying by 1980 country population and summing over these fitted values to produce aggregate inflow estimates implied for each outcome. We then divide these aggregate inflow estimates by the result of the same calculation from the second column of panel A.
This calculation reveals that DHS-recorded entries immediately following hurri-canes are larger than those that are enumerated in later US Census data. LPR hurri-cane-driven entries account for 2.47 times the corresponding number of entries in the US Census data. We interpret this ratio of 2.47 to indicate that the hurricane-respon-sive migration effects that we observe in the US Census data can be fully explained by entries of legal permanent residents. The fact that this ratio exceeds unity should not be cause for concern, because individuals who enter as LPRs immediately fol-lowing hurricanes could fail to appear in later US Census data for a number of rea-sons. Most prominently, large shares of immigrants to the United States do return to their home countries (or remigrate to third countries). Jasso and Rosenzweig (1982) estimate that up to 50 percent of the 1971 US immigrant cohort had remigrated by
27 The set of countries has been restricted to be the same across all estimated specifications. We lose three coun-tries to lack of available data from the DHS.

VOL. 12 NO. 2 267MAHAJAN AND YANG: TAKEN BY STORM
January 1979.28 On top of this, we must consider mortality rates, which we would expect to lead roughly one in ten LPR entries seen in the DHS results to not appear
28 Similarly high return or remigration rates from the United States have been estimated in earlier decades of the twentieth century (Chiswick and Hatton 2003; Bandiera, Rasul, and Viarengo 2013).
Table 6—The Effect of Hurricanes on Migration—Comparing Census to DHS Data
As a proportion of 1980 population
Panel A. Census, 1980–2004 Migrants( t ) Migrants( t )
Hurricane index( t, t − 1 ) 0.0046 −0.0012(0.0021) (0.0016)
Hurricane index( t, t − 1 ) × 1980 proportional immigrant stock 0.1235(0.0427)
Country-years 3,800 3,800Countries 156 156 R 2 0.4426 0.4475Proportion of census inflows 1
Panel B. DHS, 1982–2004 LPR( t ) LPR( t )
Hurricane index( t, t − 1 ) 0.0023 −0.0035(0.0040) (0.0039)
Hurricane index( t, t − 1 ) × 1980 proportional immigrant stock 0.1266(0.0402)
Country-years 2,600 2,600Countries 156 156 R 2 0.2954 0.2966Proportion of census inflows 2.47
Panel C. DHS, 1983–2004 Non-Immi( t ) Non-Immi( t )
Hurricane index( t, t − 1 ) 0.2193 −0.0627(0.0788) (0.0689)
Hurricane index( t, t − 1 ) × 1980 proportional immigrant stock 5.7883(2.3536)
Country-years 2,200 2,200Countries 156 156 R 2 0.4485 0.4495Proportion of census inflows 50.51
Notes: Each column within a panel refers to an OLS specification with a constant term, country fixed effects, year fixed effects, and country-specific time trends along with the variables displayed. Standard errors clustered at the country level. See equations (1) and (2). “Migrants” and “1980 proportional immigrant stock” constructed using restricted-access data from the US Census Bureau’s Research Data Center. “LPR( t )” refers to the number of indi-viduals granted lawful permanent resident status from a given country in year t . “Non-Immi( t )” refers to the number of individuals who entered the US, enumerated by the DHS, from a given country in year t who were not granted lawful permant residence (e.g., tourists and those on student visas). “Hurricane index( t, t − 1 )” refers to the aver-age of a hurricane index for a given country across years t and t − 1 . “Proportion of census inflows” is calculated by multiplying the estimated coefficients by each country’s specific “Hurricane index( t, t − 1 )” and “1980 propor-tional immigrant stock”, summing them across country-years, then dividing by the same calculation made using the results from the second “Census” column.
Sources: Outcomes in panels B and C obtained from electronic copies of the Yearbook of Immigration Statistics for 1996–2004 (Department of Homeland Security 2018) and the Statistical Yearbook of the Immigration and Naturalization Service for prior to 1996 (Statistical Yearbook 1982–1995).

268 AMERICAN ECONOMIC JOURNAL: APPLIED ECONOMICS APRIL 2020
in the US Census data from 2000 and beyond.29 Another contributing but smaller factor is the undercounting of minorities in the US Census.
The combination of these factors can bring the initial ratio of 2.47 very close to 1. If we then consider statistical noise and measurement error (e.g., incorrect reported years of entry or country of origin), the magnitude of the migration impacts on LPR entries seen in the DHS data are quite consistent with magnitudes in regressions using US Census data. We conclude that the effects found in Table 3 and the second column of Table 6 are not in contradiction with one another, particularly when one considers the that these point estimates are each accompanied by 95 percent confidence intervals.
It is also important to keep in mind that the immediate impact of hurricanes on nonimmigrant (mainly tourist and business visa) entries (panel C of Table 6) is 50.51 times greater than the magnitudes seen in the regressions using US Census data. We interpret this very high ratio as implying that the vast majority of the individuals (essentially all, to a first approximation) who enter the United States on nonimmigrant visas in the wake of hurricanes stay only temporarily in the United States, eventually returning to their home countries (or perhaps to going to third countries).
The detail of the DHS data allows us to further probe some of the mechanisms implied by our results thus far. In particular, the citizenship results from Table 5, the large response of legal, permanent inflows from Table 6, and the realities of the US immigration system described in Section II suggest that family sponsorship may play a crucial role in allowing immigration to serve as an ex post response to natural disaster shocks in sending countries. Table 7 suggests that this is the case. More than a third of the network interaction effect detected for LPRs in Table 6 can be traced to parents, spouses, or children of US citizens—classes of immigrants who are not subject to numerical limitations. We further find that among immigrants who are subject to numerical limitations (“Capped Categories”), the network effect is espe-cially salient for family-sponsored entrants.30 Meanwhile, the effects of hurricanes on categories of entry that should not be affected by hurricanes in sending countries, such as employer-sponsored immigrants or diversity lottery winners, do not show the same heterogeneity with respect to migrant stocks.
C. Robustness and Mechanisms
The findings presented in Section IV are consistent with immigrant stocks reduc-ing the fixed cost of migration, allowing for a greater migratory response to hur-ricanes from source countries. There is, however, a concern of interpretation: the migrant stock could simply be correlated with omitted variables that are responsi-ble for this observed heterogeneity. To gauge the robustness of our network-driven interpretation of the results to omitted variable concerns, we estimate regressions with the following specification:
(6) m jt = γ 0 + γ 1 H jt + γ 2 ( H jt × s j,1980 ) + γ c ( H jt × c j ) + η j + δ t + ϕ j t + ε jt .
29 This is assuming an age-adjusted annual mortality rate of 1 percent, and that immigrants entered the United States relatively uniformly over the 25-year period of analysis.
30 Note that these data are only available starting in 1992.

VOL. 12 NO. 2 269MAHAJAN AND YANG: TAKEN BY STORM
This estimating equation modifies our main specification (2) by adding an addi-tional set of interaction terms with time-invariant control variables c j .
31
Control variables c j include a range of potential omitted variables. For exam-ple, s j,1980 may proxy for sending country incomes (log real 1980 GDP per capita). Countries with higher incomes may be expected to both have higher s j,1980 and more responsiveness to hurricanes if income makes credit constraints less binding for paying migration fixed costs. Financial development, measured by domestic credit as a proportion of GDP, may play a similar role. Migrant stocks may also proxy for distance to the United States, with closer countries having both a higher s j,1980 and lower migration fixed costs. We may expect that immigrant communities that are more concentrated geographically (say, in migrant enclaves) may be better able to
31 We also include interaction terms with c j missing , dummy variables that account for some of these variables
being unavailable for certain countries. When a variable is missing for a certain country, c j missing = 1 (and is 0
otherwise). When c j missing = 1 , we replace the missing value of c j with 0. The coefficient on the interaction term
with c j missing then represents heterogeneity in the responsiveness to hurricanes among all countries for which that
variable is missing. Note the vector of main effects are not included in the regression because they are absorbed by the country fixed effects.
Table 7—The Effect of Hurricanes on LPR Entries by Category—DHS Data
Legal, permanent immigration by categoryas a proportion of 1980 population
Panel A. Uncapped, immediate relatives Parents, spouses,of US citizens Parents Spouses Children and children
Hurricane index( t, t − 1 ) −0.0002 −0.0007 −0.0007 −0.0014(0.0003) (0.0006) (0.0008) (0.0014)
Hurricane index( t, t − 1 ) 0.0130 0.0150 0.0234 0.0457 × 1980 proportional immigrant stock (0.0069) (0.0065) (0.0167) (0.0189)Country-years 2,600 2,600 2,600 2,600 R 2 0.1609 0.1970 0.1200 0.1435Years 1982 to 2004 1982 to 2004 1982 to 2004 1982 to 2004Countries 156 156 156 156
Family Employer DiversityPanel B. Capped categories Refugee sponsored sponsored lottery
Hurricane index( t, t − 1 ) 0.0003 −0.0019 0.0001 −0.0001(0.0002) (0.0029) (0.0002) (0.0003)
Hurricane index( t, t − 1 ) −0.0013 0.1630 −0.0225 −0.0005 × 1980 proportional immigrant stock (0.0027) (0.0660) (0.0054) (0.0044)Country-years 2,600 1,500 1,500 1,500 R 2 0.3309 0.1667 0.4223 0.4218Years 1982 to 2004 1992 to 2004 1992 to 2004 1992 to 2004Countries 156 156 156 156
Notes: Each column within a panel refers to an OLS specification with a constant term, country fixed effects, year fixed effects, and country-specific time trends along with the variables displayed. Standard errors clustered at the country level. See equations (1) and (2). “Hurricane index( t, t − 1 )” refers to the average of a hurricane index for a given country across years t and t − 1 ; “1980 proportional immigrant stock” constructed using restricted-access data from the US Census Bureau’s Research Data Center.
Sources: Outcomes obtained from electronic copies of the Yearbook of Immigration Statistics for 1996–2004 (Department of Homeland Security 2018) and the Statistical Yearbook of the Immigration and Naturalization Service for prior to 1996 (Statistical Yearbook 1982–1995).

270 AMERICAN ECONOMIC JOURNAL: APPLIED ECONOMICS APRIL 2020
facilitate new immigration, perhaps due to closer social network connections. We thus include a measure of within-US geographic concentration of immigrant stocks in 1980. Larger countries, either in population or area, may naturally offer more opportunities for internal migration, thus creating lower s j,1980 s and lower respon-siveness to hurricanes. Similarly, countries that have alternative international migra-tion destinations, such as those connected to popular destinations in Europe, may feature lower stocks and lower responsiveness, so we utilize a measure of 1990 immigrant stocks in non-US destinations as a control variable.
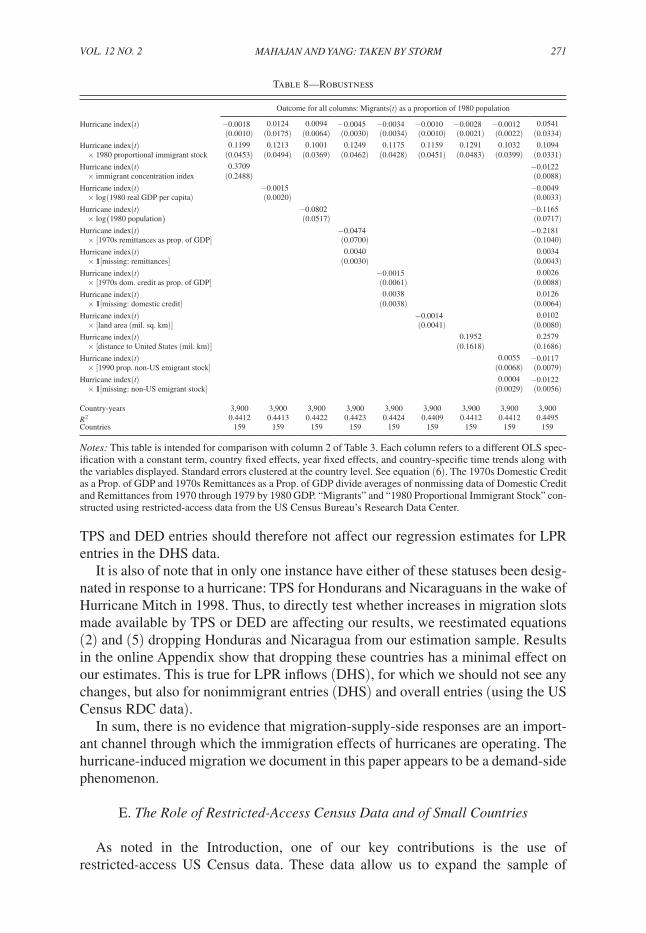
The online Appendix details the construction of each of these variables. Here, we focus on Table 8, which displays the results of estimating equation (6) with each individual control variable as well as with the complete set. The estimated coeffi-cient γ ˆ 2 remains remarkably stable and statistically significant in each regression. There appears to be a robust effect of the stock of immigrants itself, as opposed to the many factors it may additionally proxy for. Additional results in the online Appendix demonstrate that this robustness also applies to the results from Table 5 regarding the citizenship of the 1980 proportional stock.
The online Appendix also conducts placebo exercises, demonstrating that future values of the hurricane index do not predict migration in prior years. Event-study specifications further confirm these placebo exercise results and validate our choice to employ either 0 or 1 lag in the estimating equations above.
D. Migration Demand versus Migration “Supply”
An important question is whether hurricane-induced migration should be thought of as occurring on the “demand” or “supply” sides of the migration “market.” We argue that our findings should be interpreted as primarily a demand-side phenome-non: hurricanes induce greater desire to migrate (with a greater likelihood of actual migration from countries with larger stocks of prior migrants). But it is also import-ant to ask whether the “supply” of migration possibilities may respond similarly to hurricanes. One might imagine that the US government could loosen immigration restrictions to make it possible for more people to migrate in response to hurricanes. If the hurricane-induced increase in the supply of immigration slots occurred dif-ferentially more when countries had larger migrant stocks in the United States, this could provide an alternative (or complementary) explanation for our findings.
There are two mechanisms though which the US government could increase the supply of migration slots: Temporary Protected Status (TPS) and Deferred Enforced Departure (DED).32 These are temporary statuses granted by the executive branch of the federal government to nationals of select countries due to an adverse event (most commonly natural disasters, political unrest, or conflict) in their home country, and allow beneficiaries to live and work in the United States for a defined, limited period of time. While many entrants covered by these programs end up staying in the United States for multiple years, they are officially classified as nonimmigrants.
32 Prior to 1990, DED was called Extended Voluntary Departure (EVD). While similar in their practical aspects, the two programs are separate because they are implemented under different executive powers.
VOL. 12 NO. 2 271MAHAJAN AND YANG: TAKEN BY STORM
TPS and DED entries should therefore not affect our regression estimates for LPR entries in the DHS data.
It is also of note that in only one instance have either of these statuses been desig-nated in response to a hurricane: TPS for Hondurans and Nicaraguans in the wake of Hurricane Mitch in 1998. Thus, to directly test whether increases in migration slots made available by TPS or DED are affecting our results, we reestimated equations (2) and (5) dropping Honduras and Nicaragua from our estimation sample. Results in the online Appendix show that dropping these countries has a minimal effect on our estimates. This is true for LPR inflows (DHS), for which we should not see any changes, but also for nonimmigrant entries (DHS) and overall entries (using the US Census RDC data).
In sum, there is no evidence that migration-supply-side responses are an import-ant channel through which the immigration effects of hurricanes are operating. The hurricane-induced migration we document in this paper appears to be a demand-side phenomenon.
E. The Role of Restricted-Access Census Data and of Small Countries
As noted in the Introduction, one of our key contributions is the use of restricted-access US Census data. These data allow us to expand the sample of
Table 8—Robustness
Outcome for all columns: Migrants( t ) as a proportion of 1980 population
Hurricane index( t ) −0.0018 0.0124 0.0094 −0.0045 −0.0034 −0.0010 −0.0028 −0.0012 0.0541(0.0010) (0.0175) (0.0064) (0.0030) (0.0034) (0.0010) (0.0021) (0.0022) (0.0334)
Hurricane index( t ) 0.1199 0.1213 0.1001 0.1249 0.1175 0.1159 0.1291 0.1032 0.1094 × 1980 proportional immigrant stock (0.0453) (0.0494) (0.0369) (0.0462) (0.0428) (0.0451) (0.0483) (0.0399) (0.0331)Hurricane index( t ) 0.3709 −0.0122 × immigrant concentration index (0.2488) (0.0088)Hurricane index( t ) −0.0015 −0.0049 × log (1980 real GDP per capita) (0.0020) (0.0033)Hurricane index( t ) −0.0802 −0.1165 × log (1980 population) (0.0517) (0.0717)Hurricane index( t ) −0.0474 −0.2181 × [1970s remittances as prop. of GDP] (0.0700) (0.1040)Hurricane index( t ) 0.0040 0.0034 × 1 [missing: remittances] (0.0030) (0.0043)Hurricane index( t ) −0.0015 0.0026 × [1970s dom. credit as prop. of GDP] (0.0061) (0.0088)Hurricane index( t ) 0.0038 0.0126 × 1[missing: domestic credit ] (0.0038) (0.0064)Hurricane index( t ) −0.0014 0.0102 × [land area (mil. sq. km)] (0.0041) (0.0080)Hurricane index( t ) 0.1952 0.2579 × [ distance to United States (mil. km) ] (0.1618) (0.1686)Hurricane index( t ) 0.0055 −0.0117 × [1990 prop. non-US emigrant stock ] (0.0068) (0.0079)Hurricane index( t ) 0.0004 −0.0122 × 1[missing: non-US emigrant stock] (0.0029) (0.0056)
Country-years 3,900 3,900 3,900 3,900 3,900 3,900 3,900 3,900 3,900 R 2 0.4412 0.4413 0.4422 0.4423 0.4424 0.4409 0.4412 0.4412 0.4495Countries 159 159 159 159 159 159 159 159 159
Notes: This table is intended for comparison with column 2 of Table 3. Each column refers to a different OLS spec-ification with a constant term, country fixed effects, year fixed effects, and country-specific time trends along with the variables displayed. Standard errors clustered at the country level. See equation (6). The 1970s Domestic Credit as a Prop. of GDP and 1970s Remittances as a Prop. of GDP divide averages of nonmissing data of Domestic Credit and Remittances from 1970 through 1979 by 1980 GDP. “Migrants” and “1980 Proportional Immigrant Stock” con-structed using restricted-access data from the US Census Bureau’s Research Data Center.

272 AMERICAN ECONOMIC JOURNAL: APPLIED ECONOMICS APRIL 2020
analysis to include small countries that are not included for confidentiality reasons in publicly available US Census data (as discussed in the online Appendix).
To illustrate the importance of these data, we estimate equations (1) and (2) using publicly-available US Census data in the online Appendix. For both the average effect of hurricanes and the heterogeneity in this effect with respect to prior migrant stocks, coefficient estimates from publicly-available data are much smaller in mag-nitude compared to corresponding estimates presented in Table 3 (and are far from being statistically significantly different from zero at conventional levels).
The difference in results from analyses using restricted-access versus public-use US Census data derives from the inclusion of small countries. Small countries added to the analysis provide key identifying variation. As small countries, they have higher hurricane indices on average: the index takes into account the share of land area covered by a hurricane, and so small countries can have larger hurricane indi-ces. They also happen to have on average higher population shares of prior migrants in the United States, but with substantial heterogeneity that also provides identifying variation. That is, they have significant “leverage” in our specifications. To aid in getting a picture of these small countries, the online Appendix lists all countries in our sample, sorted by 1980 population, and provides the value of their mean hurri-cane index and population share of prior migrants in the United States.
To directly explore the role of small countries in contributing to the estimated effects, we provide additional regression results in the online Appendix. We show that small countries play a central role. There is no large or statistically significant effect of network-facilitated migration in response to hurricanes when we weight by population or restrict the sample to quartiles of countries above the bottom quartile of 1980 population. That said, our main results are robust to weighting by log 1980 population.
Additionally, in the online Appendix, we estimate our main regression speci-fication when dropping progressively smaller countries from the sample, starting with countries with the very smallest 1980 populations. The point estimate on the migrant stock interaction term becomes smaller when more and more small coun-tries are dropped from the regression. But the main results are not contingent on the presence of outliers in the sample, only disappearing when the smallest 20 countries (approximately) are dropped from the sample.33
Given that the key identifying variation is coming from small countries, one might raise concerns about external validity (whether empirical patterns identified in migration flows from the smallest countries would also be seen elsewhere). From a statistical standpoint, large countries could simply not be contributing to our esti-mated effects because we cannot split them into smaller administrative areas for analysis—we do not have data on migration from subnational origin areas. A hurri-cane occurring in a large country (such as China, India, Mexico, or the Philippines) affecting a particular subnational locality of a few thousand people may similarly generate migration to the United States (with heterogeneity with respect to prior migrant stocks from that locality) along the lines of what we see in our regressions,
33 The US Census does not allow us to specify exactly how many countries were excluded from each regression for confidentiality reasons, so the number of dropped countries is approximate.

VOL. 12 NO. 2 273MAHAJAN AND YANG: TAKEN BY STORM
but this will not be detected by our estimation procedure because migration flows of the country as a whole will dwarf this response in the data.
V. Conclusion
We examine how international migration responds to changes in the returns to migration, and how this response depends on the costs or barriers that migrants face in moving. We examine this question in the context of a quarter century of migration to the United States, the world’s largest migration destination, from 159 origin locations worldwide. In our analysis, we exploit the occurrence of hurri-canes, which exogenously increase the returns to migration by making origin areas less attractive, and ask whether the migration response to hurricanes depends on the size of prior migrant stocks from the same country. Our migration outcomes are unusually precise, measured either from restricted-access US Census data or actual legal immigration counts from US government administrative data. We find that, on average, countries more affected by hurricanes see more migration to the United States. This migration response is indeed larger (as a share of origin-coun-try population) among countries with larger stocks of prior US migrants. A key role played by previous migrant networks appears to be sponsoring relatives for legal immigration. There is also a substantial effect of hurricanes (and similar het-erogeneity of effects with respect to migrant stocks) on legal entries via temporary or nonimmigrant visas.
This study is among the first to test whether the immigration response to disas-ters in migrants’ origin areas is larger when origin areas have larger stocks of prior migrants. We document an important role played by migrant networks: helping com-patriots in the home country migrate themselves as a way of coping with negative shocks. We provide unique evidence that hurricane-induced flows of new migrants enter via legal, statutory immigration channels, and that there is an identifiable effect on permanent (not just temporary) migration.
These findings are of substantial policy interest. Immigration has long been one of the most contentious issues in the public realm, while at the same time shocks in migrant-source countries are pervasive. Of particular interest are shocks to economic and social conditions generated by climate change. The policy debate should be informed by a better understanding of how and when increasingly severe natural disasters in migrant-origin countries will actually lead to increased migration. Policy makers in destination countries would benefit from an improved understanding of the determinants of migrant inflows that may result from such shocks.
REFERENCES
Abarcar, Paolo. 2017. “The Return Motivations of Legal Permanent Migrants: Evidence from Exchange Rate Shocks and Immigrants in Australia.” Journal of Economic Behavior and Organi-zation 144: 62–77.
Abel, Guy J., and Nikola Sander. 2014. “Quantifying Global International Migration Flows.” Science 343 (6178): 1520–22.

274 AMERICAN ECONOMIC JOURNAL: APPLIED ECONOMICS APRIL 2020
Ambler, Kate, Diego Aycinena, and Dean Yang. 2015. “Channeling Remittances to Education: A Field Experiment among Migrants from El Salvador.” American Economic Journal: Applied Economics 7 (2): 207–32.
Amuedo-Dorantes, Catalina, and Kusum Mundra. 2007. “Social Networks and Their Impact on the Earnings of Mexican Migrants.” Demography 44 (4): 849–63.
Angelucci, Manuela. 2015. “Migration and Financial Constraints: Evidence from Mexico.” Review of Economics and Statistics 97 (1): 224–28.
Ardington, Cally, Anne Case, and Victoria Hosegood. 2009. “Labor Supply Responses to Large Social Transfers: Longitudinal Evidence from South Africa.” American Economic Journal: Applied Eco-nomics 1 (1): 22–48.
Baez, Javier, German Caruso, Valerie Mueller, and Chiyu Niu. 2017. “Droughts Augment Youth Migration in Northern Latin America and the Caribbean.” Climatic Change 140 (3–4): 423–35.
Bandiera, Oriana, Imran Rasul, and Martina Viarengo. 2013. “The Making of Modern America: Migratory Flows in the Age of Mass Migration.” Journal of Development Economics 102: 23–47.
Bauer, Thomas, Barbara Dietz, Klaus F. Zimmermann, and Eric Zwintz. 2005. “German Migration: Development, Assimilation, and Labour Market Effects.” In European Migration: What Do We Know? edited by Klaus F. Zimmermann, 197–262. New York: Oxford University Press.
Bazzi, Samuel. 2017. “Wealth Heterogeneity and the Income Elasticity of Migration.” American Eco-nomic Journal: Applied Economics 9 (2): 219–55.
Beaman, Lori A. 2012. “Social Networks and the Dynamics of Labour Market Outcomes: Evidence from Refugees Resettled in the U.S.” Review of Economic Studies 79 (1): 128–61.
Belasen, Ariel R., and Solomon W. Polachek. 2009. “How Disasters Affect Local Labor Markets: The Effects of Hurricanes in Florida.” Journal of Human Resources 44 (1): 251–76.
Bertoli, Simone, Jesús Fernández-Huertas Moraga, and Sekou Keita. 2017. “The Elasticity of the Migrant Labour Supply: Evidence from Temporary Filipino Migrants.” Journal of Development Studies 53 (11): 1822–34.
Blumenstock, Joshua, Guanghua Chi, and Xu Tan. 2018. “Migration and the Value of Social Net-works.” https://cepr.org/sites/default/files/blumenstock_migration_networks.pdf.
Blumenstock, Joshua E., Nathan Eagle, and Marcel Fafchamps. 2016. “Airtime Transfers and Mobile Communications: Evidence in the Aftermath of Natural Disasters.” Journal of Development Eco-nomics 120: 157–81.
Bohra-Mishra, Pratikshya, Michael Oppenheimer, and Solomon M. Hsiang. 2014. “Nonlinear Perma-nent Migration Response to Climatic Variations but Minimal Response to Disasters.” Proceedings of the National Academy of Sciences 111 (27): 9780–85.
Boustan, Leah Platt, Matthew E. Kahn, Paul W. Rhode, and Maria Lucia Yanguas. 2017. “The Effect of Natural Disasters on Economic Activity in US Counties: A Century of Data.” NBER Working Paper 23410.
Bryan, Gharad, Shyamal Chowdhury, and Ahmed Mushfiq Mobarak. 2014. “Underinvestment in a Profitable Technology: The Case of Seasonal Migration in Bangladesh.” Econometrica 82 (5): 1671–1748.
Card, David. 2001. “Immigrant Inflows, Native Outflows, and the Local Labor Market Impacts of Higher Immigration.” Journal of Labor Economics 19 (1): 22–64.
Centre for Research on the Epidemiology of Disasters and the United Nations Office for Disaster Risk Reduction. 2015. The Human Cost of Weather Related Disasters—1995–2015. https://www.unisdr.org/2015/docs/climatechange/COP21_WeatherDisastersReport_2015_FINAL.pdf.
Chernina, Eugenia, Paul Castañeda Dower, and Andrei Markevich. 2014. “Property Rights, Land Liquidity, and Internal Migration.” Journal of Development Economics 110: 191–215.
Chiswick, Barry R., and Timothy J. Hatton. 2003. “International Migration and the Integration of Labor Markets.” In Globalization in Historical Perspective, edited by Michael D. Bordo, Alan M. Taylor, and Jeffrey G. Williamson, 65–120. Chicago: University of Chicago Press.
Clark, Ximena, Timothy J. Hatton, and Jeffrey G. Williamson. 2007. “Explaining U.S. Immigration, 1971-1998.” Review of Economics and Statistics 89 (2): 359–73.
Clemens, Michael. 2017. “Violence, Development, and Migration Waves: Evidence from Central American Child Migrant Apprehensions.” Center for Global Development Working Paper 459.
Clemens, Michael A., and Erwin R. Tiongson. 2017. “Split Decisions: Household Finance When a Pol-icy Discontinuity Allocates Overseas Work.” Review of Economics and Statistics 99 (3): 531–43.
Comola, Margherita, and Mariapia Mendola. 2015. “Formation of Migrant Networks.” Scandinavian Journal of Economics 117 (2): 592–618.
De Weerdt, Joachim, and Kalle Hirvonen. 2016. “Risk Sharing and Internal Migration.” Economic Development and Cultural Change 65 (1): 63–86.
VOL. 12 NO. 2 275MAHAJAN AND YANG: TAKEN BY STORM
Department of Economic and Social Affairs. 2017. World Population Prospects: The 2017 Revision, Vol. 1. New York: United Nations.
Department of Homeland Security. 2006. Yearbook of Immigration Statistics. https://www.dhs.gov/immigration-statistics/yearbook.
Docquier, Frédéric, Giovanni Peri, and Ilse Ruyssen. 2014. “The Cross-country Determinants of Potential and Actual Migration.” International Migration Review 48 (1): 37–99.
Dolfin, Sarah, and Garance Genicot. 2010. “What Do Networks Do? The Role of Networks on Migra-tion and ‘Coyote’ Use.” Review of Development Economics 14 (2): 343–59.
Fajardo, Gustavo, Emilio Gutiérrez, and Horacio Larreguy. 2017. “Taking One for the Team: Shocks at Destination and Households’ Supply of Migrants.” CAF Development Bank of Latin America Working Paper 2017/10.
Franklin, Simon, and Julien Labonne. 2019. “Economic Shocks and Labor Market Flexibility.” Jour-nal of Human Resources 54 (1): 171–99.
Gibson, John, David McKenzie, and Halahingano Rohorua. 2014. “Development Impacts of Seasonal and Temporary Migration: A Review of Evidence from the Pacific and Southeast Asia.” Asia and the Pacific Policy Studies 1 (1): 18–32.
Gröger, André, and Yanos Zylberberg. 2016. “Internal Labor Migration as a Shock Coping Strategy: Evidence from a Typhoon.” American Economic Journal: Applied Economics 8 (2): 123–53.
Halliday, Timothy. 2006. “Migration, Risk, and Liquidity Constraints in El Salvador.” Economic Development and Cultural Change 54 (4): 893–925.
Hanson, Gordon H., and Craig McIntosh. 2012. “Birth Rates and Border Crossings: Latin American Migration to the US, Canada, Spain and the UK.” Economic Journal 122 (561): 707–26.
Hatton, Timothy J., and Jeffrey G. Williamson. 1993. “After the Famine: Emigration from Ireland, 1850-1913.” Journal of Economic History 53 (3): 575–600.
Hatton, Timothy J., and Jeffery G. Williamson. 1994. “International Migration and World Develop-ment: A Historical Perspective.” In Economic Aspects of International Migration, edited by Herbert Giersch, 3–56. New York: Springer-Verlag Berlin Heidelberg.
Hornbeck, Richard. 2012. “The Enduring Impact of the American Dust Bowl: Short- and Long-Run Adjustments to Environmental Catastrophe.” American Economic Review 102 (4): 1477–1507.
Hsiang, Solomon M. 2010. “Temperatures and Cyclones Strongly Associated with Economic Produc-tion in the Caribbean and Central America.” Proceedings of the National Academy of Sciences 107 (35): 15367–372.
Hsiang, Solomon M., and Amir S. Jina. 2014. “The Causal Effect of Environmental Catastrophe on Long-Run Economic Growth: Evidence from 6,700 Cyclones.” NBER Working Paper 20352.
Imberman, Scott A., Adriana D. Kugler, and Bruce I. Sacerdote. 2012. “Katrina’s Children: Evi-dence on the Structure of Peer Effects from Hurricane Evacuees.” American Economic Review 102 (5): 2048–82.
Imbert, Clement, and John Papp. 2018. “Costs and Benefits of Seasonal Migration: Evidence from India.” University of Warwick Working Paper 1161.
International Database. US Census Bureau. https://www.census.gov/programs-surveys/international-pro-grams/about/idb.html.
Jack, William, and Tavneet Suri. 2014. “Risk Sharing and Transaction Costs: Evidence from Kenya’s Mobile Money Revolution.” American Economic Review 104 (1): 183–223.
Jasso, Guillermina, and Mark R. Rosenzweig. 1982. “Estimating the Emigration Rates of Legal Immigrants Using Administrative and Survey Data: The 1971 Cohort of Immigrants to the United States.” Demography 19 (3): 279–90.
Jasso, Guillermina, and Mark R. Rosenzweig. 1989. “Sponsors, Sponsorship Rates and the Immigra-tion Multiplier.” International Migration Review 23 (4): 856–88.
Jayachandran, Seema. 2006. “Selling Labor Low: Wage Responses to Productivity Shocks in Devel-oping Countries.” Journal of Political Economy 114 (3): 538–75.
Kandel, William A. 2018. U.S. Family-Based Immigration Policy. Washington, DC: Congressional Research Service.
Kleemans, Marieke, and Jeremy Magruder. 2018. “Labour Market Responses to Immigration: Evi-dence from Internal Migration Driven by Weather Shocks.” Economic Journal 128 (613): 2032–65.
Kossin, James P., Timothy Hall, Thomas Knutson, Kenneth E. Kunkel, Robert J. Trapp, Duane E. Wal-iser, and Michael F. Wehner. 2017. “Extreme Storms.” In Climate Science Special Report: Fourth National Climate Assessment, Vol. 1, edited by Donald J. Wuebbles, David W. Fahey, and Kathy A. Hibbard, 257–76. Washington, DC: US Global Change Research Program.
Lucas, Robert E.B., and Oded Stark. 1985. “Motivations to Remit: Evidence from Botswana.” Journal of Political Economy 93 (5): 901–18.

276 AMERICAN ECONOMIC JOURNAL: APPLIED ECONOMICS APRIL 2020
Marchiori, Luca, Jean-François Maystadt, and Ingmar Schumacher. 2012. “The Impact of Weather Anomalies on Migration in Sub-Saharan Africa.” Journal of Environmental Economics and Man-agement 63 (3): 355–74.
Massey, Douglas S. 1988. “Economic Development and International Migration in Comparative Per-spective.” Population and Development Review 14 (3): 383–413.
McKenzie, David, Steven Stillman, and John Gibson. 2010. “How Important Is Selection? Experimen-tal vs. Non-experimental Measures of the Income Gains from Migration.” Journal of the European Economic Association 8 (4): 913–45.
McKenzie, David, Caroline Theoharides, and Dean Yang. 2014. “Distortions in the International Migrant Labor Market: Evidence from Filipino Migration and Wage Responses to Destination Country Economic Shocks.” American Economic Journal: Applied Economics 6 (2): 49–75.
Minale, Luigi. 2018. “Agricultural Productivity Shocks, Labour Reallocation and Rural-Urban Migra-tion in China.” Journal of Economic Geography 18 (4): 795–821.
Morduch, Jonathan. 1995. “Income Smoothing and Consumption Smoothing.” Journal of Economic Perspectives 9 (3): 103–14.
Morten, Melanie. 2019. “Temporary Migration and Endogenous Risk Sharing in Village India.” Jour-nal of Political Economy 127 (1): 1–46.
Munshi, Kaivan. 2003. “Networks in the Modern Economy: Mexican Migrants in the U.S. Labor Mar-ket.” Quarterly Journal of Economics 118 (2): 549–99.
Munshi, Kaivan, and Mark Rosenzweig. 2016. “Networks and Misallocation: Insurance, Migration, and the Rural-Urban Wage Gap.” American Economic Review 106 (1): 46–98.
Noy, Ilan. 2009. “The Macroeconomic Consequences of Disasters.” Journal of Development Econom-ics 88 (2): 221–31.
Orrenius, Pia M. 1999. “The Role of Family Networks, Coyote Prices and the Rural Economy in Migration from Western Mexico: 1965–1994.” Federal Reserve Bank of Dallas Working Paper 9910.
Orrenius, Pia M., and Madeline Zavodny. 2005. “Self-Selection among Undocumented Immigrants from Mexico.” Journal of Development Economics 78 (1): 215–40.
Piguet, Étienne, Antoine Pécoud, and Paul de Guchteneire. 2011. Migration and Climate Change. New York: Cambridge University Press.
Rosenzweig, Mark R., and Oded Stark. 1989. “Consumption Smoothing, Migration, and Marriage: Evidence from Rural India.” Journal of Political Economy 97 (4): 905–26.
Rosenzweig, Mark R., and Kenneth I. Wolpin. 1993. “Credit Market Constraints, Consumption Smoothing, and the Accumulation of Durable Production Assets in Low-Income Countries: Invest-ments in Bullocks in India.” Journal of Political Economy 101 (2): 223–44.
Ruggles, Steven, Sarah Flood, Ronald Goeken, Josiah Grover, Erin Meyer, Jose Pacas, and Matthew Sobek. 2019. “IPUMS USA Version 9.0 [dataset].” Integrated Public Use Microdata Series. https://usa.ipums.org/usa/index.shtml.
Statistical Yearbook of the Immigration and Naturalization Service. 1982–1995. US Citizenship and Immigration Services. https://www.uscis.gov/history-and-genealogy/historical-library/our-collection/general-collection.
Stecklov, Guy, Paul Winters, Marco Stampini, and Benjamin Davis. 2005. “Do Conditional Cash Transfers Influence Migration? A Study Using Experimental Data from the Mexican Progresa Pro-gram.” Demography 42 (4): 769–90.
Strobl, Eric. 2011. “The Economic Growth Impact of Hurricanes: Evidence from US Coastal Coun-ties.” Review of Economics and Statistics 93 (2): 575–89.
Theoharides, Caroline. 2018. “Manila to Malaysia, Quezon to Qatar: International Migration and Its Effects on Origin-Country Human Capital.” Journal of Human Resources 53 (4): 1022–49.
Torres, Gerver, and Brett Pelham. 2008. One-Quarter of the World’s Population May Wish to Migrate. Washington, DC: Gallup.
Walsh, Kevin J.E., John L. McBride, Philip J. Klotzbach, Sethurathinam Balachandran, Suzana J. Camargo, Greg Holland, Thomas R. Knutson, James P. Kossin, Tsz-cheung Lee, Adam Sobel, and Masato Sugi. 2016. “Tropical Cyclones and Climate Change.” Wires Climate Change 7 (1): 65–89.
World Bank Group. 2018. Migration and Remittances: Recent Developments and Outlook—Transit Migration. Migration and Development Brief 29. World Bank, Washington, DC.
Wozniak, Abigail. 2010. “Are College Graduates More Responsive to Distant Labor Market Opportu-nities?” Journal of Human Resources 45 (4): 944–70.
Yang, Dean. 2006. “Why Do Migrants Return to Poor Countries? Evidence from Philippine Migrants’ Responses to Exchange Rate Shocks.” Review of Economics and Statistics 88 (4): 715–35.

VOL. 12 NO. 2 277MAHAJAN AND YANG: TAKEN BY STORM
Yang, Dean. 2008a. “Coping with Disaster: The Impact of Hurricanes on International Financial Flows, 1970-2002.” B.E. Journal of Economic Analysis and Policy 8 (1): 1–43.
Yang, Dean. 2008b. “International Migration, Remittances and Household Investment: Evidence from Philippine Migrants’ Exchange Rate Shocks.” Economic Journal 118 (528): 591–630.
Yang, Dean. 2008c. “Risk, Migration, and Rural Financial Markets: Evidence from Earthquakes in El Salvador.” Social Research 75 (3): 955–92.
Yang, Dean, and HwaJung Choi. 2007. “Are Remittances Insurance? Evidence from Rainfall Shocks in the Philippines.” World Bank Economic Review 21 (2): 219–48.
Yang, Dean, and Claudia A. Martinez. 2006. “Remittances and Poverty in Migrants’ Home Areas: Evi-dence from the Philippines.” In International Migration, Remittances and the Brain Drain, edited by Maurice Schiff, and Caglar Ozden, 81–121. Washington DC: World Bank.