Embed Size (px)
Citation preview

Contents
1 Modelling Smarter Choices 1
1.1 Introduction 1 1.2 Classification of Smarter Choice Initiatives 2 1.3 General Approach to Modelling Smarter Choice Initiatives 3 1.4 Benchmarking Expected Impacts of Smarter Choice Initiatives 4 1.5 Modelling the ‘Hard’ Components of Smarter Choice Packages 5 1.6 Modelling ‘Soft’ Components of Smarter Choice Packages 6 1.7 Modelling Specific Smarter Choice Measures 9 1.8 Reporting Requirements 11 1.9 Considerations when Appraising Smarter Choices 12
2 Document Provenance 12
Appendix A References and Sources of Evidence 13
Appendix B Overview of Möser and Bamberg Meta Analysis 15
TAG Unit M5.2 Modelling Smarter Choices
Page 1
1 Modelling Smarter Choices
1.1 Introduction
1.1.1 The report “Smarter Choices – Changing the Way We Travel” (Department for Transport, July 2004) describes ten measures which reduce the need to travel, reduce dependence on private cars and increase physical activity. They may be deployed individually or in combination.
1.1.2 This Unit provides advice on incorporating the impacts of Smarter Choice initiatives in existing modelling tools that have been developed based on the advice in TAG Unit M2 - Variable Demand Modelling, i.e. traditional “four-stage” transport models. This should be considered where Smarter Choices are the primary intervention to be tested, or where they are introduced in a study area, impacting the demand for other transport proposals being analysed.
1.1.3 This Unit sets out pragmatic methods to apply the emerging evaluation evidence from Smarter Choice initiatives. The analyst should ensure that use of such a model is proportionate and appropriate for the level of analysis required. For instance, schemes that are primarily aimed at encouraging mode shift to active modes may be appraised by means of a simpler approach using the advice in TAG Unit A5.1 – Active Mode Appraisal, so long as adequate forecasts can be made. The approach described here will add value when the impacts on highway and public transport networks are significant in appraising the scheme, or when the effects of changes in congestion on modal shift are likely to be significant
1.1.4 The Department notes that formal modelling of Smarter Choices is a developing area and commissioned the studies “Modelling and Appraisal of Smarter Choices: A Literature Review” (Jotisankasa and Polak, 2008) and “Modelling and Appraisal of Smarter Choices: Scope for Further Research” (Polak, 2009), available on the Department’s website on GOV.UK. The Department would welcome further innovation using these and other ideas, but believes that the approach set out in this guidance is adequate where modelling is undertaken to assess Smarter Choices in major schemes at the present time.
1.1.5 Evidence on the impacts of Smarter Choices is growing, but not all such evidence is ideal for modelling as it generally gives the outcome of using a package of measures, each of which, ideally, should be modelled individually. Evidence is usually given at a relatively aggregate level; the disaggregate data that would be required to estimate a sophisticated demand model (i.e. concerning how disaggregate groups may react differently to demand management measures, both in combination and individually) is not readily available.
1.1.6 This guidance does not give a comprehensive literature review of the evidence, but gives an example of how the evidence might be used to update a transport model.
1.1.7 Currently there is no complete TAG guidance on the appraisal of certain Smarter Choice measures, in particular ‘soft’ measures which are intended to affect demand without affecting actual (as opposed to perceived) cost. Section 1.9 explains some of the issues associated with using models to appraise such measures. However, this Unit does provide guidance on including the impacts of Smarter Choice measures as part of the modelling (and hence appraisal) of ‘hard’ measures that can be represented in a traditional transport model using standard methods.
1.1.8 The purpose of this Unit is not to advise transport planners whether or not to include Smarter Choices in their schemes, but to provide guidance specifically on modelling Smarter Choices for modelling practitioners. As such, the guidance takes a neutral stance on Smarter Choices measures themselves and does not seek to encourage or dissuade transport planners from pursuing them.
1.1.9 The structure of the Unit is as follows:
TAG Unit M5.2 Modelling Smarter Choices
Page 2
Smarter Choice initiatives are grouped and distinctions are drawn between ‘hard’ and ‘soft’ measures;
the recommended general approach to modelling Smarter Choice initiatives is explained;
the evidence of the effects of Smarter Choice initiatives is reviewed and guidance is provided on how impacts may be ‘benchmarked’;
Smarter Choice packages often include ‘hard’ components and guidance is provided on the ways in which these may be modelled;
guidance is provided on the general ways in which the ‘soft’ components of Smarter Choice packages may be modelled;
the modelling of workplace travel plans, school travel plans and targeted marketing initiatives is considered in more detail; and
the issues associated with the appraisal of smarter choices using transport model output is discussed.
1.2 Classification of Smarter Choice Initiatives
1.2.1 The “Smarter Choices – Changing the Way We Travel” report identified ten Smarter Choice measures: workplace travel plans, school travel plans, personalised travel planning, travel awareness campaigns, public transport information and marketing, car clubs, car sharing schemes, teleworking, teleconferencing, and home shopping. The guidance in this Unit is based around these ten measures but the techniques presented may be adapted in order to model other Smarter Choices initiatives, provided appropriate evidence of their impacts is available.
1.2.2 Although different Smarter Choice measures often have similar aims, different techniques are required to model different measures. In particular, a distinction is required between:
measures which have a direct impact on travellers’ generalised cost, whether financial cost or time1 (defined as ‘hard’ measures in this Unit); and
measures which affect behaviour without affecting travellers’ cost, instead changing travellers’ response to cost (defined as ‘soft’ measures in this Unit).
1.2.3 Where a package of Smarter Choices measures is used that combines hard and soft measures, the analyst should model the hard and soft measures separately. It is important that the effects of Smarter Choices are not double counted by modelling a component measure as both a hard measure and a soft measure.
1.2.4 This guidance focuses on three types of Smarter Choice initiatives:
workplace travel plans;
school travel plans; and
targeted marketing initiatives2.
1 Also potentially measurable quality factors in the form of generalised minutes. See paragraph 1.2.5. 2 Personalised travel planning, travel awareness campaigns, and public transport marketing share common features of targeted marketing and there are no sharp dividing lines between them. These initiatives are therefore treated together in this guidance as ‘targeted marketing initiatives’

TAG Unit M5.2 Modelling Smarter Choices
Page 3
The first two types potentially involve both ‘hard’ and ‘soft’ measures, while targeted marketing initiatives are, by definition, all ‘soft’.
1.2.5 Some measures that are traditionally referred to as “soft”, such as bus quality improvements, real time passenger information systems, etc., can be represented in the model’s generalised cost formulation since evidence of values exist (see TAG Unit M3.2) and may be collected from local surveys. For the purposes of this Unit, these are treated as ‘hard’ measures, referring to those measures that can be represented in a traditional transport model using standard methods.
1.3 General Approach to Modelling Smarter Choice Initiatives
1.3.1 As with all aspects of modelling, the inclusion of Smarter Choices impacts should be evidence-based. There is some evidence about the combined effects of several Smarter Choices measures (which throughout this Unit is termed a ‘package’), but much less evidence about the isolated effects of individual ‘soft’ measures, in a form that informs the specification of how these measures may be modelled. ‘Hard’ measures can be represented in models of the kind specified in TAG Unit M2 in generally conventional ways.
1.3.2 The suggested approach to modelling packages of Smarter Choices initiatives is to use a step-by-step approach, where hard measures are modelled specifically and adjustments for soft measures are used in order to achieve the benchmark suggested by the evidence. Evidence of benchmark effects of packages often include combinations of hard and soft measures. This approach allows the analyst to interpret the evidence and suitably apply it in the modelling as an appropriate benchmark and allow the model to make proper allowance for induced second order effects.
Step one: benchmark the expected impacts of the Smarter Choice package, based on the available evidence, taking account of the proposed intensity of application compared with the intensity of application to which the evidence relates. This is discussed further in Section 1.4;
Step two: model the ‘hard’ components of the Smarter Choice package explicitly (where applicable); check that the impacts are less than the benchmark where the package includes soft measures and adjust the model if necessary. This is discussed further in Section 1.5;
Step three: model the ‘soft’ components of the Smarter Choice package by means of assumed adjustments to the model parameters. Check that the impacts are plausible in comparison with the benchmark and the impacts of the ‘hard’ measures and that the combined impacts of the hard and soft measures are consistent with the benchmark. This is discussed further in Section 1.6; and
Step four: assess traffic impacts on the road network, especially in terms of congestion, and also assess impacts on public transport patronage and revenues.
1.3.3 The order in which the second and third steps are carried out is important as it may have a material impact on the results. It is also important that the final results for appraisal are based on a fully converged model run.
1.3.4 Usually, the evidence will give demand changes including the effects of induced traffic, so in order to calibrate a variable demand model it should be run to convergence. If the evidence on demand changes excludes induced traffic effects (e.g. stated preference surveys), it may be appropriate to calibrate the variable demand model by adjusting the model parameters so that the results from the first iteration run match the expected demand changes, before running the model to convergence.
1.3.5 To be consistent with the theory on which most models are based (i.e. that transport users are fully informed and make rational decisions), it is important that both the without-scheme and with-scheme forecasts for each appraisal are run using the same model parameters. In this instance, it is expected that the ‘soft’ components will be modelled by adjusting the parameters in the without-scheme forecast, and the same parameters will be retained in the with-scheme forecast.
TAG Unit M5.2 Modelling Smarter Choices
Page 4
1.3.6 Given the uncertain nature of the assumptions necessary for the third step, sensitivity tests using different assumptions should form a core part of the analysis.
1.4 Benchmarking Expected Impacts of Smarter Choice Initiatives
1.4.1 The first of the steps listed above requires information about measured or observed impacts of Smarter Choice measures so that an appropriate benchmark or target car trip reduction can be established for the Smarter Choice package to be modelled.
1.4.2 In order to establish a benchmark, two steps are required:
first, the evidence about the impacts of Smarter Choice measures needs to be understood;
second, the scale of the impacts indicated by the evidence needs to be related to the intensity of the proposed application so that a benchmark of an appropriate scale can be derived.
Evidence
1.4.3 There is growing evidence about the effects of Smarter Choice initiatives. This Unit uses evidence based on a meta-analysis carried out by Möser and Bamberg (2008). The evidence presented in this study is not without uncertainty in itself, although other studies have suggested similar results3. Although this provides indicative benchmarks that can be used in modelling, the analyst is encouraged to study any other relevant sources of evaluation evidence (as contained in Appendix A4) in order to understand if or how local circumstances may differ from results obtained through the study of meta-analysis used here. Given the range of interventions delivered and the depth and breadth of research associated with the programme, the Sustainable Travel Towns evaluation (Sloman et al., 2010) is a very useful reference.
Benchmarking
1.4.4 Evidence from studies such as Möser and Bamberg is not sufficient to enable a benchmark trip reduction to be calculated or estimated in a systematic manner. The benchmark trip reduction should therefore be developed by means of reasoned argument from the data.
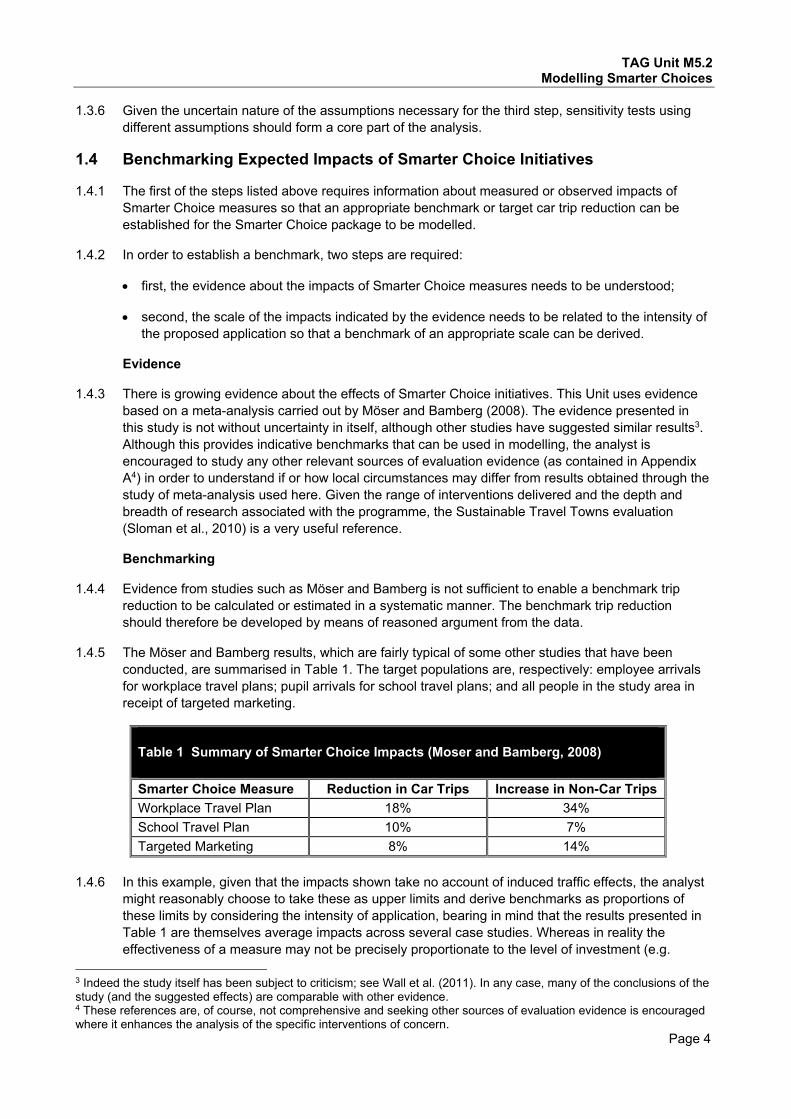
1.4.5 The Möser and Bamberg results, which are fairly typical of some other studies that have been conducted, are summarised in Table 1. The target populations are, respectively: employee arrivals for workplace travel plans; pupil arrivals for school travel plans; and all people in the study area in receipt of targeted marketing.
Table 1 Summary of Smarter Choice Impacts (Moser and Bamberg, 2008) Smarter Choice Measure Reduction in Car Trips Increase in Non-Car Trips Workplace Travel Plan 18% 34% School Travel Plan 10% 7% Targeted Marketing 8% 14%
1.4.6 In this example, given that the impacts shown take no account of induced traffic effects, the analyst
might reasonably choose to take these as upper limits and derive benchmarks as proportions of these limits by considering the intensity of application, bearing in mind that the results presented in Table 1 are themselves average impacts across several case studies. Whereas in reality the effectiveness of a measure may not be precisely proportionate to the level of investment (e.g.
3 Indeed the study itself has been subject to criticism; see Wall et al. (2011). In any case, many of the conclusions of the study (and the suggested effects) are comparable with other evidence. 4 These references are, of course, not comprehensive and seeking other sources of evaluation evidence is encouraged where it enhances the analysis of the specific interventions of concern.
TAG Unit M5.2 Modelling Smarter Choices
Page 5
different quality of scheme design, potential impacts on non-targeted populations, etc.); this forms a good starting point in establishing a benchmark. For example, if it is proposed that workplace travel plans are to apply to 50% of the workforce in the study area, the benchmark would be a 9% reduction in car commuting trips and a 17% increase in non-car commuting trips. Similarly, if it is proposed that school travel plans are to apply to 75% of school students in the study area, the benchmark would be a 7.5% reduction in car education trips and a 5% increase in non-car education trips. In the case of targeted marketing initiatives, calculations of this nature are much more difficult and it is recommended that benchmarks be set using judgement that is based as far as possible on reasoned arguments. These reasoned arguments and the evidence supporting them should be fully documented.
1.4.7 In some cases it may be appropriate to use lower levels of impact for the benchmark for reasons other than intensity of application (for example, where only limited measures are introduced). Conversely, proposed packages that may offer significantly more elements relative to the evidence may have potential to cause a greater relative impact, and the model may be calibrated accordingly. These reasons need to be documented, along with reasoned arguments and evidence supporting the assumptions actually used.
1.4.8 Benchmarks derived in the above manner will exclude the effects of induced traffic and therefore the out-turn effects shown in fully converged runs should be lower. This implies that the adjustments made to the model to achieve the benchmark should be based on an initial run of the demand model and not a fully converged model run.
1.5 Modelling the ‘Hard’ Components of Smarter Choice Packages
1.5.1 Having benchmarked the effects of the Smarter Choice package to be modelled, the next step is to model the ‘hard’ components of the package.
1.5.2 A transport model developed in accordance with the advice in TAG Unit M2 - Variable Demand Modelling, TAG Unit M3.1 – Highway Assignment Modelling and TAG Unit M3.2 - Public Transport Assignment Modelling will be capable of modelling the effects of many of the ‘hard’ components of Smarter Choice packages. If the transport model to be used cannot represent all the ‘hard’ measure components of the package, consideration should be given to enhancing the model so that it models as many of the ‘hard’ components as possible and in as realistic a manner as possible.
1.5.3 The following two particular aspects of conventional models may need general enhancement for Smarter Choice modelling:
treatment of walk and cycle; and
modelling parking policies.
For advice on the treatment of walk and cycle, reference should be made to TAG Unit M2. Advice on the treatment of parking policies, including park-and-ride, can be found in TAG Unit M5.1 - Modelling Parking and Park-and-Ride.
1.5.4 It may not be possible to model directly some ‘hard’ components because the necessary data and techniques will not always be available. Where they cannot be properly modelled, one of two approaches will need to be followed:
use of network model parameters such as public transport walk, wait and fare adjustments as proxies (see TAG Unit M3.2); and
inclusion of the impact of these ‘hard’ measures within the ‘behavioural change’ adjustments discussed in the next section.
TAG Unit M5.2 Modelling Smarter Choices
Page 6
1.5.5 Further advice about how the ‘hard’ components of Smarter Choice packages should be modelled is provided in Section 1.7. All assumptions made in modelling ‘hard’ components of Smarter Choice packages should be fully documented as described in Section 1.8.
1.5.6 When the model has been set up to estimate the effects of as many as possible of the ‘hard’ components of the Smarter Choice package, an initial model run should be carried out to assess the impacts of the hard measures on modal shift. The model should be fully converged so that the induced traffic effects are properly modelled.
1.5.7 Logically, the impacts of the hard measures modelled explicitly should be less than the benchmarks established at the outset from the empirical evidence (where, of course, the packages in the evidence include soft measures). If this is not the case, further consideration should be given to both the appropriateness of the benchmarks and the realism with which the ‘hard’ measures have been modelled. The temptation only to revise the benchmarks upwards should be resisted and upward revisions to the benchmarks should be accompanied by clearly reasoned arguments. It is more likely that some aspect of the ways in which the measures are represented in the model requires adjustment so that the impacts of the ‘hard’ measures are forecast to be more realistic. The temptation to adjust model parameters in a way that may affect the realism test results adversely and materially should be resisted.
1.6 Modelling ‘Soft’ Components of Smarter Choice Packages
1.6.1 In principle, the impacts of the ‘soft’ components of Smarter Choice packages may be approximated by modifications to one or more of the following features of established models:
commuting trip rates; and/or
values of time for the various travel stages (walk, wait, in-vehicle, and interchange); and/or
mode constants; and/or
mode choice sensitivity parameters.
1.6.2 It may be necessary to use more than one of these approaches to model the effects of the various measures which may constitute the Smarter Choice package being considered. For instance, one measure may be better modelled using one of the modifications while others may be better dealt with by other modifications. If more than one modification is used, great care should be taken to ensure that the responses to any one measure are not modelled more than once.
1.6.3 Each of the approaches is discussed in turn below. In none of the approaches is there much evidence for the possible modifications that may be made and some are more problematic than others. The approaches therefore could require some exploration by means of tests of alternative values to assess the scale of the modifications which would yield plausible effects in relation to the effects of the ‘hard’ components and the benchmark car trip reductions. These exploratory tests should be fully documented.
Modifications to Commuting Trip Rates
1.6.4 Certain ‘soft’ measures, such as teleworking or a compressed working week, should logically reduce the average weekday commuting trip rates used in transport models.
1.6.5 In theory, the impacts of teleworking or a compressed working week could be more complex than a common global reduction in demand. In particular, it is possible that workers with longer commutes may be more likely to work from home on some days or work a compressed week, as they have a greater incentive to do so. However, reflecting such nuances is unlikely to be practical and simpler approaches should generally be adopted.

TAG Unit M5.2 Modelling Smarter Choices
Page 7
1.6.6 Such measures may be modelled approximately by modifications to either trip rates or the trip frequency parameter value.
1.6.7 Estimates of the percentage reductions to apply to trip rates may be made by making assumptions about the numbers of workers who might work some of the time from home and the average number of days they would do so. While the impacts may vary by type of employment, given the approximate nature of Smarter Choice modelling, it is likely to be sufficient to derive and apply average reductions for the employment groups already represented in the model rather than increasing the segmentation specifically for the purpose of modelling Smarter Choice measures.
1.6.8 Trip rate modifications may be applied on an area-wide basis or to individual zones. An alternative approach for area-wide application is to modify the trip frequency parameter value, taking care not to increase it to the extent that the choice hierarchy would be changed. The appropriate scale of the parameter value change would need to be determined by experimentation, with the preferred value being selected by comparing modelled out-turns with expected reductions.
1.6.9 Whichever approach is adopted, the results should be consistent with evidence from local sources, such as household interview or travel diary surveys or staff travel to work surveys often conducted in the early stages of developing a workplace travel plan. The evidence and the consequent assumptions should be fully documented.
Modifications to Generalised Cost Components
1.6.10 A number of Smarter Choice measures impact on specific parts of a journey. These may often be represented through use of quality factors that effectively reduce the generalised cost of certain journey elements. For example a passenger may experience a reduction in perceived wait time where real time passenger information systems are provided at a bus stop, and hence a reduction is made to the wait time part of that journey, effectively modelling this as a “hard” measure. Indicative values for different types of improvements can be found in the following TAG Data Book Tables:
M3.2.1: Segmented Values of Bus Quality Interventions (generalised minutes)
A4.1.6: Summary of value of journey quality benefit of different types of cycle facility relative to no facilities
A4.1.7: Values of different aspects of the pedestrian environment used in the valuation of the London Strategic Walk Network
Modification to Values of Time
1.6.11 Where there may be difficulties in making adjustments to components of generalised cost, the analyst might consider making adjustments to behavioural values of time, which could be introduced as modified weights applied to the individual components of travel time within the supply model. Such an example may be where there is a programme of improved customer care by drivers, which could lead to a reduction in perceived in-vehicle time for bus users, but evidence or values may not exist concerning users’ willingness-to-pay for such improvements.
1.6.12 Any modifications to the modelled values of time should be fully documented along with supporting evidence and/or reasoned argument.
Modifications to Mode Constants
1.6.13 A primary goal of a Smarter Choices package is to change the perception of car travel relative to other modes. A straightforward way to represent this in models is to change the mode constants. Such changes should be targeted at the mode affected by the marketing; for example:
measures aimed specifically at reducing car travel should be incorporated by increasing the mode constant for car mode only, thereby making car less attractive; and

TAG Unit M5.2 Modelling Smarter Choices
Page 8
measures aimed specifically at increasing travel by another mode (for example, cycling) should be incorporated by reducing the mode constant for the targeted mode only (e.g. making cycling more attractive).
1.6.14 All such changes must be reported. The change in mode constant should be expressed in generalised cost minutes (by dividing the change in mode constant by the sensitivity parameter).
1.6.15 Changing the mode constants for a forecast run will automatically bring about changes in choices in respect of all demand responses in the model, not just choice of mode. Changes in distribution and hence average trip lengths (across all modes) are also likely to result from reduced congestion and may be more apparent than modal transfers if mode choice is less sensitive than destination choice, as in the case of the default choice hierarchy recommended in TAG Unit M2. It should not be necessary to change the parameters in the trip distribution model to represent the relative attractiveness of each zone.
1.6.16 From the above, it can be seen that an approach involving a mode constant change achieves consistency in the modelling process. There is a causal link between trips removed from car and trips that appear on other modes (to the same or alternative destinations). Trips which are forecast to transfer from car to bus will be most likely to do so where bus services are a reasonable alternative.
1.6.17 Most fully-specified transport demand/supply models treat public transport as a single mode, with sub-mode split being carried out by the assignment process. This means the same mode constant adjustment in the demand model would affect all public transport modes equally. Some assignment models permit mode-specific constants to be applied, and these may then be reflected in the costs input to the demand model. With other assignment models, it may be necessary to proxy a mode constant using a boarding penalty or an in-vehicle time adjustment.
1.6.18 In principle, it is possible to modify mode constants in order to achieve a benchmark or target change in trips by mode. This is straightforward with a single target (such as a specified reduction in car use) but may become problematic with multiple targets (such as a 10% reduction in car use combined with a 25% increase in public transport use). Where changes in non-car mode trips or travel form part of the benchmark, some experimentation with mode constant values may be required.
1.6.19 In these cases a proportionate approach may be to ensure that the ‘primary’ benchmark is met (e.g. reduction in car trips where the objective is to reduce car travel, or increase in bus trips if this is the primary objective of the scheme). Efforts should be made to reflect the evidence for other modes, bearing in mind specific softer measures targeted at those modes as part of the package as well. However, given that local conditions are often quite variable in themselves, i.e. there are different mode shares and different options available to local travellers, some deviation from evidence from elsewhere may be expected. Principally, the analyst should ensure that no error or bias exists in implementation that cause these differences in the model mode shares. A description and explanation for any variances from the evidence being used should be fully reported.
1.6.20 An alternative to using the target mode changes (especially where targets are not available for the specific schemes under consideration) would be to estimate the required change in the mode constant by methods which are independent of the model. An example methodology using an ‘experts panel’ approach would involve the following stages:
identify the scale of the mode constants (against car alternative by comparison with car) implied by the costs and mode shares within the base year model;
identify the likely components of the mode constant;
assess the relative importance of each component of the mode constant;
TAG Unit M5.2 Modelling Smarter Choices
Page 9
assess the ability to address each component through Smarter Choice measures (perhaps with a range of assumptions about available funding); and
derive changes to mode constants which can then be applied in the model.
1.6.21 The advantage of this approach is that the modeller explicitly addresses the links between the Smarter Choice measures and the way they might impact upon perceptions of alternative modes.
Modifications to Sensitivity Parameters
1.6.22 On balance, the approach of adjusting demand model choice parameters to represent Smarter Choice measures is not recommended.
1.6.23 The available evidence suggests that ‘soft’ Smarter Choice measures might make the choice of mode of travel more sensitive than is currently the case. It may be possible to represent this in modelling by making mode choice more sensitive; however, potentially implausible results could arise if the car mode were also to experience declining costs, for example, through a fuel cost reduction, as then the transfer to car use would be larger than would have been the case with unchanged choice parameters. Moreover, the application of the higher sensitivity only in cases where costs for the non-car modes are improving more rapidly than for the car mode does not seem to be either practical or theoretically consistent.
1.7 Modelling Specific Smarter Choice Measures
1.7.1 This Section discusses the potential components of workplace travel plans, school travel plans and targeted marketing initiatives and how one may classify these components into ‘hard’ and ‘soft’ measures. Both workplace and school travel plans will often consist of a number of ‘hard’ and ‘soft’ measures.
1.7.2 In the case of all the ‘hard’ measures, changes may be made either to the networks from which generalised costs would be skimmed or to the generalised costs directly. In either case, the resulting changes in costs should be fed into the demand model so that the demand changes can be forecast. In the case of network changes, re-assignment effects may also be of interest.
1.7.3 There is insufficient knowledge available about the ‘soft’ measures which might form components of workplace travel for their explicit representation in a transport model. Their effects should therefore be modelled using one or more of the general approaches outlined in Section 1.6.
Workplace Travel Plans
1.7.4 A workplace travel plan is a set of measures implemented at a workplace designed to:
encourage commuting by the more environmentally friendly modes;
reduce commuting by car, particularly driving without passengers (single occupant car commuting);
reduce car use for business trips through, for example, encouraging teleconferencing; and
reduce the visitor travel by car, especially single occupant cars.
1.7.5 The potential components of workplace travel plans may be classified as follows.

TAG Unit M5.2 Modelling Smarter Choices
Page 10
Table 2 Classification of workplace travel plan components Type of measure Specific measure ‘Hard’ measures that can be modelled using standard modelling tools
New conventional bus or rail services which serve the workplace; ‘Work buses’ between the workplace and the town centre which can be used by any traveller, that is, their use is not restricted to employees at the workplace only Dedicated ‘work buses’ between the workplace and the town centre which can only be used by employees at the workplace Subsidised public transport fares and interest-free season ticket loans Special deals which reduce the cost of commuting by bus and/or rail Parking ‘cash out’, that is, payments made to employees on days when they do not commute by car
‘Hard’ measures that can be modelled using models which include the functionality to model parking policies
Car parking restricted to essential users
Increased parking charges ‘Hard’ measures that can be modelled using more advanced techniques
Car sharing schemes Preferential parking for car sharers Demand activated bus services
‘Soft’ measures, most of which cannot be modelled explicitly
Car clubs Providing information about public transport services to all staff Offering personalised journey plans to all staff Providing secure cycle parking Providing changing and showering facilities at the workplace Providing a business cycle mileage allowance Providing services on site in order to reduce the need to travel off-site, such as cafeteria, convenience shopping, cash dispenser Encouraging teleworking Permitting flexible working hours or compressed working weeks
School Travel Plans
1.7.6 A school travel plan is a set of measures implemented at a school designed to:
reduce traffic congestion caused by school runs;
improve safety;
improve health and welfare of pupils; and
support pupils who are already travelling by sustainable modes.
In other words, school travel plans are established to make it more attractive for pupils to get to school by walking, cycling, public transport or car sharing.
1.7.7 The potential components of school travel plans may be classified as follows:

TAG Unit M5.2 Modelling Smarter Choices
Page 11
Table 3 Classification of school travel plan components Type of measure Specific measure ‘Hard’ measures that can be modelled using standard models:
Public transport fare reduction Special school buses Physical changes to the streets around the school such as 20 mph speed limits, traffic calming, pedestrian crossings and cycle lanes
‘Soft’ measures, most of which cannot be modelled explicitly:
Car sharing schemes for families living in the same neighbourhood Special walking or cycling promotion days Programme of pedestrian and cycle training for children Cycle parking Promotion of sustainable travel within the curriculum Involvement of children in the development of the school travel plan Setting out the school’s travel policy in the school prospectus and home/school agreement
Targeted Marketing Initiatives
1.7.8 Targeted marketing initiatives include: personalised travel planning, travel awareness campaigns and public transport marketing. They provide travel advice and information largely based on a good understanding of the particular travel patterns and needs. They also provide encouragement for those who are already adopting, to various degrees, sustainable means of travel.
1.7.9 These measures are all classified as ‘soft’ and hence guidance in Section 1.6 should be followed in order to model their effects.
1.7.10 Examples of targeted marketing initiatives include the following:
easy-to-use public transport timetables;
delivery of targeted (local or site-specific) personal travel plan information directly to households to help them make sustainable travel choices;
limited number of free trial public transport tickets for people who do not already use public transport;
offer of a visit from someone who can provide personal travel advice;
maps of walking and cycling routes; and
loans for the purchase of bicycles.
1.8 Reporting Requirements
1.8.1 It will be evident from this Unit that modelling Smarter Choice measures will often require assumptions to be made of one kind or another. All such assumptions made should be fully documented and supported by reasoned arguments and/or evidence, preferably local to the area concerned. Documentation should include:
the measures being modelled;

TAG Unit M5.2 Modelling Smarter Choices
Page 12
the benchmark impacts, along with the interpretation of evidence for such benchmarks;
the adopted methods of modelling the measures;
the assumptions made in modelling the measures;
the reasoned arguments and/or evidence to support the assumptions, including the results of any exploratory tests undertaken in order to determine appropriate model adjustments;
the forecasts with the ‘hard’ components but without the ‘soft’ components;
the forecasts with both ‘hard’ and ‘soft’ components; and
commentary on the plausibility of the forecast impacts of both ‘hard’ and ‘soft’ measures.
1.9 Considerations when Appraising Smarter Choices
1.9.1 This Unit has discussed how one may approach the modelling of Smarter Choice measures using traditional four-stage modelling tools. This will be of importance when appraising transport schemes where Smarter Choice initiatives will exist as a ’background’ measure. In these cases, the hard and soft components of these measures may be applied in the without-scheme and with-scheme cases alongside the scheme proposal being tested. This does not present a problem for traditional appraisal methods and TUBA may be used as normal to assess these schemes.
1.9.2 Where a Smarter Choice package may consist of hard measures only, and the transport model in hand is considered detailed and robust enough to produce sufficiently accurate results, an appraisal may also be carried out in the usual way, given that there are actual modelled cost changes that may be measured using standard tools.
1.9.3 Currently, however, there is no agreed methodology to appraise the economic impacts of most soft measures where they cannot be represented as a change in the components of generalised cost (i.e. travel time or financial cost). In these cases, switching mode as a result of soft measures would appear to be irrational since it derives no benefit that can be accounted for in a traditional appraisal, or indeed an apparent disbenefit relative to their previous choice. This often means that the usual cost-benefit analysis and accompanying tools cannot be applied in a meaningful way in the context of such soft measures.
1.9.4 In these cases, the model results may still be used to assess the impact of external costs and benefits that may arise. TUBA may still be used to derive some of the transport economic efficiency calculations (e.g. through decongestion on the highway network, greenhouse gases, etc.), provided that the analyst is satisfied with all of the implications of the model output (e.g. mode shares, trip lengths, destination choices, trip frequency, etc.). If the primary impact of the soft measures is to encourage mode shift to active modes, this may be appraised off-line from the model using the advice in TAG Unit A5.1 - Active Mode Appraisal. This also allows the analyst to include benefits such as health and journey quality.
1.9.5 Where changes in perceived cost can be adequately estimated and supported through evidence, it is possible that an adequate cost-benefit analysis may be conducted. The evidence base in this area is developing. Bus quality factors presented in TAG Unit M3.2 may be used to assess the change in costs due to various ‘softer’ service improvements. Similar values for rail passengers are also available in PDFH (see TAG Unit A5.3 – Rail Appraisal).
2 Document Provenance This TAG Unit was first released as definitive guidance in August 2012 as TAG Unit 3.10.6. This Unit was restructured in June 2013.
TAG Unit M5.2 Modelling Smarter Choices
Page 13
Appendix A References and Sources of Evidence A1.1 The evidence presented here is part of the emerging evidence base on the impact of Smarter
Choices measures. These may be used to assist benchmarking of these impacts in traditional transport models and may also be useful in comparative studies and appraisals where a model is not necessarily used.
Cairns, S., and Harmer, C., 2011. Accessing cars – insights from international experience. RAC Foundation.
Cairns, S., 2007. Understanding potential synergies between transport policies: smarter choices and road user charging. Report for Transport for London, London, 67pp.
Cairns, S., 2008. Can teleconferencing reduce business travel? TRL & UCL.
Cairns, S., 2011. Accessing cars – different ownership and use choices. RAC Foundation.
Cairns, S., and Newson C., 2006. Making school travel plans work: effects, benefits and success factors at English schools. Paper given at the European Transport Conference, Strasbourg, 18-20/09/06.
Cairns, S., Newson C. and Davis A., 2010. Understanding successful workplace travel initiatives in the UK. Transportation Research A 44, pp473-494.
Cairns, S., Sloman L., Newson, C., Anable, J., Kirkbride, A. and Goodwin, P., 2004. Smarter Choices – Changing the Way We Travel, Final Report of soft factor interventions on travel demand, Department for Transport, July.
Harmer, C. and Cairns, S., 2011. Carplus annual survey of car clubs 2010/11. TRL report PPR567, Crowthorne.
Harmer, C. and Cairns, S., 2012. Carplus annual survey of car clubs 201112. TRL reports (three volumes) for Carplus, Berkshire.
Harmer, C. and Cairns, S., 2012. The emissions impacts of car clubs in London. TRL report PPR591 for Carplus. Berkshire
ITP, 2010. Regional rural car share feasibility study: final report. Report to the Yorkshire and Humber Rural Access to Opportunities Programme, produced by ITP, Birmingham.
ITP with Richard Armitage Transport Consultancy, Cleary Hughes Associates and Austin, J., 2004. Making car sharing and car clubs work: final report. Department for Transport, London.
Levine, S., 2012. Car Rental 2.0 – car club innovations and why they matter. RAC Foundation.
Möser, G., and Bamberg, S., 2008. The effectiveness of soft transport policy measures: a critical assessment and meta-analysis of empirical evidence. Journal of Environmental Psychology, Vol 28, pp10-26.
MVA, 2011. Smarter Travel Richmond: Year 2 annual monitoring and evaluation report. Report for Transport for London.
Parker, J., Harris, L., Chatterjee, K., Armitage. R., Cleary, J., and Goodwin, P., 2007. Making personal travel planning work: research report. Department for Transport, London.
Shaheen, S.A., and Cohen, A.P., 2007. ‘Growth in worldwide carsharing: an international comparison’, Journal of the Transportation Research Board, No 1992, pp 81-89.
TAG Unit M5.2 Modelling Smarter Choices
Page 14
Shaheen, S.A., Cohen, A.P. and Chung, M.S., 2009. ‘North American Carsharing: 10 year retrospective’, Journal of the Transportation Research Board, No 2110, pp 35-44.
Sinclair Knight Merz, 2008. Stansted Airport Surface Access Modelling, 2007 Stansted Employee Surface Access Model (SESAM), 9 June.
Sloman, L., Cairns, S., Newson, C., Anable, J., Pridmore, A. and Goodwin, P., 2010. The Effects of Smarter Choice Programmes in the Sustainable Travel Towns: Research Report. Report to the Department for Transport, March 2010. Accessed February 20, 2012 at http://www.dft.gov.uk/publications/the-effects-of-smarter-choice-programmes-in-the-sustainable-travel-towns-full-report/#
Sloman, L., Cavill, N., Cope, A., Muller, L. and Kennedy, A., 2009. Analysis and synthesis of evidence on the effects of investment in six Cycling Demonstration Towns. Report for Department for Transport and Cycling England. Accessed February 20, 2012 at http://webarchive.nationalarchives.gov.uk/20110407094607/http://www.dft.gov.uk/cyclingengland/cycling-cities-towns/results/
Socialdata and Sustrans (2007a). Worcester: Sustainable Travel Demonstration Town - Interim Evaluation of ITM Programme (Stages 2.1 and 2.2). Report for Worcestershire County Council. July.
Socialdata and Sustrans, 2007b. Peterborough: Sustainable Travel Demonstration Town - Interim Evaluation of ITM Programme (Stages 2 and 3). Report for Peterborough City Council. August.
Socialdata and Sustrans, 2008. Darlington: Sustainable Travel Demonstration Town – Third Interim Travel Behaviour Research: Final Report. February.
Sustrans and Socialdata, 2008a, 2009, 2010a, 2010b, 2010c, Parker et al, 2007. Evaluations of Sustrans’ personalised travel planning projects (also known as individualised travel marketing).
The Smarter Travel Richmond and Smarter Travel Sutton Programmes
Wall, R., Brög, W., Erl, E., Ryle, J. and Barta, F., 2011. A response to: Möser, G., & Bamberg, S. (2008), The effectiveness of soft transport policy measures: A critical assessment and meta-analysis of empirical evidence. Journal of Environmental Psychology. DOI:10.1016/j.jenvp.2011.05.004.
WWF-UK, 2011. Moving on – why flying less means more for business. World Wildlife Fund, UK.
TAG Unit M5.2 Modelling Smarter Choices
Page 15
Appendix B Overview of Möser and Bamberg Meta Analysis B1.1 This Appendix provides the background information used to inform the indicative benchmarks for the
impacts of Smarter Choices measures in Section 1.4 that may be used in modelling.
B1.2 Möser and Bamberg analysed all the Smarter Choice applications that were reviewed by Cairns et al (2004), along with some more recent cases up to 2005. They provided a critical review of the effects of Smarter Choice measures, using reports of 141 studies in 12 developed countries (of which 93 studies relate to the UK). Their analysis was based on the effects of the measures as reported; no attempts were made to access and re-analyse the primary data collected about the effects of each measure or package of measures.
B1.3 In summary, Möser and Bamberg concluded that:
all the studies they reviewed used a weak quasi-experimental ‘before and after’ survey design which, in their view, severely threatens the internal validity of the reported effects of Smarter Choice interventions;
most studies did not use statistical tests for rejecting the null hypothesis of no effect;
the validity of generalising the results to the total population seems to be threatened by the frequent use of samples that are not representative of the total population; and
the results may underestimate, but more probably overestimate, the true causal car use reduction effects.
B1.4 However, they felt that, given the interest in implementing Smarter Choice measures, the main question was not whether to perform research synthesis but whether to perform it in a more or less defensible way.
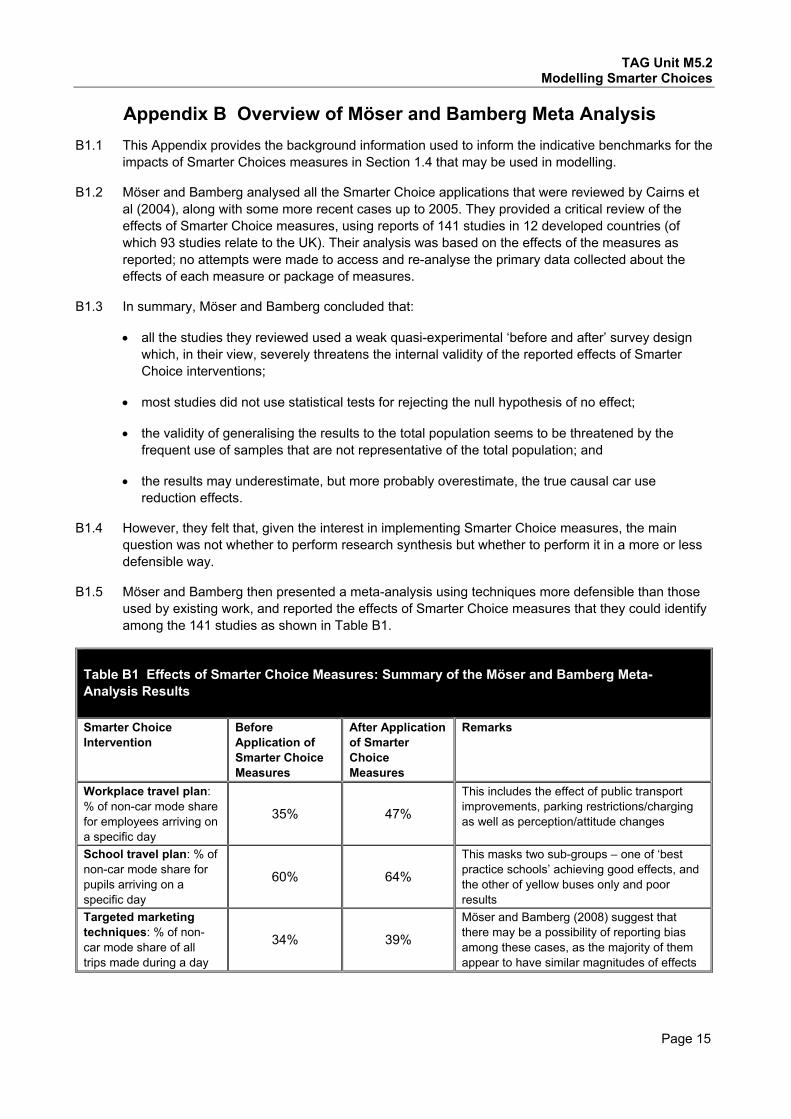
B1.5 Möser and Bamberg then presented a meta-analysis using techniques more defensible than those used by existing work, and reported the effects of Smarter Choice measures that they could identify among the 141 studies as shown in Table B1.
Table B1 Effects of Smarter Choice Measures: Summary of the Möser and Bamberg Meta-Analysis Results Smarter Choice Intervention
Before Application of Smarter Choice Measures
After Application of Smarter Choice Measures
Remarks
Workplace travel plan: % of non-car mode share for employees arriving on a specific day
35% 47%
This includes the effect of public transport improvements, parking restrictions/charging as well as perception/attitude changes
School travel plan: % of non-car mode share for pupils arriving on a specific day
60% 64%
This masks two sub-groups – one of ‘best practice schools’ achieving good effects, and the other of yellow buses only and poor results
Targeted marketing techniques: % of non-car mode share of all trips made during a day
34% 39%
Möser and Bamberg (2008) suggest that there may be a possibility of reporting bias among these cases, as the majority of them appear to have similar magnitudes of effects
TAG Unit M5.2 Modelling Smarter Choices
Page 16
B1.6 Although the Möser and Bamberg analysis shows that Smarter Choice measures may be successful in reducing travel by car, there are some important caveats that need to be borne in mind. These include all the issues noted earlier, along with the following:
The indicator of modal shift used in this work is the modal share expressed in terms of trips made by people directly targeted by the Smarter Choice measures, and there is no indication of changes in either trip-km or the vehicle-km of road traffic;
The average non-car mode shares before application of Smarter Choices measures in the meta-analysis may differ from the existing non-car mode shares in the model study area. This would need to be borne in mind when extrapolating the results to the wider population. It should be noted that the base non-car mode share for targeted marketing measures is similar to the average Great Britain level for all trips; and
It is well known that meta-analysis is likely to overstate the effects because studies with no significant or negative effects are much less likely to be published or to become accessible for retrieval. The effects revealed by Möser and Bamberg are therefore likely to be close to the upper limit in the possible range of impacts.
B1.7 However, even bearing in mind the above caveats, the results still give some idea about the average levels of impact.
For workplace travel plans, the effects are the combined effects of both ‘soft’ and associated ‘hard’ measures (e.g. public transport improvements and parking measures). The analysis suggests that workplace travel plans would increase the overall non-car mode share by 12 percentage points. Given the base mode share, this implies an increase in the number of non-car trips by 34%, or a reduction in the number of car trips by 18% on the assumption that the total number of trips stays unchanged.
For school travel plans, the sample reviewed by Möser and Bamberg could be divided into a small group of six best-practice schools where a lot had been achieved, and the rest, where the impacts were marginal, perhaps due to the lack of intensity of application or coordination with the ‘hard’ measures involved (in those cases the ‘hard’ measures were ‘Yellow’ buses). This means that the average increase in the number of non-car trips of 7% (as suggested in Table B1), or the implied reduction in the number of car trips of 10%, would have under-estimated the best-practice examples, but over-estimated the others in the school travel sample.
For targeted marketing, the analysis suggests that predominantly information and promotional campaigns would increase the overall non-car mode share by 5 percentage points. Given the base mode share, this implies an increase in the number of non-car trips by 14%, or a reduction in the number of car trips by 8%.
B1.8 The Möser and Bamberg paper does not provide any information about effects on traffic or induced traffic. Indeed, it has been a common feature of the Smarter Choice studies to examine the impacts on a limited group of the targeted travellers, rather than the road network as a whole.