Embed Size (px)
Citation preview
USAARL Report No. 2004-10
Tactile Situation Awareness System Flight Demonstration Final Report by B. J. McGrath, Naval Aerospace Medical Research Laboratory; A. Estrada, USAARL; M. G. Braithwaite, Headquarters Director Army Aviation; A. K. Raj, Institute for Human and Machine Cognition; an<i A. H. Rupert, Naval Aerospace Medical Research Laboratory
REPRODUCED FROM BEST AVAILABLE COPY
Aircrew Health and Performance Division
March 2004
Approved for public release, distribution unlimited.
n
U s A
J L _^^
A J L _m^
i ^
^
U.S. Army Aeromedical Research
Laboratory
Notice
Qualified requesters
Qualified requesters may obtain copies fi-om the Defense Technical Information Center (DTIC), 8725 John J. Kingman Road, Suite 0944, Fort Belvoir, Virginia 22060-6218. Orders will be expedited if placed through the librarian or other person designated to request documents fi-om DTIC.
Change of address
Organizations receiving reports fi-om the U.S. Army Aeromedical Research Laboratory on automatic mailing lists should confirm correct address when corresponding about laboratory reports.
Disposition
Destroy this document when it is no longer needed. Do not return it to the originator.
Disclaimer
The views, opinions, and/or findings contained in this report are those of the author(s) and should not be construed as an official Department of the Army position, policy, or decision, unless so designated by other official docimientation. Citation of trade names in this report does not constitute an official Department of the Army endorsement or approval of the use of such commercial items.
Human use
Human subjects participated in these studies after giving their free and informed volvmtary consent. Investigators adhered to AR 70-25 and USAMRMC Reg 70-25 on Use of Volunteers in Research.
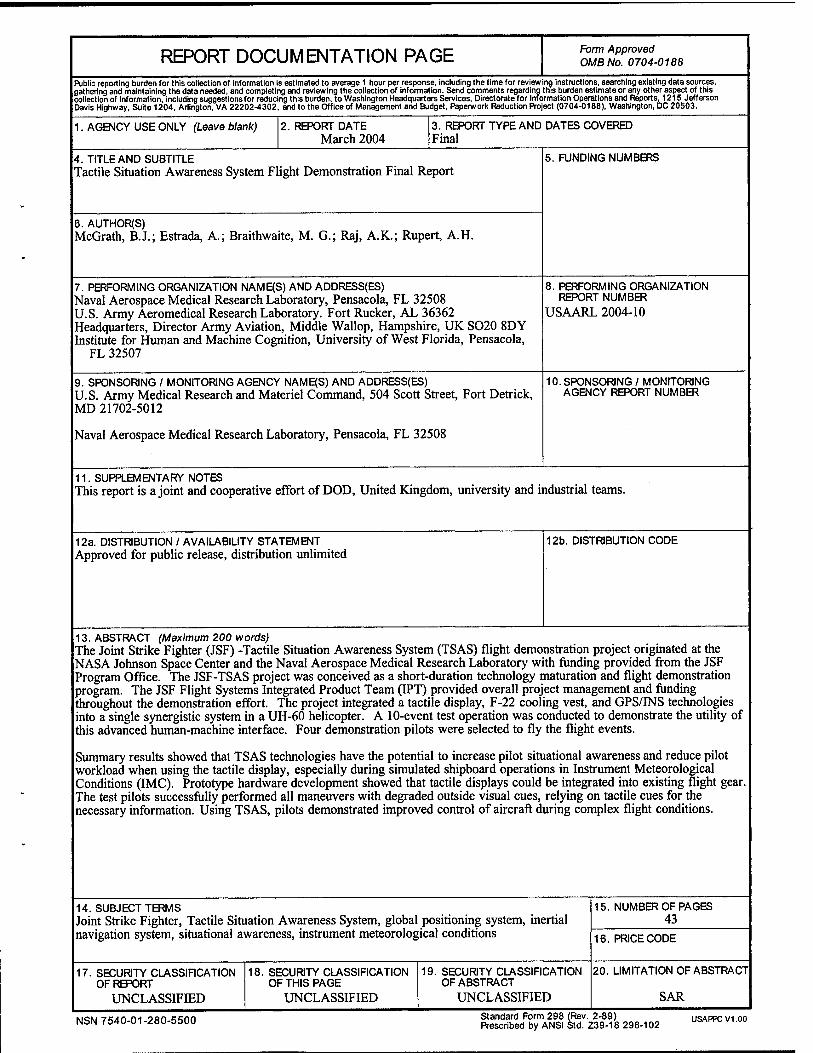
REPORT DOCUMENTATION PAGE Form Approved 0MB No. 0704-0188
Public reporting burden for this collection of information Is estimated to average 1 hour per response, including the time for reviewing instructions, searching existing data sources, gathering and maintaining the data needed, and completing and reviewing the collection of information. Send comments regarding this burden estimate or any other aspect of this collection of information, including suggestions for reducing this burden, to Washington Headquarters Services, Directorate for Information Operations and Reports, 1215 Jefferson Davis Highway, Suite 1204, Arlington. VA 22202-4302. and to the Office of Management and Budget. Paperwork Reduction Project (0704-0188). Washington, DC 20503.
1. AGENCY USE ONLY (Leave blank) 2. REPORT DATE March 2004
3. REPORT TYPE AND DATES COVERED Final
4. TITLE AND SUBTITLE Tactile Situation Awareness System Flight Demonstration Final Report
6. AUTHOR(S) McGrath, B.J.; Estrada, A.; Braithwaite, M. G.; Raj, A.K.; Rupert, A.H.
5. FUNDING NUMBERS
7. PERFORMING ORGANIZATION NAME(S) AND ADDRESS(ES) Naval Aerospace Medical Research Laboratory, Pensacola, FL 32508 U.S. Army Aeromedical Research Laboratory. Fort Rucker, AL 36362 Headquarters, Director Army Aviation, Middle Wallop, Hampshire, UK SO20 8DY Institute for Human and Machine Cognition, University of West Florida, Pensacola,
FL 32507
8. PERFORMING ORGANIZATION REPORT NUMBER
USAARL 2004-10
9. SPONSORING / MONITORING AGENCY NAME{S) AND ADDRESS(ES) U.S. Army Medical Research and Materiel Command, 504 Scott Street, Fort Detrick, MD 21702-5012
Naval Aerospace Medical Research Laboratory, Pensacola, FL 32508
10. SPONSORING / MONITORING AGENCY REPORT NUMBER
11. SUPPLEMENTARY NOTES This report is a joint and cooperative effort of DOD, United Kingdom, university and industrial teams.
12a. DISTRIBUTION / AVAILABILITY STATEMENT Approved for public release, distribution unlimited
12b. DISTRIBUTION CODE
13. ABSTRACT (Maximum 200 v/ords) The Joint Strike Fighter (JSF) -Tactile Situation Awareness System (TSAS) flight demonstration project originated at the NASA Johnson Space Center and the Naval Aerospace Medical Research Laboratory with funding provided from the JSF Program Office. The JSF-TSAS project was conceived as a short-duration technology maturation and flight demonstration program. The JSF Flight Systems Integrated Product Team (IPT) provided overall project management and funding throughout the demonstration effort. The project integrated a tactile display, F-22 cooling vest, and GPS/INS technologies into a single synergistic system in a UH-60 helicopter. A 10-event test operation was conducted to demonstrate the utility of this advanced human-machine interface. Four demonstration pilots were selected to fly the flight events.
Summary results showed that TSAS technologies have the potential to increase pilot situational awareness and reduce pilot workload when using the tactile display, especially during simulated shipboard operations in Instrument Meteorological Conditions (IMC). Prototype hardware development showed that tactile displays could be integrated into existing flight gear. The test pilots successfully performed all maneuvers with degraded outside visual cues, relying on tactile cues for the necessary information. Using TSAS, pilots demonstrated improved control of aircraft during complex flight conditions.
14. SUBJECT TERMS Joint Strike Fighter, Tactile Situation Awareness System, global positioning system, inertial navigation system, situational awareness, instrument meteorological conditions
15. NUMBER OF PAGES 43
16. PRICE CODE
17. SECURITY CLASSIFICATION OF REPORT
UNCLASSIFIED
18. SECURITY CLASSIFICATION OF THIS PAGE
UNCLASSIFIED
19. SECURITY CLASSIFICATION OF ABSTRACT
UNCLASSIFIED
20. LIMITATION OF ABSTRACT
SAR
NSN 7540-01-280-5500 Standard Form 298 (Rev. 2-89) Prescribed by ANSI Std. Z39-18 298-102
USAPPCV1.00
Acknowledgements
The JSF TSAS project was a true team effort involving numerous military, academic, and industry organizations. The JSF TSAS project participants are listed below.
• National Aeronautics and Space Administration-Johnson Space Center provided concept origination and computer hardware.
• University of Sydney provided aeronautical engineering, flight test engineering and project management support.
• Joint Strike Fighter provided program management and fiscal support. • Naval Aerospace Medical Research Laboratory provided TSAS laboratory testing facilities,
system integration facilities, flight hardware fabrication and US Navy test pilots. • United States Army Aeromedical Research Laboratory provided the UH-60 aircraft and US
Army pilots, prepared the documentation for aircraft modification approval and flight clearances, conducted ground testing to verify flight readiness, and made available the UH-60 simulator for TSAS integration and pilot training. Special thanks to MAJ Steven Gilreath, MAJ Cynthia Lamb and DAC Larry Woodrum.
• The US Navy Coastal Systems Station-Dahlgren Division (Panama City, FL) developed the factor laboratory hardware, provided fiscal management support, and provided all TSAS logistical support.
• University of West Florida developed TSAS software and designed and integrated the flight- worthy TSAS hardware.
• Naval Air Station Pensacola provided flight test and range support. • Office of Naval Research provided fiscal management support. • Jackson Foundation provided project management support.
Princeton University provided tactile expertise. Massachusetts Institute of Technology and Tulane University provided expertise in helicopter handling qualities modeling and analysis. Carleton Technologies, under CSS contract, supplied and supported the pneumatic factor, model 2856-AO, and the ground-based pneumatic factor driver system. Engineering Acoustics Inc., under ONR SBIR contract, supplied and supported the electromagnetic factor, AT-96. Audiological Engineering, under ONR contract, supplied the electromagnetic factor, Tactaid. Unitech Research Inc., under CSS contract, supplied the electiical factor, Audiotact. Lockheed-Martin/Mustang Survival, under CSS contract, supplied the F-22 cooling vest. Boeing North American, Inc., Autonetics & Missile Systems Division, under CSS contract, supplied and supported the MIGITS II GPS/INS.
111 20040422 116
Table of contents
Page
Introduction 1
System description and integration 4
UH-60 aircraft 5 Foggles 6 TSASNP-1 sensor 7 TSASNP-1 hardware 8 TSASNP-1 software 9 JSF TSAS tactor locator system 10 Carleton Technologies pneumatic tactor 11 Tactor selection 12 JSF TSAS tactile algorithm 13 Simulator testing 15 Tactor control laboratory system 16 Flight simulator. 18 Simulator results 19
Test plan 21
TSAS evaluation flight 21 Human factors metrics 23 Data recording 24 Data reduction 24
Flight test results 24
Situation awareness 25 Woridoad 26 Pilot comments 26 Flight data 28
Discussioa 37
F-22 cooling vest 38
Conclusions/recommendations 39
References 40
Acronyms 42
Table of contents (continued)
List of tables
Page Table 1. JSF TSAS simulator testing 20 Table 2. JSF TSAS test event matrix 21 Table 3. JSF TSAS evaluation flight test plan 22 Table 4. Modified China Lake situational awareness scale 23 Table 5. TSAS Video Debrief hiterview 24 Table 6. Situation awareness pilot ratings 25
List of figures
Figure 1. Types of spatial disorientation accidents (from Braithwaite et al. 1997) 1 Figure 2. TSAS Concept 2 Figure 3. Research programs related to the JSF TSAS project 3 Figure 4. JSF TSAS NP-1 architecture 5 Figure 5. USAARL UH-60 research aircraft 6 Figure 6. UH-60 chin bubble with opaque plastic lining 7 Figure 7. JSF TSAS NP-1 Software Architecture 10 Figure 8. JSF TSAS tactor locator system 11 Figure 9. TSAS demonstration pilot showing TSAS tactor locator system 11 Figure 10. Carleton Technologies model 2856-AO pneumatic tactor 12 Figure 11. JSF TSAS tactile array 14 Figure 12. JSF TSAS tactor pulse pattern 15 Figure 13. FPl Simulated shipboard take-off (Phases C and D) 29 Figure 14. FPl Simulated shipboard landing (Phases C and D) 30 Figure 15. FP2 Simulated shipboard take-off (Phases C and D) 31 Figure 16. FP2 Simulated shipboard landing (Phases C and D) 32 Figure 17. FP3 Simulated shipboard take-off (Phases C and D) 33 Figure 18. FP3 Simulated shipboard landing (Phases C and D) 34 Figure 19. FP4 Simulated shipboard take-off (Phases C and D) 35 Figure 20. FP4 Simulated shipboard landing (Phases C and D) 36
VI
Introduction
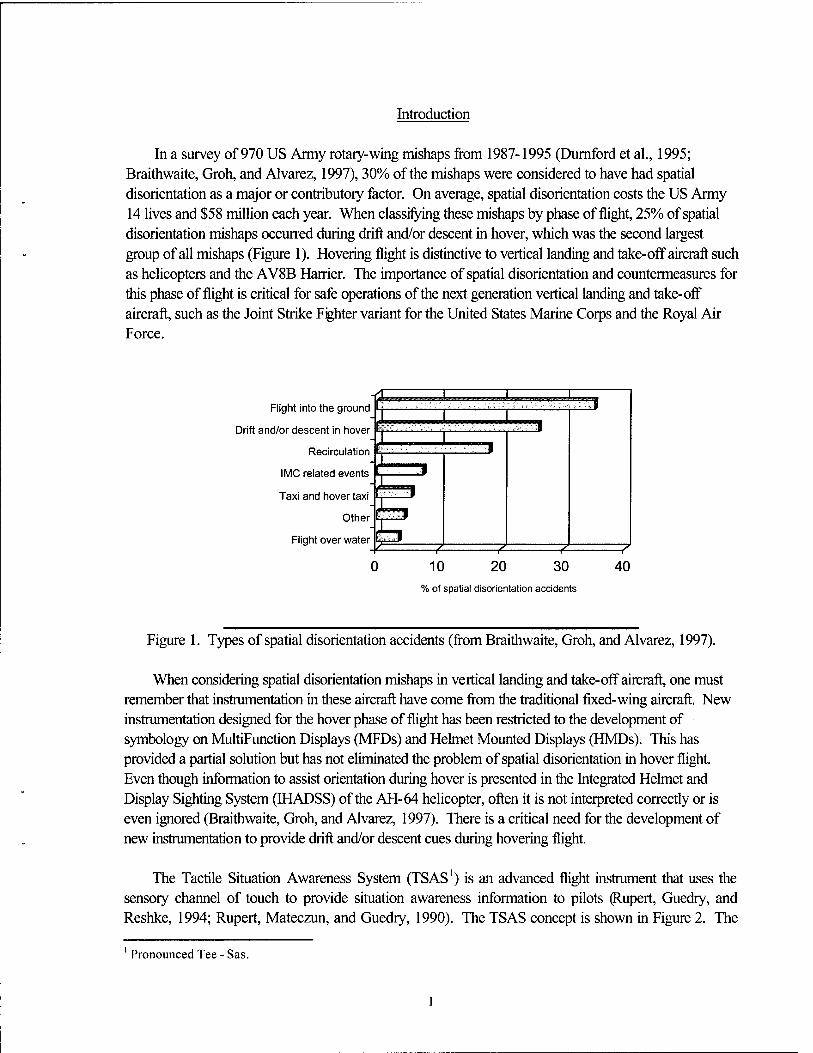
In a survey of 970 US Army rotary-wing mishaps from 1987-1995 (Dumford et al., 1995; Braithwaite, Groh, and Alvarez, 1997), 30% of the mishaps w^ere considered to have had spatial disorientation as a major or contributory factor. On average, spatial disorientation costs the US Army 14 lives and $58 million each year. When classifying these mishaps by phase of flight, 25% of spatial disorientation mishaps occurred during drift and/or descent in hover, which was the second largest group of all mishaps (Figure 1). Hovering flight is distinctive to vertical landing and take-off aircraft such as helicopters and the AV8B Harrier. The importance of spatial disorientation and countermeasures for this phase of flight is critical for safe operations of the next generation vertical landing and take-off aircraft, such as the Joint Strike Fghter variant for the United States Marine Corps and the Royal Air Force.
Flight into the ground
Drift and/or descent in hover
Recirculation
IIVIC related events
Taxi and hover taxi
Other
Flight over water
■^.^—A 1
k-. — L^^^-L.^.^
/
-I-.^-,-^' ;:;l:ij;;,„i;„l,;il;»
J- / 0 10 20 30
% of spatial disorientation accidents
40
Figure 1. Types of spatial disorientation accidents (from Braithwaite, Groh, and Alvarez, 1997).
When considering spatial disorientation mishaps in vertical landing and take-off aircraft, one must remember that instmmentation in these aircraft have come from the traditional fixed-wing aircraft. New instrumentation designed for the hover phase of flight has been restricted to the development of symbology on MultiFunction Displays (MFDs) and Helmet Mounted Displays (HMDs). This has provided a partial solution but has not eliminated the problem of spatial disorientation in hover flight. Even though information to assist orientation during hover is presented in the Integrated Helmet and Display Sighting System (HADSS) of the AH-64 helicopter, often it is not interpreted correctly or is even ignored (Braithwaite, Groh, and Alvarez, 1997). There is a critical need for the development of new instrumentation to provide drift and/or descent cues during hovering flight.
The Tactile Situation Awareness System (TSAS') is an advanced flight instrument that uses the sensory channel of touch to provide situation awareness information to pilots (Rupert, Guedry, and Reshke, 1994; Rupert, Mateczun, and Guedry, 1990). The TSAS concept is shown in Figure 2. The
Pronounced Tee - Sas.
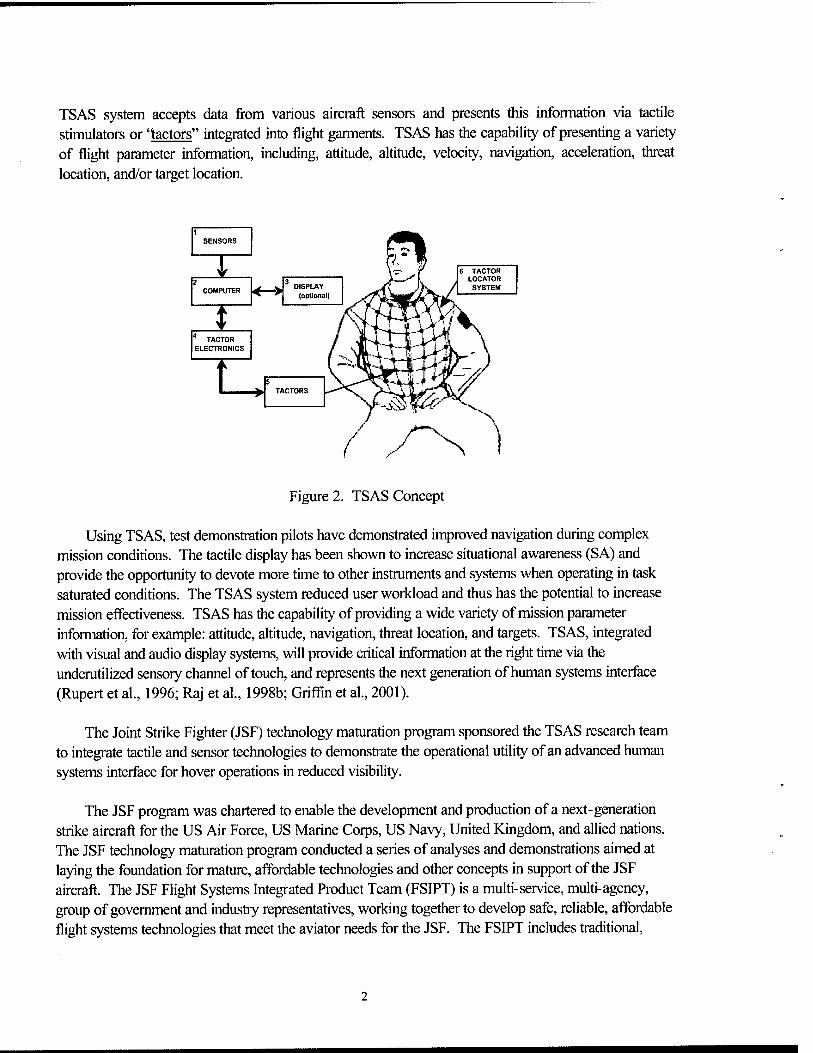
TSAS system accepts data from various aircraft sensors and presents this information via tactile stimulators or 'tactors" integrated into flight garments. TSAS has the capability of presenting a variety of flight parameter information, including, attitude, altitude, velocity, navigation, acceleration, threat location, and/or target location.
I I
COMPUTER ^ DISPLAY
(optional)
6 TACTOR LOCATOR SYSTEM
* TACTOR ELECTRONICS
j
^ 5 TACTORS
'
Figure 2. TSAS Concept
Using TSAS, test demonstration pilots have demonstrated improved navigation during complex mission conditions. The tactile display has been shown to increase situational awareness (SA) and provide the opportunity to devote more time to other instruments and systems when operating in task saturated conditions. The TSAS system reduced user workload and thus has the potential to increase mission eflFectiveness. TSAS has the capability of providing a wide variety of mission parameter infonnation, for example: attitude, altitude, navigation, threat location, and targets. TSAS, integrated witli visual and audio display systems, will provide critical information at the right time via the undemtilized sensory channel of touch, and represents the next generation of human systems interface (Rupert et al., 1996; Raj et al., 1998b; Griffin et al., 2001).
The Joint Strike Fighter (JSF) technology maturation program sponsored the TSAS research team to integrate tactile and sensor technologies to demonstrate the operational utility of an advanced human systems interface for hover operations in reduced visibility.
The JSF program was chartered to enable the development and production of a next-generation strike aircraft for the US Air Force, US Marine Corps, US Navy, United Kingdom, and allied nations. The JSF technology maturation program conducted a series of analyses and demonstrations aimed at laying the foundation for mature, affordable technologies and other concepts in support of the JSF aircraft. The JSF Flight Systems Integrated Product Team (FSIPT) is a multi-service, multi-agency, group of govemment and industry representatives, working together to develop safe, reliable, affordable flight systems technologies that meet the aviator needs for the JSF. The FSIPT includes traditional.
advanced, and integrated subsystems, and cockpit'aircrew systems (Haven and Smith, 1996). Tiie FSIPT managed and participated in the JSF TSAS flight demonstration.
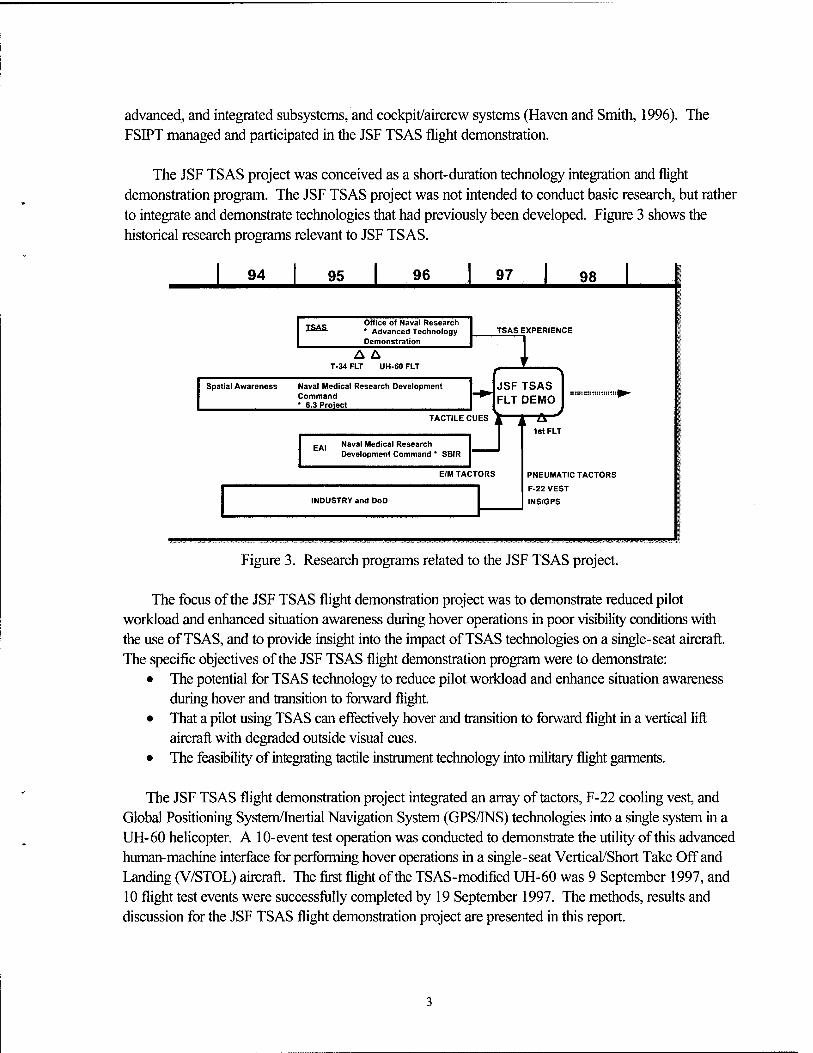
The JSF TSAS project was conceived as a short-duration technology integration and flight demonstration program. The JSF TSAS project was not intended to conduct basic research, but rather to integrate and demonstrate technologies that had previously been developed. Figure 3 shows the historical research programs relevant to JSF TSAS.
94 95 96 97 98 i ISAS.
Office of Naval Research * Advanced Technology Demonstration
TSAS EXPERIENCE
T-34 FLT UH-60 FLT
Spatial Awareness Naval Medical Research Development Command * 6.3 Project
TACTILE CUES
JSF TSAS FLT DEMO
Naval Medical Research Development Command * SBIR
E/M TACTORS
INDUSTRY and DoD
PNEUMATIC TACTORS
F-22 VEST
INS/GPS
Figure 3. Research programs related to the JSF TSAS project.
The focus of the JSF TSAS flight demonstration project was to demonstrate reduced pilot workload and enhanced situation awareness during hover operations in poor visibility conditions with the use of TSAS, and to provide insight into the impact of TSAS technologies on a single-seat aircraft. The specific objectives of the JSF TSAS flight demonstration program were to demonstrate:
• The potential for TSAS technology to reduce pilot workload and enhance situation awareness during hover and transition to forward flight.
• That a pilot using TSAS can effectively hover and transition to forward flight in a vertical lifl: aircraft with degraded outside visual cues.
• The feasibility of integrating tactile instrument technology into military flight garments.
The JSF TSAS flight demonstration project integrated an array of tactors, F-22 cooling vest, and Global Positioning System/lnertial Navigation System (GPS/INS) technologies into a single system in a UH-60 helicopter. A 10-event test operation was conducted to demonstrate the utility of this advanced human-machine interface for performing hover operations in a single-seat Vertical/Short Take Off and Landing (V/STOL) aircraft. The first flight of the TSAS-modified UH-60 was 9 September 1997, and 10 flight test events were successfiilly completed by 19 September 1997. The methods, results and discussion for the JSF TSAS flight demonstration project are presented in this report.
The successful achievement of JSF TSAS project objectives required the use of a dual station vertical lift aircraft with associated flight test support that would allow timely completion of the project within a fixed budget. The TSAS planning team established demonstrator aircraft criteria that were used in evaluating a variety of candidate flight test aircraft. Use of these criteria resulted in the decision to use the UH-60 aircraft at the United States Army Aeromedical Research Laboratory (USAARL) located at Fort Rucker, Alabama, that provided a complete flight demonstration package at the lowest cost. Benefits of using the USAARL UH-60 aircraft included:
• Dual-seat capability enabling the addition of a safety pilot, who doubled as an instmctor pilot, to provide real-time assistance to TSAS demonstration pilots.
• Previous integration and test experience with tactile instmments (Raj et al., 1998a). • Aircraft availability. • Low integration and flying time costs. • Testing the TSAS tactile instrument in a harsh environment.
The USAARL flight test facility also provided multiple benefits including:
• Complete on-site aircraft modification and maintenance, and avionics hardware and software test capability.
• On-site flight test planning, data collection and analysis, and reporting capability. • The availability of United States Army helicopter pilots. • Motion-based UH-60 simulator.
The JSF TSAS flight demonstration project integrated an array of pneumatic vibro-tactile tactors, an F-22 cooling vest, and GPS/INS technologies into a single system in a UH-60 helicopter. A 10- event test operation was conducted to demonstrate the utility of this advanced human-machine interface for performing hover operations.
System descripfion and integration
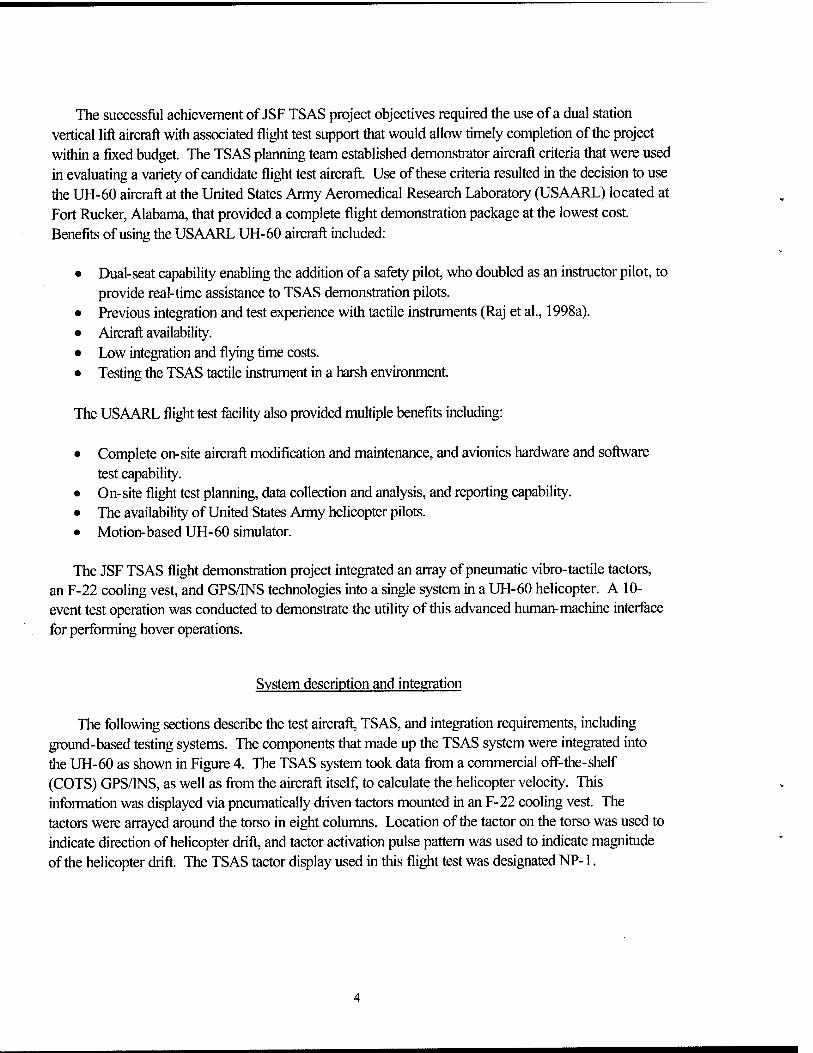
The following sections describe the test aircraft, TSAS, and integration requirements, including ground-based testing systems. The components that made up the TSAS system were integrated into the UH-60 as shown in Figure 4. The TSAS system took data fi-om a commercial off-the-shelf (COTS) GPS/INS, as well as from the aircraft itself, to calculate the helicopter velocity. This information was displayed via pneumatically driven tactors mounted in an F-22 cooling vest. The tactors were arrayed around the torso in eight columns. Location of the tactor on the torso was used to indicate direction of helicopter drift, and tactor activation pulse pattern was used to indicate magnitude of the helicopter drift. The TSAS tactor display used in this flight test was designated NP-1.
INS/GPS
± DGPS
RS-232
RS-232
Airborne Instrument System
PL-1000
TSAS Processor
NP-1
Pneumatic Valves
Pneumatic Source
Cooling Air
F-22 Cooling Vest
with Tactors
Figure 4. JSF TSAS NP-1 architecture.
UH-60 aircraft
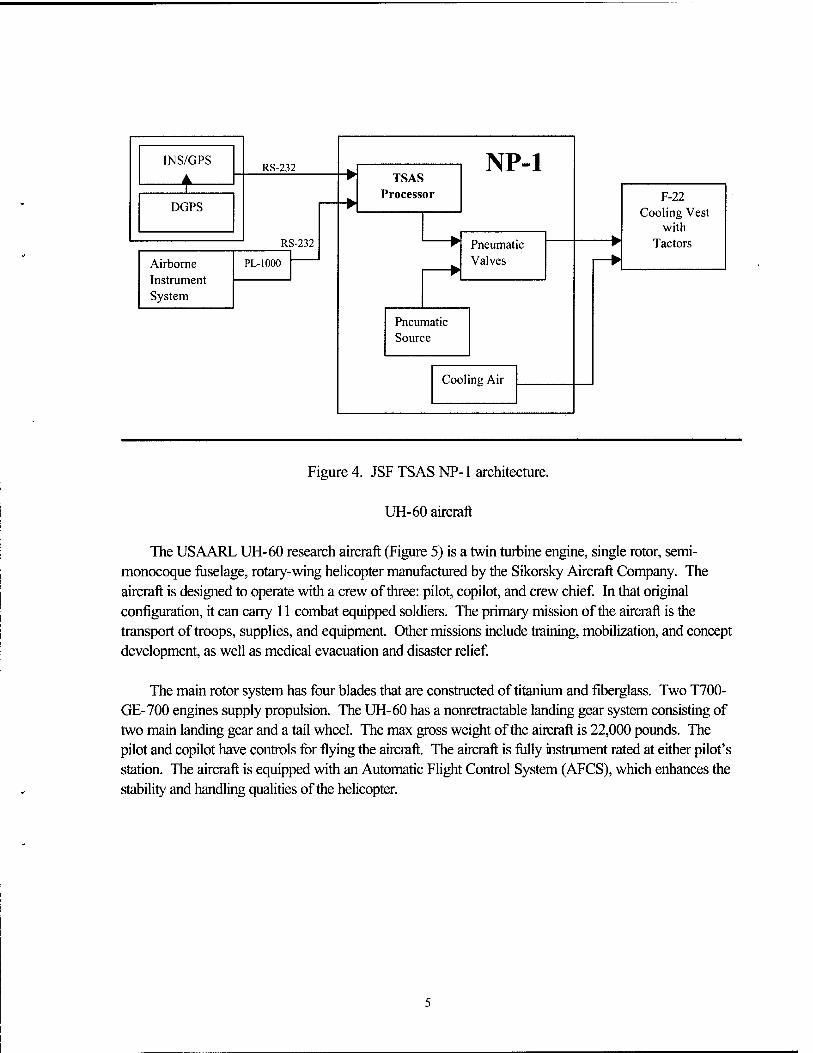
The USAARL lJH-60 research aircraft (Figure 5) is a twin turbine engine, single rotor, semi- monocoque fiiselage, rotary-wing helicopter manufactured by the Sikorsky Aircraft Company. The aircraft is designed to operate with a crew of three: pilot, copilot, and crew chief hi that original configuration, it can carry 11 combat equipped soldiers. The primary mission of the aircraft is the transport of troops, supplies, and equipment. Other missions include training, mobilization, and concept development, as well as medical evacuation and disaster relief
The main rotor system has four blades that are constmcted of titanium and fiberglass. Two T700- GE-700 engines supply propulsion. The lJH-60 has a nonretractable landing gear system consisting of two main landing gear and a tail wheel. The max gross weight of the aircraft is 22,000 pounds. The pilot and copilot have controls for flying the aircraft. The aircraft is fiilly instrument rated at either pilot's station. The aircraft is equipped with an Automatic Flight Control System (AFCS), which enhances the stability and handling qualities of the helicopter.
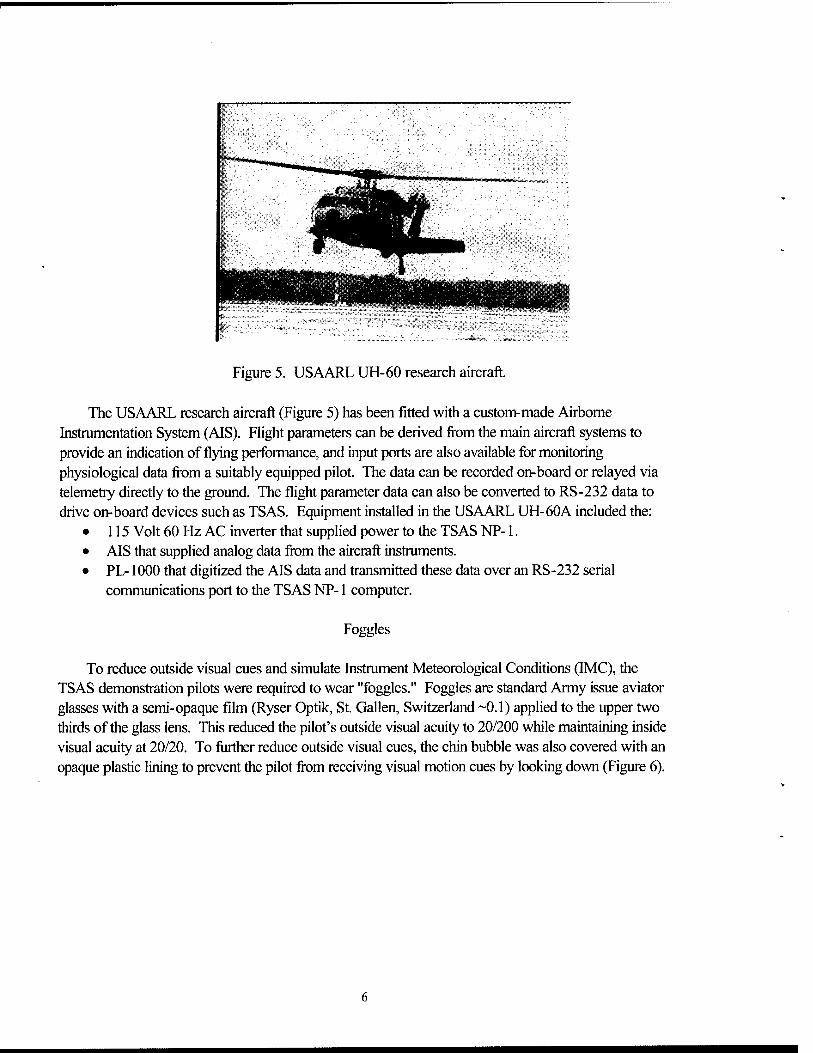
Figure 5. USAARL UH-60 research aircraft.
The USAARL research aircraft (Figure 5) has been fitted with a custom-made Airborne Instrumentation System (AIS). Fhght parameters can be derived from the main aircraft systems to provide an indication of flying performance, and input ports are also available for monitoring physiological data from a suitably equipped pilot. The data can be recorded on-board or relayed via telemetry directly to the ground. The flight parameter data can also be converted to RS-232 data to drive on-board devices such as TSAS. Equipment installed in the USAARL UH-60A included the:
• 115 Volt 60 Hz AC inverter that supplied power to the TSAS NP-1. • AIS that supplied analog data from the aircraft instruments. • PL-1000 that digitized the AIS data and transmitted these data over an RS-232 serial
communications port to the TSAS NP-1 computer.
Foggles
To reduce outside visual cues and simulate Instmment Meteorological Conditions (IMC), the TSAS demonstration pilots were required to wear "foggles." Foggles are standard Army issue aviator glasses with a semi-opaque fllm (Ryser Optik, St. Gallen, Switzerland ~0.1) applied to the upper two thirds of the glass lens. This reduced the pilot's outside visual acuity to 20/200 while maintaining inside visual acuity at 20/20. To fiirther reduce outside visual cues, the chin bubble was also covered with an opaque plastic lining to prevent the pilot from receiving visual motion cues by looking down (Figure 6).
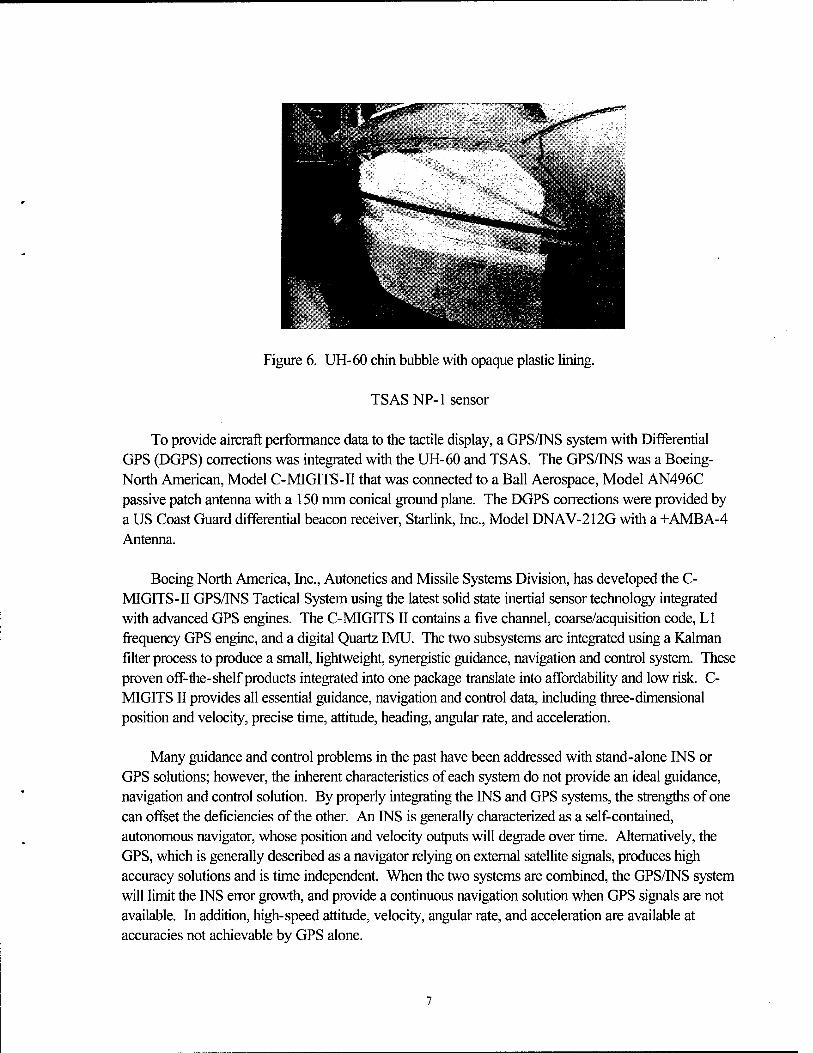
Figure 6. UH-60 chin bubble with opaque plastic lining.
TSASNP-1 sensor
To provide aircraft performance data to the tactile display, a GPS/INS system with Differential GPS (DGPS) corrections was integrated with the UH-60 and TSAS. The GPS/INS was a Boeing- North American, Model C-MIGITS-II that was connected to a Ball Aerospace, Model AN496C passive patch antenna with a 150 mm conical ground plane. The DGPS corrections were provided by a US Coast Guard differential beacon receiver, Starlink, Inc., Model DNAV-212G with a +AMBA-4 Antenna.
Boeing North America, Inc., Autonetics and Missile Systems Division, has developed the C- MIGITS-II GPS/INS Tactical System using the latest solid state inertial sensor technology integrated with advanced GPS engines. The C-MIGITS11 contains a five channel, coarse/acquisition code, LI frequency GPS engine, and a digital Quartz IMU. The two subsystems are integrated using a Kalman filter process to produce a small, lightweight, synergistic guidance, navigation and control system. These proven off-the-shelf products integrated into one package translate into affordability and low risk. C- MIGITSII provides all essential guidance, navigation and control data, including three-dimensional position and velocity, precise time, attitude, heading, angular rate, and acceleration.
Many guidance and control problems in the past have been addressed with stand-alone INS or GPS solutions; however, the inherent characteristics of each system do not provide an ideal guidance, navigation and control solution. By properly integrating the INS and GPS systems, the strengths of one can offset the deficiencies of the other. An INS is generally characterized as a self-contained, autonomous navigator, whose position and velocity outputs will degrade over time. Alternatively, the GPS, which is generally described as a navigator relying on external satellite signals, produces high accuracy solutions and is time independent. When the two systems are combined, the GPS/INS system will limit the INS error growth, and provide a continuous navigation solution when GPS signals are not available. In addition, high-speed attitude, velocity, angular rate, and acceleration are available at accuracies not achievable by GPS alone.
The DGPS receiver, Starlink DNAV-212, contains a Starlink MRB-2A differential beacon that provides the differential corrections to the C-MIGITS II. The MRB-2A provides reliable folly automatic DGPS beacon selection. The MRB-2A beacon receiver uses two channels to ensure that the automatically selected beacon is providing reliable DGPS correction data. Channel one continuously tracks the selected beacon and outputs the correction data for the C-MIGITS II. Channel two continuously scans the beacon frequency range, measuring each of the receivable beacon signals. If and when a new signal with better performance is detected, channel one will switch to it.
DGPS works by placing a high performance GPS receiver (reference station) at a known location. Since the receiver knows its exact location, it can determine the errors in the satellite signals. It does this by measuring the ranges to each satellite using the signals received and comparing these measured ranges to the actual ranges calculated from its known position. The difference between the measured and calculated range is the total error. The error data for each tracked satellite is formatted into a correction message and transmitted to GPS users. The correction message format follows the standard established by the Radio Technical Commission for Maritime Services, Special Committee 104 (RTCM-SC 104). These differential corrections are then applied to the GPS calculations, thus removing most of the satellite signal error and improving accuracy. The level of accuracy obtained for a C-MIGITS II with DGPS is 2.5 meters for position and 0.025 meter/sec for velocity.
TSASNP-1 hardware
The tactor control hardware NP-1 was developed and tested in the three months prior to the flight test. This interface relied heavily on COTS components due to the short timeline. Emphasis on individual component ruggedization and electromagnetic shielding minimized system integration time for placement in the harsh environment of a rotary-wing aircraft. The Naval Aerospace Medical Research Laboratory (NAMRL) Engineering Prototype Facility, and the USAARL Biomedical Technology Fabrication Shop developed and fabricated components of the TSAS NP-1 hardware, and Coastal Systems Station (CSS), Panama City, Florida, and University of West Florida, Institute for Human and Machine Cognition (UWF-IHMC) provided COTS component procurement support.
The TSAS controller, a Pentium-based ruggedized portable computer manufactured by Kontron Elektronik GmbH, Model IP Lite CW5, received flight information from the UH-60 AIS and the C- MIGITS via RS-232 serial ports, and custom software determined which tactors should be activated to indicate a given velocity. The software then activated the appropriate digital lines that control the tactors via a National Instruments Model PC-DIO-96 digital I/O board. These digital instmctions provide the control signals to the pneumatic control solenoid valves (Amatrix Corp., model MK 754.8XTD424.B03) via dedicated valve speed-up circuitry (Amatrix Corp., model UDB 8010). This set up allows individual solenoids to switch at up to 200 Hz. Each tactor connects to two valves, one connects to a positive pressure source, and the other connects to a negative pressure source.
The diiferential positive and negative pressure sources are created and maintained by a Medo USA, Inc., model VP06251JL, compressor/vacuum pump connected to two accumulator/manifolds (one for high pressure, one for low pressure). A manual bleed valve attached to each accumulator/manifold controlled the airflow through the accumulator, allowing pressure levels to be set at approximately ±13.8 kPa. Polyurethane tubing connects the manifolds to the solenoid valves for distribution to the individual tactors.
In addition, the NP-1 carried a Carleton Life Support Technologies, model 100C1183-1, blower that provides ventilation to the pilot via the Tactor Locator System (TLS). A 3 VDC battery-pack on the NP-1 provided backup power to the C-MIGITSII to maintain the last position in memory, therefore reducing satellite acquisition time on start-up. A 115 VAC, 60 Hz power, supply pass- through outlet on the plate powered a video camcorder for flight documentation.
TSASNP-1 software
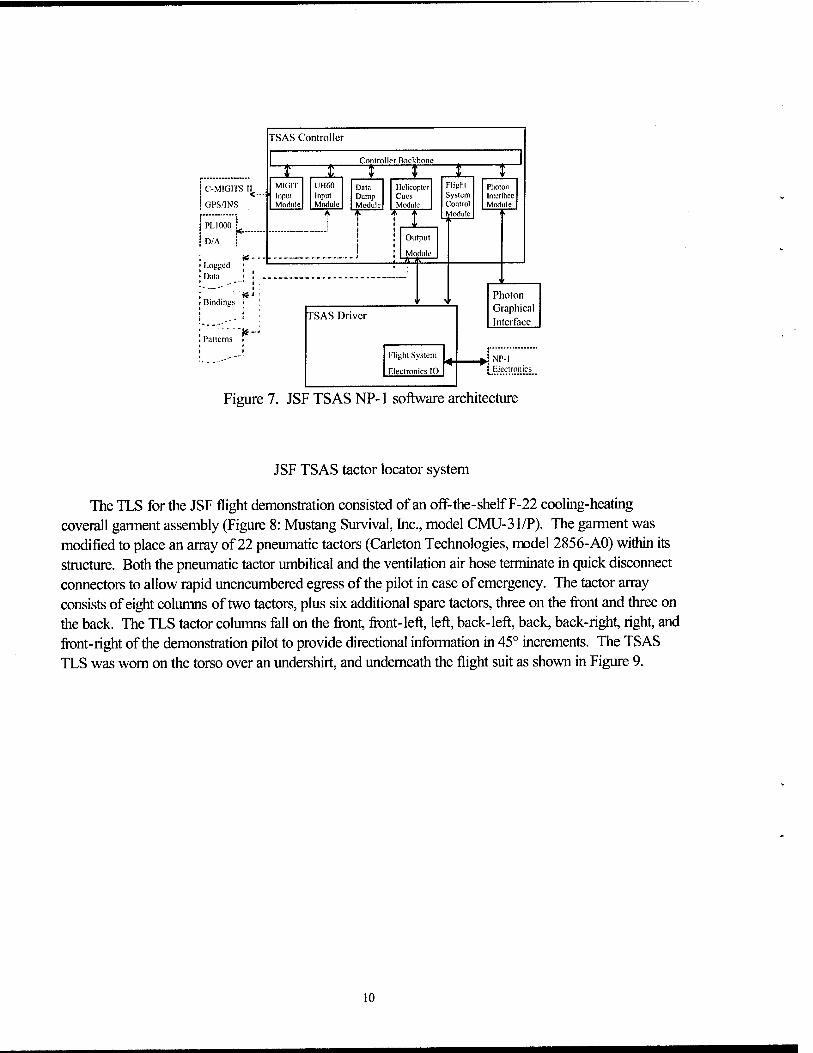
The UWF-IHMC was tasked with developing the TSAS software, and they provided the material for this section. The TSAS software was implemented in C++ on a QNX real time operating system, and may be separated into four components as shown in Figure 7. The sensor modules are responsible for providing information about the real world to the TSAS controller. The TSAS controller module feeds the input to one of many algorithms. The algorithms can be selected and controlled by the operator using a Graphical User Interface (GUI). Based upon the input, the algorithm sends commands to the TSAS driver to activate tactors. The TSAS driver executes any commands received from the TSAS controller and generates the necessary electrical signals that feed to the TSAS hardware. The TSAS driver also receives feedback information from the TSAS electronics, which is sent back to the TSAS confroller. Currentiy, this feedback information provides notification about tactor failures. The TSAS GUI module provides a graphical user interface to the test operator.
TSAS Controller
1 Controller Backbone
r I I 1 I I C-MIGITS II H M'^'''"
<""f1 Input GPS/INS II Module
UH60 Input Module
Data Dump Module
Helicopter Cues Module
Flight System Control Module
Plioton Interface Module
A h. A ^ ■
PL 1000 1 ■ ' t Output
Module
D/A 1 i
i A r Loggcd [ '■
' *
Bindings r | ^' Photon Graphical Interface
t ' TSAS Driver
Patterns i
J. Flight System
Electronics 10
JNP-1 •^ Eiectroiii_cs
Figure 7. JSF TSAS NP-1 software architecture
JSF TSAS tactor locator system
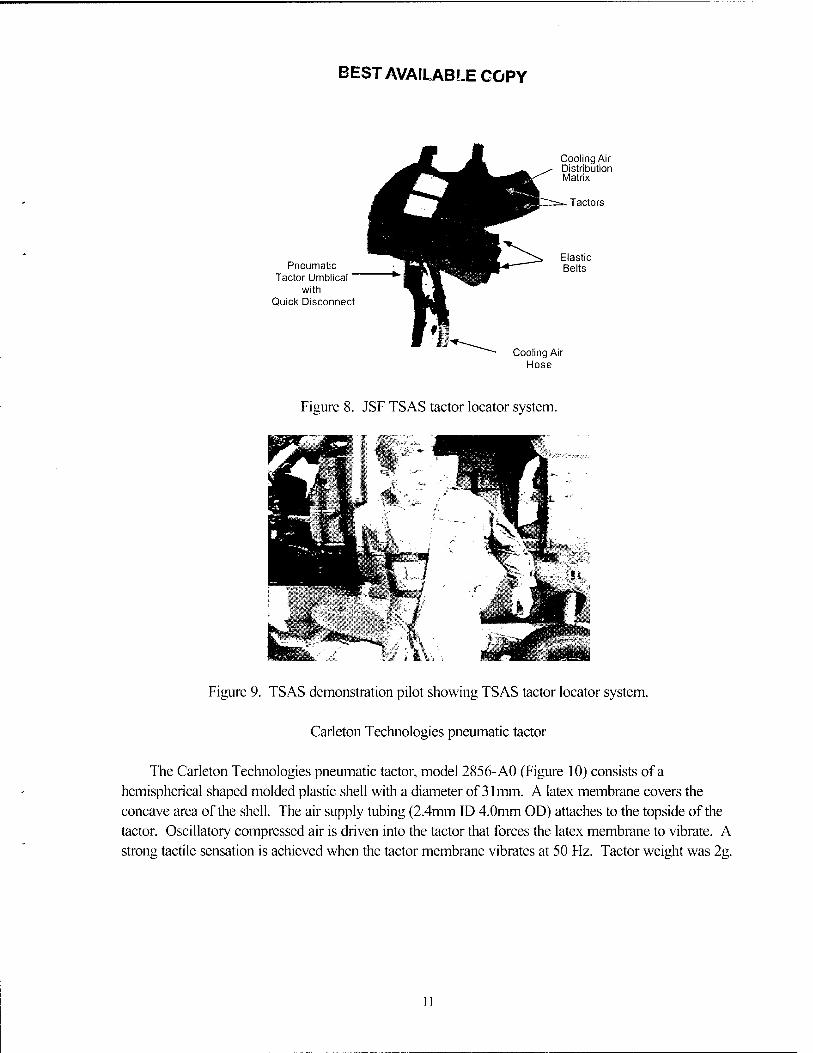
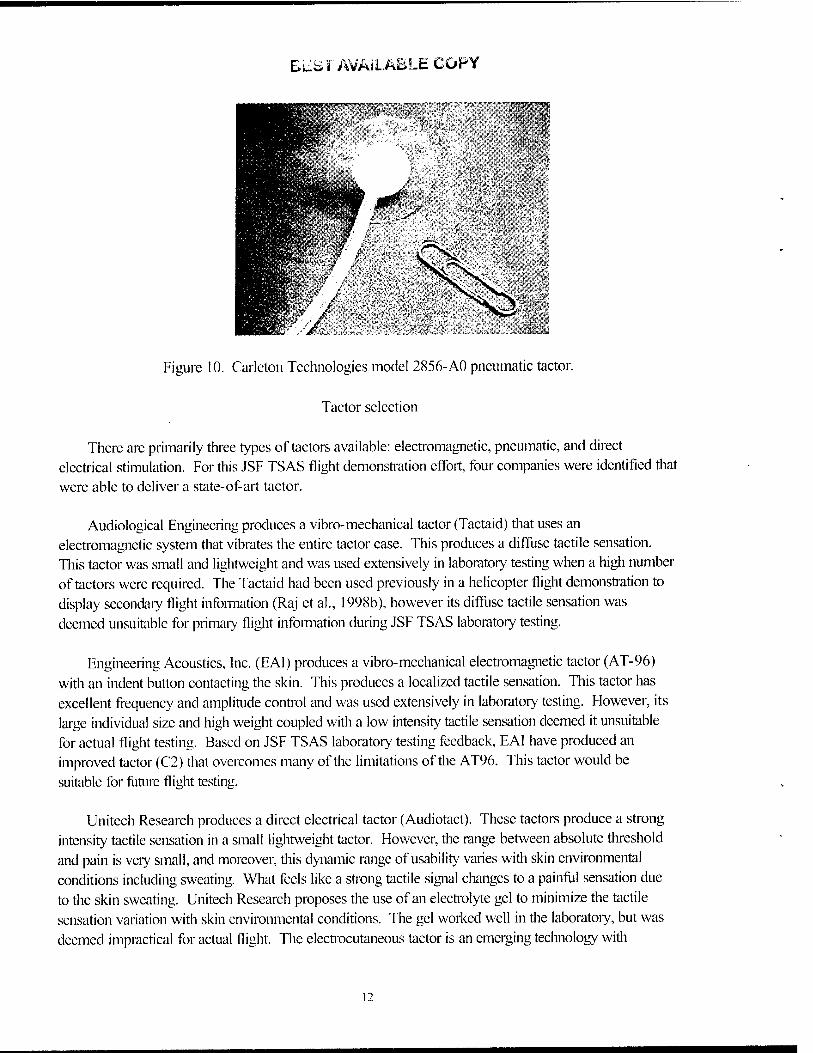
The TLS for the JSF flight demonstration consisted of an off-the-shelf F-22 cooling-heating coverall garment assembly (Figure 8: Mustang Survival, Inc., model CMU-31/P). The garment was modified to place an array of 22 pneumatic tactors (Carieton Technologies, model 2856-AO) within its stmcture. Both the pneumatic tactor umbilical and the ventilation air hose terminate in quick disconnect connectors to allow rapid unencumbered egress of the pilot in case of emergency. The tactor array consists of eight columns of two tactors, plus six additional spare tactors, three on the front and three on the back. The TLS tactor columns fall on the front, front-left, left, back-left, back, back-right, right, and fiont-right of the demonstration pilot to provide directional information in 45° increments. The TSAS TLS was worn on the torso over an undershirt, and underneath the flight suit as shown in Figure 9.
10
BEST AVAILABLE COPY
Pneumatic Tactor Umblical
with Quick Disconnect
Cooling Air Distribution Matrix
Tactors
Elastic Belts
Cooling Air Hose
Figure 8. JSF TSAS tactor locator system.
Figure 9. TSAS demonstration pilot showing TSAS tactor locator system.
Carleton Technologies pneumatic tactor
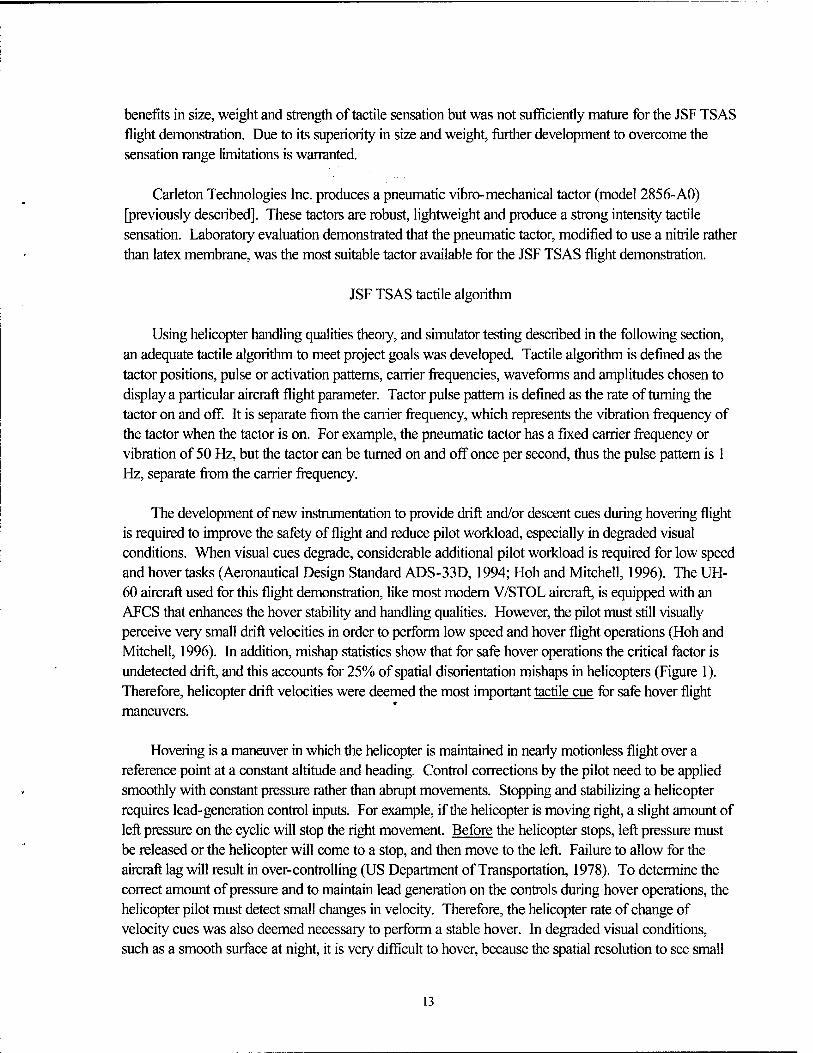
The Carleton Technologies pneumatic tactor, model 2856-AO (Figure 10) consists of a hemispherical shaped molded plastic shell with a diameter of 31mm. A latex membrane covers the concave area of the shell. The air supply tubing (2.4mm ID 4.0mm OD) attaches to the topside of the tactor. Oscillatory compressed air is driven into the tactor that forces the latex membrane to vibrate. A strong tactile sensation is achieved when the tactor membrane vibrates at 50 Hz. Tactor weight was 2g.
II
BLiST AmiLABLE COPY
Figure 10. Carleton Technologies model 2856-AO pneumatic tactor.
Tactor selection
There are primarily three types of tactors available: electromagnetic, pneumatic, and direct electrical stimulation. For this JSF TSAS flight demonstration eflFort, four companies were identified that were able to deliver a state-of-art tactor.
Audiological Engineering produces a vibro-mechanical tactor (Tactaid) that uses an electromagnetic system that vibrates the entire tactor case. This produces a diffuse tactile sensation. This tactor was small and lightweight and was used extensively in laboratory testing when a high number of tactors were required. The Tactaid had been used previously in a helicopter flight demonstration to display secondaiy flight infomiation (Raj et al., 1998b), however its diffuse tactile sensation was deemed unsuitiible for primary flight infoirnation during JSF TSAS laboratory testing.
Engineering Acoustics, Inc. (EAl) produces a vibro-mechanical electromagnetic tactor (AT-96) with an indent button contacting the skin. This produces a localized tactile sensation. This tactor has excellent frequency and amplitude control and was used extensively in laboratory testing. However, its large individual size and high weight coupled with a low intensity tactile sensation deemed it unsuitable for actual flight testing. Based on JSF TSAS laboratory testing feedback, EAI have produced an improved tactor (C2) that overcomes many of the limitations of the AT96. This tactor would be suitiible for future flight testing.
Unitech Research produces a direct electrical tactor (Audiotact). These tactors produce a strong intensity tactile sensation in a small lightweight tactor. However, the range between absolute threshold and pain is vciy small, and moreover, this dynamic range of usability varies with skin environmental conditions including sweating. What feels like a strong tactile signal changes to a painful sensation due to the skin sweating. Unitech Research proposes the use of an electrolyte gel to minimize the tactile sensation variation with skin environmental conditions. The gel worked well in the laboratory, but was deemed impractical for actual flight. The electrocutaneous tactor is an emerging technology with
12
benefits in size, weight and strength of tactile sensation but was not sufficiently mature for the JSF TSAS flight demonstration. Due to its superiority in size and weight, further development to overcome the sensation range limitations is warranted.
Carleton Technologies Inc. produces a pneumatic vibro-mechanical factor (model 2856-AO) [previously described]. These factors are robust, lightweight and produce a strong intensity tactile sensation. Laboratory evaluation demonstrated that the pneumatic tactor, modified to use a nitrile rather than latex membrane, was the most suitable tactor available for the JSF TSAS flight demonstration.
JSF TSAS tactile algorithm
Using helicopter handling qualities theory, and simulator testing described in the following section, an adequate tactile algorithm to meet project goals was developed. Tactile algorithm is defined as the tactor positions, pulse or activation patterns, carrier frequencies, waveforms and amplitudes chosen to display a particular aircraft flight parameter. Tactor pulse pattern is defined as the rate of turning the tactor on and off. It is separate from the carrier frequency, which represents the vibration frequency of the tactor when the tactor is on. For example, the pneumatic tactor has a fixed carrier frequency or vibration of 50 Hz, but the tactor can be tumed on and off once per second, thus the pulse pattem is 1 Hz, separate from the carrier frequency.
The development of new instrumentation to provide drift and/or descent cues during hovering flight is required to improve the safety of flight and reduce pilot workload, especially in degraded visual conditions. When visual cues degrade, considerable additional pilot workload is required for low speed and hover tasks (Aeronautical Design Standard ADS-33D, 1994; Hoh and Mitchell, 1996). The UH- 60 aircraft used for this flight demonstration, like most modem V/STOL aircraft, is equipped with an AFCS that enhances the hover stability and handling qualities. However, the pilot must still visually perceive very small drift velocities in order to perform low speed and hover flight operations (Hoh and Mitchell, 1996). In addition, mishap statistics show that for safe hover operations the critical factor is undetected drift, and this accounts for 25% of spatial disorientation mishaps in helicopters (Figure 1). Therefore, helicopter drift velocities were deemed the most important tactile cue for safe hover flight maneuvers.
Hovering is a maneuver in which the helicopter is maintained in neariy motionless flight over a reference point at a constant altitude and heading. Control corrections by the pilot need to be applied smoothly with constant pressure rather than abmpt movements. Stopping and stabilizing a helicopter requires lead-generation confrol inputs. For example, if the helicopter is moving right, a slight amount of left pressure on the cyclic will stop the right movement. Before the helicopter stops, left pressure must be released or the helicopter will come to a stop, and then move to the left. Failure to allow for the aircraft lag will result in over-confrolling (US Department of Transportation, 1978). To determine the correct amount of pressure and to maintain lead generation on the controls during hover operations, the helicopter pilot must detect small changes in velocity. Therefore, the helicopter rate of change of velocity cues was also deemed necessary to perform a stable hover. In degraded visual conditions, such as a smooth surface at night, it is very difficult to hover, because the spatial resolution to see small
13
changes in velocity is not available, and even the best pilots over-control and get into pilot induced oscillations.
As described earlier, the pneumatic tactor was selected due to its lightweight and strong tactile sensation. The pneumatic tactor activation was fixed at the amplitude and carrier frequency (±13.8 kPa square wave at 50 Hz) to provide the strongest tactile sensation. The fixed tactor amplitude, waveform and frequency allowed only tactor position and pulse pattern as the tactor stimulus variables that could be used to display aircraft flight parameters.
To display the horizontal velocity vector using a tactile instrument, the components of the velocity were separated, and then displayed using the available different tactile qualities. Tactor location was used to indicate helicopter velocity direction, and tactor activation pulse pattem was used to indicate velocity vector magnitude.
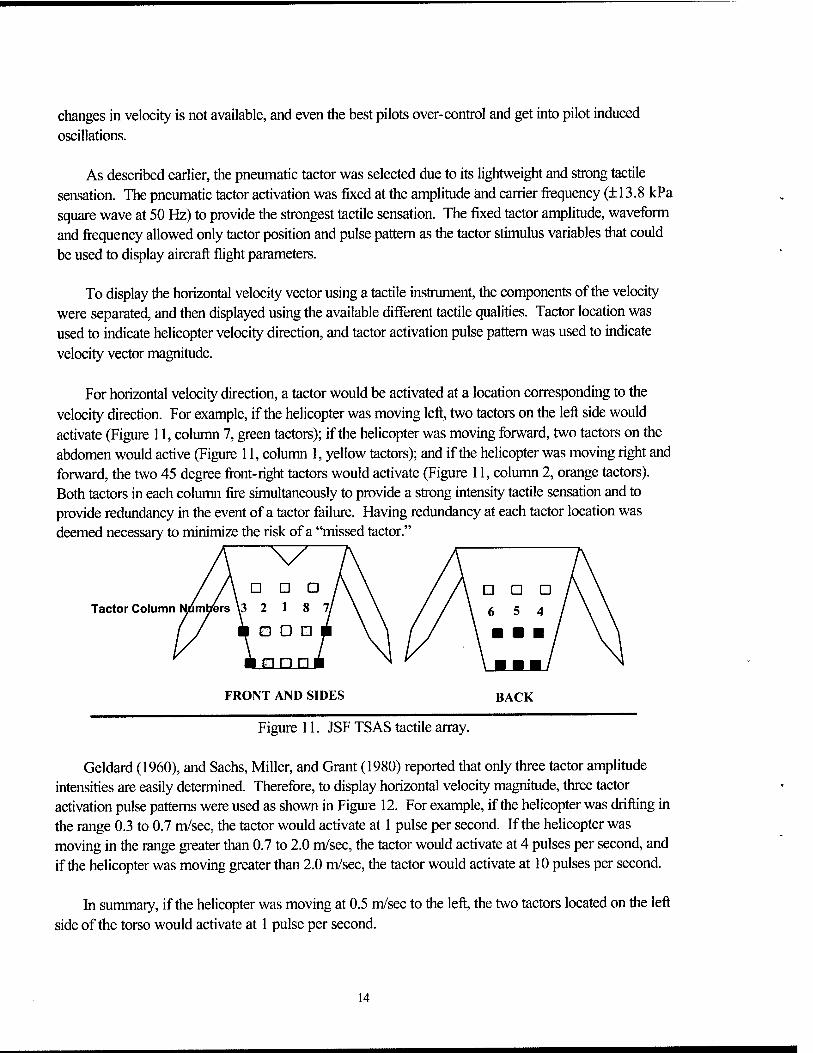
For horizontal velocity direction, a tactor would be activated at a location corresponding to the velocity direction. For example, if the helicopter was moving left, two tactors on the left side would activate (Figure 11, column 7, green tactors); if the helicopter was moving forward, two tactors on the abdomen would active (Figure 11, column 1, yellow tactors); and if the helicopter was moving right and forward, the two 45 degree fiiont-right tactors would activate (Figure 11, column 2, orange tactors). Both tactors in each column fire simultaneously to provide a strong intensity tactile sensation and to provide redundancy in the event of a tactor failure. Having redundancy at each tactor location was deemed necessary to minimize the risk of a "missed tactor."
Tactor Column
D D a im^jfers \3 2 1 8 7j
E3 O □
El n n
FRONT AND SIDES BACK
Figure 11. JSF TSAS tactile array.
Geldard (1960), and Sachs, Miller, and Grant (1980) reported that only three tactor amplitude intensities are easily determined. Therefore, to display horizontal velocity magnitude, three tactor activation pulse patterns were used as shown in Figure 12. For example, if the helicopter was drifting in the range 0.3 to 0.7 m/sec, the tactor would activate at 1 pulse per second. If the helicopter was moving in the range greater than 0.7 to 2.0 m/sec, the tactor would activate at 4 pulses per second, and if the helicopter was moving greater than 2.0 m/sec, the tactor would activate at 10 pulses per second.
In summary, if the helicopter was moving at 0.5 m/sec to the left, the two tactors located on the left side of the torso would activate at 1 pulse per second.
14
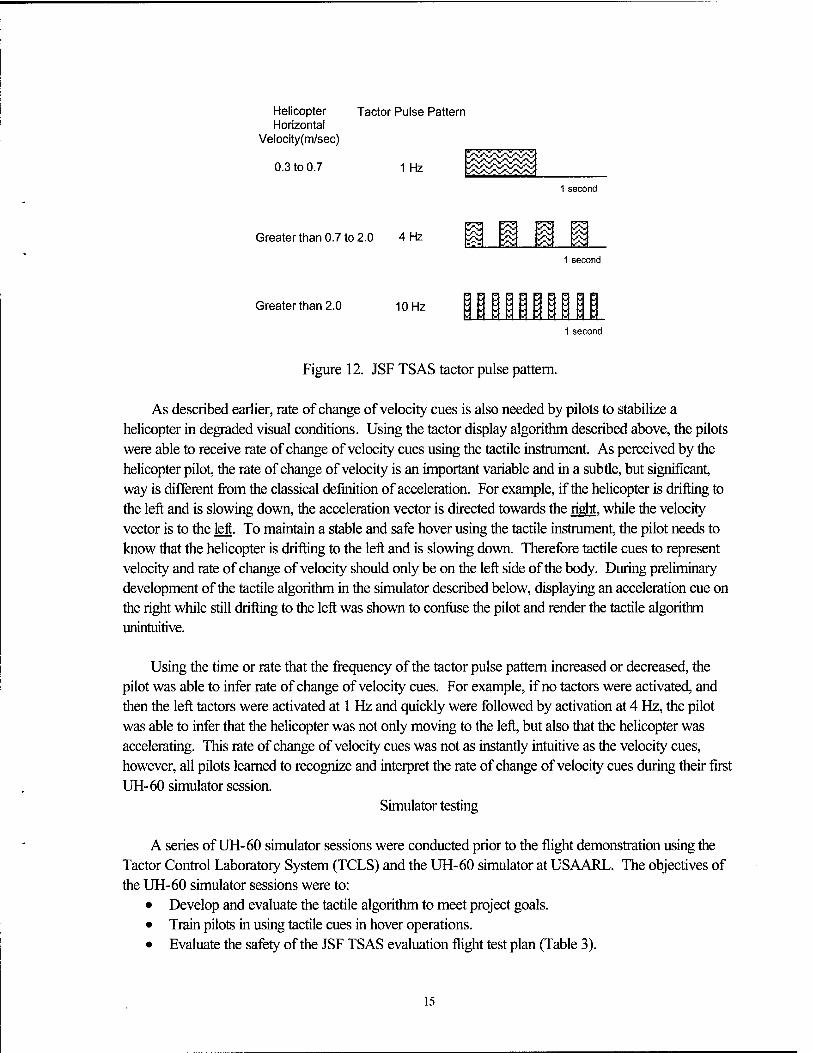
Helicopter Horizontal
Velocity(m/sec)
0.3 to 0.7
Tactor Pulse Pattern
1 Hz
1 second
Greater than 0.7 to 2.0 4 Hz
Greater than 2.0 10 Hz
1 second
y y - ij ^ ^ j ^ ^ y y
1 second
Figure 12. JSF TSAS tactor pulse pattern.
As described earlier, rate of change of velocity cues is also needed by pilots to stabilize a helicopter in degraded visual conditions. Using the tactor display algorithm described above, the pilots were able to receive rate of change of velocity cues using the tactile instrument. As perceived by the helicopter pilot, the rate of change of velocity is an important variable and in a subtle, but significant, way is different fi-om the classical definition of acceleration. For example, if the helicopter is drifting to the left and is slowing down, the acceleration vector is directed towards the right, while the velocity vector is to the left. To maintain a stable and safe hover using the tactile instmment, the pilot needs to know that the helicopter is drifting to the left and is slowing down. Therefore tactile cues to represent velocity and rate of change of velocity should only be on the left side of the body. During preliminary development of the tactile algorithm in the simulator described below, displaying an acceleration cue on the right while still drifting to the left was shown to confiise the pilot and render the tactile algorithm unintuitive.
Using the time or rate that the frequency of the tactor pulse pattern increased or decreased, the pilot was able to infer rate of change of velocity cues. For example, if no tactors were activated, and then the left tactors were activated at 1 Hz and quickly were followed by activation at 4 Hz, the pilot was able to infer that the helicopter was not only moving to the left, but also that the helicopter was accelerating. This rate of change of velocity cues was not as instantly intuitive as the velocity cues, however, all pilots learned to recognize and interpret the rate of change of velocity cues during their first UH-60 simulator session.
Simulator testing
A series of UH-60 simulator sessions were conducted prior to the flight demonstration using the Tactor Control Laboratory System (TCLS) and the UH-60 simulator at USAARL. The objectives of the UH-60 simulator sessions were to:
• Develop and evaluate the tactile algorithm to meet project goals. • Train pilots in using tactile cues in hover operations. • Evaluate the safety of the JSF TSAS evaluation flight test plan (Table 3).
15
During each lJH-60 simulator session, each pilot was asked to make quantitative comments related to the simulator session goals of algorithm development and flight test plan evaluation. Due to time and funding limitations set by the sponsor, Joint Strike Fighter, the simulator sessions were not intended to be a scientific optimization of tactile displays, but a prototyping tool to achieve the goal of a successful fligjit demonstration. Therefore, no quantitative flight performance data were recorded from these simulator sessions.
Tactor control laboratory system
The CSS was tasked to build a system capable of evaluating an exceptionally wide range of tactile stimulation devices and scenarios. It was designed for use solely in the laboratory environment of NAMRL and USAARL with maximum flexibility, minimal development time and cost, and the ability to support a variety of tactor types. CSS provided material for this section.
Functional requirements were: An 80 tactor drive capability. Six independent waveforms available. All factors individually driven. A 30 V-30 A max drive requirement. Local control with remote control via Ethernet interface. Allow future capability for diagnostic testing. Support real-time operating conditions.
The TCLS was designed to simulate potential operational scenarios in a laboratory environment and allow extensive experimentation with a broad range of stimulus characteristics and patterns. There exist a large number of conceptual approaches to tactile stimulation in aerospace conditions, and these approaches have not been exhaustively evaluated for suitability or merit. The TCLS was intended to be a laboratory tool that would allow evaluation of conceptual approaches to tactile displays and guide the development of TSAS implementations. Specifically, the TCLS would evaluate the most appropriate characteristics of the excitation waveform, such as wave shape (sine, square, triangle, etc.), amplitude, frequency, pulse pattern, and how the individual tactor excitations may be used in concert with other factors to best convey the desired information. Consequently, the primary functions of the TCLS are to:
• Provide a powerful computer to interface with various sensor systems, process sensor input, and execute patterns of tactor excitation.
• Respond to sensor input and change tactor excitation pattems in real time. • Allow dynamic variation of the excitation waveforms used for each tactor. • Provide a means of visually verifying the excitation waveforms currently being used.
The TCLS is controlled by a Pentium-based computer that is equipped with multiple special- purpose signal processing Metrabyte boards (Keithley Instmments, Cleveland, OH), including three waveform generators, two digital I/O cards generators, and an analog-to-digital converter generator. The computer/controller first initializes the six available waveforms and defines the pattems of tactor excitation that will be used during the session. It then collects sensor input, analyses the data.
16
determines which, if any, tactor excitation pattern is required, and sends the necessary information to the custom portion of the system. The custom components use a Versa Module Europa (VME) computer backplane to link various analog and digital circuitry necessary to energize individual tactors on cue.
On the MetrabyteATVIE interface board, the control information is converted from the unique cabling used by the Metrabyte cards to standard cabling more readily accessible to the VME components. The control information is then passed to the logic boards, where the information is decoded to select specific waveforms and energize the tactor. Next, the driver boards amplify the signals and supply enough current to drive the tactors at optimal power levels. These amplified signals are routed through the remapping panel and the VME/TLS interface board. The high power signals leave the lab system via connectors on the front door of the rack, and traverse an iimbilical cable to the TLS, where individual tactors fire according to the predetermined patterns.
Each logic/driver pair controls up to 16 tactors. The five pairs allow a maximum capability of 5x16=80 tactors, typically arranged with 64 tactors in an 8x8 matrix on the torso, and up to 16 auxiliary tactors located, as required, elsewhere. The output of each logic/driver pair corresponds to two rows of tactors. The TLS, on the other hand, is designed and assembled in columns, for increased reliability and ease of use. The remapping board and the associated VME/TLS interface board provide the transformation between rows and columns, such that individual rows may be included or excluded at will. This allows the system to independently drive two 40 tactor TLSs simultaneously (sharing the same 6 waveforms), for even more flexibility in research. The system most readily supports tactors with a 30V-peak drive requirement but may be used to simulate the electrical interface of other tactor types, such as pneumatic tactors. Furthermore, two basic driver types are currently available through plug-in modules on the driver boards' Field Effect Transistor (FET) (unipolar): drivers for typical battery- powered tactors that operator unidirectional, and op amp (bipolar) drivers for powered tactors that operate bidirectionally about a neutral postion. The system was designed for ease of use and maximum versatility and can readily incorporate alternative tactor types with minimal impact to the basic design.
The TCLS components were installed in a 19-inch rack on wheels. The primary components consist of the following:
Off-the-shelf hardware - Computer/controller Industrial rack-mount PC Pentium 200 MHz processor SVGA video card Metrabyte arbitrary waveform generator, dual outputs [3 each for a total of 6 waveforms] Metrabyte digital I/O, 96 output [2 each for a total of 192 outputs] Metrabyte analog to digital converter, 64 inputs Rack-mount 17" monitor Keyboard & mouse Switching power supplies, 1KW, constant current/voltage [2 each] UPS, 1400 VA, rack mount
17
• Oscilloscopes, dual channel [3 each for a total of 6 displayed channels] • VME chassis with logic power supply
Custom hardware developed - • Tactor decoders, signal selectors and drivers • Logic boards, for decoding and signal selection [5 each] • Driver boards, for signal amplification and drive current [5 each] • PET plug-in modules [80 each] • Op Amp plug-in modules [80 each] • Metrabyte/TLS interface board • VME/TLS interface board and remapping panel
Flight simulator
The UH-60 flight simulator is a six-degree-of-freedom motion-based device designed for training aviators in the use of the UH-60 Black Hawk helicopter. The device consists of a simulator compartment containing a cockpit with pilot and copilot stations, instructor operator (10) station and an observer station. The simulator is equipped with a visual system that simulates natural environment surroundings. A central computer system controls the operation of the simulator complex. The simulator is used to provide training in aircraft control, cockpit preflight procedures, instmment flight operations, visual flight operations, sling load operations, external stores subsystems, night vision goggles training, and nap-of-the-earth-flight.
The simulator compartment houses the cockpit and 10 station. Within the cockpit are all the controls, indicators, and panels located in the aircraft. Controls that are not fiinctional are physically present to preserve the appearance of a realistic configuration. Loudspeakers are located in the simulator compartment to simulate audio cues. Each of the pilot's seats is vibrated individually to simulate both continuous and periodic oscillations and vibrations experienced by the crew during normal and emergency flight conditions and maneuvers. However, these vibrations are isolated fi-om the 10 and observer stations.
The simulator compartment is mounted on a 150 cm six degree-of-fi-eedom motion system consisting of a moving platform assembly driven and supported fi-om below by six identical hydraulic actuators. The motion system provides combinations of pitch, roll, yaw, lateral, longitudinal, and vertical movement. Motion of the simulator compartment can be controlled to simulate motion due to pilot inputs as well as those resulting fi-om rotor operation, turbulence, and changes in aircraft centre-of- gravity, as well as emergency conditions and system malfijnctions. All motions, except pitch, are washed out to the neutral position after the computed acceleration has reached zero. Pitch attitude is maintained as necessary to simulate sustained longitudinal acceleration cues. Motion can be frozen at any instant and the simulator has the ability to be programmed into a crash override mode where motion can continue despite impact with the ground or other obstacles.
18
The pilot and copilot stations are provided with forward, left, and right side window displays. The visual generation system consists of two separate fiinctional areas. The first is the visual display system that presents the wide-angle-collimating video image to the crew. The digital image generator system is a foil-colour visual display that provides imagery for day, night, and dusk scenes, as well as replicating the eflFects of the searchlight/landing light on the visual displays.
The computer system consists of a central processing unit and five auxiliary processing units. Visual displays are controlled by digital image generator inputs that are modified by inputs fi-om other units such as the simulator navigation/communication identification subsystem, instmctional subsystem, and air vehicle subsystems. The navigation and communication identification subsystem provides position data for the aircraft that the simulator is replicating. The instmctional subsystem forwards information that detail the visual environment, scene lighting, and target paths through tiie database, target statias, and landing light status. The air vehicle subsystem sends information relevant to the aircraft position rates, altitude, and attitude. All of these inputs are stored in the shared memory of the main simulator control computer.
Simulator results
In the two weeks prior to the flight demonstrations, five pilots participated in 16 simulator sessions (Table 1). Four of these pilots subsequentiy flew the actual flight demonstrations. As shown in Table 1, the first simulator session for each pilot was used to learn how to use the tactile cues to fly the aircraft and evaluate the JSF TSAS flight test plan. Subsequent flights were used to develop and evaluate the tactile algorithm and provide fiirther training using tactile cues.
19
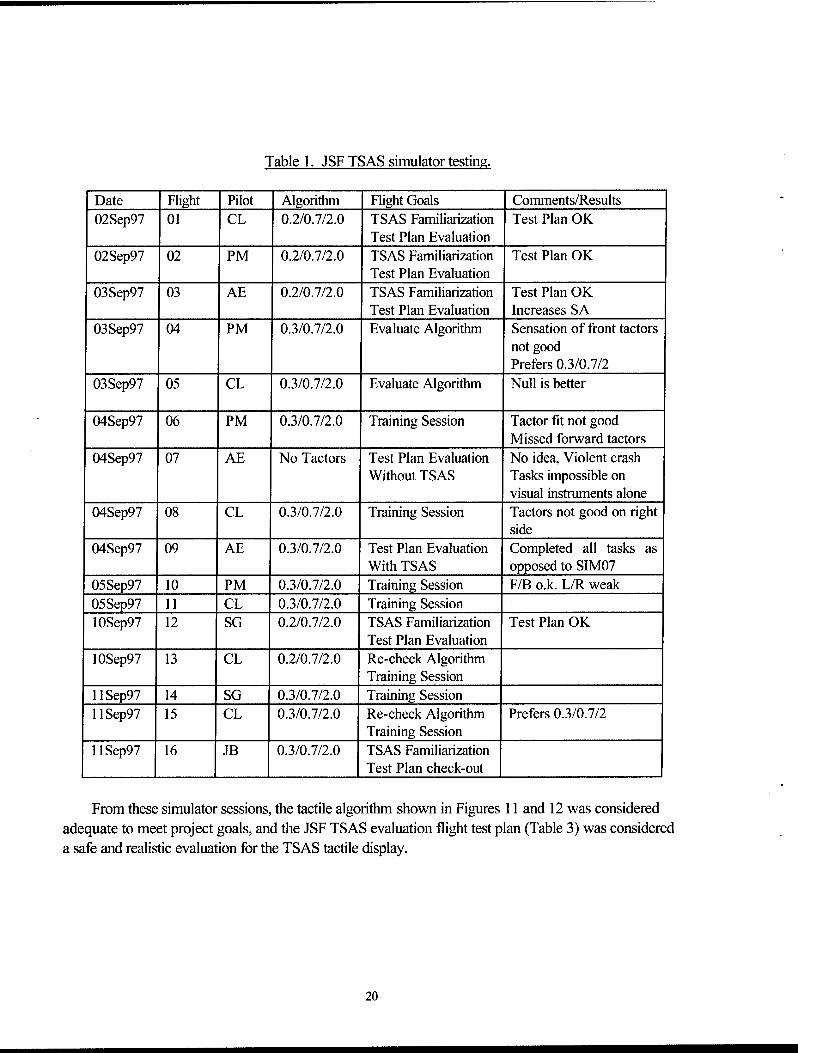
Table 1. JSF TSAS simulator testing.
Date Flight Pilot Algorithm Flight Goals Comments/Results 02Sep97 01 CL 0.2/0.7/2.0 TSAS Familiarization
Test Plan Evaluation Test Plan OK
02Sep97 02 PM 0.2/0.7/2.0 TSAS Familiarization Test Plan Evaluation
Test Plan OK
03Sep97 03 AE 0.2/0.7/2.0 TSAS Familiarization Test Plan Evaluation
Test Plan OK Increases SA
03Sep97 04 PM 0.3/0.7/2.0 Evaluate Algorithm Sensation of front tactors not good Prefers 0.3/0.7/2
03Sep97 05 CL 0.3/0.7/2.0 Evaluate Algorithm Null is better
04Sep97 06 PM 0.3/0.7/2.0 Training Session Tactor fit not good Missed forward tactors
04Sep97 07 AE No Tactors Test Plan Evaluation Without TSAS
No idea, Violent crash Tasks impossible on visual instruments alone
04Sep97 08 CL 0.3/0.7/2.0 Training Session Tactors not good on right side
04Sep97 09 AE 0.3/0.7/2.0 Test Plan Evaluation With TSAS
Completed all tasks as opposed to SIM07
05Sep97 10 PM 0.3/0.7/2.0 Training Session F/B o.k. L/R weak 05Sep97 11 CL 0.3/0.7/2.0 Training Session 10Sep97 12 SG 0.2/0.7/2.0 TSAS Familiarization
Test Plan Evaluation Test Plan OK
10Sep97 13 CL 0.2/0.7/2.0 Re-check Algorithm Training Session
llSep97 14 SG 0.3/0.7/2.0 Training Session llSep97 15 CL 0.3/0.7/2.0 Re-check Algorithm
Training Session Prefers 0.3/0.7/2
llSep97 16 JB 0.3/0.7/2.0 TSAS Familiarization Test Plan check-out
From these simulator sessions, the tactile algorithm shown in Figures 11 and 12 was considered adequate to meet project goals, and the JSF TSAS evaluation flight test plan (Table 3) was considered a safe and realistic evaluation for the TSAS tactile display.
20
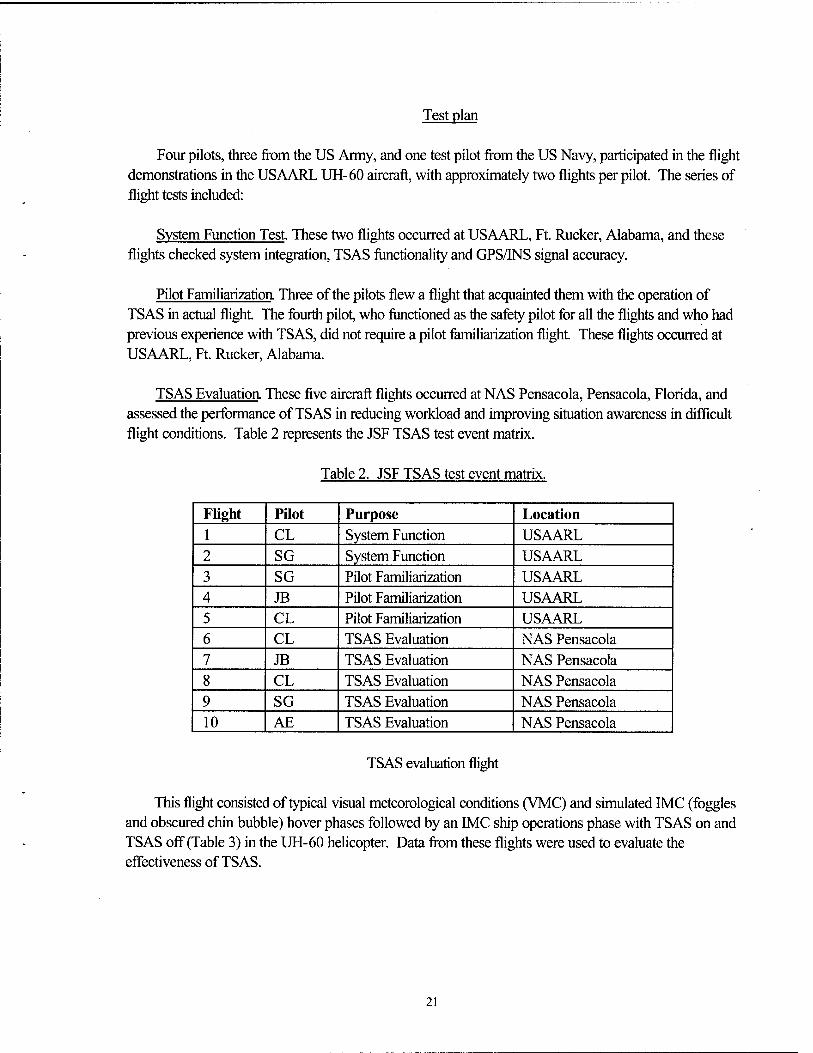
Test plan
Four pilots, three from the US Army, and one test pilot from the US Navy, participated in the flight demonstrations in the USAARL UH-60 aircraft, with approximately two flights per pilot. The series of flight tests included:
System Function Test. These two flights occurred at USAARL, Ft. Rucker, Alabama, and these flights checked system integration, TSAS functionality and GPS/INS signal accuracy.
Pilot Familiarization Three of the pilots flew a flight that acquainted them with the operation of TSAS in actual flight. The fourth pilot, who fiinctioned as the safety pilot for all the flights and who had previous experience with TSAS, did not require a pilot familiarization flight. These flights occurred at USAARL, Ft. Rucker, Alabama.
TSAS Evaluation These flve aircraft flights occurred at NAS Pensacola, Pensacola, Florida, and assessed the performance of TSAS in reducing workload and improving situation awareness in difficult flight conditions. Table 2 represents the JSF TSAS test event matrix.
Table 2. JSF TSAS test event matrix.
FUght PUot Purpose Location 1 CL System Function USAARL 2 SG System Function USAARL 3 SG Pilot Familiarization USAARL 4 JB Pilot Familiarization USAARL 5 CL Pilot Familiarization USAARL 6 CL TSAS Evaluation NAS Pensacola 7 JB TSAS Evaluation NAS Pensacola 8 CL TSAS Evaluation NAS Pensacola 9 SG TSAS Evaluation NAS Pensacola 10 AE TSAS Evaluation NAS Pensacola
TSAS evaluation flight
This flight consisted of typical visual meteorological conditions (VMC) and simulated IMC (foggles and obscured chin bubble) hover phases followed by an IMC ship operations phase with TSAS on and TSAS off (Table 3) in the UH-60 helicopter. Data from these flights were used to evaluate the effectiveness of TSAS.
21
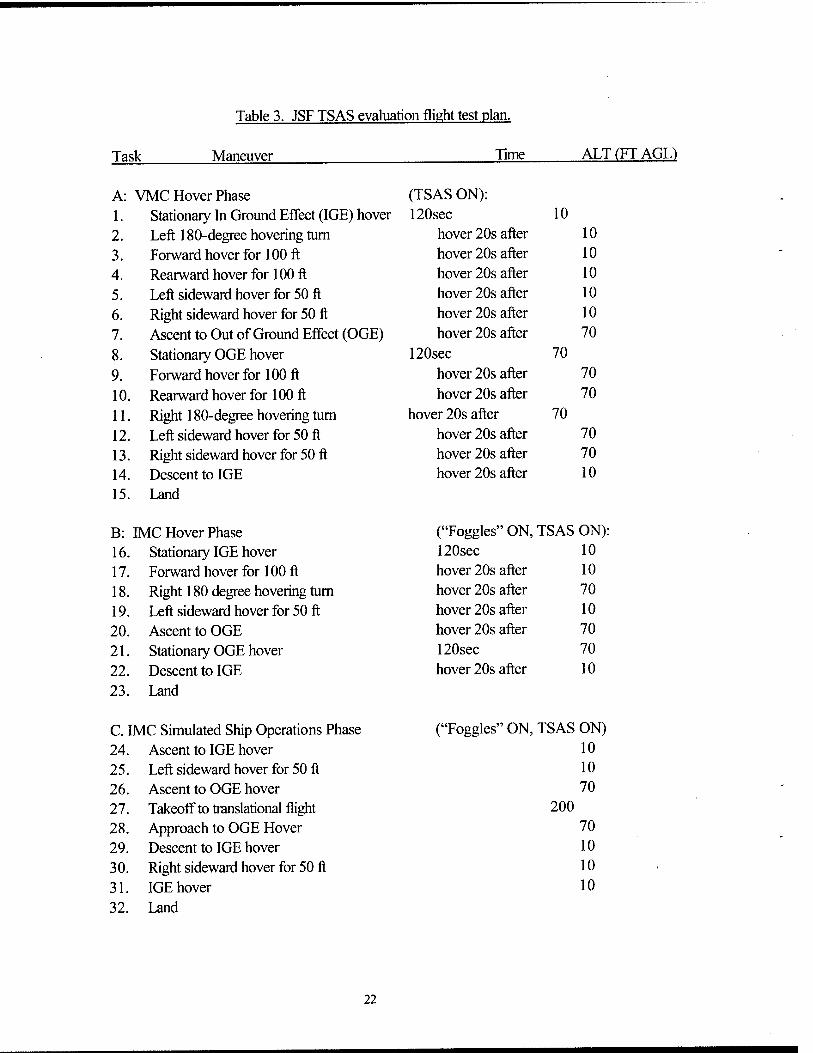
Table 3. JSF TSAS evaluation flight test plan
Task Maneuver Time ALT(FTAGL)
A: VMC Hover Phase (TSAS ON): 1. Stationary In Ground Efiect (IGE) hover 120sec 10 2. Left 180-degree hovering turn hover 20s after 10
3. Forward hover for 100 ft hover 20s after 10
4. Rearward hover for 100 ft hover 20s after 10
5. Left sideward hover for 50 ft hover 20s after 10
6. Right sideward hover for 50 ft hover 20s after 10
7. Ascent to Out of Ground Effect (OGE) hover 20s after 70
8. Stationary OGE hover 120sec 70
9. Forward hover for 100 ft hover 20s after 70
10. Rearward hover for 100 ft hover 20s after 70
11. Right 180-degree hovering turn hover 20s after 70 12. Left sideward hover for 50 ft hover 20s after 70 13. Right sideward hover for 50 ft hover 20s after 70 14. Descent to IGE hover 20s after 10 15. T^nd
B: IMC Hover Phase ('Toggles" ON, TSAS ON): 16. Stationary IGE hover 120sec 10
17. Forward hover for 100 ft hover 20s after 10
18. Right 180 degree hovering turn hover 20s after 70
19. Left sideward hover for 50 ft hover 20s after 10
20. Ascent to OGE hover 20s after 70
21. Stationary OGE hover 120sec 70 22. Descent to IGE hover 20s after 10
23. Land
C. IMC Simulated Ship Operations Phase ('Toggles" ON, TSAS ON) 24. Ascent to IGE hover 10 25. Left sideward hover for 50 ft 10 26. Ascent to OGE hover 70 27. Takeoff to translational flight 2O0 1
28. Approach to OGE Hover 70 29. Descent to IGE hover 10
30. Right sideward hover for 50 ft 10
31. IGE hover 10
32. Land
22
D. IMC Simulated Ship Operations Phase 33. Ascent to IGE hover 34. Left sideward hover for 50 ft 35. Ascent to OGE hover 3 6. Takeoff to translational flight 37. Approach to OGE Hover 3 8. Descent to IGE hover 39. Right sideward hover for 50 ft 40. IGE hover
41.
('Toggles" ON, TSAS OFF)
10
10
70
200
70
10
10
10
Land NOTE: Safety pilot flew traffic pattern to arrive on final leg in OGE hover.
Human factors metrics
Situation awareness
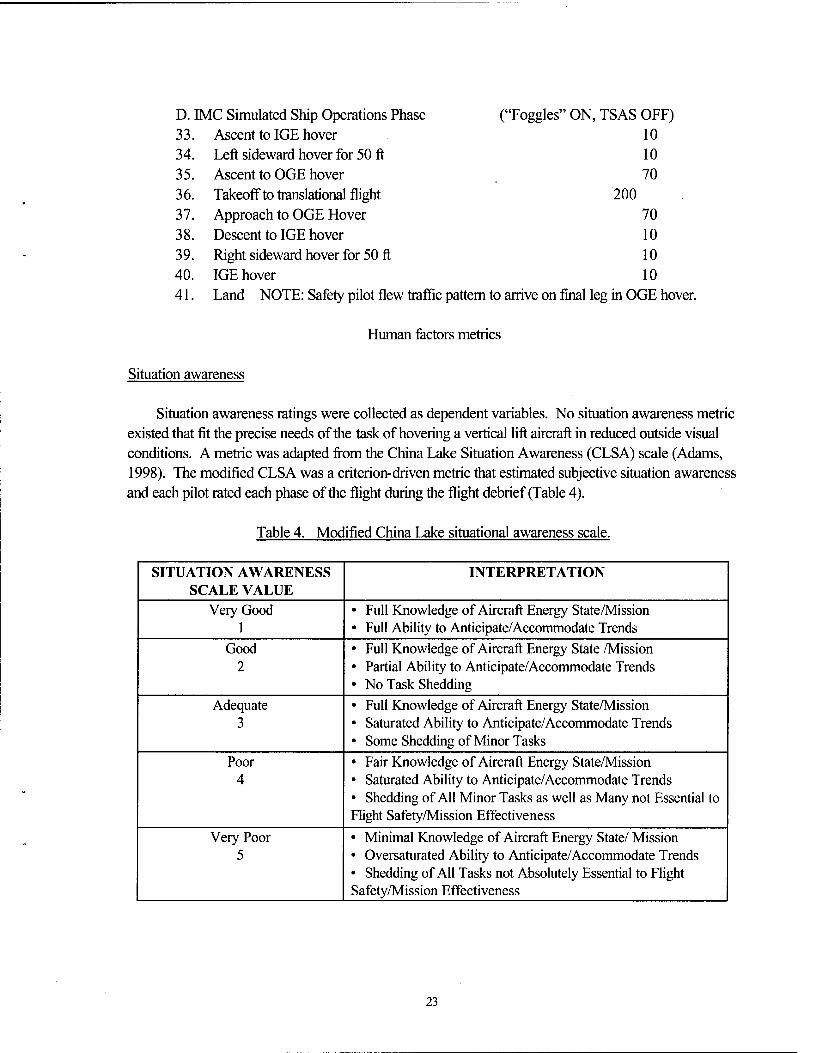
Situation awareness ratings were collected as dependent variables. No situation awareness metric existed that fit the precise needs of the task of hovering a vertical lift aircraft in reduced outside visual conditions. A metric was adapted from the China Lake Situation Awareness (CLSA) scale (Adams, 1998). The modified CLSA was a criterion-driven metric that estimated subjective situation awareness and each pilot rated each phase of the flight during the flight debrief (Table 4).
Table 4. Modified China Lake situational awareness scale.
SITUATION AWARENESS SCALE VALUE
INTERPRETATION
Very Good 1
• Full Knowledge of Aircraft Energy State/Mission • Full Ability to Anticipate/Accommodate Trends
Good 2
• Full Knowledge of Aircraft Energy State /Mission • Partial Ability to Anticipate/Accommodate Trends • No Task Shedding
Adequate 3
• Full Knowledge of Aircraft Energy State/Mission • Saturated Ability to Anticipate/Accommodate Trends • Some Shedding of Minor Tasks
Poor 4
• Fair Knowledge of Aircraft Energy State/Mission • Saturated Ability to Anticipate/Accommodate Trends • Shedding of All Minor Tasks as well as Many not Essential to Flight Safety/Mission Effectiveness
Very Poor 5
• Minimal Knowledge of Aircraft Energy State/ Mission • Oversaturated Ability to Anticipate/Accommodate Trends • Shedding of All Tasks not Absolutely Essential to Flight Safety/Mission Effectiveness
23
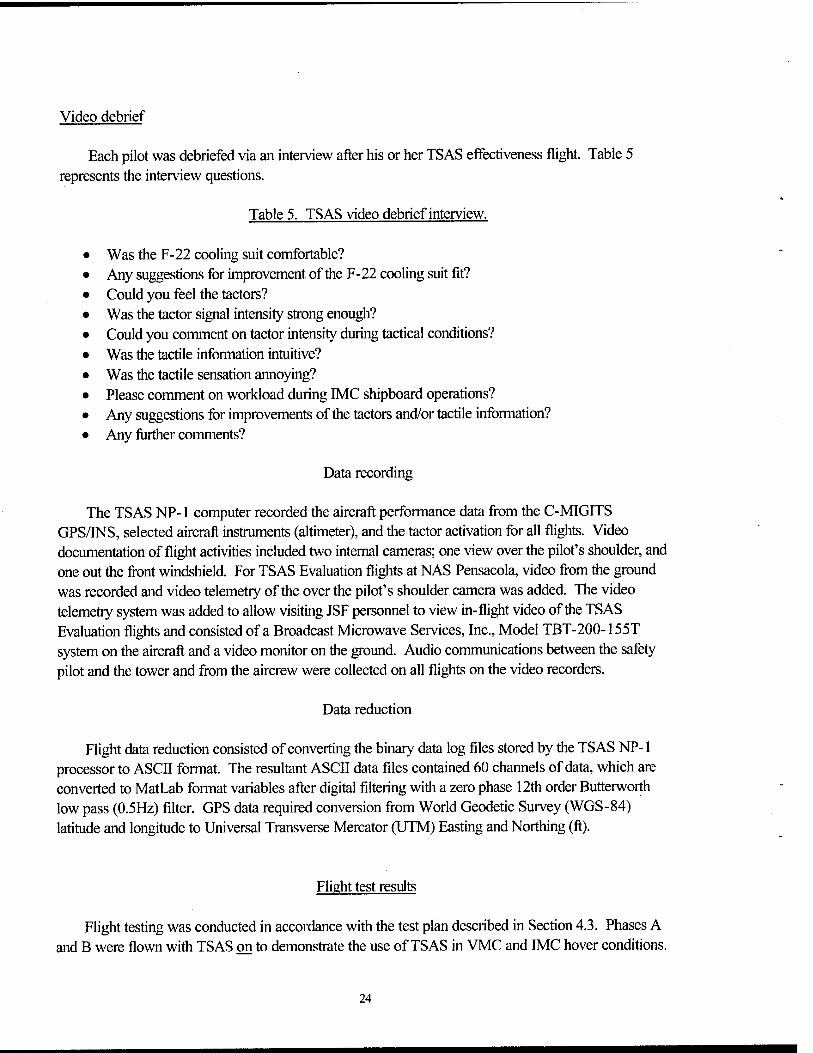
Video debrief
Each pilot was debriefed via an interview after his or her TSAS effectiveness flight. Table 5 represents the interview questions.
Table 5. TSAS video debrief interview.
Was the F-22 cooling suit comfortable? Any suggestions for improvement of the F-22 cooling suit fit? Could you feel the tactors? Was the tactor signal intensity strong enough? Could you comment on tactor intensity during tactical conditions? Was the tactile information intuitive? Was the tactile sensation annoying? Please comment on workload during IMC shipboard operations? Any suggestions for improvements of the tactors and/or tactile information? Any further comments?
Data recording
The TSAS NP-1 computer recorded the aircraft performance data from the C-MIGITS GPS/INS, selected aircraft instruments (altimeter), and the tactor activation for all flights. Video documentation of flight activities included two internal cameras; one view over the pilot's shoulder, and one out the fi-ont windshield. For TSAS Evaluation flights at NAS Pensacola, video fi-om the ground was recorded and video telemetry of the over the pilot's shoulder camera was added. The video telemetry system was added to allow visiting JSF personnel to view in-flight video of the TSAS Evaluation flights and consisted of a Broadcast Microwave Services, Inc., Model TBT-200-155T system on the aircraft and a video monitor on the ground. Audio communications between the safety pilot and the tower and from the aircrew were collected on all flights on the video recorders.
Data reduction
Flight data reduction consisted of converting the binary data log files stored by the TSAS NP-1 processor to ASCII format. The resultant ASCII data files contained 60 channels of data, which are converted to MatLab format variables after digital filtering with a zero phase 12th order Butterworth low pass (0.5Hz) filter. GPS data required conversion from Worid Geodetic Survey (WGS-84) latitude and longitude to Universal Transverse Mercator (UTM) Easting and Northing (ft).
Flight test results
Flight testing was conducted in accordance with the test plan described in Section 4.3. Phases A and B were flown with TSAS on to demonstrate the use of TSAS in VMC and IMC hover conditions.
24
Phases C and D were simulated shipboard landings flown with TSAS on and off respectively, to evaluate the effectiveness of TSAS. Three of the four pilots flew similar flight events to enable comparison of results. For TSAS Evaluation flight FP5, the pilot did not perform phase B, IMC hover phase, and phase D, TSAS off IMC shipboard operations due to time constraints. However, the FP5 test pilot did perform the TSAS on IMC shipboard operations (Phase C). Due to the incomplete data set for FP5, the situation awareness pilot ratings and flight data from FP5 are not included in the analysis, however workload and subjective comments are included. Flight 3 (FP3) was the official JSF TSAS flight demonstration for invited guests.
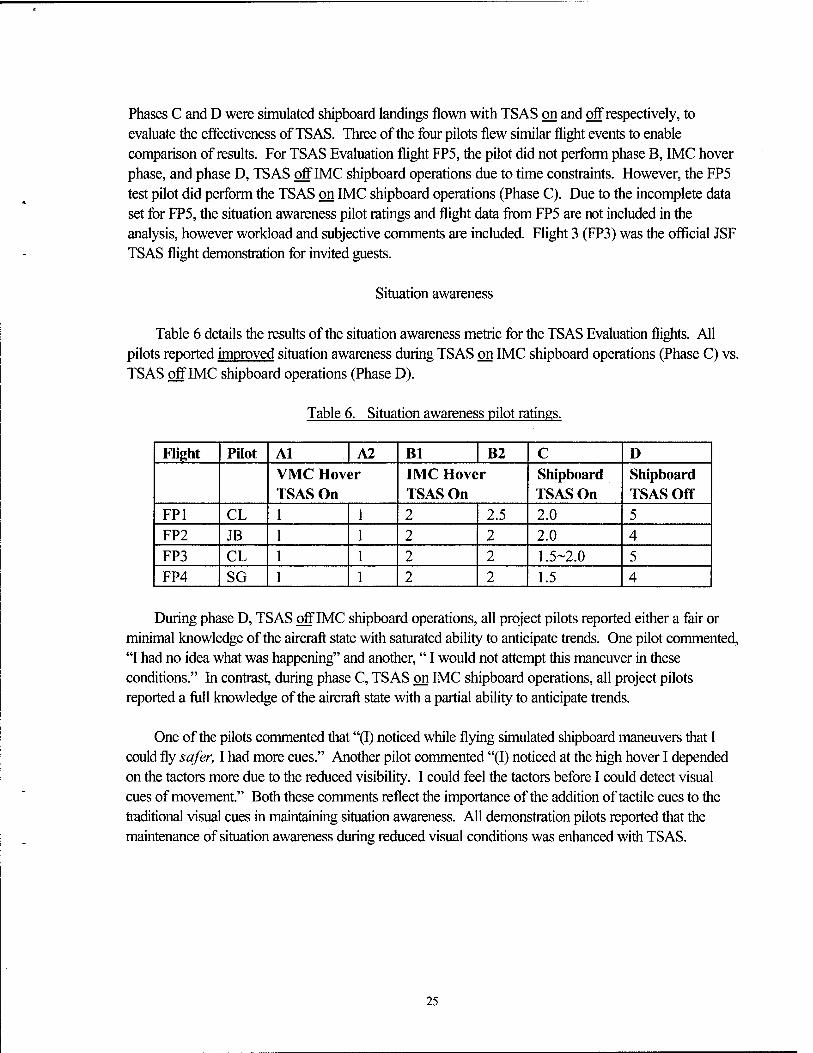
Situation awareness
Table 6 details the results of the situation awareness metric for the TSAS Evaluation flights. All pilots reported improved situation awareness during TSAS on IMC shipboard operations (Phase C) vs. TSAS off IMC shipboard operations (Phase D).
Table 6. Situation awareness pilot ratings.
Flight Pilot Al A2 Bl B2 C D VMC Hover TSAS On
IMC Hover TSAS On
Shipboard TSAS On
Shipboard TSAS Off
FPl CL 1 1 2 2.5 2.0 5 FP2 JB 1 1 2 2 2.0 4 FP3 CL 1 1 2 2 1.5-2.0 5 FP4 SG 1 1 2 2 1.5 4
During phase D, TSAS off IMC shipboard operations, all project pilots reported either a fair or minimal knowledge of the aircraft state with saturated ability to anticipate trends. One pilot commented, "I had no idea what was happening" and another," I would not attempt this maneuver in these conditions." In contrast, during phase C, TSAS on IMC shipboard operations, all project pilots reported a frill knowledge of the aircraft state with a partial ability to anticipate trends.
One of the pilots commented that "(I) noticed while flying simulated shipboard maneuvers that I could fly safer, I had more cues." Another pilot commented "(I) noticed at the high hover I depended on the tactors more due to the reduced visibility. I could feel the tactors before I could detect visual cues of movement." Both these comments reflect the importance of the addition of tactile cues to the traditional visual cues in maintaining situation awareness. All demonstration pilots reported that the maintenance of situation awareness during reduced visual conditions was enhanced with TSAS.
25
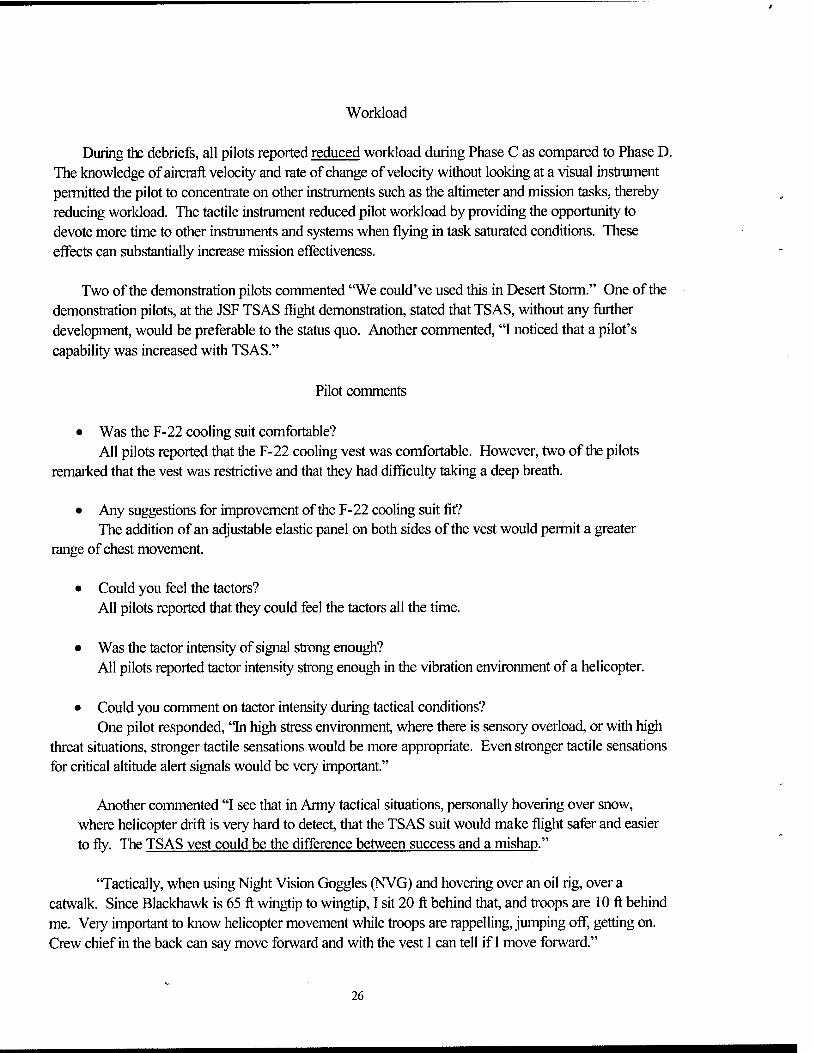
Workload
During the debriefs, all pilots reported reduced workload during Phase C as compared to Phase D. The knowledge of aircraft velocity and rate of change of velocity without looking at a visual instrument permitted the pilot to concentrate on other instruments such as the altimeter and mission tasks, thereby reducing workload. The tactile instrument reduced pilot workload by providing the opportunity to devote more time to other instruments and systems when flying in task saturated conditions. These effects can substantially increase mission effectiveness.
Two of the demonstration pilots commented "We could've used this in Desert Storm." One of the demonstration pilots, at the JSF TSAS flight demonstration, stated that TSAS, without any further development, would be preferable to the status quo. Another commented, "I noticed that a pilot's capability was increased with TSAS."
Pilot comments
• Was the F-22 cooling suit comfortable? All pilots reported that the F-22 cooling vest was comfortable. However, two of the pilots
remarked that the vest was restrictive and that they had difficulty taking a deep breath.
• Any suggestions for improvement of the F-22 cooling suit fit? The addition of an adjustable elastic panel on both sides of the vest would permit a greater
range of chest movement.
• Could you feel the tactors? All pilots reported that they could feel the tactors all the time.
• Was the tactor intensity of signal strong enough? All pilots reported tactor intensity strong enough in the vibration environment of a helicopter.
• Could you comment on tactor intensity during tactical conditions? One pilot responded, "In high stress environment, where there is sensory overload, or with high
threat situations, stronger tactile sensations would be more appropriate. Even stronger tactile sensations for critical altitude alert signals would be very important."
Another commented "I see that in Army tactical situations, personally hovering over snow, where helicopter drift is very hard to detect, that the TSAS suit would make flight safer and easier to fly. The TSAS vest could be the difference between success and a mishap."
"Tactically, when using Night Vision Goggles (NVG) and hovering over an oil rig, over a catwalk. Since Blackhawk is 65 ft wingtip to wingtip, I sit 20 ft behind that, and troops are 10 ft behind me. Very important to know helicopter movement while troops are rappelling, jumping off, getting on. Crew cWef in the back can say move forward and with the vest I can tell if I move forward."
26
"In combat, while firing mini-guns, the flash is blinding, NVG goggles tum off and I have a loss of vision. The suit could let me know if I am drifting, and which direction that I am moving."
"In combat, while taking incoming fire flying or hovering low to the ground, flash fi-om missile blast, explosions gunfire and loss of vision is present. The suit could again let me know what the helicopter is doing all this time in relation to the ground or hazards."
• Was the tactile information intuitive? All pilots responded that the tactile information was verv intuitive. Comments included: "No thinking."
"I didn't have to think."
"(TSAS) design gave 'solid indications' of drift."
"Frequency signal strength variations to identify the amount of helicopter drift was very helpful."
• Was the tactile sensation annoying? All pilots responded that the tactile sensation was not annoying or distracting.
• Please comment on workload during IMC shipboard operations? All pilots responded that workload was reduced.
• Any suggestions for improvements of the factors and/or tactile information?
1. Position Cue: "I would add the ability to pinpoint my location at will. Then I can tell if there are changes from
that personally set point. Pinpointing is very important for control (of) the helicopter, while rappelling, hoisting or hovering over water."
"I would like to add that with the TSAS suit aircraft position is known (communicated) without verbally saying it between pilots and crew chief could be in the loop as well."
"Have a pinpoint set control, set at will. While hovering, set it then I can use that point as a reference point for offloading troops via repelling, fast roping, or egress."
2. Altitude Information: "I would suggest adding something to give altitude information. Maybe on the left arm -
controls of collective position. (1) rate of descent, (2) rate of ascent, (3) change in descent, (4) change in ascent and (5) altitude. While flying following terrain. Keeping above obstacles, but not over 100 feet where threats are."
27
"Altitude control tactor, while flying with a minimum and a maximum attitude on approach on arm and identifying drift up or down."
• Any further comments? Other comments included: "In multi-flight scenario, fatigue sets in, air crew coordination is decreased, minor task capability
is reduced, the suit would counteract this. Especially cases of NVG flights, over water, or while shipboard hovering."
"In training with NVG, student is flying all by themselves. Instmctor with the suit on can monitor correctness of the flight path of the student (following directions, drift, etc.) while checking the radio or other instruments."
"Student can tell what direction they are moving while flying."
"Administratively or in a controlled environment, non-verbal communication with the crew is possible (i.e. buzzing each other to report all ready, or wait or emergency)."
Flight data
Using TSAS, pilots demonstrated improved control of aircraft during complex flight maneuvers. The awareness of aircraft velocity over the ground or "drift" without looking at a visual instrument was the biggest advantage of TSAS. This is illustrated in Figures 13 through 20, which contain data for the four pilots (Table 6). Looking at the top of the flight data figures (Figures 13 through 20), there are two red plots that show the aircraft path with TSAS ON (Phase C), the top left is a 3D view and the top right is an overhead view. At the bottom of the flight data figures (Figures 13 through 20), there are two blue plots that show the aircraft path with TSAS OFF (phase D) in both 3D and overhead views. The orientation of the helipad icon (H) indicates the heading of the helicopter at the beginning of the maneuver. For the 3D view, the helicopter is facing away from the reader, and in the overhead view the nose of the helicopter is orientated to the top of the page. Wind direction is shown as a gray arrow. The maneuver for the simulated shipboard take-off is described above, and consists of an ascent to IGE hover, followed by a left sideward hover for 50ft, then ascent to OGE hover and transition to forward flight The maneuver for the simulated shipboard landing is described above, and consists of a descent from OGE to IGE hover, followed by a left sideward hover for 50ft, stabilize at an IGE hover and then land. The safety pilot was responsible for verbally instmcting the demonstration pilot on the sequence of maneuvers. The intended maneuver is shown as a dashed black arrow in the overhead and 3D views.
28
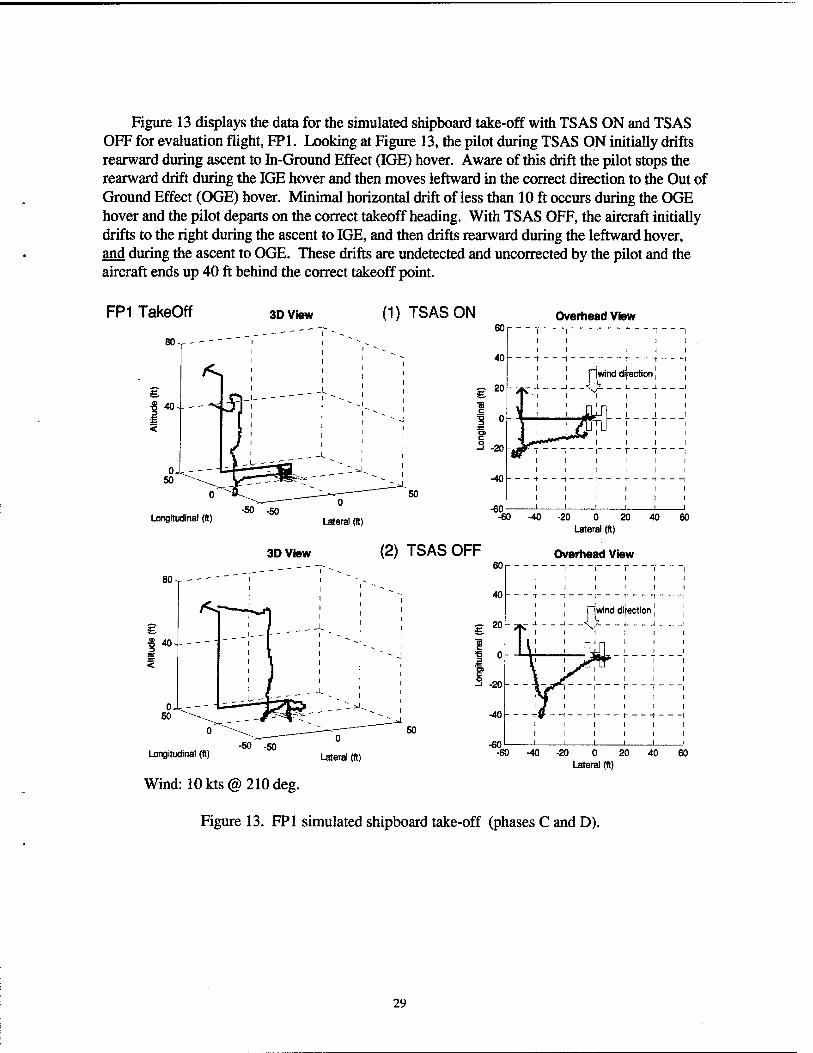
Figure 13 displays the data for the sunulated shipboard take-off with TSAS ON and TSAS OFF for evaluation flight, FPl. Looking at Figure 13, the pilot during TSAS ON initially drifts rearward during ascent to In-Ground Effect (IGE) hover. Aware of this drift the pilot stops the rearward drift during the IGE hover and then moves leftward in the correct direction to the Out of Ground Effect (OGE) hover. Minimal horizontal drift of less than 10 ft occurs during the OGE hover and the pilot departs on the correct takeoff heading. With TSAS OFF, the aircraft initially drifts to the right during the ascent to IGE, and then drifts rearward during the leftward hover, and during the ascent to OGE. These drifts are undetected and uncorrected by the pilot and the aircraft ends up 40 ft behind the correct takeoff point.
FP1 TakeOff
80- p- ---
/<^
e 1 40-
0- 50
'<:" ' 0
Ljongltu dinal (ft)
3D View (1) TSAS ON Overhead View
— 20
c
at
3 -20
-50 -50
1 r - 1 1 1 1
^ - - - fiwind dij-eotion
- _<_v _ _ ^ _ _ . 1 1
ir^ ^J
—). —1
1
_L -40
■60 -60 -40
3D View (2) TSAS OFF
-20 0 20 40 l^eral (ft)
Overhead View
60
60
40
— 20 £. ffl
a c 3 -20
-40
Longitudinal (ft) ■50 -50 -60
1 III 1
1 1 1 1 1
1 1 1 1 1
1 1
1 1
1 1 1
1 1 1
Wl
1 ~l~
1 1
-!- 1 1 1
nd difection — J 1
1 1
1 1
1 1
l\l \ J 1
1 1 1 1 1 1
1
4.
k 1 1
-60 -40 -20 0 20 40 l.^eral (ft)
60
Wind: 10kts@ 210deg.
Figure 13. FPl simulated shipboard take-off (phases C and D).
29
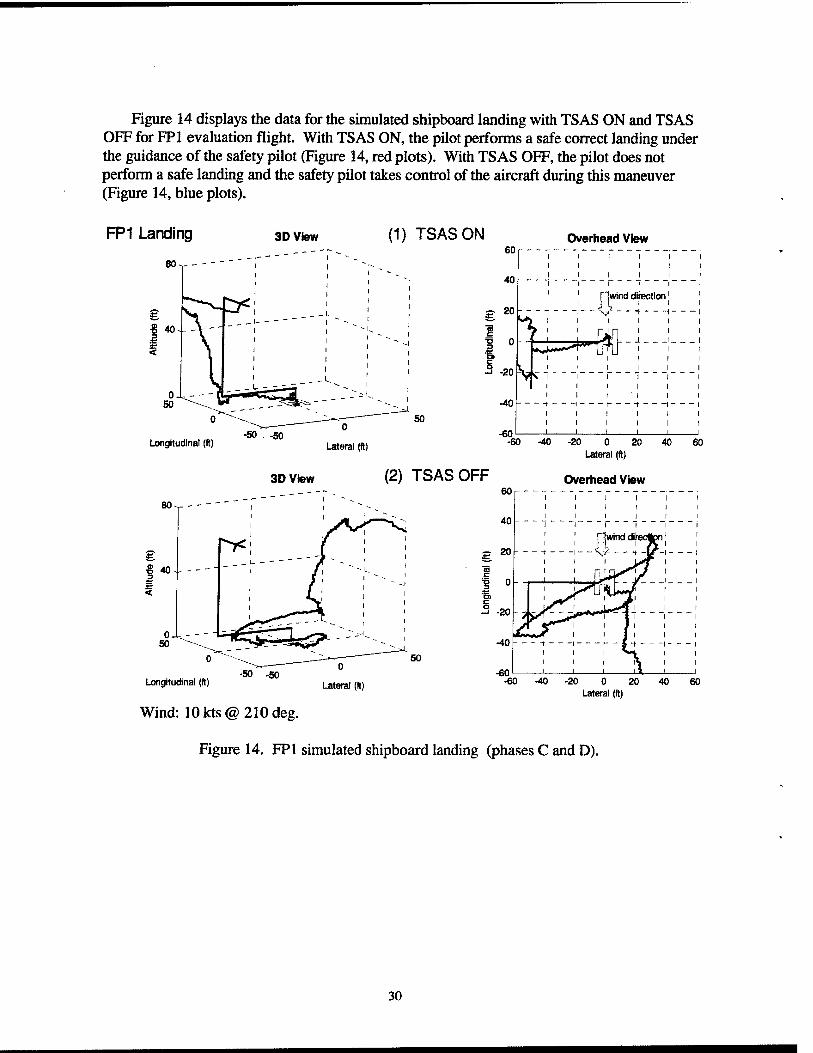
Figure 14 displays the data for the simulated shipboard landing with TSAS ON and TSAS OFF for FPl evaluation flight. With TSAS ON, the pilot performs a safe correct landing under the guidance of the safety pilot (Figure 14, red plots). With TSAS OFF, the pilot does not perform a safe landing and the safety pilot takes control of the aircraft during this maneuver (Figure 14, blue plots).
3D View (1) TSAS ON Overhead View 60
40
B 20
1 0
-20
-40
D C Q
Longitudinal (ft) -50 -50 -60
1 1 1
1 1 1 1 1 1
1 1 1
1 1
rlwind ditection
1 1
—
1
I.. i- - 1 1
y^ 1 1 1
1 1 1 1 1 1
1 1 1
1 1 1 1 1 1
Lateral (ft)
3D View (2) TSAS OFF
-60 -40 -20 0 20 40 60 Lateral (ft)
Overhead View 60
40
B 20
1 ° a c 3 -20
-40
-50 -50 -60
1 1 1 1 1 1 1 1 1 1 1 1 1 1 1 1
1 1 r-jwind dlfecton
- i
4 J-^w^
"rm- 1
Longitudinal (ft) Lateral (ft)
Wind: 10kts@ 210deg.
Figure 14. FPl simulated shipboard landing (phases C and D)
-60-40-20 0 20 40 60 Lateral (ft)
30
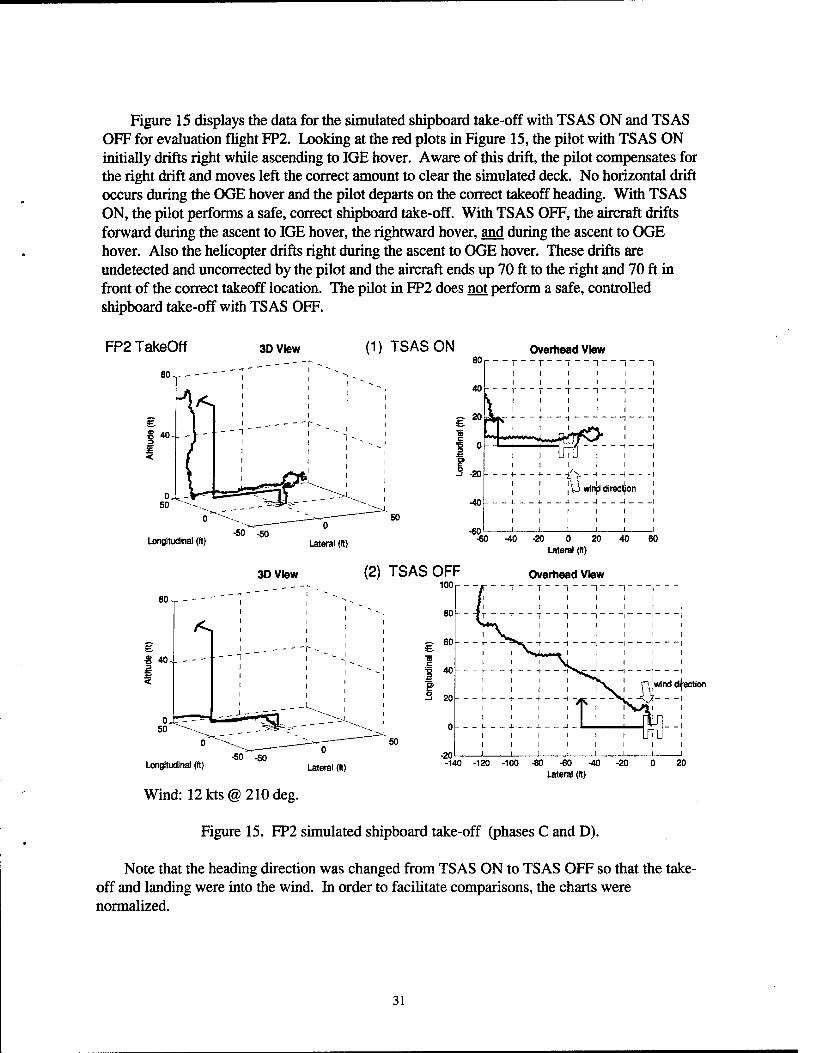
Figure 15 displays the data for the simulated shipboard take-off with TSAS ON and TSAS OFF for evaluation flight FP2. Looking at the red plots in Figure 15, the pilot with TSAS ON initially drifts right while ascending to IGE hover. Aware of this drift, the pilot compensates for the right drift and moves left the correct amount to clear the simulated deck. No horizontal drift occurs during the OGE hover and the pilot departs on the correct takeoff heading. With TSAS ON, the pilot performs a safe, correct shipboard take-off. With TSAS OFF, the aircraft drifts forward during the ascent to IGE hover, the rightward hover, and during the ascent to OGE hover. Also the helicopter drifts right during the ascent to OGE hover. These drifts are undetected and uncorrected by the pilot and the aircraft ends up 70 ft to the right and 70 ft in front of the correct takeoff location. The pilot in FP2 does not perform a safe, controlled shipboard take-off with TSAS OFF.
FP2 TakeOff 3D view (1) TSAS ON Overhead View
Longitudinal (H) •50 -50
3D View (2) TSAS OFF
-20 0 20 Ufteral (ft)
Overhead View
BO
40
/<<,
100
80
— 60
40
Longitudinal (ft) -50 -50
20
-20
r 1 i II i 11 1 1 1 1 1 /i 1 1 1 1 1
1 1
1 1
1 f
^ T
I 1
T i
n 1 i 1
1 i
1 1
1
i <sU 1
1 - 1 1
—1 1 — 1 1
1 1
1 1
^- —f- -
1 1
- -f - 1 1
1 1 "SvT'i T|winddi|i
^'1 "T - + - 1 1
- 4 - 1 1
1 1 i 1
1 1 1 1 1 1 1 1 1 1 1 1 1 1 1 1 1 1
M 1 1 1 1 1
i|BCtlon
-140 -120 -100-80-60-40 Lateral (ft)
-20 20
Wind:12kts@210deg.
Figure 15. FP2 simulated shipboard take-off (phases C and D).
Note that the heading direction was changed from TSAS ON to TSAS OFF so that the take- off and landing were into the wind. In order to facilitate comparisons, the charts were normalized.
31
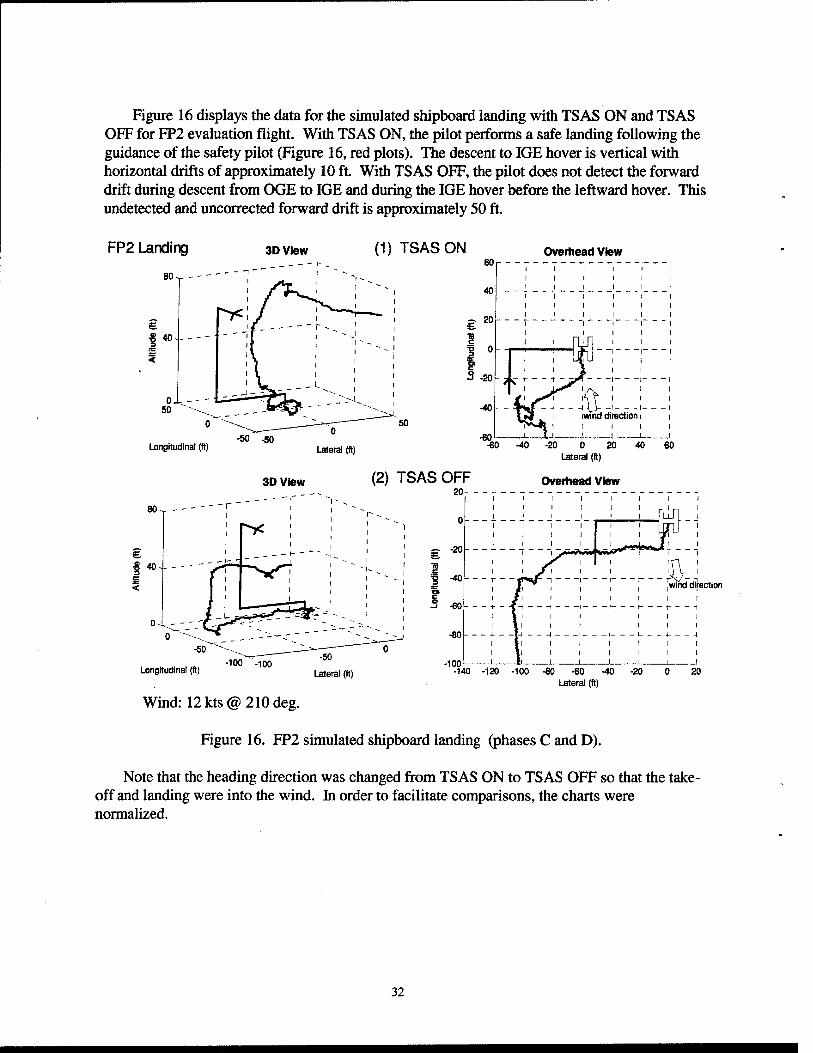
Figure 16 displays the data for the simulated shipboard landing with TSAS ON and TSAS OFF for FP2 evaluation flight. With TSAS ON, the pilot performs a safe landing following the guidance of the safety pilot (Figure 16, red plots). The descent to IGE hover is vertical with horizontal drifts of approximately 10 ft. With TSAS OFF, the pilot does not detect the forward drift during descent from OGE to IGE and during the IGE hover before the leftward hover. This undetected and uncorrected forward drift is approximately 50 ft.
FP2 Landing 3D View (1) TSAS ON Overhead View
80-^
40
0-L- 50
Longitudinal (ft)
80 ,- -
-50 -50
60
40
g 20
1 1 ° 3 -20
-40
-60 -60
1 1 1 1 1 1
' ' n 1 r
1 1 1
[ 1 1
1 1 U* L 1 1 2
- ;, ^ t - - t -s-f-
1 1 1
—1—1— 1
nd direction i i 1 1 1 1 1 1
•40
3D View (2) TSAS OFF 20
-20 0 20 Lateral (ft)
Overtiead View
40 60
I 40 ±r <
-50
Longitudinal (fl) -100 -100
wind direction
-140 -120 -100 -80 -60 -40 Lateral (ft)
Wind: 12kts@ 210deg.
Figure 16. FP2 simulated shipboard landing (phases C and D).
Note that the heading direction was changed from TSAS ON to TSAS OFF so that the take- off and landing were into the wind. In order to facilitate comparisons, the charts were normalized.
32
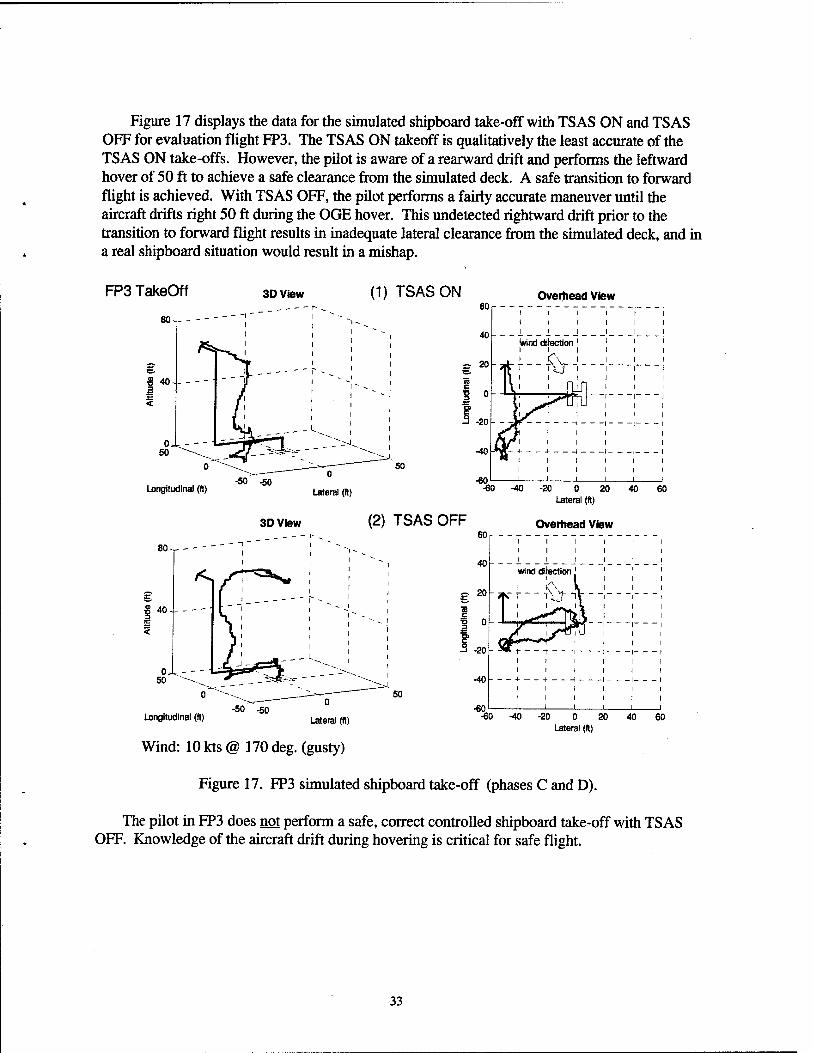
Figure 17 displays the data for the simulated shipboard take-off with TSAS ON and TSAS OFF for evaluation flight FP3. The TSAS ON takeoff is qualitatively the least accurate of the TSAS ON take-offs. However, the pilot is aware of a rearward drift and performs the leftward hover of 50 ft to achieve a safe clearance from the simulated deck. A safe transition to forward flight is achieved. With TSAS OFF, the pilot performs a fairly accurate maneuver until the aircraft drifts right 50 ft during the OGE hover. This undetected rightward drift prior to the transition to forward flight results in inadequate lateral clearance from the simulated deck, and in a real shipboard situation would result in a mishap.
FP3 TakeOff 3D View (1) TSAS ON Overhead View
80- - - " 1 "' 1 '
■8 40-
^
' " "
/
1 '
1 '
0. 50
.^- h3u^—^~
— 20
I 0 i" 5 -20
-40
-60
1 1 1 1 1 1 1 1 1
Wind dtectlon'
I 1 1 1
— —
t^^U
xTx ' '
1 1 1 1 1 1
•60-40-20 0 20 40 60 Lateral (ft)
(2) TSAS OFF Overhead View 60
40
— 20
I ° 5 -20
-40
-50 -50 -60
1 1 1 1 1 1 1 1 1
Wnd dl|ection '
-7\ \ T\j" "iV
- -^ .] ,. 1
1 1 1
1 1 1
1 1 1
1 1 1
1 1 1
-60 -40 -20 0 20 40 60 Lateral (ft)
Longitudinal (ft)
Wind: 10 kts @ 170 deg. (gusty)
Figure 17. FP3 simulated shipboard take-off (phases C and D).
The pilot in FP3 does not perform a safe, correct controlled shipboard take-off with TSAS OFF. Knowledge of the aircraft drift during hovering is critical for safe flight.
33
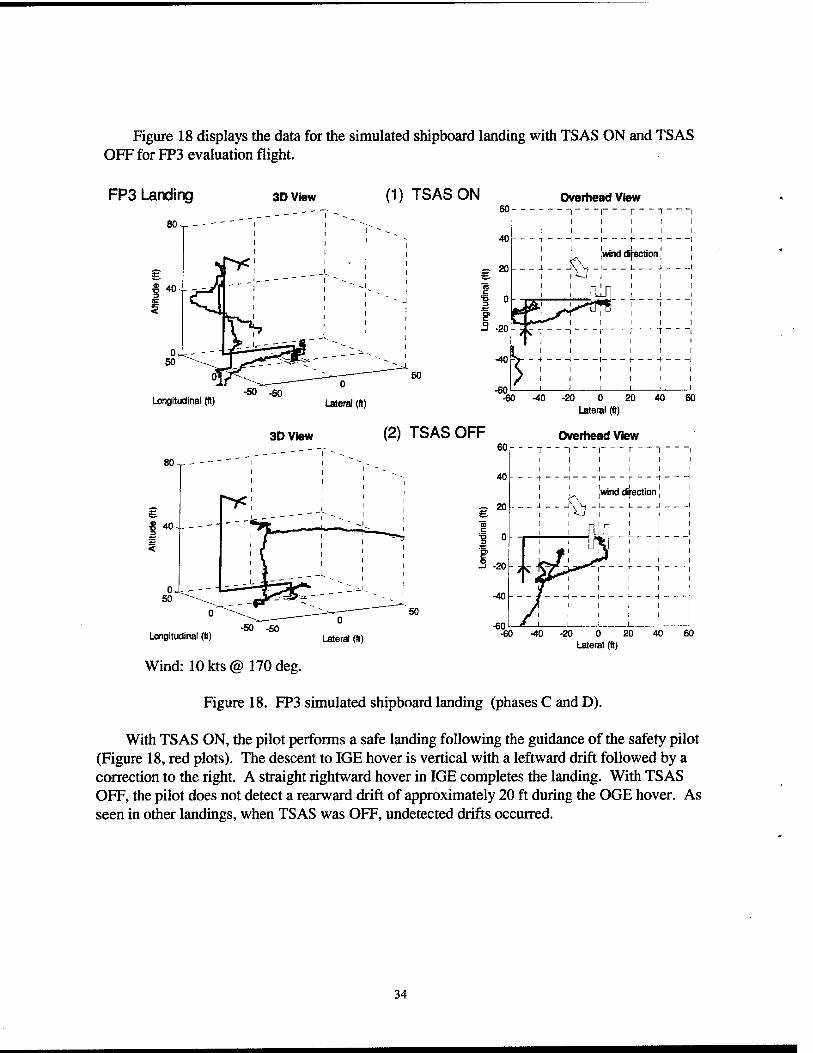
Figure 18 displays the data for the simulated shipboard landing with TSAS ON and TSAS OFF for FF3 evaluation flight.
FP3 Landing 3D View (1) TSAS ON
jjongltudlnal (ft)
80 V-
-50 -50
60
40
S 20
1 1 0 .tr
3 -20
-40
Overhead View
-1 1 1 1 1 1
j. _
' jvKind difeotion |
1 1 1
X
1
1
1 1
Lateral (ft) -60 -40 -20 0 20 40
Lateral (ft)
3D View (2) TSAS OFF Overhead View
40
50
-50 -50 Longitudinal (ft)
Wind: lOkts© 170 deg.
-20 0 20 Lateral (ft)
60
Figure 18. FP3 simulated shipboard landing (phases C and D).
With TSAS ON, the pilot performs a safe landing followmg the guidance of the safety pilot (Figure 18, red plots). The descent to IGE hover is vertical with a leftward drift foUowed by a correction to the right. A straight rightward hover in IGE completes the landing. With TSAS OFF, the pilot does not detect a rearward drift of approximately 20 ft during the OGE hover. As seen in other landings, when TSAS was OFF, undetected drifts occurred.
34
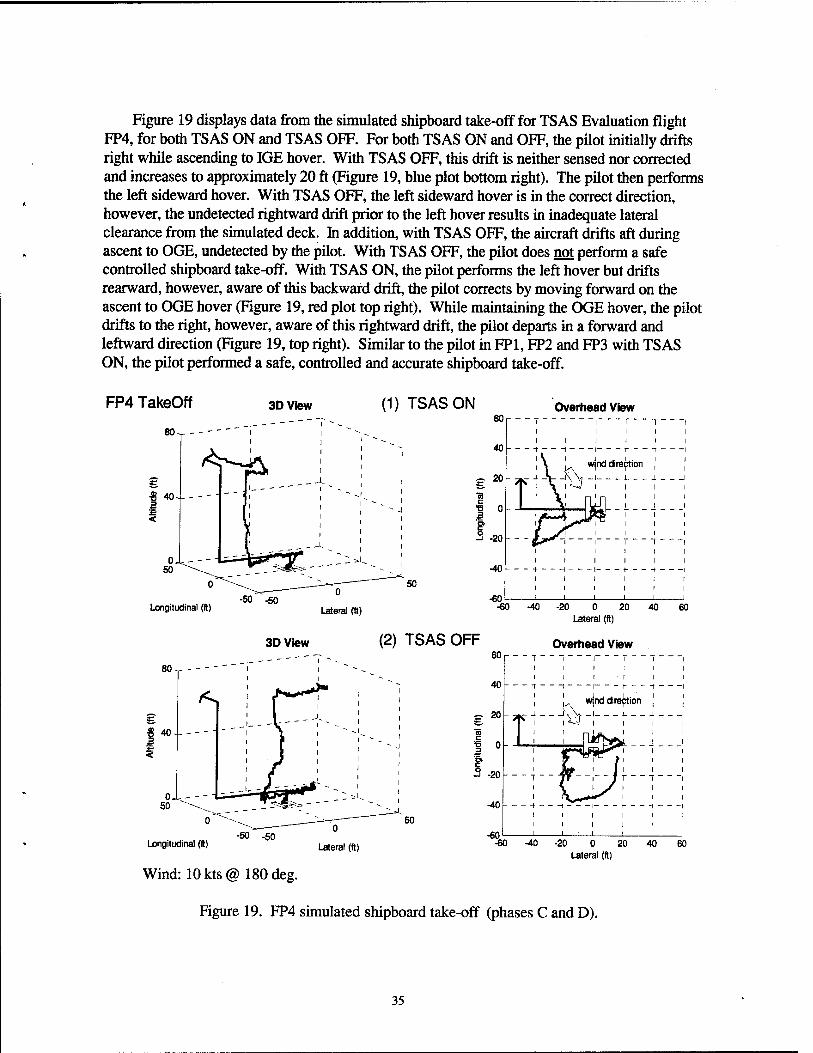
Figure 19 displays data from the simulated shipboard take-off for TSAS Evaluation flight FP4, for both TSAS ON and TSAS OFF. For both TSAS ON and OFF, the pilot initially drifts right while ascending to IGE hover. With TSAS OFF, this drift is neither sensed nor corrected and increases to approximately 20 ft (Figure 19, blue plot bottom right). The pilot then performs the left sideward hover. With TSAS OFF, the left sideward hover is in the correct direction, however, the undetected rightward drift prior to the left hover results in inadequate lateral clearance from the simulated deck. In addition, with TSAS OFF, the aircraft drifts aft during ascent to OGE, undetected by the pilot. With TSAS OFF, the pilot does not perform a safe controlled shipboard take-off. With TSAS ON, the pilot performs the left hover but drifts rearward, however, aware of this backward drift, the pilot corrects by moving forward on the ascent to OGE hover (Figure 19, red plot top right). While maintaining the OGE hover, the pilot drifts to the right, however, aware of this rightward drift, the pilot departs in a forward and leftward direction (Figure 19, top right). Similar to the pilot in FPl, FP2 and FP3 with TSAS ON, the pilot performed a safe, controlled and accurate shipboard take-off.
FP4 TakeOff
80-
3D View (1) TSAS ON Overhead View
f 40---
<
I
0 so
Longitudinal (ft)
80-r - -
40-- - -
0, 50
60
40
— 20
1 ° '5» c •3 -20
•40
-50 -50 -60
1 i 1 - - 1
1 1 1 1
1 1 1 1
1 \ ' wjnd direction
: \: nil] \
—
jpy^.. 1 1 1 1 1 1
1 1 1 1 1 i
k. _ _ _^ —1
-60 -40-20 0 20 40 60 Lateral (ft)
3D View (2) TSAS OFF Overhead View 60
40
£■ 20
I 0 f 5 -20
-40
-50 -50 -60
1 1 r " 1 1 1 1 1 1
-^- y w|nd dire *on
1
I
--f5"
1 I 1 1 1 1
-60 -40 -20 0 20 40 60 Uteral (ft)
Longitudinal (ft) Lateral (ft)
Wind: 10kts@ 180 deg.
Figure 19. FP4 simulated shipboard take-off (phases C and D).
35
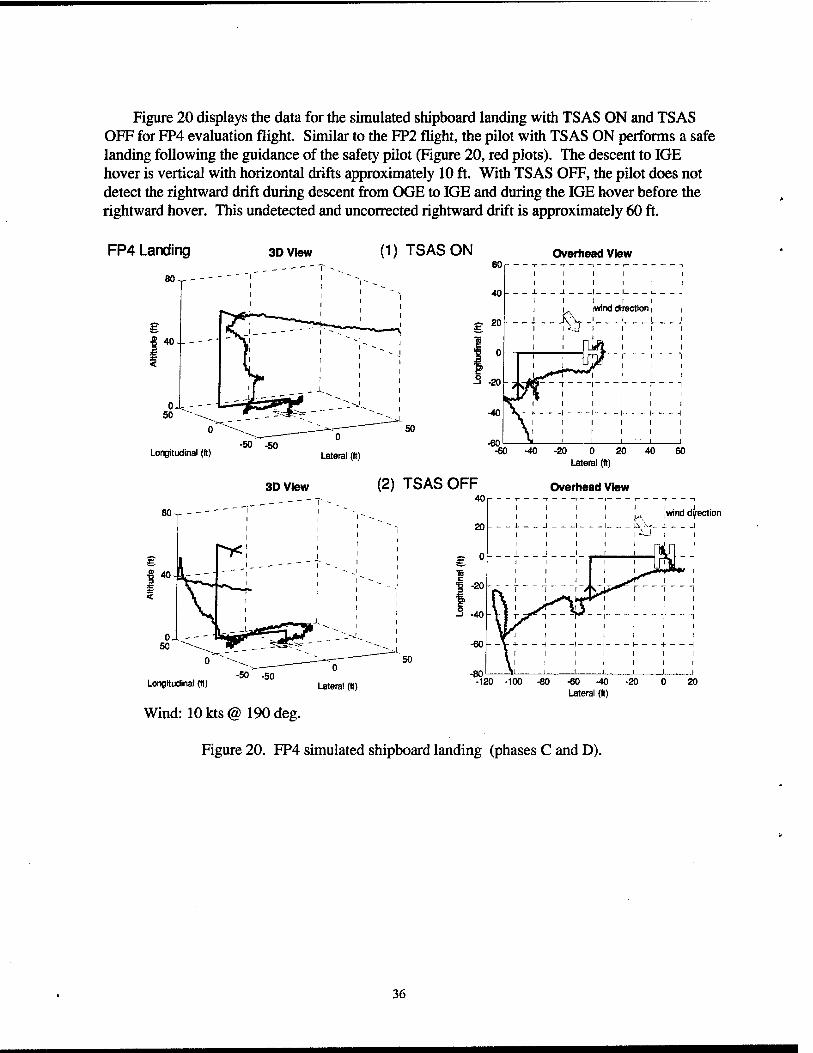
Figure 20 displays the data for the simulated shipboard landing with TS AS ON and TS AS OFF for n»4 evaluation flight. Similar to the FP2 flight, the pilot with TSAS ON performs a safe landing following the guidance of the safety pilot (Figure 20, red plots). The descent to IGE hover is vertical with horizontal drifts approximately 10 ft. With TSAS OFF, the pilot does not detect the rightward drift during descent from OGE to IGE and during the IGE hover before the rightward hover. This undetected and uncorrected rightward drift is approximately 60 ft.
FP4 Landing
80
3D View (1) TSAS ON
Longitudinal (fl) -50 -50
3D View (2) TSAS OFF
LongKudlnal (ft) -50 -50
40
20
£■ ° To
f -20
J -40
-60
-80
Overhead View
-60-40-20 0 20 40 Lateral (ft)
Overhead View
1 1 1 1 1 1 1 1 1 lx.,
J 1 1 1 Ui_ -N- 1 1 1 1 1 -^-J 1 1 1 1 1 1 1 1 1 1
1 1*
1
nddif 1
1 1 1 1 1 1 1 1 1
1 1
1 ^.^ff'^^^ 'W 1
(\i >nirr: : i
1
J
1 1
_ - 1 T
i 1 1 1
-L
1 -120 -100 -80 -60 -40 -20
Lateral (ft) 20
Wind: 10 kts @ 190 deg.
Figure 20. FP4 simulated shipboard landing (phases C and D).
36
Discussion
The JSF TSAS flight demonstration fulfilled project test objectives and demonstrated that a tactile instrument could provide increased mission effectiveness and survivability in V/STOL strike aircraft. Results from the JSF TSAS flight demonstration have shown that TSAS technologies have the potential to increase pilot situation awareness and reduce pilot workload, especially during complex flight conditions in poor visibility. Using TSAS, pilots demonstrated enhanced control of hover maneuvers, relying on tactile cues for the necessary informatioa
The awareness of aircraft movement over the ground or "drift" without looking at a visual instrument was the most important feature of the JSF TSAS tactile instrument. An undetected drift of a helicopter or V/STOL aircraft whilst hovering can lead to a spatial disorientation mishap resulting in a serious and costly problem in terms of lives lost, aircraft lost and mission failure. With the increasing use of night vision devices, the problem will only increase in magnitude. The JSF TSAS tactile instrument using an F-22 cooling vest and lightweight pneumatic tactors was optimized for hover conditions in poor visibility. By providing horizontal drift information, the pilots were able to spend more time visually attending to other displays, including the altimeter for altitude control. This ability to spend more time visually on other visual displays and using the tactile instrument for horizontal drift resulted in reports of increased situation awareness and reduced workload. During IGE hover in VMC, the pilots used the tactile cues as a secondary source of drift information, again resulting in reports of increased situation awareness and reduced workload. During OGE hover in VMC, particularly in areas of limited contrast such as the helipad from which this demonstration was performed, the visual detection of drift becomes harder due to the loss of close, clear visual cues and to the characteristics of height-depth perception illusion (Headquarters, Department of the Army. 2000). The tactile display was able to provide the necessary drift information that allowed the pilot to spend more time visually on other instruments and outside the cockpit. The TSAS tactile display permitted the pilot to concentrate on mission tasks, thereby reducing workload. The relationship between situation awareness and performance is not direct, but can be foreseen, hi general, it is expected that poor performance will occur when situation awareness is incomplete or inaccurate (Endsley, 1995). With decreased pilot workload and enhanced situation awareness, TSAS increases the potential for improved performance of an aviator. Improved performance in military aircraft translates to improved survivability and mission capability. These effects can increase mission effectiveness.
With the tactile cues provided by the TSAS tactile instrument, pilots were able to demonstrate improved control of aircraft during complex flight conditions in VMC and IMC conditions. Even though the flight demonstrations were very successful in demonstrating that tactile instruments can solve operational problems, one must be cautioned in ovemsing the tactile instrument by trying to provide too much information, thus diminishing the capability of the display. This is especially important with the current factor and TLS technology. When the pilot felt a tactile sensation with the JSF TSAS hover display, only one aircraft variable was being communicated (velocity) and the position on the body corresponded to the direction of that velocity, and the intensity of the sensation corresponded to the magnitude. This was a simple, easy-to-interpret tactile algorithm that used current factor and TLS technology to solve a critical aviation problem and improve the safety of flight.
37
These results confirm the previous findings in a T-34 flight demonstration in that a tactile display provides excellent warning of deviation fi-om a desired state or null condition (McGrath et al., 1998). By using the appropriate tactile algorithm (tactor location v^^ith maximal separation and strong tactile intensity) intuitive 3D direction and magnitude information can be provided.
A few technical problems related to the sensor hardware were encountered during the test program. As mentioned previously, strong emphasis was placed on the use of COTS equipment, which led to the selection of civilian GPS and DGPS units. The GPS unit had strict antenna requirements, which precluded the use of the installed military aircraft GPS antenna. The DGPS unit received US Coast Guard beacon signals from Mobile, Alabama, that proved intermittent at Ft. Rucker, Alabama, approximately 100 miles away. Utilizing a dedicated passive civilian GPS antenna and moving closer to Mobile (NAS Pensacola) solved these two problems, but the use of a military GPS unit with P-Code (as would be the case in a fleet deployed TSAS) would also eliminate those two problems. No other significant technical difficulties were encountered during the flight test program.
F-22 cooling vest
One of the major breakthroughs of the JSF TSAS project was the use of the F-22 cooling vest as the TLS. The F-22 cooling vest solved both engineering and human factors/acceptability concerns for a TLS. First, the F-22 cooling vest TLS was lightweight and snug fitting when properly worn, and inflated slighfly when connected to the cooling ambient air, which ensured a constant contact pressure of the pneumatic tactors on the torso. Coupled with the reduced weight of the pneumatic tactor compared to the "pager motor" tactor used in the previous two TSAS military aviation test projects (Raj et al., 1998a; Raj et al., 1998b), the pilots did not report any lost tactor sensation. Two of the larger pilots commented that additional elastic would improve the comfort even more. From a human factors perspective, the F-22 vest was exceptional because the pilots wanted to wear it. The circulating cooling air climate control was appreciated by all pilots and was instrumental in overcoming the very important aviator culture criticism that "I don't want to wear another piece of equipment." This is a very real problem as the modem aviator is tasked to carry/wear a large amount of equipment. Without aviator acceptance, tlie tactile instrument will be limited in its development.
The F-22 cooling suit was a vest (Figure 9) that provided a good fit around the torso. This coverage of the torso was more than adequate for the presentation of helicopter horizontal velocity. It allowed the placement of two tactors in each direction, thus providing increased stimulation and redundancy - a very critical feature in aviation. To expand the role of the vest to include orientation information during forward flight (perhaps presented as a single tactor or a collection of tactors in the direction of down, as demonstrated in previous TSAS test projects) an expanded coverage vest is required to include the upper torso region. The cvirrent vest does not provide a snug fit sufficient to maintain tactor contact with the body in the upper torso (chest and back).
38
Conclusions/recommendations
The TSAS flight demonstration exceeded project test objectives and demonstrated that a tactile display could provide increased mission effectiveness and survivability in V-STOL strike aircraft.
TSAS technologies have shown the potential to increase pilot SA and reduce pilot workload, especially during complex flight conditions. Using TSAS, pilots demonstrated enhanced control of hover maneuvers, including transitions to and from forward flight in degraded visual conditions, relying on tactile cues for the necessary information The awareness of aircraft movement over the ground or "drift" without looking at a visual instmment was the most important feature of TSAS. The tactile display provided the opportunity to devote more time to other instruments and systems when flying in task saturated conditions. TSAS permitted the pilot to concentrate on mission tasks, thereby reducing workload. These effects can substantially increase mission effectiveness.
Previous flight test programs also have proven the effectiveness of tactile displays in normal flight regimes (straight and level flight, standard rate turns, ground-controlled approaches and unusual attitude recoveries) in both fixed and rotary wing aircraft. Overall, TSAS flight demonstrations have shown that a tactile display can decrease pilot workload, enhance pilot SA, and increase the potential for survivability and lethality.
To achieve a complete solution to the problem of spatial awareness mishaps, tactile instmments must be integrated with advanced visual displays and audio systems into a synergistic situation awareness instrument. This integrated solution represents the basis for the next-generation human- machine interface for military and commercial aircraft. Development of mode-switching software mechanisms for the tactile instrument will also be applicable to advanced HMD and 3D audio displays. The mode-switching software must be adaptive and "smart" about which information to present; and how, when, what, and where to provide that information. The switching software will facilitate the eventual integration of visual, audio, and tactile displays into a situation awareness display that will provide the right combination of information at the right time by the right sensory channel(s).
To fully realize the potential of TSAS, the further development, testing, and evaluation of the following technology areas and the human factors implications need to be pursued:
• Integration of tactile instruments with helmet mounted displays and 3D audio displays. • Significant improvement in factor technology. • Tactor integration with flight garments. • Miniaturization ofall TSAS components. • Improve JSF hover tactile algorithm to include altitude and position cues. • Development of "smart" software to enable intelligent switching between various modes of
situation awareness information.
39
References
Adams, S. 1998. Practical considerations for measuring situational awareness. The application of tactile cues to enhance situation displays. 3"" Ann Symp Exhibition on Situational Awareness in the Tactical Air Environment (pp. 157-162). Patuxent River, MD.
Aeronautical Design Standard ADS-33D-PRF USAATC/AVRDEC. 1994. Handling qualities requirements for military rotorcraft. St Louis, MO: US Army Aviation and Troop Command.
Braithwaite, M. G., Douglass, P. K., Dumford, S. J., and Lucas, G. 1998. The hazard of spatial disorientation during helicopter flight using night vision devices. Aviat Space Environ Med, 69(11):1038-1044.
Braithwaite, M. G., Groh, S., and Alvarez, E. A. 1997. Spatial disorientation in U.S. Army helicopter accidents: An update of the 1987-92 survey to include 1993-95. Fort Rucker, AL: U.S. Army Aeromedical Research Laboratory. USAARL Report 97-13.
Durnford, S. J., Crowley, J. S., Rosado, N. R., Harper, J., and DeRoche, S. 1995. Spatial disorientation: A survey of U.S. Army helicopter accidents 1987-92. Fort Rucker, AL: U.S. Army Aeromedical Research Laboratory. USAARL Report 95-25.
Endsley, M. R. 1988. Design and evaluation for situation awareness enhancement. Proc Hum Factors Soc 32"*" Ann Meeting (pp. 97-101). Santa Monica, CA: Human Factors and Ergonomics Society.
Endsley, M. R. 1995. Toward a theory of situation awareness in dynamic systems. Hum Factors, 37(l):32-64.
Geldard, F. A. 1960. Some neglected possibilities of communication. Science, 131, 1583-1588.
Griffin, M., Pera, L., Cabrera, L., and Moore, B. 2001. Operational Assessment of the Tactile Situational Awareness System Final Report. HQ AFSOC/XPT, Huriburt Field, FL. AFSOC Project No. 99-060.
Haven, R., and Smith, R. 1996. Joint Advanced Strike Technology Integrated Helmet Audio- Visual System Demonstration Final Report Joint Strike Fighter Program Office, December 1996.
Headquarters, Department of the Army. 2000. Aeromedical Training for Flight Personnel Washington, DC. Field Manual No 3-04.301(1-301).
Hoh, R. H., and Mitchell, D. G. 1996. Handling-qualities specification - a functional requirement for the flight control system. In: MB Tischler (Ed.), Advances in aircraft flight control, (pp 3-33) London: Taylor & Francis.
40
McGrath, B. J., Suri, N., Carff, R., Raj, A. K., and Rupert, A. H. 1998. The role of intelligent software in spatial awareness displays. 3''' Ann Symp Exhibition on Situational Awareness in the Tactical Air Environment (pp. 143-152). Patuxent River, MD.
Raj, A. K., McGrath, B. J., Rochlis, J., Newman, D. J., and Rupert, A. H. 1998a. The application of tactile cues to enhance situation displays. 3'^ Ann Symp Exhibition on Situational Awareness in the Tactical Air Environment (pp. 77-84). Patuxent River, MD.
Raj, A. K., Suri, N., Braithwaite, M. G., and Rupert, A. H. 1998b. "The Tactile Situation Awareness System in Rotary Wing Aircraft: Flight Test Results," In: Proceedings of the RTA/HFM Symposium on Current Aeromedical Issues in Rotary Wing Operations, 19-22 October 1998, pp. (16) 1-7.
Rupert, A. H., Guedry, F. E., and Reshke, M. F. 1994. The use of a tactile interface to convey position and motion perceptions. In Virtual interfaces: Research and applications, Lisbon, Portugal, Oct 18-22, 1993. AGARD CP-541:20-l 1 to 20-75. Neuilly Sur Seine, France: Advisory Group for Aerospace Research and Development.
Rupert, A. H., Mateczun, A.J., and Guedry, F. E. 1990. Maintaining spatial orientation awareness. In Situational Awareness in aerospace operations. Copenhagen Denmark, 2-6 Oct 1990. AGARD CP-47821-1 to 21-5. Neuilly Sur Seine, France: Advisory Group for Aerospace Research and Development.
Sachs, R. M., Miller, J. D., and Grant, K. W. 1980. Perceived magnitude of multiple electrocutaneous pulses. Percept. Psycophys, 25(3).-255-262.
US Department of Transportation. 1978. Basic helicopter handbook. Advisory Circular 61-13B, US Department of Transportation, Federal Aviation Administration. Oklahoma City, Oklahoma.
41
Acronyms
The following lists alphabetically the acronyms used in this thesis.
ADS AFCS AFSOC AGL AIS CLSA COTS CSS DGPS EAI FET FSIPT OCA GPS GPS/INS GUI HMD HUD IGE IHADSS IMC INS INS/GPS 10 JSF MFD MSL NAMRL NATOPS NASA NAWC-AD NVD NVG OGE ONR RTCM-SC 104
SA SBH^
Aeronautical Design Standard Automatic Flight Control System Air Force Special Operations Command Above Ground Level Airborne Instrument System China Lake Situation Awareness Commercial- Off- The- Shelf Coastal Systems Station DiflFerential Global Positioning System Engineering Acoustics, Inc. Field Effect Transistor Flight Systems Integrated Product Team Ground Controlled Approach Global Positioning System Global Positioning System/Inertial Navigation System Graphical User Interface Head Mounted Display Heads-Up Display In-Ground Effect Integrated Helmet and Display Sighting System Instrument Meteorological Conditions Inertial Navigation System Inertial Navigation System/ Global Positioning System Instructor Operator Joint Strike Fighter MultiFunction Displays Mean Sea Level Naval Aerospace Medical Research Laboratory Naval Air Training and Operating Procedures Standardization National Aeronautics and Space Administration Naval Air Warfare Center - Aircraft Division Night Vision Device Night Vision Goggle Out of Ground Effect Office of Naval Research Radio Technical Commission for Maritime Services, Special Committee 104 Situational Awareness Small Business Innovative Research
42
SV-2 Survival Vest-2 TCLS Tactor Control Laboratory System TLS Tactor Locator System TSAS Tactile Situation Awareness System US United States USAARL United States Army Aeromedical Research Laboratory USD Unrecognised Spatial Disorientation UTM Universal Transverse Mercator UWF-IHMC University of West Florida, Institute for Human and Machine
Cognition VMC Visual Meteorological Conditions VME Versa Module Europa V/STOL Vertical Short Take Oif and Landing WGS World Geodetic Survey
43