Embed Size (px)
Citation preview
Tran
spar
ency
inte
rnat
iona
l - k
enya
Kenya
Table of ContentsINTRODUCTION 11.
METHODOLOGY 32.
CORRUPTION IN THE EAST AFRICAN REGION 53.
KENYA 54.
TANZANIA 65.
UGANDA 76.
BURUNDI 87.
RWANDA 88.
ORGANISATIONAL RANKING OF THE EAST 9.
AFRICAN BRIBERY INDEX 10
KENYA 1510.
10.1 SAMPLE CHARACTERISTICS 15
10.2 OVERVIEW AND FINDINGS 18
TANZANIA 3111.
11.1 SAMPLE CHARACTERISTICS 31
11.2 OVERVIEW AND FINDINGS 34
UGANDA 4712.
12.1 SAMPLE CHARACTERISTICS 47
12.2 OVERVIEW AND FINDINGS 50
BURUNDI 6113.
13.1 SAMPLE CHARACTERISTIC 61
13.2 OVERVIEW AND FINDINGS 64
RWANDA 7314.
14.1 SAMPLE CHARACTERISTICS 73
14.2 OVERVIEW AND FINDINGS 76

East
Afri
can
Brib
ery
Inde
x
www.tikenya.org
LIST OF TABLES AND FIGURES PAGE
Table 1: Country ranking on corruption prevalence 10Table2: Aggregate index of bribery-prone public institutions in the regions 10-14 Table 3: Distribution of respondents by province – Kenya 15Fig 1: Sample distribution by gender - Kenya 15Fig 2: Distribution by residence – Kenya 16Table 4: Sample distribution by age – Kenya 16Table 5: Sample distribution by employment status – Kenya 16-17Table 6: Education level of the respondents – Kenya 17Table 7: Sample distribution by household income – Kenya 17Table 8: Purpose of bribe – Kenya 18Fig 3: Reporting of corruption cases – Kenya 18Table 9: Reasons for not reporting bribery cases – Kenya 19Table 10: Exits and Entrants in the 2010 index – Kenya 19Table 11: Aggregate index for Kenya 20-21Table 12: Likelihood of bribery – Kenya 21-22 Table 13: Prevalence of bribery – Kenya 22-23 Table 14: Impact of bribery – Kenya 24Table 15: Average size of bribery – Kenya 25-26Table 16: Share of bribery – Kenya 27Fig 4: Perceived current levels of corruption – Kenya 28Fig 5: Perceived change in corruption levels in the past one year – Kenya 29Fig 6: Projected level of corruption in the next one year – Kenya 29Fig 7: Kenya government’s commitment to fight corruption 30Table 17: Distribution of respondents by province – Tanzania 31Fig 8: Sample distribution by gender – Tanzania 32Fig 9: Sample distribution by residence – Tanzania 32Table 18: Sample distribution by age – Tanzania 33Table 19: Sample distribution by employment status – Tanzania 33Table 20: Sample distribution by level of education – Tanzania 34Table 21: Sample distribution by household income – Tanzania 34Table22: Purpose of bribery – Tanzania 35Fig 10: Reporting of bribery cases – Tanzania 35Table 23: Reasons for not reporting – Tanzania 36Table 24: Exits and Entrants - Tanzania 36Table 25: Aggregate index – Tanzania 36-37Table 26: Likelihood of bribery – Tanzania 38-39Table 27: Prevalence of bribery – Tanzania 39-40

Tran
spar
ency
inte
rnat
iona
l - k
enya
Kenya
LIST OF TABLES AND FIGURES PAGE
Table 28: Impact of bribery – Tanzania 40-41Table 29: Average size of bribe – Tanzania 42Table 30: Share of bribe – Tanzania 43-44Fig 11: Percieved level of corruption – Tanzania 44Fig 12: Perceived change in corruption in the next one year – Tanzania 45Fig 13: Projected level of corruption in Tanzania in the next one year 45Fig 14: Tanzanians’ perception on the government’s commitment to fight corruption 46Table 31: Distribution of respondents by province – Uganda 47Fig 15: Gender distribution of respondents – Uganda 47Fig 16: Distribution of the respondents by residence – Uganda 48Table 32: Sample distribution by age – Uganda 48Table 33: Sample distribution by employment status – Uganda 49Table 34: Sample distribution of respondents by level of education – Uganda 49Table 35: Distribution of respondents by household income level – Uganda 50Table 36: Purpose of the bribe – Uganda 50Fig 17: Reporting of bribery cases - Uganda 51Table 37: Reasons for not reporting – Uganda 51Table 38: New entrants and exits – Uganda 52Table 39: Aggregate Index – Uganda 52-53Table 40: Likelihood of bribery – Uganda 53-54Table 41: Prevalence of bribery – Uganda 54-55Table 42: Impact of bribery – Uganda 55-56 Table 43: Average size of bribe – Uganda 57Table 44: Share of the bribe – Uganda 58Fig 18: Perceived current level of corruption – Uganda 59Fig 19: Perceived change in the corruption level in the past one year – Uganda 59Fig 20: Projected level of corruption in Uganda in the next one year 60Fig 21: Ugandans’ perception of the government’s commitment to fight corruption 60Table 45: Distribution of respondents by province – Burundi 61Fig 22: Gender distribution of the respondents-Burundi 61 Fig 23: Distribution by residence – Burundi 62Table 46: Sample distribution by age – Burundi 62Table 47: Sample distribution by employment status – Burundi 63Table 48: Distribution by level of education – Burundi 63Table 49: Distribution by household income – Burundi 64

East
Afri
can
Brib
ery
Inde
x
www.tikenya.org
LIST OF TABLES AND FIGURES PAGE
Table50: Bribery by purpose – Burundi 64Table 51: Reasons for not reporting - Burundi 65Table 52: Aggregate index - Burundi 65-66Table 53: Likelihood of bribery – Burundi 66Table 54: Prevalence of bribery – Burundi 67Table55: Impact of bribery – Burundi 68Table 56: Average size of bribe – Burundi 69Table 57: Share of bribe – Burundi 69-70Fig 24: Perception of the current level of corruption – Burundi 71Fig 25: Percieved change in the corruption level in the past one year – Burundi 71Fig 26: Projected level of corruption in Burundi in the next one year 72Fig 27: Burundians’ perception on the government’s commitment to fight corruption 72Table 58: Sample distribution by province – Rwanda 73Fig 28: Sample distribution by gender – Rwanda 73Fig 29: Sample distribution by residence – Rwanda 74Table 59: Sample distribution by age – Rwanda 74Table 60: Sample distribution by education level – Rwanda 75Table 61: Sample distribution by employment status – Rwanda 75Table 62: Distribution of residents by household income – Rwanda 76Fig 30: Perception of the level of corruption – Rwanda 77Fig 31: Perceived change in the level of corruption in the past one year – Rwanda 77Fig 32: Projected level of corruption in the next one year – Rwanda 78Fig 33: Rwandans’ perception on the government’s commitment to fight corruption 78

Tran
spar
ency
inte
rnat
iona
l - k
enya
Kenya
INTRODUCTION1.
The East African Common Market Protocol came to effect on 1st July, 2010 amid high enthusiasm and expectation among the citizens of the East African Community’s member states. The protocol is expected to boost trade across the five East African countries of Kenya, Uganda, Tanzania, Rwanda and Burundi by promoting the free movement of goods, services and capital. The East African Community has recorded notable strides in promoting trade among the member states. Intra-trade volumes rose by 87% in Uganda, 91% in Kenya and 65% in Tanzania between 2004 and 2008, heralding a bright future for the citizens of the bloc.
Individually, the member countries have formulated ambitious economic and social development blueprints. In Kenya the Vision 2030 seeks to convert the country into a middle income country within the next two decades. Rwanda’s Vision 2020, Vision 2025 for Tanzania and Uganda’s Poverty Eradication Plan seek to achieve similar goals. The countries have already made initial steps towards these goals especially in infrastructural development.
Central in these ambitious development plans is the promotion of good governance; a lack of which is likely to hold back the attainment of the plans. Resources earmarked for requisite extensive infrastructural development may end up in private hands through corruption. The much needed foreign investments may not be forthcoming or sustained unless good governance is actualised. It is noteworthy that Tanzania, Kenya, Rwanda and Uganda are at different stages of joining the league of oil producing countries. This calls for a transparent governance environment if the region is to avoid resource curse previously faced by other African countries.
The East African Bribery Index is a governance tool developed to measure bribery levels in the private and public sectors in the region. The index registers the firsthand experiences of the residents of the region with regard to service delivery and corruption. It seeks to establish the extent of bribery by seeking information on where the respondents were asked to pay bribes, if they acceded to bribery demands and the amount of bribe paid. Although the index is a tool to measure petty bribery, it is a general indicator for other forms of corruption in a particular country.
The index clearly shows that apart from Rwanda where incidents of bribery were found to be negligible, corruption is still an impediment to public service delivery in the region. Key governance and enforcement institutions such as the judiciary, the police and local authorities featured prominently in the index. Service institutions in the water, electricity, education and health sectors also dominated the top ranks of bribery-prone institutions in the region, compromising accessibility to and the quality of services offered.
01

East
Afri
can
Brib
ery
Inde
x
www.tikenya.org
It is imperative that institutions in the region scrutinise their service delivery mechanisms with a view to root out channels through which majority of the citizens are locked out of basic services thus promoting inequality and poverty. Transparency International-Kenya hopes that a deeper comparative study will be conducted in Rwanda to establish practices that have led to a negligible level of corruption.
The region will only firmly entrench itself on the path to economic and social development after inefficiencies necessitated by corruption are effectively confronted. Whether the 126 million residents of the bloc will fully enjoy the benefits of economic integration depends on how their governments respond to corruption and other governance challenges.
02

Tran
spar
ency
inte
rnat
iona
l - k
enya
Kenya
METHODOLOGY
The survey was conducted at the household level among 10,469 respondents across the five East African countries. The number of respondents in each country and administrative region were selected in proportion to the respective population size. Sampled households and respondents were picked through simple random sampling. The survey was structured around four key study questions:
Which institutions, both public and private, did you interact with in the last 12 i. months while seeking for services?Was a bribe expected or demanded during the interaction?ii. Did you pay and how much?iii. Did you receive the services sought after paying the bribe?iv.
The survey data was treated under five different indicators as enumerated below:
Indicator 1: Likelihood of encountering a bribery situationThis is the proportion of those who interacted with organisation X and a bribe was demanded and/or expected of them within the last 12 months.
Indicator 2: Prevalence of briberyThis is the proportion of those who interacted with organisation X and paid a bribe within the last 12 months.
Indicator 3: Impact of briberyThis is the proportion of those who interacted with organisation X and were provided with the service after paying a bribe that was demanded from them within the last 12 months.
03
East
Afri
can
Brib
ery
Inde
x
www.tikenya.org
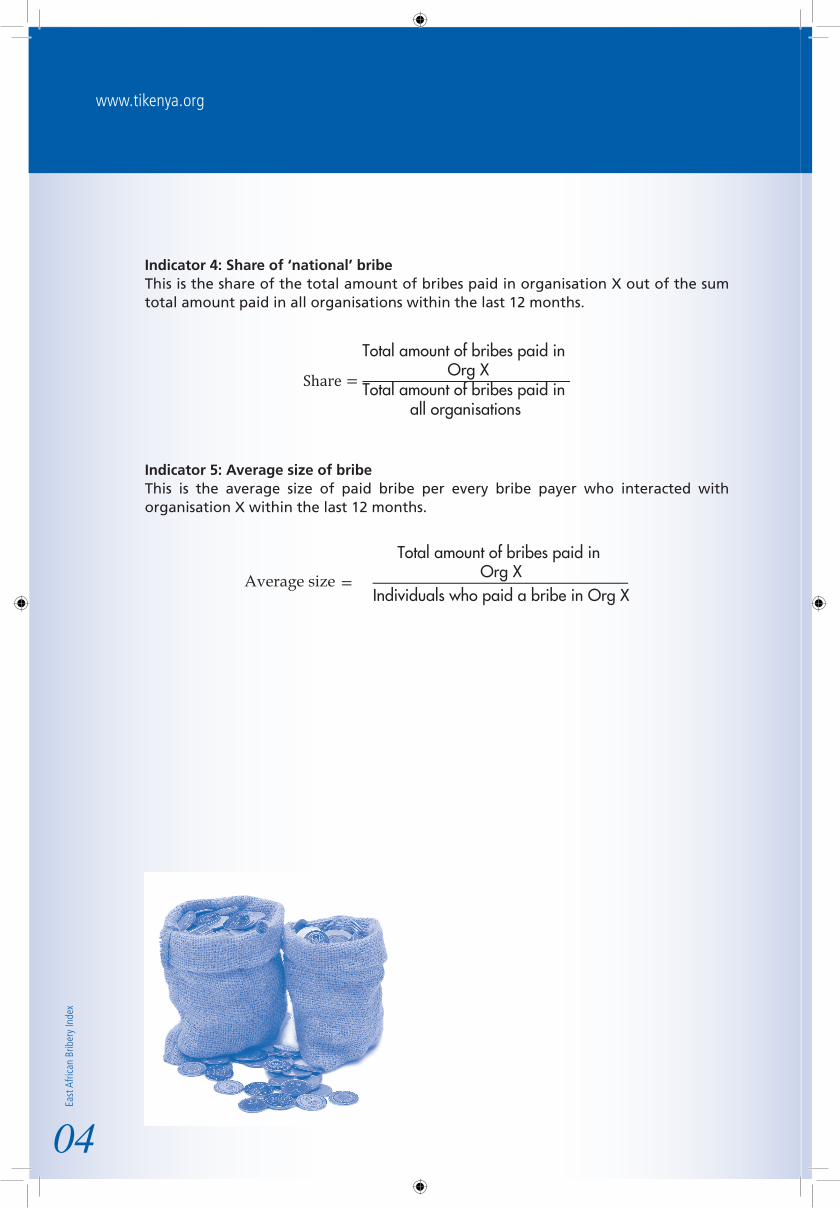
Indicator 4: Share of ‘national’ bribeThis is the share of the total amount of bribes paid in organisation X out of the sum total amount paid in all organisations within the last 12 months.
Indicator 5: Average size of bribeThis is the average size of paid bribe per every bribe payer who interacted with organisation X within the last 12 months.
04

Tran
spar
ency
inte
rnat
iona
l - k
enya
Kenya
CORRUPTION IN THE EAST AFRICAN REGION
KENYA
Since 2003, Kenya has made notable strides towards developing legislative and administrative measures to curb corruption in the public sector. These efforts followed the presidential commitment upon accession to office in December 2002 that corruption will cease to be a way of life.
Key legislation related to the fight against corruption that has been passed include the Anti Corruption and Economic Crimes Act, the Public Officers’ Ethics Act and the Public Procurement and Disposal Act. To further affirm its commitment in the war against graft, Kenya became the first country to sign and ratify the United Nations Convention Against Corruption in December 2003.
Corruption however remained a part of public practice as the wide array of institutions set up after 2002 to promote good governance were unable to compellingly tackle the vice coupled with a lack of genuine political goodwill to curb graft. In some instances, the founding legislation gave a limiting mandate on the same.
Several past corruption scandals for instance Goldenberg where the taxpayer lost US $ 600 million are yet to be resolved. The maize scandal involving the sale of subsidised maize that emerged in 2009 cost the country approximately US$ 26 million. Public officials adversely mentioned in the scandal were suspended from public office to facilitate investigations, but have since been reinstated although the details of the probe are yet to be made public.
Funds for the free education programme were also reportedly misappropriated to the tune of US$ 1 million, causing some donors to suspend their support to the programme. Some ministry officials have been charged in court, while the Permanent Secretary in the ministry was suspended but later reinstated in a different ministry after investigations into the matter.
Claims of corruption and misappropriation of public funds have not escaped the Ministry of Special Programmes which is supposed to lend the Kenyan Government a humane face. Corruption has slowed down the pace of resettlement for Kenyans who were displaced from their homes during the violence that erupted after the 2007 general elections. Two years after the violence broke out, several Kenyans are still in camps for the internally displaced or transit camps. In 2009, the Minister for Special Programmes dismissed an audit report prepared by the Office of the president which blamed the ministry for the loss of Sh200 million meant for the IDPs, arguing that it was meant to cover up the misdeeds of the Provincial Administration officials.
05

East
Afri
can
Brib
ery
Inde
x
www.tikenya.org
The pattern clearly shows that corruption continues to prevail in critical social sectors in the country, undermining the standard of living of several Kenyans. A proposed Constitution containing stronger accountability safeguards will be put to vote in August 2010. If passed, it is hoped that corruption incidents will drastically reduce paving the way for greater social and economic development.
TANZANIA
In 1992 Tanzania adopted multiparty politics aimed at eliminating monopoly in the political sphere. In 1995, Tanzania began the adoption of the Economic Recovery Programmes that aimed to eradicate state monopoly in the economy. There have since been a number of governance reforms aimed at improving organisational efficiency, personnel control and management, and capacity building across the realms of local government and regional administration, public sector management, legal and regulatory framework, and parastatals.
There have also been major policy and legal reforms initiated to strengthen governance institutions, structures and systems – to promote good governance and deter corruption. The notable reforms are the Public Sector Reform Programme (PSRP), Public Finance Management Reform Programme (PFMRP), Legal Sector Reform Programme (LSRP), Local Government Reform Programme (LGRP), National Anti-Corruption Strategy and Action Plans (NACSAP) I & II, Good Governance Coordination Unit (GGCU), the institutional strengthening of the Prevention and Combating of Corruption Bureau (PCCB), and the enactment of some specific legislation. The reforms equally respond to specific recommendations of the Presidential Commission of Inquiry Against Corruption, popularly known as, the “Warioba Report”.
Moreover, Tanzania has ratified the African Union Convention on Preventing and Combating Corruption (AU Convention), the United Nations Convention Against Corruption (UNCAC) and the Southern African Development Community Protocol Against Corruption (SADC) Protocol. Despite these efforts, evidence still paints a gloomy picture of the status of Tanzania’s good governance and anti-corruption efforts. The Tanzania Construction Sector Transparency Initiative (CoST) indicates rising incidents of corruption in the construction sector. The Tanzania Civil Engineering Contractors Association (TACECA) estimates that 90% of contractors pay between 10% to 15% of contract value in bribes. Moreover, in 2004, the Engineers Registration Board (ERB) and the Association of Consulting Engineers Tanzania (ACET) estimated that over 90% of construction contract awards and about 70% of consultancy assignments were secured
06

Tran
spar
ency
inte
rnat
iona
l - k
enya
Kenya
through corruption. The energy sector and the Bank of Tanzania have been under the media spotlight for over three years following implication in grand corruption scandals – including the grossly inflated and corruptly procured construction of the Bank of Tanzania’s Twin towers project, misappropriation of over USD 133 million in the External Payment Arrears (EPA) Account, and the corruptly procured emergency power service contract worth USD 173 million (Richmond LLC) among others. There have also been reports of high inefficiency and waste in HIV/AIDS programmes in Tanzania1 it was not clear how funds for these programmes were spent.
Government efforts therefore need to be evaluated and sharpened to improve service delivery and expedite the attainment of development goals.
UGANDA
The Inspectorate of Government, a statutory institution charged with the responsibility of fighting corruption in the country, in a 2009 report to parliament, acknowledged that corruption is increasing and is rampant in the public sector. The survey identified the Uganda Police, Kampala City Council, Land Office, Public Service (pension office), Judiciary, Uganda National Bureau of Standards, public health units, District Contracts Committees and Uganda Revenue Authority among the most corrupt public institutions. It identified the most prevalent forms of corruption in the country as bribery, embezzlement, extortion among others.
It also highlighted new methods devised by government officials to loot from public coffers. Among these methods is syndicate corruption, in which high ranking government officials connive with the private sector to overcharge or overbill the government and then share the loot with the payee.
Another method used by officials is delaying the execution of services to create a crisis and anxiety that will in turn necessitate urgency and justify the waiving of the prescribed procurement procedures. This was the case during the Commonwealth Heads of Government meeting in 2007 where colossal amounts of public funds were stolen in hurried procurements.
From the corruption incidents outlined above, it is clear that the anti-corruption legislation in Uganda have had little impact thus strengthening the cause to review them.
07

East
Afri
can
Brib
ery
Inde
x
www.tikenya.org
BURUNDI
Burundi has put in place several legal mechanisms to combat corruption. These include the creation of an anti-bribery squad, creation of a corruption court (loi no 1/36 du 13 décembre 2006 portant création de la cour anti-corruption), and laws on public procurement (Loi n°1/01 du 4 février 2008 portant Code des Marchés Publics du Burundi). This legislation seeks to enhance efficiency and transparency in procurement. It also demonstrates a commitment to eradicate graft in the public sector.
Despite these efforts, corruption is still rampant in Burundi’s public administration and service delivery sector. Non-governmental players like OLUCOME- Observatoire de lutte contre la corruption et les malversations economiques / Observatory for the Fight against Corruption and Economic embezzlement and ABUCO - Association Burundaise des Consommateurs/ Consumers Association of Burundi- attest to this through research findings and other anti-corruption initiatives. Studies and surveys done by the Economic and Development Institute (IDEC) such as the Stratégie Nationales de Gouvernance et de Lutte contre la corruption, 2009 show that 50% of business people were asked to pay bribes for public services. Seventy-six% of NGOs, 66% of business people, 54% of civil servants and 29% of citizens reported a high frequency of bribery in the national police force.
RWANDA
The Rwandan government has undertaken several legal and policy measures aimed at tackling corruption within the public and private sectors. Rwanda has also ratified the United Nations Convention against Corruption (UNCAC) and the African Union Convention on Preventing and Combating Corruption (AUCPCC)
Rwanda established an Ombudsman’s office in 2004 that monitors transparency and compliance to regulation in all governmental sectors. The Ombudsman has been instrumental in enforcing the government’s declaration on zero tolerance against corruption. It regularly exposes cases of fraud, malpractice and corruption at the top, middle and bottom levels of the public sector. This is evident through the stern action taken against a number of senior government officials implicated in corruption. In 2009, the Finance Director at the Presidency was suspended from office and sentenced to four years in prison following corruption allegations. He was further fined more
08

Tran
spar
ency
inte
rnat
iona
l - k
enya
Kenya
than one billion Rwandan Francs (USD 1.72 million). A former top civil servant in the infrastructure ministry was given a similar fine and a total of seven years in jail for involvement in corruption-related offences in government contracts. Elected officials have not been spared either, with over 20 of the 30 District Mayors in Rwanda removed from office for alleged mismanagement. The Ombudsman’s office is also responsible for reviewing the revenue declarations submitted by top government officials including the president.
09

East
Afri
can
Brib
ery
Inde
x
www.tikenya.org
THE EAST AFRICAN BRIBERY INDEX
No. COUNTRY CORRUPTION PREVALENCEBurundi 36.7%Uganda 33.0%Kenya 31.9%Tanzania 28.6%Rwanda 6.6%
Table 1: Country ranking of corruption prevalence
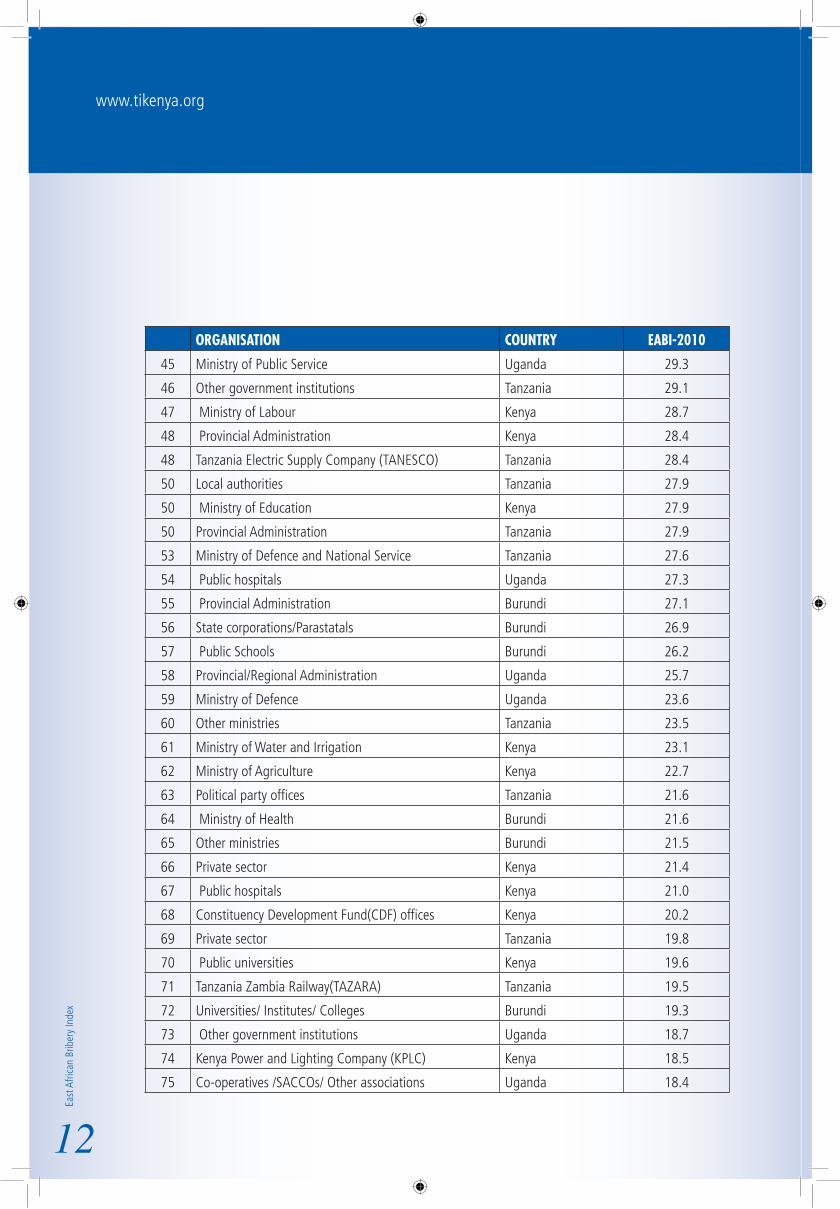
ORGANISATIONAL RANKING FOR THE EAST AFRICAN REGION
The index ranked all the adversely mentioned institutions in an integrated list of the organisations across the region. The ranking ranges from zero to one hundred with the higher figure indicating severe corruption. The individual institutional indices were normalised to reflect the different weights across the countries. The listed index below therefore differs with the index at the country level and should be used for comparison purposes only.
ORGANISATION COUNTRY EABI-2010
1 Revenue Authority /Customs Burundi 81.2
2 Burundi Police Burundi 75.0
3 Kenya Police Kenya 70.8
4 Uganda Revenue Authority Uganda 67.7
5 Tanzania Police Tanzania 65.1
6 Uganda Police Uganda 61.9
7 Ministry of State for Defence Kenya 59.2
8 Nairobi City Council Kenya 58.9
9 Judiciary Kenya 56.7
10 Judiciary Tanzania 56.4
11Régié de Production et Distribution d’Eau et d’Electricité (REGIDESO) Burundi 53.4
12 Ministry of Education Burundi 53.0
13 Ministry of Lands Kenya 51.3
10

Tran
spar
ency
inte
rnat
iona
l - k
enya
Kenya
ORGANISATION COUNTRY EABI-2010
14 Registrar of Persons Kenya 51.1
14 Kenya Prisons Service Kenya 51.1
16 Judiciary Burundi 48.6
17 Kenya Ports Authority (KPA) Kenya 48.5
18 Mulago Hospital Uganda 48.0
19 Uganda Prisons Service Uganda 47.7
20 Registrar of Births and Deaths Tanzania 46.7
21 Civil Service Burundi 44.8
22 Judiciary Uganda 44.7
23 Tanzania Prisons Service Tanzania 43.2
24 Local authorities Uganda 43.0
25 Department of Immigration Kenya 41.7
26 Ministry of Forestry and Wildlife Kenya 41.0
26 Umeme Uganda 41.0
28 Tanzania Ports Authority Tanzania 40.8
29 Kenya Revenue Authority (KRA) Kenya 40.2
30 Local authorities (n.e.s) Kenya 39.7
31 Local authorities Burundi 38.0
32 Tanzania Revenue Authority Tanzania 37.8
33 Ministry of Medical Services Kenya 37.7
34 Immigration Tanzania 37.2
35 Ministry of Youth Affairs and Sports Kenya 34.8
36 Teachers Service Commission(TSC) Kenya 34.7
37 Other ministries Kenya 34.3
38 Other unspecified organisations Tanzania 33.3
39 State corporations/Parastatals Kenya 33.0
40 Lands/Ministry of Lands Tanzania 32.8
41 Ministry of lands and human settlement development Tanzania 32.6
42 Other ministries Uganda 31.3
43 Ministry of Lands ,Housing and Urban Development Uganda 30.4
44 State corporations/Parastatals Uganda 30.2
11
East
Afri
can
Brib
ery
Inde
x
www.tikenya.org
ORGANISATION COUNTRY EABI-2010
45 Ministry of Public Service Uganda 29.3
46 Other government institutions Tanzania 29.1
47 Ministry of Labour Kenya 28.7
48 Provincial Administration Kenya 28.4
48 Tanzania Electric Supply Company (TANESCO) Tanzania 28.4
50 Local authorities Tanzania 27.9
50 Ministry of Education Kenya 27.9
50 Provincial Administration Tanzania 27.9
53 Ministry of Defence and National Service Tanzania 27.6
54 Public hospitals Uganda 27.3
55 Provincial Administration Burundi 27.1
56 State corporations/Parastatals Burundi 26.9
57 Public Schools Burundi 26.2
58 Provincial/Regional Administration Uganda 25.7
59 Ministry of Defence Uganda 23.6
60 Other ministries Tanzania 23.5
61 Ministry of Water and Irrigation Kenya 23.1
62 Ministry of Agriculture Kenya 22.7
63 Political party offices Tanzania 21.6
64 Ministry of Health Burundi 21.6
65 Other ministries Burundi 21.5
66 Private sector Kenya 21.4
67 Public hospitals Kenya 21.0
68 Constituency Development Fund(CDF) offices Kenya 20.2
69 Private sector Tanzania 19.8
70 Public universities Kenya 19.6
71 Tanzania Zambia Railway(TAZARA) Tanzania 19.5
72 Universities/ Institutes/ Colleges Burundi 19.3
73 Other government institutions Uganda 18.7
74 Kenya Power and Lighting Company (KPLC) Kenya 18.5
75 Co-operatives /SACCOs/ Other associations Uganda 18.4
12

Tran
spar
ency
inte
rnat
iona
l - k
enya
Kenya
ORGANISATION COUNTRY EABI-2010
76 Microfinance Institutions Tanzania 18.0
77 Private sector Uganda 17.9
78 Public universities Uganda 17.7
79 Other unspecified organisations Kenya 17.5
79 Universities/ Institutes/ Colleges Tanzania 17.5
81 Public colleges Kenya 17.2
82 Private sector Burundi 16.6
83 Public Hospitals Burundi 16.2
84 Water and Sewerage Companies Kenya 16.0
85 Co-operatives /SACCOs/ Other associations Kenya 15.5
86 NGOs/CBOs Burundi 15.3
87 Ustawi wa Jamii Tanzania 14.7
88 Ministry of Water and Irrigation Tanzania 14.4
89 Banks/Insurance Burundi 14.1
90 National Social Security Fund (NSSF) Uganda 14.0
91 National Water and Sewerage Company Uganda 13.8
92 Health Insurance/Other insurance Tanzania 13.2
93 Schools Tanzania 12.7
93 Public schools Uganda 12.7
95 International Organisations Uganda 12.5
96 Banks Tanzania 12.1
97 Co-operatives /SACCOs/ Other associations Tanzania 11.6
98 National Social Security Fund (NSSF) Tanzania 11.0
99 Private hospitals Uganda 10.9
100 Colleges Uganda 10.2
101 NGOs/CBOS Kenya 10.0
102 Postal Corporation Burundi 9.9
103 Public schools Kenya 9.7
104 Microfinance institutions Uganda 9.5
105 International organisations/Embassies Burundi 9.1
106 Co-operatives /SACCOs/ Other associations Burundi 8.7
13

East
Afri
can
Brib
ery
Inde
x
www.tikenya.org
ORGANISATION COUNTRY EABI-2010
107 Banks Uganda 8.6
108 International organisations Kenya 8.5
109 NGOs/CBOs Tanzania 8.2
109 Private schools Uganda 8.2
111 NGOs/CBOs Uganda 8.0
112Dar es Salaam Water and Sewerage Company (DAWASCO) Tanzania 6.5
113 Private hospitals Kenya 6.3
114 Religious organisations Tanzania 6.2
115 Postal Corporation Tanzania 2.6
116 Religious organisations Burundi 1.9
Table 2: Aggregate index of bribery-prone institutions in the East African region
14

Tran
spar
ency
inte
rnat
iona
l - k
enya
Kenya
KENYASAMPLE CHARACTERISTICSThe survey was conducted at the household level among a sample population of 3,022 people randomly picked across all the eight provinces. The sample consisted of 52.3% and 47.7% male and female respondents respectively. 65.8% % of the respondents were sampled from the rural areas while 34.2% were urban residents.
Distribution of respondents by province
Province Actual count % of sampleRift Valley 806 26.7%
Eastern 430 14.2%
Nyanza 385 12.7%
Nairobi 368 12.2%
Central 326 10.8%
Western 313 10.4%
Coast 272 9.0%
North Eastern 122 4.0%
Total 3022 100.0%
Table 3: Distribution of respondents by province - Kenya
Sample distribution by gender
Fig 1: Sample distribution by gender - Kenya
15

East
Afri
can
Brib
ery
Inde
x
www.tikenya.org
Sample distribution by residence
Fig 2: Distribution by residence - Kenya
Sample distribution by ageSlightly more than 60% of the sample was aged between 18 and 34 years. The age bracket of 18 to 24 years had a higher representation in the urban than rural areas. About 10% of the sample was above 50 years with a slightly higher representation in the rural areas.
Age Category National Urban Rural18-24 20.7% 24.4% 18.8%
25-29 25.4% 25.4% 25.4%
30-34 16.2% 16.6% 16.1%
35-39 11.6% 10.0% 12.5%
40-44 9.7% 9.4% 9.8%
45-49 5.7% 5.7% 5.7%
50-54 4.5% 4.0% 4.8%
55-59 2.9% 2.1% 3.3%
Table 4: Sample distribution by age - Kenya
Sample distribution by employment status79% of the respondents were employed either in the private or public sector.21% were fulltime students, unemployed or retired.
Employment status National Urban RuralStudent 8.2% 5.8% 9.5%
Unemployed 11.2% 12.2% 10.6%
Self-employed 39.4% 40.6% 38.8%
16

Tran
spar
ency
inte
rnat
iona
l - k
enya
Kenya
Employed in a family business or farm 10.3% 10.0% 10.4%
Employed in the private sector 15.9% 20.0% 13.8%
Employed by the government/local authority or parastatal 10.3% 7.7% 11.6%
Employed in the community sector e.g. church, N.G.O, co-operative 2.8% 2.3% 3.1%
Retired 1.9% 1.4% 2.2%
Table 5: Sample distribution by employment status - Kenya
Education level of the respondentsMajority of the respondents (about 80%) reported that they had attained either secondary or college level education. About 11% reported that they had attained university education or above.
Level of Education National Urban RuralPrimary education 14.4% 9.1% 17.2%Post-primary training 4.3% 4.2% 4.4%Secondary education 38.8% 38.4% 39.0%College education 31.0% 36.7% 28.0%University education 10.6% 10.5% 10.6%Post-graduate degree 1.0% 1.2% 0.9%
Table 6: Education level of the respondents - Kenya
Distribution of the respondents by household incomeAbout 36% of the Kenyan respondents reported a household monthly income of less than Ksh 5,000. This income bracket was more prominent in the rural areas than in the urban centers with recorded values of 39.2% and 29.2% respectively.
Household Income (Ksh) National Urban Rural Less than 5,000 35.7% 29.2% 39.2%5,000-9,999 25.9% 28.0% 24.8%10,000-24,999 23.0% 23.7% 22.6%25,000-49,999 9.9% 12.2% 8.8%50,000-99,999 3.2% 3.4% 3.1%100,000-150,999 0.7% 0.7% 0.7%Over Ksh 151,000 0.5% 0.7% 0.4%Declined to answer 1.1% 2.2% 0.6%
Table 7: Sample distribution by household income - Kenya 17

East
Afri
can
Brib
ery
Inde
x
www.tikenya.org
OVERVIEW OF THE FINDINGSThe survey recorded 12,429 interactions with service delivery institutions among the sampled respondents in the last one year. Out of these interactions, bribes were expected or demanded during 37.5% of the dealings; bribes were paid in 58% of the bribery incidents. Out of a total of 1,499 respondents who reported paying bribes, 927 (61.8%) were men while 572 (38.2%) were women.
Bribes were distributed among different purposes as follows:
Purpose of bribe Proportion of total respondentsRegulatory 28.1%Services 27.4%Law enforcement 26.6%Employment 10.6%Business 4.9%Others 2.4%
Table 8: Purpose of bribe - Kenya
REPORTING OF BRIBERY CASESThe survey sought to establish the proportion of the respondents who reported incidents of bribery. Reporting in this context is the forwarding of bribery cases to people in a position of authority with the expectation that action will be taken against the corrupt official.About 89% of the respondents did not report cases of bribery to any person in authority. Of the 11% who reported majority (40.8%) reported to the management of the respective institutions with 11% and 4.9% reporting to the police and the Office of the Ombudsman (Public Complaints Standing Committee) respectively.
Fig 3: Reporting of corruption cases - Kenya
18

Tran
spar
ency
inte
rnat
iona
l - k
enya
Kenya
Reasons for not reporting bribery cases Respondents cited various reasons for not filing bribery cases. Majority (35.6%) felt no action would be taken against the corrupt official. While about a quarter of the respondents did not know where to report such cases.
Reasons for not reporting Proportion of Total RespondentsNo action would be taken even if I reported 35.6%Other reasons/ Withheld 24.0%I didn’t know where to report 23.5%Fear of intimidation 16.8%
Table 9: Reasons for not reporting bribery cases - Kenya
ORGANISATIONAL RANKINGThe index ranking was similar to that of 2009, apart from the listing of the Kenya Prisons Service and the Kenya Ports Authority. Four of the top five worst performers of 2009 retained their adverse listing albeit with minor realignments. The main entrants and exits in the 2010 index are as follows:
EXITS FROM THE INDEX ENTRANTS INTO THE INDEXNational Social Security Fund (NSSF) Kenya Prisons Service National Health Insurance Fund (NHIF) Kenya Ports Authority (KPA)Ministry of Public works Ministry of Forestry and Wildlife
Ministry of Youth Affairs and Sports
Table 10: Exits and Entrants in the 2010 index - Kenya
THE 2010 AGGREGATE INDEX- KENYAThe aggregate index is derived from a combination of all the individual indicators. The index is a derivation of the following individual components- likelihood of bribery, prevalence of bribery, average size of bribe, share of bribery and size of bribery. Institutional ranking is based on a score of between one and 100 (100 being the most unfavourable). The index has dropped two indicators from the 2009 list. The results may therefore not be perfectly comparable.
19

East
Afri
can
Brib
ery
Inde
x
www.tikenya.org
Aggregate index- Kenya2
Rank Organisation EABI 2010 EABI 2009 Previous Rank -2009
1 Kenya Police 77.7 66.5 1
2 Nairobi City Council 61.0 42.9 4
3 Ministry of State for Defence 60.8 61.9 2
4 Judiciary 59.3 54.4 3
5 Ministry of Lands 53.3 45.6 5
6 Registrar of Persons 52.7 36.3 12
7 Kenya Prisons Service 52.2 - -
8 Kenya Ports Authority (KPA) 49.2 - -
9 Ministry of Immigration 42.1 39.6 9
10 Ministry of Forestry and Wildlife 41.2 - -
11 Local authorities (n.e.s) 40.7 38.3 11
12 Kenya Revenue Authority (KRA) 40.7 38.3 10
13 Ministry of Medical Services 37.4 21.4 22
14 Teachers Service Commission(TSC) 34.1 35.8 13
15 Ministry of Youth Affairs and Sports 34.1 - -
16 Other ministries 34.0 25 19
17 State Corporations/Parastatals 32.7 27.8 16
18 Provincial Administration 27.8 31.6 15
19 Ministry of Labour 27.2 41.7 7
20 Ministry of Education 26.7 26.4 17
21 Ministry of Water and Irrigation 21.4 33.5 14
22 Ministry of Agriculture 20.9 16.7 30
23 Private sector 20.5 25.3 18
24 Public hospitals 20.0 16.9 29
25 Constituency Development Fund (CDF) offices 18.1 17.7 25
26 Public universities 17.5 21.3 23
27 Kenya Power and Lighting Company (KPLC) 16.4 22.7 21
28 Other unspecified organisations 15.2 20.8 24
29 Public colleges 14.8 13.4 31
30 Water and Sewerage Companies 13.6 12.3 33
31 Co-operatives/SACCOs/Other associations 13.0 23.9 20
32 NGOs/CBOs 7.0 10.9 35
2 The index has dropped two indicators from last year’s list. The results may therefore not be perfectly comparable
20

Tran
spar
ency
inte
rnat
iona
l - k
enya
Kenya
Rank Organisation EABI 2010 EABI 2009 Previous Rank -2009
33 Public schools 6.8 12 34
34 International organisations 5.1 9.7 37
35 Private hospitals 3.0 13 32
Table 11: Aggregate index - Kenya.
LIKELIHOOD OF BRIBERYThis indicator represents the proportion of respondents that were overtly asked for a bribe or indirectly expected to pay a bribe in a particular institution as a percentage of the total number of respondents who reported seeking services from that institution. The notable change in this indicator compared to that of 2009 is the ranking of the Nairobi City Council in the first position from number 11 in 2009. The Kenya Prisons Service and the Ministry of Youth Affairs and Sports which were absent in the 2009 index, are among the top ten adversely mentioned institutions in this indicator.
Rank Organisation EABI 2010 EABI 2009 Previous Rank -2009
1 Nairobi City Council 84.5 64.5 11
2 Kenya Police 76.9 85.5 2
3 Ministry of State for Defence 72.2 84.0 4
4 Kenya Prisons Service 71.9 - -
5 Judiciary 70.1 86.1 1
6 Ministry of Lands 69.1 77.7 5
7 Ministry of Youth Affairs and Sports 68.1 - -
8 Registrar of Persons 66.8 70.9 7
9 Ministry of Forestry and Wildlife 65.9 - -
10 Kenya Ports Authority (KPA) 65.5 - -
11 Department of Immigration 63.0 63.1 12
12 Ministry of Medical Services 59.2 37.3 22
13 Other ministries 56.3 47.8 17
14 Kenya Revenue Authority (KRA) 55.7 57.0 14
15 Teachers Service Commission (TSC) 53.7 66.7 9
16 State Corporations/Parastatals 50.6 44.3 18
17 Local authorities (n.e.s) 50.4 61.3 13
18 Provincial Administration 46.1 53.3 15
19 Ministry of Education 45.9 52.9 16
20 Ministry of Labour 45.0 84.4 3
21

East
Afri
can
Brib
ery
Inde
x
www.tikenya.org
Rank Organisation EABI 2010 EABI 2009 Previous Rank - 2009
21 Constituency Development Fund (CDF) Offices 42.3 37.5 21
22 Ministry of Water and Irrigation 39.1 68.8 8
23 Ministry of Agriculture 35.3 27.3 29
24 Public hospitals 29.5 18.1 32
25 Public universities 29.1 32.6 26
26 Kenya Power and Lighting Company (KPLC) 28.5 34.8 24
27 Private sector 28.4 35.6 23
28 Public colleges 27.7 21.0 31
29 Co-operatives/SACCOs/Other associations 27.7 40.0 20
30 Other unspecified organisations 26.5 40.6 19
31 Water and Sewerage Companies 25.5 17.0 35
32 NGOs/CBOS 19.4 17.0 34
33 International organisations 18.0 13.6 36
34 Public schools 14.6 18.1 33
35 Private hospitals 12.3 20.3 32
Table 12: Likelihood of bribery - Kenya
PREVALENCE OF BRIBERYThis indicator represents the proportion of the respondents that actually paid bribes to an institution compared to the total number of respondents that sought services from the institution. It is instructive to note that prevalence measures only a portion of those who were in an actual bribery situation. A notable change in this indicator in comparison to that of 2009 is the ranking of the Kenya Prisons Service and the Kenya Ports Authority in position five and six respectively. The two were not listed in this indicator in 2009.
Rank Organisation EABI 2010 EABI 2009 Previous Rank - 2009
1 Nairobi City Council 58.6 44.3 5
2 Kenya Police 54.4 63.4 1
3 Registrar of Persons 48.5 38.4 9
4 Judiciary 47.8 57.8 2
5 Kenya Prisons Service 46.9 - -
6 Kenya Ports Authority (KPA) 44.8 - -
7 Ministry of Lands 42.0 46.0 4
22

Tran
spar
ency
inte
rnat
iona
l - k
enya
Kenya
Rank Organisation EABI 2010 EABI 2009 Previous Rank - 2009
8 Department of Immigration 35.7 49.4 3
9 Kenya Revenue Authority (KRA) 35.6 44.0 6
10 Ministry of State for Defence 35.2 28.4 15
11 Ministry of Medical Services 34.7 27.5 16
12 Ministry of Forestry and Wildlife 34.1 - -
13 Ministry of Youth Affairs and Sports 34.0 - -
14 Local Authorities (n.e.s) 33.9 41.2 7
15 State Corporations/Parastatals 28.2 17.8 23
16 Teachers Service Commission (TSC) 27.8 29.2 14
17 Other ministries 25.7 18.5 22
18 Ministry of Labour 25.0 31.3 12
19 Provincial Administration 23.1 31.0 13
20 Ministry of Agriculture 19.1 14.4 30
21 Ministry of Water and Irrigation 18.8 31.3 11
22 Ministry of Education 18.0 16.1 24
23 Kenya Power and Lighting Company (KPLC) 16.3 22.1 18
24 Public universities 16.2 19.6 19
25 Constituency Development Fund (CDF) Offices
15.58.3 35
26 Public hospitals 15.1 14.6 26
27 Private sector 14.6 15.0 25
28 Other unspecified organisations 14.3 18.8 20
29 Public colleges 13.9 10.1 33
30 Water and Sewerage Companies 12.7 10.4 32
31 Co-operatives/SACCOs/Other associations 12.0 33.3 10
32 Public schools 8.2 7.8 36
33 NGO/CBO’S 7.8 13.0 29
34 International organisations 6.0 10.9 31
35 Private hospitals 5.1 13.8 27
Table 13: Prevalence of bribery - Kenya
IMPACT OF BRIBERYThe indicator is a measure of the percentage of respondents who visited a particular institution and only secured the requested service upon the payment of a bribe. The Kenya Police maintained the first position in this indicator, with the Kenya Prisons Service and the Kenya Ports Authority being new entrants. The Department of Immigration dropped from the third to tenth position. 23

East
Afri
can
Brib
ery
Inde
x
www.tikenya.org
Rank Organisation EABI 2010 EABI 2009 Previous Rank - 2009
1 Kenya Police 50.4 59.2 1
2 Nairobi City Council 46.6 41.0 6
3 Registrar of Persons 46.3 36.0 8
4 Judiciary 43.3 54.9 2
5 Kenya Prisons Service 40.6 - -
6 Kenya Ports Authority (KPA) 37.9 - -
7 Ministry of Lands 37.2 43.2 5
8 Ministry of Forestry and Wildlife 34.1 - -
9 Kenya Revenue Authority (KRA) 33.9 44.0 4
10 Department of Immigration 33.8 44.4 3
11 Ministry of Medical Services 30.6 23.5 13
12 Local authorities (n.e.s) 30.5 39.6 7
13 Teachers Service Commission (TSC) 25.9 29.2 10
14 Other ministries 22.2 15.2 22
15 State Corporations/Parastatals 21.8 15.7 21
16 Provincial Administration 19.8 27.5 12
17 Ministry of Water and Irrigation 18.8 31.3 9
18 Ministry of Youth Affairs and Sports 17.0 - -
19 Ministry of Agriculture 16.2 11.4 30
20 Ministry of Education 15.8 16.1 20
21 Ministry of Labour 15.0 28.1 11
22 Kenya Power and Lighting Company( KPLC) 14.7 20.9 14
23 Public universities 14.5 19.6 18
24 Other unspecified organisations 14.3 12.5 26
25 Public hospitals 14.2 13.7 23
26 Ministry of State for Defence 13.0 12.3 27
27 Water and Sewerage Companies 12.7 10.4 31
28 Co-operatives/SACCOs/Other associations 12.0 20.0 15
29 Public colleges 9.6 9.2 32
30 Constituency Development Fund (CDF) offices 9.2 8.3 34
31 Private sector 8.8 12.3 28
32 Public schools 7.5 7.1 35
33 NGOs/CBOs 5.3 12.0 29
34 Private hospitals 4.9 13.4 24
35 International organisations 0.0 9.1 33
Table 14: Impact of bribery - Kenya24

Tran
spar
ency
inte
rnat
iona
l - k
enya
Kenya
AVERAGE SIZE OF BRIBE The indicator is a measure of the average payment made by those respondents who reported paying a bribe to a particular institution. This average sum must be interpreted within the shortcomings of the mean as a statistical measure.The Ministry of State for Defence maintained the top position in this indicator; the Ministry of Labour and the Kenya Ports Authority were also among the top five adversely mentioned institutions. The total average for the top five institutions rose by about 27% from a total of Kshs 76,481 in the previous index to 96, 974.
Rank Organisation EABI 2010 EABI 2009 Previous Rank - 2009
1 Ministry of State for Defence 53,500.00 42,000.00 1
2 Ministry of Labour 11,280.00 7,330.00 4
3 Ministry of Education 11,179.17 6,828.57 6
4 Judiciary 11,046.69 5,627.05 11
5 Kenya Ports Authority (KPA) 9,969.23 - -
6 Ministry of Lands 8,973.56 4,058.59 15
7 Kenya Prisons Service 8,393.33 - -
8 Teachers Service Commission (TSC) 7,946.67 1,742.86 29
9 Other ministries 7,528.60 1,491.18 32
10 International organisations 7,166.67 2,075.00 25
11 Private sector 7,002.96 6,405.45 7
12 Public colleges 5,963.04 5,991.67 9
13 Ministry of Agriculture 5,847.69 1,800.00 28
14 Public universities 5,363.16 5,944.44 10
15 Other unspecified organisations 4,542.86 1,600.00 31
16 State Corporations/Parastatals 4,513.59 6,989.39 5
17 Kenya Police 4,434.07 3,179.85 19
18 Department of Immigration 4,212.73 3,279.46 18
19 Ministry of Forestry and Wildlife 4,146.67 - -
20Constituency Development Fund (CDF) Offices 3,941.00 2,125.00 23
21 Water and Sewerage Companies 3,838.46 1,836.36 27
22 Local authorities (n.e.s) 3,527.61 2,275.19 21
23 Kenya Revenue Authority (KRA) 3,327.36 4,734.09 13
24 Nairobi City Council 3,155.44 4,284.27 14
25 Ministry of Water and Irrigation 2,916.67 1,440.00 33
26 NGOs/CBOs 2,872.00 2,303.85 20
25

East
Afri
can
Brib
ery
Inde
x
www.tikenya.org
Rank Organisation EABI 2010 EABI 2009 Previous Rank - 2009
27 Ministry of Medical Services 2,571.76 1,310.00 37
28Co-operatives/SACCOs/Other as-sociations 2,515.00 10,900.00 2
29 Public hospitals 2,428.66 1,339.06 35
30 Ministry of Youth Affairs and Sports 2,271.88 - -
31Kenya Power and Lighting Company (KPLC) 2,243.40 3,304.00 17
32 Registrar of Persons 2,197.13 1,038.64 39
33 Public schools 1,928.87 2,252.06 22
34 Provincial Administration 1,720.56 1,317.15 36
35 Private hospitals 1,395.00 1,910.50 26
Table 15: Average size of bribery - Kenya
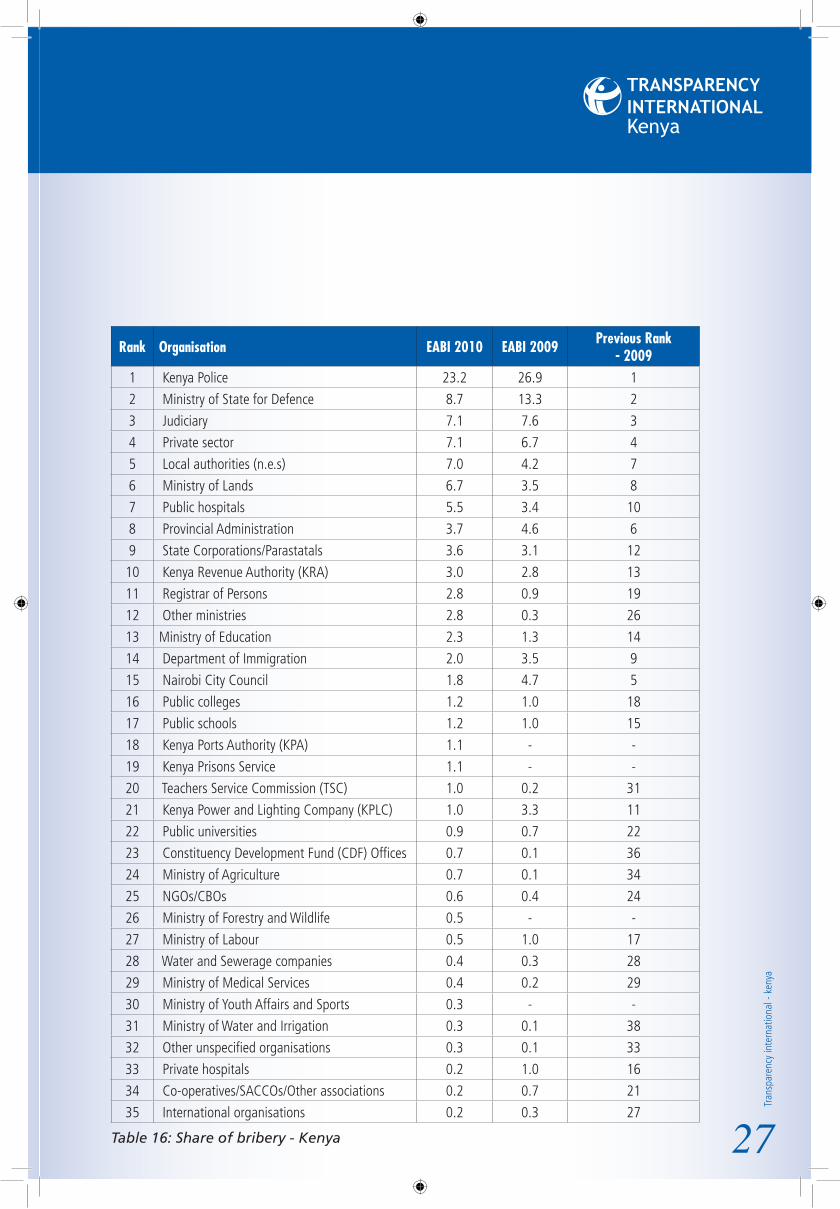
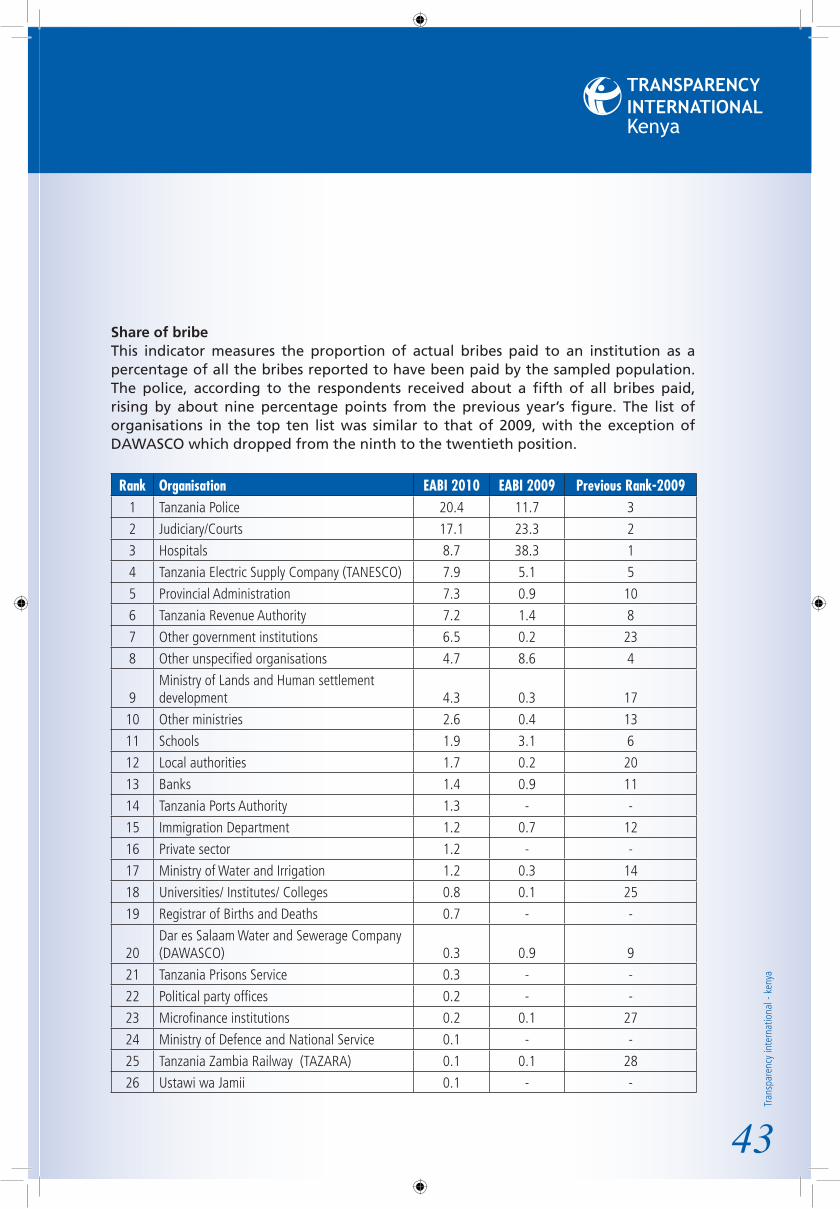
SHARE OF BRIBERYThis indicator measures the proportion of actual bribes paid to an institution as a percentage of all the bribes reported to have been paid by the sampled population. High entries maybe attributed to either of the following –
Higher frequency of interaction with the listed institutions.•Higher coercive power to extract bribes/ higher perception of individual’s risk •upon failure to pay a bribe.Economic or other forms of value attached to the services sought.•
The Kenya Police accounted for 23% of all the bribes paid by the respondents. This is a decline from 27% recorded in 2009. The standings of the five worst performers remained unchanged with the exception of the Nairobi City council whose listing under this indicator dropped to position 15 from position 5 in the previous year.
26
Tran
spar
ency
inte
rnat
iona
l - k
enya
Kenya
Rank Organisation EABI 2010 EABI 2009 Previous Rank - 2009
1 Kenya Police 23.2 26.9 1
2 Ministry of State for Defence 8.7 13.3 2
3 Judiciary 7.1 7.6 3
4 Private sector 7.1 6.7 4
5 Local authorities (n.e.s) 7.0 4.2 7
6 Ministry of Lands 6.7 3.5 8
7 Public hospitals 5.5 3.4 10
8 Provincial Administration 3.7 4.6 6
9 State Corporations/Parastatals 3.6 3.1 12
10 Kenya Revenue Authority (KRA) 3.0 2.8 13
11 Registrar of Persons 2.8 0.9 19
12 Other ministries 2.8 0.3 26
13 Ministry of Education 2.3 1.3 14
14 Department of Immigration 2.0 3.5 9
15 Nairobi City Council 1.8 4.7 5
16 Public colleges 1.2 1.0 18
17 Public schools 1.2 1.0 15
18 Kenya Ports Authority (KPA) 1.1 - -
19 Kenya Prisons Service 1.1 - -
20 Teachers Service Commission (TSC) 1.0 0.2 31
21 Kenya Power and Lighting Company (KPLC) 1.0 3.3 11
22 Public universities 0.9 0.7 22
23 Constituency Development Fund (CDF) Offices 0.7 0.1 36
24 Ministry of Agriculture 0.7 0.1 34
25 NGOs/CBOs 0.6 0.4 24
26 Ministry of Forestry and Wildlife 0.5 - -
27 Ministry of Labour 0.5 1.0 17
28 Water and Sewerage companies 0.4 0.3 28
29 Ministry of Medical Services 0.4 0.2 29
30 Ministry of Youth Affairs and Sports 0.3 - -
31 Ministry of Water and Irrigation 0.3 0.1 38
32 Other unspecified organisations 0.3 0.1 33
33 Private hospitals 0.2 1.0 16
34 Co-operatives/SACCOs/Other associations 0.2 0.7 21
35 International organisations 0.2 0.3 27
Table 16: Share of bribery - Kenya 27
East
Afri
can
Brib
ery
Inde
x
www.tikenya.org
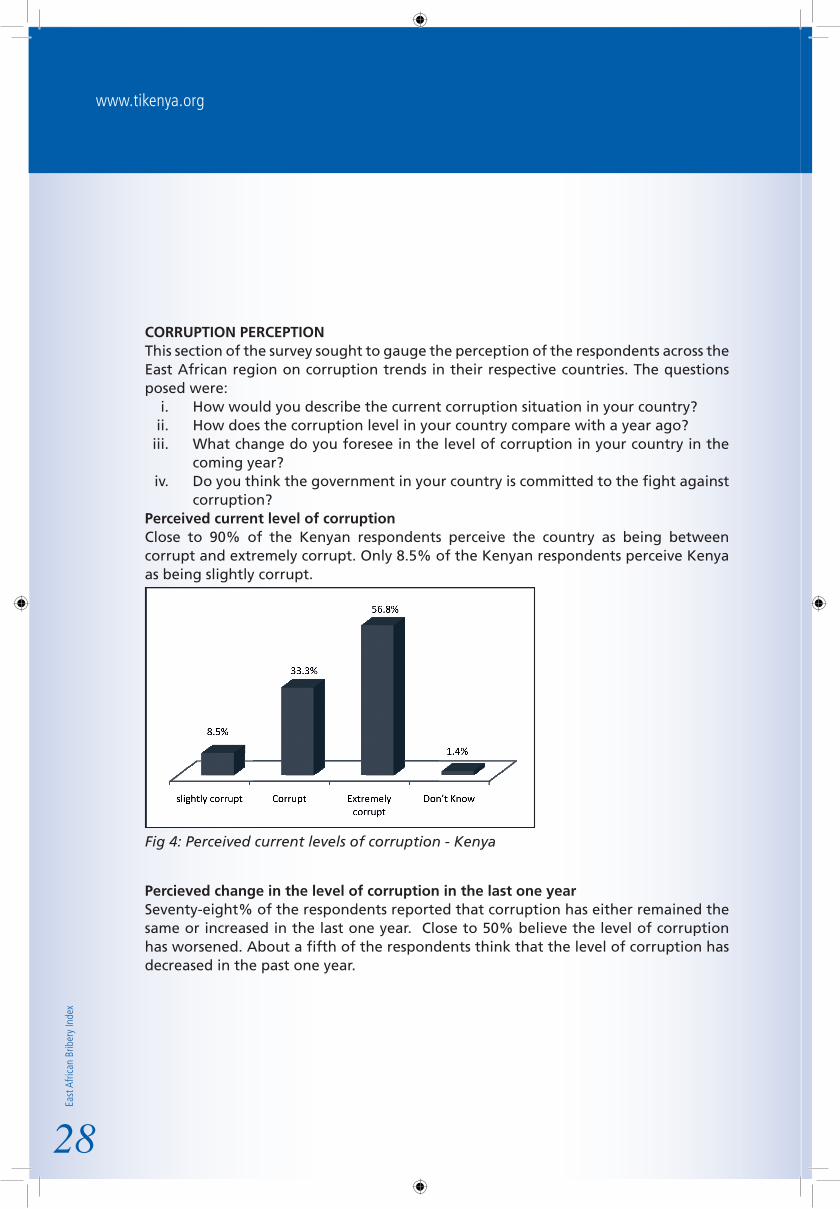
CORRUPTION PERCEPTIONThis section of the survey sought to gauge the perception of the respondents across the East African region on corruption trends in their respective countries. The questions posed were:
How would you describe the current corruption situation in your country?i. How does the corruption level in your country compare with a year ago?ii. What change do you foresee in the level of corruption in your country in the iii. coming year?Do you think the government in your country is committed to the fight against iv. corruption?
Perceived current level of corruptionClose to 90% of the Kenyan respondents perceive the country as being between corrupt and extremely corrupt. Only 8.5% of the Kenyan respondents perceive Kenya as being slightly corrupt.
Fig 4: Perceived current levels of corruption - Kenya
Percieved change in the level of corruption in the last one yearSeventy-eight% of the respondents reported that corruption has either remained the same or increased in the last one year. Close to 50% believe the level of corruption has worsened. About a fifth of the respondents think that the level of corruption has decreased in the past one year.
28

Tran
spar
ency
inte
rnat
iona
l - k
enya
Kenya
Fig 5: Perceived change in corruption levels in the past one year - Kenya
Projected level of corruption in Kenya in the next one year68% of the respondents feel the corruption levels will either rise or remain the same in the next one year. This reflects increased optimism among Kenyans compared to the previous year. EABI 2009 reported that 62.4% of the sample population said that the level of corruption was likely to increase with only 11.3% hoping for a decline. Close to 20% of the respondents in 2010 project a decline in the level of corruption in the coming year.
Fig 6: Projected level of corruption in the next one year - Kenya
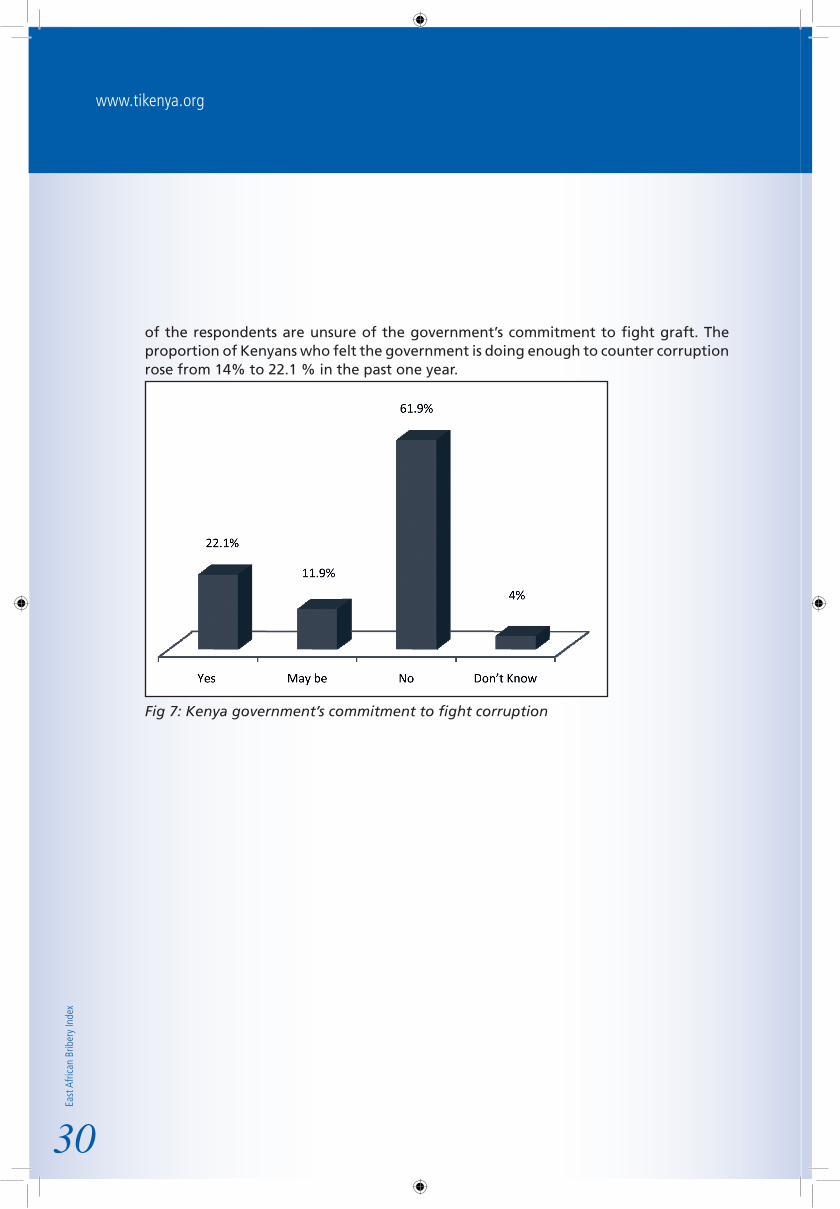
Government’s commitment to fight corruptionAbout 70% of the sampled population felt the Kenyan government is not taking sufficient action to combat corruption; this is a decline from 86% in the previous year. The difference maybe attributed to increased optimism and the fact that about 12%
29
East
Afri
can
Brib
ery
Inde
x
www.tikenya.org
of the respondents are unsure of the government’s commitment to fight graft. The proportion of Kenyans who felt the government is doing enough to counter corruption rose from 14% to 22.1 % in the past one year.
Fig 7: Kenya government’s commitment to fight corruption
30

Tran
spar
ency
inte
rnat
iona
l - k
enya
Kenya
TANZANIASAMPLE CHARACTERISTICSThe survey sampled a total of 3,231 respondents across 21 administrative provinces. 57.5% of the respondents were male while 42.5% were female. Slightly more than a half of the respondents (51%) were rural residents while 49% were drawn from the urban areas.
Distribution of respondents by province
Region Actual count NationalDar es Salaam 356 11.0%Kagera 344 10.6%Kilimanjaro 261 8.1%Mwanza 253 7.8%Arusha 237 7.3%Singida 175 5.4%Morogoro 171 5.3%Mara 170 5.3%Iringa 165 5.1%Coast 129 4.0%Ruvuma 121 3.8%Mbeya 113 3.5%Tabora 90 2.8%Mjini Magharibi 90 2.8%Tanga 88 2.7%Mtwara 88 2.7%Kigoma 87 2.7%Lindi 85 2.6%Manyara 83 2.6%Dodoma 64 2.0%Pemba 61 1.9%Total 3231 100%
Table 17: Distribution of respondents by province - Tanzania
31

East
Afri
can
Brib
ery
Inde
x
www.tikenya.org
Sample distribution by gender
Fig 8: Sample distribution by gender - Tanzania
Sample distribution by residence
Fig 9: Sample distribution by residence - Tanzania
32
Tran
spar
ency
inte
rnat
iona
l - k
enya
Kenya
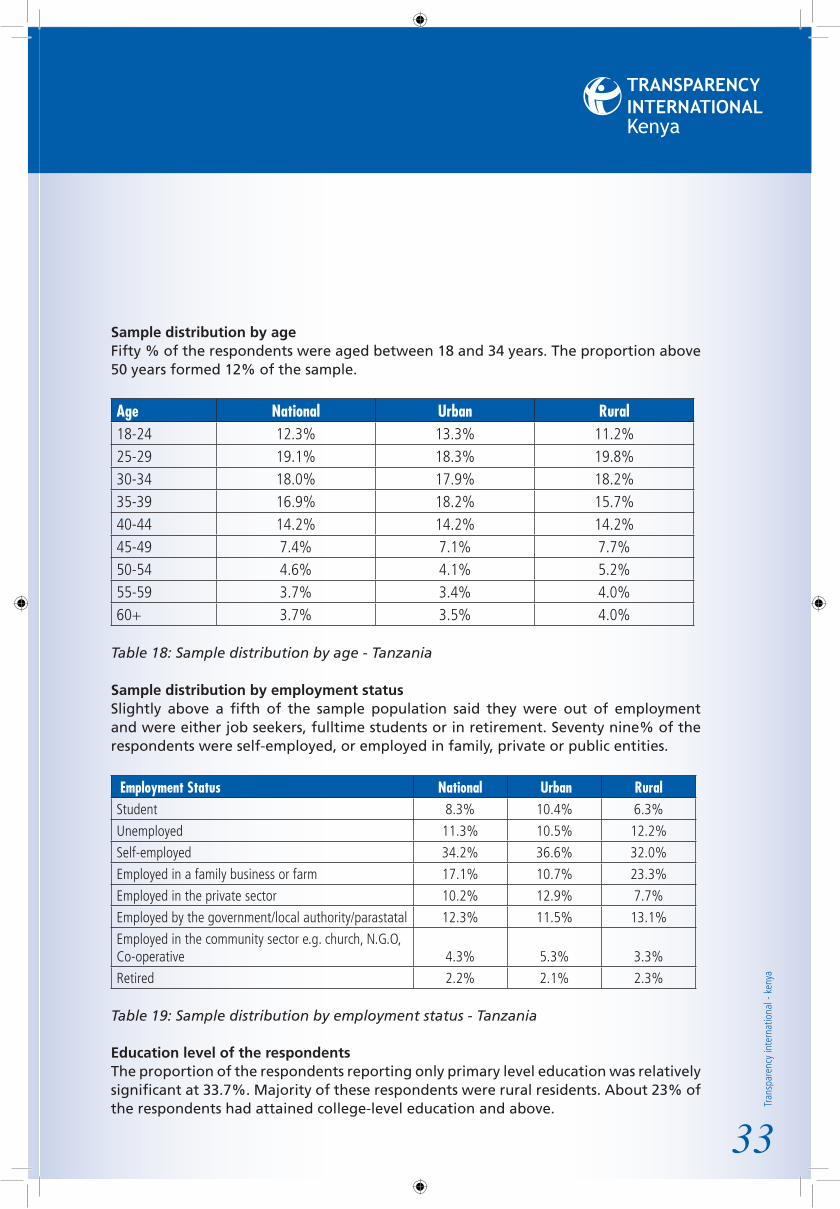
Sample distribution by ageFifty % of the respondents were aged between 18 and 34 years. The proportion above 50 years formed 12% of the sample.
Age National Urban Rural18-24 12.3% 13.3% 11.2%25-29 19.1% 18.3% 19.8%30-34 18.0% 17.9% 18.2%35-39 16.9% 18.2% 15.7%40-44 14.2% 14.2% 14.2%45-49 7.4% 7.1% 7.7%50-54 4.6% 4.1% 5.2%55-59 3.7% 3.4% 4.0%60+ 3.7% 3.5% 4.0%
Table 18: Sample distribution by age - Tanzania
Sample distribution by employment statusSlightly above a fifth of the sample population said they were out of employment and were either job seekers, fulltime students or in retirement. Seventy nine% of the respondents were self-employed, or employed in family, private or public entities.
Employment Status National Urban Rural Student 8.3% 10.4% 6.3%
Unemployed 11.3% 10.5% 12.2%
Self-employed 34.2% 36.6% 32.0%
Employed in a family business or farm 17.1% 10.7% 23.3%
Employed in the private sector 10.2% 12.9% 7.7%
Employed by the government/local authority/parastatal 12.3% 11.5% 13.1%
Employed in the community sector e.g. church, N.G.O, Co-operative 4.3% 5.3% 3.3%
Retired 2.2% 2.1% 2.3%
Table 19: Sample distribution by employment status - Tanzania
Education level of the respondentsThe proportion of the respondents reporting only primary level education was relatively significant at 33.7%. Majority of these respondents were rural residents. About 23% of the respondents had attained college-level education and above.
33

East
Afri
can
Brib
ery
Inde
x
www.tikenya.org
Level of education National Urban RuralPrimary school 33.7% 23.6% 43.4%Post-primary training 12.6% 11.3% 13.8%Secondary school 30.5% 35.6% 25.7%College-level education 16.4% 18.8% 14.2%University degree 5.7% 9.0% 2.6%Post-graduate degree 1.0% 1.8% 0.3%
Table 20: Sample distribution by level of education - Tanzania
Distribution of the respondents by household incomeClose to a third of the respondents (32.6%) reported a monthly household income of less than Tshs 100,000 (5,608.50 Kshs). A higher proportion of these respondents were rural residents. Slightly more than 2% of the respondents reported an income level of above Tshs 5,000,000 (280,426.20 Kshs).
Household income( Tshs) National Urban Rural Less 100,000 32.6% 28.8% 36.1%100,000-299,000 26.9% 26.2% 27.5%300,000- 499,000 17.2% 19.6% 15.0%500,000-749,999 8.2% 8.7% 7.7%750,000- 999,999 5.0% 6.3% 3.8%1,000,000-5,000,000 5.7% 6.1% 5.2%Over 5,000,000 2.2% 2.9% 1.5%Refused To Answer 2.2% 1.4% 3.0%
Table 21: Sample distribution by household income - Tanzania
OVERVIEW OF THE FINDINGSThe survey recorded 15,071 interactions with both private and public institutions. Bribery was either expected or demanded during 40.9% of these interactions; 64.5% of these interactions were characterised by bribery payments. A total of 1, 714 respondents reported paying bribes in Tanzania 1,028 (60%) were men while the women were 686 (40%).
34

Tran
spar
ency
inte
rnat
iona
l - k
enya
Kenya
The respondents reported paying bribes for different purposes detailed below:
Purpose of the bribe Proportion of Total RespondentsServices 44.7%Law enforcement 22.2%Regulatory 12.2%Others 10.4%Employment 7.0%Business 3.6%
Table22: Purpose of bribery - Tanzania
REPORTING OF BRIBERY CASESThe reportage of bribery incidents was very low; 92.9% of the respondents who were asked for a bribe did not report the incident to anyone in a position of authority. Close to a third of those who filed a bribery case, sought redress from the management of the concerned institution. Sixteen% of those who forwarded bribery cases sought the attention of the Office of the Ombudsman.
Fig 10: Reporting of bribery cases - Tanzania
Reasons for not reportingLike in Kenya, the leading reason for not forwarding bribery-related complaints was the belief that no action would be taken following the report. About 20% feared incidents of intimidation that may follow such reporting.
35
East
Afri
can
Brib
ery
Inde
x
www.tikenya.org
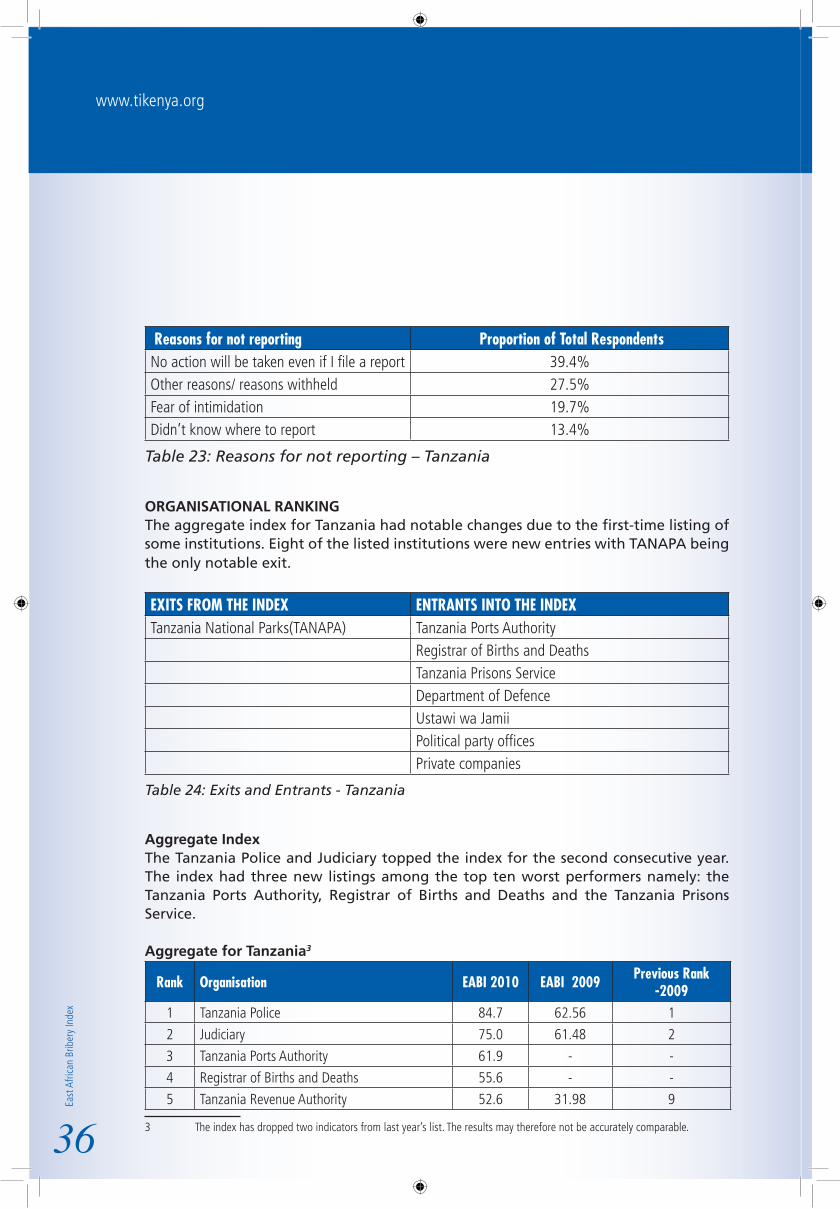
Reasons for not reporting Proportion of Total RespondentsNo action will be taken even if I file a report 39.4%Other reasons/ reasons withheld 27.5%Fear of intimidation 19.7%Didn’t know where to report 13.4%
Table 23: Reasons for not reporting – Tanzania
ORGANISATIONAL RANKINGThe aggregate index for Tanzania had notable changes due to the first-time listing of some institutions. Eight of the listed institutions were new entries with TANAPA being the only notable exit.
EXITS FROM THE INDEX ENTRANTS INTO THE INDEXTanzania National Parks(TANAPA) Tanzania Ports Authority Registrar of Births and Deaths Tanzania Prisons Service Department of Defence Ustawi wa Jamii Political party offices Private companies
Table 24: Exits and Entrants - Tanzania
Aggregate IndexThe Tanzania Police and Judiciary topped the index for the second consecutive year. The index had three new listings among the top ten worst performers namely: the Tanzania Ports Authority, Registrar of Births and Deaths and the Tanzania Prisons Service.
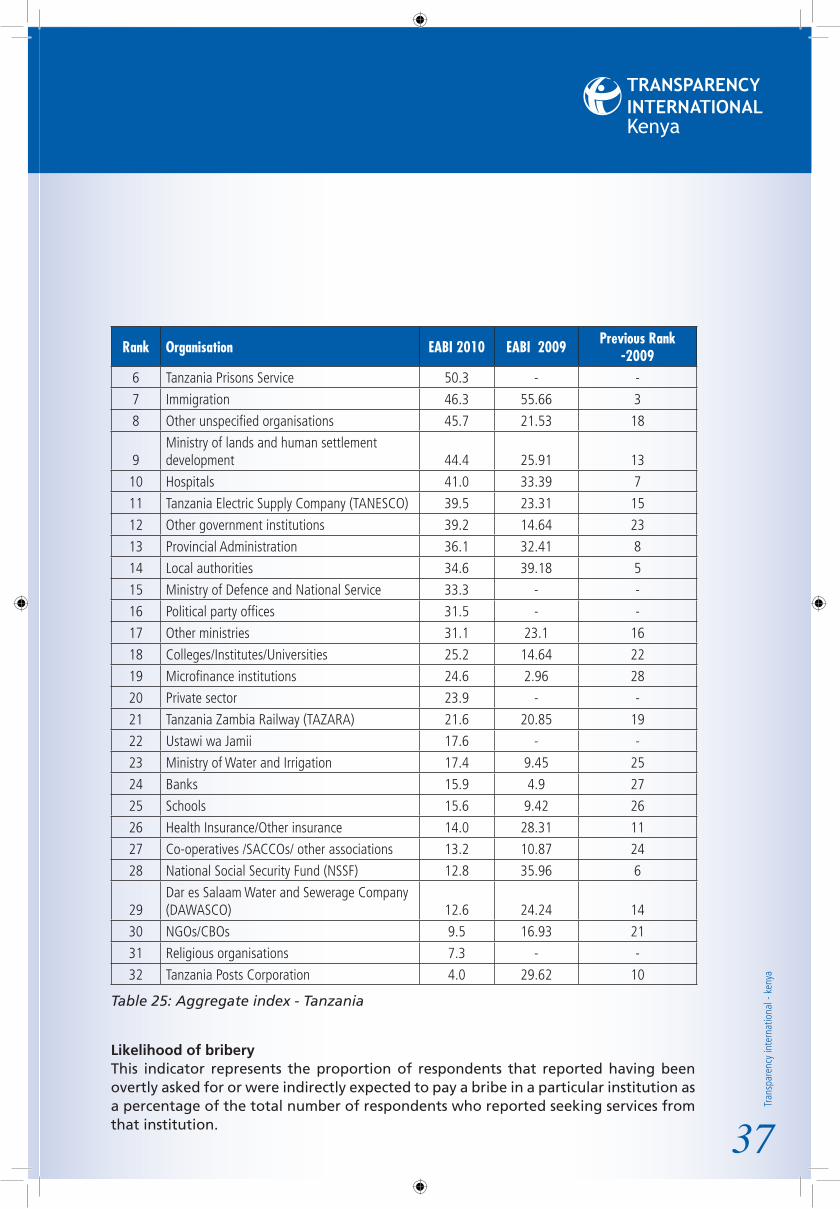
Aggregate for Tanzania3
Rank Organisation EABI 2010 EABI 2009 Previous Rank -2009
1 Tanzania Police 84.7 62.56 1
2 Judiciary 75.0 61.48 2
3 Tanzania Ports Authority 61.9 - -
4 Registrar of Births and Deaths 55.6 - -
5 Tanzania Revenue Authority 52.6 31.98 9
3 The index has dropped two indicators from last year’s list. The results may therefore not be accurately comparable.36
Tran
spar
ency
inte
rnat
iona
l - k
enya
Kenya
Rank Organisation EABI 2010 EABI 2009 Previous Rank -2009
6 Tanzania Prisons Service 50.3 - -
7 Immigration 46.3 55.66 3
8 Other unspecified organisations 45.7 21.53 18
9Ministry of lands and human settlement development 44.4 25.91 13
10 Hospitals 41.0 33.39 7
11 Tanzania Electric Supply Company (TANESCO) 39.5 23.31 15
12 Other government institutions 39.2 14.64 23
13 Provincial Administration 36.1 32.41 8
14 Local authorities 34.6 39.18 5
15 Ministry of Defence and National Service 33.3 - -
16 Political party offices 31.5 - -
17 Other ministries 31.1 23.1 16
18 Colleges/Institutes/Universities 25.2 14.64 22
19 Microfinance institutions 24.6 2.96 28
20 Private sector 23.9 - -
21 Tanzania Zambia Railway (TAZARA) 21.6 20.85 19
22 Ustawi wa Jamii 17.6 - -
23 Ministry of Water and Irrigation 17.4 9.45 25
24 Banks 15.9 4.9 27
25 Schools 15.6 9.42 26
26 Health Insurance/Other insurance 14.0 28.31 11
27 Co-operatives /SACCOs/ other associations 13.2 10.87 24
28 National Social Security Fund (NSSF) 12.8 35.96 6
29Dar es Salaam Water and Sewerage Company (DAWASCO) 12.6 24.24 14
30 NGOs/CBOs 9.5 16.93 21
31 Religious organisations 7.3 - -
32 Tanzania Posts Corporation 4.0 29.62 10
Table 25: Aggregate index - Tanzania
Likelihood of briberyThis indicator represents the proportion of respondents that reported having been overtly asked for or were indirectly expected to pay a bribe in a particular institution as a percentage of the total number of respondents who reported seeking services from that institution. 37

East
Afri
can
Brib
ery
Inde
x
www.tikenya.org
The Tanzania Police was once again the worst performer in this indicator. The new entrants were the Department of Defence, Registrar of Births and Deaths and the Tanzania Prisons Service.
Rank Organisation EABI 2010 EABI 2009 Previous Rank -2009
1 Tanzania Police 76.7 51.0 1
2 Ministry of Defence and National Service 74.2 - -
3 Judiciary 68.1 39.5 3
4 Registrar of Births and Deaths 66.2 - -
5 Tanzania Prison Service 61.9 - -
6 Immigration 52.5 38.5 4
7Ministry of lands and human settlement development 47.9 31.4 6
8 Tanzania Revenue Authority 46.8 24.6 8
9 Other unspecified organisations 45.4 11.2 21
10 Tanzania Ports Authority 44.1 - -
11 Local authorities 41.4 35.7 5
12 Hospitals 41.3 15.5 20
13 Other government institutions 40.6 10.5 23
14 Provincial Administration 39.6 23.7 9
15 Political party offices 34.5 - -
16 Tanzania Electric Supply Company (TANESCO) 34.1 17.0 17
17 Universities/Institutes/Colleges 32.7 10.0 24
18 Other ministries 32.3 18.8 15
19 Microfinance institutions 30.8 1.5 28
20 Tanzania Zambia Railway (TAZARA) 30.0 22.2 13
21 Private sector 29.5 - -
22 Co-operatives /SACCOs/ Other associations 27.3 9.1 25
23 Ustawi wa Jamii 24.1 - -
24 National Social Security Fund (NSSF) 22.2 30.8 7
25 Ministry of Water and Irrigation 21.9 10.8 22
26 Schools 19.1 8.2 26
27 Banks 16.0 4.6 27
28 Health Insurance/Other insurance 14.8 23.5 11
29 NGOs/CBOs 13.9 16.1 18
38

Tran
spar
ency
inte
rnat
iona
l - k
enya
Kenya
Rank Organisation EABI 2010 EABI 2009 Previous Rank -2009
30Dar es Salaam Water And Sewerage Company (DAWASCO) 12.4 16.1 19
31 Religious organisations 10.9 - -
32 Tanzania Posts Corporation 5.3 17.2 16
Table 26: Likelihood of bribery - Tanzania
Prevalence of briberyThis indicator represents the proportion of the respondents that actually paid bribes to the listed institutions in comparison to the total number of respondents that sought services from the institution. It is instructive to note that prevalence measures only a portion of those who were in an actual bribery situation. The Tanzania Police maintained the top ranking albeit with a slight improvement in the percentage values. The Registrar of Births and Deaths, Tanzania Prisons Service and Tanzania Ports Authority are the new entrants in the list of the ten worst performers.
Rank Organisation EABI 2010 EABI 2009 Previous Rank -2009
1 Tanzania Police 53.8 40.9 1
2 Judiciary 46.6 28.5 3
3 Registrar of Births and Deaths 43.2 - -
4 Tanzania Prison Service 42.9 - -
5 Tanzania Ports Authority 41.2 - -
6 Immigration 34.4 38.5 2
7 Tanzania Revenue Authority 31.8 13.8 13
8Ministry of Lands and Human settlement development 29.1 11.4 17
9 Other unspecified organisations 28.9 9.2 21
10 Hospitals 27.4 11.6 16
11 Local authorities 25.5 25 4
12 Other government institutions 23.7 5.3 24
13 Tanzania Electric Supply Company (TANESCO) 23.7 12.1 15
14 Provincial Administration 22.0 18.6 7
15 Other ministries 22.0 10.1 20
16 Tanzania Zambia Railway(TAZARA) 20.0 14.8 11
39
East
Afri
can
Brib
ery
Inde
x
www.tikenya.org
Rank Organisation EABI 2010 EABI 2009 Previous Rank -2009
17 Ministry of Defence and National Service 19.4 - -
18 Private sector 19.3 - -
19 Political party offices 17.2 - -
20 Microfinance institutions 15.4 1.5 28
21 Health Insurance/Other insurance 14.8 23.5 5
22 Universities/Institutes/colleges 13.3 12.5 14
23 Ministry of Water and Irrigation 13.0 4.7 25
24 Ustawi wa Jamii 13.0 - -
25 Banks 11.6 2.3 27
26 Schools 11.1 4.6 26
27 Co-operatives /SACCOs/ Other associations 9.1 23 6.8
28 NGOs/CBOs 8.3 10.3 19
29 National Social Security Fund (NSSF) 8.3 23.1 6
30 Religious organisations 6.4 - -
31Dar es Salaam Water and Sewerage Company (DAWASCO) 5.1 8.9 22
32 Tanzania Posts Corporation 2.2 14.1 12
Table 27: Prevalence of bribery - Tanzania
Impact of briberyThe indicator is a measure of the percentage of respondents who visited a particular institution and only secured the requested service upon paying a bribe. Close to half of the respondents who reported interacting with the Tanzania Police only received the required service after paying a bribe. The league of the ten most adversely ranked institutions was dominated by service and law enforcement agencies including the police, Judiciary, Immigration Department and hospitals.
Rank Organisation EABI 2010 EABI 2009 Previous Rank -20091 Tanzania Police 48.9 31.5 2
2 Registrar of Births and Deaths 43.2 - -
3 Judiciary 40.9 25.4 3
4 Tanzania Prisons Service 38.1 - -
5 Tanzania Ports Authority 35.3 - -
6 Immigration Department 32.8 38.5 1
40

Tran
spar
ency
inte
rnat
iona
l - k
enya
Kenya
Rank Organisation EABI 2010 EABI 2009 Previous Rank -2009
7 Tanzania Revenue Authority 30.3 12.3 10
8 Other unspecified organisations 25.4 5.6 20
9 Hospitals 25.1 9.9 16
10 Local authorities 22.8 21.4 5
11Ministry of Lands and Human settlement development 22.7 11.4 11
12 Tanzania Electric Supply Company (TANESCO) 21.1 10.0 15
13 Other government institutions 20.8 5.3 21
14 Provincial Administration 19.7 16.5 7
15 Other ministries 18.3 10.1 14
16 Political party offices 17.2 - -
17 Tanzania Zambia Railway(TAZARA) 16.3 11.1 12
18 Private sector 15.7 - -
19 Health Insurance/Other insurance 14.8 17.6 6
20 Ustawi wa Jamii 13.0 - -
21 Microfinance institutions 12.8 1.5 28
22 Ministry of Water and Irrigation 12.1 4.7 23
23 Universities/Institutes/Colleges 10.7 5.0 22
24 Banks 10.2 1.9 27
25 Schools 10.0 3.8 26
26 National Social Security Fund (NSSF) 8.3 23.1 4
27 NGOs/CBOs 6.5 4.6 24
28 Ministry of Defence and National Service 6.5 - -
29 Co-operatives /SACCOs/ other associations 5.7 4.5 25
30 Religious organisations 4.5 - -
31Dar es Salaam Water and Sewerage Company (DAWASCO) 2.2 8.9 17
32 Tanzania Posts Corporation 1.8 10.9 13
Table 28: Impact of bribery - Tanzania
Average size of bribeThe indicator is a measure of the average payment made by those respondents who reported paying a bribe to a particular institution. A high average is a clear indication of the bribe-extracting power of an institution. It may also indicate the value attached to the service by the service-seeker. The Tanzania Ports Authority was a new entrant that led in this indicator. There was a marked decline in the amount of bribes paid in comparison to 2009. 41

East
Afri
can
Brib
ery
Inde
x
www.tikenya.org
Rank Organisation EABI 2010 EABI 2009 Previous Rank -2009
1 Tanzania Ports Authority 172,500.00 - -
2 Political party offices 90,000.00 - -
3 Tanzania Revenue Authority 88,315.44 106,222.22 6
4 Other unspecified organisations 80,570.09 337,888.89 1
5Ministry of Lands and Human settlement development 75,894.23 52,500.00 13
6Dar es Salaam Water And Sewerage Com-pany (DAWASCO) 74,571.43 132,000.00 3
7 Universities/Institutes/Colleges 72,350.00 18,000.00 22
8 Microfinance institutions 62,500.00 50,000.00 14
9 Judiciary 61,567.06 252,969.23 2
10Tanzania Electric Supply Company (TANES-CO) 60,974.47 79,600.02 8
11 Other government institutions 55,365.12 120,000.00 4
12 Immigration Department 54,071.43 102,000.00 7
13 Other ministries 53,695.45 43,714.29 15
14 Ministry of Defence and National Service 45,000.00 - -
15 Tanzania Police 44,495.21 38,995.31 17
16 Local authorities 41,441.56 23,857.14 20
17 Registrar of Births and Deaths 39,343.75 - -
18 Banks 35,527.03 62,700.00 11
19 Provincial Administration 34,926.32 17,900.00 23
20 Tanzania Posts Corporation 31,600.00 16,555.56 24
21 Private sector 29,255.41 - -
22 Tanzania Prison Service 27,361.11 - -
23 Ustawi wa Jamii 27,142.86 - -
24 Ministry Of Water and Irrigation 25,170.59 33,285.71 18
25 Schools 24,119.72 58,621.78 12
26 Hospitals 23,555.24 64,773.36 10
27 National Social Security Fund (NSSF) 23,333.33 66,666.67 9
28 Religious organisations 22,714.29 - -
29 Co-operatives /SACCOs/ Other associations 21,125.00 14,000.00 25
30 NGOs/CBOs 20,944.44 23,555.56 21
Table 29: Average size of bribe - Tanzania
42
Tran
spar
ency
inte
rnat
iona
l - k
enya
Kenya
Share of bribe This indicator measures the proportion of actual bribes paid to an institution as a percentage of all the bribes reported to have been paid by the sampled population. The police, according to the respondents received about a fifth of all bribes paid, rising by about nine percentage points from the previous year’s figure. The list of organisations in the top ten list was similar to that of 2009, with the exception of DAWASCO which dropped from the ninth to the twentieth position.
Rank Organisation EABI 2010 EABI 2009 Previous Rank-20091 Tanzania Police 20.4 11.7 3
2 Judiciary/Courts 17.1 23.3 2
3 Hospitals 8.7 38.3 1
4 Tanzania Electric Supply Company (TANESCO) 7.9 5.1 5
5 Provincial Administration 7.3 0.9 10
6 Tanzania Revenue Authority 7.2 1.4 8
7 Other government institutions 6.5 0.2 23
8 Other unspecified organisations 4.7 8.6 4
9Ministry of Lands and Human settlement development 4.3 0.3 17
10 Other ministries 2.6 0.4 13
11 Schools 1.9 3.1 6
12 Local authorities 1.7 0.2 20
13 Banks 1.4 0.9 11
14 Tanzania Ports Authority 1.3 - -
15 Immigration Department 1.2 0.7 12
16 Private sector 1.2 - -
17 Ministry of Water and Irrigation 1.2 0.3 14
18 Universities/ Institutes/ Colleges 0.8 0.1 25
19 Registrar of Births and Deaths 0.7 - -
20Dar es Salaam Water and Sewerage Company (DAWASCO) 0.3 0.9 9
21 Tanzania Prisons Service 0.3 - -
22 Political party offices 0.2 - -
23 Microfinance institutions 0.2 0.1 27
24 Ministry of Defence and National Service 0.1 - -
25 Tanzania Zambia Railway (TAZARA) 0.1 0.1 28
26 Ustawi wa Jamii 0.1 - -
43

East
Afri
can
Brib
ery
Inde
x
www.tikenya.org
Rank Organisation EABI 2010 EABI 2009 Previous Rank -2009
27 NGOs/CBOs 0.1 0.3 16
28 Co-operatives /SACCOs/ Other associations 0.1 0.1 26
29 Religious organisations 0.1 - -
30 Tanzania Posts Corporation 0.1 0.2 22
31 National Social Security Fund (NSSF) 0.0 0.3 18
32 Health Insurance/Other insurance 0.0 0.2 21
Table 30: Share of bribe – Tanzania
CORRUPTION PERCEPTIONThis section of the survey sought to gauge the perception of the respondents across the East African region on corruption trends in their respective countries. The questions posed were:
How would you describe the current corruption situation in your country?i. How does the corruption level in your country compare with a year ago?ii. What change do you foresee in the level of corruption in your country in the iii. coming year?Do you think the government in your country is committed to the fight against iv. corruption?
Perceived level of corruption in TanzaniaEighty-five % of the respondents felt that the country is between corrupt and extremely corrupt, with a larger percentage leaning towards the latter.
Fig 11: Percieved level of corruption - Tanzania
44
Tran
spar
ency
inte
rnat
iona
l - k
enya
Kenya
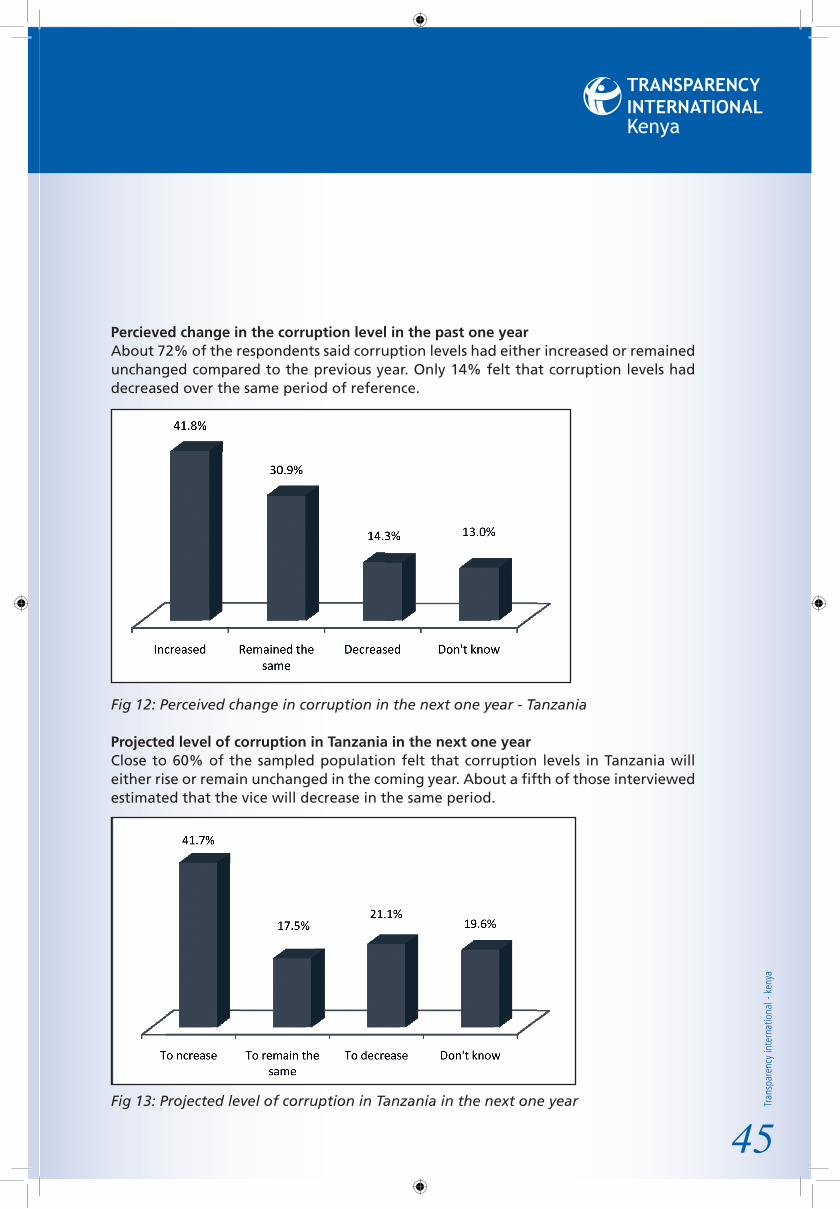
Percieved change in the corruption level in the past one yearAbout 72% of the respondents said corruption levels had either increased or remained unchanged compared to the previous year. Only 14% felt that corruption levels had decreased over the same period of reference.
Fig 12: Perceived change in corruption in the next one year - Tanzania
Projected level of corruption in Tanzania in the next one yearClose to 60% of the sampled population felt that corruption levels in Tanzania will either rise or remain unchanged in the coming year. About a fifth of those interviewed estimated that the vice will decrease in the same period.
Fig 13: Projected level of corruption in Tanzania in the next one year
45
East
Afri
can
Brib
ery
Inde
x
www.tikenya.org
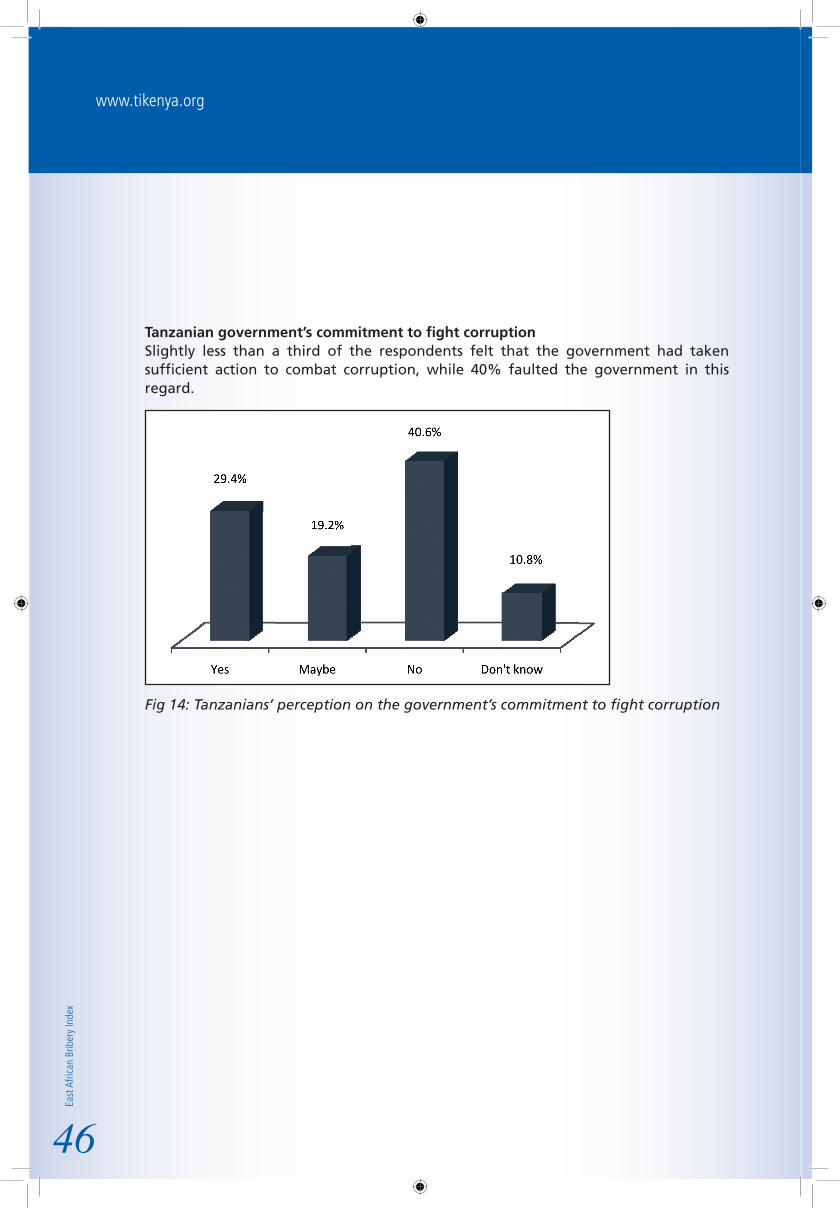
Tanzanian government’s commitment to fight corruptionSlightly less than a third of the respondents felt that the government had taken sufficient action to combat corruption, while 40% faulted the government in this regard.
Fig 14: Tanzanians’ perception on the government’s commitment to fight corruption
46

Tran
spar
ency
inte
rnat
iona
l - k
enya
Kenya
UGANDASAMPLE CHARACTERISTICSThe survey sampled 2,639 respondents across four administrative provinces - Central, Northern, Eastern and Western. Fifty-two% of the sample consisted of males while 48% was female. About 80% of the respondents were sampled from the rural areas with 20% drawn from the urban regions.
Distribution of respondents by province
Region Actual count % of Total SampleCentral 983 37.2%Western 640 24.3%Eastern 615 23.3%Northern 401 15.2% 2639 100%
Table 31: Distribution of respondents by province - Uganda
Gender distribution of the respondents
Fig 15: Gender distribution of respondents - Uganda
47

East
Afri
can
Brib
ery
Inde
x
www.tikenya.org
Distribution of the respondents by residence
Fig 16: Distribution of the respondents by residence - Uganda
Sample distribution by ageAbout 60% of the respondents were aged between 18 and 34 years, while four%, largely from the rural areas, were 60 years and above.
Age category National Urban Rural18-24 18.5% 19.0% 18.4%25-29 24.0% 30.4% 22.5%30-34 16.4% 15.2%% 16.7%35-39 13.1% 10.8% 13.6%40-44 10.1% 9.8% 10.1%45-49 5.7% 5.8% 5.7%50-54 3.7% 3.8% 3.7%55-59 4.5% 3.5% 4.8%60+ 4.1% 1.7% 4.5%
Table 32: Sample distribution by age - Uganda
48

Tran
spar
ency
inte
rnat
iona
l - k
enya
Kenya
Sample distribution by employment statusMajority of the respondents (34.9%) were self-employed. About 12% were students while 13.5% were unemployed.
Employment status National Urban RuralStudent 11.8% 13.5% 11.4%
Unemployed 13.5% 8.7% 14.7%
Self-employed 34.9% 32.3% 35.5%
Employed in a family business or farm 10.2% 9.2% 10.4%
Employed in the private sector 13.9% 19.6% 12.5%
Employed by the government/Local authority/Parastatal 9.3% 7.9% 9.6%
Employed in the community sector e.g. church, N.G.O, Co-operative 4.5% 7.1% 3.8%
Retired 2.0% 1.7% 2.0%
Table 33: Sample distribution by employment status - Uganda
Sample distribution by education levelMajority of those interviewed had attained secondary school education while only two% had received post-graduate education.
Education Levels National Urban RuralPrimary school 17.5% 1.3% 16.2%Post-primary training 5.4% 5.5% 4.6%Secondary school 39.9% 8.7% 31.2%College education 19.9% 3.5% 16.3%University degree 15.6% 4.3% 11.3%Post-graduate degree 2.0% 1.9% 0.9%
Table 34: Sample distribution of respondents by level of education - Uganda
Distribution of the respondents by incomeAbout 70% of the respondents reported a household monthly income of below Ushs 625,000 (Kshs 22,457.8 0). While most of the respondents in the lower income brackets resided in the rural areas, majority of the high income earners were urban dwellers. Only about One and a half% of the respondents reported an income level of above Ushs 3,775,000 (Kshs 135,645).
49

East
Afri
can
Brib
ery
Inde
x
www.tikenya.org
Household income (Ushs) National Urban Rural Less than 125,000 15.5% 6.0% 17.9%125,000- 249,999 23.0% 15.2% 25.0%250,000-624,999 31.7% 32.5% 31.5%625,000- 1,249,999 18.1% 21.7% 17.2%1,250,000-2,4999,999 7.6% 13.7% 6.1%2,500,000- 3,774,999 2.1% 7.1% 0.9%Over 3,775,000 1.4% 3.5% 0.8%Declined to answer 15.5% 6.0% 17.9%
Table 35: Distribution of respondents by household income level – Uganda
OVERVIEW OF THE FINDINGSA total of 15,612 interactions with private and public institutions were reported in the survey. Bribes were expected or demanded during 31% of the interaction; out of all the bribery situations reported, bribes were actually paid in 67.3% of the cases. Out of a total of 1,620 respondents who reported paying bribes in Uganda, 880 (54.3 %) of them were men while 740 (45.7%) were women.The bribes were paid for different purposes as follows:
Purpose of Bribe Proportion of Total RespondentsService 37.6%Law enforcement 28.0%Regulatory 15.7%Employment 10.1%Business 6.2%Others 2.3%
Table 36: Purpose of the bribe - Uganda
50

Tran
spar
ency
inte
rnat
iona
l - k
enya
Kenya
REPORTING OF BRIBERY CASESNinety three% of the respondents who were in a bribery situation did not report or complain to anybody in authority. Only 6.6% filed bribery-related complaints.
Fig 17: Reporting of bribery cases - Uganda
REASONS FOR NOT REPORTINGAsked why they did not forward bribery-related complaints, more than 40% no action would be taken on such reports while 17.4% claimed they did not know where to report such incidents. These trends were similar in Kenya and Tanzania.
Reasons for not reporting %No action would be taken even if I reported 41.8%Others/ Reason withheld 24.0%Didn’t know where to report 17.4%Fear of intimidation 16.8%
Table 37: Reasons for not reporting - Uganda
51

East
Afri
can
Brib
ery
Inde
x
www.tikenya.org
ORGANISATIONAL RANKINGThere were minimal changes in the overall ranking compared to the 2009 index. However, some institutions made their first appearance in the index while three exited.
EXITS ENTRANTSNorthern Uganda Social Action Fund Public schools
The Aids Support Organisation (TASO) Public hospitals
Immigration Department State corporations/Parastatals
Private schools
Table 38: New entrants and exits - Uganda
Aggregate IndexThe aggregate index represents the composite index derived from all the individual study indicators. There was little change on this index in comparison to that of 2009. Seven out of 10 organisations that were listed in the top 10 list retained their positions with minimal movement. The Uganda Revenue Authority replaced the Uganda Police in the first spot.
Aggregate for Uganda4
Rank Organisation EABI 2010 EABI 2009 Previous Rank -2009
1 Uganda Revenue Authority 77.1 54.7 2
2 Uganda Police 70.6 58.3 1
3 Mulago hospital 54.5 40.6 7
4 Uganda Prisons Service 54.2 39.7 9
5 Judiciary 49.7 45.5 6
6 Local authorities 46.2 38.4 10
7 Umeme 44.9 40.5 8
8 Other ministries 32.7 19.5 21
9Ministry of Lands, Housing and Urban Development 32.4 37.4 12
10 State corporations/Parastatals 31.6 - -
11 Ministry of Public Service 31.2 49.5 3
12 Public hospitals 27.3 0.0 0
13 Provincial/Regional Administration 25.9 37.1 13
14 Ministry of Defence 23.5 46.4 4
15 Other government institutions 16.8 35.0 144 The index has dropped two indicators from last year’s list. The results may therefore not be perfectly comparable
52

Tran
spar
ency
inte
rnat
iona
l - k
enya
Kenya
16 Co-operatives /SACCOs/ Other associations 16.6 13.8 28
17 Public universities 15.6 18.0 23
18 Private sector 15.1 16.1 25
19 National Social Security Fund (NSSF) 11.2 37.5 11
20 National Water and Sewerage Company 10.6 13.2 30
21 International organisations 8.9 18.2 22
22 Public schools 8.8 - -
23 Private hospitals 6.7 - -
24 Colleges 6.0 20.2 19
25 Microfinance institutions 5.0 16.4 24
26 Banks 3.7 14.6 27
27 Private schools 3.3 - -
28 NGOs/CBOs 3.1 19.7 20
Table 39: Aggregate Index - Uganda
Likelihood of bribery Likelihood as an indicator measures the proportion of respondents who interacted with a particular institution and were required to pay a bribe either through an open demand or a bribe was expected from them. The highest score for this indicator fell by about seven percentage points. It is noteworthy that the Ministry of Defence dropped from the first position in the 2009 listing to number 11. Six of the 10 worst performers in the 2009 index retained their adverse ranking.
Rank Organisation EABI 2010 EABI 2009 Previous Rank -2009
1 Uganda Police 69.5 76.7 4
2 Mulago hospital 65.5 68.6 6
3 Judiciary 54.1 79.7 2
4Ministry of Lands, Housing and Urban Development 53.4 60.0 10
5 Uganda Prisons Service 51.7 63.0 7
6 Uganda Revenue Authority 51.1 76.8 3
7 Umeme 47.6 50.0 12
8 Local authorities 47.0 60.0 9
9 Other ministries 43.9 31.6 18
10 Ministry of Public Service 42.9 60.0 11
53

East
Afri
can
Brib
ery
Inde
x
www.tikenya.org
Rank Organisation EABI 2010 EABI 2009 Previous Rank -2009
11 Ministry of Defence 35.3 85.7 1
12 Public hospitals 34.1 - -
13 Provincial/Regional Administration 32.0 48.4 14
14 State corporations/Parastatals 30.1 - -
15 Other government institutions 27.7 42.8 15
16 Co-operatives /SACCOs/ Other associations 26.3 17.913 28
17 National Social Security Fund (NSSF) 25.3 50.0 13
18 Public universities 23.6 26.2 24
19 Private sector 21.7 23.3 25
20 National Water and Sewerage Company 21.6 27.7 19
21 International organisations 17.4 26.7 22
22 Public schools 15.3 - -
23 Colleges 14.9 22.1 26
24 Private hospitals 13.9 - -
25 NGOs/CBOs 13.3 26.8 20
26 Microfinance institutions 13.0 26.7 21
27 Private schools 11.0 - -
28 Banks 10.9 11.8 29
Table 40: Likelihood of bribery - Uganda
Prevalence of briberyThis indicator represents the proportion of the respondents that actually paid bribes to an institution in comparison with the total number of respondents that sought services from the institution. The Ministry of Defence registered the biggest improvement falling from the first position in 2009 to number 12 in 2010.
Rank Organisation EABI 2010 EABI 2009 Previous Rank -2009
1 Uganda Police 53.1 65.9 4
2 Uganda Prisons Service 46.6 51.9 6
3 Mulago Hospital 43.7 62.2 5
4 Judiciary 35.8 69.6 3
5 Umeme 35.3 46.0 10
6 Uganda Revenue Authority 35.0 73.2 2
7 Local authorities 32.3 49.0 8
54

Tran
spar
ency
inte
rnat
iona
l - k
enya
Kenya
Rank Organisation EABI 2010 EABI 2009 Previous Rank -2009
8 Other ministries 25.2 26.3 18
9 Ministry of Lands, Housing and Urban Devel-opment 24.7 36.0 13
10 Public hospitals 23.2 - -
11 State corporations/Parastatals 22.4 - -
12 Ministry of Defence 22.1 85.7 1
13 Provincial/Regional Administration 20.6 29.7 15
14 Ministry of Public Service 19.6 40.0 11
15 Co-operatives /SACCOs/ Other associations 17.3 15.2 27
16 Other government institutions 15.6 33.2 14
17 Public universities 14.2 16.7 17
18 Private sector 13.4 16.0 25
19 International organisations 12.0 11.2 28
20 National Water and Sewerage Company 11.7 23.1 20
21 Public schools 11.3 - -
22 National Social Security Fund (NSSF) 10.7 40.0 12
23 Microfinance institutions 10.1 20.9 21
24 Private schools 7.2 - -
25 Banks 7.1 8.8 29
26 Colleges 7.1 18.8 22
27 Private hospitals 7.0 - -
28 NGOs/CBOs 6.7 18.2 23
Table 41: Prevalence of bribery - Uganda
Impact of briberyThe indicator is a measure of the percentage of respondents who visited a particular institution and only got the service upon paying a bribe. The Ministry of Defence which was ranked in the top position in 2009, dropped to tenth place. The Judiciary also recorded an improved position, falling from number two to seven, with its score improving by more than 33 percentage points.
Rank Organisation EABI 2010 EABI 2009 Previous Rank -2009
1 Uganda Police 49.3 58.3 5
2 Mulago Hospital 42.9 58.4 4
55

East
Afri
can
Brib
ery
Inde
x
www.tikenya.org
Rank Organisation EABI 2010 EABI 2009 Previous Rank -2009
3 Uganda Prison service 41.4 48.1 6
4 Umeme 33.7 42.0 7
5 Local authorities 30.3 37.1 9
6 Uganda Revenue Authority 29.1 62.5 3
7 Judiciary 28.9 63.3 2
8 Public hospitals 22.5 - -
9 Other ministries 22.3 10.5 27
10 Ministry of Defence 22.1 78.6 1
11 Ministry of Lands ,Housing and Urban Devel-opment 20.5 36.0 11
12 State corporations/Parastatals 20.3 - -
13 Provincial/Regional Administration 19.1 21.9 18
14 Co-operatives /SACCOs/ Other associations 16.2 11.3 26
15 Ministry of Public Service 16.1 26.7 12
16 Public universities 13.3 16.7 20
17 Other government institutions 13.0 22.7 17
18 International organisations 11.4 7.8 28
19 Private sector 10.2 13.8 25
20 Public schools 10.2 - -
21 National Water and Sewerage Company 9.9 21.5 19
22 Microfinance institutions 7.7 16.3 22
23 Private schools 7.2 - -
24 Private hospitals 6.9 - -
25 Banks 6.8 7.7 29
26 National Social Security Fund (NSSF) 6.7 40.0 8
27 Colleges 6.0 16.6 21
28 NGOs/CBOs 4.9 14.9 23
Table 42: Impact of bribery - Uganda
Average size of bribeThe indicator is a measure of the average payment made by those respondents who reported paying a bribe to a particular institution. The figure represents the average sum that a citizen has to part with to access a particular service. This average must be interpreted within the shortcomings of the mean as a statistical measure.The most notable change on this indicator is the rise by the Uganda Prisons Service from 18th position in the previous year to number seven in 2010. Further, the size of bribe reported as paid rose by almost 84% for the three top-ranked institutions.56
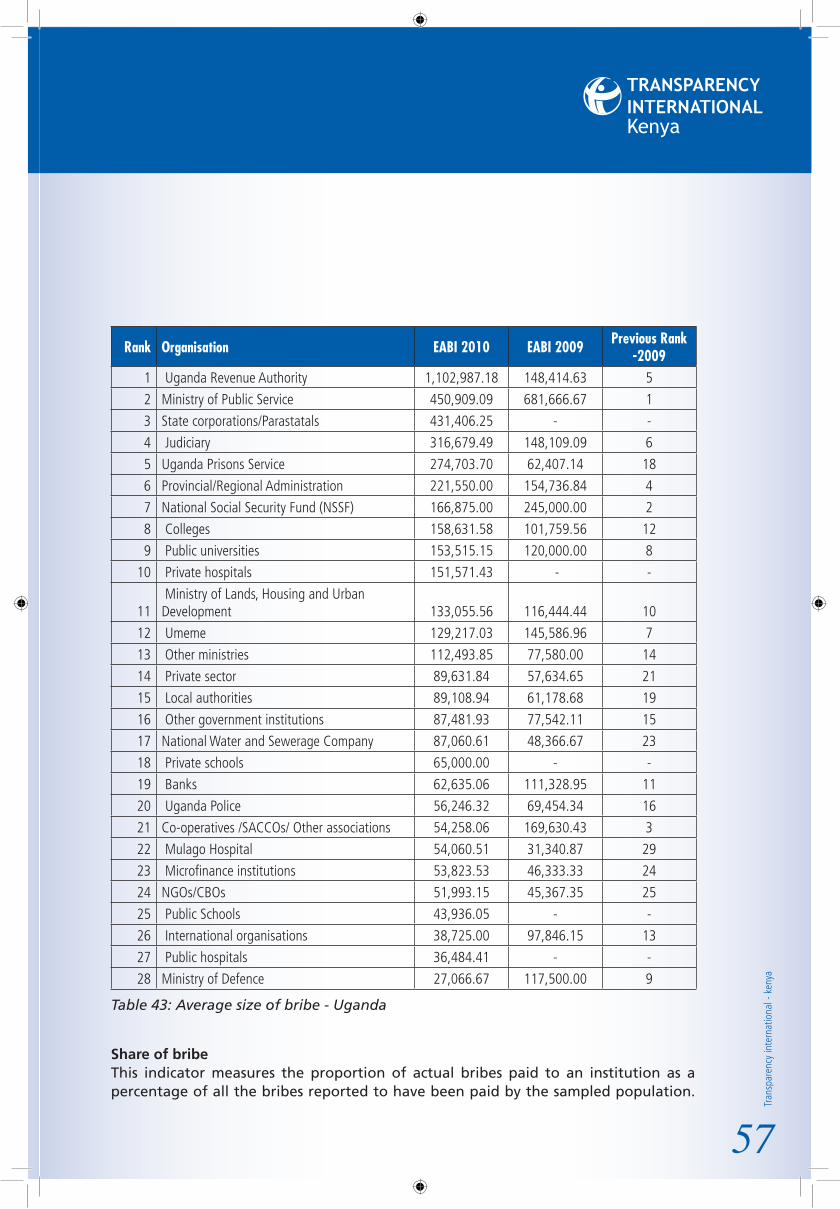
Tran
spar
ency
inte
rnat
iona
l - k
enya
Kenya
Rank Organisation EABI 2010 EABI 2009 Previous Rank -2009
1 Uganda Revenue Authority 1,102,987.18 148,414.63 5
2 Ministry of Public Service 450,909.09 681,666.67 1
3 State corporations/Parastatals 431,406.25 - -
4 Judiciary 316,679.49 148,109.09 6
5 Uganda Prisons Service 274,703.70 62,407.14 18
6 Provincial/Regional Administration 221,550.00 154,736.84 4
7 National Social Security Fund (NSSF) 166,875.00 245,000.00 2
8 Colleges 158,631.58 101,759.56 12
9 Public universities 153,515.15 120,000.00 8
10 Private hospitals 151,571.43 - -
11 Ministry of Lands, Housing and Urban Development 133,055.56 116,444.44 10
12 Umeme 129,217.03 145,586.96 7
13 Other ministries 112,493.85 77,580.00 14
14 Private sector 89,631.84 57,634.65 21
15 Local authorities 89,108.94 61,178.68 19
16 Other government institutions 87,481.93 77,542.11 15
17 National Water and Sewerage Company 87,060.61 48,366.67 23
18 Private schools 65,000.00 - -
19 Banks 62,635.06 111,328.95 11
20 Uganda Police 56,246.32 69,454.34 16
21 Co-operatives /SACCOs/ Other associations 54,258.06 169,630.43 3
22 Mulago Hospital 54,060.51 31,340.87 29
23 Microfinance institutions 53,823.53 46,333.33 24
24 NGOs/CBOs 51,993.15 45,367.35 25
25 Public Schools 43,936.05 - -
26 International organisations 38,725.00 97,846.15 13
27 Public hospitals 36,484.41 - -
28 Ministry of Defence 27,066.67 117,500.00 9
Table 43: Average size of bribe - Uganda
Share of bribeThis indicator measures the proportion of actual bribes paid to an institution as a percentage of all the bribes reported to have been paid by the sampled population.
57

East
Afri
can
Brib
ery
Inde
x
www.tikenya.org
Of all the bribes reportedly paid by the respondents, almost a quarter (24.1%) were paid to the Uganda Revenue Authority, which claimed the first position. The top three worst performers on this indicator received almost a half (47.6%) of all the bribes reported to have been paid. The Uganda Police, which was ranked first in 2009, slipped one place down to number two.
Rank Organisation EABI 2010 EABI 2009 Previous Rank -2009
1 Uganda Revenue Authority 24.1 4.2 7
2 Uganda Police 11.8 28.9 1
3 Local authorities 11.7 4.4 6
4 Judiciary 6.9 5.6 3
5 Umeme 5.6 4.6 5
6 Private sector 5.0 4.0 9
7 Public hospitals 4.3 - -
8 Other ministries 4.1 0.3 30
9 State corporations/Parastatals 3.9 - -
10 Provincial/Regional Administration 2.5 2.0 15
11 Mulago Hospital 2.4 2.5 13
12 Public schools 2.1 - -
13 Uganda Prisons Service 2.1 0.6 24
14 Other government institutions 2.0 4.1 8
15 Private hospitals 1.8 - -
16 Public universities 1.4 1.2 18
17 Ministry of Public Service 1.4 2.8 11
18 Banks 1.4 2.9 10
19 NGOs/CBOs 1.1 1.5 16
20 Colleges 0.8 2.4 14
21 National Water and Sewerage Company 0.8 0.5 26
22Ministry of Lands, Housing and Urban Devel-opment 0.7 0.7 22
23 Private schools 0.5 - -
24 Co-operatives /SACCOs/Other associations 0.5 2.7 12
25 International organisations 0.4 0.9 21
26 National Social Security Fund (NSSF) 0.4 0.7 23
27 Microfinance institutions 0.3 0.6 25
28 Ministry of Defence 0.1 1.0 20
Table 44: Share of the bribe - Uganda
58

Tran
spar
ency
inte
rnat
iona
l - k
enya
Kenya
CORRUPTION PERCEPTIONThis section of the survey sought to gauge the perception of the respondents across the East African region on corruption trends in their respective countries. The questions posed were:
How would you describe the current corruption situation in your country?i. How does the corruption level in your country compare with a year ago?ii. What change do you foresee in the level of corruption in your country in the iii. coming year?Do you think the government is committed to the fight against corruption?iv.
Perceived current level of corruption
Fig 18: Perceived current level of corruption - Uganda
Percieved changes in the corruption level in the past one year
Fig 19: Perceived change in the corruption level in the past one year - Uganda
59
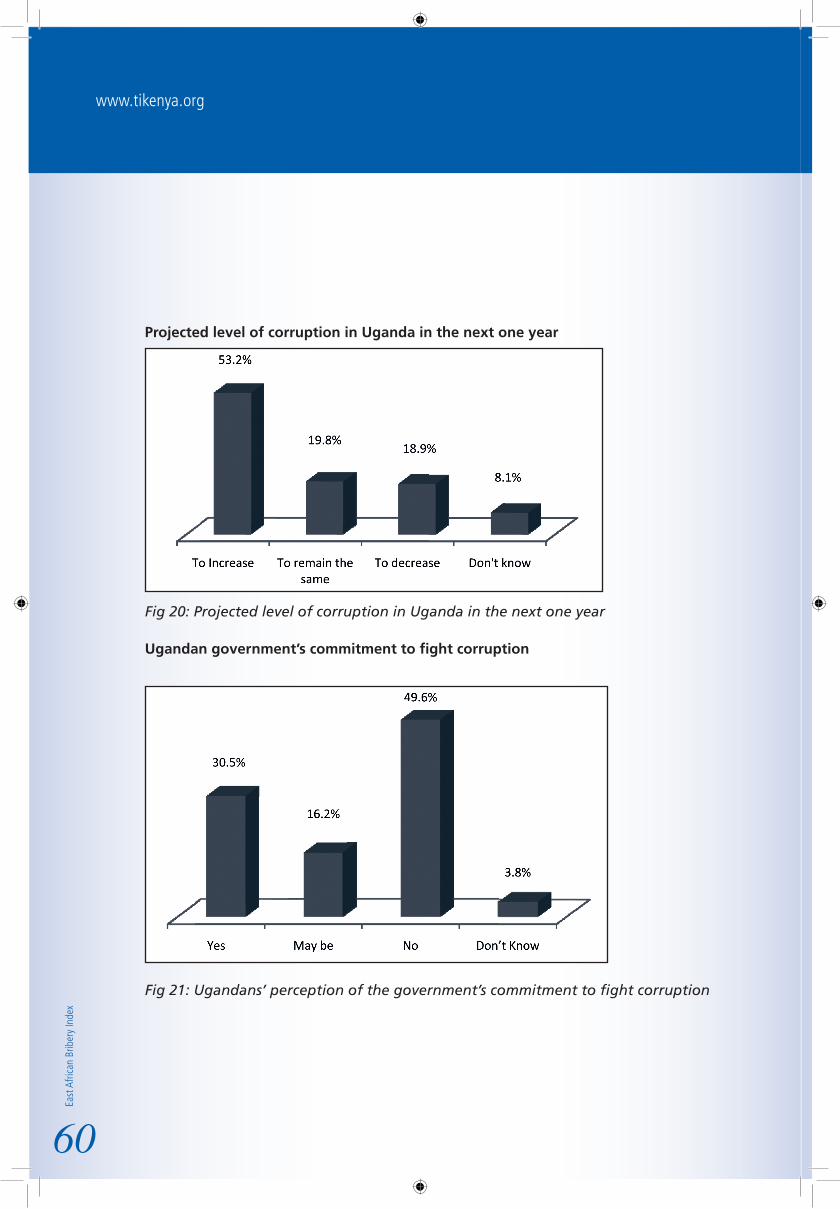
East
Afri
can
Brib
ery
Inde
x
www.tikenya.org
Projected level of corruption in Uganda in the next one year
Fig 20: Projected level of corruption in Uganda in the next one year
Ugandan government’s commitment to fight corruption
Fig 21: Ugandans’ perception of the government’s commitment to fight corruption
60

Tran
spar
ency
inte
rnat
iona
l - k
enya
Kenya
BURUNDISAMPLE CHARACTERISTICSA total of 715 respondents randomly selected across nine administrative provinces of Burundi were interviewed in the survey. The males accounted for 67% of the sample while 33% were female. About 70% of the respondents were rural residents while 30% were from the urban areas.
Distribution of respondents by province
Province Actual count % of sampleBujumbura 130 18.2Gitega 119 16.6Bururi 75 10.5Bubanza 70 9.8Kayanza 69 9.7Ngozi 69 9.7Kirundo 67 9.4Muramvya 62 8.7Cankuzo 54 7.6 Total 715 100%
Table 45: Distribution of respondents by province - Burundi
Gender distribution of the respondents
Fig 22: Gender distribution of the respondents-Burundi
61

East
Afri
can
Brib
ery
Inde
x
www.tikenya.org
Distribution of the sample by residence
Fig 23: Distribution by residence - Burundi
Sample distribution by age
More than a half of the respondents (56.6%) were aged between 18 and 34 years with the age group of 30 to 34 years having a marked higher representation in the urban areas. Only seven% of the respondents were above 50 years with the majority sampled from the rural areas.
Age National Urban Rural18-24 9.8% 9.3% 10.0%
25-29 26.7% 22.4% 28.5%
30-34 20.1% 25.2% 18.0%
35-39 19.7% 20.1% 19.6%
40-44 12.3% 13.6% 11.8%
45-49 4.3% 6.1% 3.6%
50-54 2.9% 1.9% 3.4%
55-59 2.0% 0.5% 2.6%
60+ 2.1% 0.9% 2.6%
Table 46: Sample distribution by age - Burundi
62

Tran
spar
ency
inte
rnat
iona
l - k
enya
Kenya
Sample distribution by employment statusAlmost 80% of the sample reported being in fulltime employment while the remaining 20% were either in retirement or school.
Employment Status National Urban RuralStudent 7.6% 7.5% 7.6%
Unemployed 12.0% 11.7% 12.2%
Self-employed 29.0% 23.4% 31.3%
Employed in a family business or farm 5.0% 8.9% 3.4%
Employed in the private sector 9.2% 13.1% 7.6%
Employed by the government/Local authority/Para-statal 30.8% 29.9% 31.1%
Employed in the community sector e.g. church, N.G.O, co-operative 5.2% 5.1% 5.2%
Retired 1.3% 0.5% 1.6%
Table 47: Sample distribution by employment status - Burundi
Education level of the respondentsAbout 18 % of the respondents reported primary schooling as the highest level of education attained; majority of these were sampled in the rural areas. About 58 % of the respondents had attained college education or above with only one% holding post-graduate qualifications.
Level of Education National Urban RuralPrimary school 18.2% 11.2% 18.2%Post-primary training 10.6% 6.1% 10.6%Secondary school 13.7% 14.5% 13.7%College education 37.2% 33.2% 37.2%University degree 19.3% 32.2% 19.3%Post-graduate degree 1.0% 2.8% 1.0%
Table 48: Distribution by level of education - Burundi
Distribution of the respondents by household incomeMore than half of the respondents (56.7%) reported a monthly household income of below 160,000 Burundi Francs (Ksh 10,731). Less than one% of the respondents reported a household income of more than 2.4 million Burundi Francs (Ksh 160,964.70). All of the respondents in the highest income bracket were interviewed within the capital city, Bujumbura and its environs.
63

East
Afri
can
Brib
ery
Inde
x
www.tikenya.org
Income in Burundi Francs National Urban RuralLess than 80,000 26.4% 27.1% 26.1%80,000- 159,999 30.3% 23.8% 33.1%160,000-399,999 26.6% 34.1% 23.4%400,000- 799,999 9.8% 7.9% 10.6%800,000- 1,599,999 1.8% 1.9% 1.8%1,600,000- 2,415,999 0.6% 1.4% 0.2%Over 2, 416,000 0.7% 0.7% 0Refused To Answer 3.8% 1.4% 4.80%
Table 49: Distribution by household income - Burundi
OVERVIEW OF THE FINDINGSThe survey recorded 1,153 interactions with service delivery institutions. From these interactions, bribes were demanded or expected in 722 instances; bribes were actually paid in 98% of these interactions. A total of 402 respondents reported paying bribes in Burundi, 289 (71.9%) of these were men while the women constituted were 113 (18.1%). The purposes of the bribes paid were as follows:
Purpose of the bribe Proportion of the respondents in % Services 36.7Law enforcement 21.7Others 14.1Employment 13.4Regulatory 10.3Business 3.8
Table50: Bribery by purpose - Burundi
REPORTING OF BRIBERY CASESReporting of bribery incidents in Burundi was very low. Majority (92%) of the respondents who encountered bribery demands did not report the case to anybody in authority. Thirty% of those who forwarded bribery cases sought redress from the management of the concerned institution, 19% went to the media while 14% complained to the police.
64

Tran
spar
ency
inte
rnat
iona
l - k
enya
Kenya
Reasons for not reportingThe reluctance to report bribery cases was largely attributed to the belief that no action would be taken following the complaint and the fear of intimidation.
Reasons for not reporting Proportion of respondents in % No action would be taken even if I reported 32.2Fear of intimidation 32.2Others/Reason withheld 24Didn’t know where to report 11.4
Table 51: Reasons for not reporting - Burundi
Aggregate IndexThe Revenue Authority registered the highest bribery incidents in Burundi and East Africa. Other adversely mentioned institutions included the Burundi Police and the Ministry of Education.
Rank Organisation EABI 20101 Customs/Revenue Authority 90.2
2 Burundi Police 80.3
3 Ministry of Education 59.9
4 Régié de Production et Distribution d’Eau et d’Electricité (REGIDESO) 57.9
5 Judiciary 52.4
6 Civil Service 47.7
7 Local authorities 40.0
8 State corporations/Parastatals 28.9
9 Provincial Administration 27.9
10 Public schools 27.1
11 NGOs/CBOs 26.1
12 Other ministries 24.2
13 Ministry of Health 23.8
14 Universities/Institutes/Colleges 21.4
15 Private sector 18.1
16 Banks/Insurance 17.6
17 Public Hospitals 16.7
18 International organisations/Embassies 11.6
65

East
Afri
can
Brib
ery
Inde
x
www.tikenya.org
Rank Organisation EABI 201019 Postal Corporation 10.2
20 Co-operatives /SACCOs/ Other associations 8.6
21 Religious organisations 1.0
Table 52: Aggregate index - Burundi
Likelihood of BriberyThis indicator is a measure of the probability of being asked or expected to pay a bribe when interacting with an institution. The top three listed institutions recorded a likelihood of more than 70%, implying that only about a third of the respondents were served in these institutions in a situation where a bribe was not expected or demanded.
Rank Organisation EABI 20101 Customs/Revenue Authority 77.2
2 Régié de Production et Distribution d’Eau et d’Electricité (REGIDESO) 75.4
3 Burundi Police 73.5
4 Judiciary 69.5
5 Civil Service 63.1
6 Ministry of Education 59.9
7 Local authorities 52.0
8 Other ministries 42.9
9 Parastatal/Government organisations 41.8
10 Provincial Administration 37.0
11 Public schools 35.4
12 Ministry of Health 32.4
13 Universities/Institutes/Colleges 24.7
14 Public hospitals 20.2
15 Private sector 19.5
16 Banks/Insurance companies 18.1
17 Postal Corporation 17.5
18 International organisations/Embassies 15.4
19 NGOs/CBOs 14.7
20 Co-operatives /SACCOs/ Other associations 13.6
21 Religious organisations 6.9
Table 53: Likelihood of bribery - Burundi
66

Tran
spar
ency
inte
rnat
iona
l - k
enya
Kenya
Prevalence of briberyThis indicator represents the proportion of the respondents that actually paid bribes to the listed institutions in comparison with the total number of respondents that sought services from the institution. It is instructive to note that prevalence measures only a portion of those who were in an actual bribery situation. Burundi recorded a bribery prevalence of about 60%. A high prevalence indicates that a proportion that did not pay the bribes may have regarded the expected amount as unaffordable, thus preventing them from accessing the required services.
Rank Organisation EABI 20101 Customs/Revenue Authority 58.7
2 Burundi Police 54.3
3 Régié de Production et Distribution d’Eau et d’Electricité (REGIDESO) 49.2
4 Civil service 41.5
5 Judiciary 37.4
6 Local authorities 34.0
7 Ministry of Education 31.5
8 Provincial Administration 24.3
9 Public schools 23.9
10 Parastatal/Government organisations 20.9
11 Ministry of Health 17.6
12 Universities/Institutes/Colleges 15.7
13 Private sector 14.9
14 Other ministries 14.3
15 Public hospitals 13.8
16 Banks/Insurance companies 9.6
17 Postal Corporation 8.8
18 Co-operatives /SACCOs/ Other associations 8.6
19 International organisations/Embassies 5.1
20 NGOs/CBOs 4.4
21 Religious organisations 1.4
Table 54: Prevalence of bribery - Burundi
67

East
Afri
can
Brib
ery
Inde
x
www.tikenya.org
Impact of briberyThe indicator is a measure of the percentage of respondents who visited a particular institution and only got the service upon paying a bribe. More than a half of the respondents who reported interaction with the tax collection agencies had to part with a bribe to access services.
Rank Organisation EABI 20101 Customs/Revenue Authority 57.6
2 Burundi Police 47.0
3 Régié de Production et Distribution d’Eau et d’Electricité (REGIDESO) 36.1
4 Civil Service 35.4
5 Local authorities 30.0
6 Ministry of Education 29.6
7 Judiciary 27.3
8 Provincial Administration 22.5
9 Public schools 21.6
10 Parastatal/Government organisations 19.0
11 Ministry of Health 17.6
12 Universities/Institutes/Colleges 15.7
13 Public hospitals 12.7
14 Other ministries 11.4
15 Private sector 10.9
16 Banks/Insurance companies 7.4
17 Co-operatives /SACCOs/ Other associations 7.4
18 Postal Corporation 7.0
19 International organisations/Embassies 5.1
20 NGOs/CBOs 2.9
21 Religious organisations 1.4
Table55: Impact of bribery - Burundi
Average size of bribe This indicator is a measure of the average payment made by those respondents who reported paying a bribe to access services from a particular institution. This average must be interpreted within the shortcomings of the mean as a statistical measure.
68
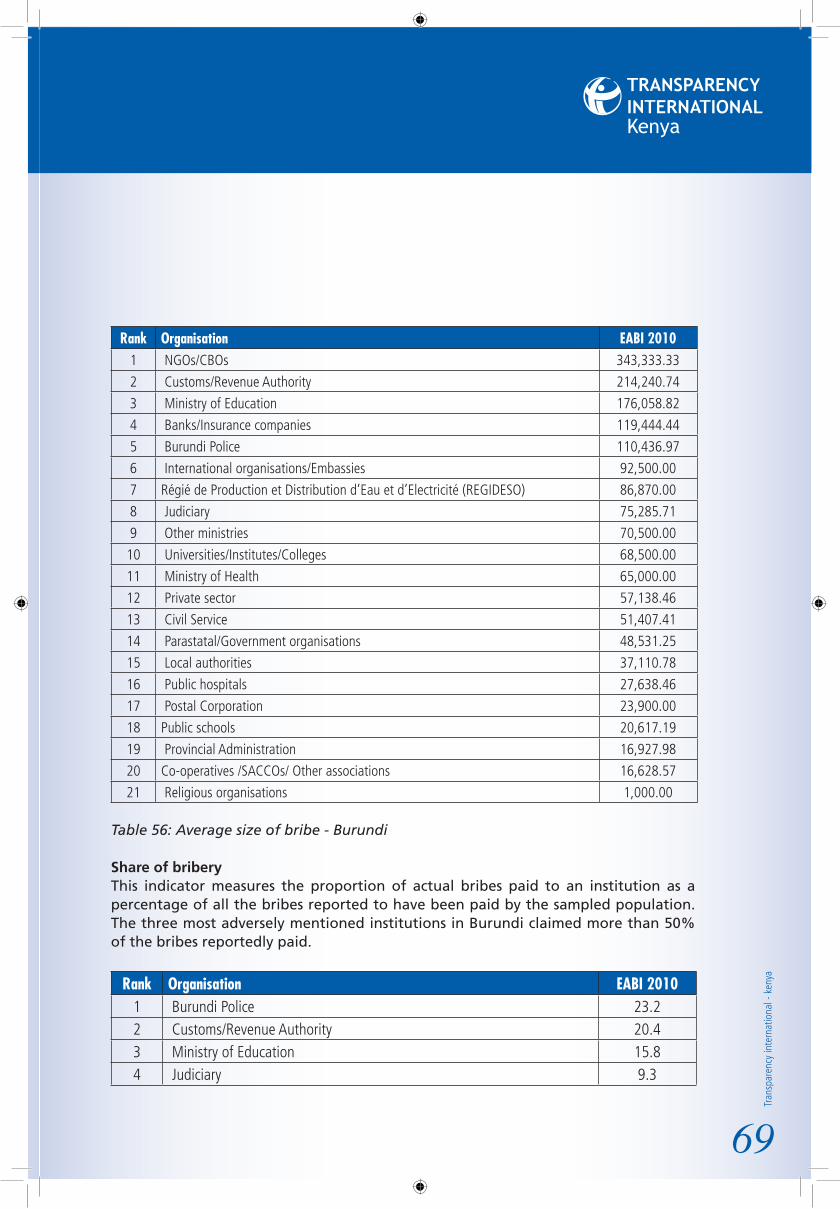
Tran
spar
ency
inte
rnat
iona
l - k
enya
Kenya
Rank Organisation EABI 20101 NGOs/CBOs 343,333.33
2 Customs/Revenue Authority 214,240.74
3 Ministry of Education 176,058.82
4 Banks/Insurance companies 119,444.44
5 Burundi Police 110,436.97
6 International organisations/Embassies 92,500.00
7 Régié de Production et Distribution d’Eau et d’Electricité (REGIDESO) 86,870.00
8 Judiciary 75,285.71
9 Other ministries 70,500.00
10 Universities/Institutes/Colleges 68,500.00
11 Ministry of Health 65,000.00
12 Private sector 57,138.46
13 Civil Service 51,407.41
14 Parastatal/Government organisations 48,531.25
15 Local authorities 37,110.78
16 Public hospitals 27,638.46
17 Postal Corporation 23,900.00
18 Public schools 20,617.19
19 Provincial Administration 16,927.98
20 Co-operatives /SACCOs/ Other associations 16,628.57
21 Religious organisations 1,000.00
Table 56: Average size of bribe - Burundi
Share of bribery This indicator measures the proportion of actual bribes paid to an institution as a percentage of all the bribes reported to have been paid by the sampled population. The three most adversely mentioned institutions in Burundi claimed more than 50% of the bribes reportedly paid.
Rank Organisation EABI 20101 Burundi Police 23.22 Customs/Revenue Authority 20.43 Ministry of Education 15.84 Judiciary 9.3
69

East
Afri
can
Brib
ery
Inde
x
www.tikenya.org
Rank Organisation EABI 20105 Régié de Production et Distribution d’Eau et d’Electricité (REGIDESO) 4.66 Local authorities 3.37 Parastatal/Government organisations 2.78 Private sector 2.69 Public hospitals 2.510 Provincial Administration 2.511 Civil Service 2.412 Public schools 2.313 Banks/Insurance companies 1.914 NGOs/CBOs 1.815 Universities/Institutes/Colleges 1.716 Other ministries 1.217 Ministry of Health 0.718 Postal Corporation 0.419 International organisations/Embassies 0.320 Co-operatives /SACCOs/ Other associations 0.221 Religious organisations 0.0
Table 57: Share of bribe - Burundi
CORRUPTION PERCEPTIONThis section of the survey sought to gauge the perception of the respondents across the East African region on corruption trends in their respective countries. The questions posed were:
How would you describe the current corruption situation in your country?i. How does the corruption level in your country compare with a year ago?ii. What change do you foresee in the level of corruption in your country in the iii. coming year?Do you think the government in your country is committed to the fight against iv. corruption?
70
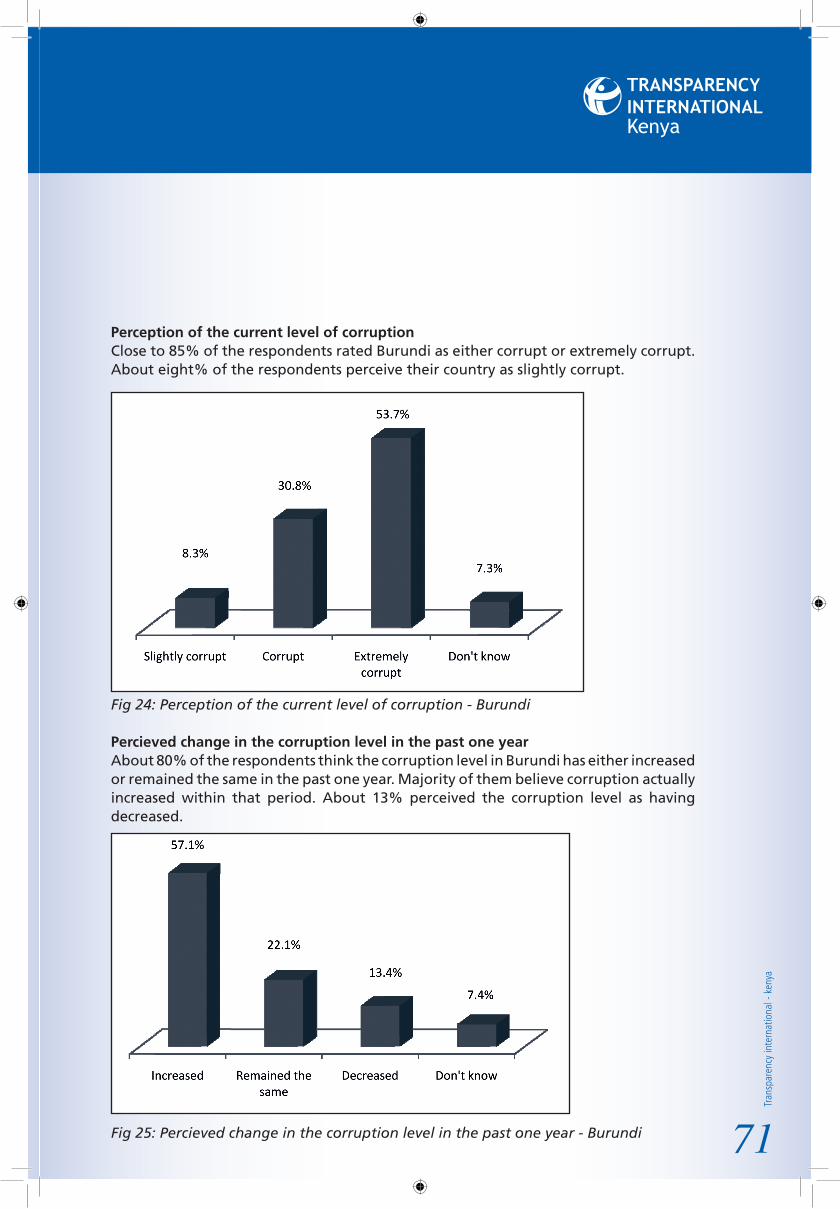
Tran
spar
ency
inte
rnat
iona
l - k
enya
Kenya
Perception of the current level of corruptionClose to 85% of the respondents rated Burundi as either corrupt or extremely corrupt. About eight% of the respondents perceive their country as slightly corrupt.
Fig 24: Perception of the current level of corruption - Burundi
Percieved change in the corruption level in the past one yearAbout 80% of the respondents think the corruption level in Burundi has either increased or remained the same in the past one year. Majority of them believe corruption actually increased within that period. About 13% perceived the corruption level as having decreased.
Fig 25: Percieved change in the corruption level in the past one year - Burundi 71

East
Afri
can
Brib
ery
Inde
x
www.tikenya.org
72
Projected level of corruption in Burundi in the next one yearMajority of the respondents withheld their opinion on whether corruption levels will increase or decrease in the coming year. Notably, almost a quarter of the respondents (23.5%) were optimistic that corruption will reduce in the next year.
Fig 26: Projected level of corruption in Burundi in the next one year
Burundian government’s commitment to fight corruptionMore than a half of the respondents did not think the Burundian governement had taken sufficient action against corruption, while 22% commended the government’s anti-corruption efforts.
Fig 27: Burundians’ perception on the government’s commitment to fight corruption
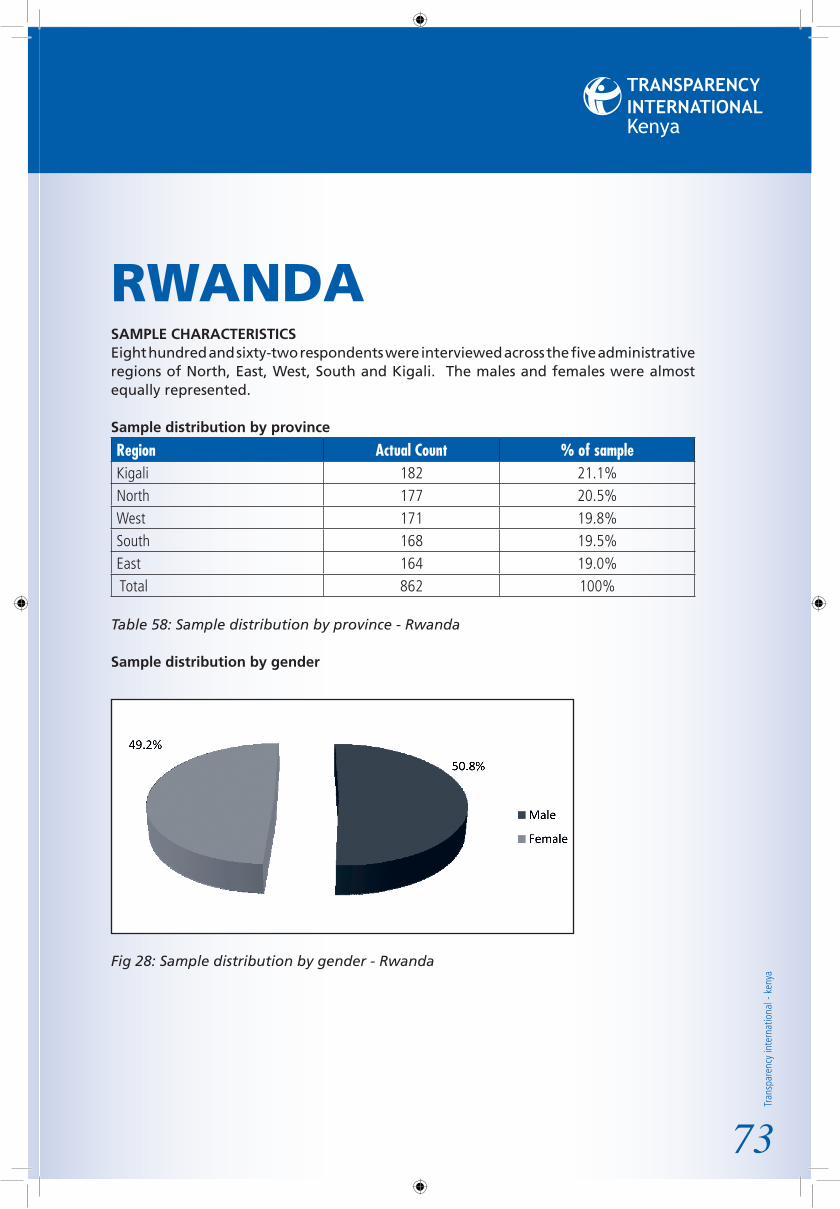
Tran
spar
ency
inte
rnat
iona
l - k
enya
Kenya
RWANDASAMPLE CHARACTERISTICS Eight hundred and sixty-two respondents were interviewed across the five administrative regions of North, East, West, South and Kigali. The males and females were almost equally represented.
Sample distribution by province
Region Actual Count % of sampleKigali 182 21.1%North 177 20.5%West 171 19.8%South 168 19.5%East 164 19.0% Total 862 100%
Table 58: Sample distribution by province - Rwanda
Sample distribution by gender
Fig 28: Sample distribution by gender - Rwanda
73
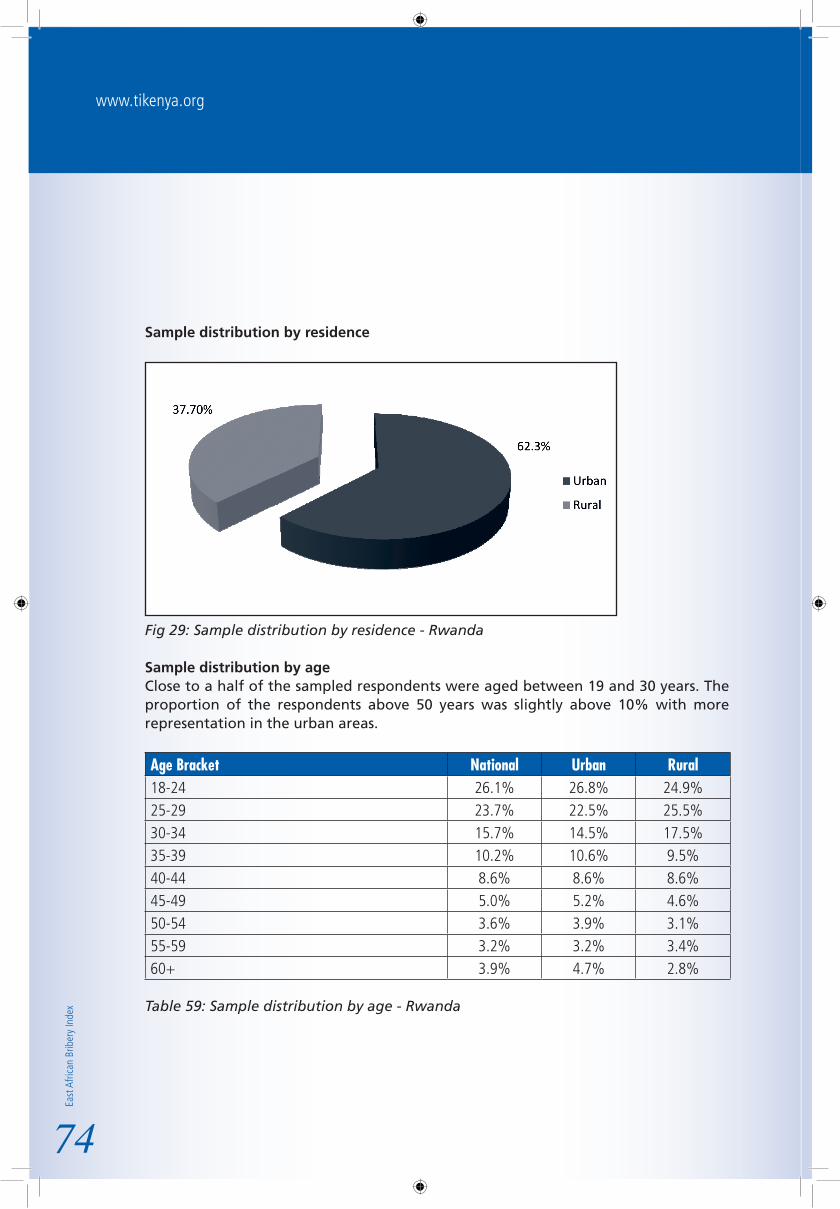
East
Afri
can
Brib
ery
Inde
x
www.tikenya.org
Sample distribution by residence
Fig 29: Sample distribution by residence - Rwanda
Sample distribution by ageClose to a half of the sampled respondents were aged between 19 and 30 years. The proportion of the respondents above 50 years was slightly above 10% with more representation in the urban areas.
Age Bracket National Urban Rural18-24 26.1% 26.8% 24.9%25-29 23.7% 22.5% 25.5%30-34 15.7% 14.5% 17.5%35-39 10.2% 10.6% 9.5%40-44 8.6% 8.6% 8.6%45-49 5.0% 5.2% 4.6%50-54 3.6% 3.9% 3.1%55-59 3.2% 3.2% 3.4%60+ 3.9% 4.7% 2.8%
Table 59: Sample distribution by age - Rwanda
74

Tran
spar
ency
inte
rnat
iona
l - k
enya
Kenya
Sample distribution by education level
Level of education National Urban Rural Primary school 30.3% 24.6% 39.7%Post-primary training 13.1% 12.5% 14.2%Secondary school 43.3% 45.3% 40.0%College education 5.7% 7.1% 3.4%University degree 6.4% 8.9% 2.2%Post-graduate degree 1.3% 1.7% 0.6%
Table 60: Sample distribution by education level - Rwanda
Distribution of the sample by employment statusAbout a third of the respondents were either students or job seekers. A higher proportion of the unemployed respondents were drawn from the rural areas. Only about one and a half% had retired.
Employment status National Urban RuralStudent 15.9% 18.2% 12.0%Unemployed 18.0% 16.4% 20.6%Self-employed 31.7% 28.5% 37.0%Employed in a family business or farm 13.0% 11.9% 14.8%Employed in the private sector 11.5% 13.6% 8.0%Employed by the government/Local authority/Parastatal 6.4% 7.3% 4.9%Employed in the community sector e.g. church, co-operative 2.2% 2.6% 1.5%Retired 1.4% 1.5% 1.2%
Table 61: Sample distribution by employment status - Rwanda
Distribution of the respondents by household IncomeThe majority of the respondents (60.5%) reported a monthly household income of less than Rwanda Francs 70,000 (Kshs 9,692.50). Less than one percent of the respondents reported an income higher than 1, 057, 000 Rwanda Francs (Kshs 146,356.80).
75
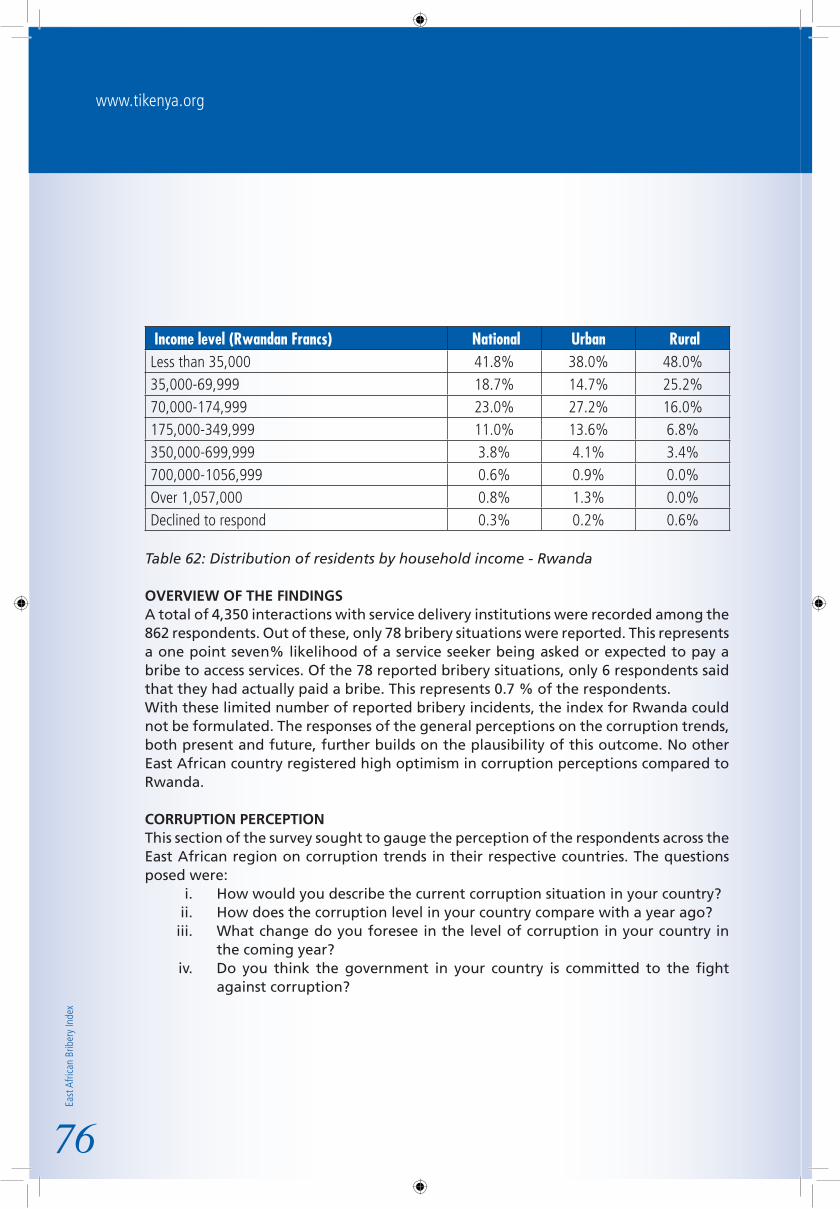
East
Afri
can
Brib
ery
Inde
x
www.tikenya.org
Income level (Rwandan Francs) National Urban Rural Less than 35,000 41.8% 38.0% 48.0%35,000-69,999 18.7% 14.7% 25.2%70,000-174,999 23.0% 27.2% 16.0%175,000-349,999 11.0% 13.6% 6.8%350,000-699,999 3.8% 4.1% 3.4%700,000-1056,999 0.6% 0.9% 0.0%Over 1,057,000 0.8% 1.3% 0.0%Declined to respond 0.3% 0.2% 0.6%
Table 62: Distribution of residents by household income - Rwanda
OVERVIEW OF THE FINDINGSA total of 4,350 interactions with service delivery institutions were recorded among the 862 respondents. Out of these, only 78 bribery situations were reported. This represents a one point seven% likelihood of a service seeker being asked or expected to pay a bribe to access services. Of the 78 reported bribery situations, only 6 respondents said that they had actually paid a bribe. This represents 0.7 % of the respondents.With these limited number of reported bribery incidents, the index for Rwanda could not be formulated. The responses of the general perceptions on the corruption trends, both present and future, further builds on the plausibility of this outcome. No other East African country registered high optimism in corruption perceptions compared to Rwanda.
CORRUPTION PERCEPTIONThis section of the survey sought to gauge the perception of the respondents across the East African region on corruption trends in their respective countries. The questions posed were:
How would you describe the current corruption situation in your country?i. How does the corruption level in your country compare with a year ago?ii. What change do you foresee in the level of corruption in your country in iii. the coming year?Do you think the government in your country is committed to the fight iv. against corruption?
76

Tran
spar
ency
inte
rnat
iona
l - k
enya
Kenya
Perception of the level of corruptionThe perception of Rwandan respondents on corruption to a large extent justifies the negligible levels of bribery in service provision. About 84% of the respondents perceive Rwanda as being just slightly corrupt. Only 12% perceived the country as being either corrupt or extremely corrupt.
Fig 30: Perception of the level of corruption - Rwanda
Percieved change in the level of corruption in the past one yearAsked how corruption levels changed in the past one year, close to 90% reported a perceived reduction. Six percent perceived corruption levels to have remained constant with only one a half% reporting a possible increase.
Fig 31: Perceived change in the level of corruption in the past one year - Rwanda
77

East
Afri
can
Brib
ery
Inde
x
www.tikenya.org
78
Projected level of corruption in Rwanda in the next one yearNinety% of the respondents predict a decrease in corruption levels. Only about six% said the corruption level would either remain unchanged or increase.
Fig 32: Projected level of corruption in the next one year - Rwanda
Perception of the Rwandan government’s commitment to fight corruptionAsked how they judged the government efforts to combat corruption, 97% reported satisfaction while one% were of the contrary opinion.
Fig 33: Rwandans’ perception on the government’s commitment to fight corruption

Tran
spar
ency
inte
rnat
iona
l - k
enya
Kenya

East
Afri
can
Brib
ery
Inde
x
www.tikenya.org
64