Embed Size (px)
Citation preview
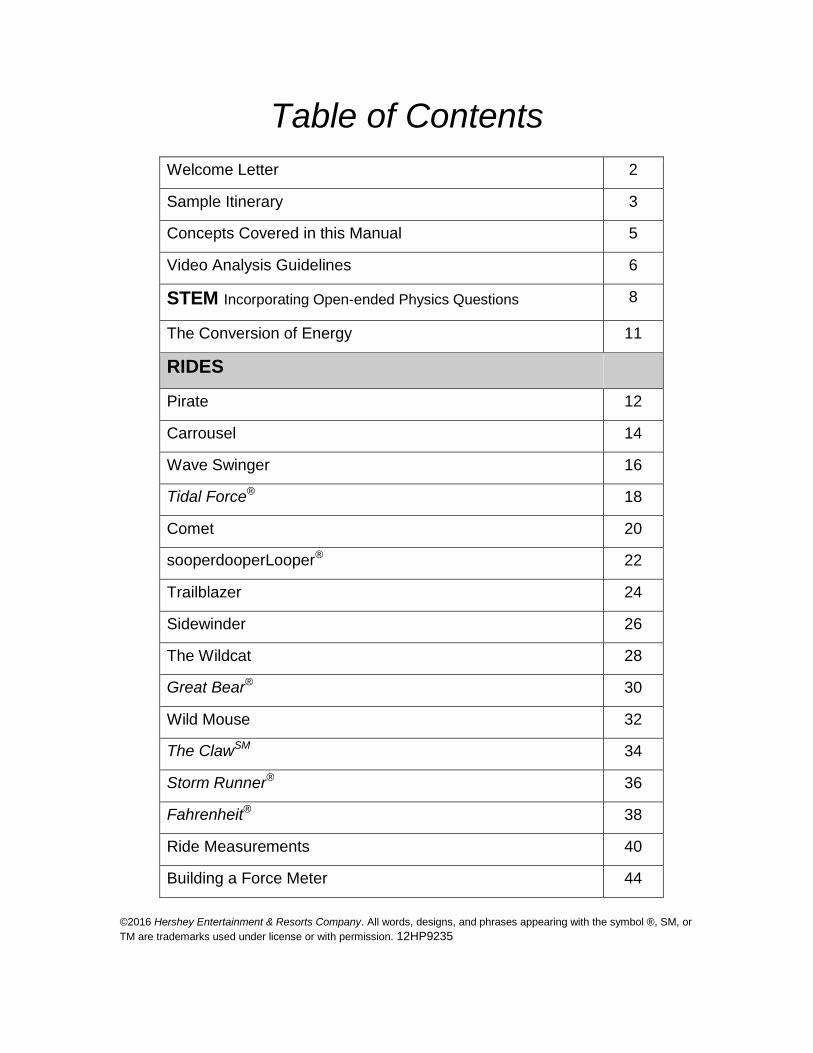
Table of Contents
Welcome Letter 2
Sample Itinerary 3
Concepts Covered in this Manual 5
Video Analysis Guidelines 6
STEM Incorporating Open-ended Physics Questions 8
The Conversion of Energy 11
RIDES
Pirate 12
Carrousel 14
Wave Swinger 16
Tidal Force® 18
Comet 20
sooperdooperLooper® 22
Trailblazer 24
Sidewinder 26
The Wildcat 28
Great Bear® 30
Wild Mouse 32
The ClawSM 34
Storm Runner® 36
Fahrenheit® 38
Ride Measurements 40
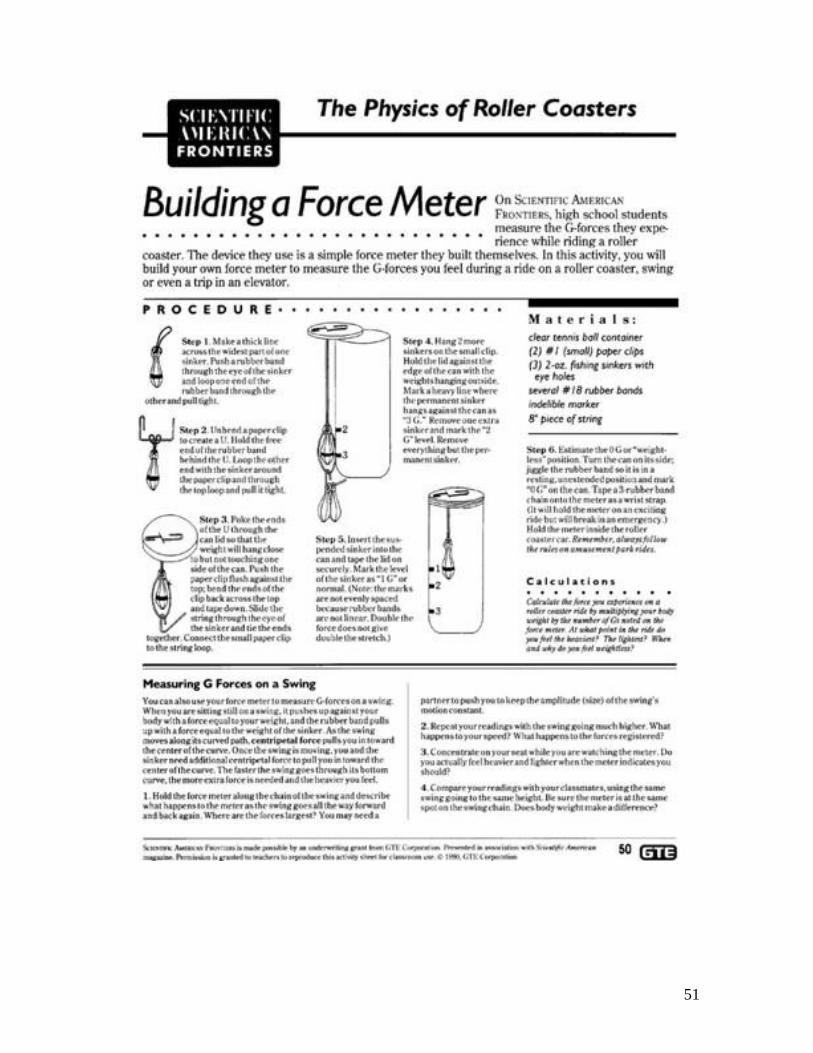
Building a Force Meter 44
©2016 Hershey Entertainment & Resorts Company. All words, designs, and phrases appearing with the symbol ®, SM, or
TM are trademarks used under license or with permission. 12HP9235
2
Welcome to Hersheypark, a proud supporter of STEM education initiatives.
Hersheypark offers laboratory manuals focusing on Math and Physics. Both of
the manuals are designed to give students the opportunity to apply their content
knowledge in a hands-on environment while enjoying the day at one of the
country’s favorite amusement parks.
We have incorporated STEM focus, open-ended, and conservation of energy
activities that will challenge your thinking.
Our educational guides are designed to be a resource as you and your students
plan your Hersheypark adventure. Feel free to choose the activities that best fit
your students and reproduce the worksheets as needed. You will find activities
that are appropriate for a variety of ages, grade levels, and curriculums.
Hersheypark would like to recognize several individuals who have contributed
their time and talents to updating the current Physics Lab Manual. These
individuals are continuing the tradition of educational enrichment within
Hersheypark.
• Pete Vreeland, Upper Merion High School
• Dave McCachren, Mifflin County High School
• Jim Delaney, Manheim Township High School
• Missy Doll, Manheim Township High School
• Chris Manning, Manheim Township High School
Hersheypark would like to extend a Thank You to the following individual for his
continued support of our Education Programs.
• Dr. Geno Torri, Consultant
Hersheypark will gladly accept any recommendations, experiments, or
corrections to our education guides. Please feel free to email your comments or
questions to [email protected].
3
A Message to Educators from Authors
Hersheypark Physics Day offers students a unique opportunity to experience first-hand
the physics concepts learned in the classroom. Over the years, many teachers have,
through trial and error, developed ideas and procedures that make the Physics Day
experience one of the most significant learning events of the year for their students. The
authors would like to offer the following suggestions and advice:
Prior to the trip - administrative preparation:
_____ a. Plan financing of trip.
_____ b. Present proposal to administration for approval.
_____ c. Determine procedures to be used at the Park, like check-in locations and what
to do in the event of an emergency situation.
_____ d. Obtain permission slips from students. NOTE: Be sure that students indicate
any medical concerns (like allergies to bee stings) on their permission slips.
_____ e. Line up transportation.
_____ f. Provide maps of Hersheypark to the students. Discuss locations of emergency
facilities and check-in points.
_____ g. Establish itinerary to maximize educational opportunities.
Typical time schedule:
10 AM Rides open. Begin lab activities. Activities typically take between three
and four hours to complete with good reliability. Lunch-time check-in is a
good time to assess how activities are going.
2:30 PM Experimenting is typically completed by this time making it a good time for
a check-in. Materials can be collected. Some groups leave at this time in
order to arrive at their school at the end of the school day. Other schools
give students free time to enjoy the Park until it closes.
4
Educational preparation:
_____ a. Establish and review safety requirements and emergency procedures.
_____ b. Pretest students on concepts to be reinforced by the field trip.
_____ c. Teach/review concepts that will be dealt with during the trip.
_____ d. Construct accelerometers.
_____ e. Assemble together all materials (lab sheets, pencils, calculators, stop watches,
accelerometers, and plastic bags to carry everything in).
_____ f. Determine number of students per lab group and assign lab group members
(groups of 3 or 4 seem to work best).
_____ g. Set clear objectives and requirements for students (number of rides to analyze,
evaluation procedures that will be applied, follow-up assignments, etc.).
Example: All students must complete worksheet packets on four to five rides of which
at least two must be coasters and two must be non-coasters.
Day of the trip:
_____ 1. Remind students of safety requirements and emergency procedures.
_____ 2. Remind students of check in times and locations.
_____ 3. Students should be prepared for sun or rain (sunscreen is highly
recommended).
_____ 4. Students should bring money for food, phone, and storage locker.
After the trip:
_____ 1. Schedule class time for follow-up discussion of concepts experienced.
_____ 2. Evaluate student work.
_____ 3. Post-test students on concepts.
_____ 4. Put up bulletin board (it’s great motivation for future classes).
We hope that your educational experience goes smoothly and that your students walk
away with a deeper understanding of physics principles.
5
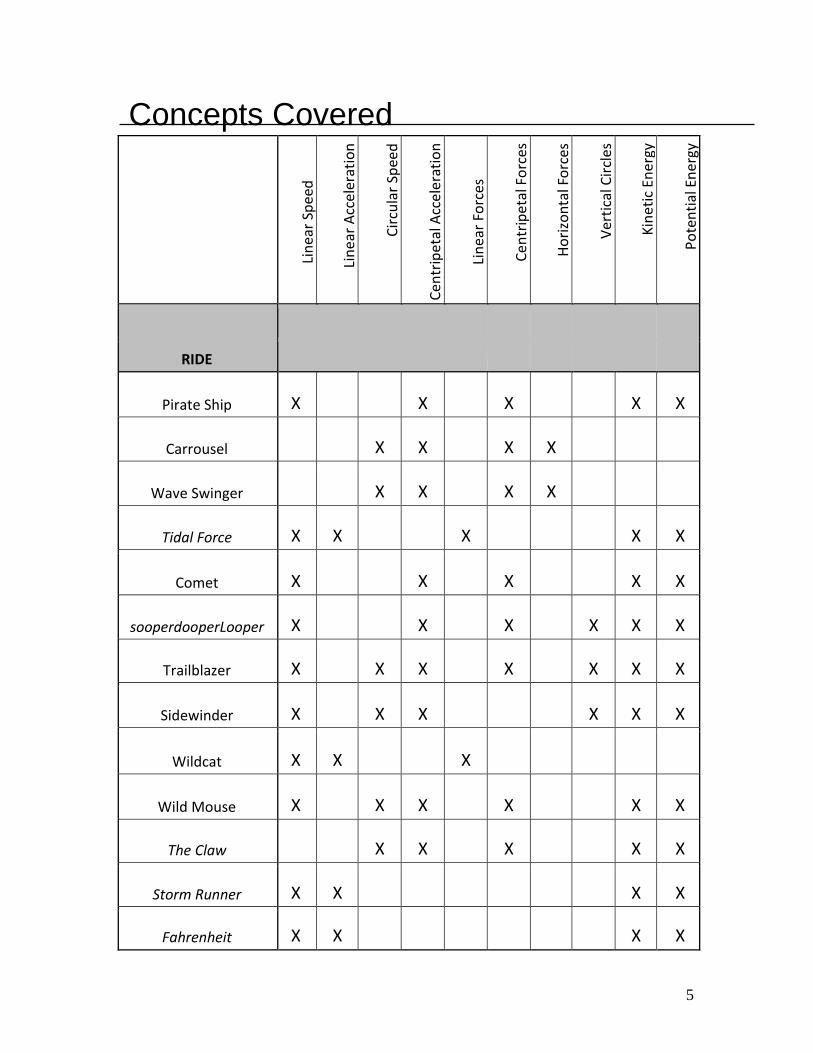
Concepts Covered
RIDE
Pirate Ship X X X X X
Carrousel X X X X
Wave Swinger X X X X
Tidal Force X X X X X
Comet X X X X X
sooperdooperLooper X X X X X X
Trailblazer X X X X X X X
Sidewinder X X X X X X
Wildcat X X X
Wild Mouse X X X X X X
The Claw X X X X X
Storm Runner X X X X
Fahrenheit X X X X
6
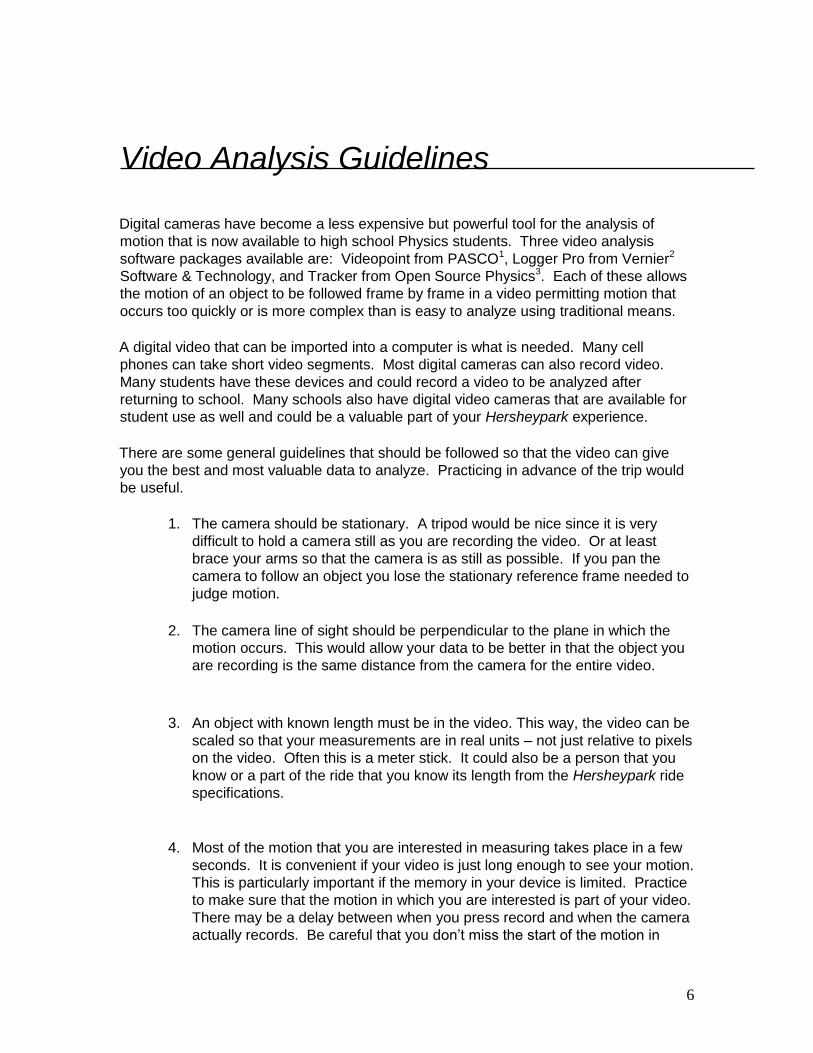
Video Analysis Guidelines
Digital cameras have become a less expensive but powerful tool for the analysis of
motion that is now available to high school Physics students. Three video analysis
software packages available are: Videopoint from PASCO1, Logger Pro from Vernier2
Software & Technology, and Tracker from Open Source Physics3. Each of these allows
the motion of an object to be followed frame by frame in a video permitting motion that
occurs too quickly or is more complex than is easy to analyze using traditional means.
A digital video that can be imported into a computer is what is needed. Many cell
phones can take short video segments. Most digital cameras can also record video.
Many students have these devices and could record a video to be analyzed after
returning to school. Many schools also have digital video cameras that are available for
student use as well and could be a valuable part of your Hersheypark experience.
There are some general guidelines that should be followed so that the video can give
you the best and most valuable data to analyze. Practicing in advance of the trip would
be useful.
1. The camera should be stationary. A tripod would be nice since it is very
difficult to hold a camera still as you are recording the video. Or at least
brace your arms so that the camera is as still as possible. If you pan the
camera to follow an object you lose the stationary reference frame needed to
judge motion.
2. The camera line of sight should be perpendicular to the plane in which the
motion occurs. This would allow your data to be better in that the object you
are recording is the same distance from the camera for the entire video.
3. An object with known length must be in the video. This way, the video can be
scaled so that your measurements are in real units – not just relative to pixels
on the video. Often this is a meter stick. It could also be a person that you
know or a part of the ride that you know its length from the Hersheypark ride
specifications.
4. Most of the motion that you are interested in measuring takes place in a few
seconds. It is convenient if your video is just long enough to see your motion.
This is particularly important if the memory in your device is limited. Practice
to make sure that the motion in which you are interested is part of your video.
There may be a delay between when you press record and when the camera
actually records. Be careful that you don’t miss the start of the motion in

7
which you are interested. If the time that you can record video is not limited,
take several videos so that you have sufficient data to analyze.
5. Please Note: Hersheypark does not allow cameras or measuring devices on;
Skyrush, Storm Runner Fahrenheit, Laff Trakk and the Hershey Tripple
Towers. Hersheypark reserves the right to add any additional rides to this
list, and all riders must listen to the instructions given by the ride operators at
all times.
1
PASCO
10101 Foothills Blvd
Roseville, CA 95747 800-772-8700 www.pasco.com
2
Vernier Software & Technology
13979 SW Millikan Way
Beaverton, OR 97005 888-837-6437 www.vernier.com
3
Open Source Physics www.opensourcephysics.org
8
STEM Focus Questions
Science:
1. As a general rule, a roller coaster reaches its maximum speed at the bottom of
the first hill. Using the information about the specifications of the Park’s rides,
devise a method for calculating the speed of a roller coaster at the bottom of the
first hill and complete the calculation for one of the roller coasters at the Park.
2. Of all of the rides at the Park, which ride produces the greatest gravitational
potential energy in a passenger on that ride? Explain how you would calculate
the energy of this ride.
Technology:
1. What technologies are used to control the potential and kinetic energy of the
roller coaster cars as it moves from the station, through the ride, and back to the
station?
2. Some of the roller coasters in the Park are constructed primarily out of wood
while others are constructed primarily out of steel. How has the use of these two
different technologies influenced the designs of the classic wooden roller coaster
and the modern steel roller coaster?
Engineering:
1. Look at several different roller coasters in the Park and find the ones that have
vertical loops. Where in these rides are the loops located (towards the
beginning, middle, or end)? Why are they placed there? Are there any roller
coasters that are different from the rest in terms of the placement of the vertical
loop?
2. The track for a roller coaster is often built with banked turns at the bottom of hills.
Why do the roller coaster engineers place these bank turns at the bottom of the
hills and why are these turns banked?
9
Mathematics:
1. Every ride at the amusement park has a ride capacity. The ride capacity is the
number of people who can ride each hour. Devise and explain a method for
calculating the ride capacity for a ride at the Park and then complete that
calculation. What are the characteristics of rides with a low ride capacity? What
are the characteristics of a ride with a high ride capacity?
2. The amount of time that you wait in a line for a ride can be used to determine
how many people were in front of you in the line when you joined it. Devise and
explain a method for determining how many people were in front of you in line.
10
Open-ended Physics Day Questions
Note: These questions are designed to engage students in some qualitative and
quantitative analysis of the application of physics concepts at an amusement park.
Since each question requires them to essentially design a methodology for developing a
solution to the question, students may approach any particular question differently. As a
result, there may be several different solutions to the same question and there may be
more than one right answer.
What if? The log flume is a ride that sends riders down a long slope into a pond, producing a
rather large wave. Does the size of the wave depend on the number of people in the
car? What happens to the size of the wave if someone large is in the front of the flume?
What if someone large is in the back of the flume? What if you wanted to ride the flume
and not get wet, where would you sit?
Why do they do that? Look at several different roller coasters in the Park and find the ones that have vertical
loops. Where in these rides are the loops located (towards the beginning, middle, or
end)? Why are they placed there? Are there any roller coasters that are different from
the rest in terms of the placement of the vertical loop?
When a roller coaster enters a turn, it follows a track that is banked. Why do they bank
turns for roller coasters? You may notice that some turns are banked at larger angles
than other turns. Why do those turns require a larger angle?
How much is that? As a general rule, a roller coaster reaches its maximum speed at the bottom of the first
hill. Using the information about the specifications of the Park’s rides, devise a method
for calculating the speed of a roller coaster at the bottom of the first hill and complete the
calculation for one of the roller coasters at the Park.
Compare all of the rides at Hersheypark. Which ride produces the greatest gravitational
potential energy in a passenger on that ride? Explain how you would calculate the
energy of this ride.
Every ride at the amusement park has a ride capacity. The ride capacity is the number
of people who can ride each hour. Devise and explain a method for calculating the ride
capacity for a ride at the Park and then complete that calculation. What are the
characteristics of rides with a low ride capacity? What are the characteristics of a ride
with a high ride capacity?
11
Where in the Park would you be moving with the greatest velocity? Support your answer
with data. Where in the Park would you have the greatest acceleration? Support your
answer data.
The Conservation of Energy
In this activity, you need to identify three different rides at Hersheypark (selecting one
ride from each category listed below; two rides from the same category are not
permitted) and describe the similarities in how each ride demonstrates the key concepts
of the conservation of energy. Where appropriate, incorporate calculations with your
explanation.
Conservation of energy key concepts:
• Potential energy
• Kinetic energy
• Thermal energy
• Work
• Energy transformation
Ride Categories:
• Roller coasters
• Water rides
• Free-fall rides
• Vertical circle rides
• Horizontal circle rides
Your analysis can include data from:
• Ride technical specifications located at the back of this Physics Guide
• Stop watches
• Video of the rides
• Sensor data from passengers who rode the rides
Your analysis should address the following points:
• How the rides provide passengers with potential energy
• How the passengers’ potential energy is transformed into kinetic energy
• How some of the passengers’ potential and kinetic energy is transformed into
thermal energy
• How work is done on the passengers to give them potential energy or change
kinetic energy
• How friction works to transform kinetic energy into thermal energy
12
Note: In this type of assignment, students may start this activity as a pre-trip pre-lab,
spend a majority of their time at Hersheypark collecting data to answer the questions,
and finish their write-up back at the school. The format of their write-up can take any
form - lab report, class presentation, podcast, movie, wikispace website, etc.
13
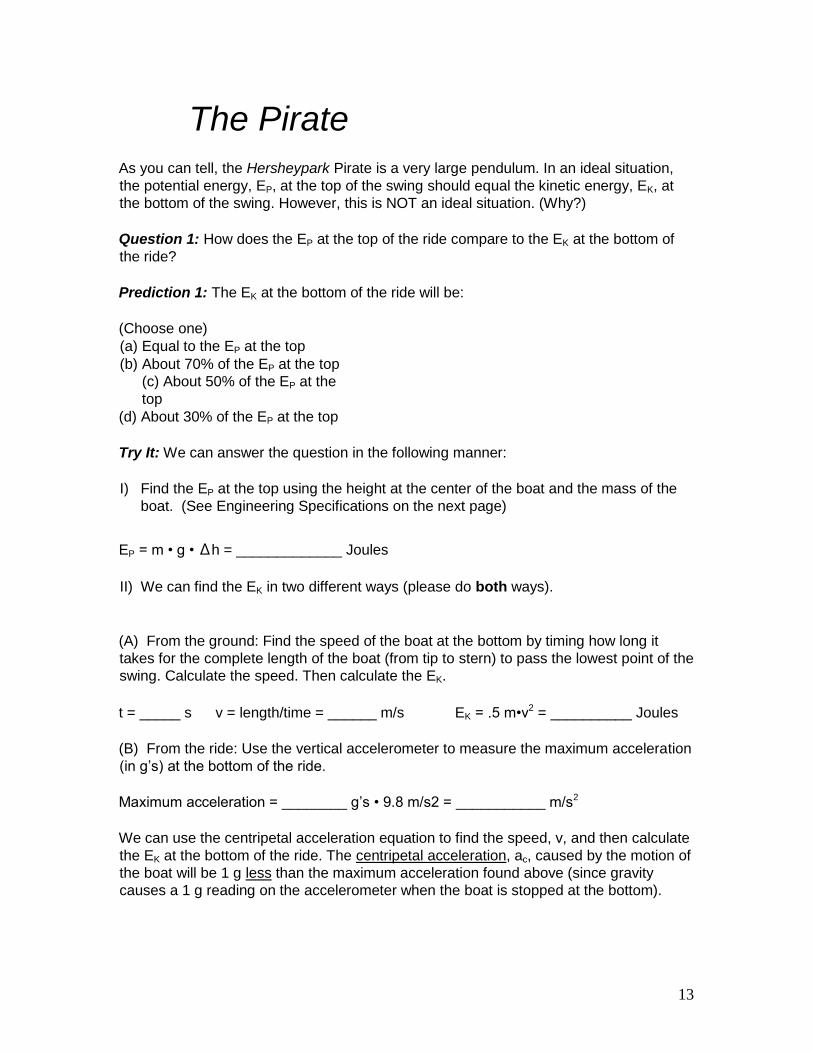
The Pirate
As you can tell, the Hersheypark Pirate is a very large pendulum. In an ideal situation,
the potential energy, EP, at the top of the swing should equal the kinetic energy, EK, at
the bottom of the swing. However, this is NOT an ideal situation. (Why?)
Question 1: How does the EP at the top of the ride compare to the EK at the bottom of
the ride?
Prediction 1: The EK at the bottom of the ride will be:
(Choose one)
(a) Equal to the EP at the top
(b) About 70% of the EP at the top
(c) About 50% of the EP at the
top
(d) About 30% of the EP at the top
Try It: We can answer the question in the following manner:
I) Find the EP at the top using the height at the center of the boat and the mass of the
boat. (See Engineering Specifications on the next page)
EP = m • g • ∆h = _____________ Joules
II) We can find the EK in two different ways (please do both ways).
(A) From the ground: Find the speed of the boat at the bottom by timing how long it
takes for the complete length of the boat (from tip to stern) to pass the lowest point of the
swing. Calculate the speed. Then calculate the EK.
t = _____ s v = length/time = ______ m/s EK = .5 m•v2 = __________ Joules
(B) From the ride: Use the vertical accelerometer to measure the maximum acceleration
(in g’s) at the bottom of the ride.
Maximum acceleration = ________ g’s • 9.8 m/s2 = ___________ m/s2
We can use the centripetal acceleration equation to find the speed, v, and then calculate
the EK at the bottom of the ride. The centripetal acceleration, ac, caused by the motion of
the boat will be 1 g less than the maximum acceleration found above (since gravity
causes a 1 g reading on the accelerometer when the boat is stopped at the bottom).
14
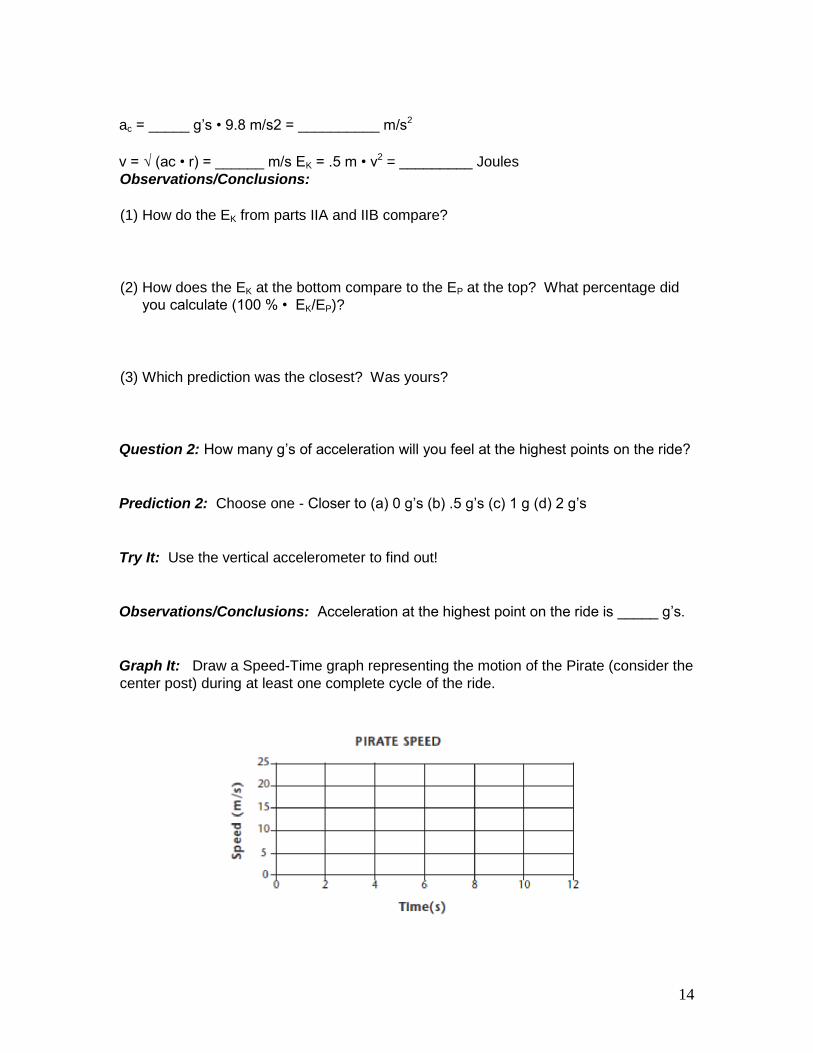
ac = _____ g’s • 9.8 m/s2 = __________ m/s2
v = √ (ac • r) = ______ m/s EK = .5 m • v2 = _________ Joules
Observations/Conclusions:
(1) How do the EK from parts IIA and IIB compare?
(2) How does the EK at the bottom compare to the EP at the top? What percentage did
you calculate (100 % • EK/EP)?
(3) Which prediction was the closest? Was yours?
Question 2: How many g’s of acceleration will you feel at the highest points on the ride?
Prediction 2: Choose one - Closer to (a) 0 g’s (b) .5 g’s (c) 1 g (d) 2 g’s
Try It: Use the vertical accelerometer to find out!
Observations/Conclusions: Acceleration at the highest point on the ride is _____ g’s.
Graph It: Draw a Speed-Time graph representing the motion of the Pirate (consider the
center post) during at least one complete cycle of the ride.
15
Engineering Specifications:
Mass of Boat: 9500 kilograms g = 9.8 m/s2
Maximum height of center of Boat: 13.6 meters
Length of Boat: 13.1 meters
Radius of Pendulum: 13.6 meters
A mild ride for winding down or just taking it easy after some challenging rides.
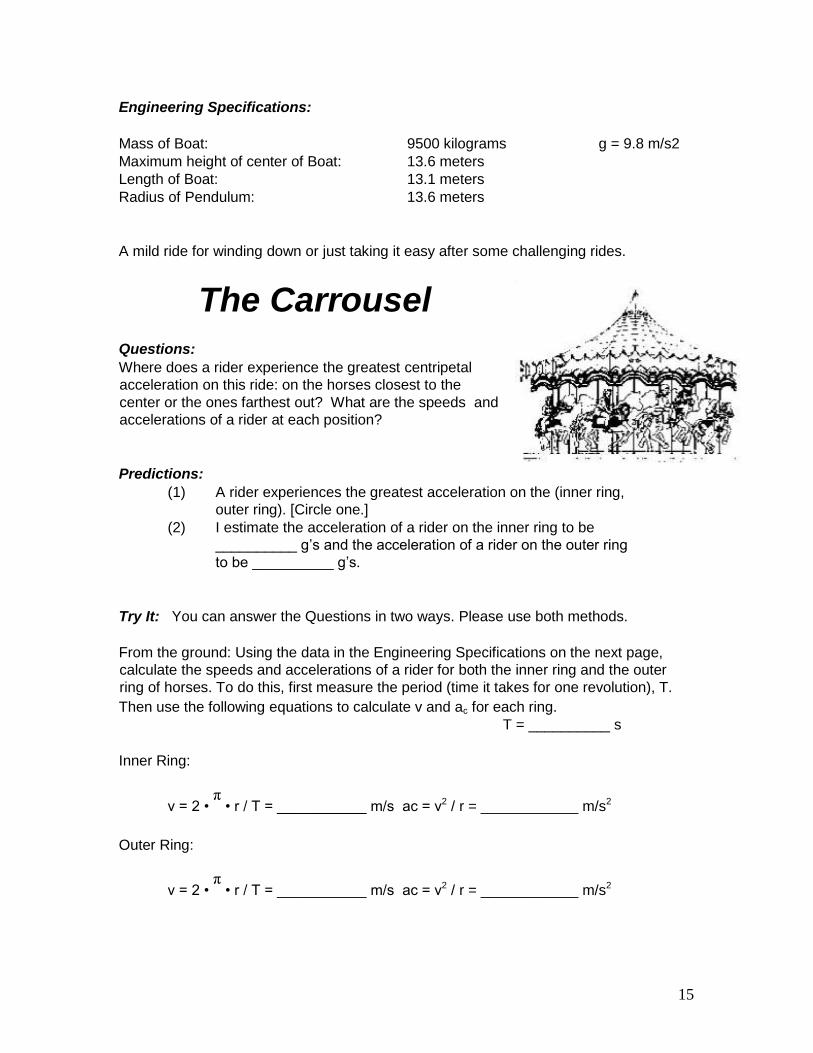
The Carrousel
Questions:
Where does a rider experience the greatest centripetal
acceleration on this ride: on the horses closest to the
center or the ones farthest out? What are the speeds and
accelerations of a rider at each position?
Predictions:
(1) A rider experiences the greatest acceleration on the (inner ring,
outer ring). [Circle one.]
(2) I estimate the acceleration of a rider on the inner ring to be
__________ g’s and the acceleration of a rider on the outer ring
to be __________ g’s.
Try It: You can answer the Questions in two ways. Please use both methods.
From the ground: Using the data in the Engineering Specifications on the next page,
calculate the speeds and accelerations of a rider for both the inner ring and the outer
ring of horses. To do this, first measure the period (time it takes for one revolution), T.
Then use the following equations to calculate v and ac for each ring.
T = __________ s Inner Ring:
v = 2 • π • r / T = ___________ m/s ac = v2 / r = ____________ m/s2
Outer Ring:
v = 2 • π • r / T = ___________ m/s ac = v2 / r = ____________ m/s2
16
On the ride: Use the horizontal accelerometer to measure the centripetal acceleration at
each position. Be sure the accelerometer is horizontal - you can hold it against the post
you hold on to - and aim it toward the center of the circle. Remember: The tangent of the
angle gives the number of g’s of acceleration.
ac for the inner ring = _____________ g’s • 9.8 m/s2 = ___________ m/s2
ac for the outer ring = _____________ g’s • 9.8 m/s2 = ___________ m/s2
Observations/Conclusions:
Where did your measurements show the greatest acceleration?
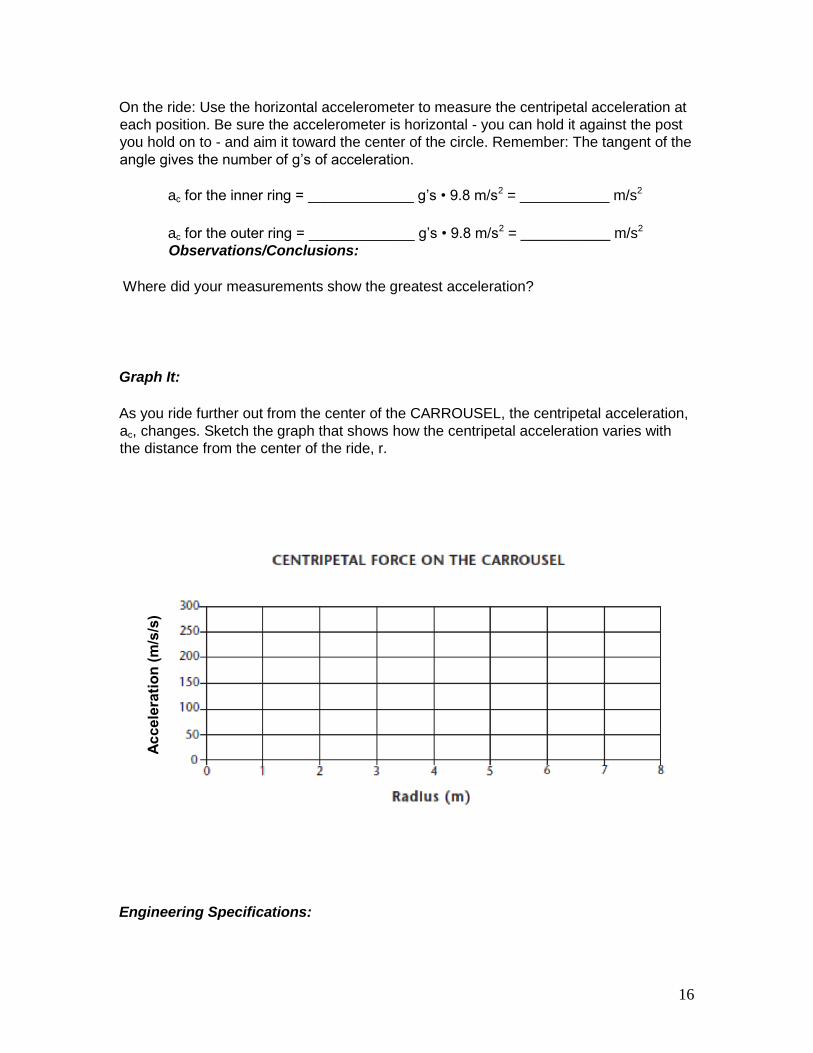
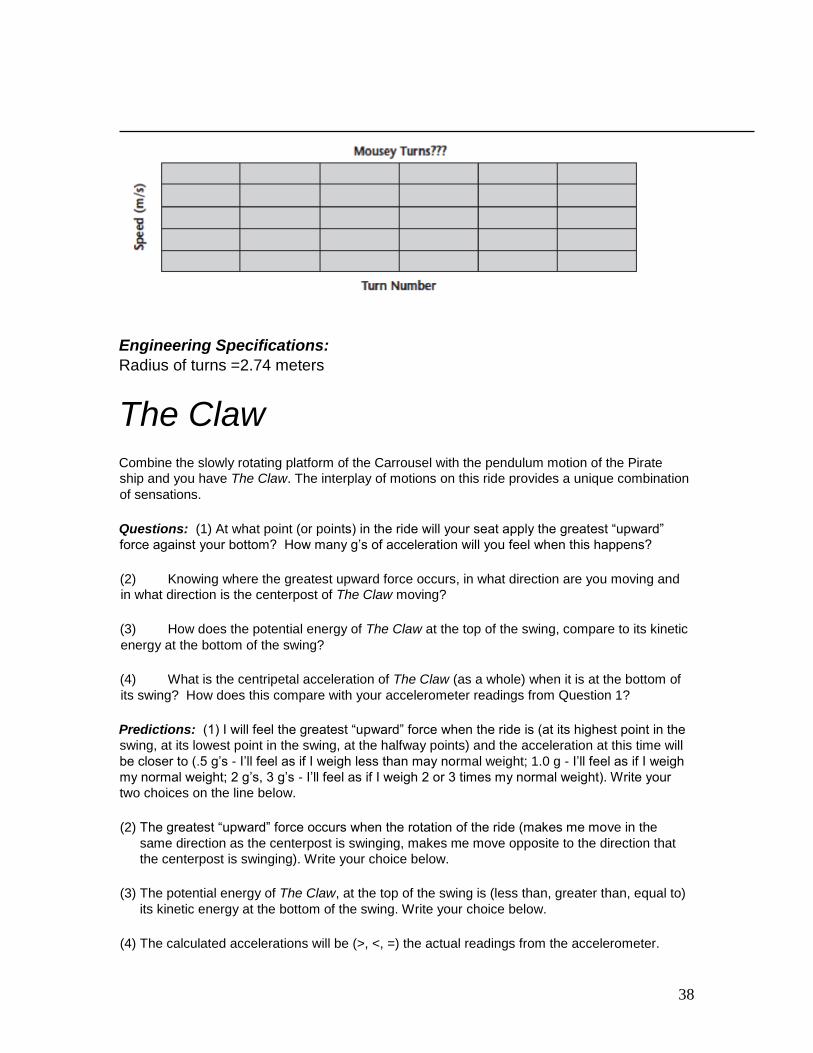
Graph It:
As you ride further out from the center of the CARROUSEL, the centripetal acceleration,
ac, changes. Sketch the graph that shows how the centripetal acceleration varies with
the distance from the center of the ride, r.
Engineering Specifications:
17
Inner Radius = 5.3 meters π = 3.14
Outer Radius = 7.2 meters
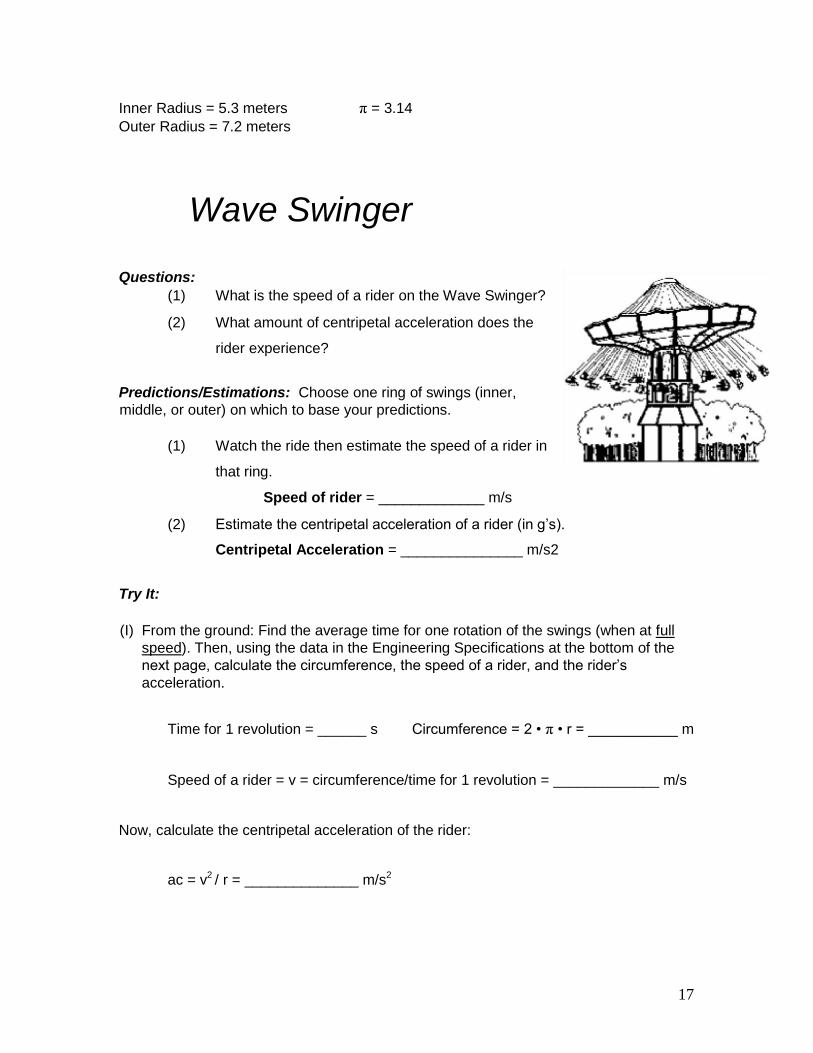
Wave Swinger Questions:
(1) What is the speed of a rider on the Wave Swinger?
(2) What amount of centripetal acceleration does the
rider experience?
Predictions/Estimations: Choose one ring of swings (inner,
middle, or outer) on which to base your predictions.
(1) Watch the ride then estimate the speed of a rider in
that ring.
Speed of rider = _____________ m/s
(2) Estimate the centripetal acceleration of a rider (in g’s).
Centripetal Acceleration = _______________ m/s2
Try It:
(I) From the ground: Find the average time for one rotation of the swings (when at full
speed). Then, using the data in the Engineering Specifications at the bottom of the
next page, calculate the circumference, the speed of a rider, and the rider’s
acceleration.
Time for 1 revolution = ______ s Circumference = 2 • π • r = ___________ m
Speed of a rider = v = circumference/time for 1 revolution = _____________ m/s
Now, calculate the centripetal acceleration of the rider:
ac = v2 / r = ______________ m/s2
18
(II) On the ride: When the ride is at full speed, use the horizontal accelerometer to
measure the centripetal acceleration. Hold the top of the accelerometer parallel to
the chains holding the swings. Record the angle measurement below. [To find the
- your angle measurement.]
Angle measurement = __________° Acceleration = tan Θ = missing?_g’s
Observations/Conclusions:
Were your predictions correct? Is the acceleration a relatively large or small one? How
do you decide?
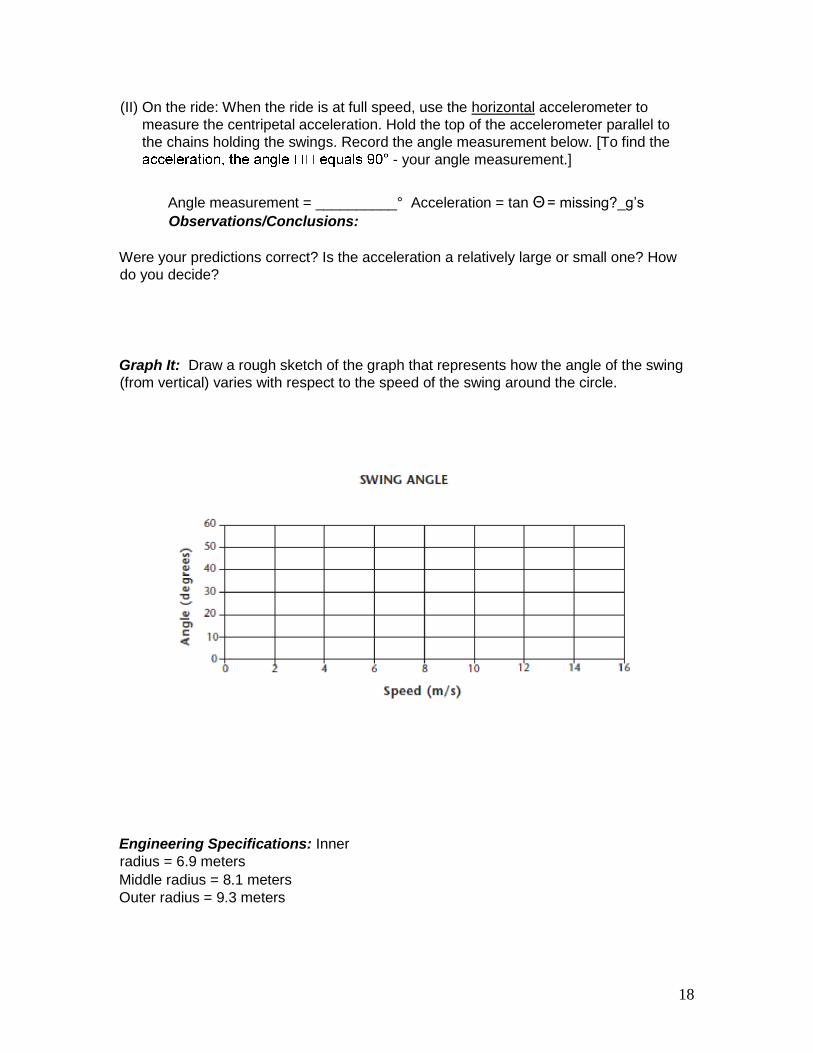
Graph It: Draw a rough sketch of the graph that represents how the angle of the swing
(from vertical) varies with respect to the speed of the swing around the circle.
Engineering Specifications: Inner
radius = 6.9 meters
Middle radius = 8.1 meters
Outer radius = 9.3 meters

19
20
TIDAL FORCE Have fun riding, but, this is one ride where all measurements are
taken from the ground! Please be sure the accelerometers don’t
get wet on this ride. Let someone else hold your equipment while
you ride.
Question: What is the acceleration of the boat as it is brought to a
stop by the water and what is the stopping force applied by the
water?
Prediction: Take a guess at how many g’s of acceleration the
riders undergo as the boat is brought to a stop.
Acceleration at the bottom = ____________ g’s
Try It: Use the following calculations.
(I) For simplicity, let’s assume that the kinetic energy, EK, of the boat at the bottom
of the run is equal to the potential energy, EP, of the boat at the top of the hill.
Calculate how fast the boat is moving at the bottom of the hill.
EK at the bottom = EP at the top = m • g • ∆h = _____________________ J
v (at the bottom) = √(2 • EK / mass) = _________________ m/s
(II) Now, we need to time how long it takes for the water to bring the boat to a slow
constant velocity. Use the stopwatch to see how long it is from the time the boat just
enters the water until the time the boat stops making its big splash.
time = ____________ s
(III) We’ll estimate the speed of the boat when it stops splashing to be about 3 m/s.
The acceleration of the boat (and its passengers) will be:
3 m/s - v (at the bottom of the hill)
a = _______________________________ = _________ m/s2 [÷9.8 m/s2 = ______ g’s]
time to stop
(IV) Using the mass of the full boat given in the specs and the acceleration (in m/s2) from
#III above, the stopping force of the water will be:
Observations/Conclusions:
21
Σ F = m • a = _____________________
How many g’s of acceleration does the boat undergo? How does the stopping force
compare to your weight in N (your weight in pounds x 4.45)?
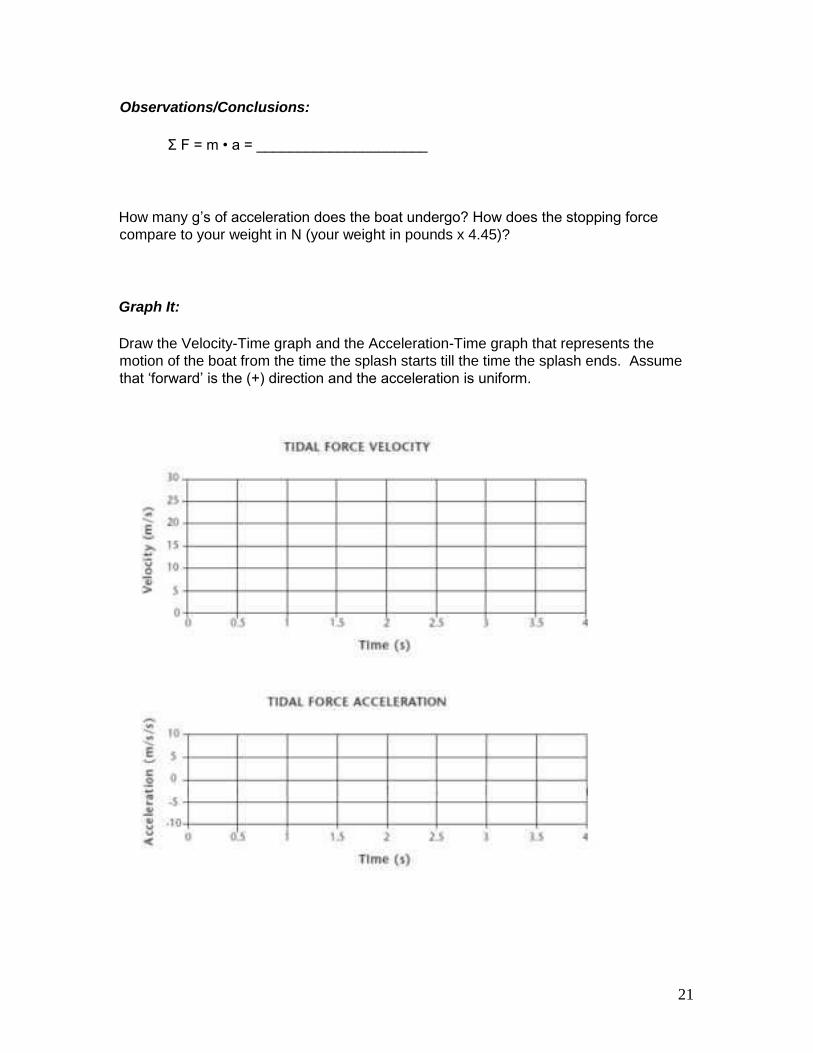
Graph It:
Draw the Velocity-Time graph and the Acceleration-Time graph that represents the
motion of the boat from the time the splash starts till the time the splash ends. Assume
that ‘forward’ is the (+) direction and the acceleration is uniform.
22
Engineering Specifications:
Mass of the full boat = 4100 kg g = 9.8 m/s2
Height of the hill = 30 meters
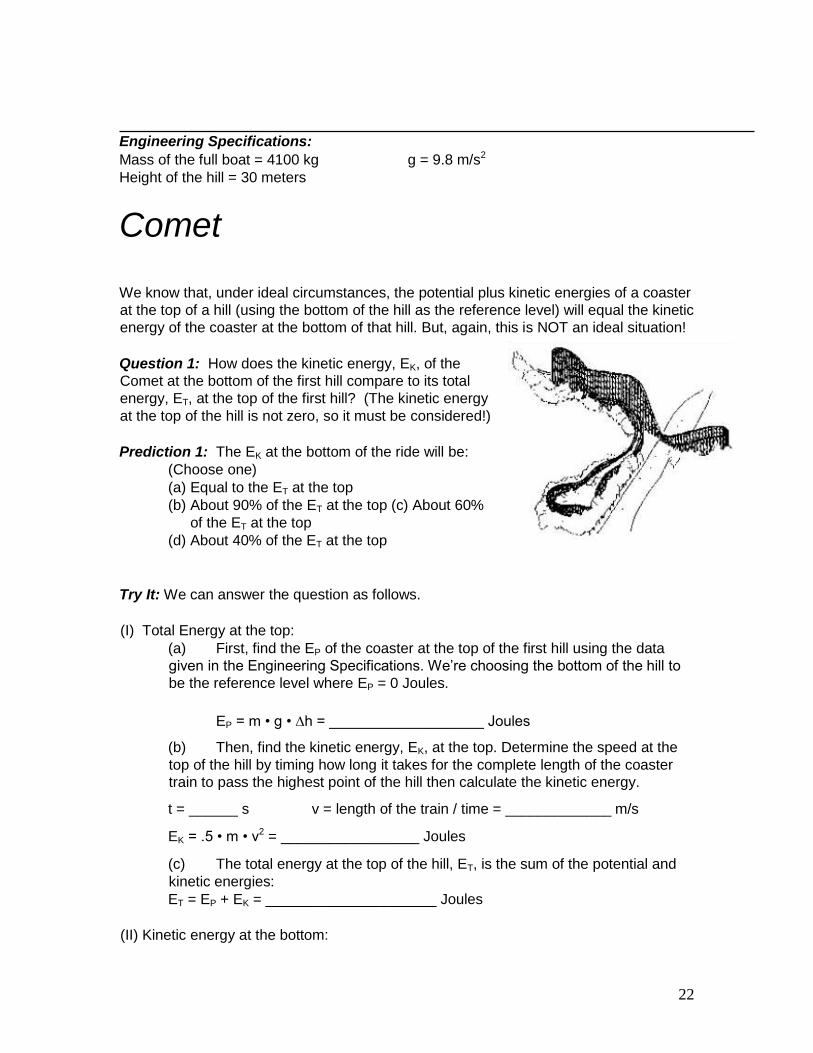
Comet
We know that, under ideal circumstances, the potential plus kinetic energies of a coaster
at the top of a hill (using the bottom of the hill as the reference level) will equal the kinetic
energy of the coaster at the bottom of that hill. But, again, this is NOT an ideal situation!
Question 1: How does the kinetic energy, EK, of the
Comet at the bottom of the first hill compare to its total
energy, ET, at the top of the first hill? (The kinetic energy
at the top of the hill is not zero, so it must be considered!)
Prediction 1: The EK at the bottom of the ride will be:
(Choose one)
(a) Equal to the ET at the top
(b) About 90% of the ET at the top (c) About 60%
of the ET at the top
(d) About 40% of the ET at the top
Try It: We can answer the question as follows.
(I) Total Energy at the top:
(a) First, find the EP of the coaster at the top of the first hill using the data
given in the Engineering Specifications. We’re choosing the bottom of the hill to
be the reference level where EP = 0 Joules.
EP = m • g • ∆h = ___________________ Joules
(b) Then, find the kinetic energy, EK, at the top. Determine the speed at the
top of the hill by timing how long it takes for the complete length of the coaster
train to pass the highest point of the hill then calculate the kinetic energy.
t = ______ s v = length of the train / time = _____________ m/s
EK = .5 • m • v2 = _________________ Joules
(c) The total energy at the top of the hill, ET, is the sum of the potential and
kinetic energies:
ET = EP + EK = _____________________ Joules
(II) Kinetic energy at the bottom:
Observations/Conclusions:
23
Determine the speed at the bottom of the hill by timing how long it takes for the complete
length of the coaster train to pass the lowest point at the bottom of the hill then calculate
the kinetic energy.
t = ______ s
v = train length / time = __________ m/s EK = .5 • m • v2 = ______Joules
(1) Calculate the percentage (100% • K/ET)? How does
the EK at the bottom compare to the ET at the top?
(2) Which prediction was the closest? Was yours?
Question 2: How does the vertical acceleration at the bottom of the second hill compare
to the vertical acceleration at the bottom of the first hill?
Prediction 2: The acceleration at the bottom of the second hill will be:
(a) About the same as the acceleration at the bottom of the first hill
(b) Much less than the acceleration at the bottom of the first hill
(c) Much greater than the acceleration at the bottom of the first hill
(d) A little less than the acceleration at the bottom of the first hill
(e) A little more than the acceleration at the bottom of the first hill
Try It: Use the vertical accelerometer to find out!
Acceleration at bottom of first hill = _____________ g’s
Acceleration at bottom of second hill = _____________ g’s
Observations/Conclusions: Which hill had the greater acceleration at the bottom?
Why is this true?
24
Engineering Specifications:
Mass of train (full) = 4300 kg Length of train = 12.2 meters
Vertical drop for the first hill = 24.4 meters g = 9.8 m/s2
sooperdooperLooper We know that, under ideal circumstances, the potential plus kinetic energies of a coaster
at the top of a hill (using the bottom of the hill as the reference level) will equal the kinetic
energy of the coaster at the bottom of that hill. But, again, this is
NOT an ideal situation!
Question 1: How does the kinetic energy, EK, of the Looper at the
bottom of the first hill compare to its total energy, ET, at the top of
the first hill? (The kinetic energy at the top of the hill is not zero, so
it must be considered!)
Prediction 1: The EK at the bottom of the ride will be:
(Choose one)
(a) Equal to the ET at the top
(b) About 90% of the ET at the top
(c) About 60% of the ET at the top
(d) About 40% of the ET at the top
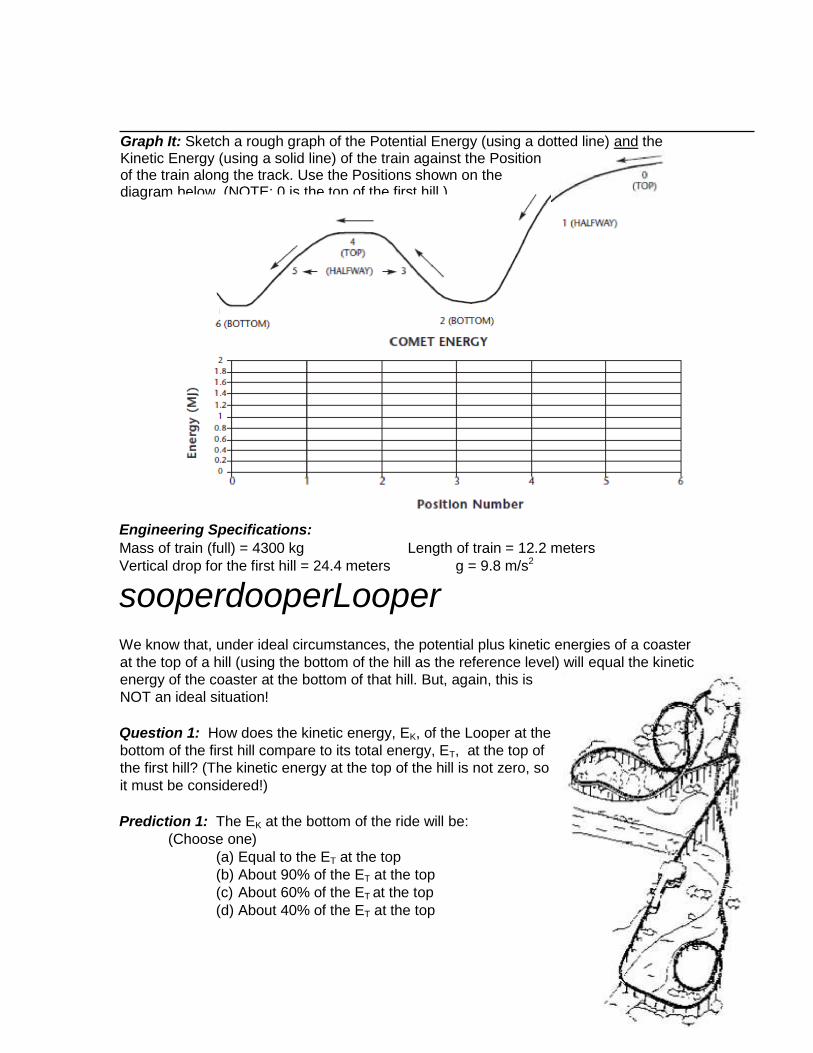
Graph It: Sketch a rough graph of the Potential Energy (using a dotted line) and the Kinetic Energy (using a solid line) of the train against the Position of the train along the track. Use the Positions shown on the diagram below. (NOTE: 0 is the top of the first hill.)
Observations/Conclusions:
25
Try It: We can answer the question as follows.
(I) Total Energy at the top:
(a) First, find the EP of the coaster at the top of the first hill using the
data given in the Engineering Specifications. We’re choosing the bottom of
the hill to be the reference level where EP = 0 Joules.
EP = m • g • ∆h = ___________________ Joules (b) Then, find the kinetic
energy, EK, at the top. Determine the speed at the top of the hill by timing
how long it takes for the complete length of the coaster train to pass the
highest point of the hill then calculate the kinetic energy.
t = ______ s v = length of the train / time = _____________ m/s
EK = .5 • m • v2 = _________________ Joules
(c) The total energy at the top of the hill, ET, is the sum of the potential and
kinetic energies:
ET = EP + EK = _____________________ Joules
(II) Kinetic energy at the bottom:
Determine the speed at the bottom of the hill by timing how long it takes for the complete
length of the coaster train to pass the lowest point at the bottom of the hill then calculate
the kinetic energy.
t = ______ s v = length of the train / time = _____________ m/s
EK = .5 • m • v2 = _________________ Joules
(1) Calculate the percentage (100 % • EK/ET)? How does
the EK at the bottom compare to the ET at the top?
(2) Which prediction was the closest? Was yours?
Question 2: How many g’s of acceleration will you feel (a)
at the bottom of the loop?
(b) at the top of the loop?
Prediction 2: What do you think?
(a) Acceleration at the bottom will be closer to (.5, 1, 2, 3) g’s. (Choose
one) (b) Acceleration at the top will be closer to (.5, 1, 2, 3) g’s. (Choose one)
26
Try It: Use the vertical accelerometer to answer the question. Record your readings
below. (HINT: Have your partner yell “NOW” when you are at the bottom and again
when you are at the top - it’s hard to tell when reading the accelerometer!)
(a) Accelerometer reading at the bottom = ___________ g’s
(b) Accelerometer reading at the top = ____________ g’s
Observations/Conclusions: Were the readings what you expected? Why or why not?
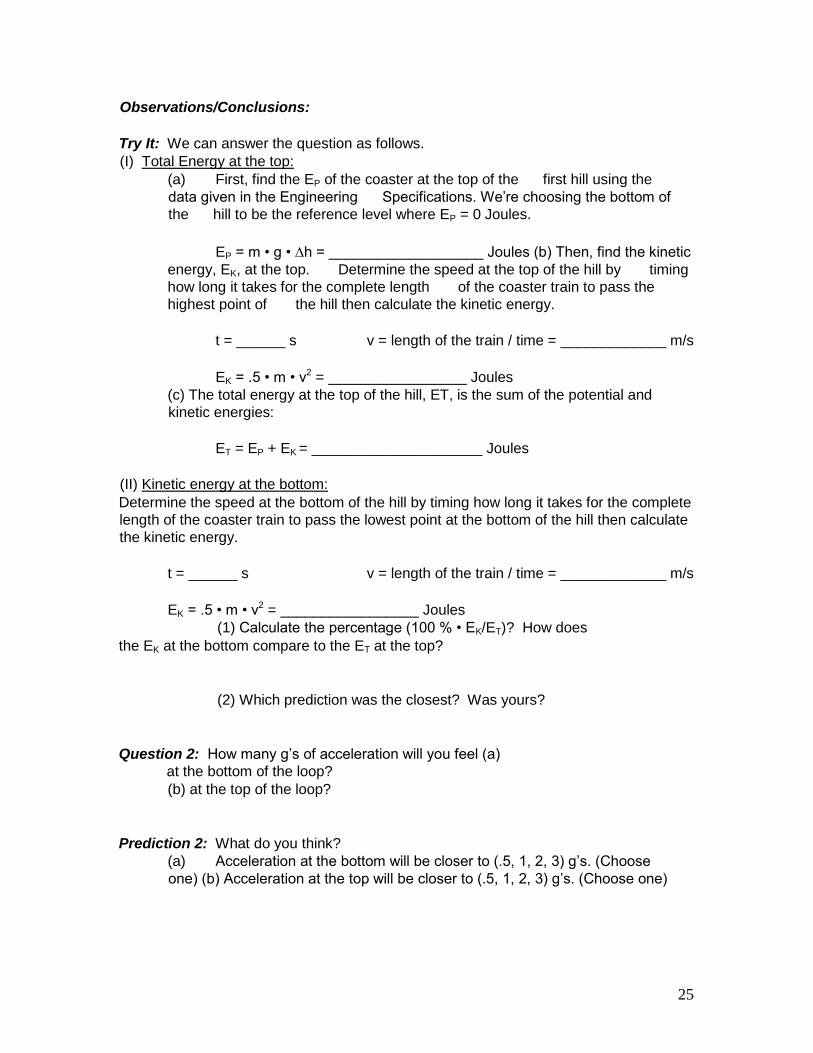
Graph It: Graph the Potential Energy of the coaster against Time from the top of the
first hill through the loop to the end of the loop.
Engineering Specifications: Mass
of train (full) = 4300 kg
Length of train = 13 meters
Height of first hill = 25 meters g = 9.8 m/s2
27
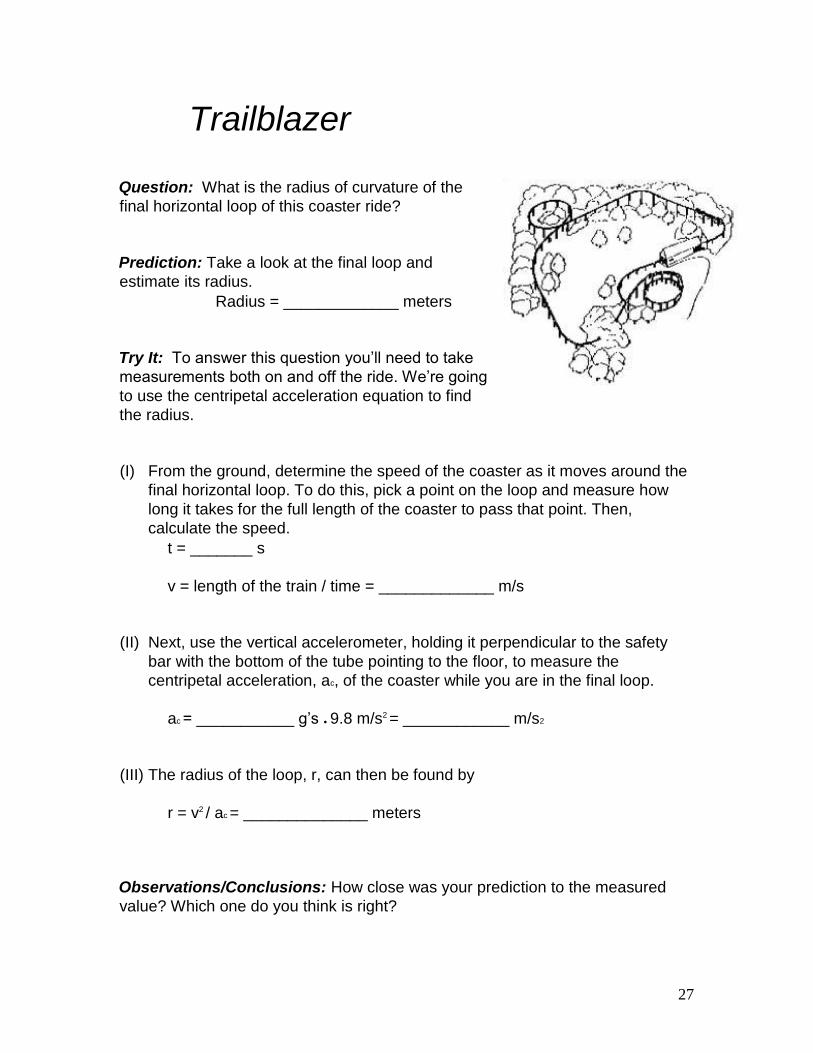
Trailblazer
Question: What is the radius of curvature of the
final horizontal loop of this coaster ride?
Prediction: Take a look at the final loop and
estimate its radius.
Radius = _____________ meters
Try It: To answer this question you’ll need to take
measurements both on and off the ride. We’re going
to use the centripetal acceleration equation to find
the radius.
(I) From the ground, determine the speed of the coaster as it moves around the
final horizontal loop. To do this, pick a point on the loop and measure how
long it takes for the full length of the coaster to pass that point. Then,
calculate the speed.
t = _______ s
v = length of the train / time = _____________ m/s
(II) Next, use the vertical accelerometer, holding it perpendicular to the safety
bar with the bottom of the tube pointing to the floor, to measure the
centripetal acceleration, ac, of the coaster while you are in the final loop.
ac = ___________ g’s • 9.8 m/s2 = ____________ m/s2
(III) The radius of the loop, r, can then be found by
r = v2 / ac = ______________ meters
Observations/Conclusions: How close was your prediction to the measured
value? Which one do you think is right?
28
Graph It: Sketch the graph of the Force on your seat against the Time you are in
the horizontal loop at the end of the ride.
Engineering Specifications:
Length of the coaster = 14.6 meters
29
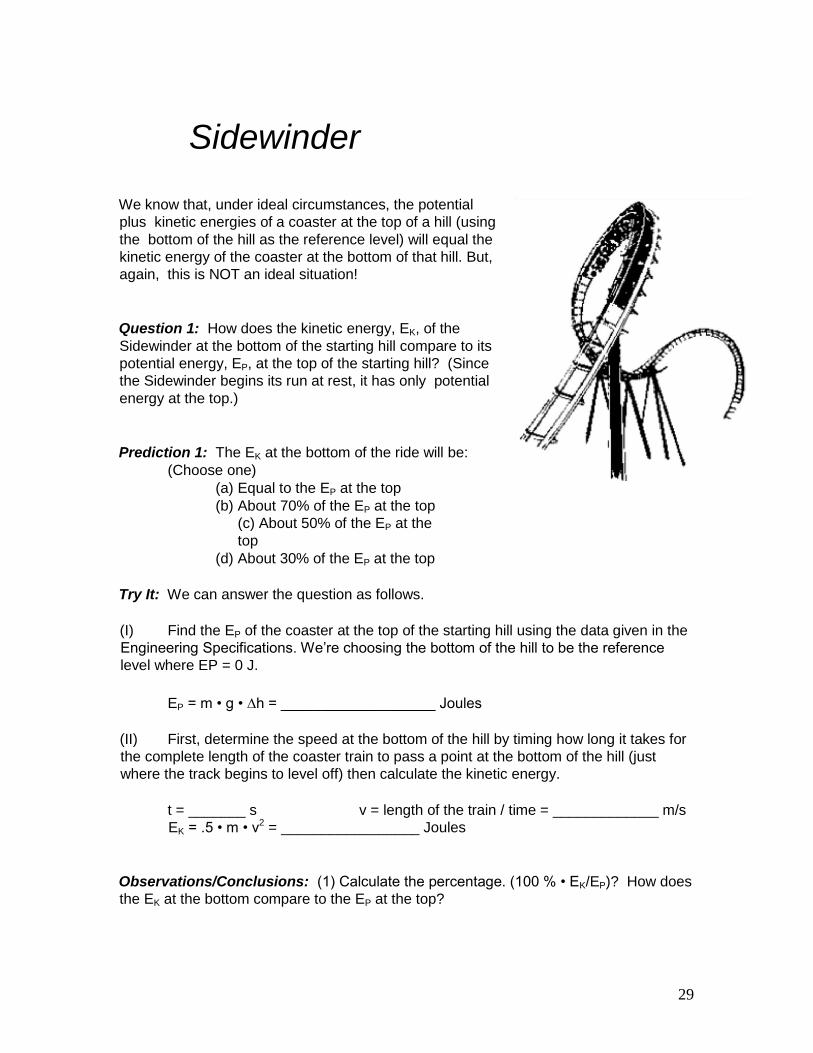
Sidewinder
We know that, under ideal circumstances, the potential
plus kinetic energies of a coaster at the top of a hill (using
the bottom of the hill as the reference level) will equal the
kinetic energy of the coaster at the bottom of that hill. But,
again, this is NOT an ideal situation!
Question 1: How does the kinetic energy, EK, of the
Sidewinder at the bottom of the starting hill compare to its
potential energy, EP, at the top of the starting hill? (Since
the Sidewinder begins its run at rest, it has only potential
energy at the top.)
Prediction 1: The EK at the bottom of the ride will be:
(Choose one)
(a) Equal to the EP at the top
(b) About 70% of the EP at the top
(c) About 50% of the EP at the
top
(d) About 30% of the EP at the top
Try It: We can answer the question as follows.
(I) Find the EP of the coaster at the top of the starting hill using the data given in the
Engineering Specifications. We’re choosing the bottom of the hill to be the reference
level where EP = 0 J.
EP = m • g • ∆h = ___________________ Joules
(II) First, determine the speed at the bottom of the hill by timing how long it takes for
the complete length of the coaster train to pass a point at the bottom of the hill (just
where the track begins to level off) then calculate the kinetic energy.
t = _______ s v = length of the train / time = _____________ m/s
EK = .5 • m • v2 = _________________ Joules
Observations/Conclusions: (1) Calculate the percentage. (100 % • EK/EP)? How does
the EK at the bottom compare to the EP at the top?
30
(2) Which prediction was the closest? Was yours?
Question 2: The critical speed for an object moving in a vertical loop is the slowest
speed the object can be moving at the top of the loop and not fall out. At this speed, the
rider would feel weightless (no pressure on your seat). When in the loop of the
Sidewinder, is the coaster moving at the critical speed or higher? If higher, how many
g’s of acceleration do you think the rider is experiencing?
Prediction 2: The coaster is moving (at, faster than) the critical speed. (Choose one.)
If ‘faster than’ how many g’s do you think you’ll experience? _____________ g’s
Try It: The easiest way to check this out is to measure it using the vertical
accelerometer. (HINT: Have your partner yell ‘NOW’ when you are at the top of the ride
- it’s hard to tell when reading the accelerometer!)
Observation/Conclusion: What did you find out?
Graph It: Sketch a graph below that shows the Kinetic Energy of the coaster as it travels
backwards from the high point of the second lift through the loop to the end of the loop.
Engineering Specifications:
31
Height of the second hill: 35.5 meters
Mass of the full train: 8260 kg
Length of train: 18.3 meters g = 9.8 m/s2
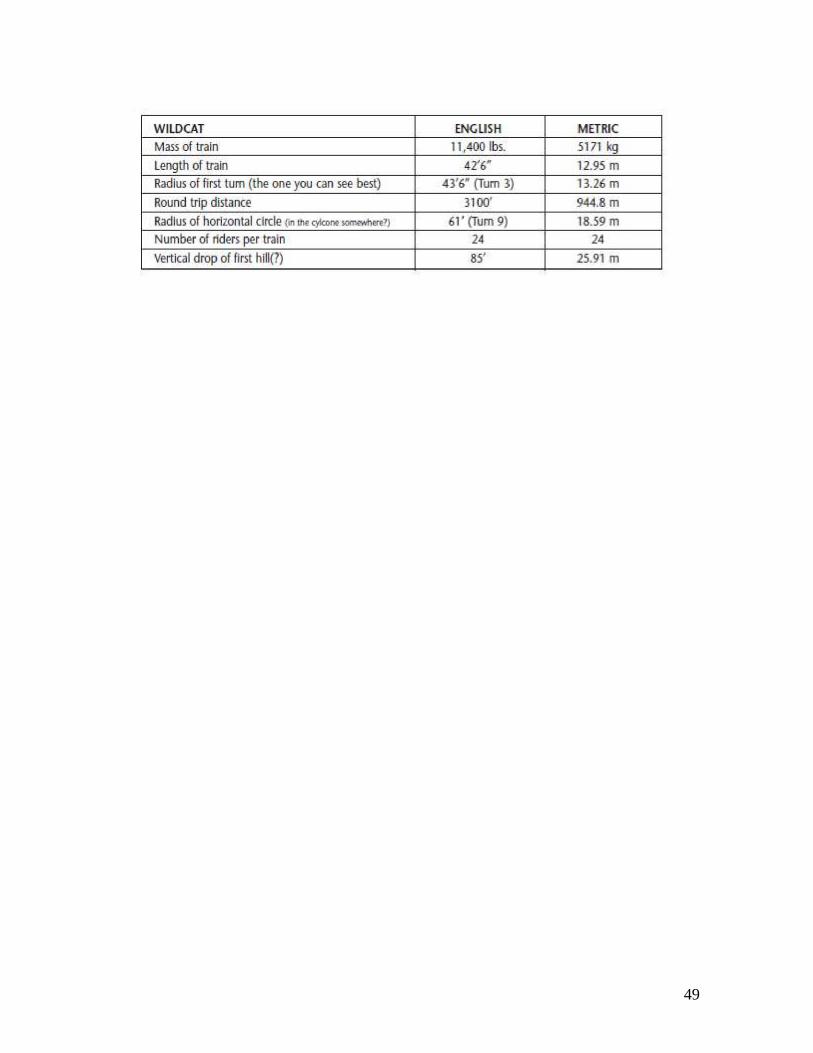
Wildcat
Named after the first roller coaster at Hersheypark, this wooden coaster twists its
way through or over itself 20 times during the ride.
Question 1: What is the average speed of the Wildcat from the time the coaster
starts down the first hill until the time when the brakes are first applied at the end
of the ride?
Prediction 1: NOTE - MAKE THIS PREDICTION AFTER YOU HAVE RIDDEN
THE COASTER! THEN TAKE YOUR MEASUREMENTS FROM THE GROUND
JUST TO SEE HOW WELL YOUR PERCEPTIONS COMPARE TO THE
ACTUAL SPEED.
The average speed of the ride seems to be about:
(a) 10 miles/hour (almost 5 m/s)
(b) 20 miles/hour (about 9 m/s)
(c) 40 miles/hour (about 18 m/s)
(d) 60 miles/hour (about 27 m/s)
(e) 80 miles/hour (about 36 m/s)
Try It: : From the ground, use a stopwatch to measure the time of the ride from
the time the coaster starts down the first hill until the time when the brakes
are first applied at the end of the ride. Find the average speed of the ride
using the equation below. (See the Engineering Specifications.)
Time = _________________________
Average Speed = Distance traveled / Time = _____________ = __________ m/s
Observations/Conclusions: How did your prediction compare to the actual
measurement of the ride’s average speed? If there was a difference between the
two, explain why you think this might happen.
32
Question 2: While standing in line, you’ll notice that the coaster stops at the end
of the ride by applying the brakes a number of times. What is the maximum
stopping acceleration (in g’s) that the coaster undergoes during braking?
Prediction 2: You can make your estimate by comparing what you see while
standing in line to what you’ve experienced in a car that comes to a quick normal
stop which is about 0.7 (g’s). The maximum stopping acceleration for the coaster
is about ______ g’s.
Try It: Before reaching the end of the ride, set the horizontal accelerometer
firmly and horizontally on the lap bar with the 80° facing forward. As the car
goes through the braking process, note the maximum angle to which the beads
rise. The tangent of this angle is the acceleration (in g’s).
The maximum stopping acceleration on the ride is ________________ g’s.
Observations/Conclusions: How did your prediction compare to the actual
meter reading? Explain any differences.
Graph It: Sketch a Speed-Time graph that shows how the speed of the coaster
varies during the braking process.
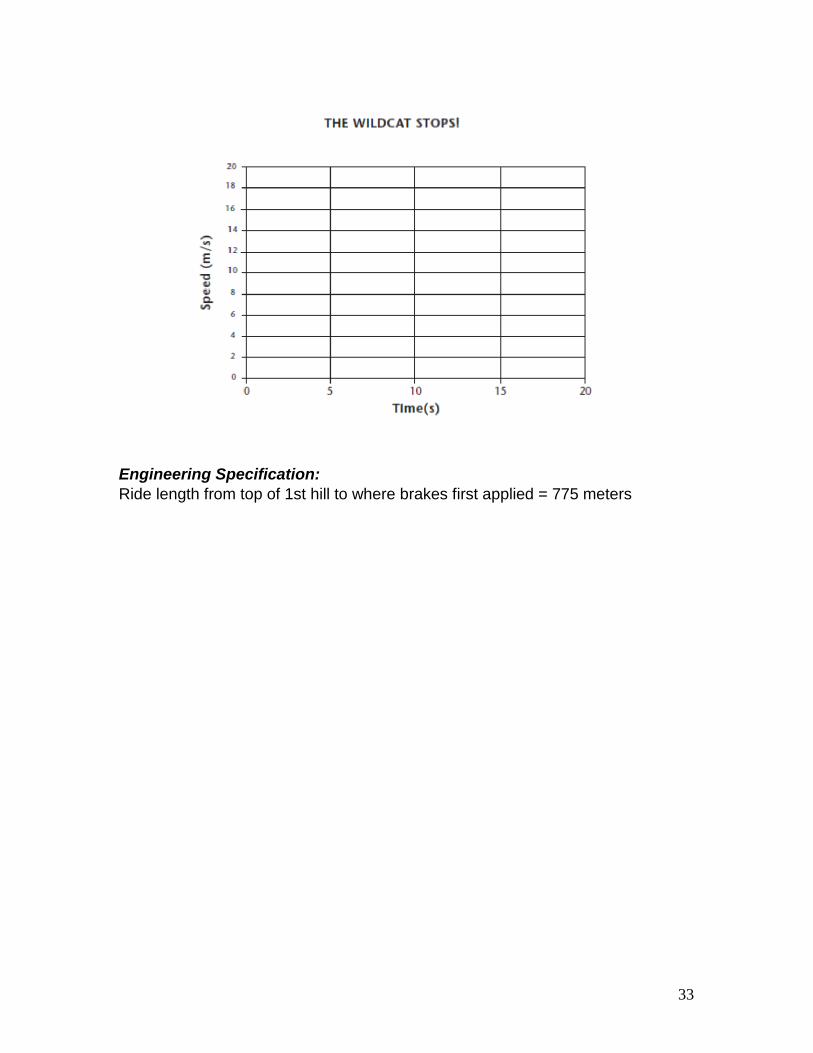
33
Engineering Specification:
Ride length from top of 1st hill to where brakes first applied = 775 meters
34
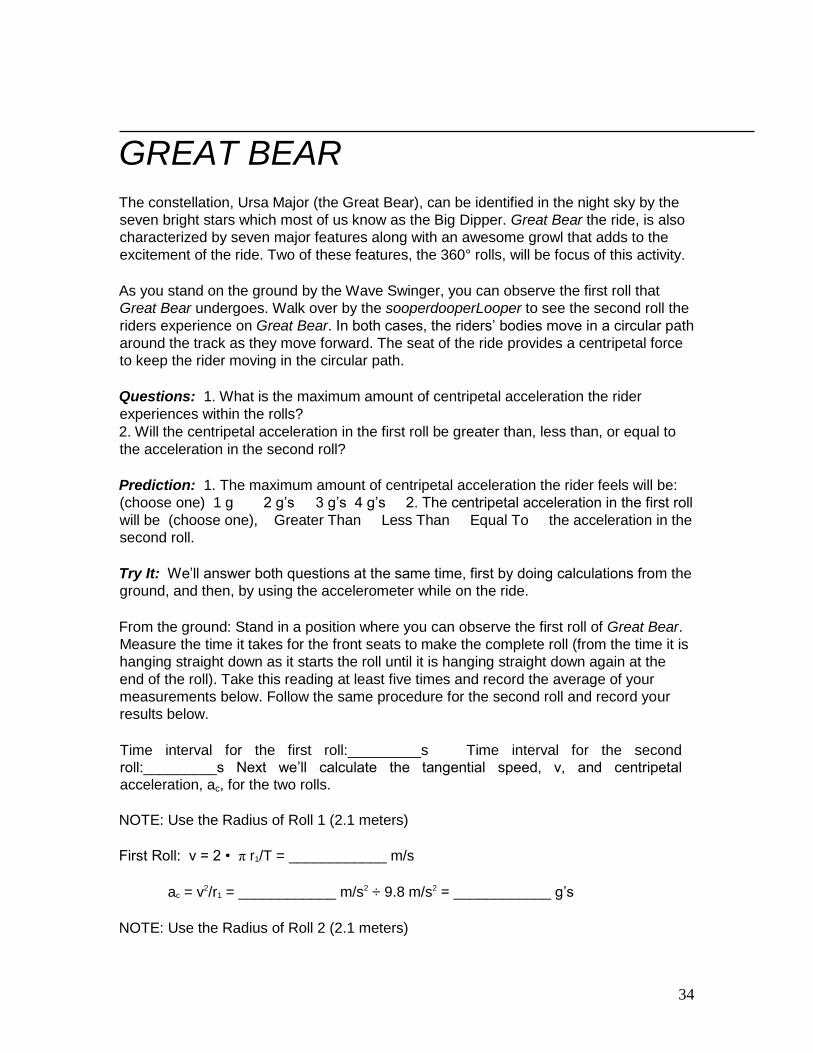
GREAT BEAR
The constellation, Ursa Major (the Great Bear), can be identified in the night sky by the
seven bright stars which most of us know as the Big Dipper. Great Bear the ride, is also
characterized by seven major features along with an awesome growl that adds to the
excitement of the ride. Two of these features, the 360° rolls, will be focus of this activity.
As you stand on the ground by the Wave Swinger, you can observe the first roll that
Great Bear undergoes. Walk over by the sooperdooperLooper to see the second roll the
riders experience on Great Bear. In both cases, the riders’ bodies move in a circular path
around the track as they move forward. The seat of the ride provides a centripetal force
to keep the rider moving in the circular path.
Questions: 1. What is the maximum amount of centripetal acceleration the rider
experiences within the rolls?
2. Will the centripetal acceleration in the first roll be greater than, less than, or equal to
the acceleration in the second roll?
Prediction: 1. The maximum amount of centripetal acceleration the rider feels will be:
(choose one) 1 g 2 g’s 3 g’s 4 g’s 2. The centripetal acceleration in the first roll
will be (choose one), Greater Than Less Than Equal To the acceleration in the
second roll.
Try It: We’ll answer both questions at the same time, first by doing calculations from the
ground, and then, by using the accelerometer while on the ride.
From the ground: Stand in a position where you can observe the first roll of Great Bear.
Measure the time it takes for the front seats to make the complete roll (from the time it is
hanging straight down as it starts the roll until it is hanging straight down again at the
end of the roll). Take this reading at least five times and record the average of your
measurements below. Follow the same procedure for the second roll and record your
results below.
Time interval for the first roll:_________s Time interval for the second
roll:_________s Next we’ll calculate the tangential speed, v, and centripetal
acceleration, ac, for the two rolls.
NOTE: Use the Radius of Roll 1 (2.1 meters)
First Roll: v = 2 • π r1/T = ____________ m/s
ac = v2/r1 = ____________ m/s2 ÷ 9.8 m/s2 = ____________ g’s
NOTE: Use the Radius of Roll 2 (2.1 meters)
35
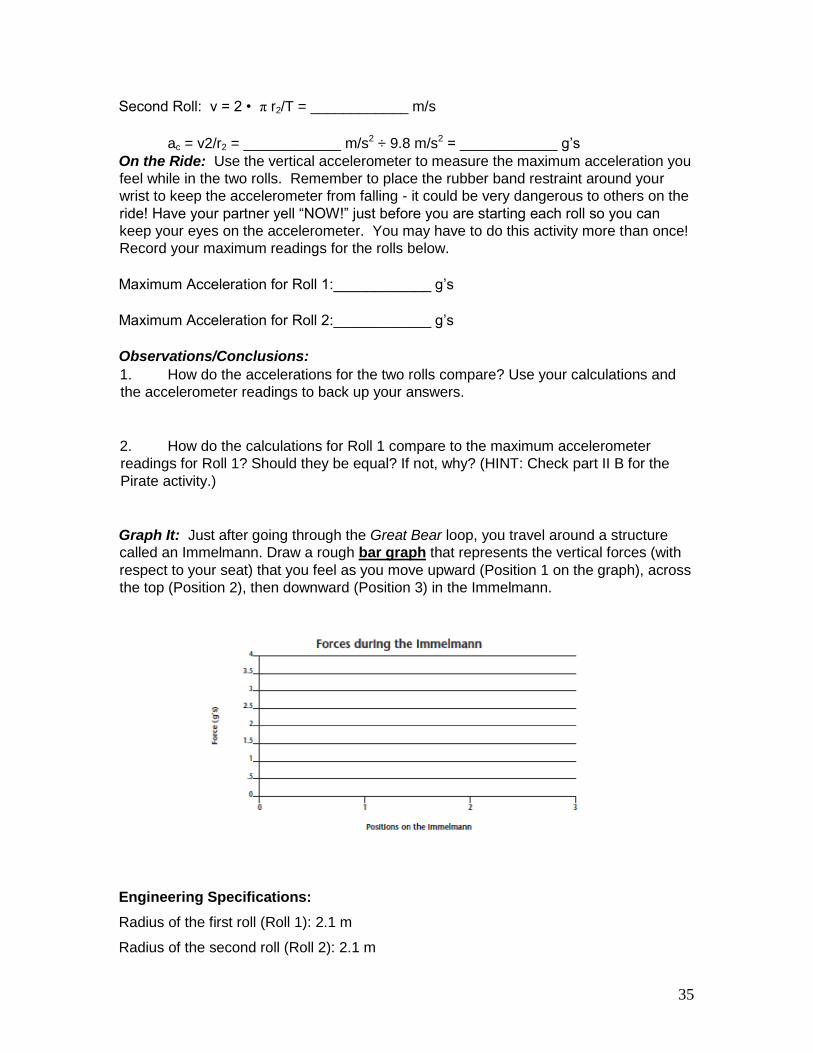
Second Roll: v = 2 • π r2/T = ____________ m/s
ac = v2/r2 = ____________ m/s2 ÷ 9.8 m/s2 = ____________ g’s
On the Ride: Use the vertical accelerometer to measure the maximum acceleration you
feel while in the two rolls. Remember to place the rubber band restraint around your
wrist to keep the accelerometer from falling - it could be very dangerous to others on the
ride! Have your partner yell “NOW!” just before you are starting each roll so you can
keep your eyes on the accelerometer. You may have to do this activity more than once!
Record your maximum readings for the rolls below.
Maximum Acceleration for Roll 1:____________ g’s
Maximum Acceleration for Roll 2:____________ g’s
Observations/Conclusions:
1. How do the accelerations for the two rolls compare? Use your calculations and
the accelerometer readings to back up your answers.
2. How do the calculations for Roll 1 compare to the maximum accelerometer
readings for Roll 1? Should they be equal? If not, why? (HINT: Check part II B for the
Pirate activity.)
Graph It: Just after going through the Great Bear loop, you travel around a structure
called an Immelmann. Draw a rough bar graph that represents the vertical forces (with
respect to your seat) that you feel as you move upward (Position 1 on the graph), across
the top (Position 2), then downward (Position 3) in the Immelmann.
Engineering Specifications:
Radius of the first roll (Roll 1): 2.1 m
Radius of the second roll (Roll 2): 2.1 m
36
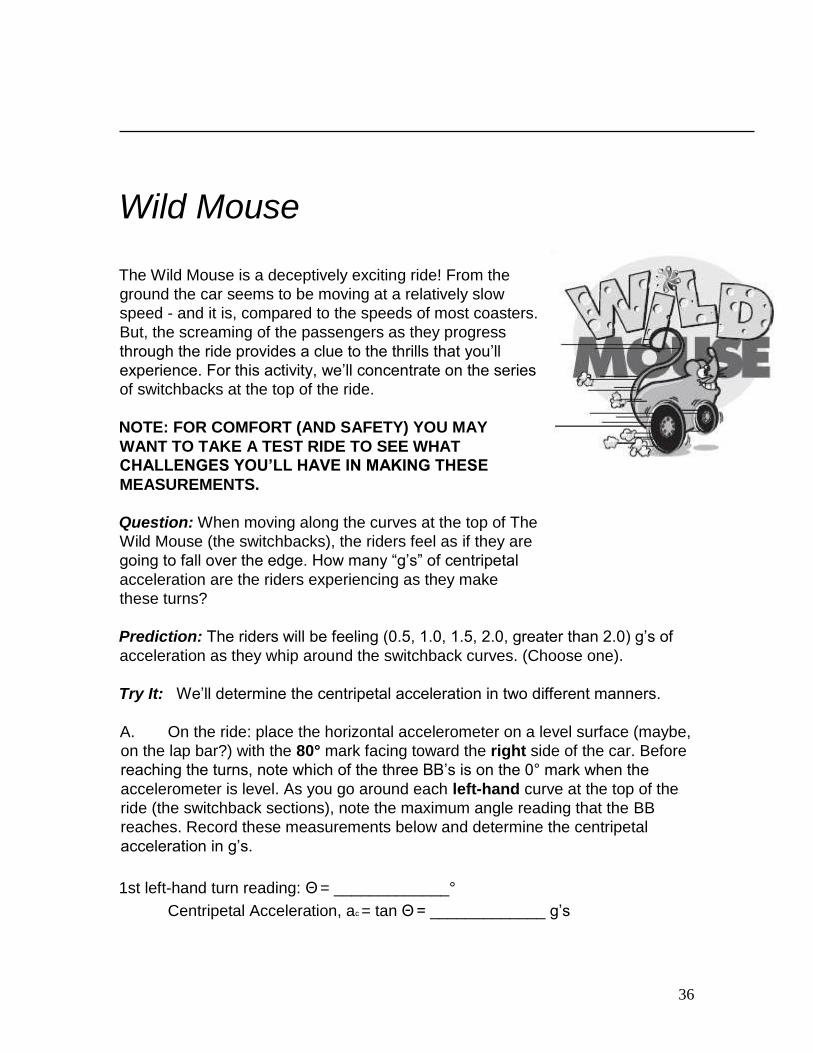
Wild Mouse
The Wild Mouse is a deceptively exciting ride! From the
ground the car seems to be moving at a relatively slow
speed - and it is, compared to the speeds of most coasters.
But, the screaming of the passengers as they progress
through the ride provides a clue to the thrills that you’ll
experience. For this activity, we’ll concentrate on the series
of switchbacks at the top of the ride.
NOTE: FOR COMFORT (AND SAFETY) YOU MAY
WANT TO TAKE A TEST RIDE TO SEE WHAT
CHALLENGES YOU’LL HAVE IN MAKING THESE
MEASUREMENTS.
Question: When moving along the curves at the top of The
Wild Mouse (the switchbacks), the riders feel as if they are
going to fall over the edge. How many “g’s” of centripetal
acceleration are the riders experiencing as they make
these turns?
Prediction: The riders will be feeling (0.5, 1.0, 1.5, 2.0, greater than 2.0) g’s of
acceleration as they whip around the switchback curves. (Choose one).
Try It: We’ll determine the centripetal acceleration in two different manners.
A. On the ride: place the horizontal accelerometer on a level surface (maybe,
on the lap bar?) with the 80° mark facing toward the right side of the car. Before
reaching the turns, note which of the three BB’s is on the 0° mark when the
accelerometer is level. As you go around each left-hand curve at the top of the
ride (the switchback sections), note the maximum angle reading that the BB
reaches. Record these measurements below and determine the centripetal
acceleration in g’s.
1st left-hand turn reading: Θ = _____________°
Centripetal Acceleration, ac = tan Θ = _____________ g’s
37
2nd left-hand turn reading: Θ = _____________°
Centripetal Acceleration, ac = tan Θ = _____________ g’s
3rd left-hand turn reading: Θ = _____________°
Centripetal Acceleration, ac = tan Θ = _____________ g’s
B. From the ground: Determine the beginning and end of the half-circle that
the car makes as it goes around a turn. Using the radius given in the Engineering
Specifications below, calculate the distance traveled by the car for the half-circle.
Distance around the half-circle = π r = _________ meters note erased 2 since
half circle
Use the stop watch to determine the time it takes for the car to traverse the
halfcircle. Take at least three trials. Record the average reading below and
calculate the speed of the car for the turn. Then calculate the centripetal
acceleration.
Time to travel the half-circle (t) = _______ seconds
Speed of the car (v) = Distance around the half-circle ÷ Time = _______ m/s
Centripetal Acceleration (ac) = v2 / r = _______ m/s2
Observations/Conclusions:
(a) How do the centripetal accelerations in parts (A) and (B) compare?
(b) Do all three turns create the same accelerations?
(c) How does the numerical result compare to how you feel on the ride?
Graph It: Draw a rough graph below showing the actual speeds (with a solid
line) for each of the turns of the switchback section AND the speeds you think
you are going (with a dotted line).
38
Engineering Specifications:
Radius of turns =2.74 meters
The Claw Combine the slowly rotating platform of the Carrousel with the pendulum motion of the Pirate
ship and you have The Claw. The interplay of motions on this ride provides a unique combination
of sensations.
Questions: (1) At what point (or points) in the ride will your seat apply the greatest “upward”
force against your bottom? How many g’s of acceleration will you feel when this happens?
(2) Knowing where the greatest upward force occurs, in what direction are you moving and
in what direction is the centerpost of The Claw moving?
(3) How does the potential energy of The Claw at the top of the swing, compare to its kinetic
energy at the bottom of the swing?
(4) What is the centripetal acceleration of The Claw (as a whole) when it is at the bottom of
its swing? How does this compare with your accelerometer readings from Question 1?
Predictions: (1) I will feel the greatest “upward” force when the ride is (at its highest point in the
swing, at its lowest point in the swing, at the halfway points) and the acceleration at this time will
be closer to (.5 g’s - I’ll feel as if I weigh less than may normal weight; 1.0 g - I’ll feel as if I weigh
my normal weight; 2 g’s, 3 g’s - I’ll feel as if I weigh 2 or 3 times my normal weight). Write your
two choices on the line below.
(2) The greatest “upward” force occurs when the rotation of the ride (makes me move in the
same direction as the centerpost is swinging, makes me move opposite to the direction that
the centerpost is swinging). Write your choice below.
(3) The potential energy of The Claw, at the top of the swing is (less than, greater than, equal to)
its kinetic energy at the bottom of the swing. Write your choice below.
(4) The calculated accelerations will be (>, <, =) the actual readings from the accelerometer.
39
Try It: (1) and (2) You’ll have to answer Questions 1 and 2 while on the ride. You’ll need the
vertical accelerometer to take measurements and a partner. Before the ride begins, hold the
accelerometer vertically (with both hands, if you can). Hold it this way for the duration of the ride.
After The Claw has begun its swinging motion, watch the accelerometer to see when it reaches
its greatest reading. You will have to let your partner know when the greatest readings occur, so
that your partner can watch to see where, in the swing, that this is happening.
(1) Maximum Acceleration:______________________ g’s occurs as_____________________
(2) Direction you are moving during maximum acceleration: ____________________________
(3) Determine the potential energy (EP) at the top:
EP = m g h = __________________ J (Use the average height of the ride below)
(4) Determine the average speed of the ride at the bottom by timing how long it takes for the
carrousel to cross the imaginary center line of the ride at the bottom of the swing and dividing
the diameter of the carrousel by the time. (See specifications on next page.)
Average speed = Diameter / Time to pass = _________________________ m/s
Calculate the average kinetic energy, EK, from the average speed calculated above:
EK = 1/2 m v2 = ___________________________J
(5) Calculate the centripetal acceleration of a rider at the bottom of the swing using the
average speed calculated above:
ac - v2/r = _________________ m/s2 (“r” is the swing radius - see below.)
The accelerometer readings will be 1 g greater than the centripetal acceleration because
the accelerometer will read 1 g when the ride is stopped. So how does the maximum
acceleration measured in #1 compare to the calculated value above?
Observations/Conclusions:
(1) Why did you feel the maximum acceleration where you did? Your explanation
MUST be supported by your findings in #1 and 2.
(2) Give your best guess as to why the EP at the top of the swing and the EK at the
bottom of the ride compared as they did.
(3) Give your best guess as to why the calculated centripetal acceleration and the
measured accelerometer readings compared as they did.
40
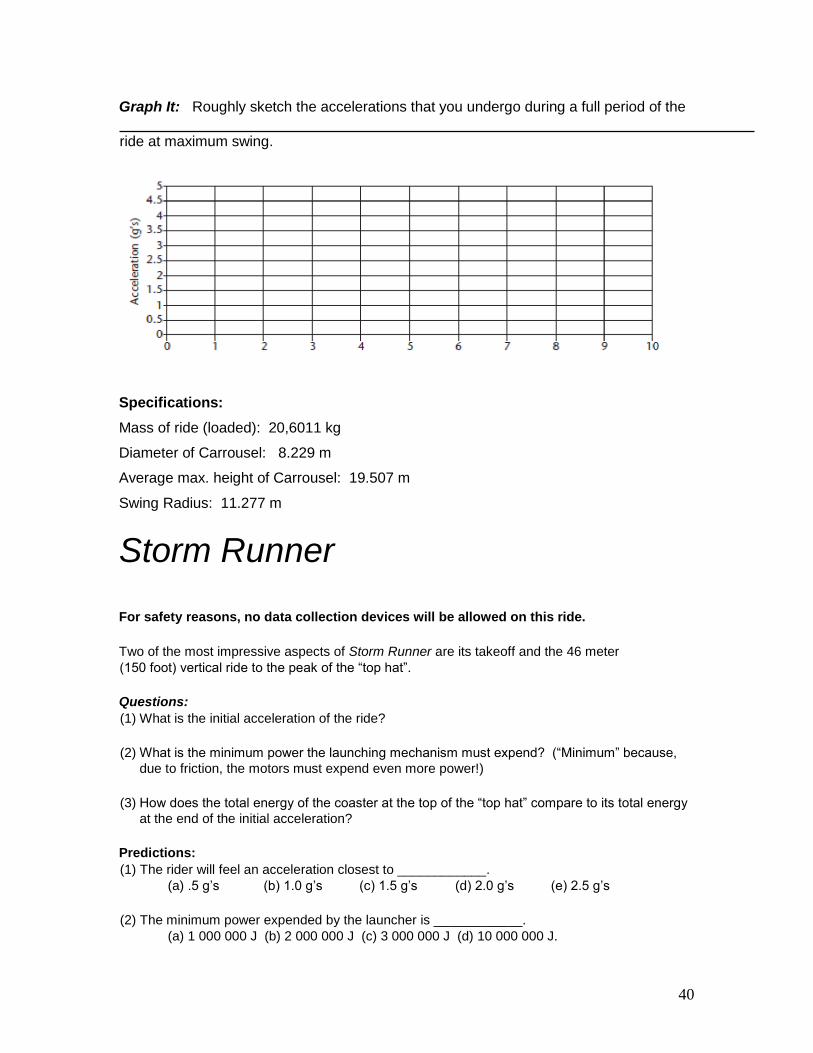
Graph It: Roughly sketch the accelerations that you undergo during a full period of the
ride at maximum swing.
Specifications:
Mass of ride (loaded): 20,6011 kg
Diameter of Carrousel: 8.229 m
Average max. height of Carrousel: 19.507 m
Swing Radius: 11.277 m
Storm Runner
For safety reasons, no data collection devices will be allowed on this ride.
Two of the most impressive aspects of Storm Runner are its takeoff and the 46 meter
(150 foot) vertical ride to the peak of the “top hat”.
Questions: (1) What is the initial acceleration of the ride?
(2) What is the minimum power the launching mechanism must expend? (“Minimum” because,
due to friction, the motors must expend even more power!)
(3) How does the total energy of the coaster at the top of the “top hat” compare to its total energy
at the end of the initial acceleration?
Predictions: (1) The rider will feel an acceleration closest to ____________.
(a) .5 g’s (b) 1.0 g’s (c) 1.5 g’s (d) 2.0 g’s (e) 2.5 g’s
(2) The minimum power expended by the launcher is ____________.
(a) 1 000 000 J (b) 2 000 000 J (c) 3 000 000 J (d) 10 000 000 J.
41
(3) The ETOTAL at the peak of the “top hat” should be (>, <, or =) the ETOTAL at the bottom of
the “top hat”. (Choose one)
(4) The calculated accelerations will be (>, <, =) the actual readings from the accelerometer.
Try It: (1) You will have to find a place where you can watch the train’s initial acceleration from rest to
its maximum speed (maybe while in line?). Use a stopwatch to measure the time for this
acceleration from the start to the bottom of the “top hat” (just before it starts its upward climb).
Make 5 measurements - average the best three (the most consistent ones).
Time for the acceleration: t = __________s
Find the average velocity for the train. The train’s displacement, ∆x, along the horizontal part of
the track is given in the specifications at the end. _
v = ∆x = = ____________m/s t The initial velocity is 0 m/s. So, we can find the velocity by using another average velocity
equation, assuming uniform acceleration: _ v = vi + vf
2 Determining vf. vf = ______________ m/s. Finally, we can find the acceleration: a = vf + vi . Calculate the acceleration.
a = ______________ m/s2.
Divide the acceleration by 9.8 m /s2 to put this number into “g’s”
a = ______________ g’s
(2) First, we have to figure out the kinetic energy (EK) gained by the coaster during takeoff.
Since the power used is equal to the rate at which the Work is done by the motors, and the gain
in kinetic energy is equal to the amount of Work done by the motors, we can calculate the Power
used by dividing the change in EK by the time during which the work occurred. We measured this
time in the previous section.
The change in EK = 0.5 m v2 = _______________ (since EK is initially zero.)
Power = Work/time = _______________ watts
Convert the power to horsepower. There are 746 watts in 1 horsepower.
______________ watts = _______________ hp
(3) Since you already know the velocity of the coaster at the bottom of the “top hat”, you can
calculate the kinetic energy. The potential energy will be 0 J if we consider the starting height to
be 0 m. So, the total energy at the bottom is
EK = 0.5 m v2 = __________________ J ETOTAL AT BOTTOM
42
At the top, you’ll have to calculate both the potential and kinetic energies (since the coaster is
moving at the top).
EP = m g h = ____________________ J
To get the speed of the coaster at the top, we can time how long it takes for the coaster to pass
the peak of the “top hat”.
v = length of the coaster/time to pass = _____________________ m/s
EK = 0.5 m v
2 = _____________________ J
ETOTAL = EP (at the top) + EK (at the top) = ___________________ J ETOTAL AT THE TOP
Observations/Conclusions: (1) Some of the best standard automobiles can reach accelerations of about .8 g’s to .9 g’s.
How does Storm Runner compare?
(2) Most of our cars have power ratings in the neighborhood of 90 to 200 horsepower. How
many cars could be powered during one of the launches of Storm Runner?
(3) How do the total energies at the bottom and the peak of the “top hat” compare? Explain
these results.
Specifications: Horizontal Run during Takeoff (just before release): 45 m Length of Train: 11,984 millimeters Height of “Top Hat”: 45.7 m
Fahrenheit
The main feature of Fahrenheit is its first hill: a 97° drop – a fall that doesn’t go just
straight down, but curves inward by 7° !
Question 1: If we fell straight downward, unhampered by air resistance, we’d accelerate at 9.8
m/s2 downward. Will the design of this coaster cause our maximum acceleration (at the bottom
of the first hill) to be equal to, less than, or greater than 9.8 m/s2?
Prediction 1: The rider’s maximum acceleration will be closest to ________ .
43
(a) 2.45 m/s2 (.25 g) (b) 4.9 m/s
2 (.5 g) (c) 9.8 m/s
2 (1 g)
(d) 14.7 m/s2 (1.5 g) (e) 19.6 m/s
2 (2 g)
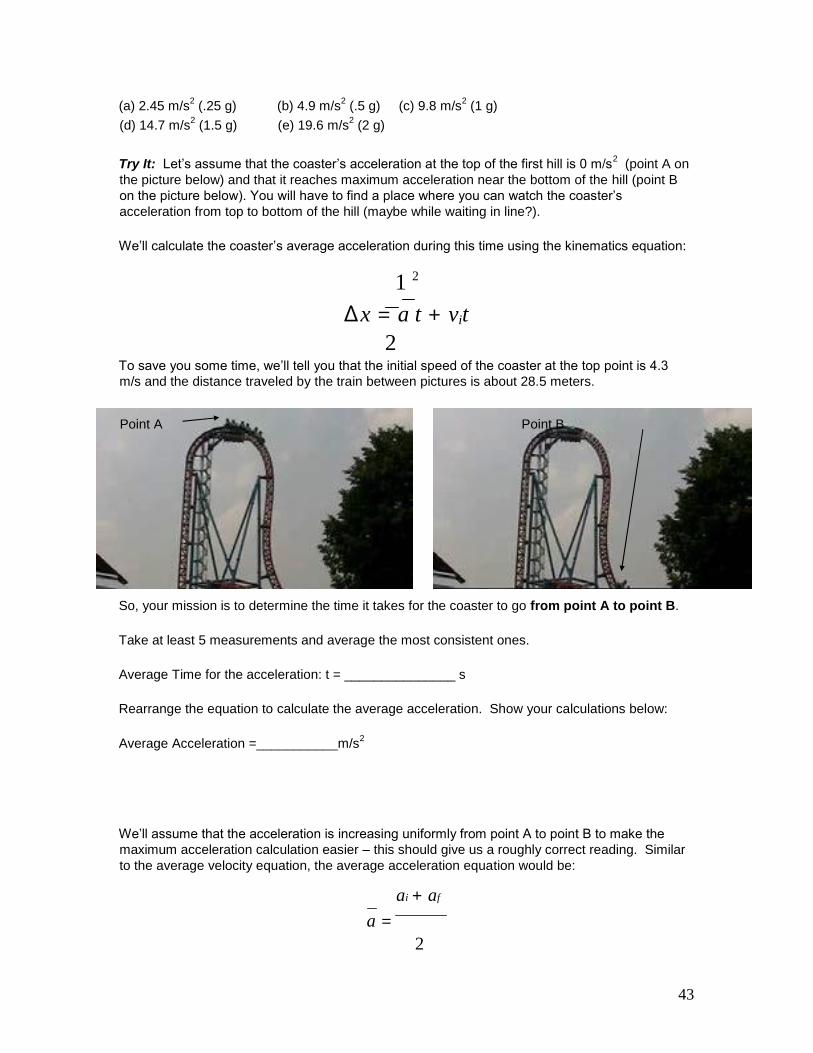
Try It: Let’s assume that the coaster’s acceleration at the top of the first hill is 0 m/s2 (point A on
the picture below) and that it reaches maximum acceleration near the bottom of the hill (point B
on the picture below). You will have to find a place where you can watch the coaster’s
acceleration from top to bottom of the hill (maybe while waiting in line?).
We’ll calculate the coaster’s average acceleration during this time using the kinematics equation:
1 2
∆x = a t + vit
2
To save you some time, we’ll tell you that the initial speed of the coaster at the top point is 4.3
m/s and the distance traveled by the train between pictures is about 28.5 meters.
So, your mission is to determine the time it takes for the coaster to go from point A to point B.
Take at least 5 measurements and average the most consistent ones.
Average Time for the acceleration: t = _______________ s
Rearrange the equation to calculate the average acceleration. Show your calculations below:
Average Acceleration =___________m/s2
We’ll assume that the acceleration is increasing uniformly from point A to point B to make the
maximum acceleration calculation easier – this should give us a roughly correct reading. Similar
to the average velocity equation, the average acceleration equation would be:
ai + af
a =
2
Point A Point B
44
where ai = 0 m/s2. Record your calculated value for aMAX below.
Conclusion:
aMAX = af = 2⋅ a
AVG = _______ m/s2 which is closest to prediction choice ________.
Question 2: Many people think that the lift to the top of the first hill is more nerve-wracking than
the rest of the ride. It takes a lot of power to pull the coaster up the hill. We’ll compare this
power to that used by a typical automobile. (See Question 2 on Storm Runner for the
calculations). While the chain is lifting the coaster, how many cars could be powered with the
same amount of energy?
Prediction 2: While the chain is lifting the coaster, the power used by the ride is equivalent to
the power used by a minimum of ______ cars.
(a) 2 (b) 30 (c) 100 (d) 150 (e) 1000
Try It: Using the Engineering specs below, determine the Power used by calculating the Work
done on the coaster during the lift. Then, time how long it takes to get the train to the top – just
as it starts up the hill until the middle of the train is at the top.
Work = mgh =____________J
LiftTime =___________s Final Answer/Conclusion
See Storm Runner Question 2 for calculations)
Work _______ J Power = = =_________W
=___________________ cars time _____s
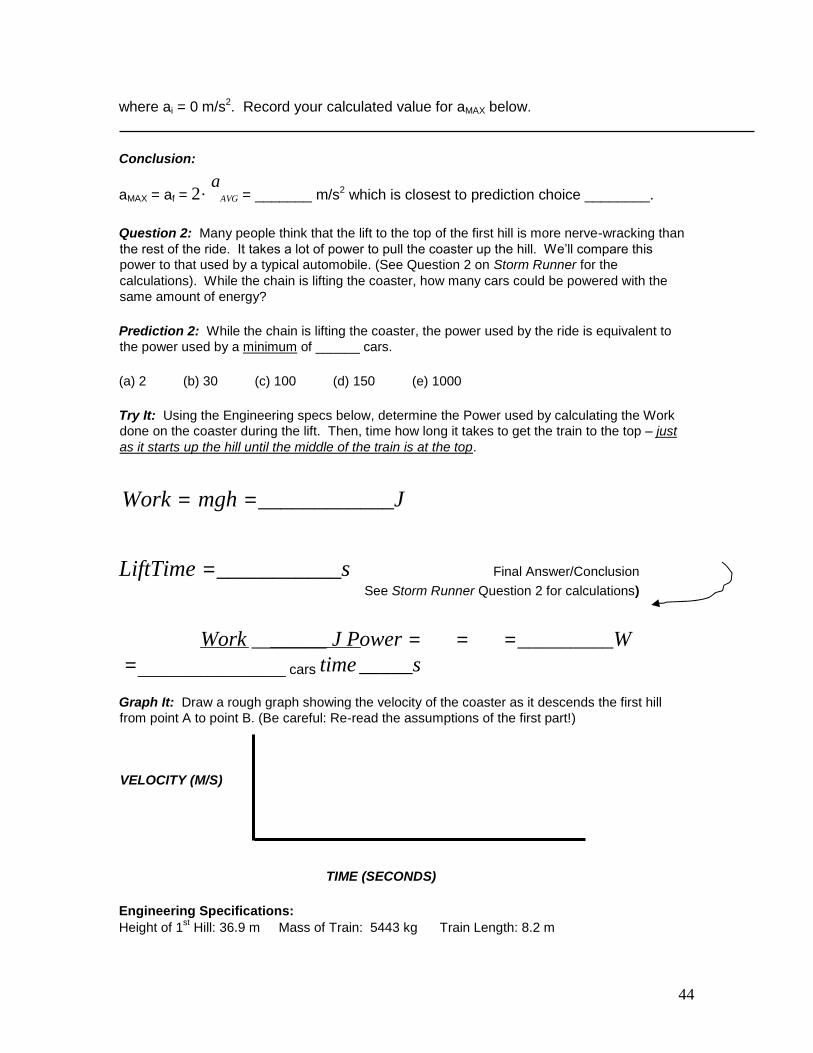
Graph It: Draw a rough graph showing the velocity of the coaster as it descends the first hill
from point A to point B. (Be careful: Re-read the assumptions of the first part!)
TIME (SECONDS)
Engineering Specifications: Height of 1
st Hill: 36.9 m Mass of Train: 5443 kg Train Length: 8.2 m
VELOCITY (M/S)
45
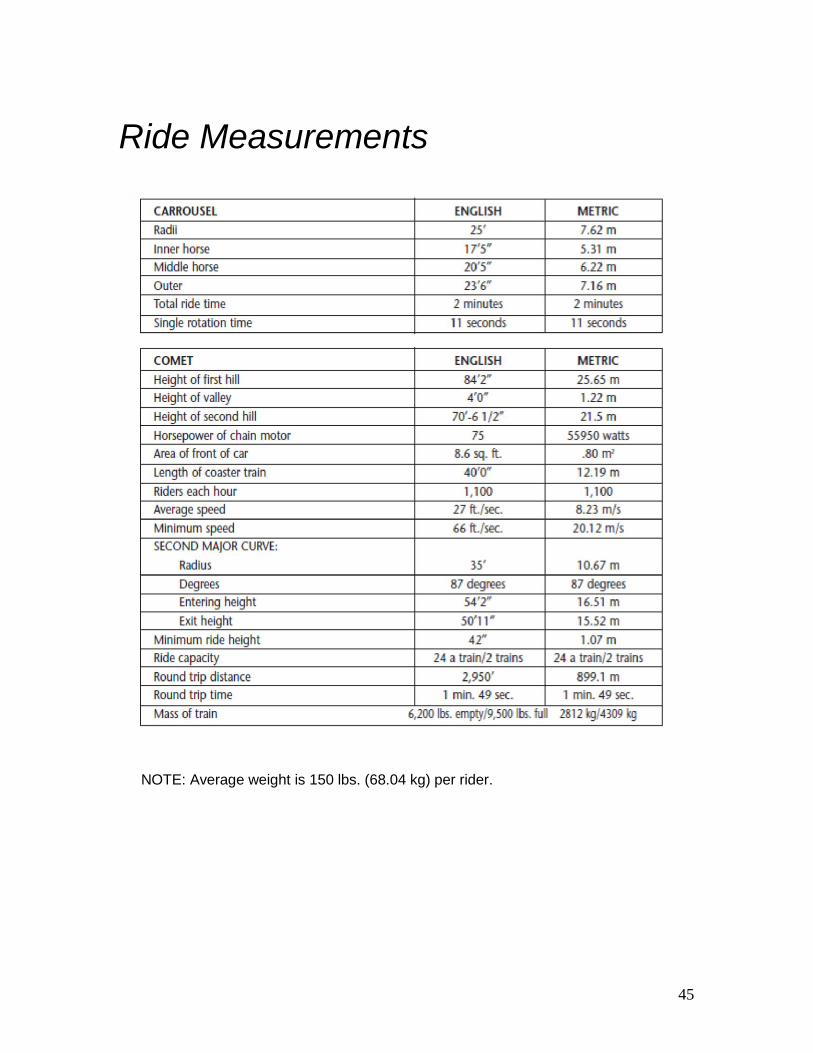
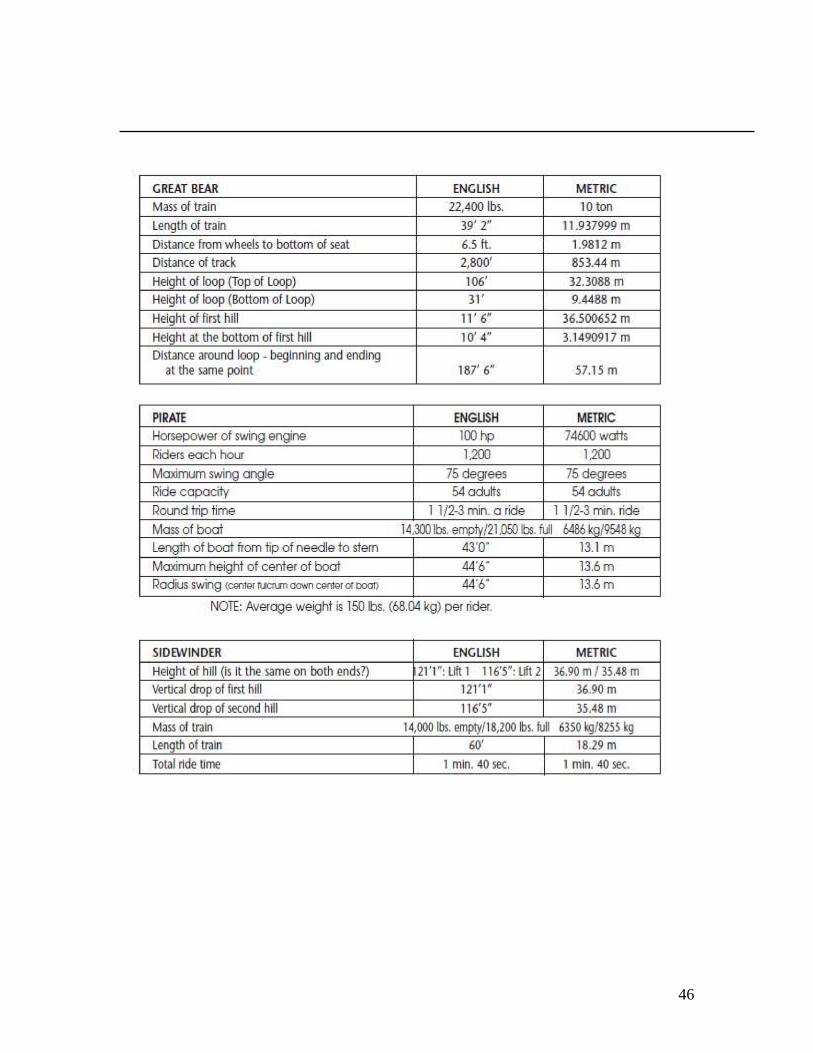
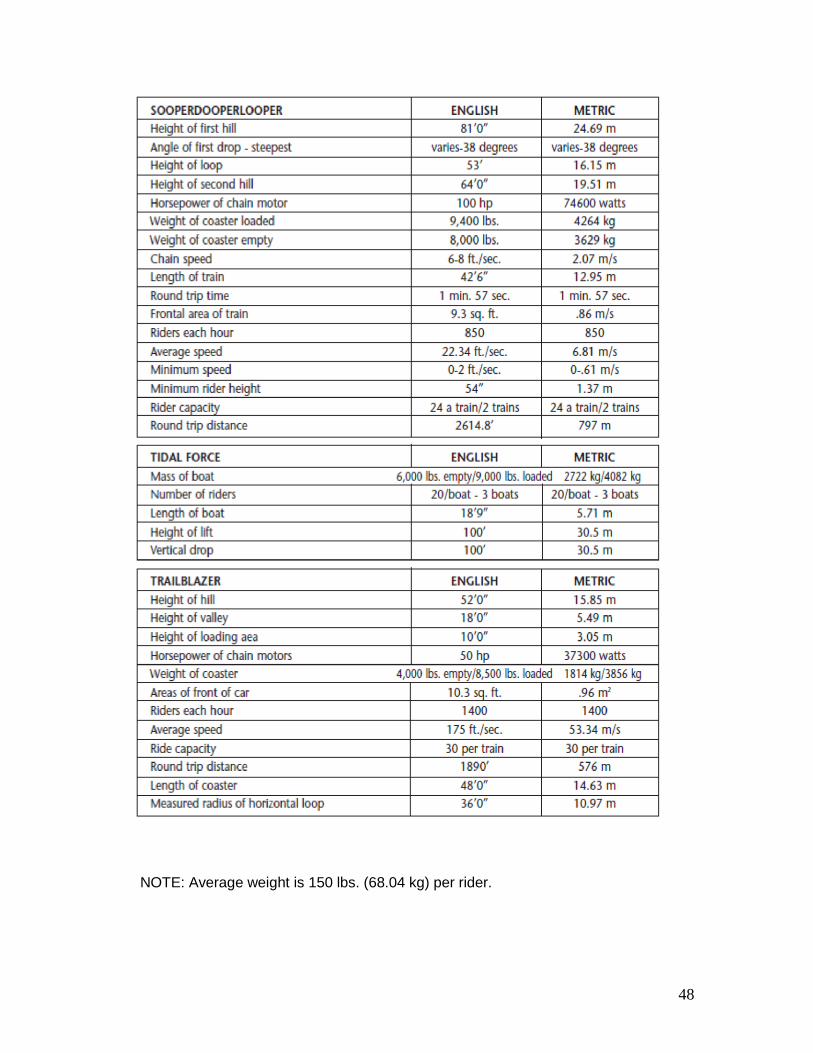
Ride Measurements
NOTE: Average weight is 150 lbs. (68.04 kg) per rider.
46

47
48
NOTE: Average weight is 150 lbs. (68.04 kg) per rider.
49
38

50
51