Embed Size (px)
Citation preview
Table of Contents
Eligibility FormsOrganizational ChartForm A-1Glossary of Terms
Organizational Profile i
P.1 Organizational Description iP.2 Organizational Situation iii
Category 1 Leadership 1
1.1 Senior Leadership 11.2 Governance and Societal Responsibilities 4
Category 2 Strategic Planning 8
2.1 Strategy Development 82.2 Strategy Implementation 10
Category 3 Customer Focus 13
3.1 Voice of the Customer 133.2 Customer Engagement 15
Category 4 Measurement, Analysis, and Knowledge Management 18
4.1 Measurement, Analysis, and Improvement of Organizational Performance 184.2 Knowledge Management, Information, and Information Technology 21
Category 5 Workforce Focus 24
5.1 Workforce Environment 245.2 Workforce Engagement 27
Category 6 Operations Focus 30
6.1 Work Processes 306.2 Operational Effectiveness 32
Catgory 7 Results 34
7.1 Product and Process Results 347.2 Customer-Focused Results 397.3 Workforce-Focused Results 417.4 Leadership and Governance Results 457.5 Financial and Market Results 47
If you love where you live, it matters where you bank. .
If you love where you live, it matters where you bank. . G - 1
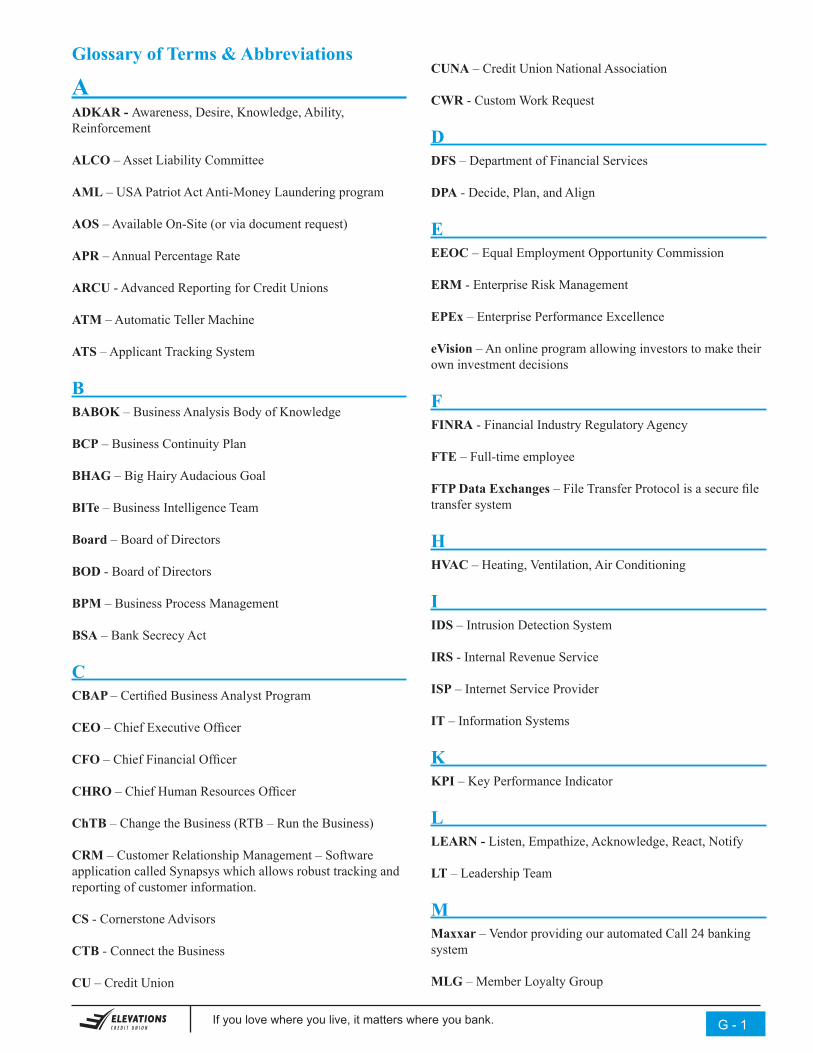
Glossary of Terms & Abbreviations
A ADKAR - Awareness, Desire, Knowledge, Ability, Reinforcement
ALCO – Asset Liability Committee
AML – USA Patriot Act Anti-Money Laundering program
AOS – Available On-Site (or via document request)
APR – Annual Percentage Rate
ARCU - Advanced Reporting for Credit Unions
ATM – Automatic Teller Machine
ATS – Applicant Tracking System
B BABOK – Business Analysis Body of Knowledge
BCP – Business Continuity Plan
BHAG – Big Hairy Audacious Goal
BITe – Business Intelligence Team
Board – Board of Directors
BOD - Board of Directors
BPM – Business Process Management
BSA – Bank Secrecy Act
C CBAP – Certified Business Analyst Program
CEO – Chief Executive Officer
CFO – Chief Financial Officer
CHRO – Chief Human Resources Officer
ChTB – Change the Business (RTB – Run the Business)
CRM – Customer Relationship Management – Software application called Synapsys which allows robust tracking and reporting of customer information.
CS - Cornerstone Advisors
CTB - Connect the Business
CU – Credit Union
CUNA – Credit Union National Association
CWR - Custom Work Request
D DFS – Department of Financial Services
DPA - Decide, Plan, and Align
E EEOC – Equal Employment Opportunity Commission
ERM - Enterprise Risk Management
EPEx – Enterprise Performance Excellence
eVision – An online program allowing investors to make their own investment decisions
F FINRA - Financial Industry Regulatory Agency
FTE – Full-time employee
FTP Data Exchanges – File Transfer Protocol is a secure file transfer system
H HVAC – Heating, Ventilation, Air Conditioning
I IDS – Intrusion Detection System
IRS - Internal Revenue Service
ISP – Internet Service Provider
IT – Information Systems
K KPI – Key Performance Indicator
L LEARN - Listen, Empathize, Acknowledge, React, Notify
LT – Leadership Team
M Maxxar – Vendor providing our automated Call 24 banking system
MLG – Member Loyalty Group
If you love where you live, it matters where you bank. . G - 2
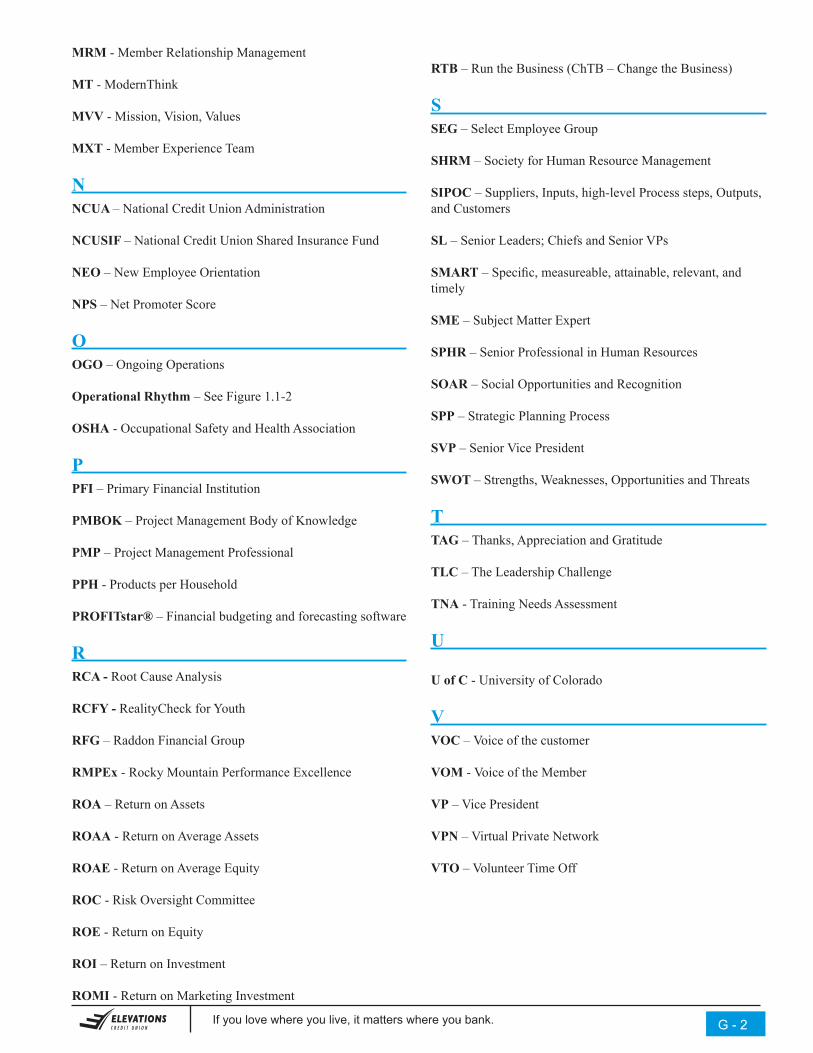
MRM - Member Relationship Management
MT - ModernThink
MVV - Mission, Vision, Values
MXT - Member Experience Team
N NCUA – National Credit Union Administration
NCUSIF – National Credit Union Shared Insurance Fund
NEO – New Employee Orientation
NPS – Net Promoter Score
O OGO – Ongoing Operations
Operational Rhythm – See Figure 1.1-2
OSHA - Occupational Safety and Health Association
P PFI – Primary Financial Institution
PMBOK – Project Management Body of Knowledge
PMP – Project Management Professional
PPH - Products per Household
PROFITstar® – Financial budgeting and forecasting software
R RCA - Root Cause Analysis
RCFY - RealityCheck for Youth
RFG – Raddon Financial Group
RMPEx - Rocky Mountain Performance Excellence
ROA – Return on Assets
ROAA - Return on Average Assets
ROAE - Return on Average Equity
ROC - Risk Oversight Committee
ROE - Return on Equity
ROI – Return on Investment
ROMI - Return on Marketing Investment
RTB – Run the Business (ChTB – Change the Business)
S SEG – Select Employee Group
SHRM – Society for Human Resource Management
SIPOC – Suppliers, Inputs, high-level Process steps, Outputs, and Customers
SL – Senior Leaders; Chiefs and Senior VPs
SMART – Specific, measureable, attainable, relevant, and timely
SME – Subject Matter Expert
SPHR – Senior Professional in Human Resources
SOAR – Social Opportunities and Recognition
SPP – Strategic Planning Process
SVP – Senior Vice President
SWOT – Strengths, Weaknesses, Opportunities and Threats
T TAG – Thanks, Appreciation and Gratitude
TLC – The Leadership Challenge
TNA - Training Needs Assessment
U
U of C - University of Colorado
V VOC – Voice of the customer
VOM - Voice of the Member
VP – Vice President
VPN – Virtual Private Network
VTO – Volunteer Time Off
iIf you love where you live, it matters where you bank. .
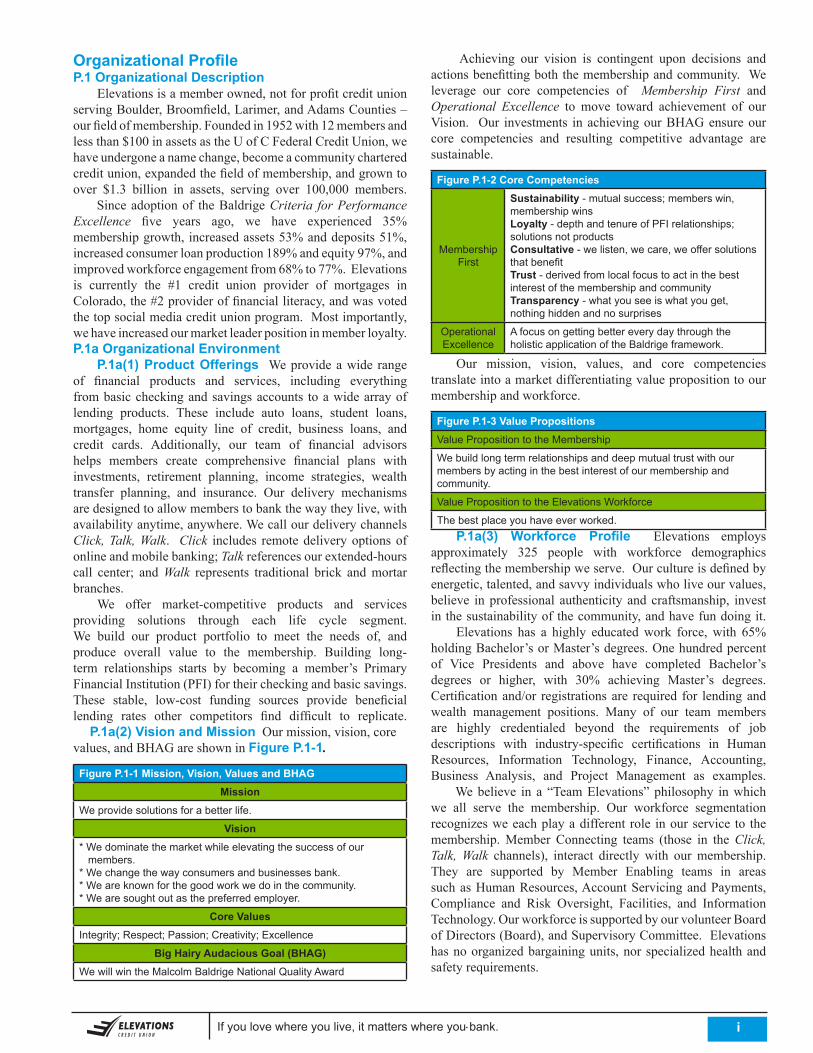
Organizational Profile P.1 Organizational Description Elevationsisamemberowned,notforprofitcreditunionservingBoulder,Broomfield,Larimer,andAdamsCounties–ourfieldofmembership.Foundedin1952with12membersandlessthan$100inassetsastheUofCFederalCreditUnion,wehaveundergoneanamechange,becomeacommunitycharteredcreditunion,expandedthefieldofmembership,andgrowntoover $1.3 billion in assets, serving over 100,000 members. Sinceadoptionof theBaldrigeCriteria for Performance Excellence five years ago, we have experienced 35%membershipgrowth,increasedassets53%anddeposits51%,increasedconsumerloanproduction189%andequity97%,andimprovedworkforceengagementfrom68%to77%.Elevationsis currently the #1 credit union provider of mortgages inColorado,the#2provideroffinancialliteracy,andwasvotedthetopsocialmediacreditunionprogram.Mostimportantly,wehaveincreasedourmarketleaderpositioninmemberloyalty.P.1a Organizational Environment P.1a(1) Product Offerings We provide a wide range of financial products and services, including everythingfrombasiccheckingandsavingsaccounts toawidearrayoflending products. These include auto loans, student loans,mortgages, home equity line of credit, business loans, andcredit cards. Additionally, our team of financial advisorshelps members create comprehensive financial plans withinvestments, retirement planning, income strategies, wealthtransfer planning, and insurance. Our delivery mechanismsaredesignedtoallowmemberstobankthewaytheylive,withavailabilityanytime,anywhere.WecallourdeliverychannelsClick, Talk, Walk. Click includes remotedeliveryoptionsofonline and mobile banking; Talkreferencesourextended-hourscall center; andWalk represents traditional brick andmortarbranches. We offer market-competitive products and servicesproviding solutions through each life cycle segment.We build our product portfolio to meet the needs of, andproduce overall value to the membership. Building long-term relationships starts by becoming a member’s PrimaryFinancialInstitution(PFI)fortheircheckingandbasicsavings.These stable, low-cost funding sources provide beneficiallending rates other competitors find difficult to replicate. P.1a(2) Vision and MissionOurmission,vision,corevalues,andBHAGareshowninFigure P.1-1.
Figure P.1-1 Mission, Vision, Values and BHAGMission
We provide solutions for a better life.
Vision* We dominate the market while elevating the success of our members.* We change the way consumers and businesses bank.* We are known for the good work we do in the community.* We are sought out as the preferred employer.
Core ValuesIntegrity; Respect; Passion; Creativity; Excellence
Big Hairy Audacious Goal (BHAG)We will win the Malcolm Baldrige National Quality Award
Achieving our vision is contingent upon decisions andactionsbenefittingboththemembershipandcommunity. Weleverage our core competencies of Membership First and Operational Excellence to move toward achievement of ourVision. Our investments inachievingourBHAGensureourcore competencies and resulting competitive advantage aresustainable.
Figure P.1-2 Core Competencies
MembershipFirst
Sustainability - mutual success; members win, membership winsLoyalty - depth and tenure of PFI relationships; solutions not productsConsultative - we listen, we care, we offer solutions that benefitTrust - derived from local focus to act in the best interest of the membership and communityTransparency - what you see is what you get, nothing hidden and no surprises
OperationalExcellence
A focus on getting better every day through the holistic application of the Baldrige framework.
Our mission, vision, values, and core competenciestranslateintoamarketdifferentiatingvaluepropositiontoourmembershipandworkforce.
Figure P.1-3 Value PropositionsValue Proposition to the Membership
We build long term relationships and deep mutual trust with our members by acting in the best interest of our membership and community.
Value Proposition to the Elevations Workforce
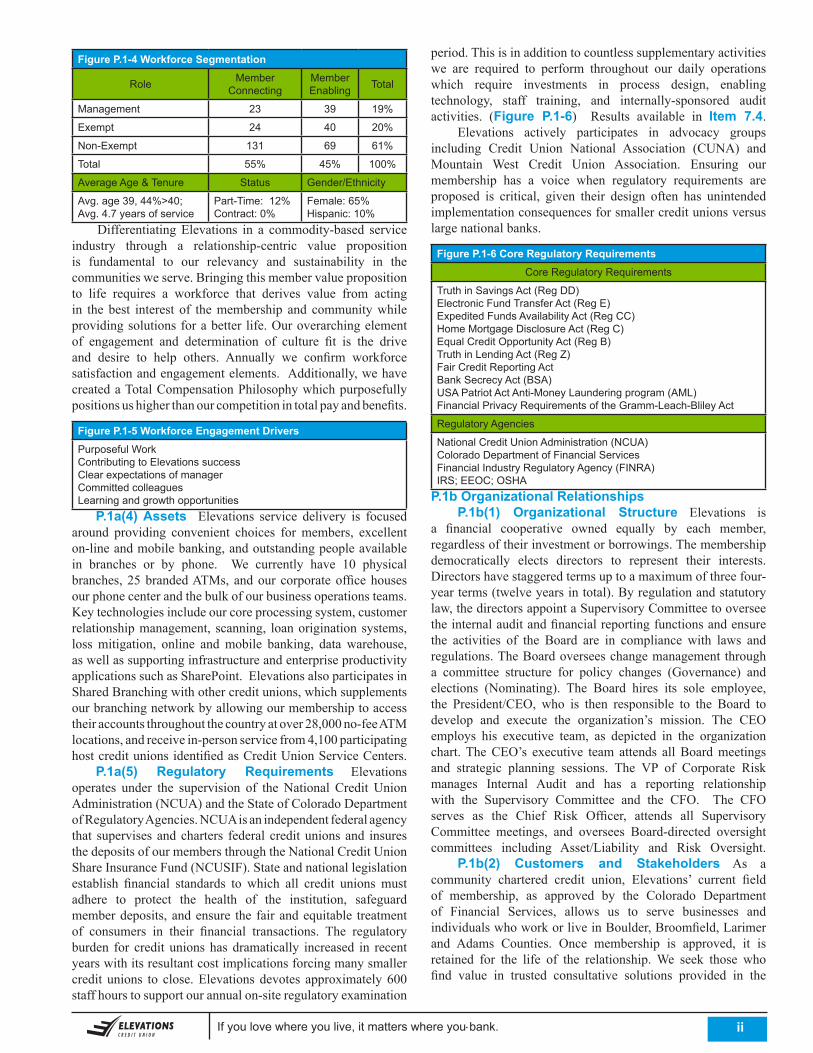
The best place you have ever worked. P.1a(3) Workforce Profile Elevations employsapproximately 325 people with workforce demographicsreflectingthemembershipweserve.Ourcultureisdefinedbyenergetic,talented,andsavvyindividualswholiveourvalues,believe inprofessional authenticity and craftsmanship, investinthesustainabilityofthecommunity,andhavefundoingit. Elevations has a highly educatedwork force, with 65%holdingBachelor’sorMaster’sdegrees.Onehundredpercentof Vice Presidents and above have completed Bachelor’sdegrees or higher, with 30% achieving Master’s degrees.Certificationand/or registrationsare required for lendingandwealth management positions. Many of our team membersare highly credentialed beyond the requirements of jobdescriptions with industry-specific certifications in HumanResources, Information Technology, Finance, Accounting,Business Analysis, and Project Management as examples. Webelieve in a “TeamElevations”philosophy inwhichwe all serve the membership. Our workforce segmentationrecognizesweeachplayadifferent role inourservice to themembership.Member Connecting teams (those in theClick, Talk, Walk channels), interact directly with ourmembership.They are supported by Member Enabling teams in areassuchasHumanResources,AccountServicingandPayments,Compliance and Risk Oversight, Facilities, and InformationTechnology.OurworkforceissupportedbyourvolunteerBoardofDirectors(Board),andSupervisoryCommittee.Elevationshasnoorganizedbargainingunits,norspecializedhealthandsafetyrequirements.
iiIf you love where you live, it matters where you bank. .
period.Thisisinadditiontocountlesssupplementaryactivitieswe are required to perform throughout our daily operationswhich require investments in process design, enablingtechnology, staff training, and internally-sponsored auditactivities. (Figure P.1-6) Results available in Item 7.4. Elevations actively participates in advocacy groupsincluding Credit Union National Association (CUNA) andMountain West Credit Union Association. Ensuring ourmembership has a voice when regulatory requirements areproposed is critical, given their design often has unintendedimplementationconsequencesforsmallercreditunionsversuslargenationalbanks.
Figure P.1-6 Core Regulatory RequirementsCore Regulatory Requirements
Truth in Savings Act (Reg DD)Electronic Fund Transfer Act (Reg E)Expedited Funds Availability Act (Reg CC)Home Mortgage Disclosure Act (Reg C)Equal Credit Opportunity Act (Reg B)Truth in Lending Act (Reg Z)Fair Credit Reporting ActBank Secrecy Act (BSA)USA Patriot Act Anti-Money Laundering program (AML)Financial Privacy Requirements of the Gramm-Leach-Bliley Act
Regulatory Agencies
National Credit Union Administration (NCUA)Colorado Department of Financial ServicesFinancial Industry Regulatory Agency (FINRA)IRS; EEOC; OSHA
P.1b Organizational Relationships P.1b(1) Organizational Structure Elevations is a financial cooperative owned equally by each member,regardlessoftheirinvestmentorborrowings.Themembershipdemocratically elects directors to represent their interests.Directorshavestaggeredtermsuptoamaximumofthreefour-yearterms(twelveyearsintotal).Byregulationandstatutorylaw,thedirectorsappointaSupervisoryCommitteetooverseetheinternalauditandfinancialreportingfunctionsandensurethe activities of the Board are in compliance with laws andregulations.TheBoardoverseeschangemanagementthrougha committee structure for policy changes (Governance) andelections (Nominating). The Board hires its sole employee,the President/CEO, who is then responsible to the Board todevelop and execute the organization’s mission. The CEOemploys his executive team, as depicted in the organizationchart.TheCEO’s executive team attends allBoardmeetingsand strategic planning sessions. The VP of Corporate Riskmanages Internal Audit and has a reporting relationshipwith the Supervisory Committee and the CFO. The CFOserves as the Chief Risk Officer, attends all SupervisoryCommittee meetings, and oversees Board-directed oversightcommittees including Asset/Liability and Risk Oversight. P.1b(2) Customers and Stakeholders As acommunity chartered credit union, Elevations’ current fieldof membership, as approved by the Colorado Departmentof Financial Services, allows us to serve businesses andindividualswhoworkorliveinBoulder,Broomfield,Larimerand Adams Counties. Once membership is approved, it isretained for the life of the relationship.We seek those whofind value in trusted consultative solutions provided in the
Figure P.1-4 Workforce Segmentation
Role Member Connecting
Member Enabling Total
Management 23 39 19%
Exempt 24 40 20%
Non-Exempt 131 69 61%
Total 55% 45% 100%
Average Age & Tenure Status Gender/Ethnicity
Avg. age 39, 44%>40; Avg. 4.7 years of service
Part-Time: 12%Contract: 0%
Female: 65%Hispanic: 10%
DifferentiatingElevations in a commodity-based serviceindustry through a relationship-centric value propositionis fundamental to our relevancy and sustainability in thecommunitiesweserve.Bringingthismembervaluepropositionto life requires a workforce that derives value from actingin the best interest of themembership and communitywhileprovidingsolutionsforabetter life.Ouroverarchingelementof engagement and determination of culture fit is the driveand desire to help others. Annually we confirm workforcesatisfactionandengagementelements. Additionally,wehavecreatedaTotalCompensationPhilosophywhichpurposefullypositionsushigherthanourcompetitionintotalpayandbenefits.
Figure P.1-5 Workforce Engagement DriversPurposeful WorkContributing to Elevations successClear expectations of managerCommitted colleaguesLearning and growth opportunities
P.1a(4) Assets Elevations service delivery is focusedaround providing convenient choices formembers, excellenton-lineandmobilebanking,andoutstandingpeopleavailablein branches or by phone. We currently have 10 physicalbranches,25brandedATMs, andour corporateofficehousesourphonecenterandthebulkofourbusinessoperationsteams.Keytechnologiesincludeourcoreprocessingsystem,customerrelationshipmanagement, scanning, loanoriginationsystems,lossmitigation, online andmobile banking, data warehouse,aswellassupportinginfrastructureandenterpriseproductivityapplicationssuchasSharePoint.ElevationsalsoparticipatesinSharedBranchingwithothercreditunions,whichsupplementsourbranchingnetworkbyallowingourmembershiptoaccesstheiraccountsthroughoutthecountryatover28,000no-feeATMlocations,andreceivein-personservicefrom4,100participatinghostcreditunionsidentifiedasCreditUnionServiceCenters. P.1a(5) Regulatory Requirements Elevations operates under the supervision of theNational Credit UnionAdministration(NCUA)andtheStateofColoradoDepartmentofRegulatoryAgencies.NCUAisanindependentfederalagencythat supervises andcharters federal creditunionsand insuresthedepositsofourmembersthroughtheNationalCreditUnionShareInsuranceFund(NCUSIF).Stateandnationallegislationestablish financial standards to which all credit unions mustadhere to protect the health of the institution, safeguardmemberdeposits,andensure the fairandequitable treatmentof consumers in their financial transactions. The regulatoryburden for credit unionshasdramatically increased in recentyearswithitsresultantcostimplicationsforcingmanysmallercredit unions to close.Elevationsdevotes approximately600staffhourstosupportourannualon-siteregulatoryexamination
iiiIf you love where you live, it matters where you bank. .
best interests of the membership and community. We arenot for those whose focus is obtaining the lowest pricepossible on individual products. Our approach is solution-centric, straightforward, focused on building relationships,doing the right thing, and getting better at it every day. While we differentiate through relationship, weunderstand our customer groups have key thresholdrequirements or value drivers we must meet or exceedbefore our unique value proposition can be considered.
Figure P.1-7 Key Stakeholder RequirementsMember (Customer) Requirements:
Threshold – aligned with Operational Excellence Core Competency ❋ Prompt service ❋ Inquiry/problem resolved timely ❋ Quality service & support ❋ Easy to conduct business
Differentiation – aligned with Membership First Core Competency ❋ Personally engaged - Trust ❋ Feel like a valued member - Loyalty ❋ Delivers value - Consultative ❋ Act in best interest - Sustainability, Transparency
Community Requirements
• Reputation as a fiscally sound, good corporate citizen • Proactive volunteer and community (financial) reinvestment
Regulatory Requirements
• Accurate financial records• Appropriate risk assessment and mitigation• Proactive compliance with regulations
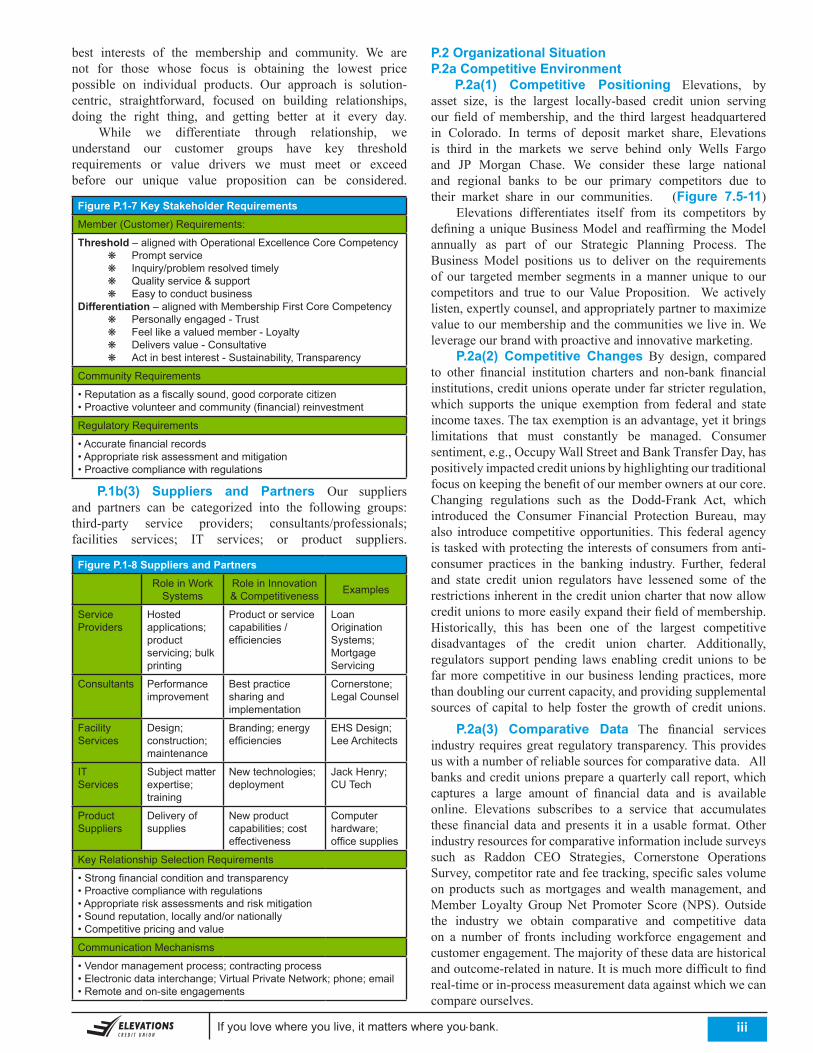
P.1b(3) Suppliers and Partners Our suppliersand partners can be categorized into the following groups:third-party service providers; consultants/professionals;facilities services; IT services; or product suppliers.
Figure P.1-8 Suppliers and PartnersRole in Work
SystemsRole in Innovation & Competitiveness Examples
Service Providers
Hosted applications; product servicing; bulk printing
Product or service capabilities / efficiencies
Loan Origination Systems; Mortgage Servicing
Consultants Performance improvement
Best practice sharing and implementation
Cornerstone; Legal Counsel
Facility Services
Design; construction; maintenance
Branding; energy efficiencies
EHS Design; Lee Architects
IT Services
Subject matter expertise; training
New technologies; deployment
Jack Henry; CU Tech
Product Suppliers
Delivery of supplies
New product capabilities; cost effectiveness
Computer hardware; office supplies
Key Relationship Selection Requirements
• Strong financial condition and transparency• Proactive compliance with regulations• Appropriate risk assessments and risk mitigation• Sound reputation, locally and/or nationally• Competitive pricing and value
Communication Mechanisms
• Vendor management process; contracting process• Electronic data interchange; Virtual Private Network; phone; email• Remote and on-site engagements
P.2 Organizational SituationP.2a Competitive Environment P.2a(1) Competitive Positioning Elevations, byasset size, is the largest locally-based credit union servingour field ofmembership, and the third largest headquarteredin Colorado. In terms of deposit market share, Elevationsis third in the markets we serve behind only Wells Fargoand JP Morgan Chase. We consider these large nationaland regional banks to be our primary competitors due totheir market share in our communities. (Figure 7.5-11) Elevations differentiates itself from its competitors bydefiningauniqueBusinessModelandreaffirming theModelannually as part of our Strategic Planning Process. TheBusiness Model positions us to deliver on the requirementsof our targetedmember segments in amanner unique to ourcompetitors and true to ourValue Proposition. We activelylisten,expertlycounsel,andappropriatelypartnertomaximizevaluetoourmembershipandthecommunitieswelivein.Weleverageourbrandwithproactiveandinnovativemarketing. P.2a(2) Competitive Changes By design, comparedto other financial institution charters and non-bank financialinstitutions,creditunionsoperateunderfarstricterregulation,which supports the unique exemption from federal and stateincometaxes.Thetaxexemptionisanadvantage,yetitbringslimitations that must constantly be managed. Consumersentiment,e.g.,OccupyWallStreetandBankTransferDay,haspositivelyimpactedcreditunionsbyhighlightingourtraditionalfocusonkeepingthebenefitofourmemberownersatourcore.Changing regulations such as the Dodd-Frank Act, whichintroduced the Consumer Financial Protection Bureau, mayalso introducecompetitiveopportunities.This federal agencyistaskedwithprotectingtheinterestsofconsumersfromanti-consumer practices in the banking industry. Further, federaland state credit union regulators have lessened some of therestrictionsinherentinthecreditunioncharterthatnowallowcreditunionstomoreeasilyexpandtheirfieldofmembership.Historically, this has been one of the largest competitivedisadvantages of the credit union charter. Additionally,regulators support pending laws enabling credit unions to befarmore competitive inourbusiness lendingpractices,morethandoublingourcurrentcapacity,andprovidingsupplementalsources of capital to help foster the growth of credit unions.
P.2a(3) Comparative Data The financial servicesindustryrequiresgreat regulatory transparency.Thisprovidesuswithanumberofreliablesourcesforcomparativedata.Allbanksandcreditunionsprepareaquarterlycallreport,whichcaptures a large amount of financial data and is availableonline. Elevations subscribes to a service that accumulatesthesefinancial data andpresents it in a usable format.Otherindustryresourcesforcomparativeinformationincludesurveyssuch as Raddon CEO Strategies, Cornerstone OperationsSurvey,competitorrateandfeetracking,specificsalesvolumeonproducts such asmortgages andwealthmanagement, andMember LoyaltyGroupNet Promoter Score (NPS). Outsidethe industry we obtain comparative and competitive dataon a number of fronts including workforce engagement andcustomerengagement.Themajorityofthesedataarehistoricalandoutcome-relatedinnature.Itismuchmoredifficulttofindreal-timeorin-processmeasurementdataagainstwhichwecancompareourselves.
ivIf you love where you live, it matters where you bank. .
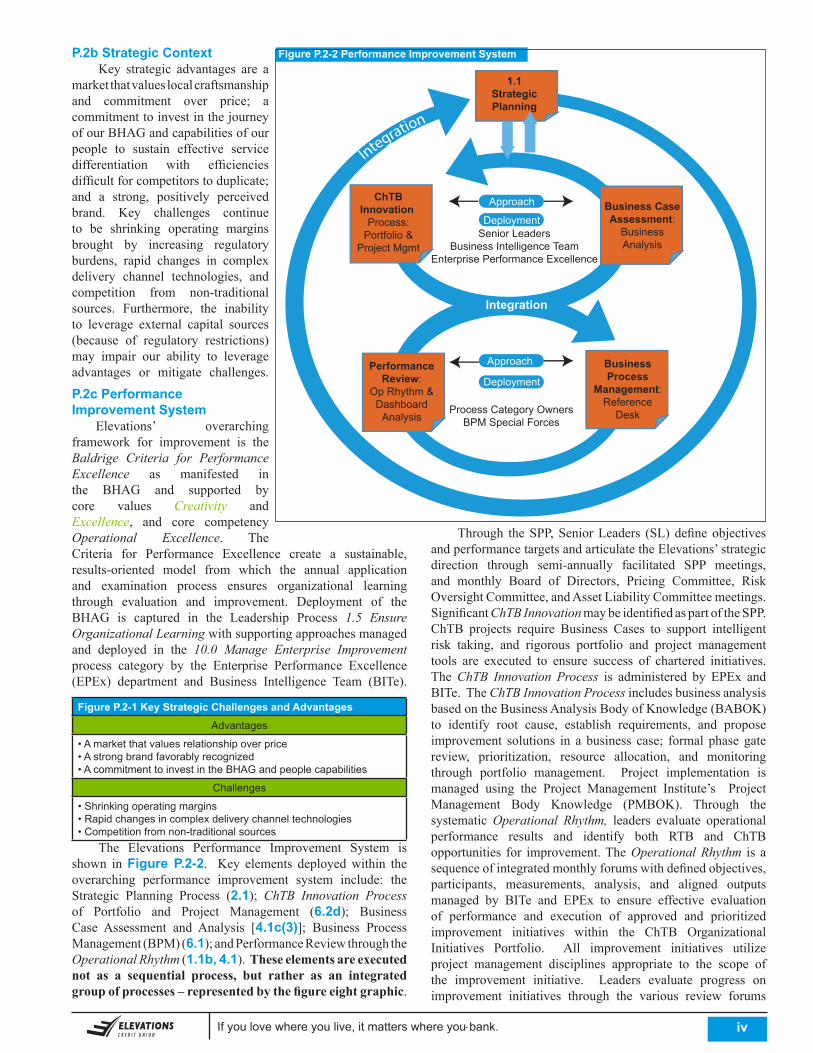
Through theSPP,SeniorLeaders (SL)defineobjectivesandperformancetargetsandarticulatetheElevations’strategicdirection through semi-annually facilitated SPP meetings,and monthly Board of Directors, Pricing Committee, RiskOversightCommittee,andAssetLiabilityCommitteemeetings.SignificantChTB Innovation maybeidentifiedaspartoftheSPP.ChTB projects require Business Cases to support intelligentrisk taking, and rigorous portfolio and project managementtools are executed to ensure success of chartered initiatives.TheChTB Innovation Process is administered by EPEx andBITe.TheChTB Innovation ProcessincludesbusinessanalysisbasedontheBusinessAnalysisBodyofKnowledge(BABOK)to identify root cause, establish requirements, and proposeimprovement solutions in a business case; formal phase gatereview, prioritization, resource allocation, and monitoringthrough portfolio management. Project implementation ismanaged using the Project Management Institute’s ProjectManagement Body Knowledge (PMBOK). Through thesystematicOperational Rhythm, leaders evaluate operationalperformance results and identify both RTB and ChTBopportunities for improvement.TheOperational Rhythm is a sequenceofintegratedmonthlyforumswithdefinedobjectives,participants, measurements, analysis, and aligned outputsmanaged by BITe and EPEx to ensure effective evaluationof performance and execution of approved and prioritizedimprovement initiatives within the ChTB OrganizationalInitiatives Portfolio. All improvement initiatives utilizeproject management disciplines appropriate to the scope ofthe improvement initiative. Leaders evaluate progress onimprovement initiatives through the various review forums
P.2b Strategic Context Key strategic advantages are amarketthatvalueslocalcraftsmanshipand commitment over price; acommitmenttoinvestinthejourneyofourBHAGandcapabilitiesofourpeople to sustain effective servicedifferentiation with efficienciesdifficultforcompetitorstoduplicate;and a strong, positively perceivedbrand. Key challenges continueto be shrinking operating marginsbrought by increasing regulatoryburdens, rapid changes in complexdelivery channel technologies, andcompetition from non-traditionalsources. Furthermore, the inabilityto leverage external capital sources(because of regulatory restrictions)may impair our ability to leverageadvantages or mitigate challenges.
P.2c Performance Improvement System Elevations’ overarchingframework for improvement is theBaldrige Criteria for Performance Excellence as manifested in the BHAG and supported bycore values Creativity and Excellence, and core competencyOperational Excellence. TheCriteria for Performance Excellence create a sustainable,results-oriented model from which the annual applicationand examination process ensures organizational learningthrough evaluation and improvement. Deployment of theBHAG is captured in the Leadership Process 1.5 Ensure Organizational Learning withsupportingapproachesmanagedand deployed in the 10.0 Manage Enterprise Improvement process category by the Enterprise Performance Excellence(EPEx) department and Business Intelligence Team (BITe).
Figure P.2-1 Key Strategic Challenges and AdvantagesAdvantages
• A market that values relationship over price• A strong brand favorably recognized • A commitment to invest in the BHAG and people capabilities
Challenges
• Shrinking operating margins• Rapid changes in complex delivery channel technologies• Competition from non-traditional sources The Elevations Performance Improvement System isshown inFigure P.2-2. Key elements deployedwithin theoverarching performance improvement system include: theStrategic Planning Process (2.1); ChTB Innovation Process of Portfolio and Project Management (6.2d); BusinessCase Assessment and Analysis [4.1c(3)]; Business ProcessManagement(BPM)(6.1);andPerformanceReviewthroughtheOperational Rhythm(1.1b, 4.1).These elements are executed not as a sequential process, but rather as an integrated group of processes – represented by the figure eight graphic.
Figure P.2-2 Performance Improvement System
Business CaseAssessment:
BusinessAnalysis
PerformanceReview:
Op Rhythm &Dashboard
Analysis
ChTBInnovation
Process:Portfolio &
Project Mgmt
BusinessProcess
Management:Reference
Desk
Senior LeadersBusiness Intelligence Team
Enterprise Performance Excellence
Process Category OwnersBPM Special Forces
Approach
Approach
Deployment
Deployment
Integration
Integration
1.1StrategicPlanning
vIf you love where you live, it matters where you bank. .
Figure P.2-3 Enterprise Process Map
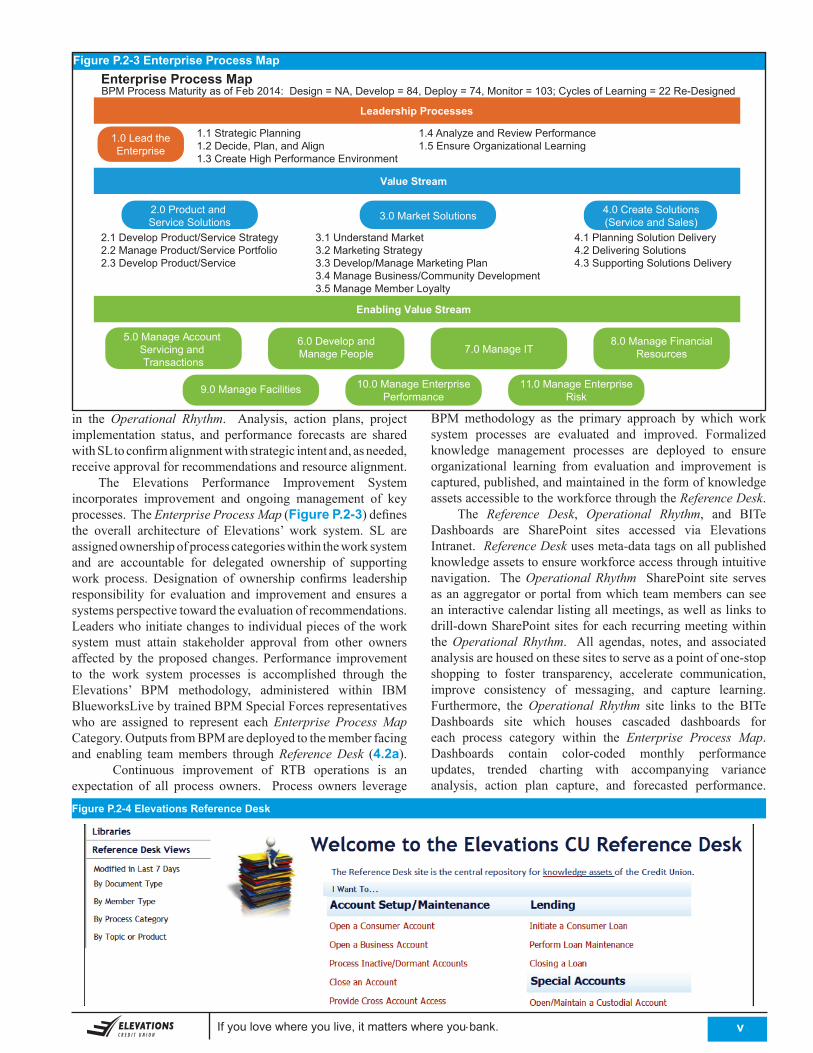
in the Operational Rhythm. Analysis, action plans, projectimplementation status, and performance forecasts are sharedwithSLtoconfirmalignmentwithstrategicintentand,asneeded,receiveapprovalforrecommendationsandresourcealignment. The Elevations Performance Improvement Systemincorporates improvement and ongoing management of keyprocesses.TheEnterprise Process Map(Figure P.2-3)definesthe overall architecture of Elevations’ work system. SL areassignedownershipofprocesscategorieswithintheworksystemand are accountable for delegated ownership of supportingwork process. Designation of ownership confirms leadershipresponsibility for evaluation and improvement and ensures asystemsperspectivetowardtheevaluationofrecommendations.Leaderswhoinitiatechangestoindividualpiecesoftheworksystem must attain stakeholder approval from other ownersaffectedby theproposedchanges.Performance improvementto the work system processes is accomplished through theElevations’ BPM methodology, administered within IBMBlueworksLivebytrainedBPMSpecialForcesrepresentativeswho are assigned to represent eachEnterprise Process Map Category.OutputsfromBPMaredeployedtothememberfacingand enabling teammembers throughReference Desk (4.2a). Continuous improvement of RTB operations is anexpectation of all process owners. Process owners leverage
BPMmethodology as the primary approach by which worksystem processes are evaluated and improved. Formalizedknowledge management processes are deployed to ensureorganizational learning from evaluation and improvement iscaptured,published,andmaintainedintheformofknowledgeassetsaccessibletotheworkforcethroughtheReference Desk. The Reference Desk, Operational Rhythm, and BITeDashboards are SharePoint sites accessed via ElevationsIntranet.Reference Deskusesmeta-datatagsonallpublishedknowledgeassetstoensureworkforceaccessthroughintuitivenavigation. TheOperational Rhythm SharePoint site servesasanaggregatororportalfromwhichteammemberscanseeaninteractivecalendarlistingallmeetings,aswellaslinkstodrill-downSharePointsitesforeachrecurringmeetingwithintheOperational Rhythm. All agendas, notes, and associatedanalysisarehousedonthesesitestoserveasapointofone-stopshopping to foster transparency, accelerate communication,improve consistency of messaging, and capture learning.Furthermore, theOperational Rhythm site links to the BITeDashboards site which houses cascaded dashboards foreach process category within the Enterprise Process Map.Dashboards contain color-coded monthly performanceupdates, trended charting with accompanying varianceanalysis, action plan capture, and forecasted performance. Figure P.2-4 Elevations Reference Desk
1.0 Lead theEnterprise
Leadership Processes
Enterprise Process MapBPM Process Maturity as of Feb 2014: Design = NA, Develop = 84, Deploy = 74, Monitor = 103; Cycles of Learning = 22 Re-Designed
Value Stream
4.0 Create Solutions(Service and Sales)3.0 Market Solutions
2.1 Develop Product/Service Strategy2.2 Manage Product/Service Portfolio2.3 Develop Product/Service
3.1 Understand Market3.2 Marketing Strategy3.3 Develop/Manage Marketing Plan3.4 Manage Business/Community Development3.5 Manage Member Loyalty
4.1 Planning Solution Delivery4.2 Delivering Solutions4.3 Supporting Solutions Delivery
2.0 Product and Service Solutions
Enabling Value Stream
5.0 Manage Account Servicing and Transactions
6.0 Develop andManage People 7.0 Manage IT
8.0 Manage FinancialResources
9.0 Manage Facilities 10.0 Manage EnterprisePerformance
11.0 Manage EnterpriseRisk
1.1 Strategic Planning1.2 Decide, Plan, and Align1.3 Create High Performance Environment
1.4 Analyze and Review Performance1.5 Ensure Organizational Learning
If you love where you live, it matters where you bank. . 1
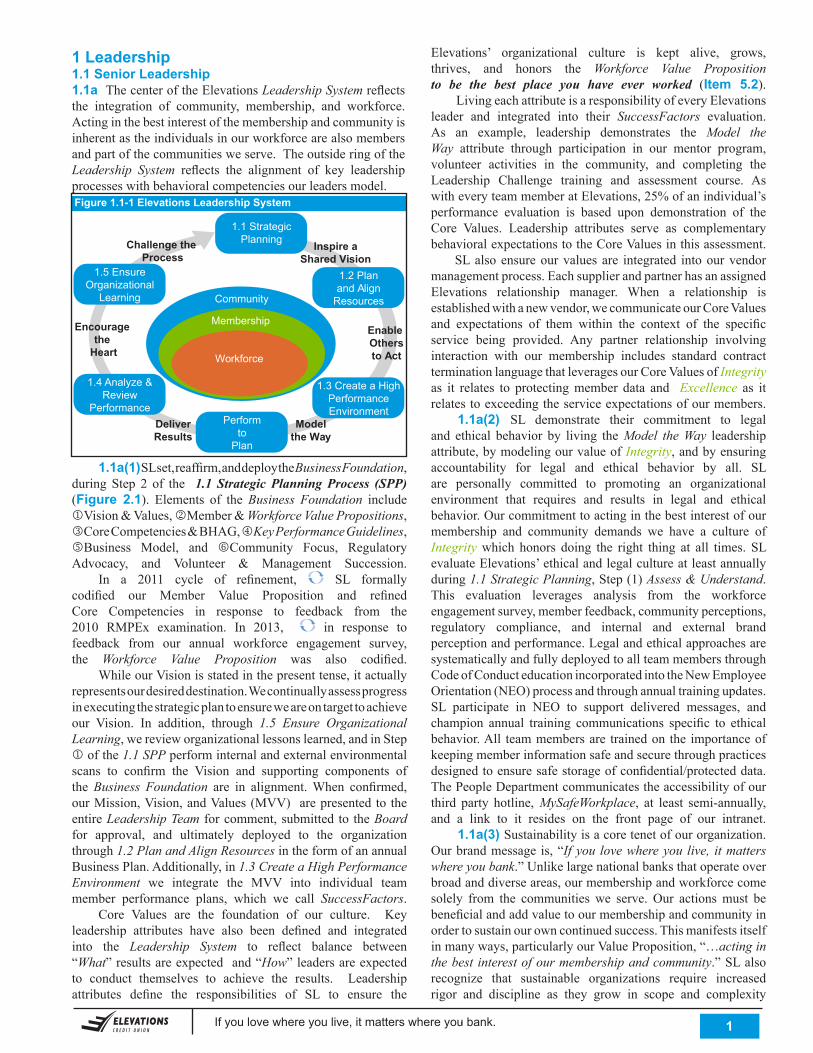
1 Leadership1.1 Senior Leadership1.1a ThecenteroftheElevationsLeadership Systemreflectsthe integration of community, membership, and workforce.Actinginthebestinterestofthemembershipandcommunityisinherentastheindividualsinourworkforcearealsomembersandpartofthecommunitiesweserve.TheoutsideringoftheLeadership System reflects the alignment of key leadershipprocesseswithbehavioralcompetenciesourleadersmodel.Figure 1.1-1 Elevations Leadership System
1.1a(1)SLset,reaffirm,anddeploytheBusiness Foundation, during Step 2 of the 1.1 Strategic Planning Process (SPP) (Figure 2.1). Elements of theBusiness Foundation includejVision&Values,kMember&Workforce Value Propositions, lCoreCompetencies&BHAG,mKey Performance Guidelines, nBusiness Model, and oCommunity Focus, RegulatoryAdvocacy, and Volunteer & Management Succession. In a 2011 cycle of refinement, SL formallycodified our Member Value Proposition and refinedCore Competencies in response to feedback from the2010 RMPEx examination. In 2013, in response to feedback from our annual workforce engagement survey,the Workforce Value Proposition was also codified. WhileourVisionisstatedinthepresenttense,itactuallyrepresentsourdesireddestination.Wecontinuallyassessprogressinexecutingthestrategicplantoensureweareontargettoachieveour Vision. In addition, through 1.5 Ensure Organizational Learning,werevieworganizationallessonslearned,andinStepjofthe1.1 SPPperforminternalandexternalenvironmentalscans to confirm the Vision and supporting components oftheBusiness Foundation are in alignment.When confirmed,ourMission,Vision,andValues(MVV)arepresentedtotheentire Leadership Team forcomment,submittedto theBoard for approval, and ultimately deployed to the organizationthrough1.2 Plan and Align ResourcesintheformofanannualBusinessPlan.Additionally,in1.3 Create a High Performance Environment we integrate the MVV into individual teammember performance plans, which we call SuccessFactors. Core Values are the foundation of our culture. Keyleadership attributes have also been defined and integratedinto the Leadership System to reflect balance between“What”resultsareexpectedand“How”leadersareexpectedto conduct themselves to achieve the results. Leadershipattributes define the responsibilities of SL to ensure the
Elevations’ organizational culture is kept alive, grows,thrives, and honors the Workforce Value Proposition to be the best place you have ever worked (Item 5.2). LivingeachattributeisaresponsibilityofeveryElevationsleader and integrated into their SuccessFactors evaluation.As an example, leadership demonstrates the Model the Way attribute through participation in our mentor program,volunteer activities in the community, and completing theLeadership Challenge training and assessment course. AswitheveryteammemberatElevations,25%ofanindividual’sperformance evaluation is based upon demonstration of theCore Values. Leadership attributes serve as complementarybehavioralexpectationstotheCoreValuesinthisassessment. SLalsoensureourvaluesare integrated intoourvendormanagementprocess.EachsupplierandpartnerhasanassignedElevations relationship manager. When a relationship isestablishedwithanewvendor,wecommunicateourCoreValuesand expectations of them within the context of the specificservice being provided. Any partner relationship involvinginteraction with our membership includes standard contractterminationlanguagethatleveragesourCoreValuesofIntegrity as it relates to protectingmember data and Excellence as it relatestoexceedingtheserviceexpectationsofourmembers. 1.1a(2) SL demonstrate their commitment to legaland ethical behavior by living theModel the Way leadershipattribute,bymodelingourvalueofIntegrity,andbyensuringaccountability for legal and ethical behavior by all. SLare personally committed to promoting an organizationalenvironment that requires and results in legal and ethicalbehavior.Ourcommitmenttoactinginthebestinterestofourmembership and community demands we have a culture ofIntegritywhich honors doing the right thing at all times. SLevaluateElevations’ethicalandlegalcultureatleastannuallyduring1.1 Strategic Planning,Step(1)Assess & Understand.This evaluation leverages analysis from the workforceengagementsurvey,memberfeedback,communityperceptions,regulatory compliance, and internal and external brandperceptionandperformance.LegalandethicalapproachesaresystematicallyandfullydeployedtoallteammembersthroughCodeofConducteducationincorporatedintotheNewEmployeeOrientation(NEO)processandthroughannualtrainingupdates.SL participate in NEO to support delivered messages, andchampion annual training communications specific to ethicalbehavior.All teammembersare trainedon the importanceofkeepingmemberinformationsafeandsecurethroughpracticesdesignedtoensuresafestorageofconfidential/protecteddata.ThePeopleDepartmentcommunicatestheaccessibilityofourthird party hotline,MySafeWorkplace, at least semi-annually,and a link to it resides on the front page of our intranet. 1.1a(3) Sustainabilityisacoretenetofourorganization.Ourbrandmessage is,“If you love where you live, it matters where you bank.”Unlikelargenationalbanksthatoperateoverbroadanddiverseareas,ourmembershipandworkforcecomesolely from the communities we serve. Our actionsmust bebeneficialandaddvaluetoourmembershipandcommunityinordertosustainourowncontinuedsuccess.Thismanifestsitselfinmanyways,particularlyourValueProposition,“…acting in the best interest of our membership and community.”SLalsorecognize that sustainable organizations require increasedrigor and discipline as they grow in scope and complexity
Community
Membership
Workforce
1.3 Create a HighPerformanceEnvironment
Performto
Plan
1.4 Analyze &Review
Performance
1.5 EnsureOrganizational
Learning
1.1 StrategicPlanning
1.2 Planand Align
Resources
Challenge the Process
Inspire aShared Vision
Enable Othersto Act
Modelthe Way
DeliverResults
Encouragethe
Heart
If you love where you live, it matters where you bank. . 2
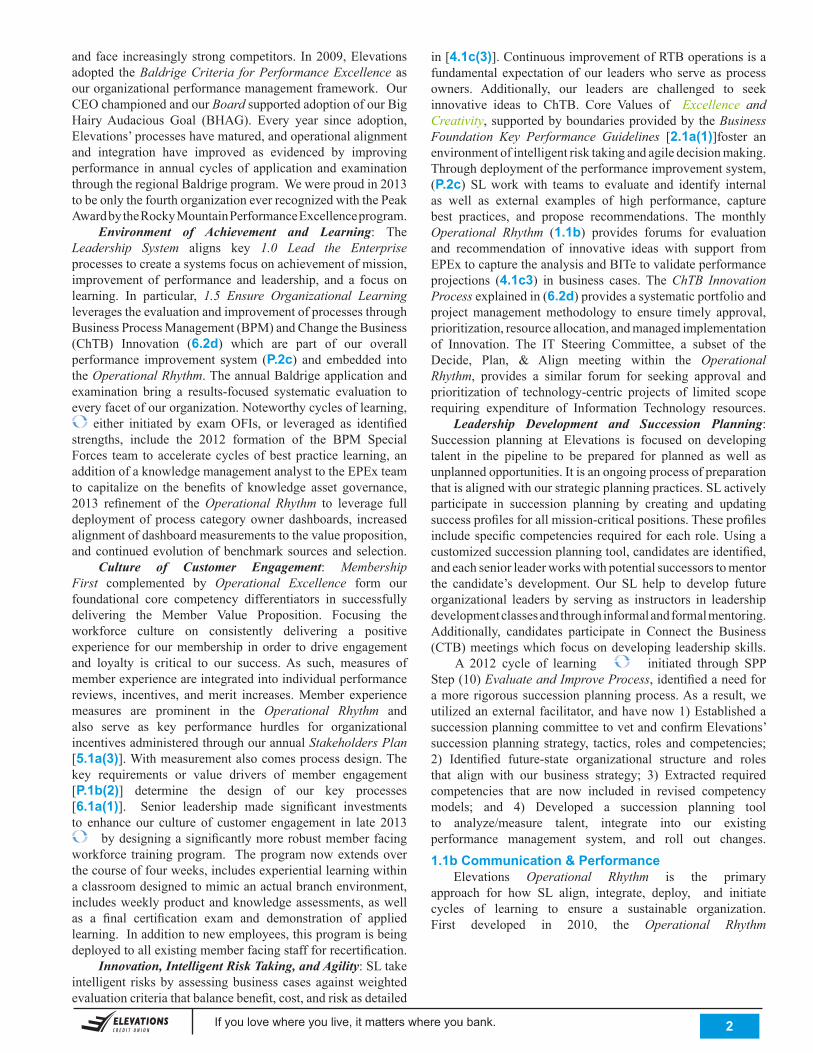
andface increasinglystrongcompetitors. In2009,Elevationsadopted theBaldrige Criteria for Performance Excellence as ourorganizationalperformancemanagementframework.OurCEOchampionedandourBoardsupportedadoptionofourBigHairyAudacious Goal (BHAG). Every year since adoption,Elevations’processeshavematured,andoperationalalignmentand integration have improved as evidenced by improvingperformance inannualcyclesofapplicationandexaminationthroughtheregionalBaldrigeprogram.Wewereproudin2013tobeonlythefourthorganizationeverrecognizedwiththePeakAwardbytheRockyMountainPerformanceExcellenceprogram. Environment of Achievement and Learning: TheLeadership System aligns key 1.0 Lead the Enterprise processestocreateasystemsfocusonachievementofmission,improvement of performance and leadership, and a focus onlearning. In particular, 1.5 Ensure Organizational Learning leveragestheevaluationandimprovementofprocessesthroughBusinessProcessManagement(BPM)andChangetheBusiness(ChTB) Innovation (6.2d) which are part of our overallperformance improvement system (P.2c) and embedded intotheOperational Rhythm.TheannualBaldrigeapplicationandexamination bring a results-focused systematic evaluation toeveryfacetofourorganization.Noteworthycyclesoflearning,
either initiated by examOFIs, or leveraged as identifiedstrengths, include the 2012 formation of the BPM SpecialForces team toacceleratecyclesofbestpractice learning,anadditionofaknowledgemanagementanalysttotheEPExteamto capitalize on the benefits of knowledge asset governance,2013 refinement of theOperational Rhythm to leverage fulldeploymentofprocesscategoryownerdashboards, increasedalignmentofdashboardmeasurementstothevalueproposition,andcontinuedevolutionofbenchmarksourcesandselection. Culture of Customer Engagement: Membership First complemented by Operational Excellence form ourfoundational core competency differentiators in successfullydelivering the Member Value Proposition. Focusing theworkforce culture on consistently delivering a positiveexperience forourmembership inorder todriveengagementand loyalty is critical to our success.As such, measures ofmemberexperienceareintegratedintoindividualperformancereviews, incentives, andmerit increases.Member experiencemeasures are prominent in the Operational Rhythm and also serve as key performance hurdles for organizationalincentivesadministeredthroughourannualStakeholders Plan [5.1a(3)].Withmeasurementalsocomesprocessdesign.Thekey requirements or value drivers of member engagement[P.1b(2)] determine the design of our key processes[6.1a(1)]. Senior leadership made significant investmentsto enhance our culture of customer engagement in late 2013
bydesigningasignificantlymorerobustmemberfacingworkforce trainingprogram. Theprogramnowextendsoverthecourseoffourweeks,includesexperientiallearningwithinaclassroomdesignedtomimicanactualbranchenvironment,includesweeklyproductandknowledgeassessments,aswellas a final certification exam and demonstration of appliedlearning.Inadditiontonewemployees,thisprogramisbeingdeployedtoallexistingmemberfacingstaffforrecertification. Innovation, Intelligent Risk Taking, and Agility:SLtakeintelligent risksbyassessingbusinesscasesagainstweightedevaluationcriteriathatbalancebenefit,cost,andriskasdetailed
in[4.1c(3)].ContinuousimprovementofRTBoperationsisafundamental expectationofour leaderswho serveasprocessowners. Additionally, our leaders are challenged to seekinnovative ideas to ChTB. Core Values of Excellence and Creativity,supportedbyboundariesprovidedbytheBusiness Foundation Key Performance Guidelines [2.1a(1)]foster an environmentofintelligentrisktakingandagiledecisionmaking.Throughdeploymentoftheperformanceimprovementsystem,(P.2c) SLworkwith teams to evaluate and identify internalas well as external examples of high performance, capturebest practices, and propose recommendations. The monthlyOperational Rhythm (1.1b) provides forums for evaluationand recommendation of innovative ideas with support fromEPExtocapturetheanalysisandBITetovalidateperformanceprojections (4.1c3) in business cases. TheChTB Innovation Processexplainedin(6.2d)providesasystematicportfolioandprojectmanagementmethodology to ensure timely approval,prioritization,resourceallocation,andmanagedimplementationof Innovation. The IT Steering Committee, a subset of theDecide, Plan, & Align meeting within the Operational Rhythm, provides a similar forum for seeking approval andprioritization of technology-centric projects of limited scoperequiring expenditure of Information Technology resources. Leadership Development and Succession Planning:Succession planning at Elevations is focused on developingtalent in the pipeline to be prepared for planned as well asunplannedopportunities.Itisanongoingprocessofpreparationthatisalignedwithourstrategicplanningpractices.SLactivelyparticipate in succession planning by creating and updatingsuccessprofilesforallmission-criticalpositions.Theseprofilesincludespecificcompetenciesrequiredforeachrole.Usingacustomizedsuccessionplanningtool,candidatesareidentified,andeachseniorleaderworkswithpotentialsuccessorstomentorthe candidate’s development. Our SL help to develop futureorganizational leaders by serving as instructors in leadershipdevelopmentclassesandthroughinformalandformalmentoring.Additionally, candidates participate in Connect the Business(CTB)meetingswhichfocusondeveloping leadershipskills. A 2012 cycle of learning initiated through SPPStep(10)Evaluate and Improve Process,identifiedaneedforamore rigoroussuccessionplanningprocess.Asa result,weutilizedanexternalfacilitator,andhavenow1)EstablishedasuccessionplanningcommitteetovetandconfirmElevations’successionplanningstrategy, tactics, rolesandcompetencies;2) Identified future-state organizational structure and rolesthat align with our business strategy; 3) Extracted requiredcompetencies that are now included in revised competencymodels; and 4) Developed a succession planning toolto analyze/measure talent, integrate into our existingperformance management system, and roll out changes.
1.1b Communication & Performance Elevations Operational Rhythm is the primaryapproach for how SL align, integrate, deploy, and initiatecycles of learning to ensure a sustainable organization.First developed in 2010, the Operational Rhythm
If you love where you live, it matters where you bank. . 3
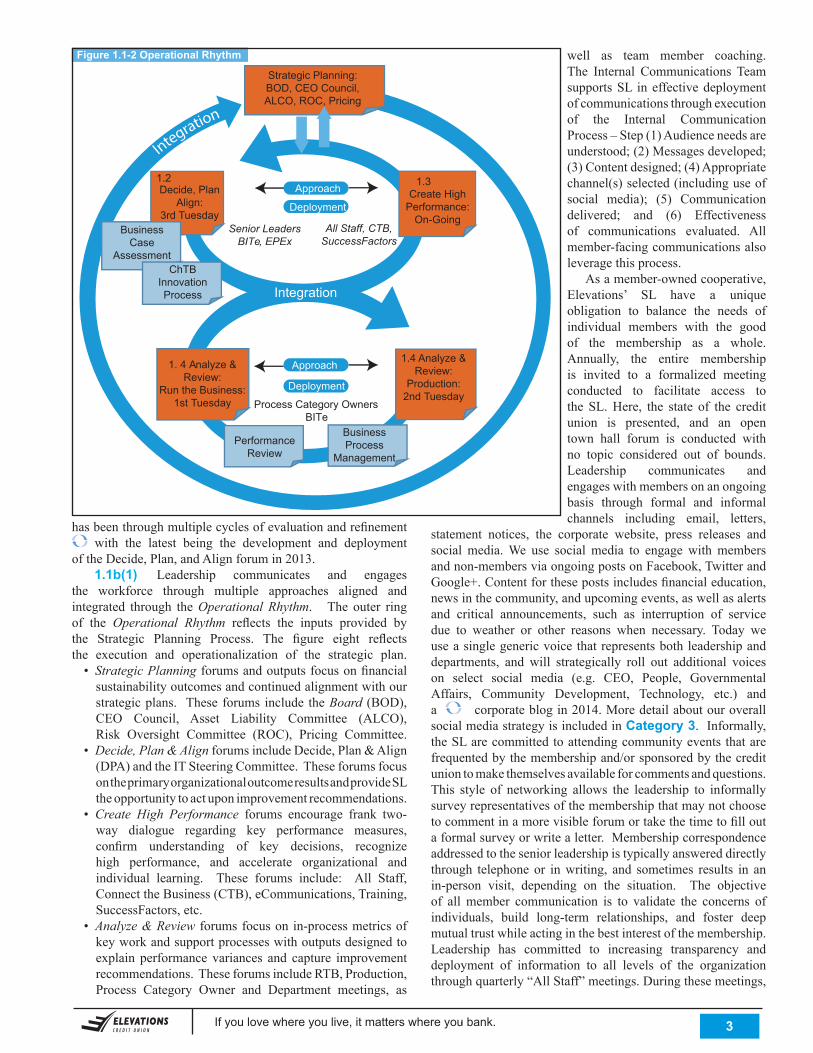
Figure 1.1-2 Operational Rhythm
hasbeenthroughmultiplecyclesofevaluationandrefinement with the latest being the development and deployment
oftheDecide,Plan,andAlignforumin2013. 1.1b(1) Leadership communicates and engagesthe workforce through multiple approaches aligned andintegrated through theOperational Rhythm. The outer ringof the Operational Rhythm reflects the inputs provided bythe Strategic Planning Process. The figure eight reflectsthe execution and operationalization of the strategic plan.
• Strategic Planningforumsandoutputsfocusonfinancialsustainabilityoutcomesandcontinuedalignmentwithourstrategicplans. Theseforums include theBoard (BOD),CEO Council, Asset Liability Committee (ALCO),Risk Oversight Committee (ROC), Pricing Committee.
• Decide, Plan & AlignforumsincludeDecide,Plan&Align(DPA)andtheITSteeringCommittee.TheseforumsfocusontheprimaryorganizationaloutcomeresultsandprovideSLtheopportunitytoactuponimprovementrecommendations.
• Create High Performance forums encourage frank two-way dialogue regarding key performance measures,confirm understanding of key decisions, recognizehigh performance, and accelerate organizational andindividual learning. These forums include: All Staff,ConnecttheBusiness(CTB),eCommunications,Training,SuccessFactors,etc.
• Analyze & Review forumsfocusonin-processmetricsofkeyworkandsupportprocesseswithoutputsdesignedtoexplain performance variances and capture improvementrecommendations.TheseforumsincludeRTB,Production,Process Category Owner and Department meetings, as
well as team member coaching.The Internal Communications TeamsupportsSL ineffectivedeploymentofcommunicationsthroughexecutionof the Internal CommunicationProcess–Step(1)Audienceneedsareunderstood;(2)Messagesdeveloped;(3)Contentdesigned;(4)Appropriatechannel(s)selected(includinguseofsocial media); (5) Communicationdelivered; and (6) Effectivenessof communications evaluated. Allmember-facingcommunicationsalsoleveragethisprocess. Asamember-ownedcooperative,Elevations’ SL have a uniqueobligation to balance the needs ofindividual members with the goodof the membership as a whole.Annually, the entire membershipis invited to a formalized meetingconducted to facilitate access tothe SL.Here, the state of the creditunion is presented, and an opentown hall forum is conducted withno topic considered out of bounds.Leadership communicates andengageswithmembersonanongoingbasis through formal and informalchannels including email, letters,
statement notices, the corporate website, press releases andsocial media.We use social media to engage withmembersandnon-membersviaongoingpostsonFacebook,TwitterandGoogle+.Contentforthesepostsincludesfinancialeducation,newsinthecommunity,andupcomingevents,aswellasalertsand critical announcements, such as interruption of servicedue to weather or other reasons when necessary. Today weuseasinglegenericvoicethatrepresentsbothleadershipanddepartments, and will strategically roll out additional voiceson select social media (e.g. CEO, People, GovernmentalAffairs, Community Development, Technology, etc.) anda corporateblogin2014.MoredetailaboutouroverallsocialmediastrategyisincludedinCategory 3.Informally,theSLarecommittedtoattendingcommunityeventsthatarefrequentedbythemembershipand/orsponsoredbythecredituniontomakethemselvesavailableforcommentsandquestions.This style of networking allows the leadership to informallysurveyrepresentativesofthemembershipthatmaynotchoosetocommentinamorevisibleforumortakethetimetofilloutaformalsurveyorwritealetter.Membershipcorrespondenceaddressedtotheseniorleadershipistypicallyanswereddirectlythrough telephoneor inwriting, and sometimes results in anin-person visit, depending on the situation. The objectiveof allmember communication is to validate the concerns ofindividuals, build long-term relationships, and foster deepmutualtrustwhileactinginthebestinterestofthemembership.Leadership has committed to increasing transparency anddeployment of information to all levels of the organizationthroughquarterly“AllStaff”meetings.Duringthesemeetings,
Decide, PlanAlign:
3rd Tuesday
Process Category OwnersBITe
Approach
Approach
Deployment
Deployment
Integration
Integration
1.1
1.2Create High
Performance:On-Going
1.3
1. 4 Analyze &Review:
Run the Business:1st Tuesday
1.4 Analyze &Review:
Production:2nd Tuesday
Senior LeadersBITe, EPEx
All Staff, CTB,SuccessFactors
Business Case
AssessmentChTB
InnovationProcess
PerformanceReview
BusinessProcess
Management
1.1 Strategic Planning:BOD, CEO Council,ALCO, ROC, Pricing
If you love where you live, it matters where you bank. . 4
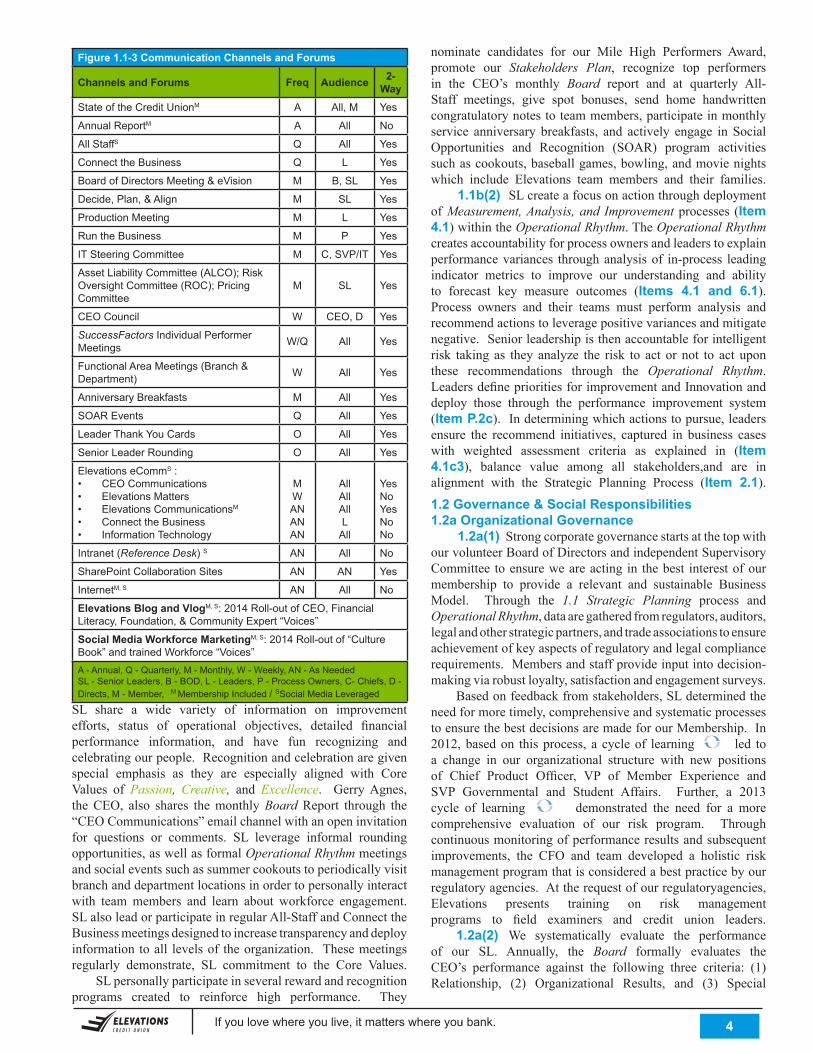
Figure 1.1-3 Communication Channels and Forums
Channels and Forums Freq Audience 2-Way
State of the Credit UnionM A All, M Yes
Annual ReportM A All No
All StaffS Q All Yes
Connect the Business Q L Yes
Board of Directors Meeting & eVision M B, SL Yes
Decide, Plan, & Align M SL Yes
Production Meeting M L Yes
Run the Business M P Yes
IT Steering Committee M C, SVP/IT Yes
Asset Liability Committee (ALCO); Risk Oversight Committee (ROC); Pricing Committee
M SL Yes
CEO Council W CEO, D Yes
SuccessFactors Individual Performer Meetings W/Q All Yes
Functional Area Meetings (Branch & Department) W All Yes
Anniversary Breakfasts M All Yes
SOAR Events Q All Yes
Leader Thank You Cards O All Yes
Senior Leader Rounding O All Yes
Elevations eCommS :• CEO Communications• Elevations Matters• Elevations CommunicationsM
• Connect the Business• Information Technology
MWANANAN
AllAllAllL
All
YesNoYesNoNo
Intranet (Reference Desk) S AN All No
SharePoint Collaboration Sites AN AN Yes
InternetM, S AN All No
Elevations Blog and VlogM, S: 2014 Roll-out of CEO, Financial Literacy, Foundation, & Community Expert “Voices”
Social Media Workforce MarketingM, S: 2014 Roll-out of “Culture Book” and trained Workforce “Voices”A - Annual, Q - Quarterly, M - Monthly, W - Weekly, AN - As NeededSL - Senior Leaders, B - BOD, L - Leaders, P - Process Owners, C- Chiefs, D - Directs, M - Member, ,M Membership Included / SSocial Media Leveraged
SL share a wide variety of information on improvementefforts, status of operational objectives, detailed financialperformance information, and have fun recognizing andcelebratingourpeople.Recognitionandcelebrationaregivenspecial emphasis as they are especially aligned with CoreValues of Passion, Creative, and Excellence. GerryAgnes,theCEO, also shares themonthlyBoard Report through the“CEOCommunications”emailchannelwithanopeninvitationfor questions or comments. SL leverage informal roundingopportunities,aswellasformalOperational Rhythm meetings andsocialeventssuchassummercookoutstoperiodicallyvisitbranchanddepartmentlocationsinordertopersonallyinteractwith teammembers and learn about workforce engagement.SLalsoleadorparticipateinregularAll-StaffandConnecttheBusinessmeetingsdesignedtoincreasetransparencyanddeployinformationtoall levelsof theorganization. Thesemeetingsregularly demonstrate, SL commitment to the Core Values. SLpersonallyparticipateinseveralrewardandrecognitionprograms created to reinforce high performance. They
nominate candidates for our Mile High Performers Award,promote our Stakeholders Plan, recognize top performersin the CEO’s monthly Board report and at quarterly All-Staff meetings, give spot bonuses, send home handwrittencongratulatorynotestoteammembers,participateinmonthlyservice anniversary breakfasts, and actively engage in SocialOpportunities and Recognition (SOAR) program activitiessuchascookouts,baseballgames,bowling,andmovienightswhich include Elevations team members and their families. 1.1b(2) SLcreateafocusonactionthroughdeploymentof Measurement, Analysis, and Improvementprocesses (Item 4.1)withintheOperational Rhythm.TheOperational Rhythm createsaccountabilityforprocessownersandleaderstoexplainperformancevariances throughanalysisof in-process leadingindicator metrics to improve our understanding and abilityto forecast key measure outcomes (Items 4.1 and 6.1).Process owners and their teams must perform analysis andrecommendactionstoleveragepositivevariancesandmitigatenegative.Seniorleadershipisthenaccountableforintelligentrisk taking as they analyze the risk to act or not to act uponthese recommendations through the Operational Rhythm.LeadersdefineprioritiesforimprovementandInnovationanddeploy those through the performance improvement system(Item P.2c).Indeterminingwhichactionstopursue,leadersensure the recommend initiatives, captured in business caseswith weighted assessment criteria as explained in (Item 4.1c3), balance value among all stakeholders,and are inalignment with the Strategic Planning Process (Item 2.1).1.2 Governance & Social Responsibilities 1.2a Organizational Governance 1.2a(1) StrongcorporategovernancestartsatthetopwithourvolunteerBoardofDirectorsandindependentSupervisoryCommittee toensureweareacting in thebest interestofourmembership to provide a relevant and sustainable BusinessModel. Through the 1.1 Strategic Planning process andOperational Rhythm,dataaregatheredfromregulators,auditors,legalandotherstrategicpartners,andtradeassociationstoensureachievementofkeyaspectsofregulatoryandlegalcompliancerequirements.Membersandstaffprovideinputintodecision-makingviarobustloyalty,satisfactionandengagementsurveys. Basedonfeedbackfromstakeholders,SLdeterminedtheneedformoretimely,comprehensiveandsystematicprocessestoensurethebestdecisionsaremadeforourMembership.In2012,basedon thisprocess, a cycleof learning led to a change in our organizational structure with new positionsof Chief Product Officer, VP of Member Experience andSVP Governmental and Student Affairs. Further, a 2013cycle of learning demonstrated the need for a morecomprehensive evaluation of our risk program. Throughcontinuousmonitoringofperformanceresultsandsubsequentimprovements, the CFO and team developed a holistic riskmanagementprogramthatisconsideredabestpracticebyourregulatoryagencies.Attherequestofourregulatoryagencies,Elevations presents training on risk management programs to field examiners and credit union leaders. 1.2a(2) We systematically evaluate the performanceof our SL. Annually, the Board formally evaluates theCEO’s performance against the following three criteria: (1)Relationship, (2) Organizational Results, and (3) Special
If you love where you live, it matters where you bank. . 5
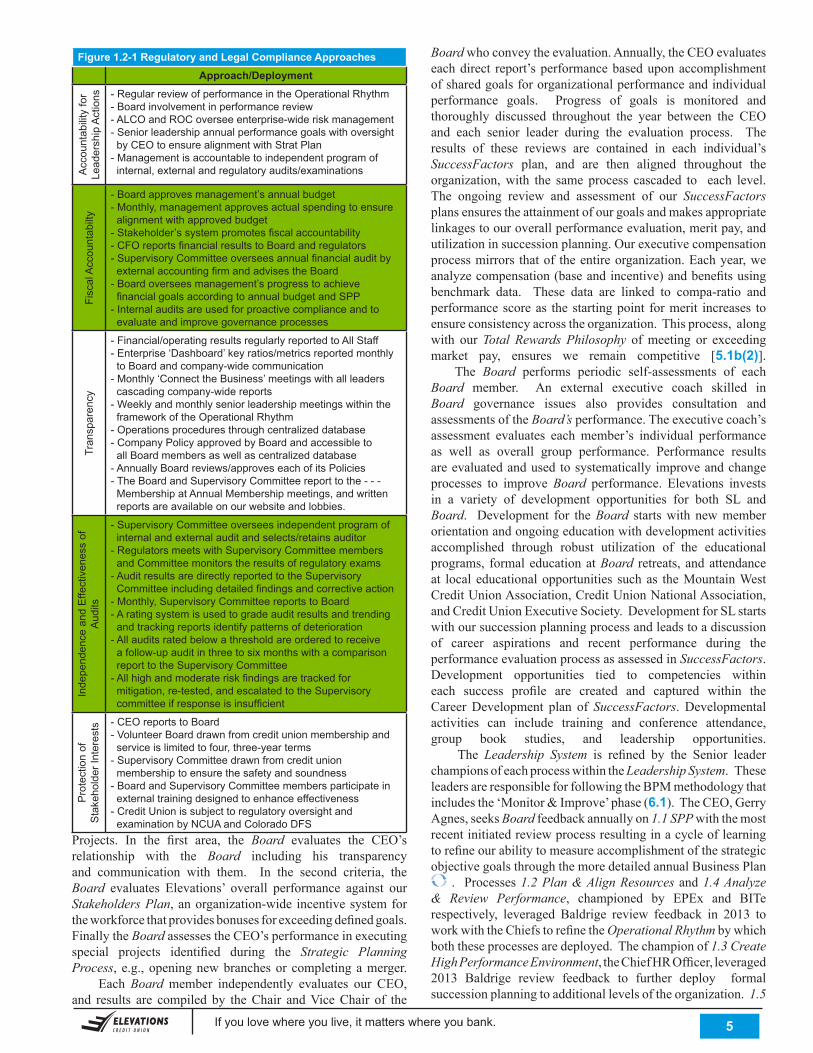
Figure 1.2-1 Regulatory and Legal Compliance ApproachesApproach/Deployment
Acc
ount
abili
ty fo
r Le
ader
ship
Act
ions - Regular review of performance in the Operational Rhythm
- Board involvement in performance review- ALCO and ROC oversee enterprise-wide risk management- Senior leadership annual performance goals with oversight by CEO to ensure alignment with Strat Plan- Management is accountable to independent program of internal, external and regulatory audits/examinations
Fisc
al A
ccou
ntab
ilty
- Board approves management’s annual budget- Monthly, management approves actual spending to ensure alignment with approved budget- Stakeholder’s system promotes fiscal accountability- CFO reports financial results to Board and regulators- Supervisory Committee oversees annual financial audit by external accounting firm and advises the Board- Board oversees management’s progress to achieve financial goals according to annual budget and SPP- Internal audits are used for proactive compliance and to evaluate and improve governance processes
Tran
spar
ency
- Financial/operating results regularly reported to All Staff - Enterprise ‘Dashboard’ key ratios/metrics reported monthly to Board and company-wide communication- Monthly ‘Connect the Business’ meetings with all leaders cascading company-wide reports - Weekly and monthly senior leadership meetings within the framework of the Operational Rhythm - Operations procedures through centralized database- Company Policy approved by Board and accessible to all Board members as well as centralized database- Annually Board reviews/approves each of its Policies- The Board and Supervisory Committee report to the - - - Membership at Annual Membership meetings, and written reports are available on our website and lobbies.
Inde
pend
ence
and
Effe
ctiv
enes
s of
A
udits
- Supervisory Committee oversees independent program of internal and external audit and selects/retains auditor- Regulators meets with Supervisory Committee members and Committee monitors the results of regulatory exams- Audit results are directly reported to the Supervisory Committee including detailed findings and corrective action- Monthly, Supervisory Committee reports to Board- A rating system is used to grade audit results and trending and tracking reports identify patterns of deterioration - All audits rated below a threshold are ordered to receive a follow-up audit in three to six months with a comparison report to the Supervisory Committee- All high and moderate risk findings are tracked for mitigation, re-tested, and escalated to the Supervisory committee if response is insufficient
Pro
tect
ion
of
Sta
keho
lder
Inte
rest
s - CEO reports to Board- Volunteer Board drawn from credit union membership and service is limited to four, three-year terms- Supervisory Committee drawn from credit union membership to ensure the safety and soundness - Board and Supervisory Committee members participate in external training designed to enhance effectiveness- Credit Union is subject to regulatory oversight and examination by NCUA and Colorado DFS
Projects. In the first area, the Board evaluates the CEO’srelationship with the Board including his transparencyand communication with them. In the second criteria, theBoard evaluates Elevations’ overall performance against ourStakeholders Plan,anorganization-wide incentivesystemfortheworkforcethatprovidesbonusesforexceedingdefinedgoals.FinallytheBoardassessestheCEO’sperformanceinexecutingspecial projects identified during the Strategic Planning Process, e.g.,openingnewbranchesorcompletingamerger. EachBoard member independently evaluates our CEO,and results are compiled by theChair andViceChair of the
Boardwhoconveytheevaluation.Annually,theCEOevaluateseachdirect report’sperformancebaseduponaccomplishmentofsharedgoalsfororganizationalperformanceandindividualperformance goals. Progress of goals is monitored andthoroughly discussed throughout the year between the CEOand each senior leader during the evaluation process. Theresults of these reviews are contained in each individual’sSuccessFactors plan, and are then aligned throughout theorganization,with the same process cascaded to each level.The ongoing review and assessment of our SuccessFactors plansensurestheattainmentofourgoalsandmakesappropriatelinkagestoouroverallperformanceevaluation,meritpay,andutilizationinsuccessionplanning.Ourexecutivecompensationprocessmirrors thatof theentireorganization.Eachyear,weanalyzecompensation(baseandincentive)andbenefitsusingbenchmark data. These data are linked to compa-ratio andperformancescoreas thestartingpoint formerit increases toensureconsistencyacrosstheorganization.Thisprocess,alongwith ourTotal Rewards Philosophy ofmeeting or exceedingmarket pay, ensures we remain competitive [5.1b(2)]. The Board performs periodic self-assessments of eachBoard member. An external executive coach skilled inBoard governance issues also provides consultation andassessmentsoftheBoard’sperformance.Theexecutivecoach’sassessment evaluates each member’s individual performanceas well as overall group performance. Performance resultsareevaluatedandused tosystematically improveandchangeprocesses to improveBoard performance. Elevations investsin a variety of development opportunities for both SL andBoard. Development for theBoard startswith newmemberorientationandongoingeducationwithdevelopmentactivitiesaccomplished through robust utilization of the educationalprograms, formaleducationatBoard retreats, andattendanceat local educationalopportunities suchas theMountainWestCreditUnionAssociation,CreditUnionNationalAssociation,andCreditUnionExecutiveSociety.DevelopmentforSLstartswithoursuccessionplanningprocessandleadstoadiscussionof career aspirations and recent performance during theperformanceevaluationprocessasassessedinSuccessFactors.Development opportunities tied to competencies withineach success profile are created and captured within theCareerDevelopment plan of SuccessFactors. Developmentalactivities can include training and conference attendance,group book studies, and leadership opportunities. The Leadership System is refined by the Senior leaderchampionsofeachprocesswithintheLeadership System.TheseleadersareresponsibleforfollowingtheBPMmethodologythatincludesthe‘Monitor&Improve’phase(6.1).TheCEO,GerryAgnes,seeksBoardfeedbackannuallyon1.1 SPPwiththemostrecentinitiatedreviewprocessresultinginacycleoflearningtorefineourabilitytomeasureaccomplishmentofthestrategicobjectivegoalsthroughthemoredetailedannualBusinessPlan
. Processes1.2 Plan & Align Resources and 1.4 Analyze & Review Performance, championed by EPEx and BITerespectively, leveraged Baldrige review feedback in 2013 toworkwiththeChiefstorefinetheOperational Rhythmbywhichboththeseprocessesaredeployed.Thechampionof1.3 Create High Performance Environment,theChiefHROfficer,leveraged2013 Baldrige review feedback to further deploy formalsuccessionplanningtoadditionallevelsoftheorganization.1.5
If you love where you live, it matters where you bank. . 6
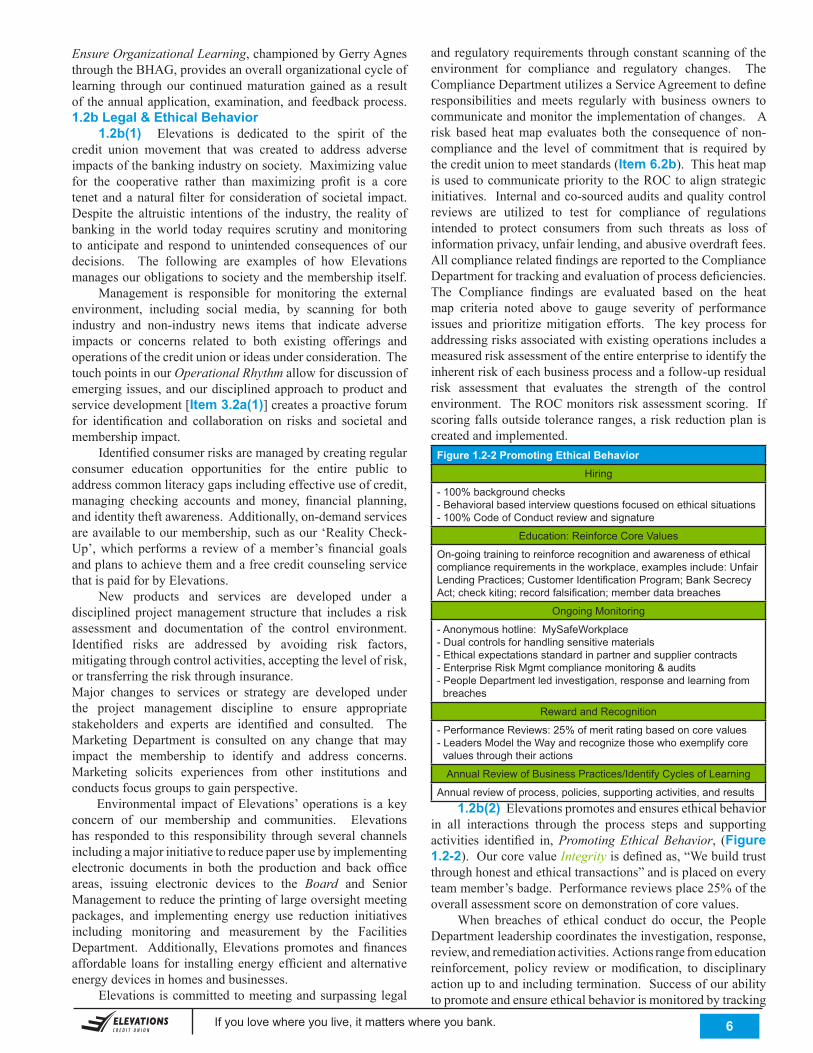
Ensure Organizational Learning,championedbyGerryAgnesthroughtheBHAG,providesanoverallorganizationalcycleoflearning throughour continuedmaturation gained as a resultoftheannualapplication,examination,andfeedbackprocess.1.2b Legal & Ethical Behavior 1.2b(1) Elevations is dedicated to the spirit of thecredit union movement that was created to address adverseimpactsofthebankingindustryonsociety.Maximizingvaluefor the cooperative rather than maximizing profit is a coretenet andanaturalfilter for considerationof societal impact.Despite the altruistic intentionsof the industry, the realityofbanking in theworld today requires scrutiny andmonitoringto anticipate and respond to unintended consequences of ourdecisions. The following are examples of how Elevationsmanagesourobligationstosocietyandthemembershipitself. Management is responsible for monitoring the externalenvironment, including social media, by scanning for bothindustry and non-industry news items that indicate adverseimpacts or concerns related to both existing offerings andoperationsofthecreditunionorideasunderconsideration.ThetouchpointsinourOperational Rhythmallowfordiscussionofemergingissues,andourdisciplinedapproachtoproductandservicedevelopment[Item 3.2a(1)]createsaproactiveforumfor identification and collaboration on risks and societal andmembershipimpact. Identifiedconsumerrisksaremanagedbycreatingregularconsumer education opportunities for the entire public toaddresscommonliteracygapsincludingeffectiveuseofcredit,managing checking accounts and money, financial planning,andidentitytheftawareness.Additionally,on-demandservicesareavailabletoourmembership,suchasour‘RealityCheck-Up’,whichperforms a reviewof amember’sfinancial goalsandplanstoachievethemandafreecreditcounselingservicethatispaidforbyElevations. New products and services are developed under adisciplinedprojectmanagement structure that includes a riskassessment and documentation of the control environment.Identified risks are addressed by avoiding risk factors,mitigatingthroughcontrolactivities,acceptingthelevelofrisk,ortransferringtheriskthroughinsurance.Major changes to services or strategy are developed underthe project management discipline to ensure appropriatestakeholders and experts are identified and consulted. TheMarketing Department is consulted on any change that mayimpact the membership to identify and address concerns.Marketing solicits experiences from other institutions andconductsfocusgroupstogainperspective. Environmental impact ofElevations’ operations is a keyconcern of our membership and communities. Elevationshas responded to this responsibility through several channelsincludingamajorinitiativetoreducepaperusebyimplementingelectronic documents in both the production and back officeareas, issuing electronic devices to the Board and Senior Managementtoreducetheprintingoflargeoversightmeetingpackages, and implementing energy use reduction initiativesincluding monitoring and measurement by the FacilitiesDepartment. Additionally, Elevations promotes and financesaffordable loans for installingenergyefficientandalternativeenergydevicesinhomesandbusinesses. Elevations iscommitted tomeetingandsurpassing legal
andregulatoryrequirementsthroughconstantscanningoftheenvironment for compliance and regulatory changes. TheComplianceDepartmentutilizesaServiceAgreementtodefineresponsibilities andmeets regularly with business owners tocommunicateandmonitortheimplementationofchanges.Arisk based heatmap evaluates both the consequence of non-compliance and the level of commitment that is required bythecredituniontomeetstandards(Item 6.2b).ThisheatmapisusedtocommunicateprioritytotheROCtoalignstrategicinitiatives.Internalandco-sourcedauditsandqualitycontrolreviews are utilized to test for compliance of regulationsintended to protect consumers from such threats as loss ofinformationprivacy,unfairlending,andabusiveoverdraftfees.AllcompliancerelatedfindingsarereportedtotheComplianceDepartmentfortrackingandevaluationofprocessdeficiencies.The Compliance findings are evaluated based on the heatmap criteria noted above to gauge severity of performanceissues and prioritizemitigation efforts. The key process foraddressingrisksassociatedwithexistingoperationsincludesameasuredriskassessmentoftheentireenterprisetoidentifytheinherentriskofeachbusinessprocessandafollow-upresidualrisk assessment that evaluates the strength of the controlenvironment.TheROCmonitorsriskassessmentscoring.Ifscoringfallsoutsidetoleranceranges,ariskreductionplaniscreatedandimplemented.
Figure 1.2-2 Promoting Ethical BehaviorHiring
- 100% background checks- Behavioral based interview questions focused on ethical situations- 100% Code of Conduct review and signature
Education: Reinforce Core Values
On-going training to reinforce recognition and awareness of ethical compliance requirements in the workplace, examples include: Unfair Lending Practices; Customer Identification Program; Bank Secrecy Act; check kiting; record falsification; member data breaches
Ongoing Monitoring
- Anonymous hotline: MySafeWorkplace - Dual controls for handling sensitive materials - Ethical expectations standard in partner and supplier contracts- Enterprise Risk Mgmt compliance monitoring & audits- People Department led investigation, response and learning from breaches
Reward and Recognition
- Performance Reviews: 25% of merit rating based on core values- Leaders Model the Way and recognize those who exemplify core values through their actions
Annual Review of Business Practices/Identify Cycles of Learning
Annual review of process, policies, supporting activities, and results 1.2b(2) Elevationspromotesandensuresethicalbehaviorin all interactions through the process steps and supportingactivities identified in,Promoting Ethical Behavior, (Figure 1.2-2).OurcorevalueIntegrityisdefinedas,“Webuildtrustthroughhonestandethicaltransactions”andisplacedoneveryteammember’sbadge.Performancereviewsplace25%oftheoverallassessmentscoreondemonstrationofcorevalues. When breaches of ethical conduct do occur, the PeopleDepartmentleadershipcoordinatestheinvestigation,response,review,andremediationactivities.Actionsrangefromeducationreinforcement, policy review ormodification, to disciplinaryactionuptoandincludingtermination.Successofourabilitytopromoteandensureethicalbehaviorismonitoredbytracking
If you love where you live, it matters where you bank. . 7
thenumberofethicalbreaches[Item 7.4a(4)]wehaveaswellasourmembership’sperceptionofhowwellwehaveactedinthebestinterestoftheirneedsandthecommunity[Item 7.5a(2)].1.2c Societal Responsibilities & Support of Key Communities 1.2c(1) Providingthecommunitywithaccesstounbiasedfinancialeducation,rangingfromrudimentaryfinancialliteracytocomplex long-termfinancialplanning, is the right thing todo. Our education initiatives provide a strong differentiatorinthemarketplace,supportourbrand.buildmemberloyalty,and create thriving members that in turn allow Elevationsto thrive. Each year Elevations deploys a broad array offree classes that are open to the public. Consistentwith thetheme Lifelong Learning through Elevations Credit Union, we create a holistic life-stage based program that allows usto meet the needs of our communities, build loyalty, andposition the credit union as the trusted resource within thecommunities we serve. We produce a program that beginswithprimarystudentsandcontinues throughpost-graduation.Workingwith ourSVPofGovernmental andStudentAffairswedeliverthreekeyinitiatives:RealityCheckforStudents(K-12);RealityCheckatCUBoulder;andRealityCheckLifelongLearning.Additionally,weintegrateanewmemberincentivewith tangible goals around newmember acquisition, productadoption,andWealthManagementreferrals.
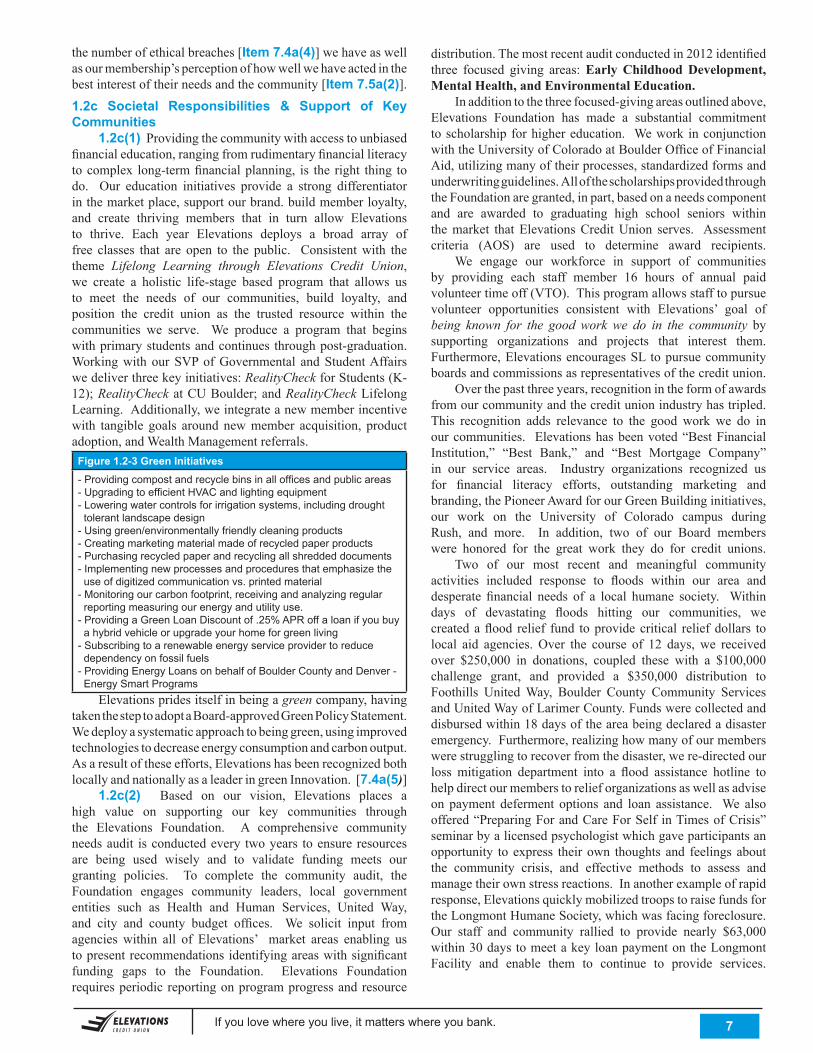
Figure 1.2-3 Green Initiatives- Providing compost and recycle bins in all offices and public areas- Upgrading to efficient HVAC and lighting equipment- Lowering water controls for irrigation systems, including drought tolerant landscape design- Using green/environmentally friendly cleaning products- Creating marketing material made of recycled paper products- Purchasing recycled paper and recycling all shredded documents- Implementing new processes and procedures that emphasize the use of digitized communication vs. printed material- Monitoring our carbon footprint, receiving and analyzing regular reporting measuring our energy and utility use.- Providing a Green Loan Discount of .25% APR off a loan if you buy a hybrid vehicle or upgrade your home for green living- Subscribing to a renewable energy service provider to reduce dependency on fossil fuels- Providing Energy Loans on behalf of Boulder County and Denver - Energy Smart Programs
Elevations prides itself in being a greencompany,havingtakenthesteptoadoptaBoard-approvedGreenPolicyStatement.Wedeployasystematicapproachtobeinggreen,usingimprovedtechnologiestodecreaseenergyconsumptionandcarbonoutput.Asaresultoftheseefforts,ElevationshasbeenrecognizedbothlocallyandnationallyasaleaderingreenInnovation.[7.4a(5)] 1.2c(2) Based on our vision, Elevations places ahigh value on supporting our key communities throughthe Elevations Foundation. A comprehensive communityneedsaudit isconductedevery twoyears toensureresourcesare being used wisely and to validate funding meets ourgranting policies. To complete the community audit, theFoundation engages community leaders, local governmententities such as Health and Human Services, United Way,and city and county budget offices. We solicit input fromagencies within all of Elevations’ market areas enabling ustopresentrecommendationsidentifyingareaswithsignificantfunding gaps to the Foundation. Elevations Foundationrequiresperiodicreportingonprogramprogressandresource
distribution.Themostrecentauditconductedin2012identifiedthree focused giving areas:Early Childhood Development, Mental Health, and Environmental Education. Inadditiontothethreefocused-givingareasoutlinedabove,Elevations Foundation has made a substantial commitmenttoscholarship forhighereducation. Wework inconjunctionwiththeUniversityofColoradoatBoulderOfficeofFinancialAid,utilizingmanyoftheirprocesses,standardizedformsandunderwritingguidelines.AllofthescholarshipsprovidedthroughtheFoundationaregranted,inpart,basedonaneedscomponentand are awarded to graduating high school seniors withinthemarket thatElevationsCreditUnion serves. Assessmentcriteria (AOS) are used to determine award recipients. We engage our workforce in support of communitiesby providing each staff member 16 hours of annual paidvolunteertimeoff(VTO).Thisprogramallowsstafftopursuevolunteer opportunities consistent with Elevations’ goal ofbeing known for the good work we do in the community bysupporting organizations and projects that interest them.Furthermore,ElevationsencouragesSL topursuecommunityboardsandcommissionsasrepresentativesofthecreditunion. Overthepastthreeyears,recognitionintheformofawardsfromourcommunityandthecreditunionindustryhastripled.This recognition adds relevance to the good work we do inourcommunities. Elevationshasbeenvoted“BestFinancialInstitution,” “Best Bank,” and “Best Mortgage Company”in our service areas. Industry organizations recognized usfor financial literacy efforts, outstanding marketing andbranding,thePioneerAwardforourGreenBuildinginitiatives,our work on the University of Colorado campus duringRush, and more. In addition, two of our Board memberswere honored for the great work they do for credit unions. Two of our most recent and meaningful communityactivities included response to floods within our area anddesperate financial needs of a local humane society. Withindays of devastating floods hitting our communities, wecreatedaflood relief fund toprovidecritical reliefdollars tolocal aid agencies. Over the course of 12 days, we receivedover $250,000 in donations, coupled these with a $100,000challenge grant, and provided a $350,000 distribution toFoothills UnitedWay, Boulder County Community ServicesandUnitedWayofLarimerCounty.Fundswerecollectedanddisbursedwithin18daysoftheareabeingdeclaredadisasteremergency.Furthermore,realizinghowmanyofourmemberswerestrugglingtorecoverfromthedisaster,were-directedourloss mitigation department into a flood assistance hotline tohelpdirectourmemberstorelieforganizationsaswellasadviseon payment deferment options and loan assistance. We alsooffered“PreparingForandCareForSelf inTimesofCrisis”seminarbyalicensedpsychologistwhichgaveparticipantsanopportunity to express theirown thoughts and feelingsaboutthe community crisis, and effective methods to assess andmanagetheirownstressreactions.Inanotherexampleofrapidresponse,ElevationsquicklymobilizedtroopstoraisefundsfortheLongmontHumaneSociety,whichwasfacingforeclosure.Our staff and community rallied to provide nearly $63,000within30daystomeetakeyloanpaymentontheLongmontFacility and enable them to continue to provide services.
If you love where you live, it matters where you bank. . 8
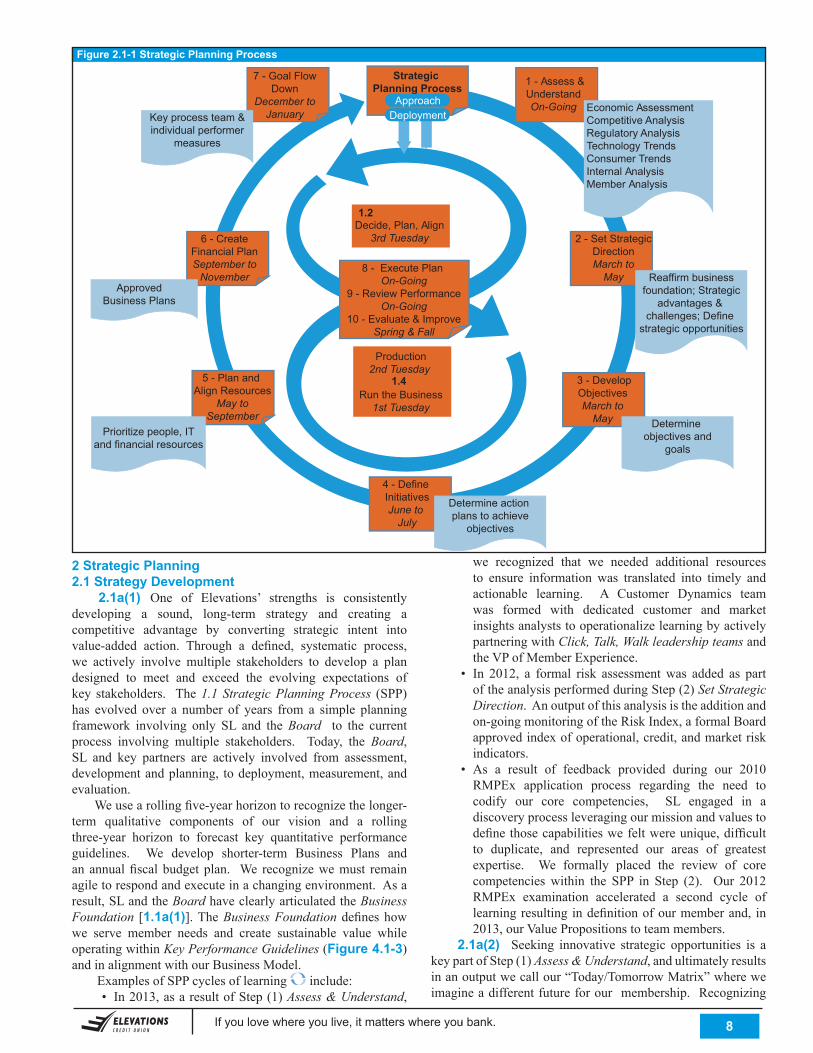
we recognized that we needed additional resourcesto ensure information was translated into timely andactionable learning. A Customer Dynamics teamwas formed with dedicated customer and marketinsightsanalyststooperationalizelearningbyactivelypartneringwithClick, Talk, Walk leadership teams and theVPofMemberExperience.
• In 2012, a formal risk assessmentwas added as partoftheanalysisperformedduringStep(2)Set Strategic Direction.Anoutputofthisanalysisistheadditionandon-goingmonitoringoftheRiskIndex,aformalBoardapprovedindexofoperational,credit,andmarketriskindicators.
• As a result of feedback provided during our 2010RMPEx application process regarding the need tocodify our core competencies, SL engaged in adiscoveryprocessleveragingourmissionandvaluestodefinethosecapabilitieswefeltwereunique,difficultto duplicate, and represented our areas of greatestexpertise. We formally placed the review of corecompetencies within the SPP in Step (2). Our 2012RMPEx examination accelerated a second cycle oflearningresultingindefinitionofourmemberand, in2013,ourValuePropositionstoteammembers.
2.1a(2) Seeking innovative strategic opportunities is akeypartofStep(1)Assess & Understand,andultimatelyresultsinanoutputwecallour“Today/TomorrowMatrix”whereweimagineadifferentfutureforourmembership.Recognizing
Figure 2.1-1 Strategic Planning Process
2 Strategic Planning2.1 Strategy Development 2.1a(1) One of Elevations’ strengths is consistentlydeveloping a sound, long-term strategy and creating acompetitive advantage by converting strategic intent intovalue-added action. Through a defined, systematic process,we actively involve multiple stakeholders to develop a plandesigned to meet and exceed the evolving expectations ofkey stakeholders. The1.1 Strategic Planning Process (SPP)has evolved over a number of years from a simple planningframework involving only SL and theBoard to the currentprocess involving multiple stakeholders. Today, the Board, SL and key partners are actively involved from assessment,developmentandplanning, todeployment,measurement,andevaluation. Weusearollingfive-yearhorizontorecognizethelonger-term qualitative components of our vision and a rollingthree-year horizon to forecast key quantitative performanceguidelines. We develop shorter-term Business Plans andan annualfiscal budget plan. We recognizewemust remainagiletorespondandexecuteinachangingenvironment.Asaresult,SLandtheBoardhaveclearlyarticulatedtheBusiness Foundation [1.1a(1)].TheBusiness Foundation defineshowwe serve member needs and create sustainable value whileoperatingwithinKey Performance Guidelines(Figure 4.1-3)andinalignmentwithourBusinessModel. ExamplesofSPPcyclesoflearning include:
• In2013,asaresultofStep(1)Assess & Understand,
7 - Goal FlowDown
December toJanuary
6 - CreateFinancial PlanSeptember to
November
5 - Plan and Align Resources
May toSeptember
4 - Define InitiativesJune to
July
3 - DevelopObjectivesMarch to
May
2 - Set Strategic DirectionMarch to
May
1 - Assess &UnderstandOn-Going
Decide, Plan, Align3rd Tuesday
Production2nd Tuesday
Run the Business1st Tuesday
Key process team &individual performer
measures
ApprovedBusiness Plans
Prioritize people, ITand financial resources
Determine action plans to achieve
objectives
Determine objectives and
goals
Reaffirm businessfoundation; Strategic
advantages & challenges; Define
strategic opportunities
Economic AssessmentCompetitive AnalysisRegulatory AnalysisTechnology TrendsConsumer TrendsInternal AnalysisMember Analysis
8 - Execute Plan On-Going
9 - Review PerformanceOn-Going
10 - Evaluate & ImproveSpring & Fall
1.1
1.2
1.4
1.1 Strategic Planning Process
ApproachDeployment
If you love where you live, it matters where you bank. . 9
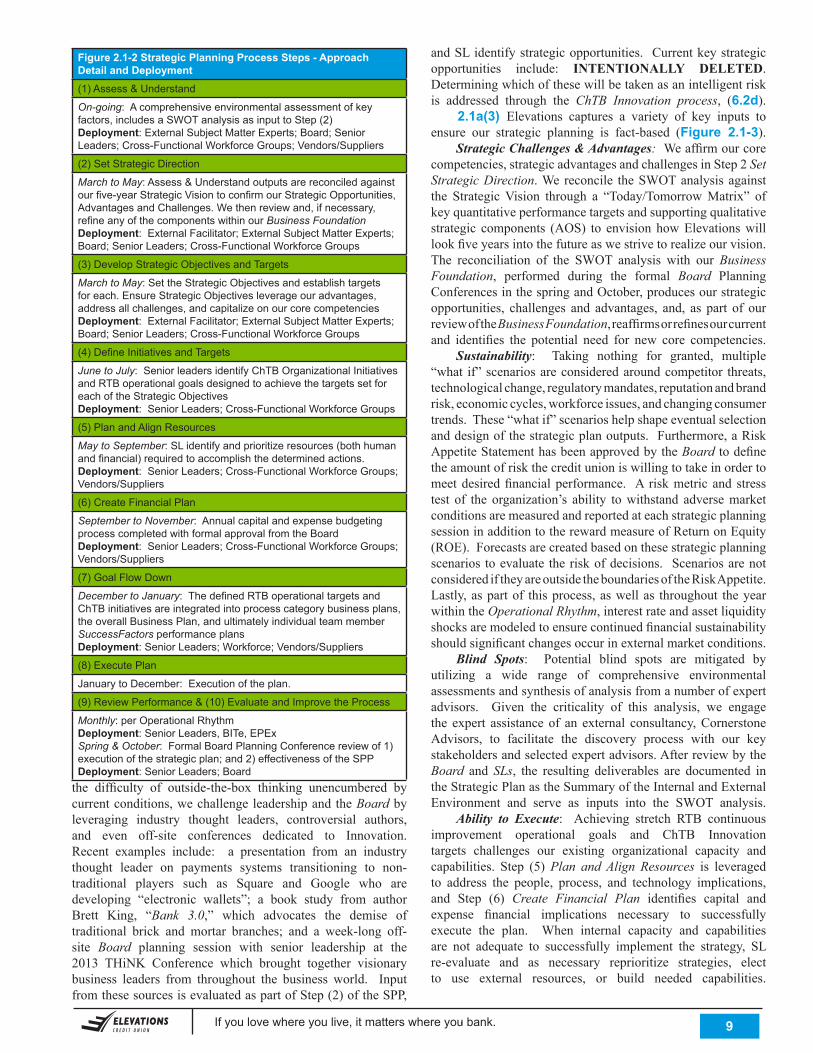
Figure 2.1-2 Strategic Planning Process Steps - Approach Detail and Deployment(1) Assess & Understand
On-going: A comprehensive environmental assessment of key factors, includes a SWOT analysis as input to Step (2)Deployment: External Subject Matter Experts; Board; Senior Leaders; Cross-Functional Workforce Groups; Vendors/Suppliers
(2) Set Strategic Direction
March to May: Assess & Understand outputs are reconciled against our five-year Strategic Vision to confirm our Strategic Opportunities, Advantages and Challenges. We then review and, if necessary, refine any of the components within our Business FoundationDeployment: External Facilitator; External Subject Matter Experts; Board; Senior Leaders; Cross-Functional Workforce Groups
(3) Develop Strategic Objectives and Targets
March to May: Set the Strategic Objectives and establish targets for each. Ensure Strategic Objectives leverage our advantages, address all challenges, and capitalize on our core competenciesDeployment: External Facilitator; External Subject Matter Experts; Board; Senior Leaders; Cross-Functional Workforce Groups
(4) Define Initiatives and Targets
June to July: Senior leaders identify ChTB Organizational Initiatives and RTB operational goals designed to achieve the targets set for each of the Strategic Objectives Deployment: Senior Leaders; Cross-Functional Workforce Groups
(5) Plan and Align Resources
May to September: SL identify and prioritize resources (both human and financial) required to accomplish the determined actions.Deployment: Senior Leaders; Cross-Functional Workforce Groups; Vendors/Suppliers
(6) Create Financial Plan
September to November: Annual capital and expense budgeting process completed with formal approval from the BoardDeployment: Senior Leaders; Cross-Functional Workforce Groups; Vendors/Suppliers
(7) Goal Flow Down
December to January: The defined RTB operational targets and ChTB initiatives are integrated into process category business plans, the overall Business Plan, and ultimately individual team member SuccessFactors performance plansDeployment: Senior Leaders; Workforce; Vendors/Suppliers
(8) Execute Plan
January to December: Execution of the plan.
(9) Review Performance & (10) Evaluate and Improve the Process
Monthly: per Operational RhythmDeployment: Senior Leaders, BITe, EPExSpring & October: Formal Board Planning Conference review of 1) execution of the strategic plan; and 2) effectiveness of the SPPDeployment: Senior Leaders; Boardthe difficulty of outside-the-box thinking unencumbered bycurrentconditions,wechallengeleadershipandtheBoardbyleveraging industry thought leaders, controversial authors,and even off-site conferences dedicated to Innovation.Recent examples include: a presentation from an industrythought leader on payments systems transitioning to non-traditional players such as Square and Google who aredeveloping “electronic wallets”; a book study from authorBrett King, “Bank 3.0,” which advocates the demise oftraditional brick and mortar branches; and a week-long off-site Board planning session with senior leadership at the2013 THiNK Conference which brought together visionarybusiness leaders from throughout the business world. InputfromthesesourcesisevaluatedaspartofStep(2)oftheSPP,
andSLidentifystrategicopportunities. Currentkeystrategicopportunities include: INTENTIONALLY DELETED.Determiningwhichofthesewillbetakenasanintelligentriskis addressed through the ChTB Innovation process, (6.2d). 2.1a(3) Elevations captures a variety of key inputs toensure our strategic planning is fact-based (Figure 2.1-3). Strategic Challenges & Advantages:Weaffirmourcorecompetencies,strategicadvantagesandchallengesinStep2Set Strategic Direction.Wereconcile theSWOTanalysisagainstthe StrategicVision through a “Today/TomorrowMatrix” ofkeyquantitativeperformancetargetsandsupportingqualitativestrategic components (AOS) to envisionhowElevationswilllookfiveyearsintothefutureaswestrivetorealizeourvision.The reconciliation of the SWOT analysis with ourBusiness Foundation, performed during the formal Board PlanningConferencesinthespringandOctober,producesourstrategicopportunities, challenges and advantages, and, as part of ourreviewoftheBusiness Foundation,reaffirmsorrefinesourcurrentand identifies the potential need for new core competencies. Sustainability: Taking nothing for granted, multiple“what if”scenariosareconsideredaroundcompetitor threats,technologicalchange,regulatorymandates,reputationandbrandrisk,economiccycles,workforceissues,andchangingconsumertrends.These“whatif”scenarioshelpshapeeventualselectionanddesignofthestrategicplanoutputs.Furthermore,aRiskAppetiteStatementhasbeenapprovedbytheBoardtodefinetheamountofriskthecreditunioniswillingtotakeinordertomeetdesiredfinancialperformance. A riskmetric and stresstest of the organization’s ability towithstand adversemarketconditionsaremeasuredandreportedateachstrategicplanningsessioninadditiontotherewardmeasureofReturnonEquity(ROE).Forecastsarecreatedbasedonthesestrategicplanningscenarios toevaluate theriskofdecisions. ScenariosarenotconsiderediftheyareoutsidetheboundariesoftheRiskAppetite.Lastly,aspartof thisprocess,aswellas throughout theyearwithintheOperational Rhythm,interestrateandassetliquidityshocksaremodeledtoensurecontinuedfinancialsustainabilityshouldsignificantchangesoccurinexternalmarketconditions. Blind Spots: Potential blind spots are mitigated byutilizing a wide range of comprehensive environmentalassessmentsandsynthesisofanalysisfromanumberofexpertadvisors. Given the criticality of this analysis, we engagethe expert assistanceof an external consultancy,CornerstoneAdvisors, to facilitate the discovery process with our keystakeholdersandselectedexpertadvisors.AfterreviewbytheBoard and SLs, the resulting deliverables are documented intheStrategicPlanastheSummaryoftheInternalandExternalEnvironment and serve as inputs into the SWOT analysis. Ability to Execute: Achieving stretch RTB continuousimprovement operational goals and ChTB Innovationtargets challenges our existing organizational capacity andcapabilities. Step (5)Plan and Align Resources is leveraged to address the people, process, and technology implications,and Step (6) Create Financial Plan identifies capital andexpense financial implications necessary to successfullyexecute the plan. When internal capacity and capabilitiesare not adequate to successfully implement the strategy, SLre-evaluate and as necessary reprioritize strategies, electto use external resources, or build needed capabilities.
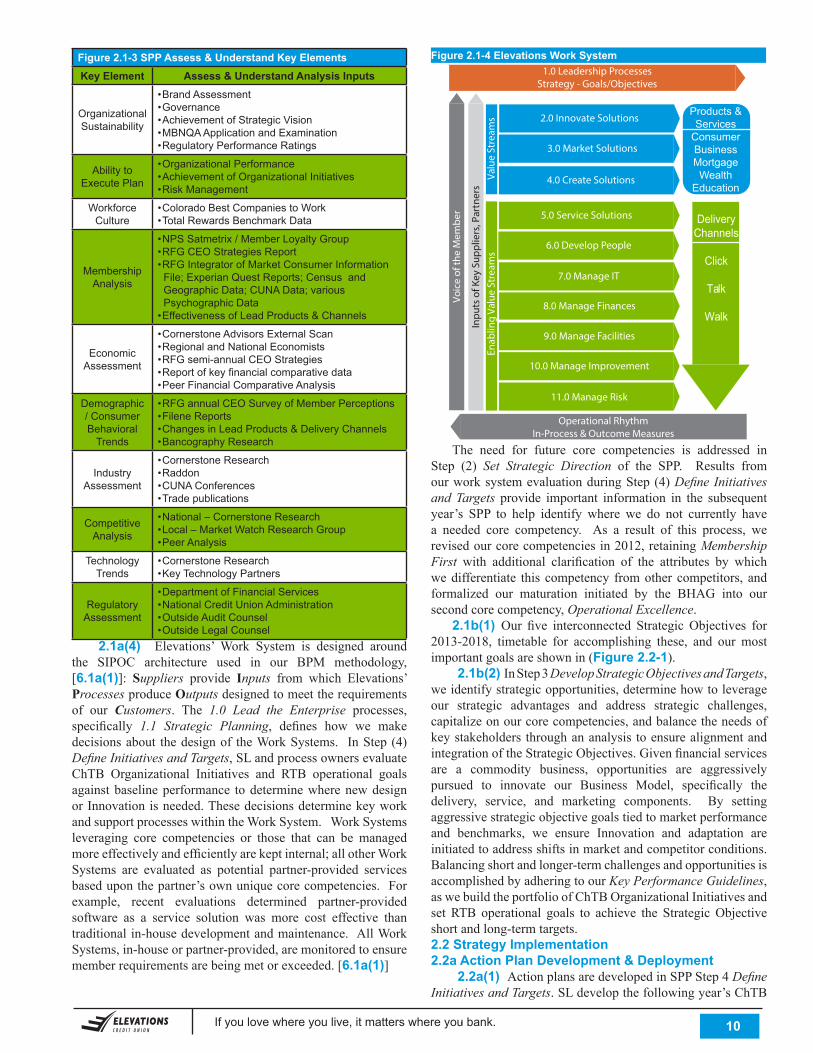
If you love where you live, it matters where you bank. . 10
Figure 2.1-3 SPP Assess & Understand Key ElementsKey Element Assess & Understand Analysis Inputs
Organizational Sustainability
• Brand Assessment• Governance• Achievement of Strategic Vision• MBNQA Application and Examination• Regulatory Performance Ratings
Ability to Execute Plan
• Organizational Performance• Achievement of Organizational Initiatives• Risk Management
Workforce Culture
• Colorado Best Companies to Work• Total Rewards Benchmark Data
Membership Analysis
• NPS Satmetrix / Member Loyalty Group• RFG CEO Strategies Report• RFG Integrator of Market Consumer Information File; Experian Quest Reports; Census and Geographic Data; CUNA Data; various Psychographic Data• Effectiveness of Lead Products & Channels
Economic Assessment
• Cornerstone Advisors External Scan• Regional and National Economists• RFG semi-annual CEO Strategies• Report of key financial comparative data• Peer Financial Comparative Analysis
Demographic / Consumer Behavioral
Trends
• RFG annual CEO Survey of Member Perceptions• Filene Reports• Changes in Lead Products & Delivery Channels• Bancography Research
Industry Assessment
• Cornerstone Research• Raddon • CUNA Conferences• Trade publications
Competitive Analysis
• National – Cornerstone Research• Local – Market Watch Research Group• Peer Analysis
Technology Trends
• Cornerstone Research• Key Technology Partners
Regulatory Assessment
• Department of Financial Services• National Credit Union Administration• Outside Audit Counsel• Outside Legal Counsel
2.1a(4) Elevations’ Work System is designed aroundthe SIPOC architecture used in our BPM methodology,[6.1a(1)]: Suppliers provide Inputs from which Elevations’ProcessesproduceOutputsdesignedtomeettherequirementsof our Customers. The 1.0 Lead the Enterprise processes,specifically 1.1 Strategic Planning, defines how we makedecisionsabout thedesignof theWorkSystems. InStep(4)Define Initiatives and Targets,SLandprocessownersevaluateChTB Organizational Initiatives and RTB operational goalsagainstbaselineperformance todeterminewherenewdesignorInnovationisneeded.ThesedecisionsdeterminekeyworkandsupportprocesseswithintheWorkSystem.WorkSystemsleveraging core competencies or those that can be managedmoreeffectivelyandefficientlyarekeptinternal;allotherWorkSystems are evaluated as potential partner-provided servicesbaseduponthepartner’sownuniquecorecompetencies.Forexample, recent evaluations determined partner-providedsoftware as a service solution was more cost effective thantraditionalin-housedevelopmentandmaintenance.AllWorkSystems,in-houseorpartner-provided,aremonitoredtoensurememberrequirementsarebeingmetorexceeded.[6.1a(1)] Figure 2.1-4 Elevations Work System
The need for future core competencies is addressed inStep (2) Set Strategic Direction of the SPP. Results fromourworksystemevaluationduringStep(4)Define Initiatives and Targets provide important information in the subsequentyear’s SPP to help identify where we do not currently havea needed core competency. As a result of this process, werevisedourcorecompetenciesin2012,retainingMembership First with additional clarification of the attributes by whichwedifferentiate this competency fromothercompetitors, andformalized our maturation initiated by the BHAG into oursecondcorecompetency,Operational Excellence. 2.1b(1) Our five interconnected Strategic Objectives for2013-2018, timetable for accomplishing these, and our mostimportantgoalsareshownin(Figure 2.2-1). 2.1b(2) InStep3Develop Strategic Objectives and Targets, weidentifystrategicopportunities,determinehowtoleverageour strategic advantages and address strategic challenges,capitalizeonourcorecompetencies,andbalancetheneedsofkeystakeholders throughananalysis toensurealignmentandintegrationoftheStrategicObjectives.Givenfinancialservicesare a commodity business, opportunities are aggressivelypursued to innovate our Business Model, specifically thedelivery, service, and marketing components. By settingaggressivestrategicobjectivegoalstiedtomarketperformanceand benchmarks, we ensure Innovation and adaptation areinitiatedtoaddressshiftsinmarketandcompetitorconditions.Balancingshortandlonger-termchallengesandopportunitiesisaccomplishedbyadheringtoourKey Performance Guidelines, aswebuildtheportfolioofChTBOrganizationalInitiativesandset RTB operational goals to achieve the StrategicObjectiveshortandlong-termtargets.2.2 Strategy Implementation2.2a Action Plan Development & Deployment 2.2a(1) ActionplansaredevelopedinSPPStep4Define Initiatives and Targets.SLdevelopthefollowingyear’sChTB
Figure 2.1-4 Elevations Work System1.0 Leadership Processes
Strategy - Goals/Objectives
Voic
e of
the
Mem
ber
Inpu
ts o
f Key
Sup
plie
rs, P
artn
ers
2.0 Innovate Solutions
3.0 Market Solutions
4.0 Create SolutionsValu
e St
ream
sEn
ablin
g Va
lue
Stre
ams
5.0 Service Solutions
6.0 Develop People
7.0 Manage IT
8.0 Manage Finances
9.0 Manage Facilities
10.0 Manage Improvement
11.0 Manage Risk
Products &Services
ConsumerBusinessMortgage
WealthEducation
DeliveryChannels
Click
Talk
Walk
Operational RhythmIn-Process & Outcome Measures
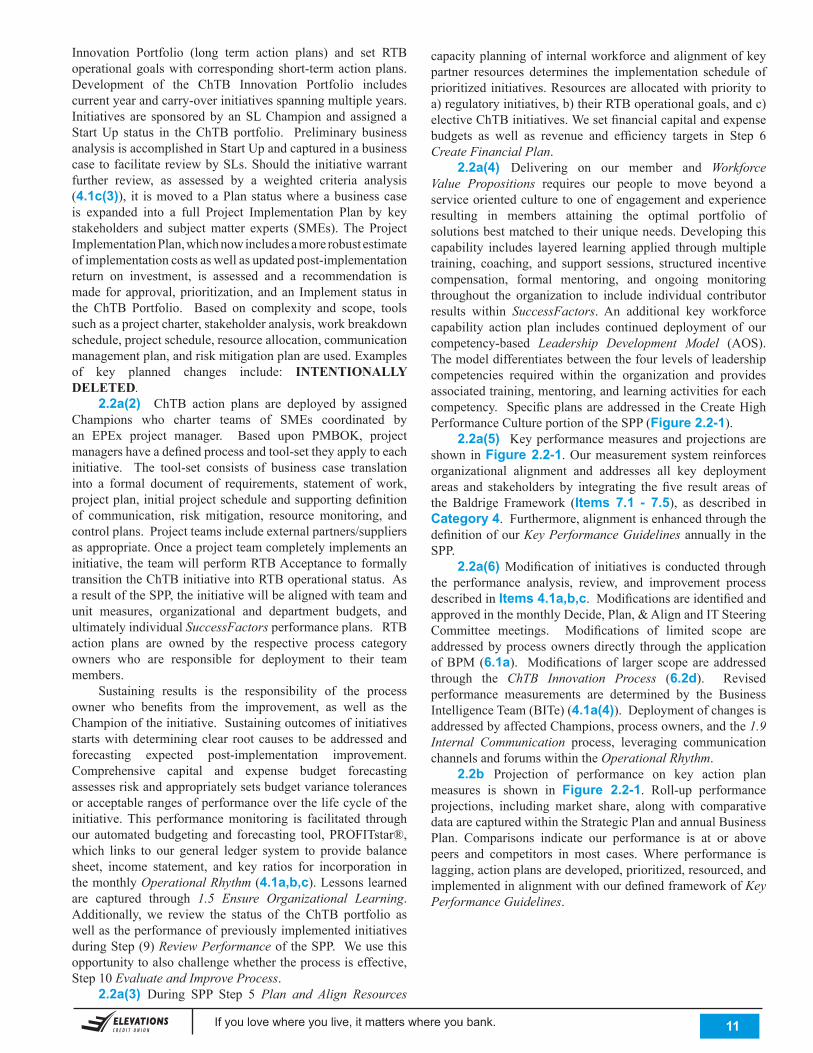
If you love where you live, it matters where you bank. . 11
Innovation Portfolio (long term action plans) and set RTBoperationalgoalswithcorrespondingshort-termactionplans.Development of the ChTB Innovation Portfolio includescurrentyearandcarry-overinitiativesspanningmultipleyears.Initiatives are sponsoredby anSLChampion and assigned a StartUp status in theChTBportfolio. Preliminary businessanalysisisaccomplishedinStartUpandcapturedinabusinesscasetofacilitatereviewbySLs.Shouldtheinitiativewarrantfurther review, as assessed by a weighted criteria analysis(4.1c(3)), it ismoved toaPlanstatuswhereabusinesscaseis expanded into a full Project Implementation Plan by keystakeholders and subjectmatter experts (SMEs).The ProjectImplementationPlan,whichnowincludesamorerobustestimateofimplementationcostsaswellasupdatedpost-implementationreturn on investment, is assessed and a recommendation ismade forapproval,prioritization,andan Implement status inthe ChTB Portfolio. Based on complexity and scope, toolssuchasaprojectcharter,stakeholderanalysis,workbreakdownschedule,projectschedule,resourceallocation,communicationmanagementplan,andriskmitigationplanareused.Examplesof key planned changes include: INTENTIONALLY DELETED. 2.2a(2) ChTB action plans are deployed by assignedChampions who charter teams of SMEs coordinated byan EPEx project manager. Based upon PMBOK, projectmanagershaveadefinedprocessandtool-settheyapplytoeachinitiative. The tool-set consists of business case translationinto a formal document of requirements, statement of work,projectplan,initialprojectscheduleandsupportingdefinitionof communication, risk mitigation, resource monitoring, andcontrolplans.Projectteamsincludeexternalpartners/suppliersasappropriate.Onceaprojectteamcompletelyimplementsaninitiative, the teamwillperformRTBAcceptancetoformallytransitiontheChTBinitiativeintoRTBoperationalstatus.AsaresultoftheSPP,theinitiativewillbealignedwithteamandunit measures, organizational and department budgets, andultimatelyindividualSuccessFactorsperformanceplans.RTBaction plans are owned by the respective process categoryowners who are responsible for deployment to their teammembers. Sustaining results is the responsibility of the processowner who benefits from the improvement, as well as theChampionoftheinitiative.Sustainingoutcomesofinitiativesstartswithdeterminingclear rootcauses tobeaddressedandforecasting expected post-implementation improvement.Comprehensive capital and expense budget forecastingassessesriskandappropriatelysetsbudgetvariancetolerancesoracceptablerangesofperformanceoverthelifecycleoftheinitiative.This performancemonitoring is facilitated throughourautomatedbudgetingand forecasting tool,PROFITstar®,which links to our general ledger system to provide balancesheet, income statement, and key ratios for incorporation inthemonthlyOperational Rhythm(4.1a,b,c).Lessonslearnedare captured through 1.5 Ensure Organizational Learning.Additionally, we review the status of the ChTB portfolio aswellastheperformanceofpreviouslyimplementedinitiativesduringStep(9)Review PerformanceoftheSPP.Weusethisopportunitytoalsochallengewhethertheprocessiseffective,Step10Evaluate and Improve Process. 2.2a(3) During SPP Step 5 Plan and Align Resources
capacityplanningofinternalworkforceandalignmentofkeypartner resources determines the implementation schedule ofprioritizedinitiatives.Resourcesareallocatedwithprioritytoa)regulatoryinitiatives,b)theirRTBoperationalgoals,andc)electiveChTBinitiatives.Wesetfinancialcapitalandexpensebudgets as well as revenue and efficiency targets in Step 6Create Financial Plan. 2.2a(4) Delivering on our member and Workforce Value Propositions requires our people to move beyond aserviceorientedculturetooneofengagementandexperienceresulting in members attaining the optimal portfolio ofsolutionsbestmatchedtotheiruniqueneeds.Developingthiscapability includes layered learning applied throughmultipletraining, coaching, and support sessions, structured incentivecompensation, formal mentoring, and ongoing monitoringthroughout the organization to include individual contributorresults within SuccessFactors. An additional key workforcecapability action plan includes continued deployment of ourcompetency-based Leadership Development Model (AOS).Themodeldifferentiatesbetweenthefourlevelsofleadershipcompetencies required within the organization and providesassociatedtraining,mentoring,andlearningactivitiesforeachcompetency. Specificplansareaddressedin theCreateHighPerformanceCultureportionoftheSPP(Figure 2.2-1). 2.2a(5) Keyperformancemeasuresandprojectionsareshown inFigure 2.2-1.Ourmeasurement systemreinforcesorganizational alignment and addresses all key deploymentareas and stakeholders by integrating the five result areas ofthe Baldrige Framework (Items 7.1 - 7.5), as described inCategory 4.Furthermore,alignmentisenhancedthroughthedefinitionofourKey Performance GuidelinesannuallyintheSPP. 2.2a(6) Modificationof initiatives isconducted throughthe performance analysis, review, and improvement processdescribedinItems 4.1a,b,c.ModificationsareidentifiedandapprovedinthemonthlyDecide,Plan,&AlignandITSteeringCommittee meetings. Modifications of limited scope areaddressedbyprocessownersdirectly through theapplicationofBPM(6.1a). Modificationsof larger scopeareaddressedthrough the ChTB Innovation Process (6.2d). Revisedperformance measurements are determined by the BusinessIntelligenceTeam(BITe)(4.1a(4)).DeploymentofchangesisaddressedbyaffectedChampions,processowners,andthe1.9 Internal Communication process, leveraging communicationchannelsandforumswithintheOperational Rhythm. 2.2b Projection of performance on key action planmeasures is shown in Figure 2.2-1. Roll-up performanceprojections, including market share, along with comparativedataarecapturedwithintheStrategicPlanandannualBusinessPlan. Comparisons indicate our performance is at or abovepeers and competitors in most cases.Where performance islagging,actionplansaredeveloped,prioritized,resourced,andimplementedinalignmentwithourdefinedframeworkofKey Performance Guidelines.
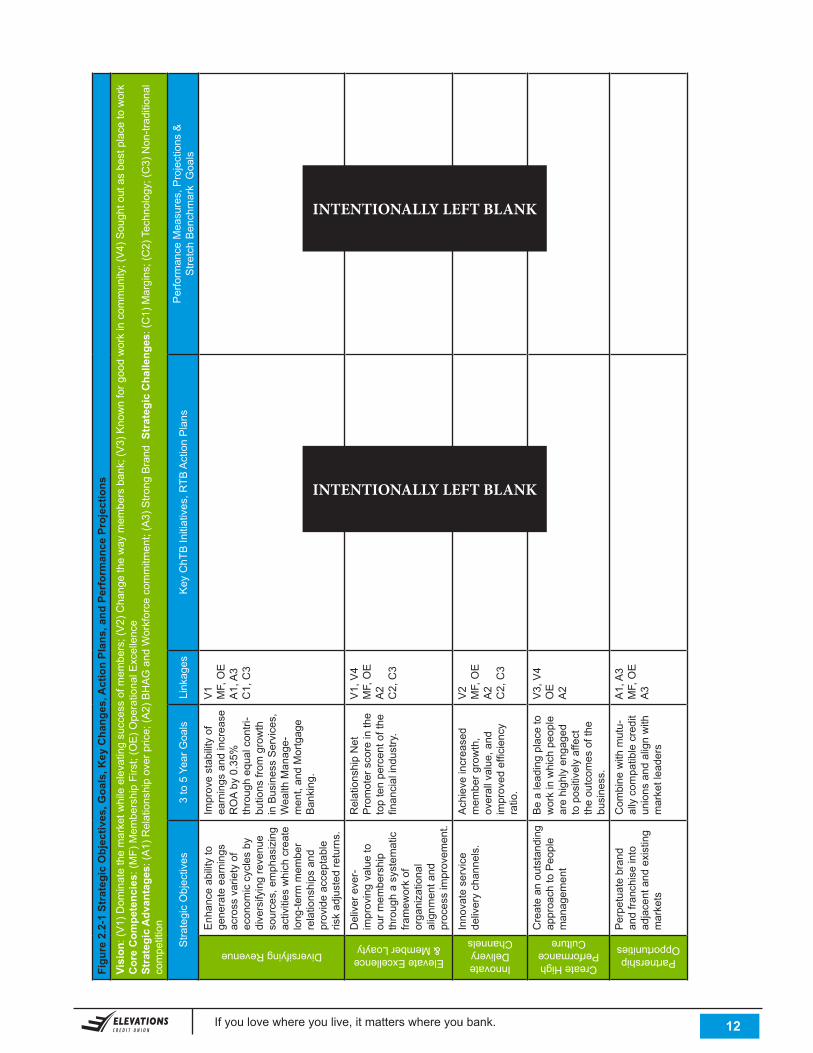
If you love where you live, it matters where you bank. . 12
Figu
re 2
.2-1
Str
ateg
ic O
bjec
tives
, Goa
ls, K
ey C
hang
es, A
ctio
n Pl
ans,
and
Per
form
ance
Pro
ject
ions
Visi
on: (
V1)
Dom
inat
e th
e m
arke
t whi
le e
leva
ting
succ
ess
of m
embe
rs; (
V2)
Cha
nge
the
way
mem
bers
ban
k; (V
3) K
now
n fo
r goo
d w
ork
in c
omm
unity
; (V
4) S
ough
t out
as
best
pla
ce to
wor
kC
ore
Com
pete
ncie
s: (M
F) M
embe
rshi
p Fi
rst;
(OE
) Ope
ratio
nal E
xcel
lenc
eSt
rate
gic
Adv
anta
ges:
(A1)
Rel
atio
nshi
p ov
er p
rice;
(A2)
BH
AG
and
Wor
kfor
ce c
omm
itmen
t; (A
3) S
trong
Bra
nd S
trat
egic
Cha
lleng
es: (
C1)
Mar
gins
; (C
2) T
echn
olog
y; (C
3) N
on-tr
aditi
onal
co
mpe
titio
n
Stra
tegi
c O
bjec
tives
3 to
5 Y
ear G
oals
Link
ages
Key
ChT
B In
itiat
ives
, RTB
Act
ion
Pla
nsP
erfo
rman
ce M
easu
res,
Pro
ject
ions
&S
tretc
h B
ench
mar
k G
oals
Diversifying Revenue
Enh
ance
abi
lity
to
gene
rate
ear
ning
s ac
ross
var
iety
of
econ
omic
cyc
les
by
dive
rsify
ing
reve
nue
sour
ces,
em
phas
izin
g ac
tiviti
es w
hich
cre
ate
long
-term
mem
ber
rela
tions
hips
and
pr
ovid
e ac
cept
able
ris
k ad
just
ed re
turn
s.
Impr
ove
stab
ility
of
earn
ings
and
incr
ease
R
OA
by 0
.35%
th
roug
h eq
ual c
ontri
-bu
tions
from
gro
wth
in
Bus
ines
s S
ervi
ces,
W
ealth
Man
age-
men
t, an
d M
ortg
age
Ban
king
.
V1
MF,
OE
A1,
A3
C1,
C3
Elevate Excellence & Member Loayty
Del
iver
eve
r-im
prov
ing
valu
e to
ou
r mem
bers
hip
thro
ugh
a sy
stem
atic
fra
mew
ork
of
orga
niza
tiona
l al
ignm
ent a
nd
proc
ess
impr
ovem
ent.
Rel
atio
nshi
p N
et
Pro
mot
er s
core
in th
e to
p te
n pe
rcen
t of t
he
finan
cial
indu
stry
.
V1,
V4
MF,
OE
A2
C2,
C3
InnovateDelivery
Channels
Inno
vate
ser
vice
de
liver
y ch
anne
ls.
Ach
ieve
incr
ease
d m
embe
r gro
wth
, ov
eral
l val
ue, a
nd
impr
oved
effi
cien
cy
ratio
.
V2
MF,
OE
A2
C2,
C3
Create HighPerformance
Culture
Cre
ate
an o
utst
andi
ng
appr
oach
to P
eopl
e m
anag
emen
t
Be
a le
adin
g pl
ace
to
wor
k in
whi
ch p
eopl
e ar
e hi
ghly
eng
aged
to
pos
itive
ly a
ffect
th
e ou
tcom
es o
f the
bu
sine
ss.
V3,
V4
OE
A2
PartnershipOpportunities
Per
petu
ate
bran
d an
d fra
nchi
se in
to
adja
cent
and
exi
stin
g m
arke
ts
Com
bine
with
mut
u-al
ly c
ompa
tible
cre
dit
unio
ns a
nd a
lign
with
m
arke
t lea
ders
A1,
A3
MF,
OE
A3
INTENTIONALLY LEFT BLANK
INTENTIONALLY LEFT BLANK
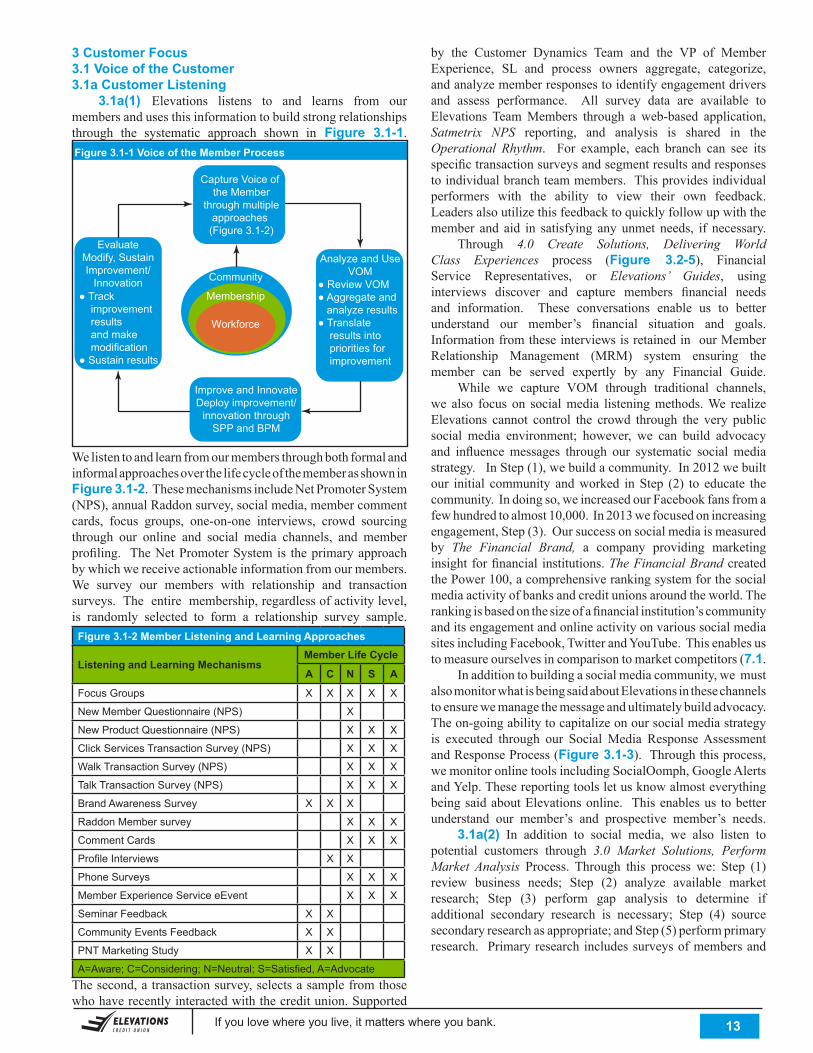
If you love where you live, it matters where you bank. . 13
3 Customer Focus3.1 Voice of the Customer3.1a Customer Listening 3.1a(1) Elevations listens to and learns from ourmembersandusesthisinformationtobuildstrongrelationshipsthrough the systematic approach shown in Figure 3.1-1.
WelistentoandlearnfromourmembersthroughbothformalandinformalapproachesoverthelifecycleofthememberasshowninFigure 3.1-2.ThesemechanismsincludeNetPromoterSystem(NPS),annualRaddonsurvey,socialmedia,membercommentcards, focus groups, one-on-one interviews, crowd sourcingthrough our online and social media channels, and memberprofiling. TheNetPromoterSystemis theprimaryapproachbywhichwereceiveactionableinformationfromourmembers.We survey our members with relationship and transactionsurveys.Theentiremembership,regardlessofactivitylevel,is randomly selected to form a relationship survey sample.
Figure 3.1-2 Member Listening and Learning Approaches
Listening and Learning MechanismsMember Life Cycle
A C N S A
Focus Groups X X X X X
New Member Questionnaire (NPS) X
New Product Questionnaire (NPS) X X X
Click Services Transaction Survey (NPS) X X X
Walk Transaction Survey (NPS) X X X
Talk Transaction Survey (NPS) X X X
Brand Awareness Survey X X X
Raddon Member survey X X X
Comment Cards X X X
Profile Interviews X X
Phone Surveys X X X
Member Experience Service eEvent X X X
Seminar Feedback X X
Community Events Feedback X X
PNT Marketing Study X X
A=Aware; C=Considering; N=Neutral; S=Satisfied, A=AdvocateThesecond,atransactionsurvey,selectsasamplefromthosewhohaverecentlyinteractedwiththecreditunion.Supported
Figure 3.1-1 Voice of the Member Process
Performto
Plan
Improve and InnovateDeploy improvement/
innovation throughSPP and BPM
EvaluateModify, SustainImprovement/
Innovation
Analyze and UseVOM
Capture Voice of the Member
through multipleapproaches (Figure 3.1-2)
Community
Membership
Workforce
by the Customer Dynamics Team and the VP of MemberExperience, SL and process owners aggregate, categorize,andanalyzememberresponsestoidentifyengagementdriversand assess performance. All survey data are available toElevations TeamMembers through a web-based application,Satmetrix NPS reporting, and analysis is shared in theOperational Rhythm. For example, each branch can see itsspecifictransactionsurveysandsegmentresultsandresponsestoindividualbranchteammembers.Thisprovidesindividualperformers with the ability to view their own feedback.Leadersalsoutilizethisfeedbacktoquicklyfollowupwiththemember and aid in satisfying any unmet needs, if necessary. Through 4.0 Create Solutions, Delivering World Class Experiences process (Figure 3.2-5), FinancialService Representatives, or Elevations’ Guides, usinginterviews discover and capture members financial needsand information. These conversations enable us to betterunderstand our member’s financial situation and goals.InformationfromtheseinterviewsisretainedinourMemberRelationship Management (MRM) system ensuring themember can be served expertly by any Financial Guide. While we capture VOM through traditional channels,we also focus on socialmedia listeningmethods.We realizeElevations cannot control the crowd through the very publicsocial media environment; however, we can build advocacyand influencemessages through our systematic socialmediastrategy.InStep(1),webuildacommunity.In2012webuiltour initial community andworked inStep (2) to educate thecommunity.Indoingso,weincreasedourFacebookfansfromafewhundredtoalmost10,000.In2013wefocusedonincreasingengagement,Step(3).Oursuccessonsocialmediaismeasuredby The Financial Brand, a company providing marketinginsightforfinancial institutions.The Financial BrandcreatedthePower100,acomprehensiverankingsystemforthesocialmediaactivityofbanksandcreditunionsaroundtheworld.Therankingisbasedonthesizeofafinancialinstitution’scommunityanditsengagementandonlineactivityonvarioussocialmediasitesincludingFacebook,TwitterandYouTube.Thisenablesustomeasureourselvesincomparisontomarketcompetitors(7.1. Inadditiontobuildingasocialmediacommunity,wemustalsomonitorwhatisbeingsaidaboutElevationsinthesechannelstoensurewemanagethemessageandultimatelybuildadvocacy.Theon-goingabilitytocapitalizeonoursocialmediastrategyis executed through our SocialMedia ResponseAssessmentandResponseProcess(Figure 3.1-3).Throughthisprocess,wemonitoronlinetoolsincludingSocialOomph,GoogleAlertsandYelp.ThesereportingtoolsletusknowalmosteverythingbeingsaidaboutElevationsonline. Thisenablesus tobetterunderstand our member’s and prospective member’s needs. 3.1a(2) In addition to social media, we also listen topotential customers through 3.0 Market Solutions, Perform Market Analysis Process. Through this process we: Step (1)review business needs; Step (2) analyze available marketresearch; Step (3) perform gap analysis to determine ifadditional secondary research is necessary; Step (4) sourcesecondaryresearchasappropriate;andStep(5)performprimaryresearch. Primaryresearchincludessurveysofmembersand
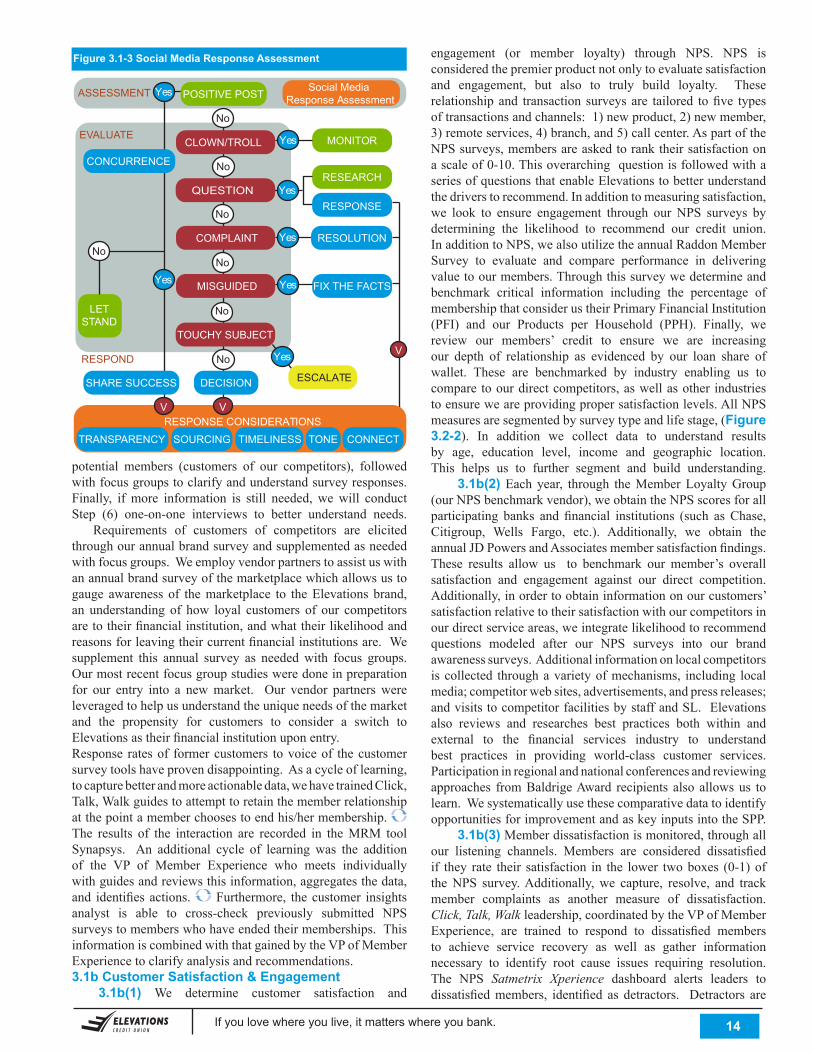
If you love where you live, it matters where you bank. . 14
Figure 3.1-3 Social Media Response Assessment
potential members (customers of our competitors), followedwithfocusgroupstoclarifyandunderstandsurveyresponses.Finally, ifmore information is still needed, wewill conductStep (6) one-on-one interviews to better understand needs. Requirements of customers of competitors are elicitedthroughourannualbrandsurveyandsupplementedasneededwithfocusgroups.Weemployvendorpartnerstoassistuswithanannualbrandsurveyofthemarketplacewhichallowsustogauge awareness of themarketplace to theElevations brand,an understanding of how loyal customers of our competitorsaretotheirfinancialinstitution,andwhattheirlikelihoodandreasonsforleavingtheircurrentfinancialinstitutionsare.Wesupplement this annual survey as neededwith focus groups.Ourmostrecentfocusgroupstudiesweredoneinpreparationfor our entry into a newmarket. Our vendor partnerswereleveragedtohelpusunderstandtheuniqueneedsofthemarketand the propensity for customers to consider a switch toElevationsastheirfinancialinstitutionuponentry.Response ratesof formercustomers tovoiceof thecustomersurveytoolshaveprovendisappointing.Asacycleoflearning,tocapturebetterandmoreactionabledata,wehavetrainedClick,Talk,Walkguidestoattempttoretainthememberrelationshipatthepointamemberchoosestoendhis/hermembership. The results of the interaction are recorded in theMRM toolSynapsys. An additional cycle of learning was the additionof the VP of Member Experience who meets individuallywithguidesandreviewsthisinformation,aggregatesthedata,and identifiesactions. Furthermore, thecustomer insightsanalyst is able to cross-check previously submitted NPSsurveystomemberswhohaveendedtheirmemberships.ThisinformationiscombinedwiththatgainedbytheVPofMemberExperiencetoclarifyanalysisandrecommendations.3.1b Customer Satisfaction & Engagement 3.1b(1) We determine customer satisfaction and
engagement (or member loyalty) through NPS. NPS isconsideredthepremierproductnotonlytoevaluatesatisfactionand engagement, but also to truly build loyalty. Theserelationshipand transaction surveysare tailored tofive typesoftransactionsandchannels:1)newproduct,2)newmember,3)remoteservices,4)branch,and5)callcenter.AspartoftheNPSsurveys,membersareaskedtoranktheirsatisfactiononascaleof0-10.ThisoverarchingquestionisfollowedwithaseriesofquestionsthatenableElevationstobetterunderstandthedriverstorecommend.Inadditiontomeasuringsatisfaction,we look to ensure engagement through our NPS surveys bydetermining the likelihood to recommend our credit union.InadditiontoNPS,wealsoutilizetheannualRaddonMemberSurvey to evaluate and compare performance in deliveringvaluetoourmembers.Throughthissurveywedetermineandbenchmark critical information including the percentage ofmembershipthatconsiderustheirPrimaryFinancialInstitution(PFI) and our Products per Household (PPH). Finally, wereview our members’ credit to ensure we are increasingour depth of relationship as evidenced by our loan share ofwallet. These are benchmarked by industry enabling us tocomparetoourdirectcompetitors,aswellasother industriestoensureweareprovidingpropersatisfactionlevels.AllNPSmeasuresaresegmentedbysurveytypeandlifestage,(Figure 3.2-2). In addition we collect data to understand resultsby age, education level, income and geographic location.This helps us to further segment and build understanding. 3.1b(2) Each year, through theMemberLoyaltyGroup(ourNPSbenchmarkvendor),weobtaintheNPSscoresforallparticipating banks and financial institutions (such asChase,Citigroup, Wells Fargo, etc.). Additionally, we obtain theannualJDPowersandAssociatesmembersatisfactionfindings.These results allow us to benchmark our member’s overallsatisfaction and engagement against our direct competition.Additionally,inordertoobtaininformationonourcustomers’satisfactionrelativetotheirsatisfactionwithourcompetitorsinourdirectserviceareas,weintegratelikelihoodtorecommendquestions modeled after our NPS surveys into our brandawarenesssurveys.Additionalinformationonlocalcompetitorsiscollected throughavarietyofmechanisms, including localmedia;competitorwebsites,advertisements,andpressreleases;andvisitstocompetitorfacilitiesbystaffandSL.Elevationsalso reviews and researches best practices both within andexternal to the financial services industry to understandbest practices in providing world-class customer services.Participationinregionalandnationalconferencesandreviewingapproaches fromBaldrigeAward recipients also allowsus tolearn.WesystematicallyusethesecomparativedatatoidentifyopportunitiesforimprovementandaskeyinputsintotheSPP. 3.1b(3)Memberdissatisfactionismonitored,throughallour listening channels. Members are considered dissatisfiedif they rate their satisfaction in the lower twoboxes (0-1)oftheNPS survey.Additionally,we capture, resolve, and trackmember complaints as another measure of dissatisfaction.Click, Talk, Walkleadership,coordinatedbytheVPofMemberExperience, are trained to respond to dissatisfied membersto achieve service recovery as well as gather informationnecessary to identify root cause issues requiring resolution.The NPS Satmetrix Xperience dashboard alerts leaders todissatisfiedmembers, identified as detractors. Detractors are
Performto
Plan
EVALUATE
ASSESSMENT Yes Social Media Response Assessment
RESPOND
LETSTAND
No
No
CLOWN/TROLL
No
No
No
MISGUIDED
No
DECISION
CONCURRENCE
Yes
SHARE SUCCESS
MONITOR
RESEARCH
FIX THE FACTSYes
YesCOMPLAINT RESOLUTION
Yes
RESPONSE
POSITIVE POST
YesQUESTION
ESCALATE
TOUCHY SUBJECT
YesNo
TRANSPARENCY SOURCING TIMELINESS TONE CONNECTRESPONSE CONSIDERATIONS
V V
V
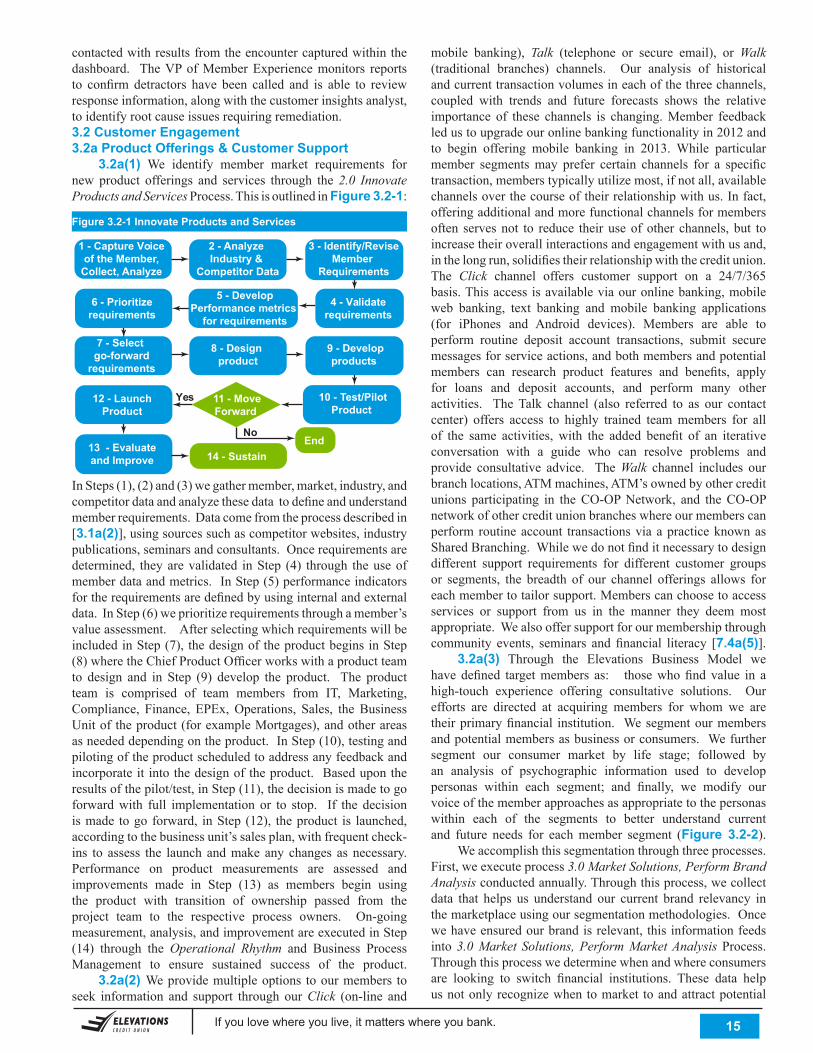
If you love where you live, it matters where you bank. . 15
contactedwithresultsfromtheencountercapturedwithinthedashboard. TheVPofMemberExperiencemonitors reportsto confirm detractors have been called and is able to reviewresponseinformation,alongwiththecustomerinsightsanalyst,toidentifyrootcauseissuesrequiringremediation.3.2 Customer Engagement3.2a Product Offerings & Customer Support 3.2a(1) We identify member market requirements fornew product offerings and services through the2.0 Innovate Products and ServicesProcess.Thisisoutlinedin Figure 3.2-1:
Figure 3.2-1 Innovate Products and Services
1 - Capture Voiceof the Member,
Collect, Analyze
2 - Analyze Industry &
Competitor Data
7 - Select go-forward
requirements
8 - Design product
13 - Evaluateand Improve
10 - Test/PilotProduct
14 - SustainEnd
4 - Validaterequirements
5 - DevelopPerformance metrics
for requirements
11 - MoveForward
No
Yes12 - LaunchProduct
9 - Developproducts
6 - Prioritizerequirements
3 - Identify/ReviseMember
Requirements
InSteps(1),(2)and(3)wegathermember,market,industry,andcompetitordataandanalyzethesedatatodefineandunderstandmemberrequirements.Datacomefromtheprocessdescribedin[3.1a(2)],usingsourcessuchascompetitorwebsites,industrypublications,seminarsandconsultants.Oncerequirementsaredetermined, theyarevalidated inStep (4) through theuseofmemberdataandmetrics.InStep(5)performanceindicatorsfortherequirementsaredefinedbyusinginternalandexternaldata.InStep(6)weprioritizerequirementsthroughamember’svalueassessment.AfterselectingwhichrequirementswillbeincludedinStep(7), thedesignoftheproductbeginsinStep(8)wheretheChiefProductOfficerworkswithaproductteamto design and in Step (9) develop the product. The productteam is comprised of team members from IT, Marketing,Compliance, Finance, EPEx,Operations, Sales, theBusinessUnitoftheproduct(forexampleMortgages),andotherareasasneededdependingontheproduct.InStep(10),testingandpilotingoftheproductscheduledtoaddressanyfeedbackandincorporateit intothedesignoftheproduct. Basedupontheresultsofthepilot/test,inStep(11),thedecisionismadetogoforwardwith full implementation or to stop. If the decisionismade togo forward, inStep (12), theproduct is launched,accordingtothebusinessunit’ssalesplan,withfrequentcheck-ins to assess the launch andmake any changes as necessary.Performance on product measurements are assessed andimprovements made in Step (13) as members begin usingthe product with transition of ownership passed from theproject team to the respective process owners. On-goingmeasurement,analysis,andimprovementareexecutedinStep(14) through the Operational Rhythm and Business ProcessManagement to ensure sustained success of the product. 3.2a(2) Weprovidemultipleoptions toourmembers toseek information and support through ourClick (on-line and
mobile banking), Talk (telephone or secure email), or Walk (traditional branches) channels. Our analysis of historicalandcurrenttransactionvolumesineachofthethreechannels,coupled with trends and future forecasts shows the relativeimportance of these channels is changing.Member feedbackledustoupgradeouronlinebankingfunctionalityin2012andto begin offering mobile banking in 2013. While particularmember segmentsmay prefer certain channels for a specifictransaction,memberstypicallyutilizemost,ifnotall,availablechannelsoverthecourseoftheirrelationshipwithus.Infact,offeringadditionalandmorefunctionalchannelsformembersoften servesnot to reduce their useofother channels, but toincreasetheiroverallinteractionsandengagementwithusand,inthelongrun,solidifiestheirrelationshipwiththecreditunion.The Click channel offers customer support on a 24/7/365basis.Thisaccessisavailableviaouronlinebanking,mobileweb banking, text banking and mobile banking applications(for iPhones and Android devices). Members are able toperform routine deposit account transactions, submit securemessagesforserviceactions,andbothmembersandpotentialmembers can research product features and benefits, applyfor loans and deposit accounts, and perform many otheractivities. TheTalk channel (also referred to as our contactcenter) offers access to highly trained teammembers for allof the same activities, with the added benefit of an iterativeconversation with a guide who can resolve problems andprovide consultative advice. TheWalk channel includes ourbranchlocations,ATMmachines,ATM’sownedbyothercreditunions participating in theCO-OPNetwork, and theCO-OPnetworkofothercreditunionbrancheswhereourmemberscanperformroutineaccount transactionsviaapracticeknownasSharedBranching.Whilewedonotfinditnecessarytodesigndifferent support requirements for different customer groupsor segments, the breadth of our channel offerings allows foreachmembertotailorsupport.Memberscanchoosetoaccessservices or support from us in the manner they deem mostappropriate.Wealsooffersupportforourmembershipthroughcommunity events, seminars andfinancial literacy [7.4a(5)]. 3.2a(3) Through the Elevations Business Model wehave defined targetmembers as: thosewhofindvalue in ahigh-touch experience offering consultative solutions. Ourefforts are directed at acquiring members for whom we aretheirprimaryfinancial institution. Wesegmentourmembersandpotentialmembersasbusinessorconsumers. Wefurthersegment our consumer market by life stage; followed byan analysis of psychographic information used to developpersonas within each segment; and finally, we modify ourvoiceofthememberapproachesasappropriatetothepersonaswithin each of the segments to better understand currentand future needs for eachmember segment (Figure 3.2-2). Weaccomplishthissegmentationthroughthreeprocesses.First,weexecuteprocess3.0 Market Solutions, Perform Brand Analysisconductedannually.Throughthisprocess,wecollectdata that helps us understand our current brand relevancy inthemarketplaceusingoursegmentationmethodologies.Oncewehaveensuredourbrandisrelevant, thisinformationfeedsinto 3.0 Market Solutions, Perform Market Analysis Process.Throughthisprocesswedeterminewhenandwhereconsumersare looking to switch financial institutions. These data helpusnotonlyrecognizewhentomarket toandattractpotential
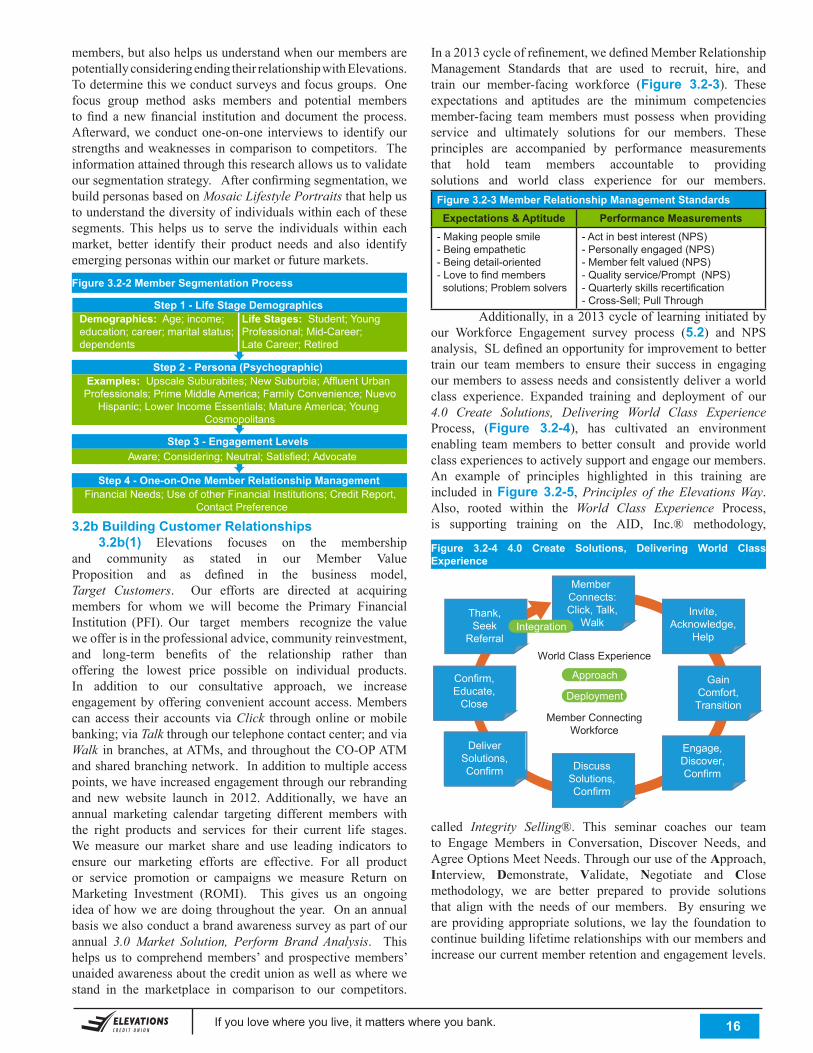
If you love where you live, it matters where you bank. . 16
members,butalsohelpsusunderstandwhenourmembersarepotentiallyconsideringendingtheirrelationshipwithElevations.Todeterminethisweconductsurveysandfocusgroups.Onefocus group method asks members and potential memberstofind a newfinancial institution anddocument the process.Afterward,weconductone-on-one interviews to identifyourstrengthsandweaknesses incomparisontocompetitors. Theinformationattainedthroughthisresearchallowsustovalidateoursegmentationstrategy.Afterconfirmingsegmentation,webuildpersonasbasedonMosaic Lifestyle Portraits thathelpustounderstandthediversityofindividualswithineachofthesesegments.This helps us to serve the individualswithin eachmarket, better identify their product needs and also identifyemergingpersonaswithinourmarketorfuturemarkets.
Figure 3.2-2 Member Segmentation Process
Ina2013cycleofrefinement,wedefinedMemberRelationshipManagement Standards that are used to recruit, hire, andtrain our member-facing workforce (Figure 3.2-3). Theseexpectations and aptitudes are the minimum competenciesmember-facing teammembers must possess when providingservice and ultimately solutions for our members. Theseprinciples are accompanied by performance measurementsthat hold team members accountable to providingsolutions and world class experience for our members.
Figure 3.2-3 Member Relationship Management StandardsExpectations & Aptitude Performance Measurements
- Making people smile- Being empathetic- Being detail-oriented- Love to find members solutions; Problem solvers
- Act in best interest (NPS)- Personally engaged (NPS)- Member felt valued (NPS)- Quality service/Prompt (NPS)- Quarterly skills recertification - Cross-Sell; Pull Through
Additionally,ina2013cycleoflearninginitiatedbyour Workforce Engagement survey process (5.2) and NPSanalysis,SLdefinedanopportunityforimprovementtobettertrain our teammembers to ensure their success in engagingourmemberstoassessneedsandconsistentlydeliveraworldclass experience. Expanded training and deployment of our4.0 Create Solutions, Delivering World Class Experience Process, (Figure 3.2-4), has cultivated an environmentenabling teammembers to better consult andprovideworldclassexperiencestoactivelysupportandengageourmembers.An example of principles highlighted in this training areincluded inFigure 3.2-5, Principles of the Elevations Way.Also, rooted within the World Class Experience Process,is supporting training on the AID, Inc.® methodology,3.2b Building Customer Relationships
3.2b(1) Elevations focuses on the membershipand community as stated in our Member ValueProposition and as defined in the business model,Target Customers. Our efforts are directed at acquiringmembers for whom we will become the Primary FinancialInstitution (PFI).Our target members recognize the valueweofferisintheprofessionaladvice,communityreinvestment,and long-term benefits of the relationship rather thanoffering the lowest price possible on individual products.In addition to our consultative approach, we increaseengagementbyofferingconvenientaccountaccess.Memberscan access their accounts viaClick throughonlineormobilebanking; via Talkthroughourtelephonecontactcenter;andviaWalk inbranches,atATMs,and throughout theCO-OPATMandsharedbranchingnetwork.Inadditiontomultipleaccesspoints,wehaveincreasedengagementthroughourrebrandingand new website launch in 2012. Additionally, we have anannual marketing calendar targeting different members withthe right products and services for their current life stages.We measure our market share and use leading indicators toensure our marketing efforts are effective. For all productor service promotion or campaigns we measure Return onMarketing Investment (ROMI). This gives us an ongoingideaofhowwearedoingthroughouttheyear.Onanannualbasiswealsoconductabrandawarenesssurveyaspartofourannual 3.0 Market Solution, Perform Brand Analysis. Thishelpsus to comprehendmembers’ andprospectivemembers’unaidedawarenessaboutthecreditunionaswellaswherewestand in the marketplace in comparison to our competitors.
Figure 3.2-4 4.0 Create Solutions, Delivering World Class Experience
called Integrity Selling®. This seminar coaches our teamto Engage Members in Conversation, Discover Needs, andAgreeOptionsMeetNeeds.ThroughouruseoftheApproach,Interview, Demonstrate, Validate, Negotiate and Close methodology, we are better prepared to provide solutionsthat align with the needs of our members. By ensuring weareprovidingappropriate solutions,we lay the foundation tocontinuebuildinglifetimerelationshipswithourmembersandincreaseourcurrentmemberretentionandengagementlevels.
Approach
Deployment
Member Connects:Click, Talk,
WalkInvite,
Acknowledge,Help
GainComfort,Transition
Engage,Discover,Confirm
DiscussSolutions,Confirm
DeliverSolutions,Confirm
Confirm,Educate,
Close
Thank,Seek
ReferralWorld Class Experience
Member ConnectingWorkforce
Integration
Step 1 - Life Stage DemographicsDemographics: Age; income;education; career; marital status; dependents
Life Stages: Student; Young Professional; Mid-Career;Late Career; Retired
Step 2 - Persona (Psychographic)
Step 3 - Engagement Levels
Step 4 - One-on-One Member Relationship ManagementFinancial Needs; Use of other Financial Institutions; Credit Report,
Contact Preference
Examples: Upscale Suburabites; New Suburbia; Affluent Urban Professionals; Prime Middle America; Family Convenience; Nuevo
Hispanic; Lower Income Essentials; Mature America; Young Cosmopolitans
Aware; Considering; Neutral; Satisfied; Advocate

If you love where you live, it matters where you bank. . 17
Figure 3.2-6 Social Media Strategy
engagewithourmembersonthesetopics.Onceapostismade,wemonitor its performance and interactwith responses in atimelymanner as they come in, with the goal of building aconversationaroundatopicorprovidingfeedbacktoinquiries(utilizing various stakeholders’ expertise in some cases).Once a quarter,we review performancemetrics and conductcompetitive analysis to get new ideas for engaging contenttrends(AOS). 3.2b(2) Member complaints may be received through
Figure 3.2-5 Principles of “The Elevations Way”- Respect meet them at the door or phone with a real and genuine \ SMILE- Relationship is paramount; Integrity, only the right solutions at the right time; we refer them to competitors if our solutions aren’t right- Creative, Passion outside the box “WoW” solutions and service are encouraged! Dinner on us; we can mail that for you; we can call your agent- Team thinking; no matter our role, we drop everything to help each other deliver “WoW” experiences- Fix it for the member, then FIX it so it doesn’t happen again; cycles of learning Excellence Wealsocreateengagement throughouremergingsocialmedia channels. One of the building blocks of our strategy(Figure 3.2-6) is to create engaging content that will helpenhance relationships with our members, the communitieswe represent and our business partners. The process todevelop this engaging content beginswith bi-annual strategysessions.Working with our third party social media agency,we review socialmedia trends, analyzewhich content is themost impactful, and develop plans for the next half of theyear. Eachmonth, theMarketingDepartment builds a socialmedia calendar (including Elevations and community-basedeventsandseminars,financialeducation,videos,sweepstakes,SEG current events, historic notes of interest, helpful tipsabout resourceswe offer, etc.).This calendar is reviewedbyour third party social media agency to continually guide usand keep us abreast of current algorithms that will enableus toget themost visibility and engagement fromourposts. Weroutethemonthlysocialmediacalendar(AOS)toallaffecteddepartmentsthroughouttheorganization.Thisroutingactsnotonlyasanopportunityforteamstoprovideadditionalrelationship building content to the social calendar, but alsoassists in internally communicating upcoming social mediamessaging so our member-facing teammembers can further
anyofourchannelsorthroughourNPSsurveytool.Througha2012cycleoflearninginitiatedfromNPSanalysis,wecreatedanewposition,VicePresidentofMemberExperience,toensureweareabletoleadachangeinitiativetoincreaseouroverallmember loyalty. Through a 2013 cycle of learning initiatedby NPS analysis and workforce engagement surveys, werecognizedtheneedtobringtogetherateamofpeoplewhocouldrepresent ourmembers inside the organization, contribute tobuildingapro-memberculture,monitorourproblemresolutionefficacy,generatesolutionsaffectingNPSgrowthandmembersatisfaction,andultimatelymonitorimplementationofagreedsolutions.TheMemberExperienceTeam(MXT)wasformedand includes cross functional teammembers fromacross theorganization. Through the establishment of ourMXT team,we have developed and deployed our 4.0 Create Solutions, Respond to Service Feedback process to empower TeamElevations staff to effectively manage all service feedback. Complaints resolution ismanaged through theLEARNProcess (Figure 3.2-7). We empower our team membersto address issues exercising LEARN at the point of contact,escalatingto leadershiponlywhentheyareunable toresolvetheissue. Ourgoalistorestorememberconfidenceandalsotousecomplaintinformationtodriveimprovementinourprocesses.Inordertoachievethislearning,wecapturemembercomplaintsinourcentralizedMRMsystem,aswerealizethisisacrucialstepto identifying systemic issues.Monthly complaint commentsareaggregated,categorizedandthemostsignificantissuesareprioritized by theMXT team to ensure appropriate action istakennotonlytoresolvetheinitialissue,butalsotolearnfromthedatatoimprovesystemicissues.Positivecommentsarealsoevaluatedtoensureweareactivelylisteningtothevoiceofourmember. Webelieveitisimportanttodemonstratetoourmembershipwevaluetheirfeedback,andmostimportantlyactuponit.WehavedeployedaIt Matters What You Thinkcommunicationtoourmembershiptoletthemknowofmember-initiatedchanges.Examplesof change initiatedbymembers include: expandedcallcenterhours,mobileremotedepositcheckcapture,reducedfeeschedule,andsimplifiednotificationsfortraveltopreventcreditcardblockages.Figure 3.2-7 Complaint Management Process - LEARN
Social Media Tactics
- Social Advertising- Content creation and distribution- Fan acquisition- Social activation programs- Online community- Monitoring and response- Social integration- Social advertising- Social content organization- Monitoring and response- Governance/training
Social MediaObjectives
- Establish and grow brand awareness with target segments- Increase knowledge about credit unions; differentiate from big banks- Grow communities and drive engagement to build affinity- Position as pillar of the community through philantropy/social responsiblity- Generate web traffic conversations- Media relations and crisis management Empathize:
CommunicateUnderstanding
Apologize:Take
ResponsiblityReact:Deliver
Solutions
Notify:Capture
Information
Voice of the MemberCapture, Analyze,
Resolve
MemberConnects:
Click, Talk, Walk Listen &IdentifyProblem
Approach
Deployment
4.2.4 Compliment & Complaint
Management LEARN
Member ConnectingWorkforce
Integration
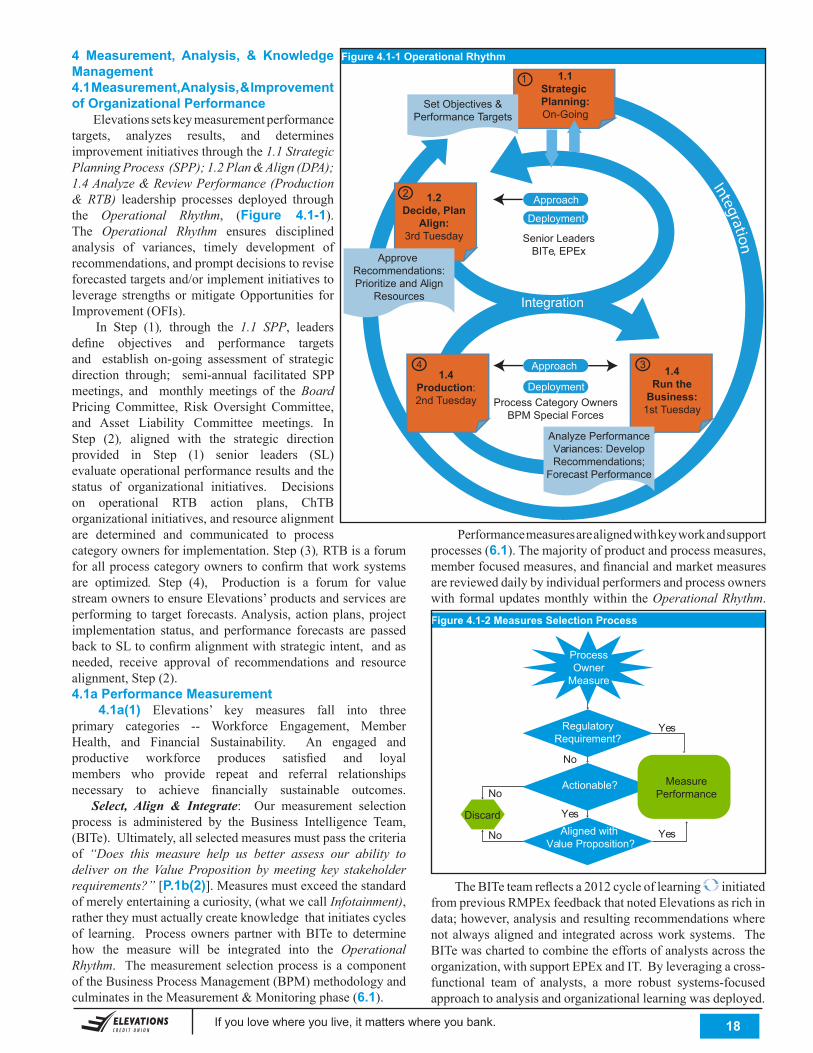
If you love where you live, it matters where you bank. . 18
4 Measurement, Analysis, & Knowledge Management4.1 Measurement, Analysis, & Improvement of Organizational Performance Elevationssetskeymeasurementperformancetargets, analyzes results, and determinesimprovementinitiativesthroughthe1.1 Strategic Planning Process (SPP); 1.2 Plan & Align (DPA); 1.4 Analyze & Review Performance (Production & RTB) leadership processes deployed throughthe Operational Rhythm, (Figure 4.1-1).The Operational Rhythm ensures disciplinedanalysis of variances, timely development ofrecommendations,andpromptdecisionstoreviseforecastedtargetsand/orimplementinitiativestoleverage strengths ormitigateOpportunities forImprovement(OFIs). In Step (1), through the 1.1 SPP, leaders define objectives and performance targetsand establish on-going assessment of strategicdirection through; semi-annual facilitated SPPmeetings, and monthly meetings of theBoard Pricing Committee, Risk Oversight Committee,and Asset Liability Committee meetings. InStep (2), aligned with the strategic directionprovided in Step (1) senior leaders (SL)evaluateoperationalperformanceresultsandthestatus of organizational initiatives. Decisionson operational RTB action plans, ChTBorganizationalinitiatives,andresourcealignmentare determined and communicated to processcategoryownersforimplementation.Step(3), RTBisaforumforallprocesscategoryownerstoconfirmthatworksystemsare optimized. Step (4), Production is a forum for valuestreamownerstoensureElevations’productsandservicesareperforming to target forecasts.Analysis, actionplans,projectimplementation status, and performance forecasts are passedbacktoSLtoconfirmalignmentwithstrategicintent,andasneeded, receive approval of recommendations and resourcealignment,Step(2).4.1a Performance Measurement 4.1a(1) Elevations’ key measures fall into threeprimary categories -- Workforce Engagement, MemberHealth, and Financial Sustainability. An engaged andproductive workforce produces satisfied and loyalmembers who provide repeat and referral relationshipsnecessary to achieve financially sustainable outcomes. Select, Align & Integrate: Our measurement selectionprocess is administered by the Business Intelligence Team,(BITe).Ultimately,allselectedmeasuresmustpassthecriteriaof “Does this measure help us better assess our ability to deliver on the Value Proposition by meeting key stakeholder requirements?”[P.1b(2)].Measuresmustexceedthestandardofmerelyentertainingacuriosity,(whatwecallInfotainment), rathertheymustactuallycreateknowledgethatinitiatescyclesof learning. Process owners partnerwithBITe to determinehow the measure will be integrated into the Operational Rhythm. Themeasurementselectionprocess isacomponentoftheBusinessProcessManagement(BPM)methodologyandculminatesintheMeasurement&Monitoringphase(6.1).
Figure 4.1-1 Operational Rhythm
Performancemeasuresarealignedwithkeyworkandsupportprocesses(6.1).Themajorityofproductandprocessmeasures,memberfocusedmeasures,andfinancialandmarketmeasuresarerevieweddailybyindividualperformersandprocessownerswithformalupdatesmonthlywithintheOperational Rhythm.Figure 4.1-2 Measures Selection Process
ProcessOwner
Measure
No
No
No
Yes
Yes
Actionable?
RegulatoryRequirement?
Aligned with Value Proposition?
Yes
MeasurePerformance
Discard
TheBITeteamreflectsa2012cycleoflearning initiated frompreviousRMPExfeedbackthatnotedElevationsasrichindata;however,analysisandresultingrecommendationswherenotalwaysalignedand integratedacrossworksystems. TheBITewaschartedtocombinetheeffortsofanalystsacrosstheorganization,withsupportEPExandIT.Byleveragingacross-functional team of analysts, a more robust systems-focusedapproachtoanalysisandorganizationallearningwasdeployed.
1.4Production:2nd Tuesday
1.4Run the
Business:1st Tuesday
Senior LeadersBITe, EPEx
Process Category OwnersBPM Special Forces
Approach
Approach
Deployment
Deployment
Integration1.1
Strategic Planning:On-Going
1.2Decide, Plan
Align:3rd Tuesday
Approve Recommendations:Prioritize and Align
Resources
Analyze PerformanceVariances: DevelopRecommendations;
Forecast Performance
1
2
34
Integration
Set Objectives &Performance Targets
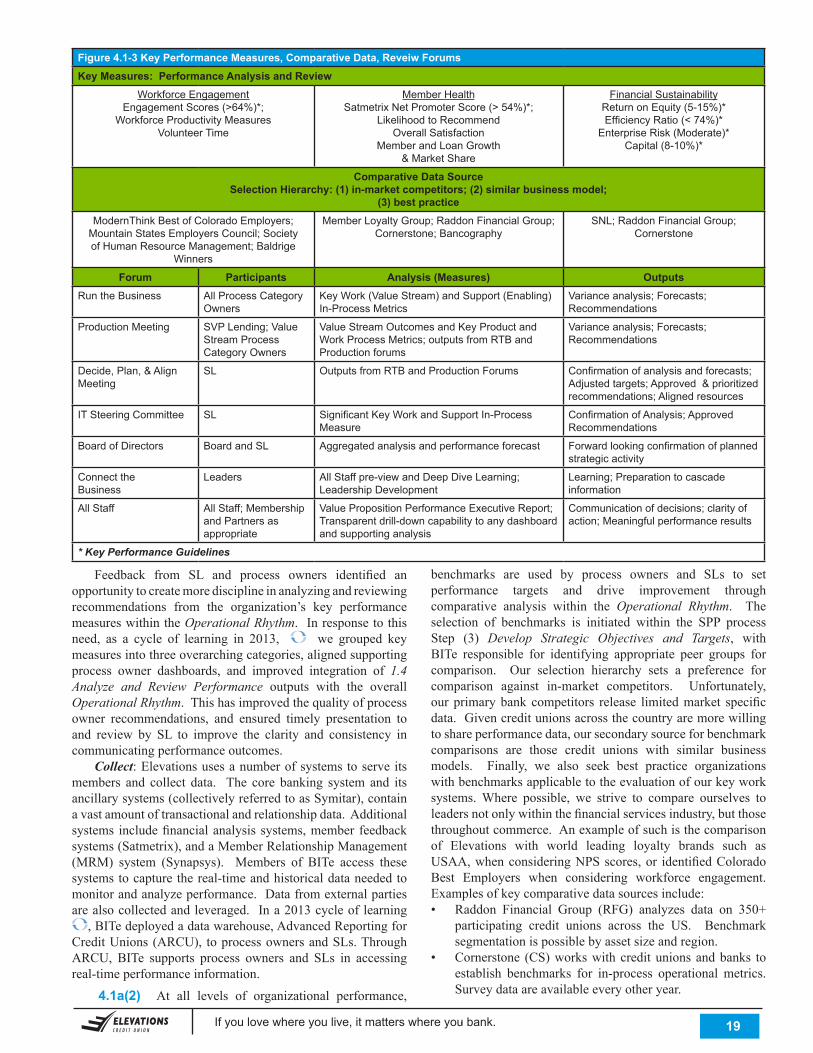
If you love where you live, it matters where you bank. . 19
Feedback from SL and process owners identified anopportunitytocreatemoredisciplineinanalyzingandreviewingrecommendations from the organization’s key performancemeasureswithintheOperational Rhythm. Inresponsetothisneed, as a cycle of learning in 2013, we grouped keymeasuresintothreeoverarchingcategories,alignedsupportingprocess owner dashboards, and improved integration of 1.4 Analyze and Review Performance outputs with the overallOperational Rhythm.Thishasimprovedthequalityofprocessowner recommendations, and ensured timely presentation toand review by SL to improve the clarity and consistency incommunicatingperformanceoutcomes. Collect:Elevationsusesanumberofsystemstoserveitsmembers and collect data. The core banking system and itsancillarysystems(collectivelyreferredtoasSymitar),containavastamountoftransactionalandrelationshipdata.Additionalsystems includefinancialanalysissystems,member feedbacksystems(Satmetrix),andaMemberRelationshipManagement(MRM) system (Synapsys). Members of BITe access thesesystemstocapturethereal-timeandhistoricaldataneededtomonitorandanalyzeperformance.Datafromexternalpartiesarealsocollectedandleveraged. Ina2013cycleoflearning
,BITedeployedadatawarehouse,AdvancedReportingforCreditUnions(ARCU), toprocessownersandSLs.ThroughARCU, BITe supports process owners and SLs in accessingreal-timeperformanceinformation.
4.1a(2) At all levels of organizational performance,
benchmarks are used by process owners and SLs to setperformance targets and drive improvement throughcomparative analysis within the Operational Rhythm. Theselection of benchmarks is initiated within the SPP processStep (3) Develop Strategic Objectives and Targets, withBITe responsible for identifying appropriate peer groups forcomparison. Our selection hierarchy sets a preference forcomparison against in-market competitors. Unfortunately,ourprimarybankcompetitors release limitedmarket specificdata.Givencreditunionsacrossthecountryaremorewillingtoshareperformancedata,oursecondarysourceforbenchmarkcomparisons are those credit unions with similar businessmodels. Finally, we also seek best practice organizationswithbenchmarksapplicabletotheevaluationofourkeyworksystems.Where possible, we strive to compare ourselves toleadersnotonlywithinthefinancialservicesindustry,butthosethroughoutcommerce.Anexampleofsuchisthecomparisonof Elevations with world leading loyalty brands such asUSAA,whenconsideringNPSscores,or identifiedColoradoBest Employers when considering workforce engagement.Examplesofkeycomparativedatasourcesinclude:• Raddon Financial Group (RFG) analyzes data on 350+
participating credit unions across the US. Benchmarksegmentationispossiblebyassetsizeandregion.
• Cornerstone (CS)workswithcreditunionsandbanks toestablish benchmarks for in-process operational metrics.Surveydataareavailableeveryotheryear.
Figure 4.1-3 Key Performance Measures, Comparative Data, Reveiw ForumsKey Measures: Performance Analysis and Review
Workforce EngagementEngagement Scores (>64%)*;
Workforce Productivity MeasuresVolunteer Time
Member HealthSatmetrix Net Promoter Score (> 54%)*;
Likelihood to RecommendOverall Satisfaction
Member and Loan Growth & Market Share
Financial SustainabilityReturn on Equity (5-15%)*Efficiency Ratio (< 74%)*
Enterprise Risk (Moderate)*Capital (8-10%)*
Comparative Data SourceSelection Hierarchy: (1) in-market competitors; (2) similar business model;
(3) best practiceModernThink Best of Colorado Employers;
Mountain States Employers Council; Society of Human Resource Management; Baldrige
Winners
Member Loyalty Group; Raddon Financial Group; Cornerstone; Bancography
SNL; Raddon Financial Group; Cornerstone
Forum Participants Analysis (Measures) OutputsRun the Business All Process Category
OwnersKey Work (Value Stream) and Support (Enabling) In-Process Metrics
Variance analysis; Forecasts; Recommendations
Production Meeting SVP Lending; Value Stream Process Category Owners
Value Stream Outcomes and Key Product and Work Process Metrics; outputs from RTB and Production forums
Variance analysis; Forecasts; Recommendations
Decide, Plan, & Align Meeting
SL Outputs from RTB and Production Forums Confirmation of analysis and forecasts; Adjusted targets; Approved & prioritized recommendations; Aligned resources
IT Steering Committee SL Significant Key Work and Support In-Process Measure
Confirmation of Analysis; Approved Recommendations
Board of Directors Board and SL Aggregated analysis and performance forecast Forward looking confirmation of planned strategic activity
Connect theBusiness
Leaders All Staff pre-view and Deep Dive Learning; Leadership Development
Learning; Preparation to cascade information
All Staff All Staff; Membership and Partners as appropriate
Value Proposition Performance Executive Report; Transparent drill-down capability to any dashboard and supporting analysis
Communication of decisions; clarity of action; Meaningful performance results
* Key Performance Guidelines
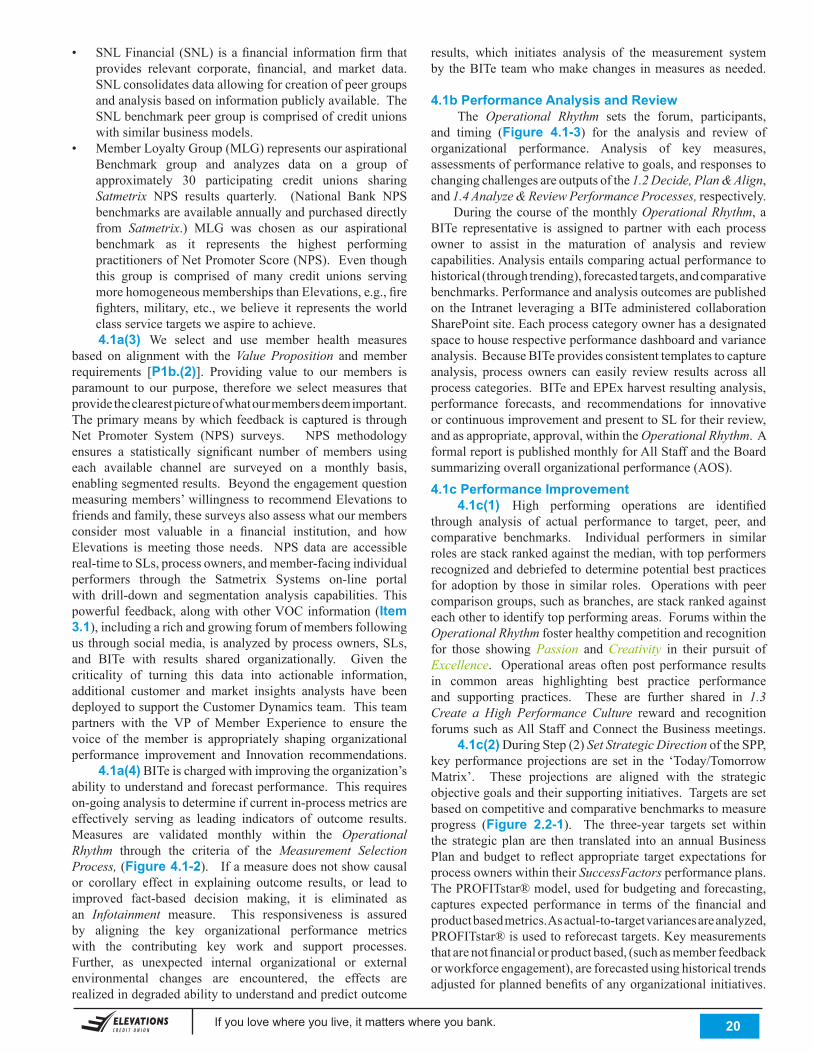
If you love where you live, it matters where you bank. . 20
results, which initiates analysis of the measurement systemby theBITe teamwhomakechanges inmeasuresasneeded.
4.1b Performance Analysis and Review The Operational Rhythm sets the forum, participants,and timing (Figure 4.1-3) for the analysis and review oforganizational performance. Analysis of key measures,assessmentsofperformancerelativetogoals,andresponsestochangingchallengesareoutputsofthe1.2 Decide, Plan & Align, and 1.4 Analyze & Review Performance Processes, respectively. During thecourseof themonthlyOperational Rhythm, a BITe representative is assigned to partner with each processowner to assist in the maturation of analysis and reviewcapabilities.Analysisentailscomparingactualperformancetohistorical(throughtrending),forecastedtargets,andcomparativebenchmarks.Performanceandanalysisoutcomesarepublishedon the Intranet leveraging aBITe administered collaborationSharePointsite.Eachprocesscategoryownerhasadesignatedspacetohouserespectiveperformancedashboardandvarianceanalysis.BecauseBITeprovidesconsistenttemplatestocaptureanalysis, process owners can easily review results across allprocesscategories.BITeandEPExharvestresultinganalysis,performance forecasts, and recommendations for innovativeorcontinuousimprovementandpresenttoSLfortheirreview,andasappropriate,approval,withintheOperational Rhythm.AformalreportispublishedmonthlyforAllStaffandtheBoardsummarizingoverallorganizationalperformance(AOS).
4.1c Performance Improvement 4.1c(1) High performing operations are identifiedthrough analysis of actual performance to target, peer, andcomparative benchmarks. Individual performers in similarrolesarestackrankedagainstthemedian,withtopperformersrecognizedanddebriefedtodeterminepotentialbestpracticesfor adoptionby those in similar roles. Operationswith peercomparisongroups,suchasbranches,arestackrankedagainsteachothertoidentifytopperformingareas.ForumswithintheOperational Rhythmfosterhealthycompetitionandrecognitionfor those showingPassion and Creativity in their pursuit ofExcellence. Operationalareasoftenpostperformanceresultsin common areas highlighting best practice performanceand supporting practices. These are further shared in 1.3 Create a High Performance Culture reward and recognitionforumssuchasAllStaffandConnect theBusinessmeetings. 4.1c(2)DuringStep(2)Set Strategic DirectionoftheSPP,keyperformanceprojections are set in the ‘Today/TomorrowMatrix’. These projections are aligned with the strategicobjectivegoalsandtheirsupportinginitiatives.Targetsaresetbasedoncompetitiveandcomparativebenchmarkstomeasureprogress (Figure 2.2-1). The three-year targets set withinthe strategicplanare then translated into an annualBusinessPlan andbudget to reflect appropriate target expectations forprocessownerswithintheirSuccessFactorsperformanceplans.ThePROFITstar®model,usedforbudgetingandforecasting,captures expected performance in terms of the financial andproductbasedmetrics.Asactual-to-targetvariancesareanalyzed,PROFITstar®isusedtoreforecasttargets.Keymeasurementsthatarenotfinancialorproductbased,(suchasmemberfeedbackorworkforceengagement),areforecastedusinghistoricaltrendsadjustedforplannedbenefitsofanyorganizationalinitiatives.
• SNLFinancial (SNL) isafinancial informationfirmthatprovides relevant corporate, financial, and market data.SNLconsolidatesdataallowingforcreationofpeergroupsandanalysisbasedoninformationpubliclyavailable.TheSNLbenchmarkpeergroupiscomprisedofcreditunionswithsimilarbusinessmodels.
• MemberLoyaltyGroup(MLG)representsouraspirationalBenchmark group and analyzes data on a group ofapproximately 30 participating credit unions sharingSatmetrix NPS results quarterly. (National Bank NPSbenchmarksareavailableannuallyandpurchaseddirectlyfrom Satmetrix.) MLG was chosen as our aspirationalbenchmark as it represents the highest performingpractitionersofNetPromoterScore(NPS).Eventhoughthis group is comprised of many credit unions servingmorehomogeneousmembershipsthanElevations,e.g.,firefighters,military, etc.,webelieve it represents theworldclassservicetargetsweaspiretoachieve.
4.1a(3) We select and use member health measuresbased on alignment with theValue Proposition and member requirements [P1b.(2)]. Providing value to our members isparamount to our purpose, thereforewe selectmeasures thatprovidetheclearestpictureofwhatourmembersdeemimportant.TheprimarymeansbywhichfeedbackiscapturedisthroughNet Promoter System (NPS) surveys. NPS methodologyensures a statistically significant number of members usingeach available channel are surveyed on a monthly basis,enablingsegmentedresults.Beyondtheengagementquestionmeasuringmembers’willingness torecommendElevationstofriendsandfamily,thesesurveysalsoassesswhatourmembersconsider most valuable in a financial institution, and howElevations ismeeting those needs. NPS data are accessiblereal-timetoSLs,processowners,andmember-facingindividualperformers through the Satmetrix Systems on-line portalwith drill-down and segmentation analysis capabilities. Thispowerful feedback,alongwithotherVOCinformation(Item 3.1),includingarichandgrowingforumofmembersfollowingusthroughsocialmedia,isanalyzedbyprocessowners,SLs,and BITe with results shared organizationally. Given thecriticality of turning this data into actionable information,additional customer and market insights analysts have beendeployedtosupporttheCustomerDynamicsteam.Thisteampartners with the VP of Member Experience to ensure thevoice of themember is appropriately shaping organizationalperformance improvement and Innovation recommendations. 4.1a(4)BITeischargedwithimprovingtheorganization’sabilitytounderstandandforecastperformance.Thisrequireson-goinganalysistodetermineifcurrentin-processmetricsareeffectively serving as leading indicators of outcome results.Measures are validated monthly within the Operational Rhythm through the criteria of the Measurement Selection Process, (Figure 4.1-2).Ifameasuredoesnotshowcausalor corollary effect in explaining outcome results, or lead toimproved fact-based decision making, it is eliminated asan Infotainment measure. This responsiveness is assuredby aligning the key organizational performance metricswith the contributing key work and support processes.Further, as unexpected internal organizational or externalenvironmental changes are encountered, the effects arerealizedindegradedabilitytounderstandandpredictoutcome
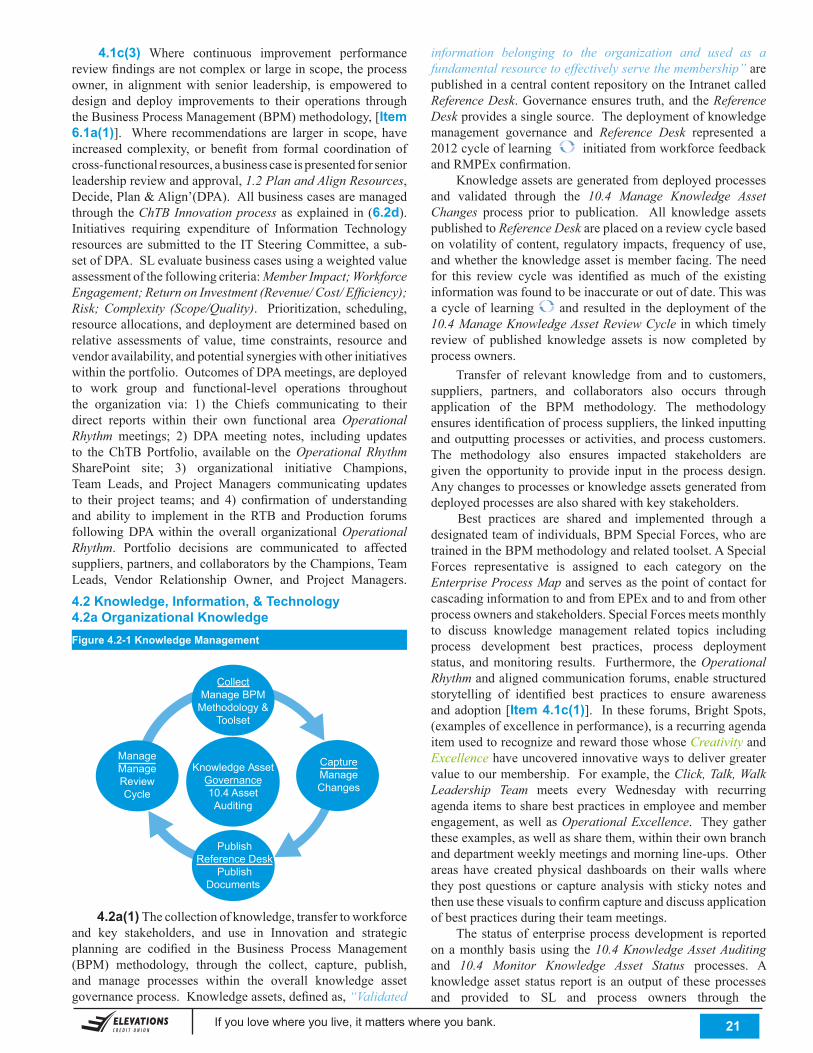
If you love where you live, it matters where you bank. . 21
4.1c(3) Where continuous improvement performancereviewfindingsarenotcomplexorlargeinscope,theprocessowner, in alignmentwith senior leadership, is empowered todesign and deploy improvements to their operations throughtheBusinessProcessManagement(BPM)methodology,[Item 6.1a(1)]. Where recommendations are larger in scope, haveincreased complexity, or benefit from formal coordination ofcross-functionalresources,abusinesscaseispresentedforseniorleadershipreviewandapproval,1.2 Plan and Align Resources, Decide,Plan&Align’(DPA).AllbusinesscasesaremanagedthroughtheChTB Innovation processasexplainedin(6.2d).Initiatives requiring expenditure of Information Technologyresourcesaresubmitted to theITSteeringCommittee,asub-setofDPA.SLevaluatebusinesscasesusingaweightedvalueassessmentofthefollowingcriteria:Member Impact; Workforce Engagement; Return on Investment (Revenue/ Cost/ Efficiency); Risk; Complexity (Scope/Quality). Prioritization, scheduling,resourceallocations,anddeploymentaredeterminedbasedonrelative assessments of value, time constraints, resource andvendoravailability,andpotentialsynergieswithotherinitiativeswithintheportfolio.OutcomesofDPAmeetings,aredeployedto work group and functional-level operations throughoutthe organization via: 1) the Chiefs communicating to theirdirect reports within their own functional area Operational Rhythm meetings; 2) DPA meeting notes, including updatesto theChTBPortfolio, available on theOperational Rhythm SharePoint site; 3) organizational initiative Champions,Team Leads, and Project Managers communicating updatesto their project teams; and 4) confirmation of understandingand ability to implement in theRTB and Production forumsfollowingDPAwithin the overall organizationalOperational Rhythm. Portfolio decisions are communicated to affectedsuppliers,partners,andcollaboratorsbytheChampions,TeamLeads, Vendor Relationship Owner, and Project Managers.
4.2 Knowledge, Information, & Technology4.2a Organizational Knowledge
CollectManage BPM
Methodology &Toolset
Knowledge AssetGovernance10.4 AssetAuditing
PublishReference Desk
PublishDocuments
CaptureManageChanges
ManageManageReviewCycle
Figure 4.2-1 Knowledge Management
4.2a(1) Thecollectionofknowledge,transfertoworkforceand key stakeholders, and use in Innovation and strategicplanning are codified in the Business Process Management(BPM) methodology, through the collect, capture, publish,and manage processes within the overall knowledge assetgovernanceprocess.Knowledgeassets,definedas,“Validated
information belonging to the organization and used as a fundamental resource to effectively serve the membership” are publishedinacentralcontentrepositoryontheIntranetcalledReference Desk.Governanceensures truth,andtheReference Deskprovidesasinglesource.Thedeploymentofknowledgemanagement governance and Reference Desk represented a 2012cycleoflearning initiatedfromworkforcefeedbackandRMPExconfirmation. Knowledgeassetsaregeneratedfromdeployedprocessesand validated through the 10.4 Manage Knowledge Asset Changes process prior to publication. All knowledge assetspublishedtoReference Deskareplacedonareviewcyclebasedonvolatilityofcontent,regulatoryimpacts,frequencyofuse,andwhethertheknowledgeassetismemberfacing.Theneedfor this review cycle was identified asmuch of the existinginformationwasfoundtobeinaccurateoroutofdate.Thiswasacycleof learning and resulted in thedeploymentof the10.4 Manage Knowledge Asset Review Cycle inwhichtimelyreview of published knowledge assets is now completed byprocessowners. Transfer of relevant knowledge from and to customers,suppliers, partners, and collaborators also occurs throughapplication of the BPM methodology. The methodologyensuresidentificationofprocesssuppliers,thelinkedinputtingandoutputtingprocessesoractivities,andprocesscustomers.The methodology also ensures impacted stakeholders aregiven theopportunity toprovide input in theprocessdesign.Anychangestoprocessesorknowledgeassetsgeneratedfromdeployedprocessesarealsosharedwithkeystakeholders. Best practices are shared and implemented through adesignatedteamofindividuals,BPMSpecialForces,whoaretrainedintheBPMmethodologyandrelatedtoolset.ASpecialForces representative is assigned to each category on theEnterprise Process MapandservesasthepointofcontactforcascadinginformationtoandfromEPExandtoandfromotherprocessownersandstakeholders.SpecialForcesmeetsmonthlyto discuss knowledge management related topics includingprocess development best practices, process deploymentstatus, andmonitoring results. Furthermore, theOperational Rhythmandalignedcommunicationforums,enablestructuredstorytelling of identified best practices to ensure awarenessandadoption[Item 4.1c(1)]. In theseforums,BrightSpots,(examplesofexcellenceinperformance),isarecurringagendaitemusedtorecognizeandrewardthosewhoseCreativity and Excellencehaveuncoveredinnovativewaystodelivergreatervaluetoourmembership.Forexample,theClick, Talk, Walk Leadership Team meets every Wednesday with recurringagendaitemstosharebestpracticesinemployeeandmemberengagement, as well as Operational Excellence. Theygathertheseexamples,aswellassharethem,withintheirownbranchanddepartmentweeklymeetingsandmorningline-ups.Otherareas have created physical dashboards on theirwallswheretheypostquestionsor capture analysiswith stickynotes andthenusethesevisualstoconfirmcaptureanddiscussapplicationofbestpracticesduringtheirteammeetings. Thestatusofenterpriseprocessdevelopment is reportedonamonthlybasisusing the10.4 Knowledge Asset Auditing and 10.4 Monitor Knowledge Asset Status processes. Aknowledgeasset status report is anoutputof theseprocessesand provided to SL and process owners through the
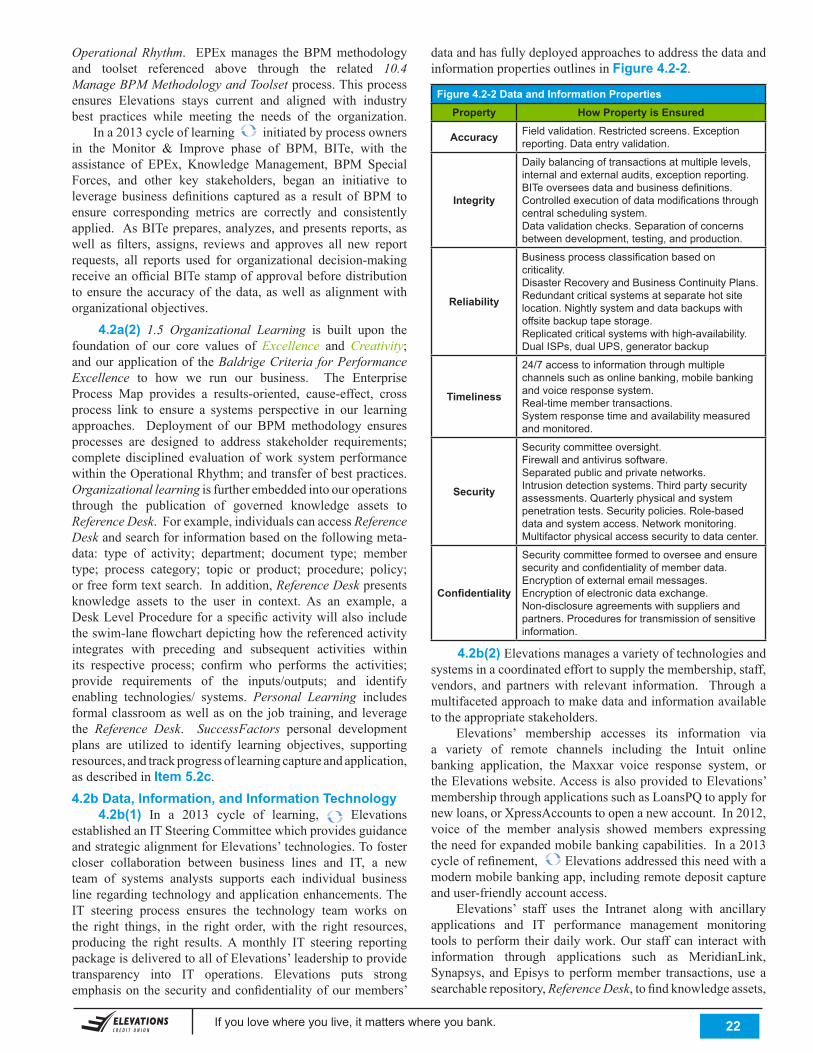
If you love where you live, it matters where you bank. . 22
Operational Rhythm. EPExmanages theBPMmethodologyand toolset referenced above through the related 10.4 Manage BPM Methodology and Toolsetprocess.Thisprocessensures Elevations stays current and aligned with industrybest practices while meeting the needs of the organization. Ina2013cycleoflearning initiatedbyprocessownersin the Monitor & Improve phase of BPM, BITe, with theassistance of EPEx, Knowledge Management, BPM SpecialForces, and other key stakeholders, began an initiative toleverage business definitions captured as a result ofBPM toensure corresponding metrics are correctly and consistentlyapplied. AsBITeprepares,analyzes,andpresentsreports,aswell as filters, assigns, reviews and approves all new reportrequests, all reports used for organizational decision-makingreceiveanofficialBITestampofapprovalbeforedistributiontoensure theaccuracyof thedata,aswellasalignmentwithorganizationalobjectives.
4.2a(2) 1.5 Organizational Learning is built upon thefoundation of our core values of Excellence and Creativity; andourapplicationof theBaldrige Criteria for Performance Excellence to how we run our business. The EnterpriseProcess Map provides a results-oriented, cause-effect, crossprocess link to ensure a systems perspective in our learningapproaches. Deployment of our BPMmethodology ensuresprocesses are designed to address stakeholder requirements;complete disciplined evaluationofwork systemperformancewithintheOperationalRhythm;andtransferofbestpractices.Organizational learningisfurtherembeddedintoouroperationsthrough the publication of governed knowledge assets toReference Desk.Forexample,individualscanaccessReference Deskandsearchforinformationbasedonthefollowingmeta-data: type of activity; department; document type; membertype; process category; topic or product; procedure; policy;orfreeformtextsearch. Inaddition,Reference Desk presents knowledge assets to the user in context. As an example, aDeskLevelProcedureforaspecificactivitywillalsoincludetheswim-laneflowchartdepictinghowthereferencedactivityintegrates with preceding and subsequent activities withinits respective process; confirm who performs the activities;provide requirements of the inputs/outputs; and identifyenabling technologies/ systems. Personal Learning includesformalclassroomaswellasonthejobtraining,andleveragethe Reference Desk. SuccessFactors personal development plans are utilized to identify learning objectives, supportingresources,andtrackprogressoflearningcaptureandapplication,asdescribedinItem 5.2c.4.2b Data, Information, and Information Technology 4.2b(1) In a 2013 cycle of learning, Elevations establishedanITSteeringCommitteewhichprovidesguidanceandstrategicalignmentforElevations’technologies.Tofostercloser collaboration between business lines and IT, a newteam of systems analysts supports each individual businesslineregarding technologyandapplicationenhancements.TheIT steering process ensures the technology team works onthe right things, in the right order, with the right resources,producing the right results.A monthly IT steering reportingpackageisdeliveredtoallofElevations’leadershiptoprovidetransparency into IT operations. Elevations puts strongemphasison thesecurityandconfidentialityofourmembers’
dataandhasfullydeployedapproachestoaddressthedataandinformationpropertiesoutlinesinFigure 4.2-2.
Figure 4.2-2 Data and Information PropertiesProperty How Property is Ensured
Accuracy Field validation. Restricted screens. Exception reporting. Data entry validation.
Integrity
Daily balancing of transactions at multiple levels, internal and external audits, exception reporting.BITe oversees data and business definitions. Controlled execution of data modifications through central scheduling system.Data validation checks. Separation of concerns between development, testing, and production.
Reliability
Business process classification based on criticality.Disaster Recovery and Business Continuity Plans.Redundant critical systems at separate hot site location. Nightly system and data backups with offsite backup tape storage.Replicated critical systems with high-availability.Dual ISPs, dual UPS, generator backup
Timeliness
24/7 access to information through multiple channels such as online banking, mobile banking and voice response system.Real-time member transactions.System response time and availability measured and monitored.
Security
Security committee oversight.Firewall and antivirus software.Separated public and private networks.Intrusion detection systems. Third party security assessments. Quarterly physical and system penetration tests. Security policies. Role-based data and system access. Network monitoring.Multifactor physical access security to data center.
Confidentiality
Security committee formed to oversee and ensure security and confidentiality of member data.Encryption of external email messages. Encryption of electronic data exchange.Non-disclosure agreements with suppliers and partners. Procedures for transmission of sensitive information.
4.2b(2) Elevationsmanagesavarietyoftechnologiesandsystemsinacoordinatedefforttosupplythemembership,staff,vendors, and partners with relevant information. Through amultifacetedapproachtomakedataandinformationavailabletotheappropriatestakeholders. Elevations’ membership accesses its information viaa variety of remote channels including the Intuit onlinebanking application, the Maxxar voice response system, ortheElevationswebsite.AccessisalsoprovidedtoElevations’membershipthroughapplicationssuchasLoansPQtoapplyfornewloans,orXpressAccountstoopenanewaccount.In2012,voice of the member analysis showed members expressingtheneedforexpandedmobilebankingcapabilities.Ina2013cycleofrefinement, Elevationsaddressedthisneedwithamodernmobilebankingapp,includingremotedepositcaptureanduser-friendlyaccountaccess. Elevations’ staff uses the Intranet along with ancillaryapplications and IT performance management monitoringtools toperform theirdailywork.Our staff can interactwithinformation through applications such as MeridianLink,Synapsys, andEpisys toperformmember transactions, use asearchablerepository,Reference Desk,tofindknowledgeassets,
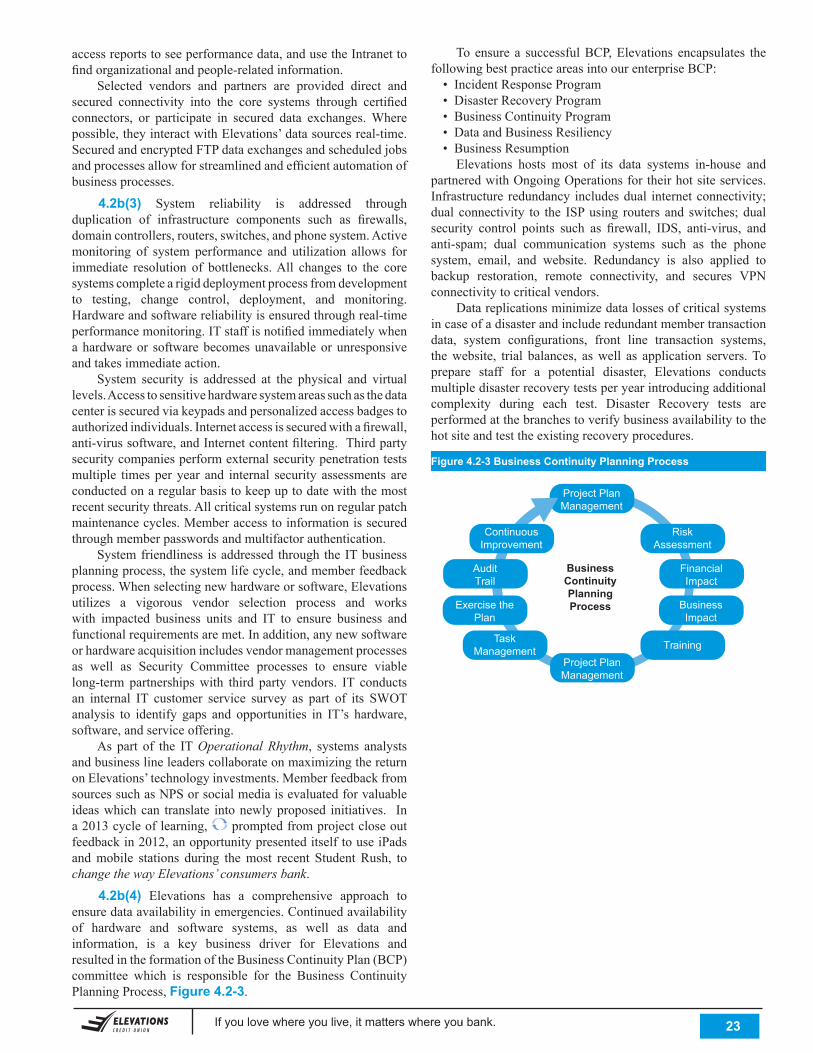
If you love where you live, it matters where you bank. . 23
accessreportstoseeperformancedata,andusetheIntranettofindorganizationalandpeople-relatedinformation. Selected vendors and partners are provided direct andsecured connectivity into the core systems through certifiedconnectors, or participate in secured data exchanges.Wherepossible,theyinteractwithElevations’datasourcesreal-time.SecuredandencryptedFTPdataexchangesandscheduledjobsandprocessesallowforstreamlinedandefficientautomationofbusinessprocesses.
4.2b(3) System reliability is addressed throughduplication of infrastructure components such as firewalls,domaincontrollers,routers,switches,andphonesystem.Activemonitoring of system performance and utilization allows forimmediate resolution of bottlenecks.All changes to the coresystemscompletearigiddeploymentprocessfromdevelopmentto testing, change control, deployment, and monitoring.Hardwareandsoftwarereliabilityisensuredthroughreal-timeperformancemonitoring.ITstaffisnotifiedimmediatelywhenahardwareor softwarebecomesunavailableorunresponsiveandtakesimmediateaction. System security is addressed at the physical and virtuallevels.Accesstosensitivehardwaresystemareassuchasthedatacenterissecuredviakeypadsandpersonalizedaccessbadgestoauthorizedindividuals.Internetaccessissecuredwithafirewall,anti-virussoftware,andInternetcontentfiltering.Thirdpartysecuritycompaniesperformexternalsecuritypenetrationtestsmultiple timesper year and internal security assessments areconductedonaregularbasistokeepuptodatewiththemostrecentsecuritythreats.Allcriticalsystemsrunonregularpatchmaintenancecycles.Memberaccesstoinformationissecuredthroughmemberpasswordsandmultifactorauthentication. Systemfriendliness isaddressed throughtheITbusinessplanningprocess,thesystemlifecycle,andmemberfeedbackprocess.Whenselectingnewhardwareorsoftware,Elevationsutilizes a vigorous vendor selection process and workswith impacted business units and IT to ensure business andfunctionalrequirementsaremet.Inaddition,anynewsoftwareorhardwareacquisitionincludesvendormanagementprocessesas well as Security Committee processes to ensure viablelong-term partnershipswith third party vendors. IT conductsan internal IT customer service survey as part of its SWOTanalysis to identify gaps and opportunities in IT’s hardware,software,andserviceoffering. As part of the ITOperational Rhythm, systems analystsandbusinesslineleaderscollaborateonmaximizingthereturnonElevations’technologyinvestments.MemberfeedbackfromsourcessuchasNPSorsocialmediaisevaluatedforvaluableideaswhichcan translate intonewlyproposed initiatives. Ina2013cycleoflearning, promptedfromprojectcloseoutfeedbackin2012,anopportunitypresenteditselftouseiPadsandmobile stations during themost recent StudentRush, tochange the way Elevations’ consumers bank. 4.2b(4) Elevations has a comprehensive approach toensuredataavailabilityinemergencies.Continuedavailabilityof hardware and software systems, as well as data andinformation, is a key business driver for Elevations andresultedintheformationoftheBusinessContinuityPlan(BCP)committee which is responsible for the Business ContinuityPlanningProcess,Figure 4.2-3.
Toensure a successfulBCP,Elevationsencapsulates thefollowingbestpracticeareasintoourenterpriseBCP:
• IncidentResponseProgram• DisasterRecoveryProgram• BusinessContinuityProgram• DataandBusinessResiliency• BusinessResumption
Elevations hosts most of its data systems in-house andpartneredwithOngoingOperationsfortheirhotsiteservices.Infrastructure redundancy includesdual internetconnectivity;dual connectivity to the ISPusing routers and switches;dualsecurity control points such as firewall, IDS, anti-virus, andanti-spam; dual communication systems such as the phonesystem, email, and website. Redundancy is also applied tobackup restoration, remote connectivity, and secures VPNconnectivitytocriticalvendors. Datareplicationsminimizedatalossesofcriticalsystemsincaseofadisasterandincluderedundantmembertransactiondata, system configurations, front line transaction systems,thewebsite, trial balances, aswell as application servers.Toprepare staff for a potential disaster, Elevations conductsmultipledisasterrecoverytestsperyearintroducingadditionalcomplexity during each test. Disaster Recovery tests areperformedatthebranchestoverifybusinessavailabilitytothehotsiteandtesttheexistingrecoveryprocedures.
Figure 4.2-3 Business Continuity Planning Process
BusinessContinuityPlanningProcess
Project PlanManagement
RiskAssessment
FinancialImpact
BusinessImpact
TrainingProject PlanManagement
ContinuousImprovement
AuditTrail
Exercise thePlan
TaskManagement
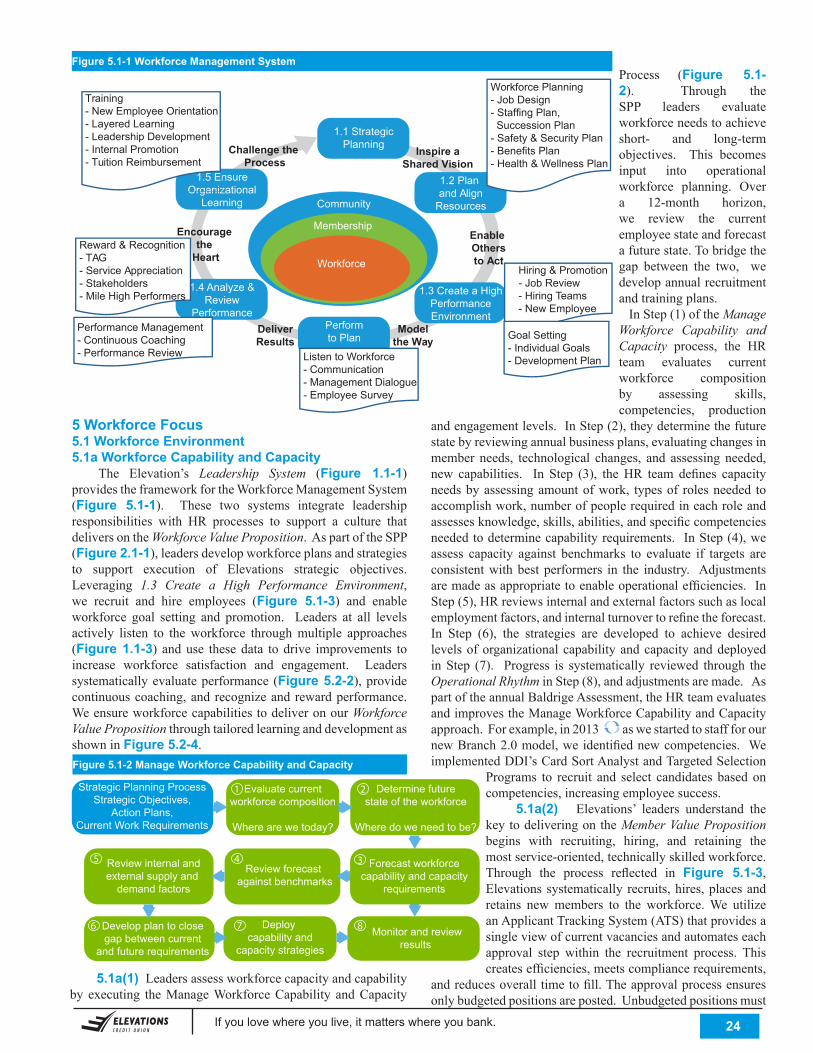
If you love where you live, it matters where you bank. . 24
Figure 5.1-1 Workforce Management System
5 Workforce Focus5.1 Workforce Environment5.1a Workforce Capability and Capacity The Elevation’s Leadership System (Figure 1.1-1)providestheframeworkfortheWorkforceManagementSystem(Figure 5.1-1). These two systems integrate leadershipresponsibilities with HR processes to support a culture thatdeliversontheWorkforce Value Proposition.AspartoftheSPP(Figure 2.1-1),leadersdevelopworkforceplansandstrategiesto support execution of Elevations strategic objectives.Leveraging 1.3 Create a High Performance Environment, we recruit and hire employees (Figure 5.1-3) and enableworkforce goal setting and promotion. Leaders at all levelsactively listen to theworkforce throughmultiple approaches(Figure 1.1-3) anduse thesedata todrive improvements toincrease workforce satisfaction and engagement. Leaderssystematicallyevaluateperformance(Figure 5.2-2),providecontinuouscoaching,andrecognizeandrewardperformance.WeensureworkforcecapabilitiestodeliveronourWorkforce Value Proposition throughtailoredlearninganddevelopmentasshowninFigure 5.2-4.Figure 5.1-2 Manage Workforce Capability and Capacity
Process (Figure 5.1-2). Through theSPP leaders evaluateworkforceneedstoachieveshort- and long-termobjectives. This becomesinput into operationalworkforce planning. Overa 12-month horizon,we review the currentemployeestateandforecastafuturestate.Tobridgethegap between the two, wedevelopannualrecruitmentandtrainingplans.InStep(1)oftheManage Workforce Capability and Capacity process, the HRteam evaluates currentworkforce compositionby assessing skills,competencies, production
andengagementlevels.InStep(2),theydeterminethefuturestatebyreviewingannualbusinessplans,evaluatingchangesinmember needs, technological changes, and assessing needed,new capabilities. In Step (3), theHR team defines capacityneedsbyassessingamountofwork, typesof rolesneeded toaccomplishwork,numberofpeoplerequiredineachroleandassessesknowledge,skills,abilities,andspecificcompetenciesneededtodeterminecapabilityrequirements. InStep(4),weassess capacity against benchmarks to evaluate if targets areconsistentwithbest performers in the industry. Adjustmentsaremadeasappropriatetoenableoperationalefficiencies.InStep(5),HRreviewsinternalandexternalfactorssuchaslocalemploymentfactors,andinternalturnovertorefinetheforecast.In Step (6), the strategies are developed to achieve desiredlevelsoforganizationalcapabilityandcapacityanddeployedinStep (7). Progress is systematically reviewed through theOperational RhythminStep(8),andadjustmentsaremade.AspartoftheannualBaldrigeAssessment,theHRteamevaluatesandimprovestheManageWorkforceCapabilityandCapacityapproach.Forexample,in2013 aswestartedtostaffforournewBranch2.0model,weidentifiednewcompetencies. WeimplementedDDI’sCardSortAnalystandTargetedSelection
Programs to recruit and select candidates basedoncompetencies,increasingemployeesuccess. 5.1a(2) Elevations’ leaders understand thekeytodeliveringontheMember Value Proposition begins with recruiting, hiring, and retaining themostservice-oriented,technicallyskilledworkforce.Through the process reflected in Figure 5.1-3, Elevationssystematicallyrecruits,hires,placesandretains newmembers to the workforce.We utilizeanApplicantTrackingSystem(ATS)thatprovidesasingleviewofcurrentvacanciesandautomateseachapproval step within the recruitment process. Thiscreatesefficiencies,meetscompliancerequirements,
andreducesoveralltimetofill.Theapprovalprocessensuresonlybudgetedpositionsareposted.Unbudgetedpositionsmust
Strategic Planning ProcessStrategic Objectives,
Action Plans,Current Work Requirements
Deploy capability and
capacity strategies
Monitor and reviewresults
Evaluate currentworkforce composition
Where are we today?
Determine futurestate of the workforce
Where do we need to be?
Review internal andexternal supply and
demand factors
Review forecast against benchmarks
Develop plan to close gap between current
and future requirements
Forecast workforcecapability and capacity
requirements
1 2
345
6 7 8
5.1a(1) Leadersassessworkforcecapacityandcapabilityby executing theManageWorkforceCapability andCapacity
Community
Membership
Workforce
1.1 StrategicPlanningChallenge the
ProcessInspire a
Shared Vision
Enable Othersto Act
Modelthe Way
DeliverResults
Encouragethe
Heart
1.2 Plan and Align
Resources
1.5 EnsureOrganizational
Learning
1.4 Analyze &Review
Performance
1.3 Create a HighPerformanceEnvironment
Performto Plan
tHiring & Promotion- Job Review- Hiring Teams- New Employee
1.5 EnOrganiz
Training- New Employee Orientation- Layered Learning- Leadership Development- Internal Promotion- Tuition Reimbursement
1
Reward & Recognition- TAG- Service Appreciation- Stakeholders- Mile High Performers
Performance Management- Continuous Coaching- Performance Review Listen to Workforce
- Communication- Management Dialogue- Employee Survey
Workforce Planning- Job Design- Staffing Plan, Succession Plan- Safety & Security Plan- Benefits Plan- Health & Wellness Plan
Goal Setting- Individual Goals- Development Plan
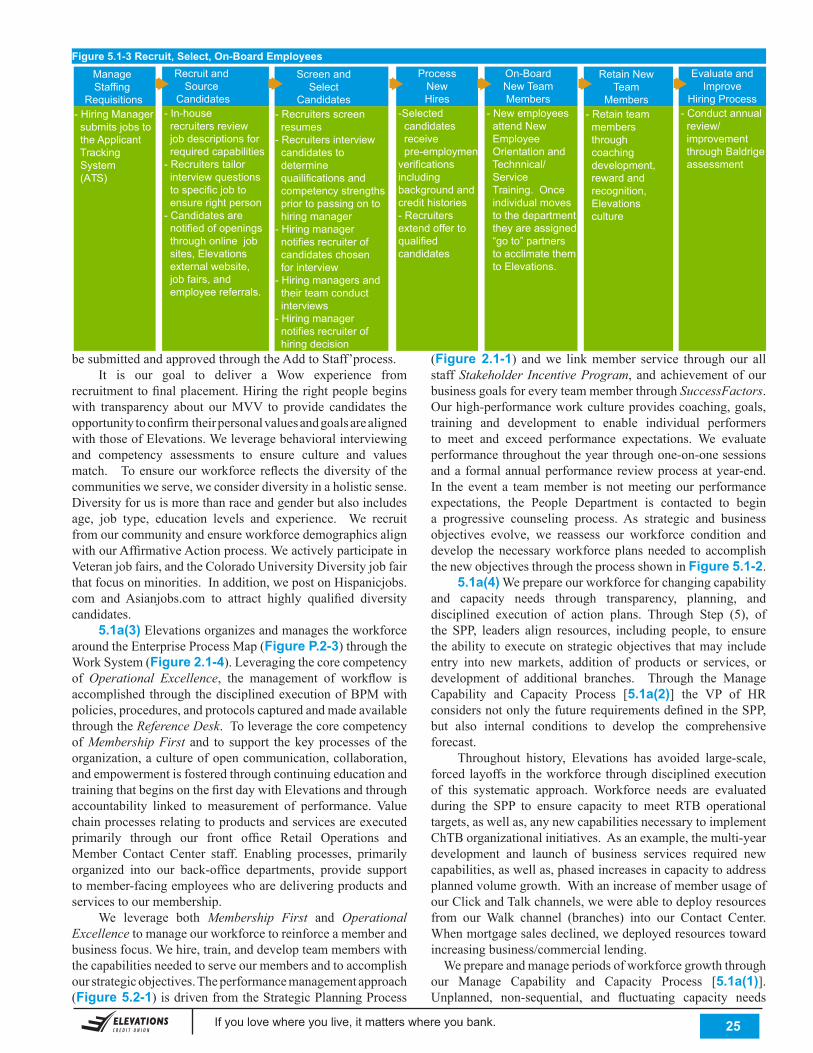
If you love where you live, it matters where you bank. . 25
besubmittedandapprovedthroughtheAddtoStaff’process. It is our goal to deliver a Wow experience fromrecruitmenttofinalplacement.Hiringtherightpeoplebeginswith transparency about ourMVV to provide candidates theopportunitytoconfirmtheirpersonalvaluesandgoalsarealignedwiththoseofElevations.Weleveragebehavioralinterviewingand competency assessments to ensure culture and valuesmatch. Toensureourworkforcereflects thediversityof thecommunitiesweserve,weconsiderdiversityinaholisticsense.Diversityforusismorethanraceandgenderbutalsoincludesage, job type, education levels and experience. We recruitfromourcommunityandensureworkforcedemographicsalignwithourAffirmativeActionprocess.WeactivelyparticipateinVeteranjobfairs,andtheColoradoUniversityDiversityjobfairthatfocusonminorities.Inaddition,wepostonHispanicjobs.com and Asianjobs.com to attract highly qualified diversitycandidates. 5.1a(3)ElevationsorganizesandmanagestheworkforcearoundtheEnterpriseProcessMap(Figure P.2-3)throughtheWorkSystem(Figure 2.1-4).Leveragingthecorecompetencyof Operational Excellence, the management of workflow isaccomplishedthroughthedisciplinedexecutionofBPMwithpolicies,procedures,andprotocolscapturedandmadeavailablethroughtheReference Desk.Toleveragethecorecompetencyof Membership First and to support thekeyprocessesof theorganization,acultureofopencommunication,collaboration,andempowermentisfosteredthroughcontinuingeducationandtrainingthatbeginsonthefirstdaywithElevationsandthroughaccountability linked to measurement of performance.Valuechainprocessesrelatingtoproductsandservicesareexecutedprimarily through our front office Retail Operations andMember Contact Center staff. Enabling processes, primarilyorganized into our back-office departments, provide supporttomember-facingemployeeswhoaredeliveringproductsandservicestoourmembership. We leverage both Membership First and Operational Excellencetomanageourworkforcetoreinforceamemberandbusinessfocus.Wehire,train,anddevelopteammemberswiththecapabilitiesneededtoserveourmembersandtoaccomplishourstrategicobjectives.Theperformancemanagementapproach(Figure 5.2-1)isdrivenfromtheStrategicPlanningProcess
Figure 5.1-3 Recruit, Select, On-Board Employees
- Hiring Manager submits jobs to the Applicant Tracking System (ATS)
Manage Staffing
Requisitions
Recruit and Source
Candidates- In-house recruiters review job descriptions for required capabilities- Recruiters tailor interview questions to specific job to ensure right person- Candidates are notified of openings through online job sites, Elevations external website, job fairs, and employee referrals.
- Recruiters screen resumes- Recruiters interview candidates to determine quailifications and competency strengths prior to passing on to hiring manager- Hiring manager notifies recruiter of candidates chosen for interview- Hiring managers and their team conduct interviews- Hiring manager notifies recruiter of hiring decision
Screen andSelect
Candidates
ProcessNewHires
-Selected candidates receive pre-employment verifications including background and credit histories- Recruiters extend offer to qualified candidates
On-BoardNew TeamMembers
- New employees attend New Employee Orientation and Technnical/ Service Training. Once individual moves to the department they are assigned “go to” partners to acclimate them to Elevations.
- Retain team members through coaching development, reward and recognition, Elevations culture
Retain NewTeam
Members
Evaluate andImprove
Hiring Process- Conduct annual review/ improvement through Baldrige assessment
(Figure 2.1-1) andwe linkmember service through our allstaff Stakeholder Incentive Program, andachievementofourbusinessgoalsforeveryteammemberthroughSuccessFactors.Ourhigh-performanceworkcultureprovidescoaching,goals,training and development to enable individual performersto meet and exceed performance expectations. We evaluateperformancethroughouttheyearthroughone-on-onesessionsandaformalannualperformancereviewprocessatyear-end.In the event a teammember is notmeetingour performanceexpectations, the People Department is contacted to begina progressive counseling process. As strategic and businessobjectives evolve, we reassess our workforce condition anddevelop thenecessaryworkforceplansneeded toaccomplishthenewobjectivesthroughtheprocessshowninFigure 5.1-2. 5.1a(4)Weprepareourworkforceforchangingcapabilityand capacity needs through transparency, planning, anddisciplined execution of action plans. Through Step (5), ofthe SPP, leaders align resources, including people, to ensuretheabilitytoexecuteonstrategicobjectivesthatmayincludeentry into newmarkets, addition of products or services, ordevelopment of additional branches. Through the ManageCapability and Capacity Process [5.1a(2)] the VP of HRconsidersnotonlythefuturerequirementsdefinedintheSPP,but also internal conditions to develop the comprehensiveforecast. Throughout history, Elevations has avoided large-scale,forcedlayoffs in theworkforcethroughdisciplinedexecutionof this systematic approach. Workforce needs are evaluatedduring the SPP to ensure capacity to meet RTB operationaltargets,aswellas,anynewcapabilitiesnecessarytoimplementChTBorganizationalinitiatives.Asanexample,themulti-yeardevelopment and launch of business services required newcapabilities,aswellas,phasedincreasesincapacitytoaddressplannedvolumegrowth.WithanincreaseofmemberusageofourClickandTalkchannels,wewereabletodeployresourcesfrom ourWalk channel (branches) into our Contact Center.Whenmortgagesalesdeclined,wedeployedresourcestowardincreasingbusiness/commerciallending.Weprepareandmanageperiodsofworkforcegrowththroughour Manage Capability and Capacity Process [5.1a(1)].Unplanned, non-sequential, and fluctuating capacity needs
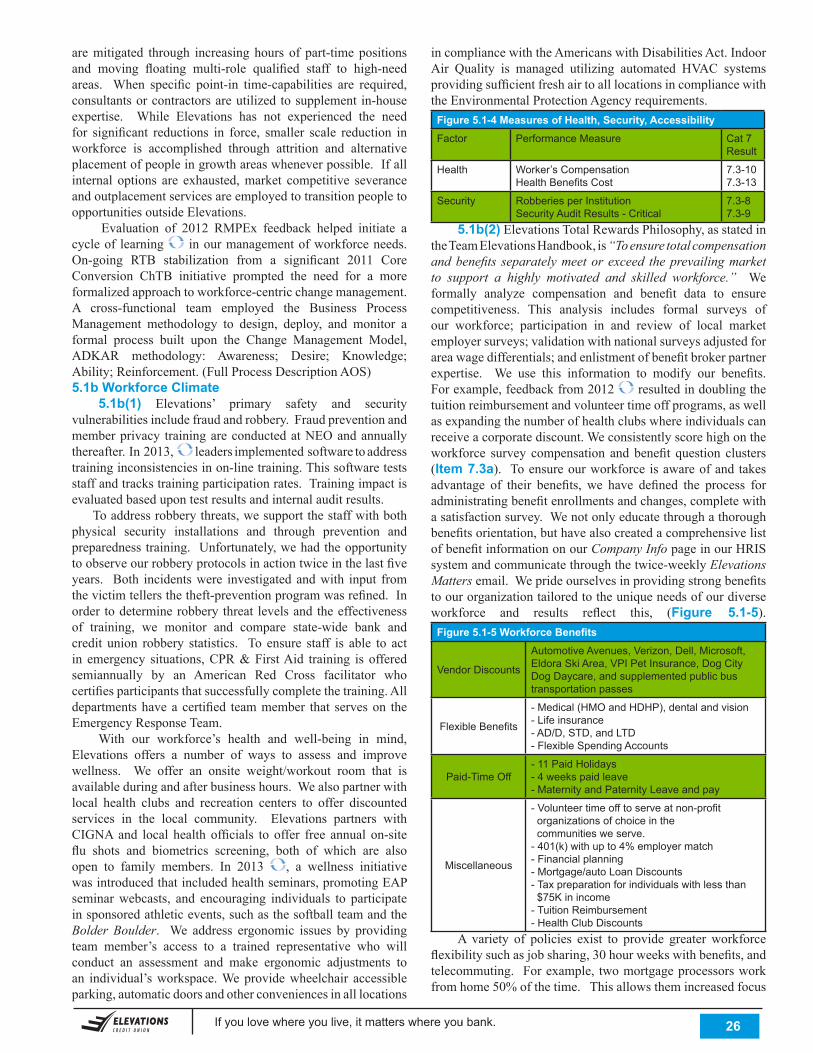
If you love where you live, it matters where you bank. . 26
aremitigated through increasing hours of part-timepositionsand moving floating multi-role qualified staff to high-needareas. When specific point-in time-capabilities are required,consultantsorcontractorsareutilizedtosupplementin-houseexpertise. While Elevations has not experienced the needfor significant reductions in force, smaller scale reduction inworkforce is accomplished through attrition and alternativeplacementofpeopleingrowthareaswheneverpossible.Ifallinternal options are exhausted,market competitive severanceandoutplacementservicesareemployedtotransitionpeopletoopportunitiesoutsideElevations. Evaluation of 2012 RMPEx feedback helped initiate acycleof learning inourmanagementofworkforceneeds.On-going RTB stabilization from a significant 2011 CoreConversion ChTB initiative prompted the need for a moreformalizedapproachtoworkforce-centricchangemanagement.A cross-functional team employed the Business ProcessManagement methodology to design, deploy, and monitor aformal process built upon the Change Management Model,ADKAR methodology: Awareness; Desire; Knowledge;Ability;Reinforcement.(FullProcessDescriptionAOS)5.1b Workforce Climate 5.1b(1) Elevations’ primary safety and securityvulnerabilitiesincludefraudandrobbery.Fraudpreventionandmemberprivacy trainingareconductedatNEOandannuallythereafter.In2013, leaders implemented software to address traininginconsistenciesinon-linetraining.Thissoftwaretestsstaffandtrackstrainingparticipationrates.Trainingimpactisevaluatedbasedupontestresultsandinternalauditresults.Toaddressrobberythreats,wesupportthestaffwithbothphysical security installations and through prevention andpreparednesstraining.Unfortunately,wehadtheopportunitytoobserveourrobberyprotocolsinactiontwiceinthelastfiveyears. Both incidentswere investigatedandwith input fromthevictimtellersthetheft-preventionprogramwasrefined.Inorder todeterminerobberythreat levelsandtheeffectivenessof training, we monitor and compare state-wide bank andcredit union robbery statistics. To ensure staff is able to actin emergency situations,CPR&FirstAid training is offeredsemiannually by an American Red Cross facilitator whocertifiesparticipantsthatsuccessfullycompletethetraining.Alldepartmentshaveacertified teammember that serveson theEmergencyResponseTeam. With our workforce’s health and well-being in mind,Elevations offers a number of ways to assess and improvewellness. We offer an onsite weight/workout room that isavailableduringandafterbusinesshours.Wealsopartnerwithlocal health clubs and recreation centers to offer discountedservices in the local community. Elevations partners withCIGNAand local health officials to offer free annual on-siteflu shots and biometrics screening, both of which are alsoopen to family members. In 2013 , a wellness initiative wasintroducedthatincludedhealthseminars,promotingEAPseminarwebcasts, and encouraging individuals to participateinsponsoredathleticevents,suchasthesoftballteamandtheBolder Boulder. We address ergonomic issues by providingteam member’s access to a trained representative who willconduct an assessment and make ergonomic adjustments toan individual’sworkspace.Weprovidewheelchair accessibleparking,automaticdoorsandotherconveniencesinalllocations
incompliancewiththeAmericanswithDisabilitiesAct.IndoorAir Quality is managed utilizing automated HVAC systemsprovidingsufficientfreshairtoalllocationsincompliancewiththeEnvironmentalProtectionAgencyrequirements.
Figure 5.1-4 Measures of Health, Security, AccessibilityFactor Performance Measure Cat 7
Result
Health Worker’s CompensationHealth Benefits Cost
7.3-107.3-13
Security Robberies per InstitutionSecurity Audit Results - Critical
7.3-87.3-9
5.1b(2)ElevationsTotalRewardsPhilosophy,asstatedintheTeamElevationsHandbook,is“To ensure total compensation and benefits separately meet or exceed the prevailing market to support a highly motivated and skilled workforce.” We formally analyze compensation and benefit data to ensurecompetitiveness. This analysis includes formal surveys ofour workforce; participation in and review of local marketemployersurveys;validationwithnationalsurveysadjustedforareawagedifferentials;andenlistmentofbenefitbrokerpartnerexpertise. We use this information to modify our benefits.Forexample,feedbackfrom2012 resultedindoublingthetuitionreimbursementandvolunteertimeoffprograms,aswellasexpandingthenumberofhealthclubswhereindividualscanreceiveacorporatediscount.Weconsistentlyscorehighontheworkforce survey compensation andbenefit question clusters(Item 7.3a). Toensureourworkforce isawareofandtakesadvantage of their benefits, we have defined the process foradministratingbenefitenrollmentsandchanges,completewithasatisfactionsurvey.Wenotonlyeducatethroughathoroughbenefitsorientation,buthavealsocreatedacomprehensivelistofbenefitinformationonourCompany InfopageinourHRISsystemandcommunicatethroughthetwice-weeklyElevations Mattersemail.Weprideourselvesinprovidingstrongbenefitstoourorganizationtailoredtotheuniqueneedsofourdiverseworkforce and results reflect this, (Figure 5.1-5).
Figure 5.1-5 Workforce Benefits
Vendor Discounts
Automotive Avenues, Verizon, Dell, Microsoft, Eldora Ski Area, VPI Pet Insurance, Dog City Dog Daycare, and supplemented public bus transportation passes
Flexible Benefits
- Medical (HMO and HDHP), dental and vision- Life insurance- AD/D, STD, and LTD- Flexible Spending Accounts
Paid-Time Off- 11 Paid Holidays- 4 weeks paid leave- Maternity and Paternity Leave and pay
Miscellaneous
- Volunteer time off to serve at non-profit organizations of choice in the communities we serve.- 401(k) with up to 4% employer match- Financial planning- Mortgage/auto Loan Discounts- Tax preparation for individuals with less than $75K in income- Tuition Reimbursement- Health Club Discounts
A variety of policies exist to provide greaterworkforceflexibilitysuchasjobsharing,30hourweekswithbenefits,andtelecommuting. Forexample, twomortgageprocessorsworkfromhome50%ofthetime.Thisallowsthemincreasedfocus
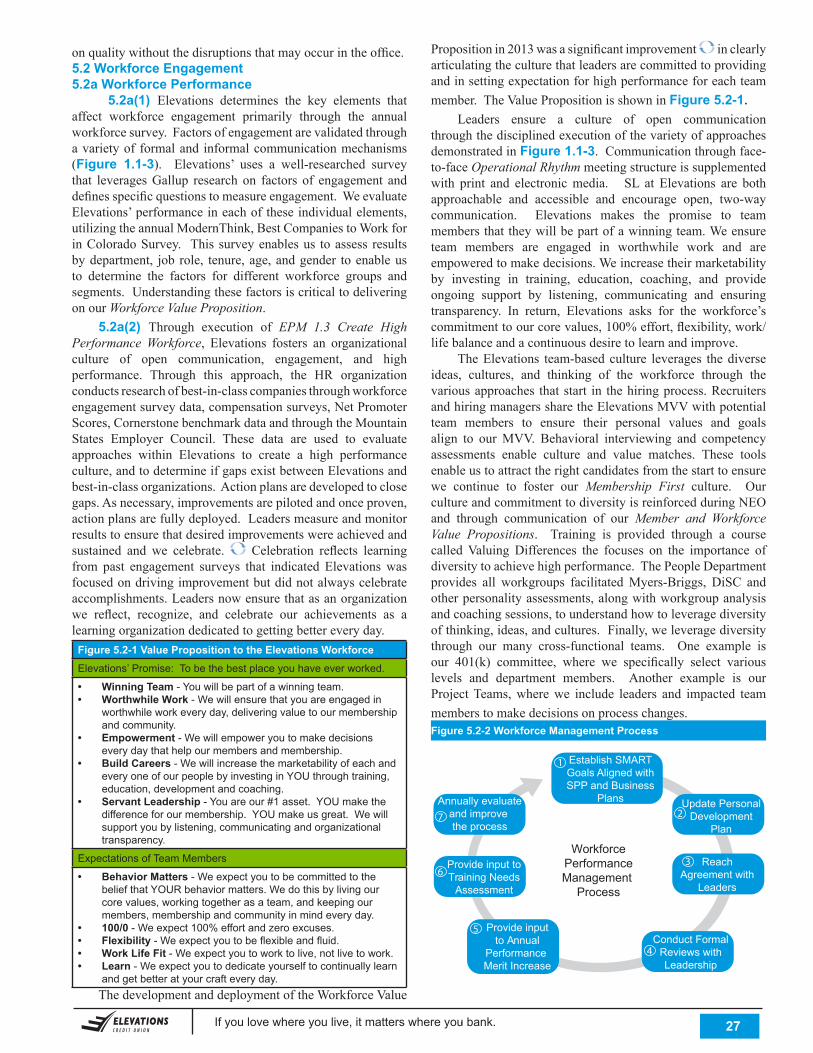
If you love where you live, it matters where you bank. . 27
onqualitywithoutthedisruptionsthatmayoccurintheoffice.5.2 Workforce Engagement5.2a Workforce Performance 5.2a(1) Elevations determines the key elements thataffect workforce engagement primarily through the annualworkforcesurvey.Factorsofengagementarevalidatedthroughavarietyof formaland informalcommunicationmechanisms(Figure 1.1-3). Elevations’ uses a well-researched surveythat leveragesGallup research on factors of engagement anddefinesspecificquestionstomeasureengagement.WeevaluateElevations’performanceineachoftheseindividualelements,utilizingtheannualModernThink,BestCompaniestoWorkforinColoradoSurvey. Thissurveyenablesus toassess resultsbydepartment, job role, tenure,age,andgender toenableusto determine the factors for different workforce groups andsegments.UnderstandingthesefactorsiscriticaltodeliveringonourWorkforce Value Proposition. 5.2a(2) Through execution of EPM 1.3 Create High Performance Workforce, Elevations fosters an organizationalculture of open communication, engagement, and highperformance. Through this approach, the HR organizationconductsresearchofbest-in-classcompaniesthroughworkforceengagementsurveydata,compensationsurveys,NetPromoterScores,CornerstonebenchmarkdataandthroughtheMountainStates Employer Council. These data are used to evaluateapproaches within Elevations to create a high performanceculture,andtodetermineifgapsexistbetweenElevationsandbest-in-classorganizations.Actionplansaredevelopedtoclosegaps.Asnecessary,improvementsarepilotedandonceproven,actionplansarefullydeployed.Leadersmeasureandmonitorresultstoensurethatdesiredimprovementswereachievedandsustained and we celebrate. Celebration reflects learningfrom past engagement surveys that indicated Elevationswasfocusedondrivingimprovementbutdidnotalwayscelebrateaccomplishments.Leadersnowensurethatasanorganizationwe reflect, recognize, and celebrate our achievements as alearningorganizationdedicatedtogettingbettereveryday.
Figure 5.2-1 Value Proposition to the Elevations WorkforceElevations’ Promise: To be the best place you have ever worked.
• Winning Team - You will be part of a winning team.• Worthwhile Work - We will ensure that you are engaged in
worthwhile work every day, delivering value to our membership and community.
• Empowerment - We will empower you to make decisions every day that help our members and membership.
• Build Careers - We will increase the marketability of each and every one of our people by investing in YOU through training, education, development and coaching.
• Servant Leadership - You are our #1 asset. YOU make the difference for our membership. YOU make us great. We will support you by listening, communicating and organizational transparency.
Expectations of Team Members
• Behavior Matters - We expect you to be committed to the belief that YOUR behavior matters. We do this by living our core values, working together as a team, and keeping our members, membership and community in mind every day.
• 100/0 - We expect 100% effort and zero excuses.• Flexibility - We expect you to be flexible and fluid.• Work Life Fit - We expect you to work to live, not live to work.• Learn - We expect you to dedicate yourself to continually learn
and get better at your craft every day. ThedevelopmentanddeploymentoftheWorkforceValue
Propositionin2013wasasignificantimprovement inclearlyarticulatingtheculturethatleadersarecommittedtoprovidingandinsettingexpectationforhighperformanceforeachteammember.TheValuePropositionisshowninFigure 5.2-1. Leaders ensure a culture of open communicationthroughthedisciplinedexecutionofthevarietyofapproachesdemonstrated in Figure 1.1-3.Communicationthroughface-to-faceOperational Rhythmmeetingstructureissupplementedwith print and electronicmedia. SL at Elevations are bothapproachable and accessible and encourage open, two-waycommunication. Elevations makes the promise to teammembersthattheywillbepartofawinningteam.Weensureteam members are engaged in worthwhile work and areempoweredtomakedecisions.Weincreasetheirmarketabilityby investing in training, education, coaching, and provideongoing support by listening, communicating and ensuringtransparency. In return, Elevations asks for the workforce’scommitmenttoourcorevalues,100%effort,flexibility,work/lifebalanceandacontinuousdesiretolearnandimprove. TheElevations team-basedculture leverages thediverseideas, cultures, and thinking of the workforce through thevariousapproaches thatstart in thehiringprocess.RecruitersandhiringmanagerssharetheElevationsMVVwithpotentialteam members to ensure their personal values and goalsalign to ourMVV. Behavioral interviewing and competencyassessments enable culture and value matches. These toolsenableustoattracttherightcandidatesfromthestarttoensurewe continue to foster our Membership First culture. OurcultureandcommitmenttodiversityisreinforcedduringNEOand through communication of our Member and Workforce Value Propositions. Training is provided through a coursecalledValuingDifferences the focuses on the importance ofdiversitytoachievehighperformance.ThePeopleDepartmentprovides all workgroups facilitatedMyers-Briggs, DiSC andotherpersonalityassessments,alongwithworkgroupanalysisandcoachingsessions,tounderstandhowtoleveragediversityofthinking,ideas,andcultures.Finally,weleveragediversitythrough our many cross-functional teams. One example isour 401(k) committee, where we specifically select variouslevels and department members. Another example is ourProjectTeams,wherewe include leaders and impacted teammemberstomakedecisionsonprocesschanges. Figure 5.2-2 Workforce Management Process
Conduct FormalReviews withLeadership
Provide input to Annual
Performance Merit Increase
Provide input toTraining Needs
Assessment
Annually evaluateand improve the process
Establish SMARTGoals Aligned withSPP and Business
Plans Update PersonalDevelopment
Plan
ReachAgreement with
Leaders
WorkforcePerformanceManagement
Process
1
2
3
4
5
6
7
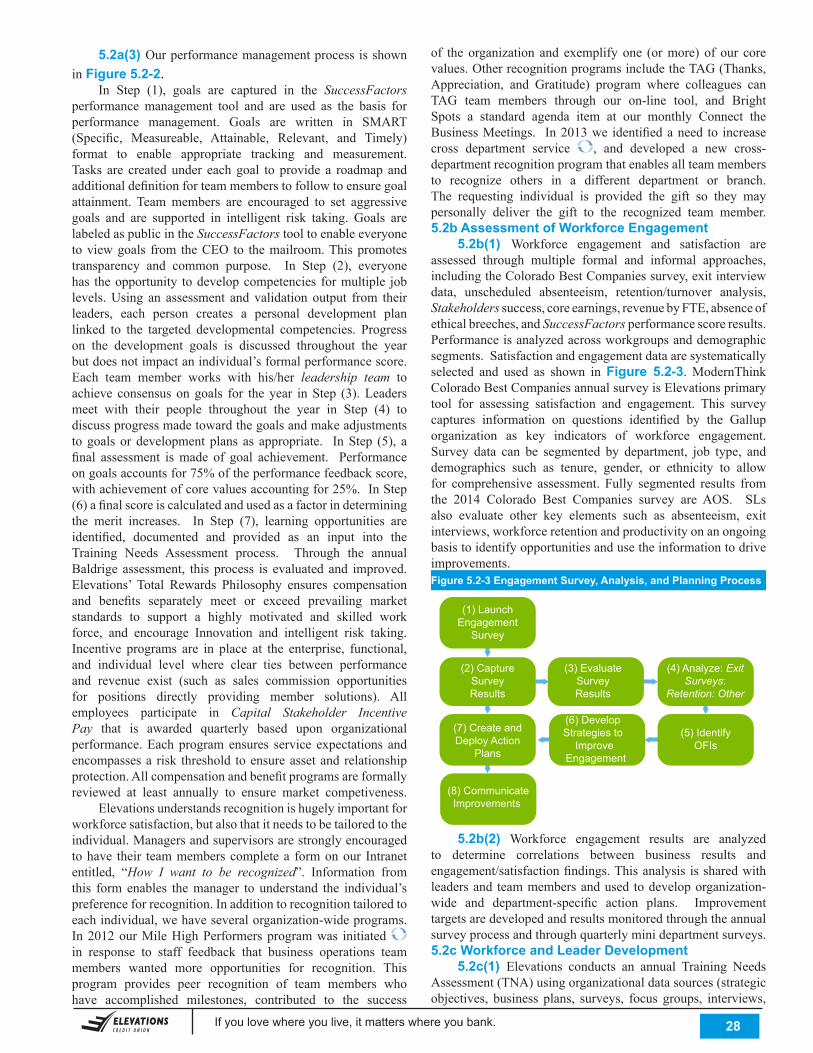
If you love where you live, it matters where you bank. . 28
5.2a(3) Ourperformancemanagementprocessisshownin Figure 5.2-2. In Step (1), goals are captured in the SuccessFactors performancemanagement tool and are used as the basis forperformance management. Goals are written in SMART(Specific, Measureable, Attainable, Relevant, and Timely)format to enable appropriate tracking and measurement.Tasks are createdunder eachgoal to provide a roadmap andadditionaldefinitionforteammemberstofollowtoensuregoalattainment. Teammembers are encouraged to set aggressivegoals and are supported in intelligent risk taking. Goals arelabeledaspublicintheSuccessFactorstooltoenableeveryonetoviewgoals from theCEOto themailroom.Thispromotestransparency and common purpose. In Step (2), everyonehas theopportunity todevelopcompetencies formultiple joblevels.Using an assessment and validation output from theirleaders, each person creates a personal development planlinked to the targeted developmental competencies. Progresson the development goals is discussed throughout the yearbutdoesnotimpactanindividual’sformalperformancescore.Each team member works with his/her leadership team to achieve consensusongoals for theyear inStep (3).Leadersmeet with their people throughout the year in Step (4) todiscussprogressmadetowardthegoalsandmakeadjustmentstogoals or developmentplans as appropriate. InStep (5), afinal assessment ismade of goal achievement. Performanceongoalsaccountsfor75%oftheperformancefeedbackscore,withachievementofcorevaluesaccountingfor25%.InStep(6)afinalscoreiscalculatedandusedasafactorindeterminingthe merit increases. In Step (7), learning opportunities areidentified, documented and provided as an input into theTraining Needs Assessment process. Through the annualBaldrige assessment, thisprocess is evaluated and improved.Elevations’ Total Rewards Philosophy ensures compensationand benefits separately meet or exceed prevailing marketstandards to support a highly motivated and skilled workforce, and encourage Innovation and intelligent risk taking.Incentive programs are in place at the enterprise, functional,and individual level where clear ties between performanceand revenue exist (such as sales commission opportunitiesfor positions directly providing member solutions). Allemployees participate in Capital Stakeholder Incentive Pay that is awarded quarterly based upon organizationalperformance.Eachprogramensures service expectations andencompassesa risk threshold toensureassetandrelationshipprotection.Allcompensationandbenefitprogramsareformallyreviewed at least annually to ensure market competiveness. Elevationsunderstandsrecognitionishugelyimportantforworkforcesatisfaction,butalsothatitneedstobetailoredtotheindividual.Managersandsupervisorsarestronglyencouragedtohave their teammemberscompletea formonour Intranetentitled, “How I want to be recognized”. Information fromthis form enables themanager to understand the individual’spreferenceforrecognition.Inadditiontorecognitiontailoredtoeachindividual,wehaveseveralorganization-wideprograms.In2012ourMileHighPerformersprogramwas initiated in response to staff feedback that business operations teammembers wanted more opportunities for recognition. Thisprogram provides peer recognition of team members whohave accomplished milestones, contributed to the success
of the organization and exemplify one (ormore) of our corevalues.OtherrecognitionprogramsincludetheTAG(Thanks,Appreciation, and Gratitude) program where colleagues canTAG team members through our on-line tool, and BrightSpots a standard agenda item at our monthly Connect theBusinessMeetings. In2013we identifiedaneed to increasecross department service , and developed a new cross-departmentrecognitionprogramthatenablesallteammembersto recognize others in a different department or branch.The requesting individual is provided the gift so they maypersonally deliver the gift to the recognized team member.5.2b Assessment of Workforce Engagement 5.2b(1) Workforce engagement and satisfaction areassessed through multiple formal and informal approaches,includingtheColoradoBestCompaniessurvey,exitinterviewdata, unscheduled absenteeism, retention/turnover analysis,Stakeholders success,coreearnings,revenuebyFTE,absenceofethicalbreeches,andSuccessFactorsperformancescoreresults.Performanceisanalyzedacrossworkgroupsanddemographicsegments.Satisfactionandengagementdataaresystematicallyselected and used as shown inFigure 5.2-3.ModernThinkColoradoBestCompaniesannualsurveyisElevationsprimarytool for assessing satisfaction and engagement. This surveycaptures information on questions identified by the Galluporganization as key indicators of workforce engagement.Survey data can be segmented by department, job type, anddemographics such as tenure, gender, or ethnicity to allowfor comprehensive assessment. Fully segmented results fromthe 2014 Colorado Best Companies survey are AOS. SLsalso evaluate other key elements such as absenteeism, exitinterviews,workforceretentionandproductivityonanongoingbasistoidentifyopportunitiesandusetheinformationtodriveimprovements.Figure 5.2-3 Engagement Survey, Analysis, and Planning Process
5.2b(2) Workforce engagement results are analyzedto determine correlations between business results andengagement/satisfactionfindings.Thisanalysis issharedwithleadersand teammembersandused todeveloporganization-wide and department-specific action plans. Improvementtargetsaredevelopedandresultsmonitoredthroughtheannualsurveyprocessandthroughquarterlyminidepartmentsurveys.5.2c Workforce and Leader Development 5.2c(1) Elevations conducts an annual Training NeedsAssessment(TNA)usingorganizationaldatasources(strategicobjectives, business plans, surveys, focus groups, interviews,
(3) EvaluateSurveyResults
(4) Analyze: ExitSurveys:
Retention: Other
(5) IdentifyOFIs
(6) Develop Strategies to
Improve Engagement
(7) Create andDeploy Action
Plans
(8) CommunicateImprovements
(1) LaunchEngagement
Survey
(2) CaptureSurveyResults
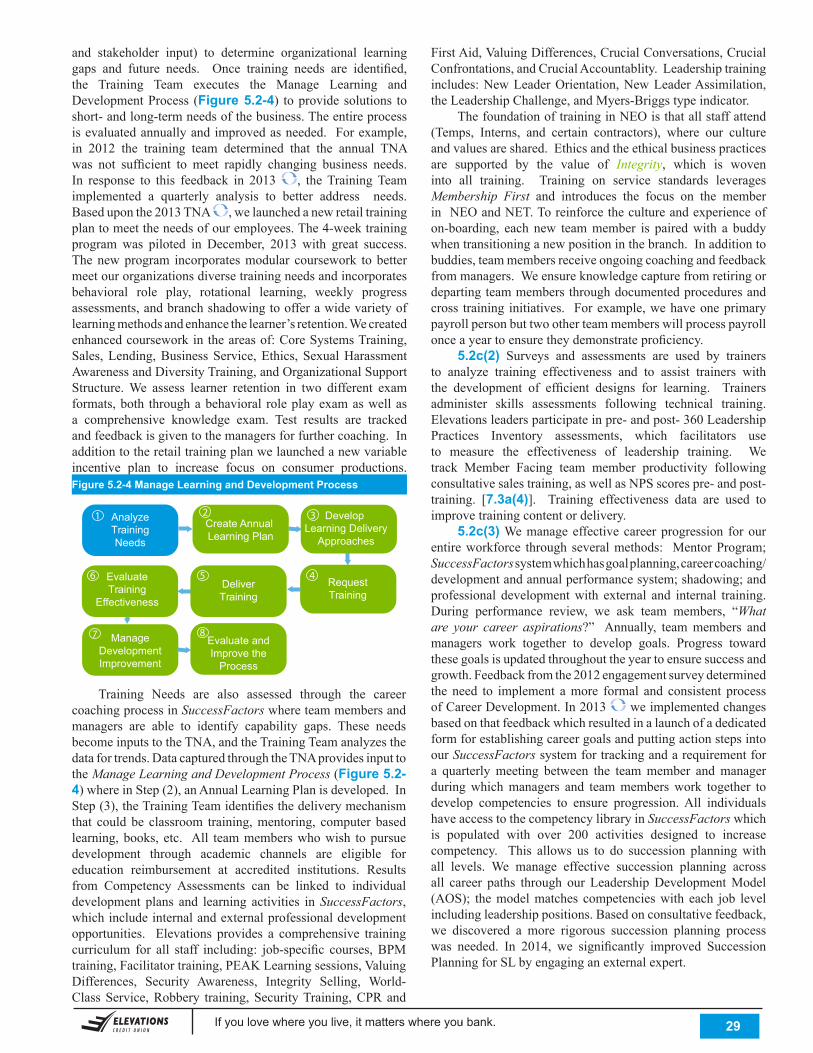
If you love where you live, it matters where you bank. . 29
Training Needs are also assessed through the careercoachingprocessinSuccessFactorswhereteammembersandmanagers are able to identify capability gaps. These needsbecomeinputstotheTNA,andtheTrainingTeamanalyzesthedatafortrends.DatacapturedthroughtheTNAprovidesinputtotheManage Learning and Development Process(Figure 5.2-4)whereinStep(2),anAnnualLearningPlanisdeveloped.InStep(3),theTrainingTeamidentifiesthedeliverymechanismthat couldbe classroom training,mentoring, computer basedlearning,books, etc. All teammemberswhowish topursuedevelopment through academic channels are eligible foreducation reimbursement at accredited institutions. Resultsfrom Competency Assessments can be linked to individualdevelopment plans and learning activities inSuccessFactors, whichincludeinternalandexternalprofessionaldevelopmentopportunities. Elevations provides a comprehensive trainingcurriculum for all staff including: job-specific courses,BPMtraining,Facilitatortraining,PEAKLearningsessions,ValuingDifferences, Security Awareness, Integrity Selling, World-ClassService,Robbery training,SecurityTraining,CPRand
and stakeholder input) to determine organizational learninggaps and future needs. Once training needs are identified,the Training Team executes the Manage Learning andDevelopmentProcess (Figure 5.2-4) toprovidesolutions toshort-andlong-termneedsofthebusiness.Theentireprocessisevaluatedannuallyandimprovedasneeded. Forexample,in 2012 the training team determined that the annual TNAwas not sufficient to meet rapidly changing business needs.In response to this feedback in 2013 , theTrainingTeamimplemented a quarterly analysis to better address needs.Baseduponthe2013TNA ,welaunchedanewretailtrainingplantomeettheneedsofouremployees.The4-weektrainingprogramwas piloted in December, 2013 with great success.Thenewprogram incorporatesmodular coursework tobettermeetourorganizationsdiversetrainingneedsandincorporatesbehavioral role play, rotational learning, weekly progressassessments,andbranchshadowingtoofferawidevarietyoflearningmethodsandenhancethelearner’sretention.Wecreatedenhancedcourseworkintheareasof:CoreSystemsTraining,Sales,Lending,BusinessService,Ethics,SexualHarassmentAwarenessandDiversityTraining,andOrganizationalSupportStructure.We assess learner retention in two different examformats,both throughabehavioral roleplayexamaswellasa comprehensive knowledge exam. Test results are trackedandfeedbackisgiventothemanagersforfurthercoaching.Inadditiontotheretailtrainingplanwelaunchedanewvariableincentive plan to increase focus on consumer productions.Figure 5.2-4 Manage Learning and Development Process
FirstAid,ValuingDifferences,CrucialConversations,CrucialConfrontations,andCrucialAccountablity.Leadershiptrainingincludes:NewLeaderOrientation,NewLeaderAssimilation,theLeadershipChallenge,andMyers-Briggstypeindicator. ThefoundationoftraininginNEOisthatallstaffattend(Temps, Interns, and certain contractors), where our cultureandvaluesareshared.Ethicsandtheethicalbusinesspracticesare supported by the value of Integrity, which is woveninto all training. Training on service standards leveragesMembership First and introduces the focus on the memberinNEOandNET.Toreinforcethecultureandexperienceofon-boarding, each new teammember is pairedwith a buddywhentransitioninganewpositioninthebranch.Inadditiontobuddies,teammembersreceiveongoingcoachingandfeedbackfrommanagers.Weensureknowledgecapturefromretiringordepartingteammembersthroughdocumentedproceduresandcross training initiatives. Forexample,wehaveoneprimarypayrollpersonbuttwootherteammemberswillprocesspayrollonceayeartoensuretheydemonstrateproficiency. 5.2c(2) Surveys and assessments are used by trainersto analyze training effectiveness and to assist trainers withthe development of efficient designs for learning. Trainersadminister skills assessments following technical training.Elevationsleadersparticipateinpre-andpost-360LeadershipPractices Inventory assessments, which facilitators useto measure the effectiveness of leadership training. Wetrack Member Facing team member productivity followingconsultativesalestraining,aswellasNPSscorespre-andpost-training. [7.3a(4)]. Training effectiveness data are used toimprovetrainingcontentordelivery. 5.2c(3)Wemanageeffectivecareerprogression forourentireworkforce throughseveralmethods: MentorProgram;SuccessFactors systemwhichhasgoalplanning,careercoaching/developmentandannualperformancesystem;shadowing;andprofessional developmentwith external and internal training.During performance review, we ask team members, “What are your career aspirations?” Annually, teammembers andmanagers work together to develop goals. Progress towardthesegoalsisupdatedthroughouttheyeartoensuresuccessandgrowth.Feedbackfromthe2012engagementsurveydeterminedthe need to implement amore formal and consistent processofCareerDevelopment.In2013 weimplementedchangesbasedonthatfeedbackwhichresultedinalaunchofadedicatedformforestablishingcareergoalsandputtingactionstepsintoourSuccessFactorssystemfortrackingandarequirementfora quarterlymeeting between the teammember andmanagerduringwhichmanagers and teammemberswork together todevelop competencies to ensure progression.All individualshaveaccesstothecompetencylibraryinSuccessFactorswhichis populated with over 200 activities designed to increasecompetency. This allows us to do succession planningwithall levels. We manage effective succession planning acrossall career paths through our LeadershipDevelopmentModel(AOS); themodelmatches competencieswith each job levelincludingleadershippositions.Basedonconsultativefeedback,we discovered a more rigorous succession planning processwas needed. In 2014, we significantly improved SuccessionPlanningforSLbyengaginganexternalexpert.
RequestTraining
DeliverTraining
EvaluateTraining
Effectiveness
ManageDevelopmentImprovement
AnalyzeTrainingNeeds
1
456
7
Create Annual Learning Plan
2 Develop Learning Delivery
Approaches
3
Evaluate andImprove the
Process
8
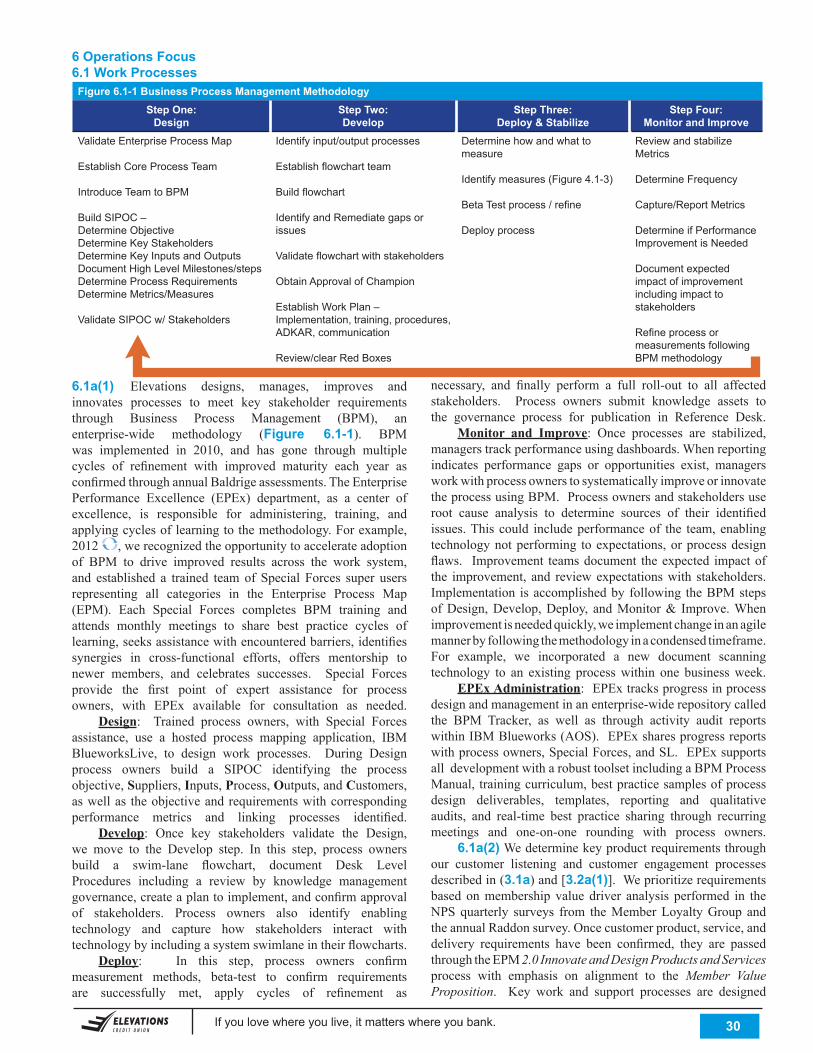
If you love where you live, it matters where you bank. . 30
6 Operations Focus 6.1 Work Processes
6.1a(1) Elevations designs, manages, improves and innovates processes to meet key stakeholder requirementsthrough Business Process Management (BPM), anenterprise-wide methodology (Figure 6.1-1). BPMwas implemented in 2010, and has gone through multiplecycles of refinement with improved maturity each year asconfirmedthroughannualBaldrigeassessments.TheEnterprisePerformance Excellence (EPEx) department, as a center ofexcellence, is responsible for administering, training, andapplyingcyclesoflearningtothemethodology.Forexample,2012 ,werecognizedtheopportunitytoaccelerateadoptionof BPM to drive improved results across the work system,and established a trained teamof Special Forces super usersrepresenting all categories in the Enterprise Process Map(EPM). Each Special Forces completes BPM training andattends monthly meetings to share best practice cycles oflearning,seeksassistancewithencounteredbarriers,identifiessynergies in cross-functional efforts, offers mentorship tonewer members, and celebrates successes. Special Forcesprovide the first point of expert assistance for processowners, with EPEx available for consultation as needed. Design: Trained process owners, with Special Forcesassistance, use a hosted process mapping application, IBMBlueworksLive, to design work processes. During Designprocess owners build a SIPOC identifying the processobjective,Suppliers,Inputs,Process,Outputs,andCustomers,aswellas theobjectiveandrequirementswithcorrespondingperformance metrics and linking processes identified. Develop: Once key stakeholders validate the Design,we move to the Develop step. In this step, process ownersbuild a swim-lane flowchart, document Desk LevelProcedures including a review by knowledge managementgovernance,createaplantoimplement,andconfirmapprovalof stakeholders. Process owners also identify enablingtechnology and capture how stakeholders interact withtechnologybyincludingasystemswimlaneintheirflowcharts. Deploy: In this step, process owners confirmmeasurement methods, beta-test to confirm requirementsare successfully met, apply cycles of refinement as
necessary, and finally perform a full roll-out to all affectedstakeholders. Process owners submit knowledge assets tothe governance process for publication in Reference Desk. Monitor and Improve: Once processes are stabilized,managerstrackperformanceusingdashboards.Whenreportingindicates performance gaps or opportunities exist, managersworkwithprocessownerstosystematicallyimproveorinnovatetheprocessusingBPM.Processownersandstakeholdersuseroot cause analysis to determine sources of their identifiedissues.Thiscould includeperformanceof the team,enablingtechnologynotperforming toexpectations,orprocessdesignflaws. Improvement teamsdocument theexpected impactofthe improvement, and reviewexpectationswith stakeholders.Implementation isaccomplishedby following theBPMstepsofDesign,Develop,Deploy, andMonitor& Improve.Whenimprovementisneededquickly,weimplementchangeinanagilemannerbyfollowingthemethodologyinacondensedtimeframe.For example, we incorporated a new document scanningtechnology to an existing processwithin one businessweek. EPEx Administration:EPExtracksprogressinprocessdesignandmanagementinanenterprise-widerepositorycalledthe BPM Tracker, as well as through activity audit reportswithinIBMBlueworks(AOS).EPExsharesprogressreportswithprocessowners,SpecialForces,andSL.EPExsupportsalldevelopmentwitharobusttoolsetincludingaBPMProcessManual,trainingcurriculum,bestpracticesamplesofprocessdesign deliverables, templates, reporting and qualitativeaudits, and real-time best practice sharing through recurringmeetings and one-on-one rounding with process owners. 6.1a(2)Wedeterminekeyproductrequirementsthroughour customer listening and customer engagement processesdescribedin(3.1a)and[3.2a(1)].Weprioritizerequirementsbased onmembership value driver analysis performed in theNPSquarterly surveys from theMemberLoyaltyGroup andtheannualRaddonsurvey.Oncecustomerproduct,service,anddelivery requirements have been confirmed, they are passedthroughtheEPM2.0 Innovate and Design Products and Services process with emphasis on alignment to the Member Value Proposition. Key work and support processes are designed
Figure 6.1-1 Business Process Management MethodologyStep One:
DesignStep Two: Develop
Step Three:Deploy & Stabilize
Step Four:Monitor and Improve
Validate Enterprise Process Map
Establish Core Process Team
Introduce Team to BPM
Build SIPOC –Determine ObjectiveDetermine Key StakeholdersDetermine Key Inputs and OutputsDocument High Level Milestones/stepsDetermine Process RequirementsDetermine Metrics/Measures
Validate SIPOC w/ Stakeholders
Identify input/output processes
Establish flowchart team
Build flowchart
Identify and Remediate gaps or issues
Validate flowchart with stakeholders
Obtain Approval of Champion
Establish Work Plan – Implementation, training, procedures, ADKAR, communication
Review/clear Red Boxes
Determine how and what to measure
Identify measures (Figure 4.1-3)
Beta Test process / refine
Deploy process
Review and stabilize Metrics
Determine Frequency
Capture/Report Metrics
Determine if Performance Improvement is Needed
Document expected impact of improvement including impact to stakeholders
Refine process or measurements following BPM methodology
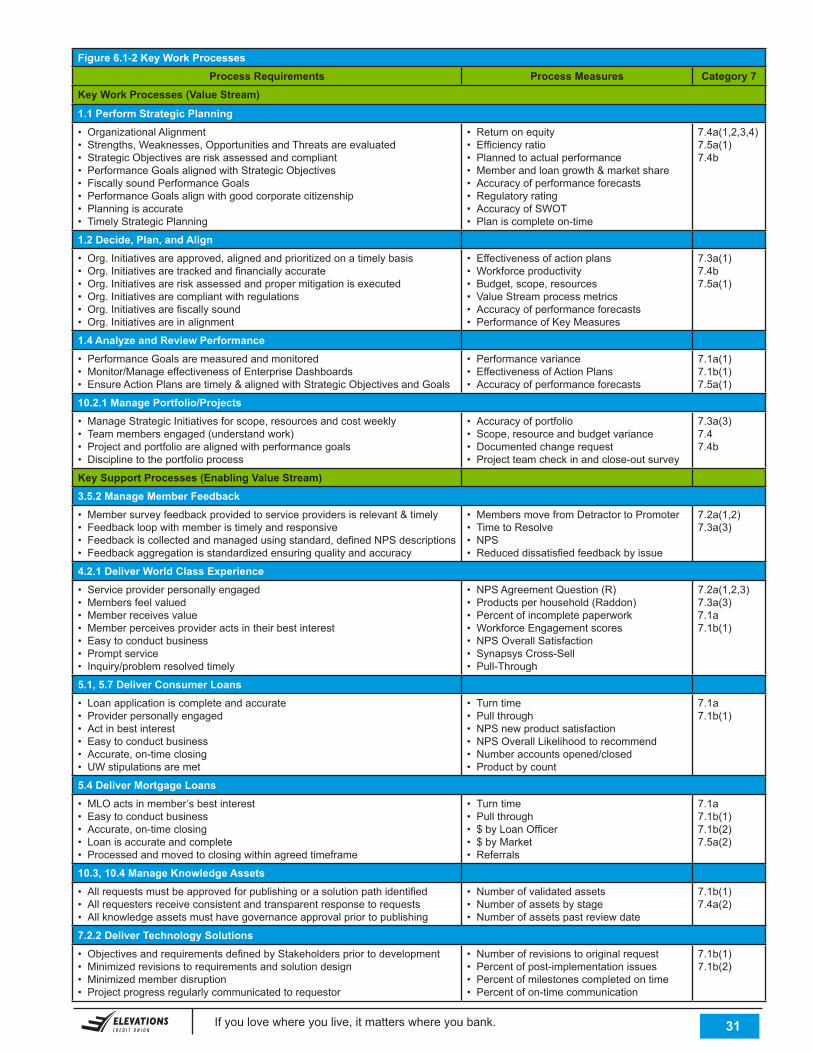
If you love where you live, it matters where you bank. . 31
Figure 6.1-2 Key Work ProcessesProcess Requirements Process Measures Category 7
Key Work Processes (Value Stream)
1.1 Perform Strategic Planning• Organizational Alignment• Strengths, Weaknesses, Opportunities and Threats are evaluated • Strategic Objectives are risk assessed and compliant• Performance Goals aligned with Strategic Objectives• Fiscally sound Performance Goals • Performance Goals align with good corporate citizenship• Planning is accurate• Timely Strategic Planning
• Return on equity• Efficiency ratio• Planned to actual performance• Member and loan growth & market share• Accuracy of performance forecasts• Regulatory rating• Accuracy of SWOT• Plan is complete on-time
7.4a(1,2,3,4)7.5a(1)7.4b
1.2 Decide, Plan, and Align• Org. Initiatives are approved, aligned and prioritized on a timely basis• Org. Initiatives are tracked and financially accurate • Org. Initiatives are risk assessed and proper mitigation is executed• Org. Initiatives are compliant with regulations• Org. Initiatives are fiscally sound• Org. Initiatives are in alignment
• Effectiveness of action plans• Workforce productivity• Budget, scope, resources • Value Stream process metrics• Accuracy of performance forecasts• Performance of Key Measures
7.3a(1)7.4b7.5a(1)
1.4 Analyze and Review Performance• Performance Goals are measured and monitored• Monitor/Manage effectiveness of Enterprise Dashboards • Ensure Action Plans are timely & aligned with Strategic Objectives and Goals
• Performance variance• Effectiveness of Action Plans• Accuracy of performance forecasts
7.1a(1)7.1b(1)7.5a(1)
10.2.1 Manage Portfolio/Projects• Manage Strategic Initiatives for scope, resources and cost weekly• Team members engaged (understand work) • Project and portfolio are aligned with performance goals• Discipline to the portfolio process
• Accuracy of portfolio• Scope, resource and budget variance• Documented change request• Project team check in and close-out survey
7.3a(3)7.47.4b
Key Support Processes (Enabling Value Stream)3.5.2 Manage Member Feedback• Member survey feedback provided to service providers is relevant & timely• Feedback loop with member is timely and responsive• Feedback is collected and managed using standard, defined NPS descriptions• Feedback aggregation is standardized ensuring quality and accuracy
• Members move from Detractor to Promoter • Time to Resolve• NPS • Reduced dissatisfied feedback by issue
7.2a(1,2)7.3a(3)
4.2.1 Deliver World Class Experience• Service provider personally engaged• Members feel valued• Member receives value• Member perceives provider acts in their best interest • Easy to conduct business• Prompt service• Inquiry/problem resolved timely
• NPS Agreement Question (R)• Products per household (Raddon)• Percent of incomplete paperwork• Workforce Engagement scores• NPS Overall Satisfaction• Synapsys Cross-Sell• Pull-Through
7.2a(1,2,3)7.3a(3)7.1a7.1b(1)
5.1, 5.7 Deliver Consumer Loans• Loan application is complete and accurate• Provider personally engaged• Act in best interest • Easy to conduct business• Accurate, on-time closing• UW stipulations are met
• Turn time• Pull through• NPS new product satisfaction• NPS Overall Likelihood to recommend• Number accounts opened/closed• Product by count
7.1a7.1b(1)
5.4 Deliver Mortgage Loans• MLO acts in member’s best interest • Easy to conduct business• Accurate, on-time closing• Loan is accurate and complete• Processed and moved to closing within agreed timeframe
• Turn time• Pull through• $ by Loan Officer• $ by Market• Referrals
7.1a7.1b(1)7.1b(2)7.5a(2)
10.3, 10.4 Manage Knowledge Assets• All requests must be approved for publishing or a solution path identified• All requesters receive consistent and transparent response to requests• All knowledge assets must have governance approval prior to publishing
• Number of validated assets• Number of assets by stage• Number of assets past review date
7.1b(1)7.4a(2)
7.2.2 Deliver Technology Solutions• Objectives and requirements defined by Stakeholders prior to development • Minimized revisions to requirements and solution design • Minimized member disruption • Project progress regularly communicated to requestor
• Number of revisions to original request• Percent of post-implementation issues• Percent of milestones completed on time• Percent of on-time communication
7.1b(1)7.1b(2)
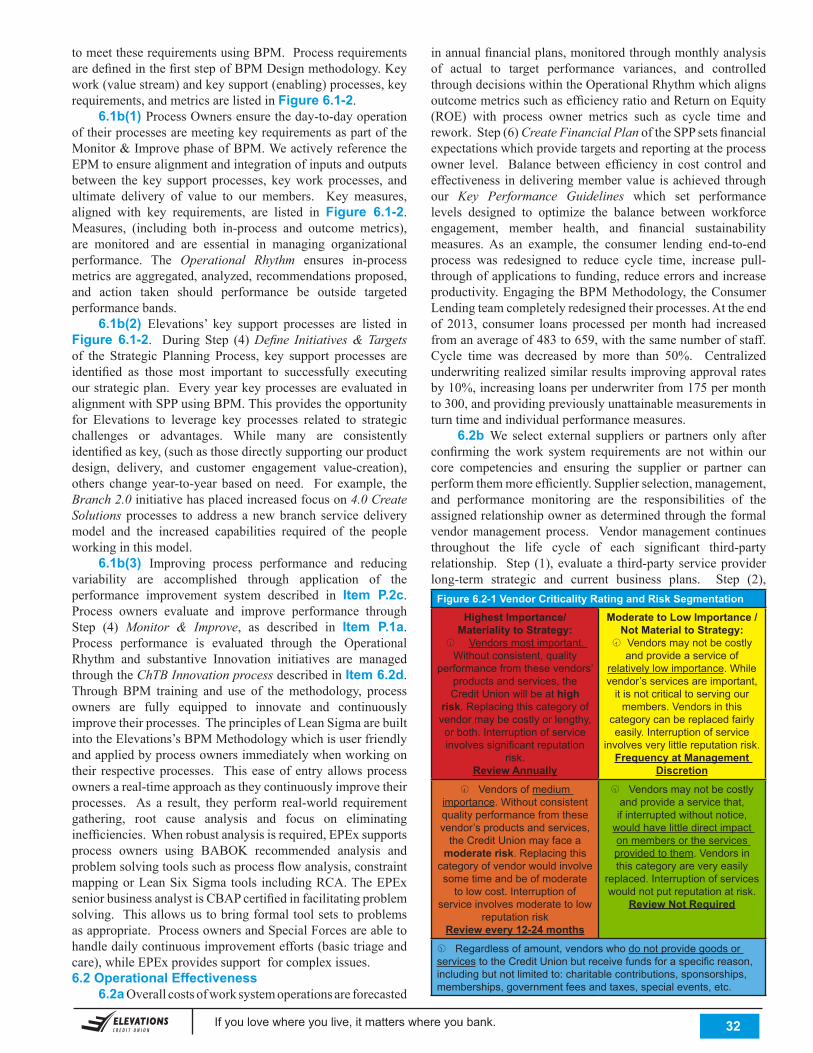
If you love where you live, it matters where you bank. . 32
tomeettheserequirementsusingBPM.ProcessrequirementsaredefinedinthefirststepofBPMDesignmethodology.Keywork(valuestream)andkeysupport(enabling)processes,keyrequirements,andmetricsarelistedinFigure 6.1-2. 6.1b(1) ProcessOwnersensuretheday-to-dayoperationoftheirprocessesaremeetingkeyrequirementsaspartoftheMonitor&ImprovephaseofBPM.WeactivelyreferencetheEPMtoensurealignmentandintegrationofinputsandoutputsbetween the key support processes, keywork processes, andultimate delivery of value to our members. Key measures,aligned with key requirements, are listed in Figure 6.1-2.Measures, (including both in-process and outcome metrics),are monitored and are essential in managing organizationalperformance. The Operational Rhythm ensures in-processmetricsareaggregated,analyzed,recommendationsproposed,and action taken should performance be outside targetedperformancebands. 6.1b(2) Elevations’ key support processes are listed in Figure 6.1-2. During Step (4)Define Initiatives & Targets of the Strategic Planning Process, key support processes areidentified as those most important to successfully executingourstrategicplan.EveryyearkeyprocessesareevaluatedinalignmentwithSPPusingBPM.Thisprovidestheopportunityfor Elevations to leverage key processes related to strategicchallenges or advantages. While many are consistentlyidentifiedaskey,(suchasthosedirectlysupportingourproductdesign, delivery, and customer engagement value-creation),others changeyear-to-year basedonneed. For example, theBranch 2.0 initiativehasplacedincreasedfocuson4.0 Create Solutions processes to address anewbranch servicedeliverymodel and the increased capabilities required of the peopleworkinginthismodel. 6.1b(3) Improving process performance and reducingvariability are accomplished through application of theperformance improvement system described in Item P.2c.Process owners evaluate and improve performance throughStep (4) Monitor & Improve, as described in Item P.1a.Process performance is evaluated through the OperationalRhythm and substantive Innovation initiatives are managedthroughtheChTB Innovation processdescribedinItem 6.2d.ThroughBPM training and use of themethodology, processowners are fully equipped to innovate and continuouslyimprovetheirprocesses.TheprinciplesofLeanSigmaarebuiltintotheElevations’sBPMMethodologywhichisuserfriendlyandappliedbyprocessownersimmediatelywhenworkingontheir respectiveprocesses. Thiseaseofentryallowsprocessownersareal-timeapproachastheycontinuouslyimprovetheirprocesses. As a result, they perform real-world requirementgathering, root cause analysis and focus on eliminatinginefficiencies.Whenrobustanalysisisrequired,EPExsupportsprocess owners using BABOK recommended analysis andproblemsolvingtoolssuchasprocessflowanalysis,constraintmappingorLeanSixSigmatools includingRCA.TheEPExseniorbusinessanalystisCBAPcertifiedinfacilitatingproblemsolving.Thisallowsustobringformaltoolsetstoproblemsasappropriate.ProcessownersandSpecialForcesareabletohandledailycontinuousimprovementefforts(basictriageandcare),whileEPExprovidessupportforcomplexissues.6.2 Operational Effectiveness 6.2a Overallcostsofworksystemoperationsareforecasted
inannualfinancialplans,monitoredthroughmonthlyanalysisof actual to target performance variances, and controlledthroughdecisionswithintheOperationalRhythmwhichalignsoutcomemetricssuchasefficiencyratioandReturnonEquity(ROE) with process owner metrics such as cycle time andrework.Step(6)Create Financial PlanoftheSPPsetsfinancialexpectationswhichprovidetargetsandreportingattheprocessowner level. Balancebetween efficiency in cost control andeffectiveness indeliveringmembervalueisachievedthroughour Key Performance Guidelines which set performancelevels designed to optimize the balance between workforceengagement, member health, and financial sustainabilitymeasures.As an example, the consumer lending end-to-endprocess was redesigned to reduce cycle time, increase pull-throughofapplicationstofunding,reduceerrorsandincreaseproductivity.EngagingtheBPMMethodology, theConsumerLendingteamcompletelyredesignedtheirprocesses.Attheendof 2013, consumer loans processed permonth had increasedfromanaverageof483to659,withthesamenumberofstaff.Cycle time was decreased by more than 50%. Centralizedunderwritingrealizedsimilarresultsimprovingapprovalratesby10%,increasingloansperunderwriterfrom175permonthto300,andprovidingpreviouslyunattainablemeasurementsinturntimeandindividualperformancemeasures. 6.2b We select external suppliers or partners only afterconfirming thework system requirements are notwithin ourcore competencies and ensuring the supplier or partner canperformthemmoreefficiently.Supplierselection,management,and performance monitoring are the responsibilities of theassignedrelationshipownerasdeterminedthroughtheformalvendormanagement process. Vendormanagement continuesthroughout the life cycle of each significant third-partyrelationship. Step(1),evaluatea third-partyserviceproviderlong-term strategic and current business plans. Step (2),
Figure 6.2-1 Vendor Criticality Rating and Risk SegmentationHighest Importance/
Materiality to Strategy: Vendors most important.
Without consistent, quality performance from these vendors’
products and services, the Credit Union will be at high
risk. Replacing this category of vendor may be costly or lengthy, or both. Interruption of service involves significant reputation
risk.Review Annually
Moderate to Low Importance / Not Material to Strategy: Vendors may not be costly
and provide a service of relatively low importance. While vendor’s services are important,
it is not critical to serving our members. Vendors in this
category can be replaced fairly easily. Interruption of service
involves very little reputation risk.Frequency at Management
Discretion
Vendors of medium importance. Without consistent quality performance from these vendor’s products and services,
the Credit Union may face a moderate risk. Replacing this
category of vendor would involve some time and be of moderate
to low cost. Interruption of service involves moderate to low
reputation risk Review every 12-24 months
Vendors may not be costly and provide a service that, if interrupted without notice,
would have little direct impact on members or the services provided to them. Vendors in this category are very easily
replaced. Interruption of services would not put reputation at risk.
Review Not Required
Regardless of amount, vendors who do not provide goods or services to the Credit Union but receive funds for a specific reason, including but not limited to: charitable contributions, sponsorships, memberships, government fees and taxes, special events, etc.
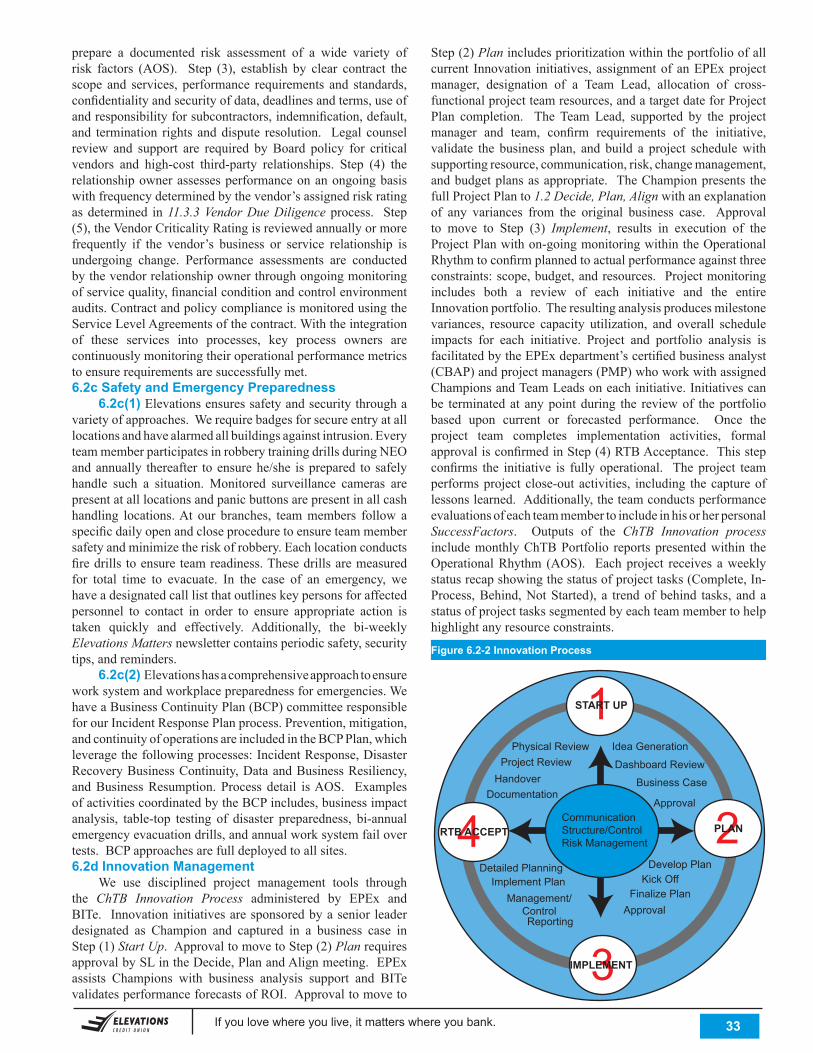
If you love where you live, it matters where you bank. . 33
prepare a documented risk assessment of a wide variety ofrisk factors (AOS). Step (3), establish by clear contract thescope and services, performance requirements and standards,confidentialityandsecurityofdata,deadlinesandterms,useofandresponsibilityforsubcontractors,indemnification,default,and termination rights anddispute resolution. Legal counselreview and support are required byBoard policy for criticalvendors and high-cost third-party relationships. Step (4) therelationshipownerassessesperformanceonanongoingbasiswithfrequencydeterminedbythevendor’sassignedriskratingas determined in 11.3.3 Vendor Due Diligenceprocess. Step(5),theVendorCriticalityRatingisreviewedannuallyormorefrequently if the vendor’s business or service relationship isundergoing change. Performance assessments are conductedbythevendorrelationshipownerthroughongoingmonitoringofservicequality,financialconditionandcontrolenvironmentaudits.ContractandpolicycomplianceismonitoredusingtheServiceLevelAgreementsofthecontract.Withtheintegrationof these services into processes, key process owners arecontinuouslymonitoringtheiroperationalperformancemetricstoensurerequirementsaresuccessfullymet.6.2c Safety and Emergency Preparedness 6.2c(1)Elevationsensuressafetyandsecuritythroughavarietyofapproaches.Werequirebadgesforsecureentryatalllocationsandhavealarmedallbuildingsagainstintrusion.EveryteammemberparticipatesinrobberytrainingdrillsduringNEOandannually thereafter toensurehe/she isprepared tosafelyhandle such a situation. Monitored surveillance cameras arepresentatalllocationsandpanicbuttonsarepresentinallcashhandling locations.At our branches, teammembers follow aspecificdailyopenandcloseproceduretoensureteammembersafetyandminimizetheriskofrobbery.Eachlocationconductsfiredrills toensureteamreadiness.Thesedrillsaremeasuredfor total time to evacuate. In the case of an emergency, wehaveadesignatedcalllistthatoutlineskeypersonsforaffectedpersonnel to contact in order to ensure appropriate action istaken quickly and effectively. Additionally, the bi-weeklyElevations Mattersnewslettercontainsperiodicsafety,securitytips,andreminders. 6.2c(2) Elevationshasacomprehensiveapproachtoensureworksystemandworkplacepreparednessforemergencies.WehaveaBusinessContinuityPlan(BCP)committeeresponsibleforourIncidentResponsePlanprocess.Prevention,mitigation,andcontinuityofoperationsareincludedintheBCPPlan,whichleveragethefollowingprocesses:IncidentResponse,DisasterRecoveryBusinessContinuity,DataandBusinessResiliency,andBusinessResumption. Process detail isAOS. ExamplesofactivitiescoordinatedbytheBCPincludes,businessimpactanalysis, table-top testing of disaster preparedness, bi-annualemergencyevacuationdrills,andannualworksystemfailovertests.BCPapproachesarefulldeployedtoallsites.6.2d Innovation Management We use disciplined project management tools throughthe ChTB Innovation Process administered by EPEx andBITe. Innovationinitiativesaresponsoredbyasenior leaderdesignated as Champion and captured in a business case inStep(1)Start Up.ApprovaltomovetoStep(2)PlanrequiresapprovalbySLintheDecide,PlanandAlignmeeting.EPExassists Champions with business analysis support and BITevalidatesperformanceforecastsofROI.Approvaltomoveto
Step(2)Planincludesprioritizationwithintheportfolioofallcurrent Innovation initiatives,assignmentofanEPExprojectmanager, designation of a Team Lead, allocation of cross-functionalprojectteamresources,andatargetdateforProjectPlan completion. The Team Lead, supported by the projectmanager and team, confirm requirements of the initiative,validate the business plan, and build a project schedulewithsupportingresource,communication,risk,changemanagement,andbudgetplansasappropriate. TheChampionpresents thefullProjectPlanto1.2 Decide, Plan, Alignwithanexplanationof any variances from the original business case. Approvalto move to Step (3) Implement, results in execution of theProjectPlanwithon-goingmonitoringwithintheOperationalRhythmtoconfirmplannedtoactualperformanceagainstthreeconstraints:scope,budget,andresources. Projectmonitoringincludes both a review of each initiative and the entireInnovationportfolio.Theresultinganalysisproducesmilestonevariances, resource capacity utilization, and overall scheduleimpacts for each initiative. Project and portfolio analysis isfacilitatedbytheEPExdepartment’scertifiedbusinessanalyst(CBAP)andprojectmanagers(PMP)whoworkwithassignedChampionsandTeamLeadsoneachinitiative.Initiativescanbe terminatedat anypointduring the reviewof theportfoliobased upon current or forecasted performance. Once theproject team completes implementation activities, formalapprovalisconfirmedinStep(4)RTBAcceptance.Thisstepconfirms the initiative is fullyoperational. Theproject teamperformsprojectclose-outactivities, including thecaptureoflessonslearned.Additionally,theteamconductsperformanceevaluationsofeachteammembertoincludeinhisorherpersonalSuccessFactors. Outputs of the ChTB Innovation process includemonthlyChTBPortfolio reportspresentedwithin theOperationalRhythm (AOS). Eachproject receives aweeklystatusrecapshowingthestatusofprojecttasks(Complete,In-Process,Behind,NotStarted), a trendofbehind tasks, andastatusofprojecttaskssegmentedbyeachteammembertohelphighlightanyresourceconstraints.
Figure 6.2-2 Innovation Process
3IMPLEMENT
1START UP
4RTB ACCEPT 2PLANCommunicationStructure/ControlRisk Management
Physical ReviewProject Review
HandoverDocumentation
Detailed PlanningImplement Plan
Management/ControlReporting
Idea Generation
Dashboard Review
Business Case
Approval
Develop PlanKick Off
Finalize PlanApproval
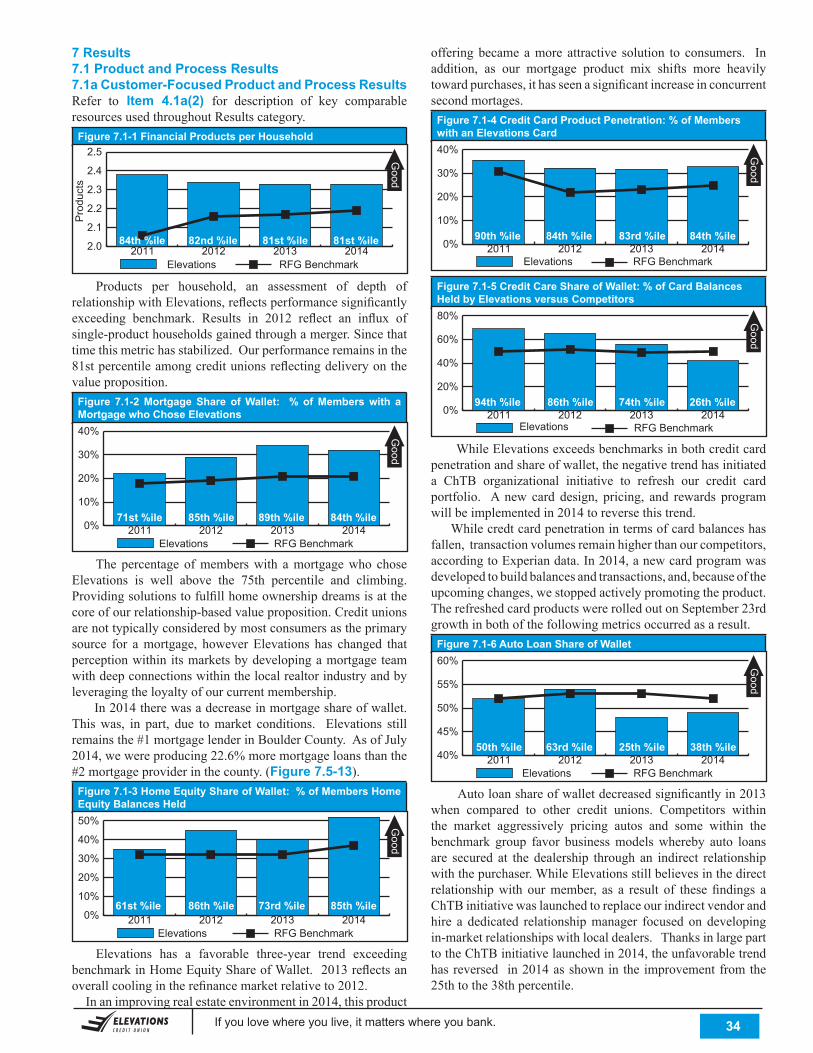
If you love where you live, it matters where you bank. . 34
7 Results7.1 Product and Process Results7.1a Customer-Focused Product and Process ResultsRefer to Item 4.1a(2) for description of key comparableresourcesusedthroughoutResultscategory.
Figure 7.1-1 Financial Products per Household
2.0
2.1
2.2
2.3
2.4
2.5
Elevations RFG Benchmark2014201320122011
Pro
duct
s
Good
84th %ile 82nd %ile 81st %ile 81st %ile
Products per household, an assessment of depth ofrelationshipwithElevations,reflectsperformancesignificantlyexceeding benchmark. Results in 2012 reflect an influx ofsingle-producthouseholdsgainedthroughamerger.Sincethattimethismetrichasstabilized.Ourperformanceremainsinthe81stpercentileamongcreditunionsreflectingdeliveryonthevalueproposition.
Figure 7.1-2 Mortgage Share of Wallet: % of Members with a Mortgage who Chose Elevations
0%
10%
20%
30%
40%
Elevations RFG Benchmark2014201320122011
Good
71st %ile 85th %ile 89th %ile 84th %ile
Thepercentageofmemberswith amortgagewho choseElevations is well above the 75th percentile and climbing.Providingsolutionstofulfillhomeownershipdreamsisatthecoreofourrelationship-basedvalueproposition.Creditunionsarenottypicallyconsideredbymostconsumersastheprimarysource for amortgage, however Elevations has changed thatperceptionwithinitsmarketsbydevelopingamortgageteamwithdeepconnectionswithinthelocalrealtorindustryandbyleveragingtheloyaltyofourcurrentmembership. In2014therewasadecreaseinmortgageshareofwallet.Thiswas, in part, due tomarket conditions. Elevations stillremainsthe#1mortgagelenderinBoulderCounty.AsofJuly2014,wewereproducing22.6%moremortgageloansthanthe#2mortgageproviderinthecounty.(Figure 7.5-13).
Figure 7.1-3 Home Equity Share of Wallet: % of Members Home Equity Balances Held
0%
10%
20%
30%
40%
50%
Elevations RFG Benchmark2014201320122011
Good
61st %ile 86th %ile 73rd %ile 85th %ile
Elevations has a favorable three-year trend exceedingbenchmarkinHomeEquityShareofWallet.2013reflectsanoverallcoolingintherefinancemarketrelativeto2012.Inanimprovingrealestateenvironmentin2014,thisproduct
offeringbecameamore attractive solution to consumers. Inaddition, as our mortgage product mix shifts more heavilytowardpurchases,ithasseenasignificantincreaseinconcurrentsecondmortages.
Figure 7.1-4 Credit Card Product Penetration: % of Members with an Elevations Card
0%
10%
20%
30%
40%
Elevations RFG Benchmark2014201320122011
Good
90th %ile 84th %ile 83rd %ile 84th %ile
Figure 7.1-5 Credit Care Share of Wallet: % of Card Balances Held by Elevations versus Competitors
0%
20%
40%
60%
80%
Elevations RFG Benchmark2014201320122011
Good
94th %ile 86th %ile 74th %ile 26th %ile
WhileElevationsexceedsbenchmarksinbothcreditcardpenetrationandshareofwallet,thenegativetrendhasinitiateda ChTB organizational initiative to refresh our credit cardportfolio. A new card design, pricing, and rewards programwillbeimplementedin2014toreversethistrend.Whilecredtcardpenetrationintermsofcardbalanceshasfallen,transactionvolumesremainhigherthanourcompetitors,accordingtoExperiandata.In2014,anewcardprogramwasdevelopedtobuildbalancesandtransactions,and,becauseoftheupcomingchanges,westoppedactivelypromotingtheproduct.TherefreshedcardproductswererolledoutonSeptember23rdgrowthinbothofthefollowingmetricsoccurredasaresult.
Figure 7.1-6 Auto Loan Share of Wallet
40%
45%
50%
55%
60%
Elevations RFG Benchmark2014201320122011
Good
50th %ile 63rd %ile 25th %ile 38th %ile
Autoloanshareofwalletdecreasedsignificantlyin2013when compared to other credit unions. Competitors withinthe market aggressively pricing autos and some within thebenchmark group favor businessmodelswhereby auto loansare secured at the dealership through an indirect relationshipwiththepurchaser.WhileElevationsstillbelievesinthedirectrelationshipwith ourmember, as a result of thesefindings aChTBinitiativewaslaunchedtoreplaceourindirectvendorandhire a dedicated relationshipmanager focused on developingin-marketrelationshipswithlocaldealers.ThanksinlargeparttotheChTBinitiativelaunchedin2014,theunfavorabletrendhasreversed in2014asshownin theimprovementfromthe25thtothe38thpercentile.
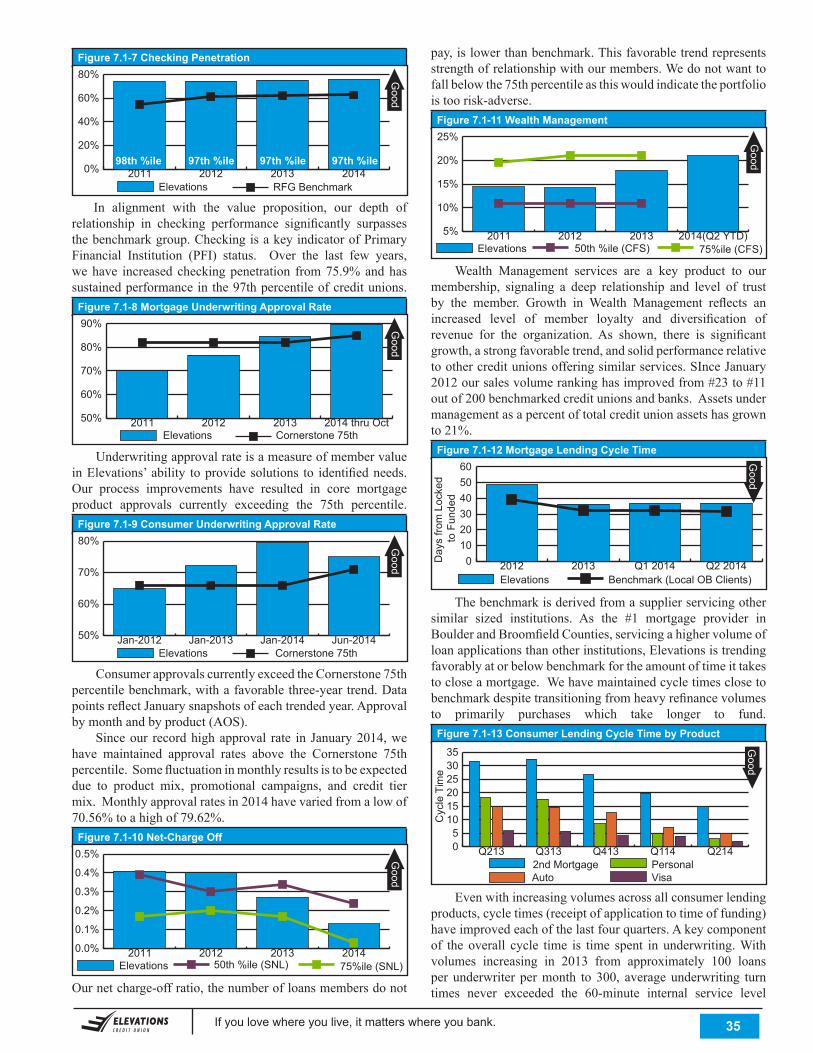
If you love where you live, it matters where you bank. . 35
Figure 7.1-7 Checking Penetration
0%
20%
40%
60%
80%
Elevations RFG Benchmark2014201320122011
Good
98th %ile 97th %ile 97th %ile 97th %ile
In alignment with the value proposition, our depth ofrelationship in checking performance significantly surpassesthebenchmarkgroup.CheckingisakeyindicatorofPrimaryFinancial Institution (PFI) status. Over the last few years,wehave increasedcheckingpenetration from75.9%andhassustainedperformanceinthe97thpercentileofcreditunions.
Figure 7.1-8 Mortgage Underwriting Approval Rate
50%
60%
70%
80%
90%
Elevations Cornerstone 75th2014 thru Oct201320122011
Good
UnderwritingapprovalrateisameasureofmembervalueinElevations’ability toprovidesolutions to identifiedneeds.Our process improvements have resulted in core mortgageproduct approvals currently exceeding the 75th percentile.
Figure 7.1-9 Consumer Underwriting Approval Rate
50%
60%
70%
80%
Elevations Cornerstone 75thJun-2014Jan-2014Jan-2013Jan-2012
Good
ConsumerapprovalscurrentlyexceedtheCornerstone75thpercentilebenchmark,withafavorablethree-yeartrend.DatapointsreflectJanuarysnapshotsofeachtrendedyear.Approvalbymonthandbyproduct(AOS). Sinceour recordhighapproval rate in January2014,wehave maintained approval rates above the Cornerstone 75thpercentile.Somefluctuationinmonthlyresultsistobeexpecteddue to product mix, promotional campaigns, and credit tiermix.Monthlyapprovalratesin2014havevariedfromalowof70.56%toahighof79.62%.
Figure 7.1-10 Net-Charge Off
0.0%
0.1%
0.2%
0.3%
0.4%
0.5%
Elevations 75%ile (SNL)50th %ile (SNL)2014201320122011
Good
Ournetcharge-offratio,thenumberofloansmembersdonot
pay,islowerthanbenchmark.Thisfavorabletrendrepresentsstrengthofrelationshipwithourmembers.Wedonotwanttofallbelowthe75thpercentileasthiswouldindicatetheportfolioistoorisk-adverse.
Figure 7.1-11 Wealth Management
5%
10%
15%
20%
25%
Elevations 75%ile (CFS)50th %ile (CFS)2014(Q2 YTD)201320122011
Good
Wealth Management services are a key product to ourmembership, signaling a deep relationship and level of trustby the member. Growth in Wealth Management reflects anincreased level of member loyalty and diversification ofrevenue for the organization.As shown, there is significantgrowth,astrongfavorabletrend,andsolidperformancerelativetoothercreditunionsofferingsimilarservices.SInceJanuary2012oursalesvolumerankinghasimprovedfrom#23to#11outof200benchmarkedcreditunionsandbanks.Assetsundermanagementasapercentoftotalcreditunionassetshasgrownto21%.
Figure 7.1-12 Mortgage Lending Cycle Time
0102030405060
Elevations Benchmark (Local OB Clients)Q2 2014Q1 201420132012
Good
Day
s fro
m L
ocke
d to
Fun
ded
Thebenchmarkisderivedfromasupplierservicingothersimilar sized institutions. As the #1 mortgage provider inBoulderandBroomfieldCounties,servicingahighervolumeofloanapplicationsthanotherinstitutions,Elevationsistrendingfavorablyatorbelowbenchmarkfortheamountoftimeittakestocloseamortgage.Wehavemaintainedcycletimesclosetobenchmarkdespitetransitioningfromheavyrefinancevolumesto primarily purchases which take longer to fund.
Figure 7.1-13 Consumer Lending Cycle Time by Product
05
101520253035
VisaAutoPersonal2nd Mortgage
Q214Q114Q413Q313Q213
Good
Cyc
le T
ime
Evenwithincreasingvolumesacrossallconsumerlendingproducts,cycletimes(receiptofapplicationtotimeoffunding)haveimprovedeachofthelastfourquarters.Akeycomponentof the overall cycle time is time spent in underwriting.Withvolumes increasing in 2013 from approximately 100 loansper underwriter permonth to 300, averageunderwriting turntimes never exceeded the 60-minute internal service level
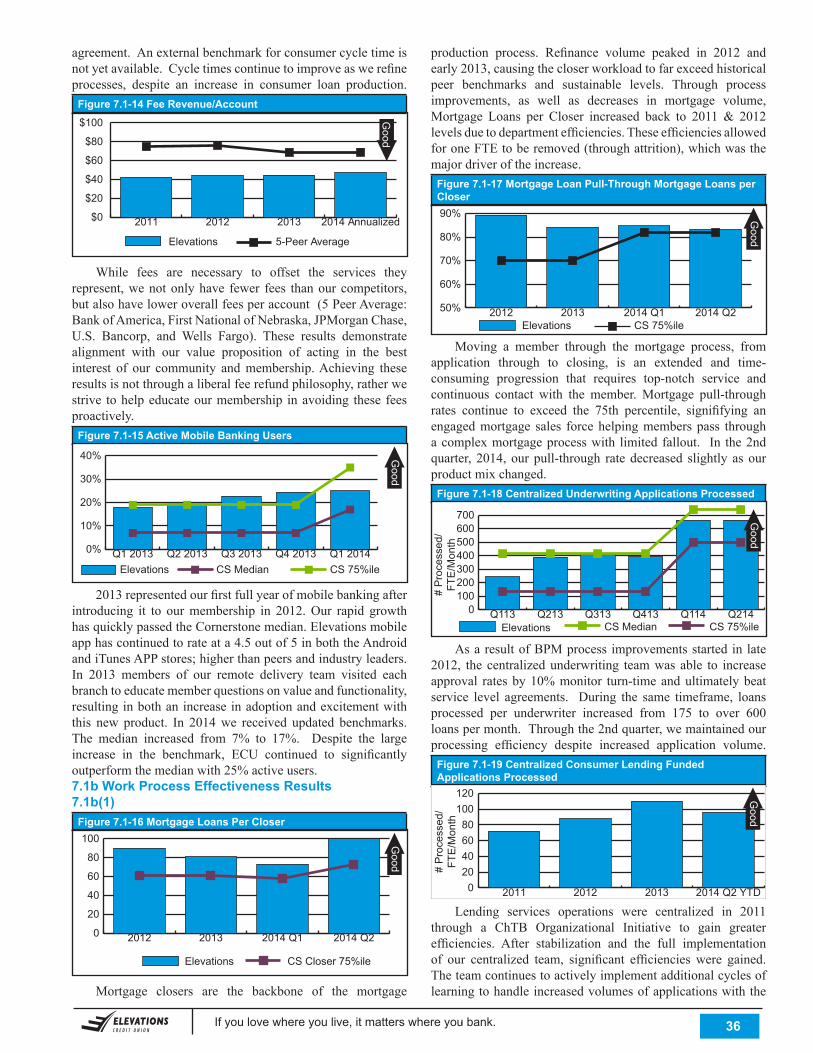
If you love where you live, it matters where you bank. . 36
agreement.Anexternalbenchmarkforconsumercycletimeisnotyetavailable.Cycletimescontinuetoimproveaswerefineprocesses, despite an increase in consumer loan production.
Figure 7.1-14 Fee Revenue/Account
$0
$20
$40
$60
$80
$100
Elevations 5-Peer Average
2014 Annualized201320122011
Good
While fees are necessary to offset the services theyrepresent,wenotonlyhave fewer fees thanourcompetitors,butalsohaveloweroverallfeesperaccount(5PeerAverage:BankofAmerica,FirstNationalofNebraska,JPMorganChase,U.S. Bancorp, and Wells Fargo). These results demonstratealignment with our value proposition of acting in the bestinterest of our community andmembership.Achieving theseresultsisnotthroughaliberalfeerefundphilosophy,ratherwestrive tohelpeducateourmembership inavoiding these feesproactively.
Figure 7.1-15 Active Mobile Banking UsersG
ood
0%
10%
20%
30%
40%
Elevations CS 75%ileCS MedianQ1 2014Q4 2013Q3 2013Q2 2013Q1 2013
2013representedourfirstfullyearofmobilebankingafterintroducing it to ourmembership in 2012.Our rapid growthhasquicklypassedtheCornerstonemedian.Elevationsmobileapphascontinuedtorateata4.5outof5inboththeAndroidandiTunesAPPstores;higherthanpeersandindustryleaders.In 2013 members of our remote delivery team visited eachbranchtoeducatememberquestionsonvalueandfunctionality,resultinginbothanincreaseinadoptionandexcitementwiththis new product. In 2014we received updated benchmarks.The median increased from 7% to 17%. Despite the largeincrease in the benchmark, ECU continued to significantlyoutperformthemedianwith25%activeusers.7.1b Work Process Effectiveness Results7.1b(1)
Figure 7.1-16 Mortgage Loans Per Closer
0
20
40
60
80
100
Elevations CS Closer 75%ile
2014 Q22014 Q120132012
Good
Mortgage closers are the backbone of the mortgage
production process. Refinance volume peaked in 2012 andearly2013,causingthecloserworkloadtofarexceedhistoricalpeer benchmarks and sustainable levels. Through processimprovements, as well as decreases in mortgage volume,Mortgage Loans per Closer increased back to 2011& 2012levelsduetodepartmentefficiencies.TheseefficienciesallowedforoneFTEtoberemoved(throughattrition),whichwasthemajordriveroftheincrease.
Figure 7.1-17 Mortgage Loan Pull-Through Mortgage Loans per Closer
50%
60%
70%
80%
90%
Elevations CS 75%ile2014 Q22014 Q120132012
Good
Moving a member through the mortgage process, fromapplication through to closing, is an extended and time-consuming progression that requires top-notch service andcontinuous contact with the member. Mortgage pull-throughrates continue to exceed the 75th percentile, signififying anengagedmortgage sales forcehelpingmemberspass throughacomplexmortgageprocesswith limitedfallout. In the2ndquarter, 2014,ourpull-through ratedecreased slightly asourproductmixchanged.
Figure 7.1-18 Centralized Underwriting Applications Processed
0100200300400500600700
Elevations CS 75%ileCS MedianQ214Q114Q413Q313Q213Q113
Good
# P
roce
ssed
/FT
E/M
onth
AsaresultofBPMprocess improvementsstartedin late2012, the centralizedunderwriting teamwas able to increaseapproval ratesby10%monitor turn-timeandultimatelybeatservice level agreements. During the same timeframe, loansprocessed per underwriter increased from 175 to over 600loanspermonth.Throughthe2ndquarter,wemaintainedourprocessing efficiency despite increased application volume.
Figure 7.1-19 Centralized Consumer Lending Funded Applications Processed
020406080
100120
2014 Q2 YTD201320122011
Good
# P
roce
ssed
/FT
E/M
onth
Lending services operations were centralized in 2011through a ChTB Organizational Initiative to gain greaterefficiencies. After stabilization and the full implementationof our centralized team, significant efficiencies were gained.Theteamcontinuestoactivelyimplementadditionalcyclesoflearningtohandleincreasedvolumesofapplicationswiththe
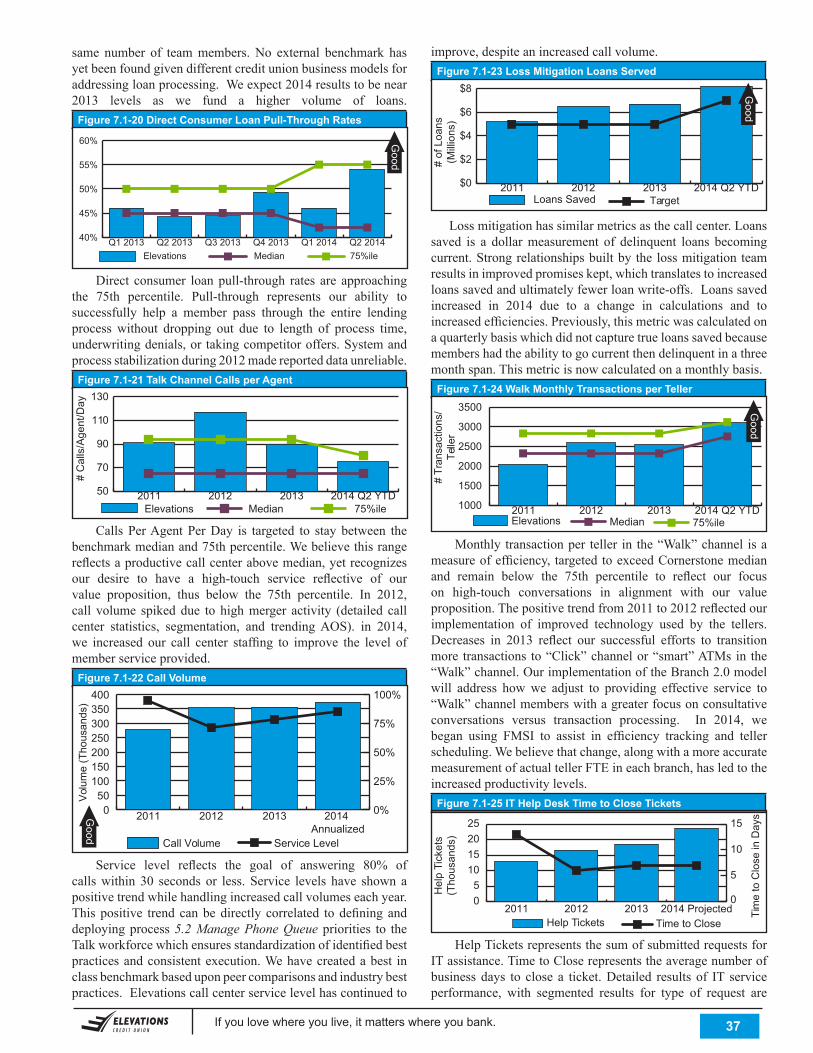
If you love where you live, it matters where you bank. . 37
same number of teammembers.No external benchmark hasyetbeenfoundgivendifferentcreditunionbusinessmodelsforaddressingloanprocessing.Weexpect2014resultstobenear2013 levels as we fund a higher volume of loans.
Figure 7.1-20 Direct Consumer Loan Pull-Through Rates
Good
40%
45%
50%
55%
60%
Elevations 75%ileMedianQ2 2014Q1 2014Q4 2013Q3 2013Q2 2013Q1 2013
Direct consumer loanpull-through rates are approachingthe 75th percentile. Pull-through represents our ability tosuccessfully help a member pass through the entire lendingprocess without dropping out due to length of process time,underwritingdenials,ortakingcompetitoroffers.Systemandprocessstabilizationduring2012madereporteddataunreliable.
Figure 7.1-21 Talk Channel Calls per Agent
50
70
90
110
130
Elevations 75%ileMedian2014 Q2 YTD201320122011
# C
alls
/Age
nt/D
ay
Calls PerAgent PerDay is targeted to stay between thebenchmarkmedianand75thpercentile.Webelievethisrangereflectsaproductivecallcenterabovemedian,yetrecognizesour desire to have a high-touch service reflective of ourvalue proposition, thus below the 75th percentile. In 2012,call volume spikeddue to highmerger activity (detailed callcenter statistics, segmentation, and trendingAOS). in 2014,we increased our call center staffing to improve the level ofmemberserviceprovided.
Figure 7.1-22 Call Volume
Vol
ume
(Tho
usan
ds)
0 50
100 150 200 250 300 350 400
0%
25%
50%
75%
100%
Call Volume Service Level
2014 Annualized
201320122011Good
Service level reflects the goal of answering 80% ofcallswithin 30 seconds or less. Service levels have shown apositivetrendwhilehandlingincreasedcallvolumeseachyear.Thispositive trendcanbedirectly correlated todefininganddeployingprocess 5.2 Manage Phone Queue priorities to theTalkworkforcewhichensuresstandardizationofidentifiedbestpracticesandconsistentexecution.Wehavecreatedabest inclassbenchmarkbaseduponpeercomparisonsandindustrybestpractices.Elevationscallcenterservicelevelhascontinuedto
improve,despiteanincreasedcallvolume.Figure 7.1-23 Loss Mitigation Loans Served
$0
$2
$4
$6
$8
Loans Saved Target2014 Q2 YTD201320122011
# of
Loa
ns(M
illio
ns)
Good
Lossmitigationhassimilarmetricsasthecallcenter.Loanssaved is a dollarmeasurement of delinquent loans becomingcurrent.Strongrelationshipsbuiltbythe lossmitigationteamresultsinimprovedpromiseskept,whichtranslatestoincreasedloanssavedandultimatelyfewerloanwrite-offs.Loanssavedincreased in 2014 due to a change in calculations and toincreasedefficiencies.Previously,thismetricwascalculatedonaquarterlybasiswhichdidnotcapturetrueloanssavedbecausemembershadtheabilitytogocurrentthendelinquentinathreemonthspan.Thismetricisnowcalculatedonamonthlybasis.
Figure 7.1-24 Walk Monthly Transactions per Teller
# Tr
ansa
ctio
ns/
Telle
r
1000
1500
2000
2500
3000
3500
Elevations 75%ileMedian2014 Q2 YTD201320122011
Good
Monthly transactionper teller in the“Walk”channel isameasureofefficiency, targetedtoexceedCornerstonemedianand remain below the 75th percentile to reflect our focuson high-touch conversations in alignment with our valueproposition.Thepositivetrendfrom2011to2012reflectedourimplementation of improved technology used by the tellers.Decreases in 2013 reflect our successful efforts to transitionmore transactions to“Click”channelor“smart”ATMsin the“Walk”channel.OurimplementationoftheBranch2.0modelwill address howwe adjust to providing effective service to“Walk”channelmemberswithagreaterfocusonconsultativeconversations versus transaction processing. In 2014, webegan using FMSI to assist in efficiency tracking and tellerscheduling.Webelievethatchange,alongwithamoreaccuratemeasurementofactualtellerFTEineachbranch,hasledtotheincreasedproductivitylevels.
Figure 7.1-25 IT Help Desk Time to Close Tickets
Hel
p Ti
cket
s(T
hous
ands
)
Tim
e to
Clo
se in
Day
s
0 5
10 15 20 25
0
5
10
15
Help Tickets Time to Close2014 Projected201320122011
HelpTicketsrepresentsthesumofsubmittedrequestsforITassistance.TimetoCloserepresentstheaveragenumberofbusinessdays to close a ticket.Detailed results of IT serviceperformance, with segmented results for type of request are
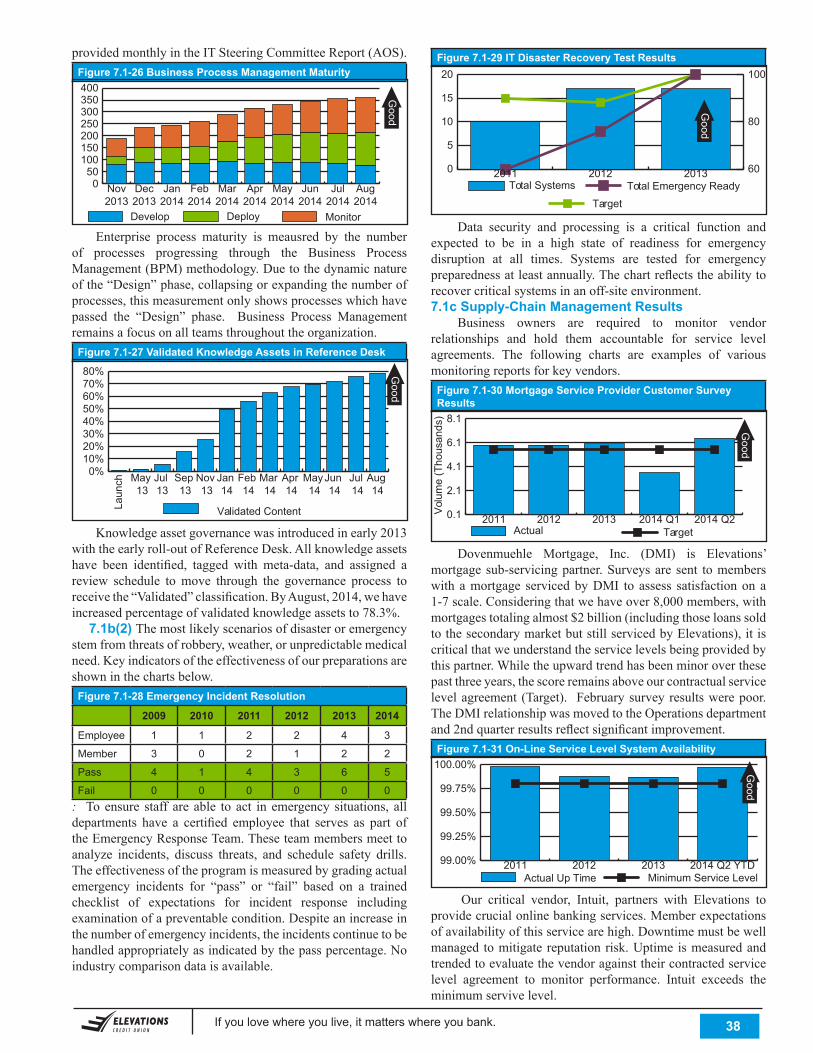
If you love where you live, it matters where you bank. . 38
providedmonthlyintheITSteeringCommitteeReport(AOS).Figure 7.1-26 Business Process Management Maturity
050
100150200250300350400
MonitorDeployDevelop
Aug2014
Jul2014
Jun2014
May2014
Apr2014
Mar2014
Feb2014
Jan2014
Dec2013
Nov2013
Good
Enterprise process maturity is meausred by the numberof processes progressing through the Business ProcessManagement(BPM)methodology.Duetothedynamicnatureofthe“Design”phase,collapsingorexpandingthenumberofprocesses,thismeasurementonlyshowsprocesseswhichhavepassed the “Design” phase. Business Process Managementremainsafocusonallteamsthroughouttheorganization.
Figure 7.1-27 Validated Knowledge Assets in Reference Desk
Good
0%10%20%30%40%50%60%70%80%
Validated Content
Aug 14
Jul 14
Jun 14
May 14
Apr 14
Mar 14
Feb 14
Jan 14
Nov 13
Sep 13
Jul 13
May 13
Laun
ch
Knowledgeassetgovernancewasintroducedinearly2013withtheearlyroll-outofReferenceDesk.Allknowledgeassetshave been identified, tagged with meta-data, and assigned areview schedule tomove through the governance process toreceivethe“Validated”classification.ByAugust,2014,wehaveincreasedpercentageofvalidatedknowledgeassetsto78.3%. 7.1b(2) Themostlikelyscenariosofdisasteroremergencystemfromthreatsofrobbery,weather,orunpredictablemedicalneed.Keyindicatorsoftheeffectivenessofourpreparationsareshowninthechartsbelow.
Figure 7.1-28 Emergency Incident Resolution
2009 2010 2011 2012 2013 2014
Employee 1 1 2 2 4 3
Member 3 0 2 1 2 2
Pass 4 1 4 3 6 5
Fail 0 0 0 0 0 0: Toensure staff are able to act in emergency situations, alldepartments have a certified employee that serves as part oftheEmergencyResponseTeam.Theseteammembersmeettoanalyze incidents, discuss threats, and schedule safety drills.Theeffectivenessoftheprogramismeasuredbygradingactualemergency incidents for “pass” or “fail” based on a trainedchecklist of expectations for incident response includingexaminationofapreventablecondition.Despiteanincreaseinthenumberofemergencyincidents,theincidentscontinuetobehandledappropriatelyasindicatedbythepasspercentage.Noindustrycomparisondataisavailable.
Figure 7.1-29 IT Disaster Recovery Test Results
0
5
10
15
20
60
80
100
Total Systems
TargetTotal Emergency Ready
201320122011
Good
Data security and processing is a critical function andexpected to be in a high state of readiness for emergencydisruption at all times. Systems are tested for emergencypreparednessatleastannually.Thechartreflectstheabilitytorecovercriticalsystemsinanoff-siteenvironment.7.1c Supply-Chain Management Results Business owners are required to monitor vendorrelationships and hold them accountable for service levelagreements. The following charts are examples of variousmonitoringreportsforkeyvendors.
Figure 7.1-30 Mortgage Service Provider Customer Survey Results
0.1
2.1
4.1
6.1
8.1
Actual Target2014 Q22014 Q1201320122011
Vol
ume
(Tho
usan
ds)
Good
Dovenmuehle Mortgage, Inc. (DMI) is Elevations’mortgagesub-servicingpartner.Surveysare sent tomemberswith amortgage servicedbyDMI to assess satisfactionon a1-7scale.Consideringthatwehaveover8,000members,withmortgagestotalingalmost$2billion(includingthoseloanssoldtothesecondarymarketbutstillservicedbyElevations),itiscriticalthatweunderstandtheservicelevelsbeingprovidedbythispartner.Whiletheupwardtrendhasbeenminoroverthesepastthreeyears,thescoreremainsaboveourcontractualservicelevelagreement (Target). Februarysurveyresultswerepoor.TheDMIrelationshipwasmovedtotheOperationsdepartmentand2ndquarterresultsreflectsignificantimprovement.
Figure 7.1-31 On-Line Service Level System Availability
99.00%
99.25%
99.50%
99.75%
100.00%
Actual Up Time Minimum Service Level2014 Q2 YTD201320122011
Good
Our critical vendor, Intuit, partners with Elevations toprovidecrucialonlinebankingservices.Memberexpectationsofavailabilityofthisservicearehigh.Downtimemustbewellmanaged tomitigatereputationrisk.Uptime ismeasuredandtrendedtoevaluatethevendoragainsttheircontractedservicelevel agreement to monitor performance. Intuit exceeds theminimumservivelevel.
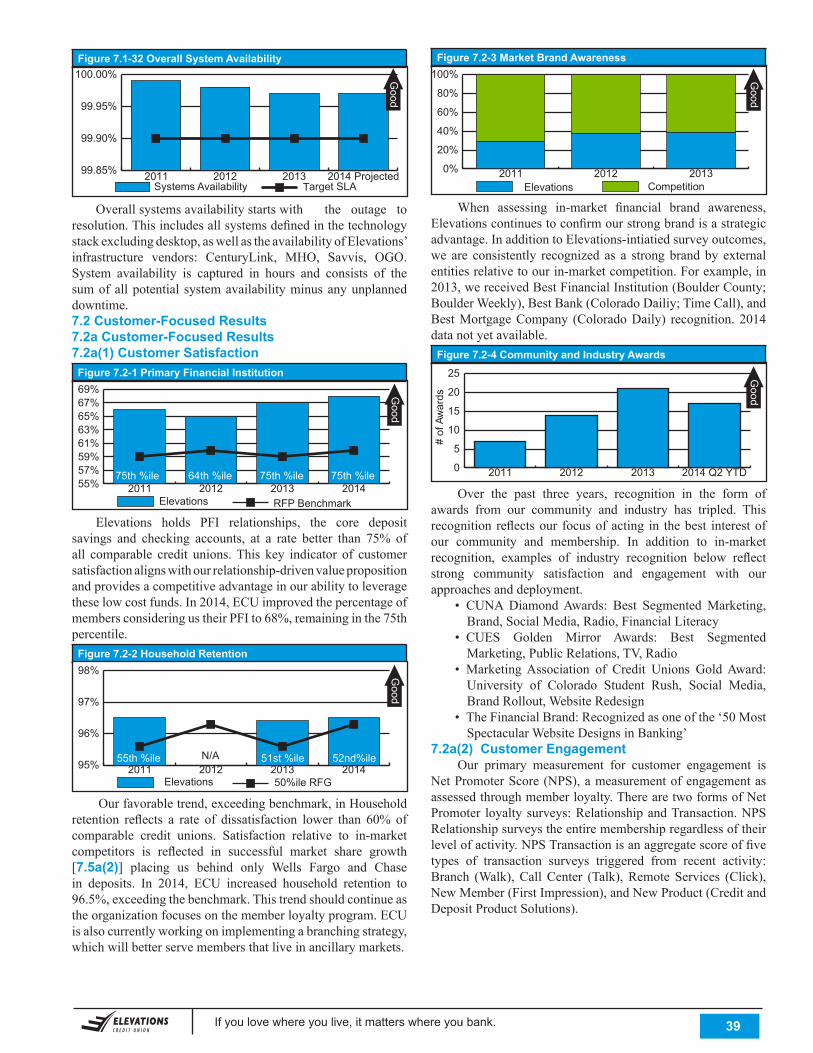
If you love where you live, it matters where you bank. . 39
Figure 7.1-32 Overall System Availability
99.85%
99.90%
99.95%
100.00%
Systems AvailabilityT arget SLA2014 Projected201320122011
Good
Overallsystemsavailabilitystartswith the outage toresolution.Thisincludesallsystemsdefinedinthetechnologystackexcludingdesktop,aswellastheavailabilityofElevations’infrastructure vendors: CenturyLink, MHO, Savvis, OGO.System availability is captured in hours and consists of thesumofallpotential systemavailabilityminusanyunplanneddowntime.7.2 Customer-Focused Results7.2a Customer-Focused Results7.2a(1) Customer Satisfaction
Figure 7.2-1 Primary Financial Institution
55%57%59%61%63%65%67%69%
Elevations RFP Benchmark2014201320122011
Good
75th %ile 64th %ile 75th %ile 75th %ile
Elevations holds PFI relationships, the core depositsavings and checking accounts, at a rate better than 75% ofall comparable credit unions.This key indicator of customersatisfactionalignswithourrelationship-drivenvaluepropositionandprovidesacompetitiveadvantageinourabilitytoleveragetheselowcostfunds.In2014,ECUimprovedthepercentageofmembersconsideringustheirPFIto68%,remaininginthe75thpercentile.
Figure 7.2-2 Household Retention
95%
96%
97%
98%
Elevations 50%ile RFG2014201320122011
Good
55th %ile N/A 51st %ile 52nd%ile
Ourfavorabletrend,exceedingbenchmark,inHouseholdretention reflects a rate of dissatisfaction lower than 60% ofcomparable credit unions. Satisfaction relative to in-marketcompetitors is reflected in successful market share growth[7.5a(2)] placing us behind only Wells Fargo and Chasein deposits. In 2014, ECU increased household retention to96.5%,exceedingthebenchmark.Thistrendshouldcontinueastheorganizationfocusesonthememberloyaltyprogram.ECUisalsocurrentlyworkingonimplementingabranchingstrategy,whichwillbetterservemembersthatliveinancillarymarkets.
Figure 7.2-3 Market Brand Awareness
0%
20%
40%
60%
80%
100%
CompetitionElevations201320122011
Good
When assessing in-market financial brand awareness,Elevationscontinuestoconfirmourstrongbrandisastrategicadvantage.InadditiontoElevations-intiatiedsurveyoutcomes,we are consistently recognized as a strongbrandby externalentitiesrelativetoourin-marketcompetition.Forexample,in2013,wereceivedBestFinancialInstitution(BoulderCounty;BoulderWeekly),BestBank(ColoradoDailiy;TimeCall),andBestMortgageCompany (ColoradoDaily) recognition. 2014datanotyetavailable.
Figure 7.2-4 Community and Industry Awards
0
5
10
15
20
25
2014 Q2 YTD201320122011
Good
# of
Aw
ards
Over the past three years, recognition in the form ofawards from our community and industry has tripled. Thisrecognition reflectsour focusofacting in thebest interestofour community and membership. In addition to in-marketrecognition, examples of industry recognition below reflectstrong community satisfaction and engagement with ourapproachesanddeployment.
• CUNA DiamondAwards: Best SegmentedMarketing,Brand,SocialMedia,Radio,FinancialLiteracy
• CUES Golden Mirror Awards: Best SegmentedMarketing,PublicRelations,TV,Radio
• MarketingAssociation of Credit Unions GoldAward:University of Colorado Student Rush, Social Media,BrandRollout,WebsiteRedesign
• TheFinancialBrand:Recognizedasoneofthe‘50MostSpectacularWebsiteDesignsinBanking’
7.2a(2) Customer Engagement Our primary measurement for customer engagement isNetPromoterScore(NPS),ameasurementofengagementasassessedthroughmemberloyalty.TherearetwoformsofNetPromoter loyaltysurveys:RelationshipandTransaction.NPSRelationshipsurveystheentiremembershipregardlessoftheirlevelofactivity.NPSTransactionisanaggregatescoreoffivetypes of transaction surveys triggered from recent activity:Branch (Walk),CallCenter (Talk),Remote Services (Click),NewMember(FirstImpression),andNewProduct(CreditandDepositProductSolutions).
T
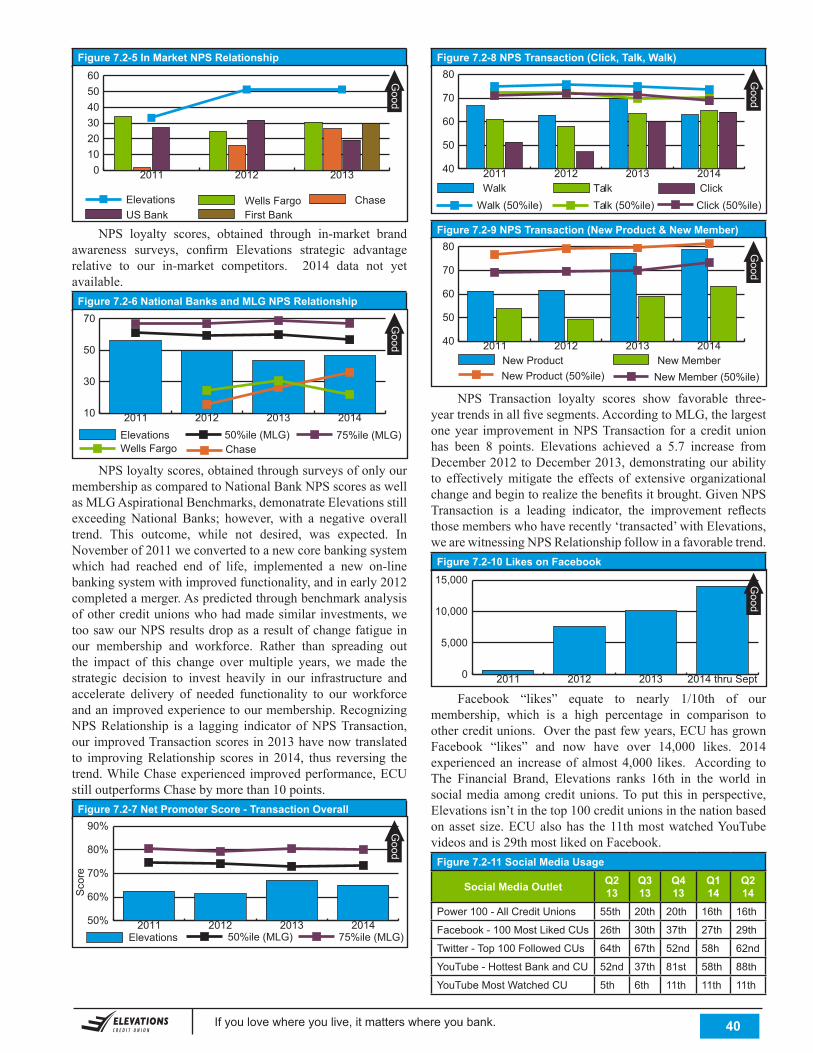
If you love where you live, it matters where you bank. . 40
Figure 7.2-8 NPS Transaction (Click, Talk, Walk)
Figure 7.2-5 NPS Transaction (Click, Talk, Walk)40
50
60
70
80
ClickTalkWalkClick (50%ile)Talk (50%ile)Walk (50%ile)
2014201320122011
Good
Figure 7.2-9 NPS Transaction (New Product & New Member)
Figure 7.2-5 NPS Transaction (Click, Talk, Walk)40
50
60
70
80
New MemberNew Product New Member (50%ile)New Product (50%ile)
2014201320122011
Good
NPS Transaction loyalty scores show favorable three-yeartrendsinallfivesegments.AccordingtoMLG,thelargestoneyear improvement inNPSTransaction foracreditunionhas been 8 points. Elevations achieved a 5.7 increase fromDecember2012toDecember2013,demonstratingourabilityto effectivelymitigate the effects of extensive organizationalchangeandbegintorealizethebenefitsitbrought.GivenNPSTransaction is a leading indicator, the improvement reflectsthosememberswhohaverecently‘transacted’withElevations,wearewitnessingNPSRelationshipfollowinafavorabletrend.
Figure 7.2-10 Likes on Facebook
0
5,000
10,000
15,000
2014 thru Sept201320122011
Good
Facebook “likes” equate to nearly 1/10th of ourmembership, which is a high percentage in comparison toothercreditunions.Overthepastfewyears,ECUhasgrownFacebook “likes” and now have over 14,000 likes. 2014experiencedan increaseof almost4,000 likes. According toThe Financial Brand, Elevations ranks 16th in the world insocialmediaamongcreditunions.Toput this inperspective,Elevationsisn’tinthetop100creditunionsinthenationbasedonasset size.ECUalsohas the11thmostwatchedYouTubevideosandis29thmostlikedonFacebook.
Figure 7.2-11 Social Media Usage
Social Media Outlet Q2 13
Q3 13
Q4 13
Q1 14
Q2 14
Power 100 - All Credit Unions 55th 20th 20th 16th 16th
Facebook - 100 Most Liked CUs 26th 30th 37th 27th 29th
Twitter - Top 100 Followed CUs 64th 67th 52nd 58h 62nd
YouTube - Hottest Bank and CU 52nd 37th 81st 58th 88th
YouTube Most Watched CU 5th 6th 11th 11th 11th
Figure 7.2-5 In Market NPS Relationship
0102030405060
First BankUS BankChaseWells FargoElevations
201320122011
Good
NPS loyalty scores, obtained through in-market brandawareness surveys, confirm Elevations strategic advantagerelative to our in-market competitors. 2014 data not yetavailable.
Figure 7.2-6 National Banks and MLG NPS Relationship
Figure 7.2-5 NPS Transaction (Click, Talk, Walk)10
30
50
70
ElevationsChaseWells Fargo
75%ile (MLG)50%ile (MLG)2014201320122011
Good
NPSloyaltyscores,obtainedthroughsurveysofonlyourmembershipascomparedtoNationalBankNPSscoresaswellasMLGAspirationalBenchmarks,demonatrateElevationsstillexceedingNational Banks; however, with a negative overalltrend. This outcome, while not desired, was expected. InNovemberof2011weconvertedtoanewcorebankingsystemwhich had reached end of life, implemented a new on-linebankingsystemwithimprovedfunctionality,andinearly2012completedamerger.Aspredictedthroughbenchmarkanalysisofothercreditunionswhohadmadesimilar investments,wetoosawourNPSresultsdropasaresultofchangefatigueinour membership and workforce. Rather than spreading outthe impact of this change overmultiple years, wemade thestrategic decision to invest heavily in our infrastructure andaccelerate delivery of needed functionality to our workforceandanimprovedexperiencetoourmembership.RecognizingNPSRelationship is a lagging indicator ofNPSTransaction,ourimprovedTransactionscoresin2013havenowtranslatedto improvingRelationship scores in 2014, thus reversing thetrend.WhileChaseexperiencedimprovedperformance,ECUstilloutperformsChasebymorethan10points.
Figure 7.2-7 Net Promoter Score - Transaction Overall
50%
60%
70%
80%
90%
Elevations 75%ile (MLG)50%ile (MLG)2014201320122011
Good
Sco
re
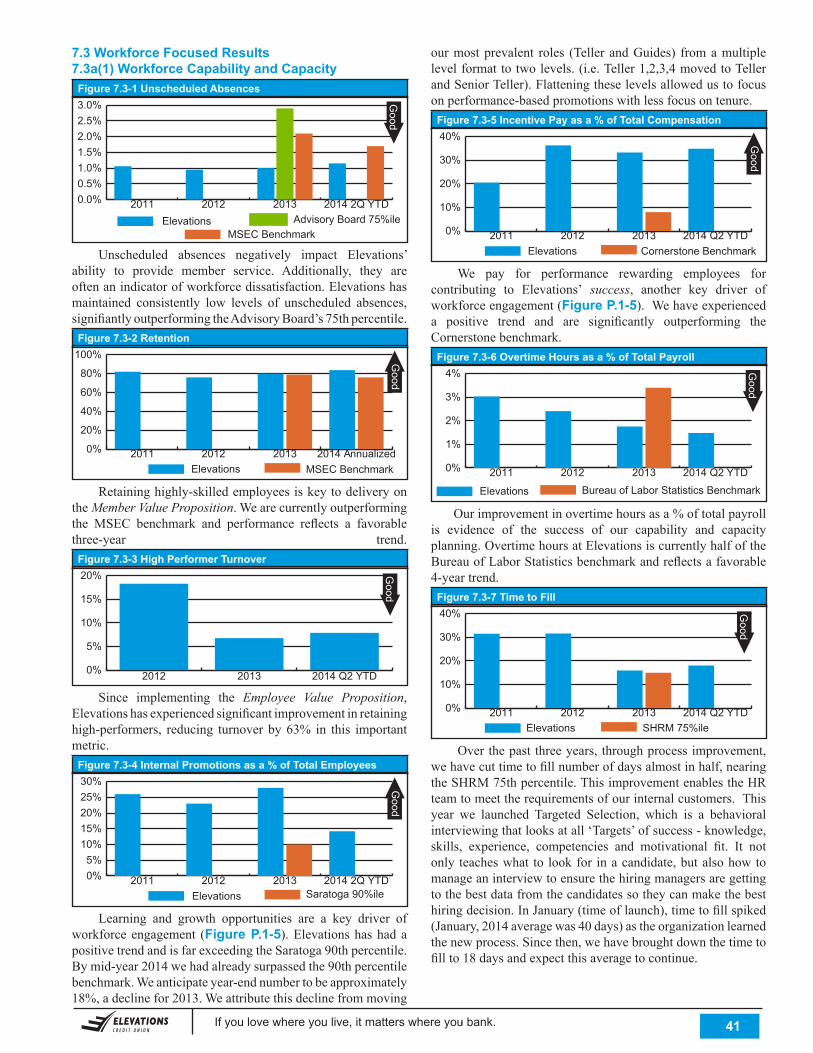
If you love where you live, it matters where you bank. . 41
ourmostprevalent roles (Teller andGuides) fromamultiplelevelformattotwolevels.(i.e.Teller1,2,3,4movedtoTellerandSeniorTeller).Flatteningtheselevelsallowedustofocusonperformance-basedpromotionswithlessfocusontenure.
Figure 7.3-5 Incentive Pay as a % of Total Compensation
0%
10%
20%
30%
40%
Cornerstone BenchmarkElevations2014 Q2 YTD201320122011
Good
We pay for performance rewarding employees forcontributing to Elevations’ success, another key driver ofworkforceengagement(Figure P.1-5).Wehaveexperienceda positive trend and are significantly outperforming theCornerstonebenchmark.
Figure 7.3-6 Overtime Hours as a % of Total Payroll
0%
1%
2%
3%
4%
Bureau of Labor Statistics BenchmarkElevations
2014 Q2 YTD201320122011
Good
Ourimprovementinovertimehoursasa%oftotalpayrollis evidence of the success of our capability and capacityplanning.OvertimehoursatElevationsiscurrentlyhalfoftheBureauofLaborStatisticsbenchmarkandreflectsafavorable4-yeartrend.
Figure 7.3-7 Time to Fill
0%
10%
20%
30%
40%
SHRM 75%ileElevations2014 Q2 YTD201320122011
Good
Overthepastthreeyears,throughprocessimprovement,wehavecuttimetofillnumberofdaysalmostinhalf,nearingtheSHRM75thpercentile.ThisimprovementenablestheHRteamtomeettherequirementsofourinternalcustomers.Thisyear we launched Targeted Selection, which is a behavioralinterviewingthatlooksatall‘Targets’ofsuccess-knowledge,skills, experience, competencies and motivational fit. It notonly teacheswhat to lookfor inacandidate,butalsohowtomanageaninterviewtoensurethehiringmanagersaregettingtothebestdatafromthecandidatessotheycanmakethebesthiringdecision.InJanuary(timeoflaunch),timetofillspiked(January,2014averagewas40days)astheorganizationlearnedthenewprocess.Sincethen,wehavebroughtdownthetimetofillto18daysandexpectthisaveragetocontinue.
7.3 Workforce Focused Results7.3a(1) Workforce Capability and Capacity
Figure 7.3-1 Unscheduled Absences
0.0%0.5%1.0%1.5%2.0%2.5%3.0%
MSEC BenchmarkAdvisory Board 75%ileElevations
2014 2Q YTD201320122011
Good
Unscheduled absences negatively impact Elevations’ability to provide member service. Additionally, they areoftenanindicatorofworkforcedissatisfaction.Elevationshasmaintained consistently low levels of unscheduled absences,signifiantlyoutperformingtheAdvisoryBoard’s75thpercentile.
Figure 7.3-2 Retention
0%
20%
40%
60%
80%
100%
MSEC BenchmarkElevations2014 Annualized201320122011
Good
Retaininghighly-skilledemployeesiskeytodeliveryontheMember Value Proposition.Wearecurrentlyoutperformingthe MSEC benchmark and performance reflects a favorablethree-year trend.
Figure 7.3-3 High Performer Turnover
0%
5%
10%
15%
20%
2014 Q2 YTD20132012
Good
Since implementing the Employee Value Proposition, Elevationshasexperiencedsignificantimprovementinretaininghigh-performers, reducing turnover by63% in this importantmetric.
Figure 7.3-4 Internal Promotions as a % of Total Employees
0%5%
10%15%20%25%30%
Saratoga 90%ileElevations2014 2Q YTD201320122011
Good
Learning and growth opportunities are a key driver ofworkforceengagement (Figure P.1-5).ElevationshashadapositivetrendandisfarexceedingtheSaratoga90thpercentile.Bymid-year2014wehadalreadysurpassedthe90thpercentilebenchmark.Weanticipateyear-endnumbertobeapproximately18%,adeclinefor2013.Weattributethisdeclinefrommoving
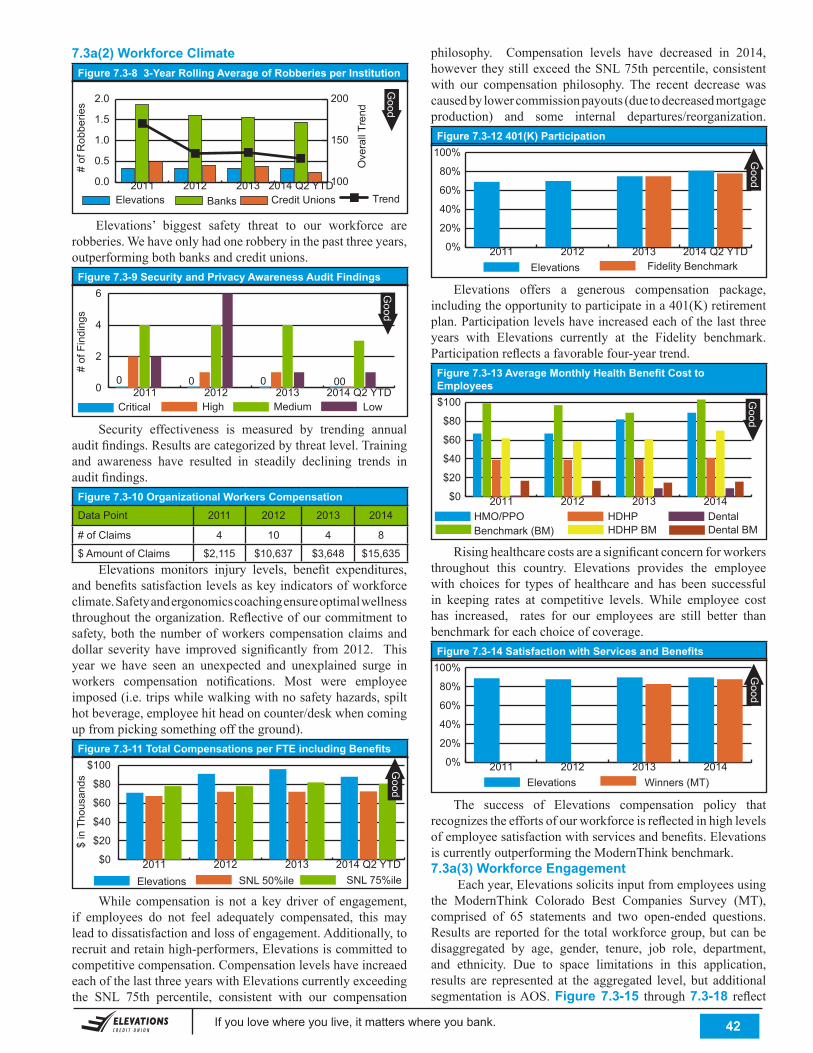
If you love where you live, it matters where you bank. . 42
7.3a(2) Workforce ClimateFigure 7.3-8 3-Year Rolling Average of Robberies per Institution
# of
Rob
berie
s
Good
0.0
0.5
1.0
1.5
2.0
100
150
200
Credit UnionsBanksElevations Trend2014 Q2 YTD201320122011
Ove
rall
Tren
d
Elevations’ biggest safety threat to our workforce arerobberies.Wehaveonlyhadonerobberyinthepastthreeyears,outperformingbothbanksandcreditunions.
Figure 7.3-9 Security and Privacy Awareness Audit Findings
0
2
4
6
LowMediumHighCritical 2014 Q2 YTD201320122011
# of
Fin
ding
s
Good
000
Security effectiveness is measured by trending annualauditfindings.Resultsarecategorizedbythreatlevel.Trainingand awareness have resulted in steadily declining trends inauditfindings.
Figure 7.3-10 Organizational Workers CompensationData Point 2011 2012 2013 2014
# of Claims 4 10 4 8
$ Amount of Claims $2,115 $10,637 $3,648 $15,635 Elevations monitors injury levels, benefit expenditures,andbenefitssatisfactionlevelsaskeyindicatorsofworkforceclimate.Safetyandergonomicscoachingensureoptimalwellnessthroughouttheorganization.Reflectiveofourcommitmenttosafety,both thenumberofworkerscompensationclaimsanddollar severity have improved significantly from2012. Thisyear we have seen an unexpected and unexplained surge inworkers compensation notifications. Most were employeeimposed(i.e.tripswhilewalkingwithnosafetyhazards,spilthotbeverage,employeehitheadoncounter/deskwhencomingupfrompickingsomethingofftheground).
Figure 7.3-11 Total Compensations per FTE including Benefits
$0
$20
$40
$60
$80
$100
SNL 75%ileSNL 50%ileElevations2014 Q2 YTD201320122011
Good
$ in
Tho
usan
ds
While compensation is not a key driver of engagement,if employees do not feel adequately compensated, this mayleadtodissatisfactionandlossofengagement.Additionally,torecruitandretainhigh-performers,Elevationsiscommittedtocompetitivecompensation.CompensationlevelshaveincreaedeachofthelastthreeyearswithElevationscurrentlyexceedingthe SNL 75th percentile, consistent with our compensation
philosophy. Compensation levels have decreased in 2014,howevertheystillexceedtheSNL75thpercentile,consistentwith our compensation philosophy. The recent decrease wascausedbylowercommissionpayouts(duetodecreasedmortgageproduction) and some internal departures/reorganization.
Figure 7.3-12 401(K) Participation
0%
20%
40%
60%
80%
100%
Fidelity BenchmarkElevations2014 Q2 YTD201320122011
Good
Elevations offers a generous compensation package,includingtheopportunitytoparticipateina401(K)retirementplan.Participationlevelshaveincreasedeachofthelastthreeyears with Elevations currently at the Fidelity benchmark.Participationreflectsafavorablefour-yeartrend.
Figure 7.3-13 Average Monthly Health Benefit Cost to Employees
$0
$20
$40
$60
$80
$100
Dental BMDental
HDHP BMHDHP
Benchmark (BM)HMO/PPO
2014201320122011
Good
Risinghealthcarecostsareasignificantconcernforworkersthroughout this country. Elevations provides the employeewith choices for types of healthcare and has been successfulin keeping rates at competitive levels.While employee costhas increased, rates for our employees are still better thanbenchmarkforeachchoiceofcoverage.
Figure 7.3-14 Satisfaction with Services and Benefits
0%
20%
40%
60%
80%
100%
Winners (MT)Elevations2014201320122011
Good
The success of Elevations compensation policy thatrecognizestheeffortsofourworkforceisreflectedinhighlevelsofemployeesatisfactionwithservicesandbenefits.ElevationsiscurrentlyoutperformingtheModernThinkbenchmark.7.3a(3) Workforce Engagement Eachyear,Elevationssolicitsinputfromemployeesusingthe ModernThink Colorado Best Companies Survey (MT),comprised of 65 statements and two open-ended questions.Resultsarereportedforthetotalworkforcegroup,butcanbedisaggregated by age, gender, tenure, job role, department,and ethnicity. Due to space limitations in this application,results are representedat the aggregated level, but additionalsegmentation isAOS.Figure 7.3-15 through7.3-18 reflect
0 0
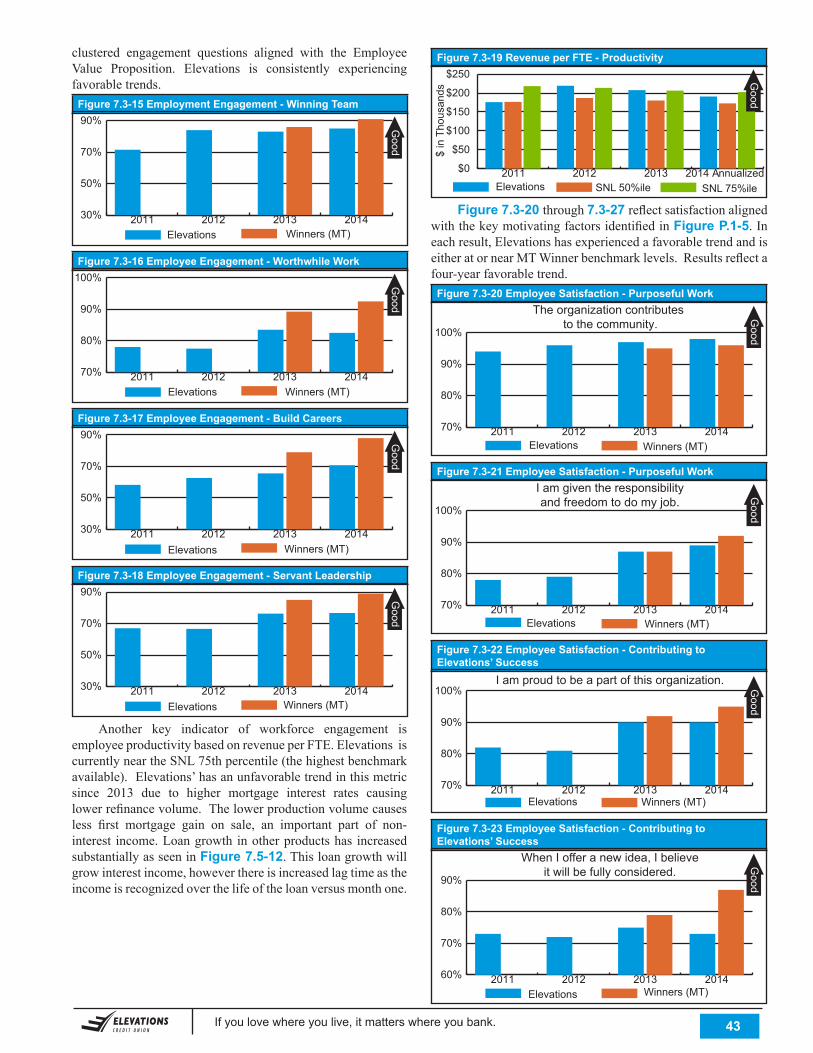
If you love where you live, it matters where you bank. . 43
clustered engagement questions aligned with the EmployeeValue Proposition. Elevations is consistently experiencingfavorabletrends.
Figure 7.3-15 Employment Engagement - Winning Team
30%
50%
70%
90%
Winners (MT)Elevations2014201320122011
Good
Figure 7.3-16 Employee Engagement - Worthwhile Work
70%
80%
90%
100%
Winners (MT)Elevations2014201320122011
Good
Figure 7.3-17 Employee Engagement - Build Careers
30%
50%
70%
90%
Winners (MT)Elevations2014201320122011
Good
Figure 7.3-18 Employee Engagement - Servant Leadership
30%
50%
70%
90%
Winners (MT)Elevations2014201320122011
Good
Another key indicator of workforce engagement isemployeeproductivitybasedonrevenueperFTE.ElevationsiscurrentlyneartheSNL75thpercentile(thehighestbenchmarkavailable).Elevations’hasanunfavorabletrendinthismetricsince 2013 due to higher mortgage interest rates causinglowerrefinancevolume.Thelowerproductionvolumecausesless first mortgage gain on sale, an important part of non-interest income.Loangrowth inotherproductshas increasedsubstantiallyasseeninFigure 7.5-12.Thisloangrowthwillgrowinterestincome,howeverthereisincreasedlagtimeastheincomeisrecognizedoverthelifeoftheloanversusmonthone.
Figure 7.3-19 Revenue per FTE - Productivity
$0
$50
$100
$150
$200
$250
SNL 75%ileSNL 50%ileElevations2014 Annualized201320122011
Good
$ in
Tho
usan
ds
Figure 7.3-20 through7.3-27 reflectsatisfactionalignedwiththekeymotivatingfactorsidentifiedinFigure P.1-5.Ineachresult,ElevationshasexperiencedafavorabletrendandiseitheratornearMTWinnerbenchmarklevels.Resultsreflectafour-yearfavorabletrend.
Figure 7.3-20 Employee Satisfaction - Purposeful Work
70%
80%
90%
100%
Winners (MT)Elevations2014201320122011
Good
The organization contributes to the community.
Figure 7.3-21 Employee Satisfaction - Purposeful Work
70%
80%
90%
100%
Winners (MT)Elevations2014201320122011
Good
I am given the responsibilityand freedom to do my job.
Figure 7.3-22 Employee Satisfaction - Contributing to Elevations’ Success
70%
80%
90%
100%
Winners (MT)Elevations2014201320122011
Good
I am proud to be a part of this organization.
Figure 7.3-23 Employee Satisfaction - Contributing to Elevations’ Success
60%
70%
80%
90%
Winners (MT)Elevations2014201320122011
Good
When I offer a new idea, I believeit will be fully considered.
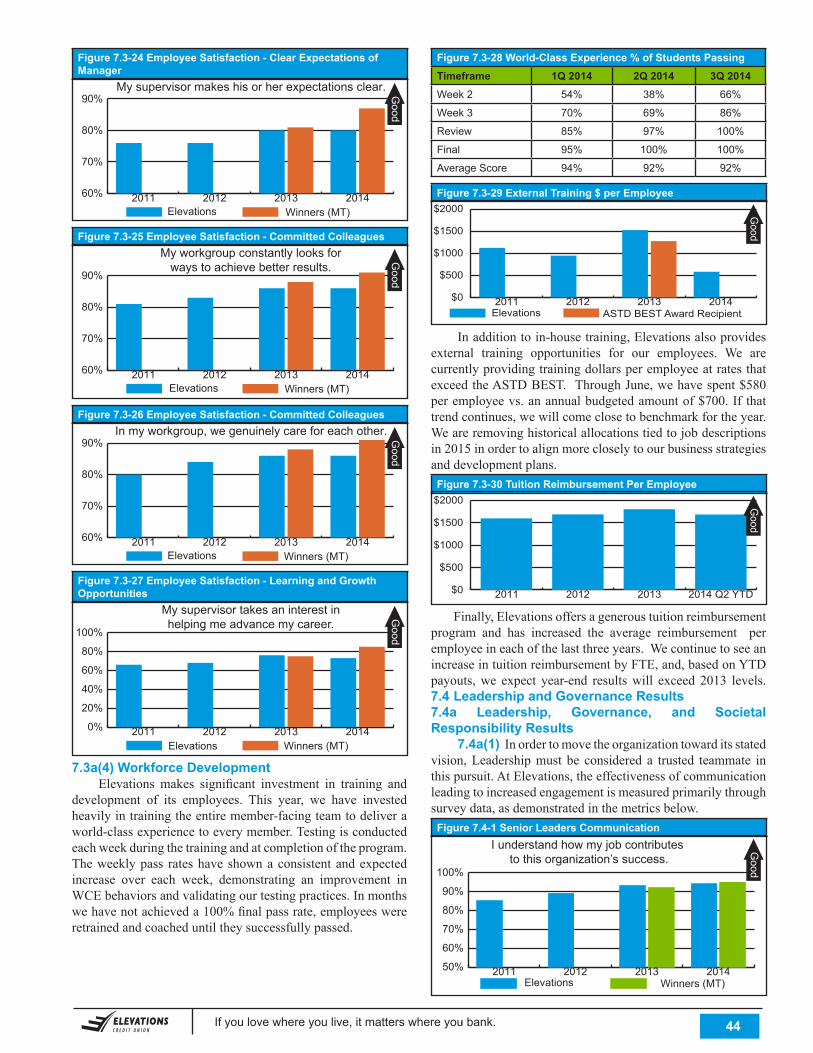
If you love where you live, it matters where you bank. . 44
Figure 7.3-24 Employee Satisfaction - Clear Expectations of Manager
60%
70%
80%
90%
Winners (MT)Elevations2014201320122011
Good
My supervisor makes his or her expectations clear.
Figure 7.3-25 Employee Satisfaction - Committed Colleagues
60%
70%
80%
90%
Winners (MT)Elevations2014201320122011
Good
My workgroup constantly looks forways to achieve better results.
Figure 7.3-26 Employee Satisfaction - Committed Colleagues
60%
70%
80%
90%
Winners (MT)Elevations2014201320122011
Good
In my workgroup, we genuinely care for each other.
Figure 7.3-27 Employee Satisfaction - Learning and Growth Opportunities
0%
20%
40%
60%
80%
100%
Winners (MT)Elevations2014201320122011
Good
My supervisor takes an interest inhelping me advance my career.
7.3a(4) Workforce Development Elevations makes significant investment in training anddevelopment of its employees. This year, we have investedheavilyintrainingtheentiremember-facingteamtodeliveraworld-classexperiencetoeverymember.Testingisconductedeachweekduringthetrainingandatcompletionoftheprogram.Theweeklypass rateshaveshownaconsistentandexpectedincrease over each week, demonstrating an improvement inWCEbehaviorsandvalidatingourtestingpractices.Inmonthswehavenotachieveda100%finalpassrate,employeeswereretrainedandcoacheduntiltheysuccessfullypassed.
Figure 7.3-28 World-Class Experience % of Students PassingTimeframe 1Q 2014 2Q 2014 3Q 2014Week 2 54% 38% 66%
Week 3 70% 69% 86%
Review 85% 97% 100%
Final 95% 100% 100%
Average Score 94% 92% 92%
Figure 7.3-29 External Training $ per Employee
$0
$500
$1000
$1500
$2000
ASTD BEST Award RecipientElevations2014201320122011
Good
Inadditiontoin-housetraining,Elevationsalsoprovidesexternal training opportunities for our employees. We arecurrentlyprovidingtrainingdollarsperemployeeatratesthatexceedtheASTDBEST.ThroughJune,wehavespent$580peremployeevs.anannualbudgetedamountof$700.If thattrendcontinues,wewillcomeclosetobenchmarkfortheyear.Weareremovinghistoricalallocationstiedtojobdescriptionsin2015inordertoalignmorecloselytoourbusinessstrategiesanddevelopmentplans.
Figure 7.3-30 Tuition Reimbursement Per Employee
$0
$500
$1000
$1500
$2000
2014 Q2 YTD201320122011
Good
Finally,Elevationsoffersageneroustuitionreimbursementprogram and has increased the average reimbursement peremployeeineachofthelastthreeyears.WecontinuetoseeanincreaseintuitionreimbursementbyFTE,and,basedonYTDpayouts,we expect year-end resultswill exceed 2013 levels.7.4 Leadership and Governance Results7.4a Leadership, Governance, and Societal Responsibility Results 7.4a(1) Inordertomovetheorganizationtowarditsstatedvision,Leadershipmust be considered a trusted teammate inthispursuit.AtElevations,theeffectivenessofcommunicationleadingtoincreasedengagementismeasuredprimarilythroughsurveydata,asdemonstratedinthemetricsbelow.
Figure 7.4-1 Senior Leaders Communication
50%
60%
70%
80%
90%
100%
Elevations2014201320122011
Good
I understand how my job contributes to this organization’s success.
Winners (MT)
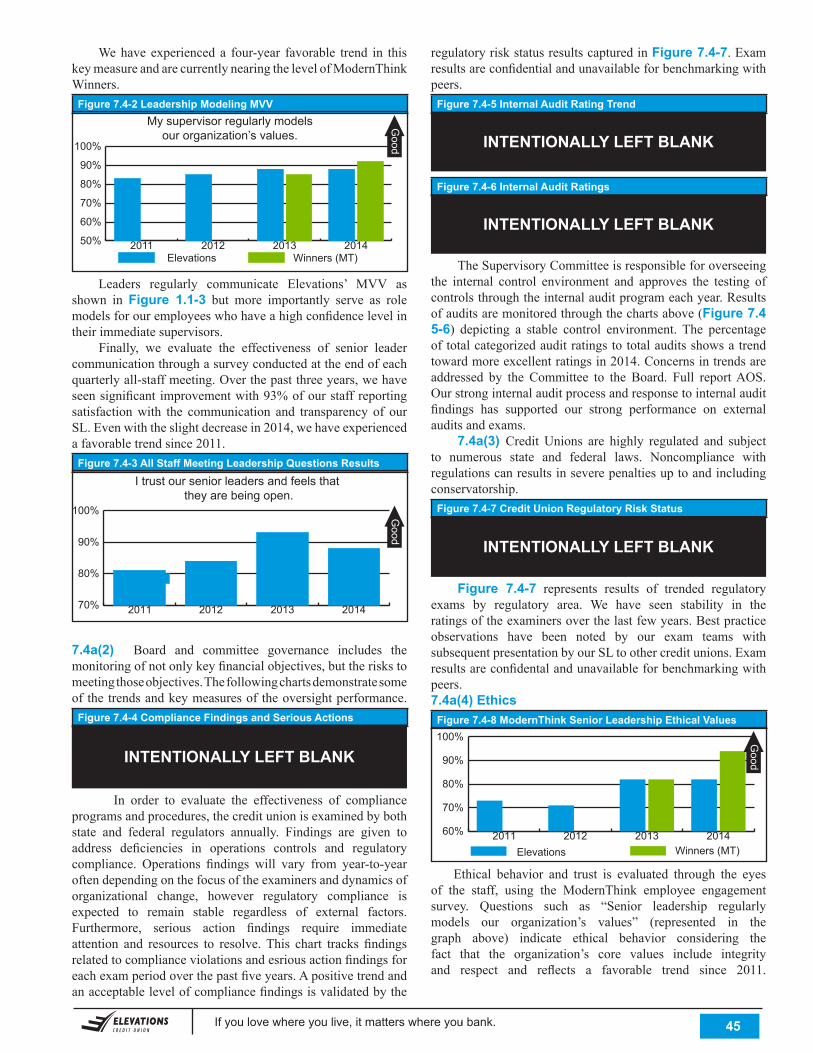
If you love where you live, it matters where you bank. . 45
Wehave experienced a four-year favorable trend in thiskeymeasureandarecurrentlynearingthelevelofModernThinkWinners.
Figure 7.4-2 Leadership Modeling MVV
Good
My supervisor regularly modelsour organization’s values.
50%
60%
70%
80%
90%
100%
Elevations2014201320122011
Winners (MT)
Leaders regularly communicate Elevations’ MVV asshown in Figure 1.1-3 but more importantly serve as rolemodelsforouremployeeswhohaveahighconfidencelevelintheirimmediatesupervisors. Finally, we evaluate the effectiveness of senior leadercommunicationthroughasurveyconductedattheendofeachquarterlyall-staffmeeting.Overthepastthreeyears,wehaveseensignificant improvementwith93%ofourstaffreportingsatisfactionwith the communication and transparency of ourSL.Evenwiththeslightdecreasein2014,wehaveexperiencedafavorabletrendsince2011.
Figure 7.4-3 All Staff Meeting Leadership Questions Results
70%
80%
90%
100%
2014201320122011
Good
I trust our senior leaders and feels that they are being open.
7.4a(2) Board and committee governance includes themonitoringofnotonlykeyfinancialobjectives,buttheriskstomeetingthoseobjectives.Thefollowingchartsdemonstratesomeofthetrendsandkeymeasuresoftheoversightperformance.
Figure 7.4-4 Compliance Findings and Serious Actions
INTENTIONALLY LEFT BLANK
In order to evaluate the effectiveness of complianceprogramsandprocedures,thecreditunionisexaminedbybothstate and federal regulators annually. Findings are given toaddress deficiencies in operations controls and regulatorycompliance. Operations findings will vary from year-to-yearoftendependingonthefocusoftheexaminersanddynamicsoforganizational change, however regulatory compliance isexpected to remain stable regardless of external factors.Furthermore, serious action findings require immediateattention and resources to resolve.This chart tracks findingsrelatedtocomplianceviolationsandesriousactionfindingsforeachexamperiodoverthepastfiveyears.Apositivetrendandanacceptablelevelofcompliancefindingsisvalidatedbythe
regulatoryriskstatusresultscapturedinFigure 7.4-7.Examresultsareconfidentialandunavailableforbenchmarkingwithpeers.
Figure 7.4-5 Internal Audit Rating Trend
INTENTIONALLY LEFT BLANK
Figure 7.4-6 Internal Audit Ratings
INTENTIONALLY LEFT BLANK
TheSupervisoryCommitteeisresponsibleforoverseeingthe internal control environment and approves the testing ofcontrolsthroughtheinternalauditprogrameachyear.Resultsofauditsaremonitoredthroughthechartsabove(Figure 7.4 5-6) depicting a stable control environment. The percentageoftotalcategorizedauditratingstototalauditsshowsatrendtowardmoreexcellentratingsin2014.Concernsintrendsareaddressed by the Committee to the Board. Full reportAOS.Ourstronginternalauditprocessandresponsetointernalauditfindings has supported our strong performance on externalauditsandexams. 7.4a(3) Credit Unions are highly regulated and subjectto numerous state and federal laws. Noncompliance withregulationscanresultsinseverepenaltiesuptoandincludingconservatorship.
Figure 7.4-7 Credit Union Regulatory Risk Status
INTENTIONALLY LEFT BLANK
Figure 7.4-7 represents results of trended regulatoryexams by regulatory area. We have seen stability in theratingsoftheexaminersoverthelastfewyears.Bestpracticeobservations have been noted by our exam teams withsubsequentpresentationbyourSLtoothercreditunions.Examresultsareconfidentalandunavailableforbenchmarkingwithpeers. 7.4a(4) Ethics
Figure 7.4-8 ModernThink Senior Leadership Ethical Values
60%
70%
80%
90%
100%
Winners (MT)Elevations2014201320122011
Good
Ethical behavior and trust is evaluated through the eyesof the staff, using the ModernThink employee engagementsurvey. Questions such as “Senior leadership regularlymodels our organization’s values” (represented in thegraph above) indicate ethical behavior considering thefact that the organization’s core values include integrityand respect and reflects a favorable trend since 2011.
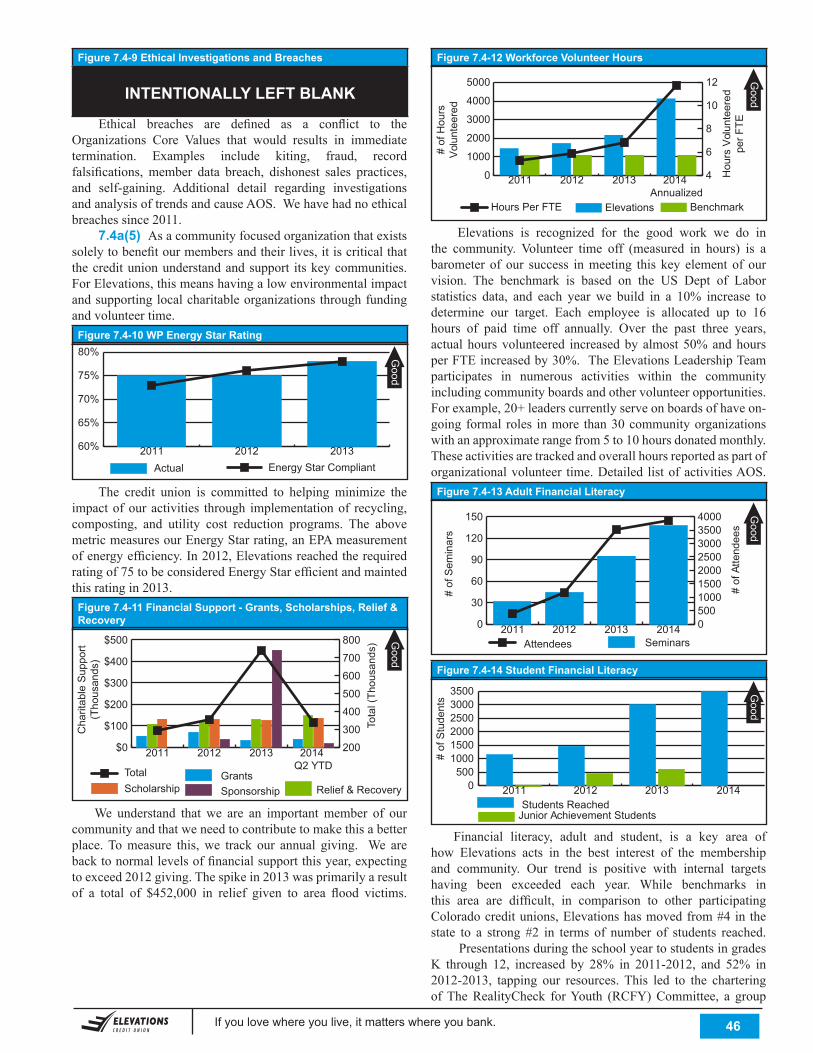
If you love where you live, it matters where you bank. . 46
Figure 7.4-9 Ethical Investigations and Breaches
INTENTIONALLY LEFT BLANK4
Ethical breaches are defined as a conflict to theOrganizations Core Values that would results in immediatetermination. Examples include kiting, fraud, recordfalsifications,member data breach, dishonest sales practices,and self-gaining. Additional detail regarding investigationsandanalysisoftrendsandcauseAOS.Wehavehadnoethicalbreachessince2011. 7.4a(5) Asacommunityfocusedorganizationthatexistssolelytobenefitourmembersandtheirlives,itiscriticalthatthecreditunionunderstandandsupport itskeycommunities.ForElevations,thismeanshavingalowenvironmentalimpactandsupportinglocalcharitableorganizationsthroughfundingandvolunteertime.
Figure 7.4-10 WP Energy Star Rating
60%
65%
70%
75%
80%
Energy Star CompliantActual 201320122011
Good
The credit union is committed to helping minimize theimpactofouractivities through implementationof recycling,composting, and utility cost reduction programs. The abovemetricmeasuresourEnergyStarrating,anEPAmeasurementofenergyefficiency.In2012,Elevationsreachedtherequiredratingof75tobeconsideredEnergyStarefficientandmaintedthisratingin2013.
Figure 7.4-11 Financial Support - Grants, Scholarships, Relief & Recovery
Good
$0
$100
$200
$300
$400
$500
200
300
400
500
600
700
800
Relief & RecoverySponsorshipScholarshipGrantsTotal
2014 Q2 YTD
201320122011
Cha
ritab
le S
uppo
rt(T
hous
ands
)
Tota
l (Th
ousa
nds)
We understand that we are an importantmember of ourcommunityandthatweneedtocontributetomakethisabetterplace.Tomeasure this,we track our annual giving. We arebacktonormallevelsoffinancialsupportthisyear,expectingtoexceed2012giving.Thespikein2013wasprimarilyaresultof a total of $452,000 in relief given to area flood victims.
Figure 7.4-12 Workforce Volunteer HoursG
ood
# of
Hou
rs
Vol
unte
ered
Hou
rs V
olun
teer
ed
per F
TE
0
1000
2000
3000
4000
5000
4
6
8
10
12
BenchmarkElevationsHours Per FTE
2014 Annualized
201320122011
Elevations is recognized for the good work we do inthe community. Volunteer time off (measured in hours) is abarometer of our success inmeeting this key element of ourvision. The benchmark is based on the US Dept of Laborstatistics data, and each year we build in a 10% increase todetermine our target. Each employee is allocated up to 16hours of paid time off annually. Over the past three years,actualhoursvolunteered increasedbyalmost50%andhoursperFTEincreasedby30%.TheElevationsLeadershipTeamparticipates in numerous activities within the communityincludingcommunityboardsandothervolunteeropportunities.Forexample,20+leaderscurrentlyserveonboardsofhaveon-going formal roles inmore than30communityorganizationswithanapproximaterangefrom5to10hoursdonatedmonthly.Theseactivitiesaretrackedandoverallhoursreportedaspartoforganizationalvolunteer time.Detailed listofactivitiesAOS.
Figure 7.4-13 Adult Financial Literacy
Good
0
30
60
90
120
150
05001000150020002500300035004000
SeminarsAttendees2014201320122011
# of
Sem
inar
s
# of
Atte
ndee
s
Figure 7.4-14 Student Financial Literacy
0500
100015002000250030003500
Junior Achievement StudentsStudents Reached
2014201320122011
Good
# of
Stu
dent
s
Financial literacy, adult and student, is a key area ofhow Elevations acts in the best interest of the membershipand community. Our trend is positive with internal targetshaving been exceeded each year. While benchmarks inthis area are difficult, in comparison to other participatingColoradocreditunions,Elevationshasmovedfrom#4inthestate to a strong #2 in terms of number of students reached. PresentationsduringtheschoolyeartostudentsingradesK through 12, increased by 28% in 2011-2012, and 52% in2012-2013, tapping our resources.This led to the charteringofTheRealityCheck forYouth (RCFY)Committee, a group
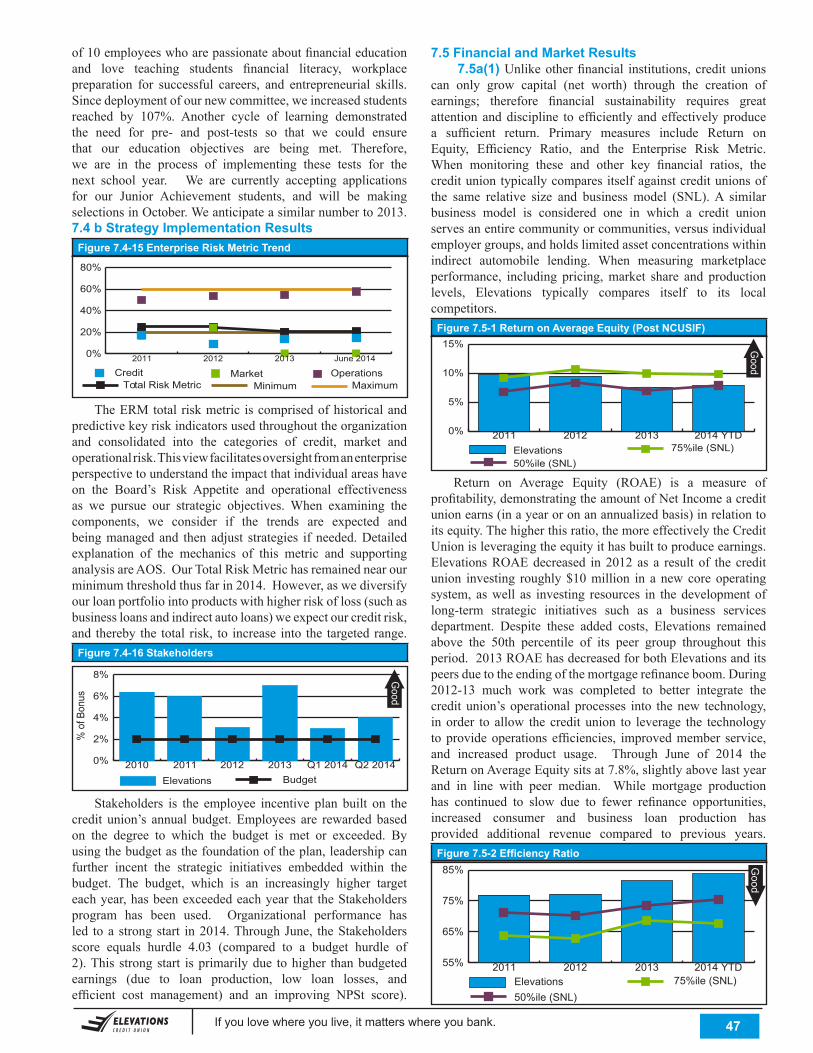
If you love where you live, it matters where you bank. . 47
of10employeeswhoarepassionateaboutfinancialeducationand love teaching students financial literacy, workplacepreparation for successful careers, and entrepreneurial skills.Sincedeploymentofournewcommittee,weincreasedstudentsreached by 107%. Another cycle of learning demonstratedthe need for pre- and post-tests so that we could ensurethat our education objectives are being met. Therefore,we are in the process of implementing these tests for thenext school year. We are currently accepting applicationsfor our Junior Achievement students, and will be makingselectionsinOctober.Weanticipateasimilarnumberto2013.7.4 b Strategy Implementation Results
Figure 7.4-15 Enterprise Risk Metric Trend
0%
20%
40%
60%
80%
MaximumMinimumTotal Risk MetricOperationsMarketCreditJune 2014 201320122011
TheERMtotal riskmetric iscomprisedofhistoricalandpredictivekeyriskindicatorsusedthroughouttheorganizationand consolidated into the categories of credit, market andoperationalrisk.Thisviewfacilitatesoversightfromanenterpriseperspectivetounderstandtheimpactthatindividualareashaveon the Board’s Risk Appetite and operational effectivenessas we pursue our strategic objectives. When examining thecomponents, we consider if the trends are expected andbeingmanagedand thenadjust strategies if needed.Detailedexplanation of the mechanics of this metric and supportinganalysisareAOS.OurTotalRiskMetrichasremainednearourminimumthresholdthusfarin2014.However,aswediversifyourloanportfoliointoproductswithhigherriskofloss(suchasbusinessloansandindirectautoloans)weexpectourcreditrisk,and thereby the total risk, to increase into the targetedrange.
Figure 7.4-16 Stakeholders
0%
2%
4%
6%
8%
Elevations BudgetQ2 2014Q1 20142013201220112010
% o
f Bon
us
Good
Stakeholders is the employee incentive plan built on thecredit union’s annual budget.Employees are rewarded basedon the degree to which the budget is met or exceeded. Byusingthebudgetasthefoundationoftheplan,leadershipcanfurther incent the strategic initiatives embedded within thebudget. The budget, which is an increasingly higher targeteachyear,hasbeenexceededeachyear that theStakeholdersprogram has been used. Organizational performance hasled toa strongstart in2014.ThroughJune, theStakeholdersscore equals hurdle 4.03 (compared to a budget hurdle of2).This strongstart isprimarilydue tohigher thanbudgetedearnings (due to loan production, low loan losses, andefficient cost management) and an improving NPSt score).
7.5 Financial and Market Results 7.5a(1)Unlikeotherfinancial institutions, creditunionscan only grow capital (net worth) through the creation ofearnings; therefore financial sustainability requires greatattention anddiscipline to efficiently and effectivelyproducea sufficient return. Primary measures include Return onEquity, Efficiency Ratio, and the Enterprise Risk Metric.When monitoring these and other key financial ratios, thecredituniontypicallycomparesitselfagainstcreditunionsofthe same relative size and business model (SNL).A similarbusiness model is considered one in which a credit unionservesanentirecommunityorcommunities,versusindividualemployergroups,andholdslimitedassetconcentrationswithinindirect automobile lending. When measuring marketplaceperformance, including pricing,market share and productionlevels, Elevations typically compares itself to its localcompetitors.
Figure 7.5-1 Return on Average Equity (Post NCUSIF)
0%
5%
10%
15%
Elevations 75%ile (SNL)50%ile (SNL)
2014 YTD201320122011
Good
Return on Average Equity (ROAE) is a measure ofprofitability,demonstratingtheamountofNetIncomeacreditunionearns(inayearoronanannualizedbasis)inrelationtoitsequity.Thehigherthisratio,themoreeffectivelytheCreditUnionisleveragingtheequityithasbuilttoproduceearnings.ElevationsROAEdecreased in2012as a result of the creditunion investing roughly$10million in a newcoreoperatingsystem, aswell as investing resources in thedevelopmentoflong-term strategic initiatives such as a business servicesdepartment. Despite these added costs, Elevations remainedabove the 50th percentile of its peer group throughout thisperiod.2013ROAEhasdecreasedforbothElevationsanditspeersduetotheendingofthemortgagerefinanceboom.During2012-13 much work was completed to better integrate thecredit union’soperationalprocesses into thenew technology,inorder to allow the credit union to leverage the technologytoprovideoperations efficiencies, improvedmember service,and increased product usage. Through June of 2014 theReturnonAverageEquitysitsat7.8%,slightlyabovelastyearand in line with peer median. While mortgage productionhas continued to slow due to fewer refinance opportunities,increased consumer and business loan production hasprovided additional revenue compared to previous years.
Figure 7.5-2 Efficiency Ratio
55%
65%
75%
85%
Elevations 75%ile (SNL)50%ile (SNL)
2014 YTD201320122011
Good
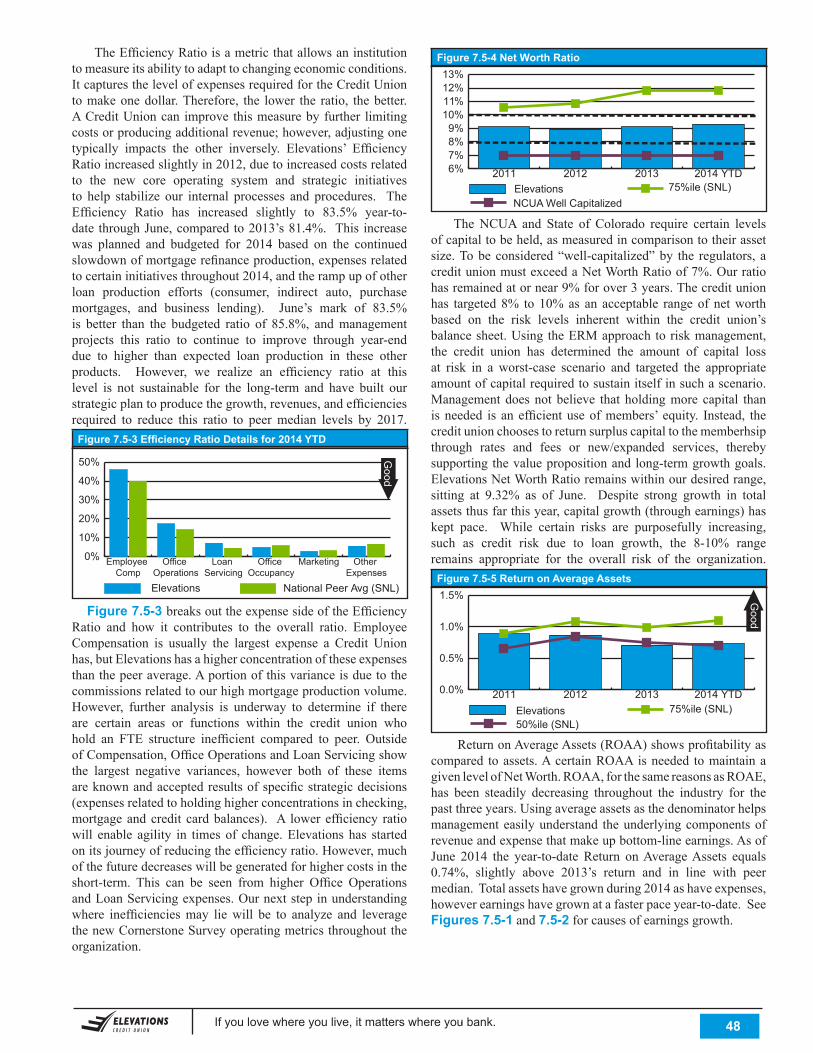
If you love where you live, it matters where you bank. . 48
TheEfficiencyRatioisametricthatallowsaninstitutiontomeasureitsabilitytoadapttochangingeconomicconditions.ItcapturesthelevelofexpensesrequiredfortheCreditUniontomakeonedollar.Therefore, the lower the ratio, thebetter.ACreditUnioncan improve thismeasurebyfurther limitingcostsorproducingadditionalrevenue;however,adjustingonetypically impacts the other inversely. Elevations’ EfficiencyRatioincreasedslightlyin2012,duetoincreasedcostsrelatedto the new core operating system and strategic initiativesto help stabilize our internal processes and procedures. TheEfficiency Ratio has increased slightly to 83.5% year-to-date throughJune,comparedto2013’s81.4%. This increasewas planned and budgeted for 2014 based on the continuedslowdownofmortgagerefinanceproduction,expensesrelatedtocertaininitiativesthroughout2014,andtherampupofotherloan production efforts (consumer, indirect auto, purchasemortgages, and business lending). June’s mark of 83.5%is better than the budgeted ratio of 85.8%, andmanagementprojects this ratio to continue to improve through year-enddue to higher than expected loan production in these otherproducts. However, we realize an efficiency ratio at thislevel is not sustainable for the long-term and have built ourstrategicplantoproducethegrowth,revenues,andefficienciesrequired to reduce this ratio to peermedian levels by 2017.
Figure 7.5-3 Efficiency Ratio Details for 2014 YTD
0%
10%
20%
30%
40%
50%
National Peer Avg (SNL)Elevations
Other Expenses
MarketingOffice Occupancy
Loan Servicing
Office Operations
Employee Comp
Good
Figure 7.5-3 breaksouttheexpensesideoftheEfficiencyRatio and how it contributes to the overall ratio. EmployeeCompensation is usually the largest expense a Credit Unionhas,butElevationshasahigherconcentrationoftheseexpensesthanthepeeraverage.Aportionofthisvarianceisduetothecommissionsrelatedtoourhighmortgageproductionvolume.However, further analysis is underway to determine if thereare certain areas or functions within the credit union whohold an FTE structure inefficient compared to peer. OutsideofCompensation,OfficeOperationsandLoanServicingshowthe largest negative variances, however both of these itemsareknownandacceptedresultsofspecificstrategicdecisions(expensesrelatedtoholdinghigherconcentrationsinchecking,mortgageandcredit cardbalances). A lowerefficiency ratiowill enable agility in times of change.Elevations has startedonitsjourneyofreducingtheefficiencyratio.However,muchofthefuturedecreaseswillbegeneratedforhighercostsintheshort-term. This can be seen from higher Office OperationsandLoanServicingexpenses.Ournextstepinunderstandingwhere inefficienciesmay liewill be to analyze and leveragethenewCornerstoneSurveyoperatingmetricsthroughouttheorganization.
Figure 7.5-4 Net Worth Ratio
6%7%8%9%
10%11%12%13%
Elevations 75%ile (SNL)NCUA Well Capitalized
2014 YTD201320122011
TheNCUA and State of Colorado require certain levelsofcapitaltobeheld,asmeasuredincomparisontotheirassetsize.Tobeconsidered“well-capitalized”by the regulators, acreditunionmustexceedaNetWorthRatioof7%.Ourratiohasremainedatornear9%forover3years.Thecreditunionhas targeted8% to10%as an acceptable rangeof networthbased on the risk levels inherent within the credit union’sbalancesheet.Using theERMapproachtoriskmanagement,the credit union has determined the amount of capital lossat risk in a worst-case scenario and targeted the appropriateamountofcapitalrequiredtosustainitselfinsuchascenario.Managementdoesnot believe that holdingmore capital thanisneeded is anefficientuseofmembers’ equity. Instead, thecreditunionchoosestoreturnsurpluscapitaltothememberhsipthrough rates and fees or new/expanded services, therebysupportingthevaluepropositionandlong-termgrowthgoals.ElevationsNetWorthRatioremainswithinourdesiredrange,sitting at 9.32% as of June. Despite strong growth in totalassetsthusfarthisyear,capitalgrowth(throughearnings)haskept pace. While certain risks are purposefully increasing,such as credit risk due to loan growth, the 8-10% rangeremains appropriate for the overall risk of the organization.
Figure 7.5-5 Return on Average Assets
0.0%
0.5%
1.0%
1.5%
Elevations 75%ile (SNL)50%ile (SNL)
2014 YTD201320122011
Good
ReturnonAverageAssets(ROAA)showsprofitabilityascompared toassets.AcertainROAAisneeded tomaintainagivenlevelofNetWorth.ROAA,forthesamereasonsasROAE,has been steadily decreasing throughout the industry for thepastthreeyears.Usingaverageassetsasthedenominatorhelpsmanagementeasilyunderstand theunderlyingcomponentsofrevenueandexpensethatmakeupbottom-lineearnings.AsofJune 2014 the year-to-date Return onAverageAssets equals0.74%, slightly above 2013’s return and in line with peermedian.Totalassetshavegrownduring2014ashaveexpenses,howeverearningshavegrownatafasterpaceyear-to-date.SeeFigures 7.5-1 and 7.5-2forcausesofearningsgrowth.
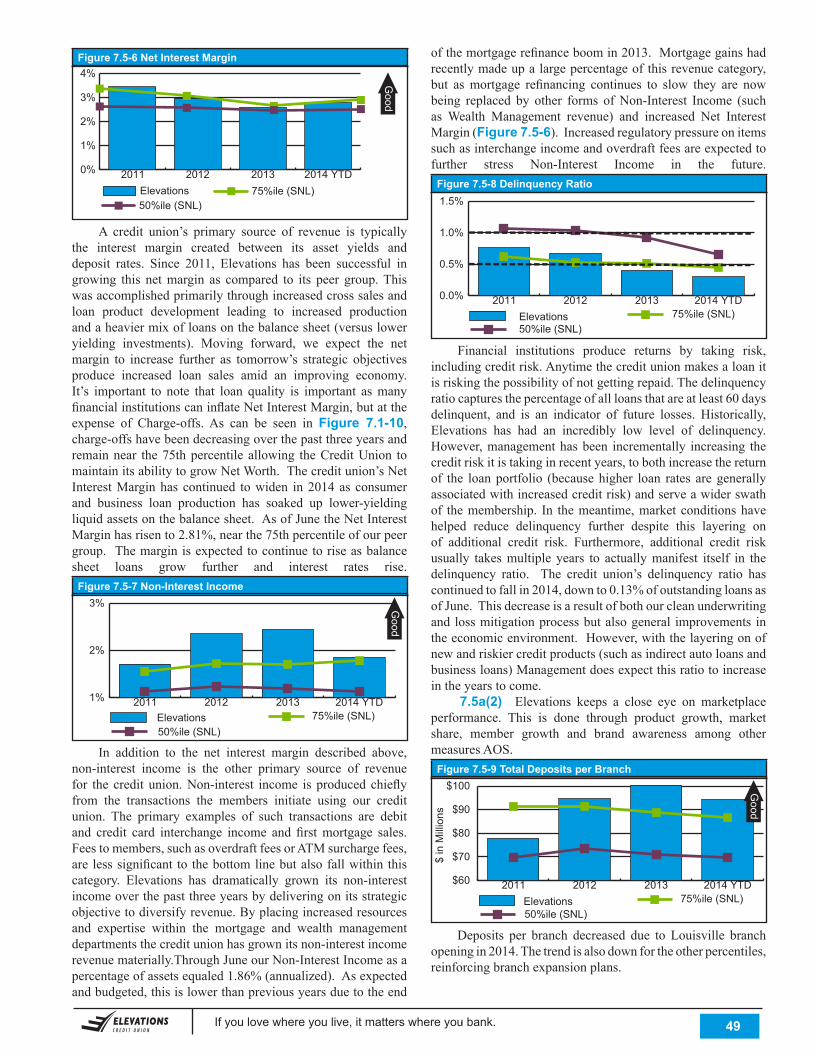
If you love where you live, it matters where you bank. . 49
Figure 7.5-6 Net Interest Margin
0%
1%
2%
3%
4%
Elevations 75%ile (SNL)50%ile (SNL)
2014 YTD201320122011
Good
A credit union’s primary source of revenue is typicallythe interest margin created between its asset yields anddeposit rates. Since 2011, Elevations has been successful ingrowing this netmargin as compared to its peer group.Thiswasaccomplishedprimarilythroughincreasedcrosssalesandloan product development leading to increased productionandaheaviermixofloansonthebalancesheet(versusloweryielding investments). Moving forward, we expect the netmargin to increase further as tomorrow’s strategic objectivesproduce increased loan sales amid an improving economy.It’s important to note that loan quality is important asmanyfinancialinstitutionscaninflateNetInterestMargin,butattheexpense of Charge-offs.As can be seen in Figure 7.1-10, charge-offshavebeendecreasingoverthepastthreeyearsandremainnear the75thpercentileallowing theCreditUnion tomaintainitsabilitytogrowNetWorth.Thecreditunion’sNetInterestMarginhascontinued towiden in2014asconsumerand business loan production has soaked up lower-yieldingliquidassetsonthebalancesheet.AsofJunetheNetInterestMarginhasrisento2.81%,nearthe75thpercentileofourpeergroup. Themarginisexpectedtocontinuetoriseasbalancesheet loans grow further and interest rates rise.
Figure 7.5-7 Non-Interest Income
1%
2%
3%
Elevations 75%ile (SNL)50%ile (SNL)
2014 YTD201320122011
Good
In addition to the net interest margin described above,non-interest income is the other primary source of revenuefor the credit union.Non-interest income isproducedchieflyfrom the transactions the members initiate using our creditunion. The primary examples of such transactions are debitand credit card interchange income and firstmortgage sales.Feestomembers,suchasoverdraftfeesorATMsurchargefees,are lesssignificant to thebottomlinebutalsofallwithinthiscategory. Elevations has dramatically grown its non-interestincomeoverthepastthreeyearsbydeliveringonitsstrategicobjectivetodiversifyrevenue.Byplacingincreasedresourcesand expertise within the mortgage and wealth managementdepartmentsthecreditunionhasgrownitsnon-interestincomerevenuematerially.ThroughJuneourNon-InterestIncomeasapercentageofassetsequaled1.86%(annualized).Asexpectedandbudgeted,thisislowerthanpreviousyearsduetotheend
ofthemortgagerefinanceboomin2013.Mortgagegainshadrecentlymadeupalargepercentageofthisrevenuecategory,but asmortgage refinancing continues to slow they are nowbeing replaced by other forms ofNon-Interest Income (suchasWealth Management revenue) and increased Net InterestMargin(Figure 7.5-6).Increasedregulatorypressureonitemssuchasinterchangeincomeandoverdraftfeesareexpectedtofurther stress Non-Interest Income in the future.
Figure 7.5-8 Delinquency Ratio
0.0%
0.5%
1.0%
1.5%
Elevations 75%ile (SNL)50%ile (SNL)
2014 YTD201320122011
Financial institutions produce returns by taking risk,includingcreditrisk.Anytimethecreditunionmakesaloanitisriskingthepossibilityofnotgettingrepaid.Thedelinquencyratiocapturesthepercentageofallloansthatareatleast60daysdelinquent, and is an indicator of future losses. Historically,Elevations has had an incredibly low level of delinquency.However,managementhasbeen incrementally increasing thecreditriskitistakinginrecentyears,tobothincreasethereturnof the loanportfolio (becausehigher loan rates aregenerallyassociatedwithincreasedcreditrisk)andserveawiderswathof themembership. In themeantime,marketconditionshavehelped reduce delinquency further despite this layering onof additional credit risk. Furthermore, additional credit riskusually takesmultiple years to actuallymanifest itself in thedelinquency ratio. The credit union’s delinquency ratio hascontinuedtofallin2014,downto0.13%ofoutstandingloansasofJune.Thisdecreaseisaresultofbothourcleanunderwritingandlossmitigationprocessbutalsogeneral improvements intheeconomicenvironment.However,withthelayeringonofnewandriskiercreditproducts(suchasindirectautoloansandbusinessloans)Managementdoesexpectthisratiotoincreaseintheyearstocome. 7.5a(2) Elevations keeps a close eye on marketplaceperformance. This is done through product growth, marketshare, member growth and brand awareness among othermeasuresAOS.
Figure 7.5-9 Total Deposits per Branch
$60
$70
$80
$90
$100
Elevations 75%ile (SNL)50%ile (SNL)
2014 YTD201320122011
Good
$ in
Mill
ions
Deposits per branch decreased due to Louisville branchopeningin2014.Thetrendisalsodownfortheotherpercentiles,reinforcingbranchexpansionplans.
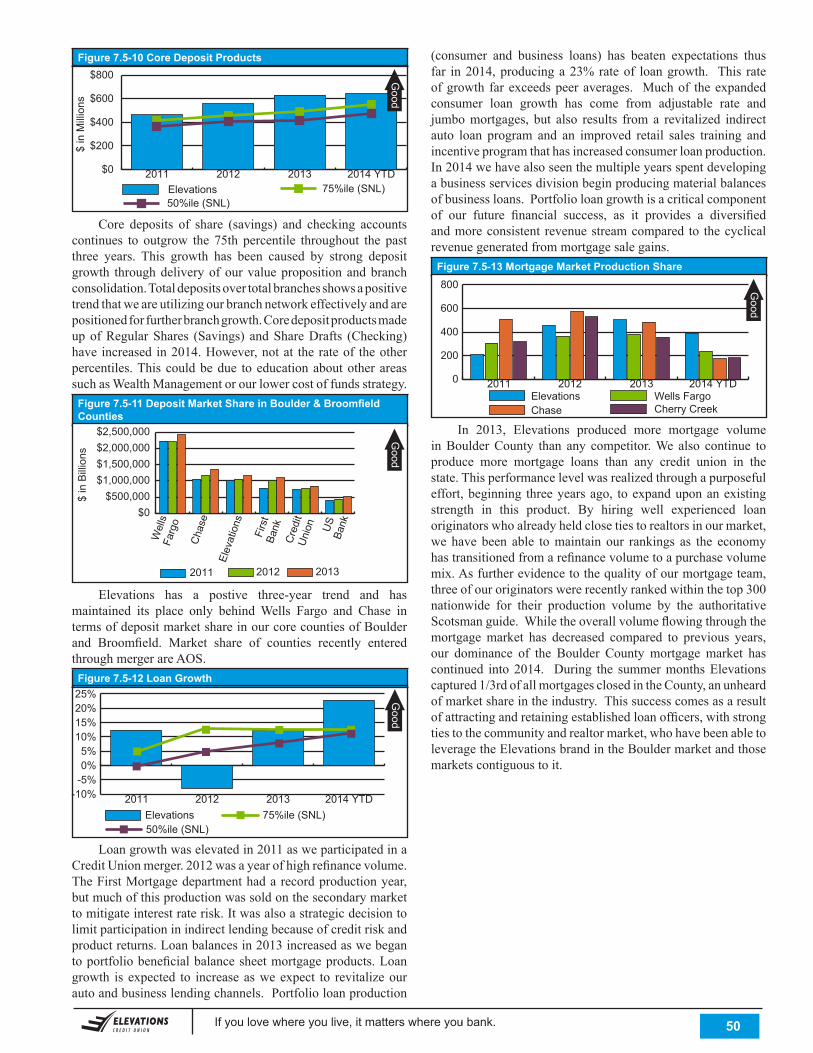
If you love where you live, it matters where you bank. . 50
Figure 7.5-10 Core Deposit Products
$0
$200
$400
$600
$800
Elevations 75%ile (SNL)50%ile (SNL)
2014 YTD201320122011
Good
$ in
Mill
ions
Core deposits of share (savings) and checking accountscontinues to outgrow the 75th percentile throughout the pastthree years. This growth has been caused by strong depositgrowth throughdeliveryofourvaluepropositionandbranchconsolidation.Totaldepositsovertotalbranchesshowsapositivetrendthatweareutilizingourbranchnetworkeffectivelyandarepositionedforfurtherbranchgrowth.CoredepositproductsmadeupofRegularShares (Savings) andShareDrafts (Checking)have increasedin2014.However,notat therateof theotherpercentiles.Thiscouldbedue toeducationaboutotherareassuchasWealthManagementorourlowercostoffundsstrategy.
Figure 7.5-11 Deposit Market Share in Boulder & Broomfield Counties
Good
$0 $500,000
$1,000,000 $1,500,000 $2,000,000 $2,500,000
201320122011
US
Ban
k
Cre
dit
Uni
onFirs
tBa
nk
Elev
atio
ns
Cha
se
Wel
ls F
argo
$ in
Bill
ions
Elevations has a postive three-year trend and hasmaintained its place only behindWells Fargo and Chase intermsofdepositmarketshareinourcorecountiesofBoulderand Broomfield. Market share of counties recently enteredthroughmergerareAOS.
Figure 7.5-12 Loan Growth
Good
-10%-5%0%5%
10%15%20%25%
Elevations 75%ile (SNL)50%ile (SNL)
2014 YTD201320122011
Loangrowthwaselevatedin2011asweparticipatedinaCreditUnionmerger.2012wasayearofhighrefinancevolume.TheFirstMortgagedepartmenthadarecordproductionyear,butmuchofthisproductionwassoldonthesecondarymarkettomitigateinterestraterisk.Itwasalsoastrategicdecisiontolimitparticipationinindirectlendingbecauseofcreditriskandproductreturns.Loanbalancesin2013increasedaswebegantoportfoliobeneficialbalancesheetmortgageproducts.Loangrowth is expected to increaseasweexpect to revitalizeourautoandbusinesslendingchannels.Portfolioloanproduction
(consumer and business loans) has beaten expectations thusfar in2014,producinga23%rateof loangrowth. This rateofgrowth farexceedspeeraverages. Muchof theexpandedconsumer loan growth has come from adjustable rate andjumbomortgages, but also results from a revitalized indirectauto loan program and an improved retail sales training andincentiveprogramthathasincreasedconsumerloanproduction.In2014wehavealsoseenthemultipleyearsspentdevelopingabusinessservicesdivisionbeginproducingmaterialbalancesofbusinessloans.Portfolioloangrowthisacriticalcomponentof our future financial success, as it provides a diversifiedandmoreconsistent revenuestreamcompared to thecyclicalrevenuegeneratedfrommortgagesalegains.
Figure 7.5-13 Mortgage Market Production Share
0
200
400
600
800
Cherry CreekChaseWells FargoElevations
2014 YTD201320122011
Good
In 2013, Elevations produced more mortgage volumeinBoulderCounty than any competitor.We also continue toproduce more mortgage loans than any credit union in thestate.Thisperformancelevelwasrealizedthroughapurposefuleffort,beginning threeyearsago, toexpanduponanexistingstrength in this product. By hiring well experienced loanoriginatorswhoalreadyheldclosetiestorealtorsinourmarket,we have been able tomaintain our rankings as the economyhastransitionedfromarefinancevolumetoapurchasevolumemix.Asfurtherevidencetothequalityofourmortgageteam,threeofouroriginatorswererecentlyrankedwithinthetop300nationwide for their production volume by the authoritativeScotsmanguide.Whiletheoverallvolumeflowingthroughthemortgagemarket has decreased compared to previous years,our dominance of the Boulder County mortgage market hascontinued into 2014. During the summermonthsElevationscaptured1/3rdofallmortgagesclosedintheCounty,anunheardofmarketshareintheindustry.Thissuccesscomesasaresultofattractingandretainingestablishedloanofficers,withstrongtiestothecommunityandrealtormarket,whohavebeenabletoleveragetheElevationsbrandintheBouldermarketandthosemarketscontiguoustoit.