Embed Size (px)
Citation preview
Measuring Environmental Consciousness of university students
TABLE OF CONTENTS
Page
Chapter 1: Introduction and objectives 41.1 Abstract 41.2 General introduction to the topic 41.3 Problem statement and research objective 81.4 Research questions 81.5 Research Contribution 91.6 Research Assumptions 111.7 Delimitations of the study 11
Chapter 2: Theoretical Background-Literature Review 122.1 Introduction 122.2 Theoretical Framework 122.3 Definitions of the variables 13
2.3.1 Environmental Consciousness 13
2.3.2 Knowledge 142.3.3 Attitude 142.3.4 Behavior 14
2.4 Hypotheses 152.4.1 Knowledge and Attitudes 152.4.2 Behavior 17
2.4.3 Cross-country comparisons 182.4.4 Relationships between measures 19
2.5 Demographic variables 202.6 Conclusion 20
Chapter 3: Methodology and Data 213.1 Methods and procedures 213.2 The Questionnaire 22 3.2.1 First Questionnaire draft 22
3.2.2 Final Questionnaire draft 23
3.3 Measures of variables 253.4 Sample Characteristics 253.5 Statistical techniques 29
The Netherlands & Greece
Measuring Environmental Consciousness of university students
Chapter 4: Results 304.1 Means 304.2 Performing the t-test 34
Page4.2.1 T-test: Interpretation 35
4.3 Factor Analysis 37 4.3.1 Performing the analysis 37
4.4 Regression 40 4.4.1 Regression Part 1: The effect of Knowledge (and demographics) 40
on Attitudes 4.4.2 Regression Part 2: The effect of Attitudes (and demographics) 42
on Non-purchasing Behavior 4.4.3 Regression Part 3: The effect of Attitudes (and demographics) 43
on Purchasing Behavior
Chapter 5: Discussion and Conclusions 45 5.1 Discussion 45 5.2 Theoretical and Managerial Implications 48 5.3 Directions for Future Research 49 5.4 Conclusion 50
List of references 51
Appendices 57Appendix 1. Final Draft Questionnaire 58Appendix 2. Group statistics 64Appendix 3. T-test 67
3.1 T-test for the total means/averages of the two samples 67 3.2 T-test for all distinct items of the environmental measures 71
Appendix 4. Factor Analysis 804.1 First Factor Analysis run: Knowledge 804.2 Second Factor Analysis run: Attitudes 844.3 Third Factor Analysis run: Non-purchasing behavior 88 4.4 Fourth Factor Analysis run: Purchasing behavior 92
Appendix 5. Regression 965.1 Regression Analysis with Attitudes as dependent variable and 96knowledge and demographics as independent variables
5.1.a Both nationality samples 965.1.b Greek sample 985.1.c Dutch sample 100
5.2 Regression Analysis with NPURB as dependent variable and 102attitudes and demographics as independent variables
The Netherlands & Greece
Measuring Environmental Consciousness of university students
5.2.a Both nationality samples 1025.2.b Greek sample 1045.2.c Dutch sample 106
Page
5.3 Regression Analysis with PURB as dependent variable and 108attitudes and demographics as independent variables
5.3.a Both nationality samples 108
5.3.b Greek sample 110
5.3.c Dutch sample 112
Figures & TablesFigure 1. Public opinion on environmental protection 7
as a key priority of the E.U. Figure 2. Public opinion regarding environmental state 7
in E.U. countries 2005-2010Figure 3. Theoretical Framework 13Figure 4. The investigated relationships between the measures of 40
environmental concern
Table 1: Dutch sample characteristics 26Table 2: Greek sample characteristics 28Table 3: Means/averages for Knowledge 30Table 4: Means/averages for Attitudes 31Table 5: Means/averages for Non-purchasing Behavior 32 Table 6: Means/averages for Purchasing Behavior 33
The Netherlands & Greece
Measuring Environmental Consciousness of university students
Chapter 1: Introduction and objectives
1.1 Abstract
During the last decades, the severity of problems associated with the degradation of the natural environment has been constantly reported and discussed. At the same time, environmental consciousness of individuals has been continuously rising as a result of the increasing evidence of environmental problems and the extensive media coverage. Several studies have been conducted worldwide regarding ecological concern/awareness of peoples in general or by targeting specific parts/segments of the world’s populations. This paper aims at examining the level of environmental concern/consciousness, focusing on academic students of two different European countries, The Netherlands and Greece, and using established measures from the literature. In addition, the relationships between measures are investigated and discussed.
1.2 General introduction to the topic
In a modern world characterized by a vast pace of productional, technological and industrial changes, it seems like the contemporary people can acquire almost anything that they could desire, as long as they are able to cover the respective costs. This is actually one side of the truth. The other side is that, to be in the (deceptively) beneficial position to be offered with a great variety of products, modern people sacrifice their natural environment on a daily basis. The phenomenon of environmental deterioration is not a current issue. It has been a constant problem that evolved simultaneously with technological and industrial development and the gradual changes in human lifestyles. Some may argue that the exploitation of natural resources has been inevitable, since people’s needs in products and services have been rapidly increasing over time. This argument is justified up to the extent that the exploitation is not unlimited and uncontrollable and the production does not threaten the survival of various ecosystems.
Although the natural environment seemed defenseless against the massive force of industrial evolution and urban development, a contradictious –latent at first- force began to rise due to the gradual recognition of the impendent danger. This force is known as environmental consciousness. Scientists associated with the natural environment, academic professors and people affiliated with literature and culture, intellectuals and common people as well, commenced to express their concern about the threat many
The Netherlands & Greece
Measuring Environmental Consciousness of university students
decades ago. The voice of those people initiated a rise in concern/awareness about ecological issues of more and more individuals and fired the emergence of group movements devoted in actions against environmental deterioration. Gerlach (2001) refers to movement groups which were formed already back in the 30’s, like the “Wilderness Society” (1935). Several alternatives to older established institutions emerged in the late 60’s, such as “Friends of the Earth” and “Zero Population Growth” (1968), as well as other groups even more radical in ideology and/or tactics, with sonorous names such as “Ecology Freaks” and “Ecology Commandoes”. According to Gerlach, many small and local groups of people were formed in communities across the U.S. in order to protect their neighborhoods from industrial facilities that were considered dangerous for the locals and the environment. “The ecology movement continued to move, grow, change and promote change. In the late 70’s people began to refer to it as environmentalism. In the late 80’s and early 90’s the European term “the Greens” became popular. Today, what remains is usually called the environmental movement or the Green movement (Gerlach, 2001: chapter 9). The evolution of environmental concern during the decades led to some important differences between the environmental movement of the 70’s and the green movement in the 90’s. Environmentalism in the 70’s was characterized by a restricted geographic focus on local ecological issues and its supporters were basically members of an intellectual elite. Moreover, the general attitude toward businesses and growth was adversarial because of the negative effects of business activity on the environment. On the other hand, the Green movement in the 90’s expanded its geographic focus on global issues (e.g. global warming) and had supporters from a broad base of the population. The new concept was based on a desire for sustainable growth and business activities started to be seen as part of the solution instead of the main cause of the problem (Charter & Peattie, 1992).
Several reports associated with the environment indicated that the issue of environmental protection had been a persistent concern for the public during the 80’s and early 90’s. Public concern with environmental problems specifically in the U.S. “peaked” around the first Earth Day in 1970 , but then generally declined throughout the rest of the decade (Dunlap 1991a, 1991b). The situation changed substantially during the 80’s. This change has been driven by several key factors, one of which was the “discovery” of critical problems such as global warming and ozone layer depletion, as well as several other specific incidents like pollution of ocean beaches and contamination of water supplies, which likely fueled the increase of public environmental concern. Moreover, the mass media - stimulated by environmental activists, scientists and policymakers – focused a great deal of attention on these problems (Dunlap 1991b, Mitchell 1990). Environmental awareness in the U.S. was given a ‘boost’ by the celebration of the twentieth Earth Day and by spring of 1990 public concern about the environment had reached unprecedented proportions (Dunlap & Scarce 1991). Apart from the U.S., several international surveys were conducted on a global scale during the 90’s, in order to investigate public opinion
The Netherlands & Greece
Measuring Environmental Consciousness of university students
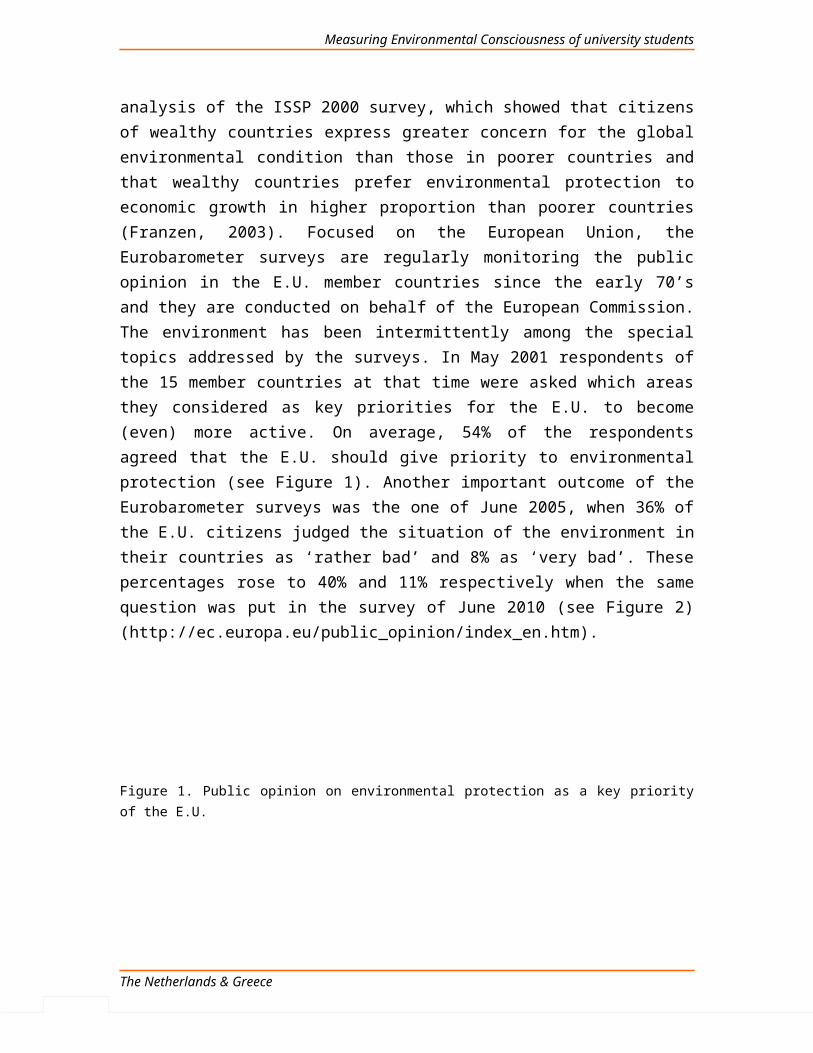
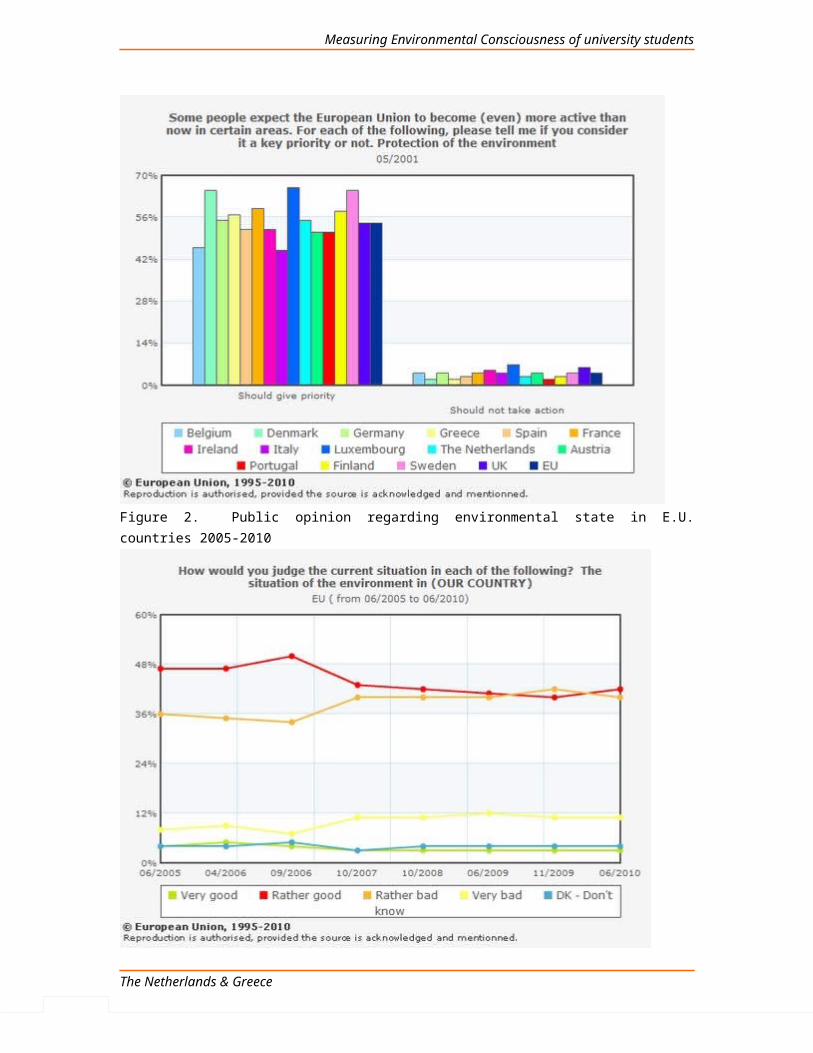
toward environmental issues. The Health of the Planet (HOP) survey in 1992 included 24 countries around the world – both industrialized and developing nations in America, Europe, Asia and Africa– and revealed that the majorities of respondents in 21 of the 24 nations reported at least a fair amount of concern about environmental problems. The respondents of 10 among the 12 European countries participated in the survey reported a great deal or a fair amount of concern in percentages higher than 50%. A very important conclusion from the results of the HOP survey was that environmental issues are salient and important issues in both wealthy and poor nations and that residents of poor nations express as much concern about environmental quality as do those living in wealthy nations (Dunlap et al. 1993). In other words, strong public concern for environmental protection existed throughout the world at that time. From the analysis of public opinion data on environmental issues collected in the HOP survey as well as in a survey conducted by Louis Harris and Associates in 1988-89 (“Public and Leadership Attitudes to the Environment in 4 continents”, 16 countries participated, 12 developing and 4 industrial), the results showed that people in both developing and industrial countries perceived that environmental quality had been and was continuing to worsen and they expressed substantial concern about the overall environmental quality and about a range of specific ecological issues (Bloom 1995). Another major wave of surveys has been conducted by the International Social Survey Programme (ISSP), which collects individual data in several countries in yearly intervals with rotating topics of interest. In 1993, 2000 and 2010 the programme survey focused on environmental issues (more info on ISSP can be found in: www.issp.org). An analysis of the ISSP 1993 survey’s data confirmed the evidence of growing concern about the environment in the developing countries, but it also provided evidence for accepting the “affluence hypothesis”, which meant that the tendency to give priority to environmental goals was much stronger in wealthy countries than in poorer nations at that time (Diekmann & Franzen, 1999). This finding was further confirmed by an analysis of the ISSP 2000 survey, which showed that citizens of wealthy countries express greater concern for the global environmental condition than those in poorer countries and that wealthy countries prefer environmental protection to economic growth in higher proportion than poorer countries (Franzen, 2003). Focused on the European Union, the Eurobarometer surveys are regularly monitoring the public opinion in the E.U. member countries since the early 70’s and they are conducted on behalf of the European Commission. The environment has been intermittently among the special topics addressed by the surveys. In May 2001 respondents of the 15 member countries at that time were asked which areas they considered as key priorities for the E.U. to become (even) more active. On average, 54% of the respondents agreed that the E.U. should give priority to environmental protection (see Figure 1). Another important outcome of the Eurobarometer surveys was the one of June 2005, when 36% of the E.U. citizens judged the situation of the environment in their countries as ‘rather bad’ and 8% as ‘very bad’. These percentages rose to 40% and 11%
The Netherlands & Greece
Measuring Environmental Consciousness of university students
respectively when the same question was put in the survey of June 2010 (see Figure 2) (http://ec.europa.eu/public_opinion/index_en.htm).
Figure 1. Public opinion on environmental protection as a key priority of the E.U.
Figure 2. Public opinion regarding environmental state in E.U. countries 2005-2010
The Netherlands & Greece
Measuring Environmental Consciousness of university students
1.3 Problem statement and research objective
Apart from the surveys conducted on an international basis in order to identify trends related to environmental concern and protection among the populations of the world, several other studies took place since the 1970’s which focused on ecological concern and related topics. These studies were usually restricted on a national basis or on a cross-cultural basis making comparisons between a limited number of countries. Some of the studies aimed at identifying clusters of environmentally aware/concerned individuals within the general public, while others examined the level of environmental concern of specific groups/segments. Studies have been conducted in a wide range of social science disciplines such as psychology, sociology, environmental studies, business research, marketing etc. All studies in general attempted to conceptualize and operationalize the “environmental consciousness” construct in order to contribute to purposes associated with each scientific discipline. This study is placed within this context and attempts to investigate the level of environmental concern/consciousness of academic students of two European countries: The Netherlands and Greece. In addition, cross-country comparisons are made and the relationships between the measures of environmental concern are examined.
1.4 Research questions
Based on the objective of the research, the research questions are formed as follows:
The Netherlands & Greece
Measuring Environmental Consciousness of university students
1. Which is the level of knowledge of Dutch and Greek students about (specific) environmental issues and what are their attitudes towards the environment?
The theoretical dimensions incorporated for drawing conclusions regarding this question are: Knowledge about environmental issues and Attitudes about the environment.
2. How Dutch and Greek students behave as regards the environment?The theoretical dimension incorporated for drawing conclusions regarding this question is Environmentally-sensitive behavior. Behavior is divided into two separate constructs: Non-purchasing behavior and Purchasing behavior.
3. Are there significant differences between the means/averages of the two countries?
Cross-national comparisons are made regarding the averages scored by the two nationality samples. But are the observed differences statistically significant?
4. What are the relationships between the environmental measures?In this part, the relationships between the measures of environmental concern are investigated and specifically: 1) the effect of knowledge about environmental issues on the attitudes toward the environment and 2) the effect of attitudes toward the environment on environmentally-sensitive behavior.
1.5 Research Contribution
The decision to examine the level of environmental concern particularly of Dutch and Greek students has been taken after careful consideration of the characteristics of those two countries. Greece and The Netherlands pose significant differences as regards culture, industry structure, people’s attitudes and consuming habits/tactics, social policies, legislation etc. and therefore it was assumed that the comparisons between findings would be of substantial interest. Furthermore, those countries’ geographical positions within Europe allow as to define them as representative countries of two wide European areas – Northern and Southern/Mediterranean – given the fact that there are significant similarities regarding culture and attitudes among nations situated in the same geographical regions. Therefore, the methodology of this study could be used in future research on larger samples and the findings could generalize beyond the borders of the two countries and across the regions they represent.
Ferber (1977) argued that using students’ sample is considered valid for exploratory studies. Furthermore, according to another study, cross-country comparisons between students are less problematic than cross-country comparisons between any other groups of people (Mullet et al., 2005). Students from different countries tend to be more similar
The Netherlands & Greece
Measuring Environmental Consciousness of university students
regarding social background, intellectual abilities, and other personal characteristics than non-students (Macri & Mullet, 2007). This is the main reason why students’ populations were chosen for the present study. In addition, university students represent a large part/segment of the population of every industrialized and developing nation nowadays. Students of today will become the professionals and consumers of tomorrow, assuming responsibility for the future of this planet. Therefore, hands-on evidence regarding the environmental concern levels of the specific segment can be proved extremely useful for theoretical as well as for managerial purposes.
The review of the literature revealed that there is no previous academic research conducted in The Netherlands which is focused on measuring ecological concern of academic students, by using measures of knowledge, attitudes, behavior in one and the same study. Sententiously, the published academic literature with topics related to environmental concern/consciousness of Dutch citizens is going to be mentioned here, whilst a more extensive reference can be found in Chapter 2 (section 2.4). Sriram and Forman (1993) used samples of Dutch and American students in order to identify cultural differences in consumer sensibilities regarding the environment, their impact on consumer choice behavior and implications for product design. Harrison et al. (1996) conducted a cross-cultural study of British and Dutch citizens in order to compare the extent to which members of the general public are actively engaged in pro-environmental behaviors. In addition, Altenburg et al. (1996) used samples of Amsterdam and Leipzig (Germany) inhabitants to study the relationship between socio-demographics and environmental consciousness. One year later, Kilbourne et al. (1998) attempted to examine the relationship between the dominant social paradigm, value systems and general environmental beliefs using a sample of Dutch, Danish and Spanish university students. Kuhlemeier et al. (1999) referred to a Dutch national assessment program which studied environmental knowledge, attitudes and responsible behavior of secondary education students. Cohen (2000) attempted a preliminary analysis of The Netherlands, in terms of ecological modernization, environmental knowledge and national character. Finally, Kilbourne et al. (2002) took a sample of business/economics students from major universities in seven countries (including The Netherlands) to test the relationships between dominant social paradigm, environmental attitudes and willingness to change.
Regarding the academic studies on Greek samples, there is no previous study which included all three components of the entire ‘green’ semantic domain. Bhate (2002) collected data from a sample of Greek, UK and Indian MBA students in order to investigate public awareness and consumer environmental behavior. Karamichas (2003) engaged in a critical evaluation of environmental concern of Greek and Spanish publics, based mostly on multinational surveys. Karameris et al. (2006) examined the level of environmental knowledge and the environmental attitudes and values of undergraduate Forestry students from a major Greek university (Aristotle University, Thessaloniki).
The Netherlands & Greece
Measuring Environmental Consciousness of university students
Macri and Mullet (2007) tested an eight-factor model of societal risk perception on two samples of Greek and French university students respectively. The model contained factors regarding hazards from pollutants and energy production, thus associated with environmental knowledge. Tampakis et al. (2007) examined the views of students from the department of Forestry and Management of the Environment and Natural Resources (University of Thrace, Greece) concerning the active involvement of citizens to environmental protection and the factors which shape environmentally-minded persons. Three years later, Manolas et al. (2010) reported the findings of a survey conducted on students of the same Forestry department, this time regarding their views and knowledge on the issue of climate change due to the greenhouse effect.
From the short literature review above, it can be concluded that several researchers in the past attempted to measure the extent of environmental consciousness dimensions of Greek and Dutch consumers – either students or members of the general public. Those attempts underline the importance of the topic and the need for studies that could provide a more concrete view of environmental concern of people living in these two countries, by incorporating measures which cover the whole concept of environmentalism.
1.6 Research Assumptions
Because the main goal of this study was the investigation of environmental consciousness of Greek and Dutch academic students, a basic assumption for the implementation of the study was that all the respondents were Greek and Dutch natives and they were enrolled in an academic programme/study by the time the survey took place. In addition, it is assumed for the present study that the answers of the participants express their actual knowledge, attitudes and behavior regarding the environment.
1.7 Delimitations of the study
The current study aims at investigating the level of ecological concern/awareness of academic students through the theoretical dimensions of perceived knowledge about environmental issues, attitudes toward the environment and environmentally-sensitive behavior. Although the items incorporated in the constructs are supposed to express contemporary society’s general knowledge, attitudes and behavior, it must be mentioned that there are several other items that could be included as well in the survey instrument. For instance, there are well-documented and reported environmental problems/issues other than those included in the knowledge construct, which, however, are not going to be investigated in the present study. The same applies for the attitudinal items and the categories of ecological products included in the purchasing behavior context. Furthermore, relationships between the measures used in this study are examined and discussed. The relationships under investigation are those between knowledge and
The Netherlands & Greece
Measuring Environmental Consciousness of university students
attitudes and attitudes and behavior. Another relationship which could be significant is the one with both knowledge and attitudes as independent variables and behavior as dependent variable. However, the investigation of this effect was not part of this study. Finally, other socio-demographic variables that could play a role in profiling ‘green’ students - e.g. the study field/discipline – were not included in this study.
Chapter 2: Theoretical Background-Literature Review
2.1 Introduction
The investigation of environmental concern/consciousness levels of population samples around the world has been a subject of continuous research over the last 25 years, due to the clear evidence of environmental degradation, the constant alerts by scientists and experts on ecological issues and the extensive publicity by the media. In addition, a number of different instruments has been used in the various efforts to measure environmental consciousness. In this study, environmental measures encapsulating individuals’ (1) perceived knowledge about green issues, (2) attitudes toward the environment and (3) environmentally-sensitive behavior are utilized in order to examine the level of environmental concern of Dutch and Greek university students. These measures derived mainly from Bohlen et al. (1993) and three supplementary items were derived from Murphy et al. (1978) and Laroche et al. (2001). The reasons of selecting the specific components or theoretical dimensions to measure environmental consciousness are mentioned in this chapter. Furthermore, several hypotheses based on previous studies regarding the relationships between those dimensions are generated and empirically tested.
2.2 Theoretical Framework
The review of past literature showed that the different instruments used in the various studies which attempted to measure environmental consciousness differed in terms of the components or dimensions of the environmental consciousness construct. For instance, some solely addressed environmental attitude scales (e.g. Buttel, 1979; Benton &
The Netherlands & Greece
KNOWLEDGEabout environmental
issues
ATTITUDESabout the environment
BEHAVIOREnvironmentally-
sensitive
Non-purchasing behavior
Purchasing behavior
Environmental Consciousness Dimensions
Measuring Environmental Consciousness of university students
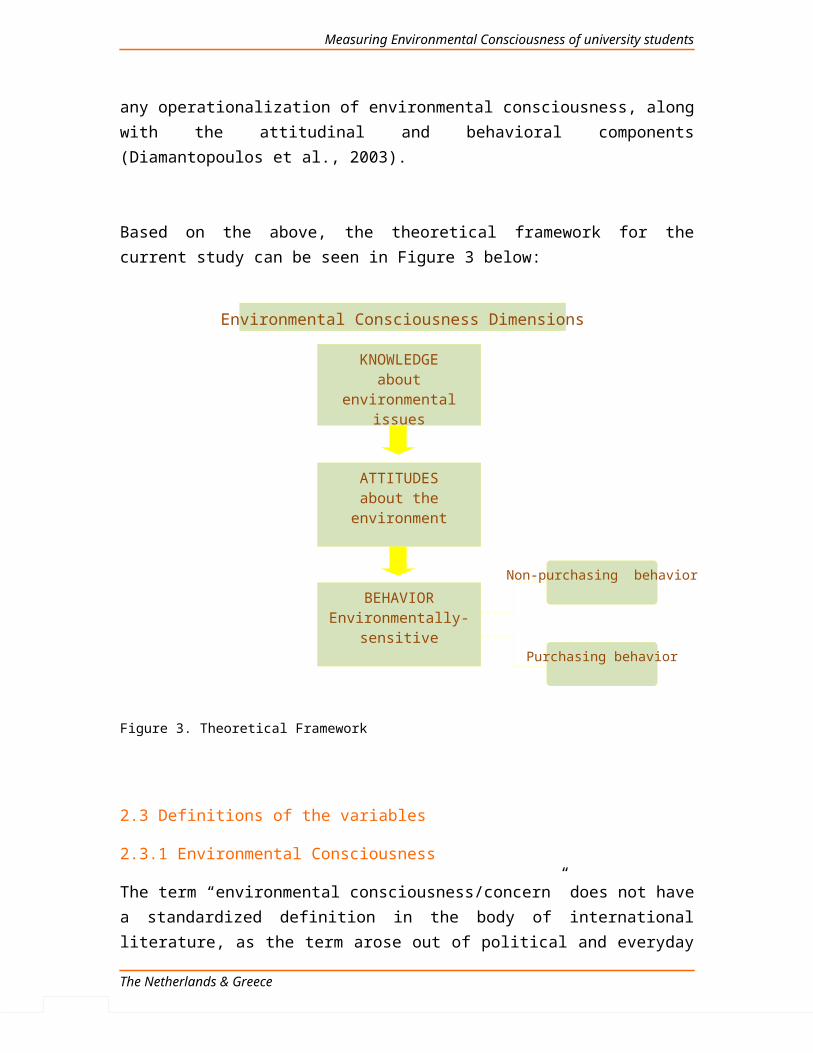
Funkhouser, 1994), while others focused on environmentally sensitive behavior (e.g. Brooker, 1976; Roozen & De Pelsmacker, 1998). However, given the fact that weak linkages between attitudes and behavior have often been noted in the environmental and marketing literature (e.g. Rothschild, 1979; Lee & Green, 1991), an analysis of attitudinal components alone may not accurately predict actual environmental behavior (Diamantopoulos et al., 2003). “Thus, it seems prudent for a behavioral component to be contained within the domain. However, a focus on behavioral dimensions alone will not provide an insight into the possible motivations generating individual’s behavior or the level of knowledge and the strength of feeling that a person may have about the environment” (Bohlen et al., 1993). Therefore, in order to capture all aspects of the domain of environmentalism, knowledge items regarding individuals’ level of information about specific or general aspects of ecological phenomena should be contained within any operationalization of environmental consciousness, along with the attitudinal and behavioral components (Diamantopoulos et al., 2003).
Based on the above, the theoretical framework for the current study can be seen in Figure 3 below:
The Netherlands & Greece
Figure 3. Theoretical Framework
Measuring Environmental Consciousness of university students
2.3 Definitions of the variables
2.3.1 Environmental Consciousness
The term “environmental consciousness/concern” does not have a standardized definition in the body of international literature, as the term arose out of political and everyday language (Hofrichter, 1992). Nevertheless, it is one of the central constructs in the literature used to explain environmentally-conscious consumer behavior (Schuster, 1992). In an important study, Van Liere & Dunlap (1981) argued that studies on environmental consciousness can produce considerably different results, depending on how the term is measured. In this study, based upon the justification in section 2.2, the environmental consciousness construct is measured through three distinct dimensions: Knowledge, Attitudes and Behavior.
2.3.2 Knowledge
An attempt to define knowledge can be quite risky, simply because knowledge has been characterized as a complex and easily misinterpreted term. Hilpinen (1970) refers to a classical definition of knowledge, according to which “Knowledge is justified true belief or true opinion combined with reason”. Nonaka and Takeuchi (1995) distinguish between knowledge and information by arguing that “information is a flow of messages, while knowledge is created by that very flow of information, anchored in the beliefs and commitment of its holder.” Tsoukas and Vladimirou (2001) claim that “knowledge is the individual capability to draw distinctions, within a domain of action, based on an appreciation of context or theory, or both.” A more precise definition was provided by DeChano (2006, p. 16), according to which environmental Knowledge was defined as “the information that enables someone to study and reach conclusions about the physical, social and cultural conditions that affect the development of an organism”. In the context of this study, perceived knowledge about environmental issues could be defined as the amount of information one possesses (or believes that possesses) regarding issues related to the natural environment which are well-reported and documented in the literature and the social media.
2.3.3 Attitude
In Fishbein and Raven (1962), “attitude” is distinguished from “belief”’ and defined as “the evaluative dimension of a concept – ‘Is it good or bad?’ ”. Later on, Eagly & Chaiken (1993, p.1) define attitude as “a psychological tendency that is expressed by evaluating a particular entity with some degree of favor or disfavor”. More recently, in
The Netherlands & Greece
Measuring Environmental Consciousness of university students
the study of DeChano (2006, p. 16) environmental attitude was defined as “the predispositions that affect how someone perceives and interprets the physical, social and cultural conditions that affect the development of an organism”. In the context of this study, the “particular entity” is the environment and issues related to it, and the evaluations of the respondents express their attitudes or concern/interest toward the environment and its quality.
2.3.4 Behavior
Rosenblueth et al. (1943) classify behavior as “any change of an entity with respect to its surroundings. Accordingly, any modification of an object, detectable externally, may be denoted as behavior.”In addition, they distinguish between active and passive behavior. “Active behavior is that in which the object is the source of the output energy involved in a given specific reaction. On the contrary, in passive behavior the object is not a source of energy.” Bruhn (1978) argues that environmentally-oriented behavior requires an individual to have concrete behavioral tendencies towards making a personal contribution to environmental solutions. In the context of this study, environmentally-sensitive behavior is expressing individuals’ current commitment to activities that aim to reduce society’s negative impact on the natural environment, and it is measured with (1) a recycling behavior scale, (2) a political action/other (non-purchasing) actions scale and (3) a purchasing behavior scale.
2.4 Hypotheses
2.4.1 Knowledge and Attitudes
Our first research question refers to the level of environmental knowledge and attitudes of Dutch and Greek university students. Hypotheses are generated below for each nation, according to the relevant background literature:
The Dutch: Valuable information was accumulated from the literature review of the studies on Dutch samples. Firstly, it is important to note that the Netherlands has since the mid-1980s emerged as an international leader in the environmental field (OECD, 1995). Furthermore, the country has pioneered the use of numerous creative approaches to environmental-policy making to chart a relatively progressive reform path (Cohen, 2000). In the HOP Survey, 24% of the Dutch respondents rated the environmental quality in their local community as ‘fairly’ or ‘very’ bad, while a 45% gave the same rates for the nationwide environmental quality (Dunlap et al. 1993). These responses require a fair amount of knowledge about environmental issues on a national level at least. In the same survey, the percentage of Dutch respondents volunteering that environmental problems are the most important problem facing their nation reached 39%. Moreover, 71% of the
The Netherlands & Greece
Measuring Environmental Consciousness of university students
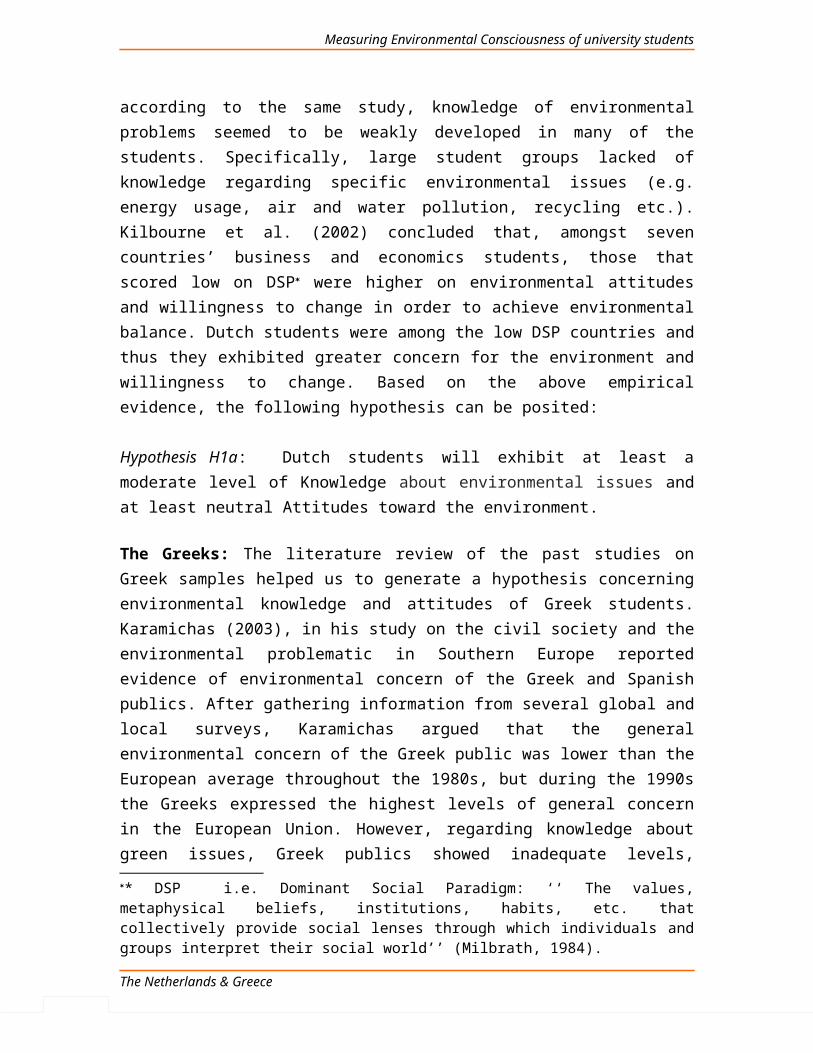
population sample declared they are personally concerned about the environment a ‘great deal’ (16%) or a ‘fair amount’ (55%), which gives us proof for the positive attitudes of the Dutch towards the environment. Kuhlemeier et al. (1999), in their study on secondary education Dutch students, concluded that 57% of the students had an attitude toward the environment ranging from positive to very positive, while the environmental attitude of 42% could be characterized as neutral. On the other hand, according to the same study, knowledge of environmental problems seemed to be weakly developed in many of the students. Specifically, large student groups lacked of knowledge regarding specific environmental issues (e.g. energy usage, air and water pollution, recycling etc.). Kilbourne et al. (2002) concluded that, amongst seven countries’ business and economics students, those that scored low on DSP were higher on environmental attitudes and willingness to change in order to achieve environmental balance. Dutch students were among the low DSP countries and thus they exhibited greater concern for the environment and willingness to change. Based on the above empirical evidence, the following hypothesis can be posited:
Hypothesis H1a: Dutch students will exhibit at least a moderate level of Knowledge about environmental issues and at least neutral Attitudes toward the environment.
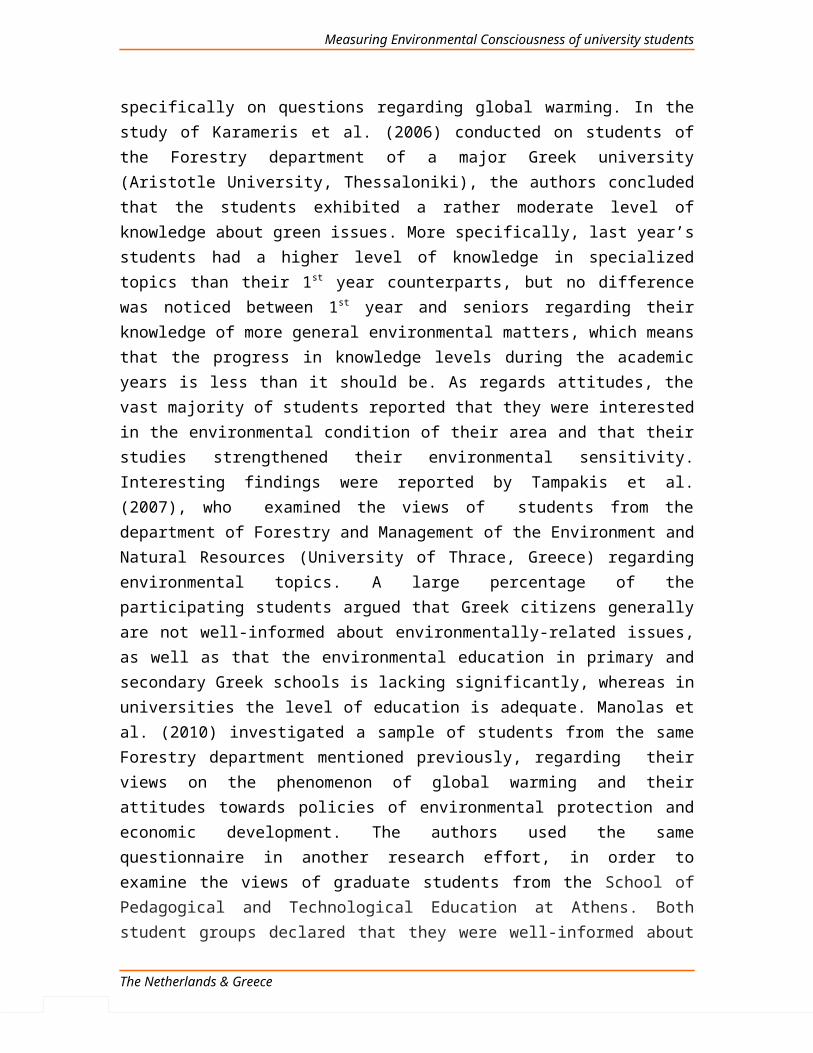
The Greeks: The literature review of the past studies on Greek samples helped us to generate a hypothesis concerning environmental knowledge and attitudes of Greek students. Karamichas (2003), in his study on the civil society and the environmental problematic in Southern Europe reported evidence of environmental concern of the Greek and Spanish publics. After gathering information from several global and local surveys, Karamichas argued that the general environmental concern of the Greek public was lower than the European average throughout the 1980s, but during the 1990s the Greeks expressed the highest levels of general concern in the European Union. However, regarding knowledge about green issues, Greek publics showed inadequate levels, specifically on questions regarding global warming. In the study of Karameris et al. (2006) conducted on students of the Forestry department of a major Greek university (Aristotle University, Thessaloniki), the authors concluded that the students exhibited a rather moderate level of knowledge about green issues. More specifically, last year’s students had a higher level of knowledge in specialized topics than their 1 st year counterparts, but no difference was noticed between 1st year and seniors regarding their knowledge of more general environmental matters, which means that the progress in knowledge levels during the academic years is less than it should be. As regards attitudes, the vast majority of students reported that they were interested in the environmental condition of their area and that their studies strengthened their environmental sensitivity.
* DSP i.e. Dominant Social Paradigm: ‘‘ The values, metaphysical beliefs, institutions, habits, etc. that collectively provide social lenses through which individuals and groups interpret their social world’’ (Milbrath, 1984).
The Netherlands & Greece
Measuring Environmental Consciousness of university students
Interesting findings were reported by Tampakis et al. (2007), who examined the views of students from the department of Forestry and Management of the Environment and Natural Resources (University of Thrace, Greece) regarding environmental topics. A large percentage of the participating students argued that Greek citizens generally are not well-informed about environmentally-related issues, as well as that the environmental education in primary and secondary Greek schools is lacking significantly, whereas in universities the level of education is adequate. Manolas et al. (2010) investigated a sample of students from the same Forestry department mentioned previously, regarding their views on the phenomenon of global warming and their attitudes towards policies of environmental protection and economic development. The authors used the same questionnaire in another research effort, in order to examine the views of graduate students from the School of Pedagogical and Technological Education at Athens. Both student groups declared that they were well-informed about the issue of global warming, something that was obvious from their assessment on the factors contributing to the phenomenon. Additionally, the majority of both groups showed positive attitudes towards policies in favor of environmental protection, as well as willingness to support measures for the reduction of green-house gases, while bearing the cost of such measures.According to the above empirical literature, the following hypothesis is postulated:
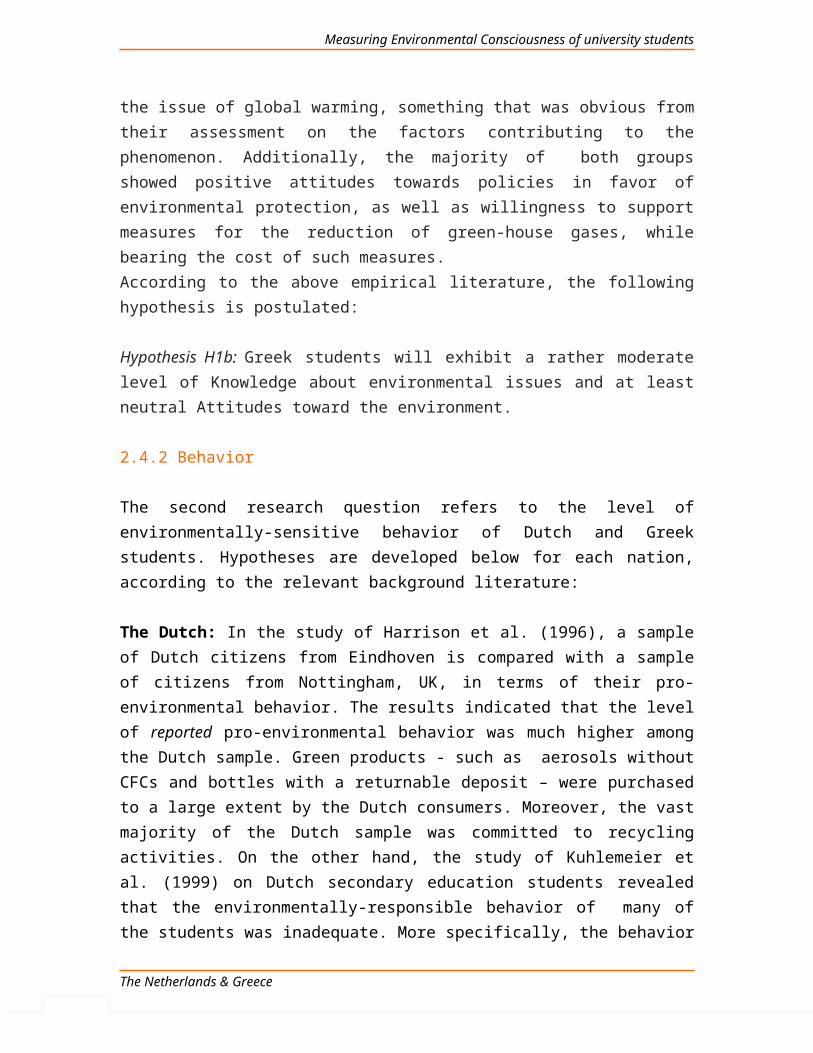
Hypothesis H1b: Greek students will exhibit a rather moderate level of Knowledge about environmental issues and at least neutral Attitudes toward the environment.
2.4.2 Behavior
The second research question refers to the level of environmentally-sensitive behavior of Dutch and Greek students. Hypotheses are developed below for each nation, according to the relevant background literature:
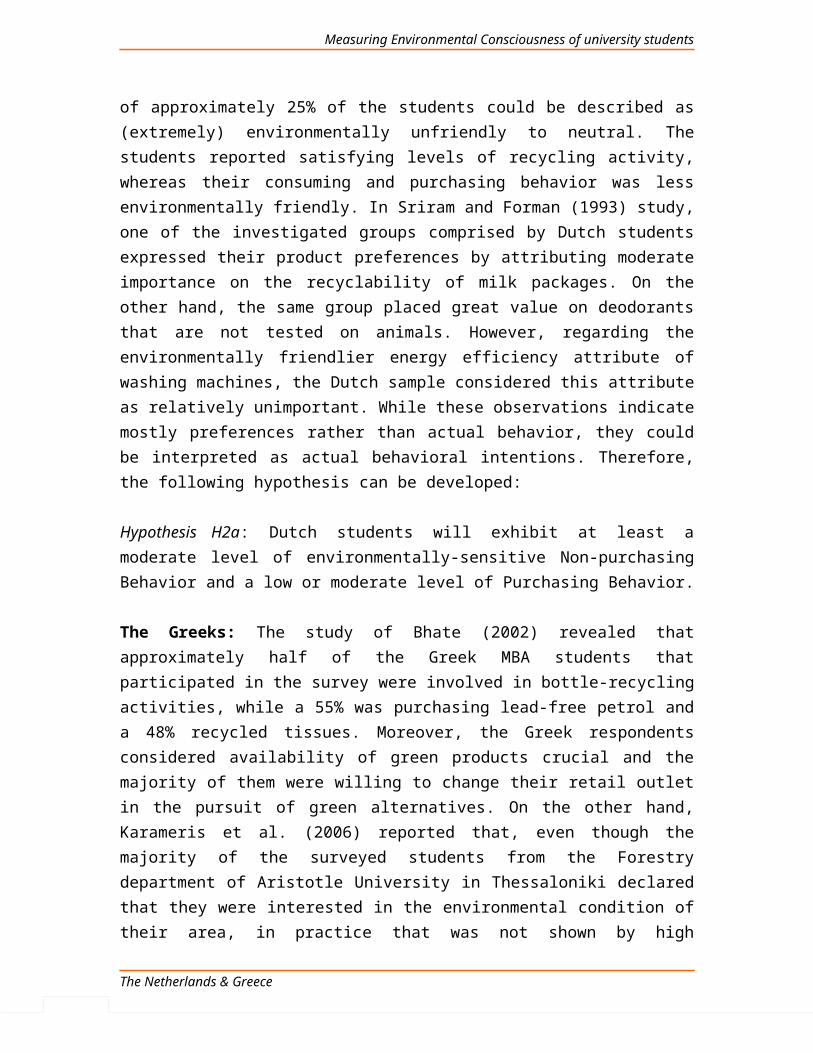
The Dutch: In the study of Harrison et al. (1996), a sample of Dutch citizens from Eindhoven is compared with a sample of citizens from Nottingham, UK, in terms of their pro-environmental behavior. The results indicated that the level of reported pro-environmental behavior was much higher among the Dutch sample. Green products - such as aerosols without CFCs and bottles with a returnable deposit – were purchased to a large extent by the Dutch consumers. Moreover, the vast majority of the Dutch sample was committed to recycling activities. On the other hand, the study of Kuhlemeier et al. (1999) on Dutch secondary education students revealed that the environmentally-responsible behavior of many of the students was inadequate. More specifically, the behavior of approximately 25% of the students could be described as (extremely) environmentally unfriendly to neutral. The students reported satisfying levels of recycling activity, whereas their consuming and purchasing behavior was less environmentally friendly. In Sriram and Forman (1993) study, one of the investigated groups comprised
The Netherlands & Greece
Measuring Environmental Consciousness of university students
by Dutch students expressed their product preferences by attributing moderate importance on the recyclability of milk packages. On the other hand, the same group placed great value on deodorants that are not tested on animals. However, regarding the environmentally friendlier energy efficiency attribute of washing machines, the Dutch sample considered this attribute as relatively unimportant. While these observations indicate mostly preferences rather than actual behavior, they could be interpreted as actual behavioral intentions. Therefore, the following hypothesis can be developed:
Hypothesis H2a: Dutch students will exhibit at least a moderate level of environmentally-sensitive Non-purchasing Behavior and a low or moderate level of Purchasing Behavior.
The Greeks: The study of Bhate (2002) revealed that approximately half of the Greek MBA students that participated in the survey were involved in bottle-recycling activities, while a 55% was purchasing lead-free petrol and a 48% recycled tissues. Moreover, the Greek respondents considered availability of green products crucial and the majority of them were willing to change their retail outlet in the pursuit of green alternatives. On the other hand, Karameris et al. (2006) reported that, even though the majority of the surveyed students from the Forestry department of Aristotle University in Thessaloniki declared that they were interested in the environmental condition of their area, in practice that was not shown by high percentage. Particularly, 54% of 5th year students admitted that they “do not do anything special” as regards environmental activities like recycling, membership in ecological organizations, buying ecological products etc., while this percentage was much lower among 1st year’s students.(16%). In the paper of Tampakis et al. (2007), in which the views of students from the department of Forestry and Management of the Environment and Natural Resources (University of Thrace, Greece) are examined, the vast majority of students (73.1%) believed that Greek citizens participate in activities related to environmental protection to a minimum extent. While the specific percentage represents only the views and opinions of a small group of students, however are considered to be of great importance, since they are based on education and training regarding the broad field of environmental science. On the other hand, Karamichas (2003) referred to the fact that, according to the Eurobarometer study in 1986, the Greek publics professed a willingness to join the ecology movement with a percentage of 50% and continued to show the highest levels of willingness to act in order to protect the environment through the 1990s. According to the empirical literature mentioned, the following hypothesis can be postulated:
Hypothesis H2b: Greek students will exhibit a low or moderate level of environmentally-sensitive Non-purchasing Behavior and a low or moderate level of Purchasing Behavior.
2.4.3 Cross-country comparisons
The Netherlands & Greece
Measuring Environmental Consciousness of university students
The third research question refers to the comparisons between the two student samples’ scored averages in each of the theoretical dimensions of environmental concern and the statistical significance of the differences observed. Based on the former hypotheses generated separately for the two samples, the following hypotheses can be posited as well:
Hypothesis H3a: There will be a significant difference between the total means of the two countries regarding the Knowledge Scale.
Hypothesis H3b: There will be no significant difference between the total means of the two countries regarding the Attitudes Scale.
Hypothesis H3c: (a) There will be a significant difference between the total means of the two countries regarding the Non-purchasing Behavior Scale. (b) There will be no significant difference between the total means of the two countries regarding the Purchasing Behavior Scale.
2.4.4 Relationships between measures
The final research question refers to the links between the three theoretical dimensions/measures of the environmental consciousness domain. Hypotheses are developed according to the founded literature.
Knowledge-Attitudes relationship: In the context of the specific relationship, Arcury (1990) conducted a research, which concluded that environmental knowledge was consistently and positively related to environmental attitudes, though the relationship was not especially strong. In addition, the positive relationship between knowledge and attitude was reported by numerous other studies (Blum, 1987; Corral-Verdugo & Armendariz, 2000; Dunlap et al., 1993; Ewert & Baker, 2001; Furman, 1998; Hausbeck et al., 1992; Ramsey & Rickson, 1976; Roth & Perez, 1989). However, DeChano (2006) found no statistically significant relationship between knowledge about the environment and positive attitudes towards the environment for none of the student groups investigated. The author suggested that the discrepancy observed raises the question of the reliability of the reported relationship in the research literature, mostly because the prior studies were conducted over a number of years and therefore could be considered outdated. However, since the majority of studies have supported the positive association between knowledge and attitude, the following hypothesis can be developed:
Hypothesis H4a: There is a significant positive relationship between Knowledge about environmental issues and Attitudes toward the environment.
The Netherlands & Greece
Measuring Environmental Consciousness of university students
Attitudes-Behavior relationship: Several studies on behavioral research have established attitudes as important predictors of behavior, behavioral intentions and explanatory factors in individual behavior (Fishbein and Ajzen, 1975; Ajzen and Fishbein, 1980; Ajzen, 1988). Schultz and Oscamp (1996) investigated attitudes and behavior within the environmental domain. The results from their studies suggested that more general attitudes can directly predict behavior in certain situations. More specifically, they found that attitudes of environmental concern were positively correlated with participation in a high-effort experimental recycling program. Numerous other studies have identified positive and significant relationships between attitudes and behavior. However, Hines et. al (1986-87), in their meta-analysis of 128 pro-environmental behavior research studies, found that people with strong pro-environmental attitudes were more likely to engage in pro-environmental behavior, yet the relationship between attitudes and actions proved to be weak. Weak linkages between attitudes and behavior have often been noted as well in other studies within the environmental and social marketing literature (e.g., Rothschild, 1979; Gill et al., 1986; Lee & Green, 1991). Given the results of past studies, the following exploratory hypotheses are developed:
Hypothesis H4b: Attitudes toward the environment are related to environmentally-sensitive Non-purchasing Behavior.
Hypothesis H4c: Attitudes toward the environment are related to environmentally-sensitive Purchasing Behavior.
2.5 Demographic variables
The literature on the measurement of environmental consciousness has often investigated the associations between socio-demographic variables and the theoretical dimensions of the environmental consciousness domain. Other studies reported positive, others negative, while others reported not significant associations. In the context of the present study, these associations are examined purely on an exploratory basis and the results are discussed. However, because of the exploratory nature of the specific investigation, no prior hypotheses are developed regarding these relationships.
2.6 Conclusion
In this chapter the theoretical background associated with the current study was presented. General definitions of the various constructs were provided and hypotheses were developed in accordance to the four research questions. It was hypothesized that linkages do exist between the environmental measures. Moreover, it was assumed that the differences between the two groups under investigation will be significant for specific
The Netherlands & Greece
Measuring Environmental Consciousness of university students
measures but not significant for other measures. These hypotheses are tested and their acceptance or rejection is discussed in the final chapter of this study. The following chapter (3) is a description of the entire methodology process.
Chapter 3: Methodology and Data
3.1 Methods and procedures
The first step towards the completion of this study –after the theoretical and conceptual framework was determined- was the collection of the necessary data. Having in mind that data from two different nationality student populations had to be gathered, it became important to designate the most appropriate method of data collection for each sample. Undoubtedly, the internet has been proven a powerful and effective instrument towards the achievement of this goal and therefore it was used for the purposes of this study as well. On the other hand, traditional methods of data collection are sometimes essential to be utilized, although they require more effort and they are more time consuming. The survey applied to academic students of all levels (bachelor, master, PhD etc.) and all age groups. The data collection instrument was a four-section questionnaire. Before completion, it was mentioned to all respondents that the survey was anonymous and they were encouraged to answer all the questions. The language used for the entire questionnaire was the English language. It was decided not to translate the content into the respective native languages of the two samples, since the English language is the second official language being taught in both countries and thus Greek and Dutch students possess an adequate level of command.
The data from the Dutch students was collected by conducting an online survey. A questionnaire was uploaded on the website www.thesistools.com. This is basically a web space (website) where students, who work on their thesis and desire to reach a number of respondents via the internet, can place their questionnaire online. There are simple and useful tools provided which make it relatively easy and effortless to construct a questionnaire and upload it on the website, without requiring advanced computer knowledge. After the completion of each questionnaire, all the information is stored in an Excel file which can be easily processed by the researcher. In addition, a file with graphic charts and percentages is also available. Our survey was placed on the specific website for the period of two months during the summer of 2010 (from the 20 th of June till the
The Netherlands & Greece
Measuring Environmental Consciousness of university students
20th of August 2010). A link to the survey was sent by e-mail to all students of the Marketing MSc class of the ESE, but with the notification for the questionnaire to be filled in only by the Dutch native students. In addition, a number of e-mails were sent to Dutch students of other faculties of the Erasmus University. All recipients were kindly requested to forward the link of the survey to other fellow students as well.
After careful consideration, the data from the Greek students was decided to be collected by applying the traditional method of questionnaire distribution. This method was judged as the most appropriate for the Greek part of the study, due to the lack of access to a student database where an online survey could be forwarded to. In total, sixty questionnaires were printed and distributed to Greek students of a major Greek university, the Athens University of Economics and Business, in Athens. The reasons of selecting the specific institution were -among others- the high level of education, the large number of study programmes available and the high concentration of students from all over the country. The survey took place in June 2010, in the central cafeteria of the university. The questionnaires were distributed randomly only to Greek native students and after a specific period of time they were collected back. The amount of time was enough for the respondents to read carefully and understand the content of the questionnaire. After the collection of all questionnaires and the rejection of those with several missing responses, the data was stored in SPSS Data editor for further analysis.
3.2 The Questionnaire
As mentioned in the previous chapter, a questionnaire was constructed for the implementation of our study. The first draft of the questionnaire was tested by test persons in order to evaluate the applicability of the whole construct and to receive critical remarks on the content. After the testing procedure, some necessary changes and improvements were made before the final draft was uploaded online and distributed to students.
3.2.1 First Questionnaire draft
For the first draft of the questionnaire it was decided to include all questions related with the three theoretical dimensions Knowledge, Attitudes, Behavior from the article of Greg Bohlen et al (1993). The assessment was made on the basis of reliability analysis (Cronbach’s a) conducted in Bohlen et al. study and the degree of validity within measures. Also, attention was paid on the relevance of the items with the modern era and society, because some of them could be considered irrelevant or outdated. More specifically:
The Knowledge domain consisted of eleven items describing well known environmental issues-problems. The knowledge construct had a high degree of internal consistency with a value of Cronbach’s α = 0.94. The Cronbach’s alpha coefficient investigates the
The Netherlands & Greece
Measuring Environmental Consciousness of university students
reliability of how well the items measure a given construct. Moreover, the knowledge construct showed a very respectable degree of measure validity. However, there were concerns about few of the items, which they could be considered somehow outdated, due to the changes that took place since the article was written (1993), regarding environmental protection and the relevant legislation.
Within the Attitudes construct, twenty statements were included, which were split into two groups. Half of the statements were negatively worded in order to reduce acquiescence bias, while most of the statements were seemingly identical in meaning. In Bohlen et al study, one of the statements was removed from the measure after reliability analysis and thus had to be noticed . The remaining 19 items reached a value of α=0.896. In addition, all items illustrated an acceptable degree of validity within the measure. Apart from the item that was dropped in the original study, extra attention was put on the similarity of meanings between the statements, which might be considered tedious and confusing by the test persons.
The Behavior construct was divided into two separate constructs: environmentally-sensitive non-purchasing behavior and environmentally-sensitive purchasing behavior. In addition, Non-purchasing behavior construct was also typically divided into two types of behavior: recycling activity undertaken and political action undertaken. Within each distinct type, 4 activities were incorporated. In the original study the recycling items produced an alpha value of 0.807 and proved to be reliable indicators of non-purchasing behavior. Similarly, items of political action had an α value of 0.798 indicating high internal consistency. Both sub-constructs indicated a respectable degree of measure validity. All items were considered relevant to the modern life style concerning the environment, as recycling activities and the particular types of political action are considered largely up-to-date.
With regards to the purchasing behavior construct, a list of six items was incorporated, each of them representing a category of environmentally-friendly products. Two of these categories (unleaded petrol and ozone-friendly aerosols) were included in the purchasing behavior domain purely on an exploratory basis, as they could not be viewed as true discriminators between environmentally sensitive/non-sensitive behavior. Hence, there were doubts if they should be incorporated in our study at all. These items were also excluded from further analysis in the original study. In addition, three statements regarding general environmental purchasing behavior were included in the construct. The items proved to be very reliable according to reliability analysis (a=0.856). Furthermore, the scale showed sufficient measure validity. Apart from the two product categories mentioned previously, the rest of the items seemed to be related to modern environmental behavior.
The Netherlands & Greece
Measuring Environmental Consciousness of university students
3.2.2 Final Questionnaire draft
The first draft of the questionnaire was given to two Dutch and two Greek students for assessment and critiques. The four students filled in the questionnaire and then wrote down their opinion and reviews, as well as suggestions for improvements. Based on the test persons’ assessment and additional review by the researcher, the final questionnaire was modulated as follows:
With regards to the Knowledge construct, three of the items were questioned by the test persons because they were considered as outdated, in a sense that the effect of the described problems to the natural environment today has been significantly reduced because of the local and international interference regarding those issues and the legislation enacted against them. Consequently, the items Acid rain, Pollution from pesticides and Building in unspoilt areas were removed from the scale. The remaining eight items were retained with slight changes in wording for a couple of them, in order to become more easy to interpret. Ultimately, the knowledge construct constituted Section 1 of the final questionnaire and included eight items describing well-reported environmental issues/problems.
The Attitudinal construct was perceived as tiresome by the test persons, as it was expected from the beginning. Three of the test persons considered superfluous and confusing the existence of more than one statements with almost the same meaning. After discussion, it was decided to reduce the items of the attitudinal domain by removing statements which had almost the same meaning with other statements. In the end, thirteen statements were retained into the final questionnaire. Concerning the item that was removed from the measure in Bohlen et al. study, all test persons considered this item as important and representative of the domain. It was decided eventually that the statement “Firms should always put profitability before environmental protection” should be incorporated in the questionnaire. The attitudes construct comprised Section 2 of the questionnaire with thirteen items-statements expressing attitudes about the environment.
All items within the non-purchasing behavior construct were interpreted well by the test persons and retained in the final draft. The only addition was an explanation of the initials “M.P.” (Member of the Parliament) because the test persons were not sure about the meaning of those initials. The non-purchasing behavior dimension was placed in Section 3a of the questionnaire and it consisted of eight items, four of them referring to recycling activity and the rest referring to political action/other actions.
Regarding the purchasing behavior domain, the items of unleaded petrol and ozone-friendly aerosols were excluded from the questionnaire because the test persons perceived them as extremely obsolete, something that was expected. Instead, there were
The Netherlands & Greece
Measuring Environmental Consciousness of university students
suggestions from two of the test persons to incorporate in the item pool categories of products that are not environmentally-friendly, in order to investigate the inclination of the respondents in consuming products harmful to the environment and to reduce acquiescence bias. After searching the literature, it was decided to include two additional categories of environmentally harming products: 1) soft drinks etc, in nonreturnable containers, which derived from the article of Murphy E. P. et al (1978) and 2) plastic knives, forks, spoons or plates (plastic cutlery or plates), which derived from the article of Laroche M. et al (2001). Additionally, another item from the same article was included in the final draft. This was the statement “I refuse to buy products from companies accused of being polluters” and it was included in order to investigate whether the respondents considered ecological issues before buying products from specific companies. Ultimately, the purchasing behavior dimension constituted Section 3b of the final questionnaire and included ten items: four items-statements of general purchasing behavior and a list of six product categories.
At the beginning of the questionnaire, before the main sections, six questions were placed regarding socio-demographics/characteristics of the sample. The questions aimed at gathering information about the respondents’ gender, age, marital status, personal educational background and parents’ educational background. The final draft of the questionnaire can be found in Appendix 1.
3.3 Measures of variables
Analytically, the variables incorporated into the questionnaire were measured using the following measurements:For the socio-demographics part, the nominal variable ‘Gender’ was measured using the two options ‘male’ and ‘female’. The interval variable ‘Age’ was measured in six age groups: Under 25, 25-34, 35-44, 45-54, 55-64, 65+. The nominal variable ‘Marital status’ was measured using four categories: Single, Engaged, Married, Divorced. The ordinal variables regarding the respondent’s educational background, as well as educational background of the father and the mother of the respondent were measured using five educational levels: Secondary education graduate, HBO, WO, Master, Ph.D. Those levels applied to Dutch respondents. For the Greek ones, a conversion was made according to the respective educational levels of the Greek educational system.
The eight items within the Knowledge construct were measured on a five-point evaluation scale ranging from 1 (I know nothing about) to 5 (I know a great deal about). The thirteen items concerning Attitudes were measured on a 5-point Likert-type scale ranging from 1 (Strongly disagree) to 5 (Strongly agree). The eight items concerning Non-purchasing behavior were measured using a 5-point frequency scale ranging from 1
The Netherlands & Greece
Measuring Environmental Consciousness of university students
(Would never do) to 5 (Do often). Finally, the ten items concerning Purchasing behavior were measured again on a 5-point frequency scale ranging from 1 (Never) to 5 (Always).
3.4 Sample Characteristics
In chapter 2.1 it was mentioned that our survey applied to academic students of all levels and all age groups. For instance, a 50 years old person that participated in an academic programme could be a respondent of the survey. The students had to be Dutch and Greek natives respectively. The initial target number of respondents was at least 30 respondents from each country-nationality.
The total number of Dutch surveys completed was 42, from which 17 contained several missing values and therefore had to be eliminated from further research. Due to the lack of time for a second round of online surveys and given the period of the two months that the questionnaire was online, the number of 25 (N) respondents as a final sample was considered adequate. The general-demographic information of the Dutch respondents is provided in the following table:
Table 1: Dutch sample characteristics
General-demographic characteristicsItems
Number of cases Percentage % of respondents
GenderMale Female
169
6436
AgeUnder 2525-3435-4445-5455-6465+
14101---
5640 4---
Marital statusSingleEngagedMarriedDivorced
223--
8812
--
Educational backgroundSecondary education graduateHBOWOMasterPh.D.
226
15-
88
2460
-
The Netherlands & Greece
Measuring Environmental Consciousness of university students
Father's educational backgroundSecondary education graduateHBOWOMasterPh.D.
91033-
36401212
-Mother's educational backgroundSecondary education graduateHBOWOMasterPh.D.
14623-
56248
12-
As the Table 1 indicates, 64% of the Dutch respondents were males and 36% were females. The age distribution was as follows: 56% were under 25 years, 40% were between 25-34 years and 4% were between 35-44 years. In addition, 88% of the respondents were single and 12% engaged. The educational background of the respondents varied as follows: Secondary education graduates 8%, HBO 8%, WO 24%, Master 60%. The educational levels of the fathers of the respondents were as follows: Secondary education graduates 36%, HBO 40%, WO 12%, Master 12%. Finally, the educational background of the mothers of the respondents varied as follows: Secondary education graduates 56%, HBO 24%, WO 8%, Master 12%.
As regards the Greek part of the survey, from the 60 questionnaires received back, 10 of them contained several missing responses and thus, had to be eliminated from further research. The number of 50 (N) respondents was considered as an adequate sample, since the target number of 30 respondents had been reached. The gender distribution among Greek respondents was: 60% males and 40% females. The age distribution was as follows: 88% of the respondents were under 25 years, while the rest 12% were between 25-34 years. In addition, 96% of the respondents were single, 2% engaged and 2% married. Regarding educational background, 82% of the respondents were secondary education graduates, 4% were T.E.I.1 graduates, 8% were A.E.I.2 graduates and 6% Master graduates. The educational levels of the fathers of the respondents were as follows: Secondary education graduates 50%, T.E.I. 22%, A.E.I. 16%, Master 10% and Ph.D. 2%. Finally, the educational background of the mothers of the respondents varied as follows: Secondary education graduates 60%, T.E.I. 14%, A.E.I. 20%, Master 4% and Ph.D. 2%.
1 T.E.I.: Academic institutions mostly focused on technological/practical education & experience
2 A.E.I.: Top-ranking academic institutions/universities focused on theoretical & practical knowledge/education
The Netherlands & Greece
Measuring Environmental Consciousness of university students
A summary of the Greek general-demographic information can be found in Table 2 on the next page.
Table 2: Greek sample characteristics
General-demographic characteristicsItems
Number of cases Percentage % of respondents
GenderMale Female
30 20
6040
AgeUnder 2525-3435-4445-5455-6465+
446----
8812
----
Marital statusSingleEngagedMarriedDivorced
4811-
9622-
Educational backgroundSecondary education graduateT.E.I.*A.E.I.**MasterPh.D.
41243-
82486-
Father's educational backgroundSecondary education graduateT.E.I.A.E.I.MasterPh.D.
2511851
502216102
Mother's educational backgroundSecondary education graduateT.E.I.A.E.I.
307
10
601420
The Netherlands & Greece
Measuring Environmental Consciousness of university students
MasterPh.D.
21
42
*T.E.I.: Academic institutions mostly focused on technological/practical education & experience**A.E.I.: Top-ranking academic institutions/universities focused on theoretical & practical knowledge/education
3.5 Statistical techniques
For the analysis of the data gathered from the two surveys various statistical methods were used. Firstly, the Means of the scores succeeded on every item were calculated, in order to draw general conclusions and compare the results between the two nationality samples. After that, a T-test for independent samples was conducted in order to investigate whether the differences between the total and partial averages scored by the two groups/samples on each environmental scale were statistically significant. In addition, all items/variables per construct were included in Factor Analysis, in order to summarize the large amount of information gathered and reduce the number of items into a smaller group of underlying dimensions or factors. In total, four separate Principal Component Analyses were conducted. Finally, the factors derived from those analyses were used further in Multiple Regression Analysis, in order to investigate the relationships between the three main constructs/dimensions of environmental concern. All the results from the analyses are presented in the following chapter (4).
The Netherlands & Greece
Measuring Environmental Consciousness of university students
Chapter 4: Results
4.1 Means
A first step in order to obtain a general, but importantly representative view of the results of our survey, is to calculate the averages (means) of the scores succeeded in each question of the three investigated components of ecological concern. Below the averages are estimated according to our research questions:
1. Which is the level of knowledge of Dutch and Greek students about (specific) environmental issues and what are their attitudes towards the environment?
For better understanding of the findings we divided the question in two parts: a) Knowledge and b) Attitudes.
a) Knowledge
Table 3
The Netherlands & Greece
KNOWLEDGEProblem/issue DUTCH GREEK
1 2.88 3.262 2.64 3.023 3.60 3.644 3.08 3.395 2.88 3.106 3.36 3.687 3.36 3.288 2.44 2.44
Total average 3.03 3.23
Measuring Environmental Consciousness of university students
In table 3 we can see the averages scored for each question incorporated in the knowledge component and the total averages for the two countries. The averages highlighted in red color are those calculated with less respondents, due to the absence of an answer to the respective questions by some of the respondents. As a general observation we can say that Greek students score higher than the Dutch as regards knowledge about specific ecological problems. Particularly, Greek students appear to know more about sea/river pollution and air pollution from power stations (questions 1 & 2) with an average difference of +0.38. In addition, the average difference is high for the knowledge concerning destruction of forests (question 6) with a +0.32 for the Greeks. This could be justified on the basis of the extensive problem with arsons in Greece, which have destroyed large parts of forest land during the past few years. On the other hand, the Dutch score higher in knowledge of the implications the world-population growth has on the natural environment (question 7, +0.08). Another interesting remark is the equality of the averages for the last question (8), on radiation from storage of nuclear waste. Students from both countries have a relatively low average of knowledge, which could be explained by the complexity of the particular issue/problem.
b) Attitudes
Table 4
The Netherlands & Greece
ATTITUDESStatement DUTCH GREEK
1 3.76 4.382 3.52 4.063 4.16 4.68
4* 3.71 3.215 2.76 3.53
6* 3.56 3.987* 3.60 3.968* 3.40 3.849* 3.79 3.9610 3.80 4.5411 4.20 4.5212 4.04 4.48
13* 3.72 3.94Total average 3.69 4.08
Measuring Environmental Consciousness of university students
In the attitudes section, for a number of statements, the answers given needed to be reversed, in order to address the matter of negatively worded statements, i.e. a score of 5 became 1 etc. These are the statements marked with a (*) in Table 4 above . Once again, Greek students achieved a higher total average of 4.08, whereas Dutch students scored a total 3.69. The highest difference occurred for statement 5 (+0.77 for the Greeks), which indicates that Greek students consider the environmental policies of the main political candidates more than the Dutch when they decide how to vote. On the contrary, Dutch students seem to disagree to a larger extent with statement 4, that “the benefits from environmental protection do not justify the expenses involved”, scoring an average of 3.71 against a 3.21 for the Greeks. The lowest difference (0.17) between the two countries occurred for statement 9, with the Greeks appear to disagree slightly more (3.96 against 3.79) that the combined effect of individual contribution to environmental protection would be negligible. Finally, both countries achieved significantly high averages for statements 3 & 11, showing their level of agreement with the need to preserve the environment for the future generations and the importance of personal environmental responsibility in everyday life respectively.
From the results obtained above, it is clearly shown that Hypothesis H1a should be accepted. The total mean scores of the Dutch students indicate 1) a moderate level of knowledge about environmental problems (total mean: 3.03, slightly above the middle of the scale) and 2) neutral to positive attitudes toward the environment (total mean: 3.69). As for Hypothesis H1b, it should be accepted as well, since the total mean scores for the Greeks indicate 1) a moderate level of environmental knowledge (total mean: 3.23) and 2) positive attitudes toward the environment and its quality (total mean: 4.08).
2. How Dutch and Greek students behave as regards the environment?
According to the division of the behavioral component in a) non-purchasing and b) purchasing behavior, we calculated the averages separately:
a) Non-purchasing behavior
Table 5
The Netherlands & Greece
BEHAVIOR non-purchasing
Indicator DUTCH GREEK
1 3.44 3.50
2 2.60 2.90
3 4.25 2.98
4 2.72 3.38
5 2.12 2.42
6 1.60 2.32
7 1.64 2.24
8 2.58 3.18Total average 2.62 2.87
Measuring Environmental Consciousness of university students
Our findings here indicate a higher total average for the Greek students, with a difference of +0.25 (see Table 5 above). Regarding recycling activities, Greek students seem to be more active in recycling metals and plastics (indicators 2 & 4), with average differences of +0.30 and +0.66 respectively. The averages for paper-recycling activity (indicator 1) are almost the same with a small +0.06 favoring the Greeks. An impressive average of 4.25 against a 2.98 indicates that Dutch students are far more active in recycling glass materials (indicator 3), with a difference of +1.27.
On the other hand, both countries’ students achieve relatively low averages for “other actions” or “political actions” undertaken. This could be explained on the basis of the increased level of commitment these actions require and thus it is difficult for many students to join in, due to their demanding studying responsibilities. An average difference of +0.72 shows that Greek students undertake more often actions related to approaching and lobbying M.P.s about green issues (indicator 6). Both countries’ students score their highest averages for boycotting companies that disrespect the environment (indicator 8), whilst both groups score low averages for writing to newspapers about green issues (indicator 7).
b) Purchasing behavior
Table 6
The Netherlands & Greece
BEHAVIOR purchasing
Indicator DUTCH GREEK
1 3.52 3.64
2 2.60 2.62
3 2.24 2.72
4 2.56 3.40
5 2.80 3.34
6 2.92 3.38
7 2.96 3.20
8 3.28 3.32
9* 3.71 3.44
10* 3.48 3.34Total average 3.01 3.24
Measuring Environmental Consciousness of university students
Interesting findings derive by calculating the averages for purchasing behavior elements (see Table 6). First of all, Greek students achieve a higher total average than the Dutch, with a difference of +0.23. For statements 3 & 4 related to environmentally-sensitive purchasing behavior, Greek students try to discover the environmental effects of products before buying and they refuse to buy products from polluters respectively more frequently than the Dutch , with differences in averages of +0.48 for statement 3 and +0.84 for statement 4. In general though, both groups score rather low averages for all statements of purchasing behavior. Now, for the six categories of environmentally friendly/harmful products, again the averages are relatively low for both countries, with the Greeks prevailing in categories 5-8 and especially for buying more often than the Dutch eco-friendly detergents and products not tested on animals (indicators 5 & 6). For indicators 9 & 10, individuals’ scores had to be reversed in order to address the fact that these categories refer to eco-harmful products, i.e. a score of 5 (“always”) became 1 (“never”). Dutch students achieve higher averages in both of these categories, which means that they buy plastic plates and/or cutlery (indicator 9) and refreshments in non-returnable containers (indicator 10) less frequently compared to Greek students.
From the results obtained above, it is obvious that Hypothesis H2a should be partially rejected. Dutch students achieve a low total mean score (2.62) on environmentally-sensitive non-purchasing behavior and not a moderate at least, as was hypothesized. On the other hand, they achieve a moderate level (3.01) of environmentally-sensitive purchasing behavior, thus Hypothesis H2a is partially supported. As for Hypothesis H2b, it should be completely accepted, as the Greek students achieve a low total mean score (2.87) on non-purchasing behavior and a moderate total mean (3.24) on purchasing behavior.
In Appendix 2, a table with group statistics is available, which contains information about the means scored for all the variables included in our survey, as well as the respective standard deviations and standard error means.
4.2 Performing the Independent Samples t-test
In the previous section, we calculated the total averages of the scores which both countries achieved in each investigated domain and then we made general comparisons between the partial and total averages of the two groups. The main finding is that Greek students scored higher total averages for all the dimensions/components of Ecological Concern. The question here is whether the differences between the averages/means of the two groups are statistically significant. For this reason, a t-test for independent groups has
The Netherlands & Greece
Measuring Environmental Consciousness of university students
been used for each separate dimension. Our two groups satisfy the prerequisite of independence, since they have different people in them and the people in the two groups have not been matched or paired in any way. Basically, the procedure of the Independent Samples Test using SPSS consists of two tests. One of them is the Levene’s test, which is used to check whether variances are different in different groups/samples. Levene’s test is similar to a t-test in a sense that it tests the hypothesis that the variances in the two samples are equal (i.e. the difference between the variances is zero). In other words, if Levene’s test is significant at p ≤ .05, that provides confidence in the hypothesis that the variances are significantly different and that the assumption of homogeneity of variances has been violated. On the contrary, if Levene’s test is non-significant (p > .05) then we can assume that the variances are roughly equal and the assumption is defensible. Consequently, if the Levene’s test is not significant, we should use the row labeled Equal variances assumed in the SPSS output table (see Appendix 3). Otherwise, if Levene’s test is significant, then we should read the test statistics from the row with the label Equal variances not assumed. Depending on the result of the Levene’s test, we then have to look at the t-test itself, according to the respective row indicated by the Levene’s test. The t-statistic is significant at p ≤ .05, and when this is the case, we can conclude that the means of the two samples are significantly different. In the case that the significance value of t (Sig. 2-tailed) is greater than .05, then we should conclude that there is no significant difference between the means of the two samples.
To test the hypotheses H3a, H3b and H3c, the independent t-test was performed initially for the total averages scored in each environmental dimension by the two countries. In this way we could draw conclusions for the differences between the general levels of knowledge, attitudes and behavior for the two countries. However, it was decided to use the t-test in order to investigate as well the partial differences between the means scored, that is for each component of the dimensions separately. In this way conclusions could be drawn for specific components/items of the environmental measures.
Below, the results of the t-test are presented for each separate dimension, first for the total averages and then for the partial averages.
4.2.1 T-test: Interpretation
Knowledge
General Knowledge: The results from the t-test for the total averages of the two samples show that there is no significant difference between the means of the two samples regarding knowledge. The two-tailed value of p is .336, which is greater than .05 and thus not significant. Therefore, Hypothesis H3a should be rejected.
The Netherlands & Greece
Measuring Environmental Consciousness of university students
Knowledge scale items: The results from the t-test for the “knowledge” items-variables reveal that there are no significant differences between the means of the two groups for all the items associated with knowledge. Particularly, the t-test for equality of means reveals that the “Sig. (2-tailed)” values are greater than .05 for all the variables. Consequently, the differences between the means/averages of the two groups for the Knowledge component items are all not significant.
Attitude
General Attitudes: The t-test for equality of means performed for the total averages scored on the Attitudes scale extracts a two-tailed value of p = .02, which is less than .05 and therefore significant. Thus, we have to conclude that there is a significant difference between the total means of the two groups and that Hypothesis H3b should be rejected.
Attitudes Scale items: The results of the t-test for the items-variables of the “Attitude” section are quite varied. For the variables 1, 2, 3, 5, 10 and 12 the “Sig.(2-tailed)” values are smaller than .05, which leads us to conclude that the means of the two groups for these variables are significantly different. On the other hand, variables 4, 6, 7, 8, 9, 11 and 13 have “Sig.(2-tailed)” values greater than .05 and thus the differences between the means of the two groups are not significant for these variables.
Behavior
a) Non-purchasing Behavior
General Non-purchasing Behavior: The findings from the t-test for equality of means reveal that there is no significant difference between the total averages of the two samples regarding Non-purchasing behavior. The two-tailed value of p is .505, which is greater than .05 and thus part (a) of Hypothesis H3c should be rejected.
Non-purchasing Behavior Scale items: The results for the “Non-purchasing Behavior” items-variables reveal that the significance of differences between the means of the two groups-nationalities is diversified. For variables 3, 4, 6 and 7 there are significant differences between the means of the two groups, since the p values are less than .05 for all these variables, whilst for the variables 1, 2, 5 and 8 the two-tailed p values are greater than .05 and thus the differences are not significant.
b) Purchasing behavior
General Purchasing Behavior: The t-test for equality of means performed for the total averages scored on the Purchasing Behavior scale yields a two-tailed value of p = .217,
The Netherlands & Greece
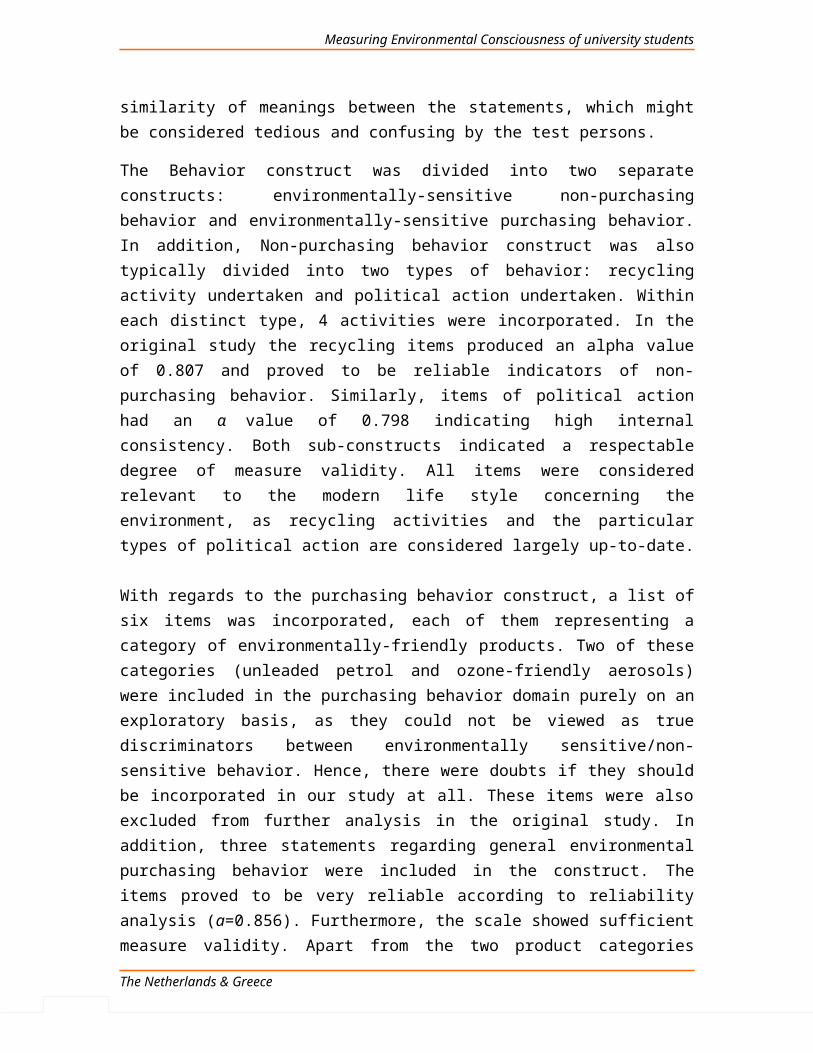
Measuring Environmental Consciousness of university students
which is greater than .05 and thus we must conclude that there is no significant difference between the total averages of the two samples. Therefore, part (b) of Hypothesis H3c should be accepted.
Purchasing Behavior Scale items: As regards the “Purchasing Behavior” items/variables, for the variables 4 & 5 the respective two-tailed values of p are less than .05 and thus the differences between the means of the two groups are significant for these variables. On the other hand, for the variables 1, 2, 3, 6, 7, 8, 9 & 10 the respective p values are all greater than .05 and therefore the differences between the means/averages of the two samples for these items/variables are considered non-significant.
The SPSS outputs for the independent samples t-tests for the total averages of the two samples, as well as for all items within the measures can be found in Appendix 3 (3.1 and 3.2 respectively).
4.3 Factor Analysis
Generally, factor analysis is a technique for identifying groups or clusters of variables. This technique is useful for various purposes, among others to reduce a data set to a more manageable size while retaining as much of the original information as possible. If we measure several variables or ask people several questions about themselves, we are able to get the correlations between each pair of variables (or questions) an arrange them in what is known as an R-matrix (correlation matrix). In factor analysis, our goal is to reduce this R-matrix down to its underlying dimensions (factors or latent variables) by looking at which variables seem to cluster together in a meaningful way. This reduction is achieved by searching for variables that correlate highly with a group of other variables, but do not correlate with variables outside of that specific group.
4.3.1 Performing the analysis
In our case, principal component analysis was conducted for the data collected from both nationality groups. A separate analysis was conducted for each component of environmental concern and the variables within them. For each analysis a Correlation matrix was produced together with a table indicating the significance value of each correlation in the R-matrix (correlation matrix). Moreover, the KMO and Bartlett’s test of sphericity was produced in order to measure sampling adequacy and the significance of Bartlett’s test. For factor extraction, both the unrotated factor solution and the Scree plot were chosen to be displayed, while for the Eigenvalues over option the Kaiser’s recommendation of eigenvalues over 1 was chosen. Next, the method of rotation chosen was orthogonal and specifically varimax, because it was assumed that the underlying factors are independent. Finally, the factor scores produced from the analyses were saved
The Netherlands & Greece
Measuring Environmental Consciousness of university students
as variables in the data editor, in order to be used later for further analysis. In order to ensure that factor scores are uncorrelated, the Anderson-Rubin method was selected. As supplementary option, it was selected the coefficients to be sorted by size in the component and rotated component matrices, so that SPSS to order the variables according to their factor loadings. In addition, it was chosen to suppress absolute values of the factor loadings which were less than 0.4. That option would assist a lot in interpretation.
First Factor Analysis run: Knowledge
In the first factor analysis run, all variables within the knowledge domain were included. A principal component analysis was conducted on the eight items, using orthogonal rotation (varimax). The Kaiser-Meyer-Olkin (KMO) measure confirmed the sampling adequacy for the analysis, with KMO = .73, which was bigger than the bare minimum of .5. Bartlett’s test of sphericity was below .05 and thus significant. An initial analysis was run to obtain eigenvalues for each component in the data. Three components had eigenvalues over Kaiser’s criterion of 1 and combined, they explained 67.31% of the variance. The scree plot was ambiguous and showed multiple points of inflexion, so it was decided to retain the three components indicated from Kaiser’s criterion in the final analysis. Comparing the two matrices before and after rotation, things were meaningfully clarified after rotation. All variables (except one) loaded very highly onto only one factor. Interpretation was easier because we have chosen the options of suppression of loadings less than .4 and ordering of variables by loading size. In the Rotated Component Matrix the variables sea/river pollution, pollution of drinking water, ozone layer depletion and forests’ destruction loaded highly on the first component/factor. Also, the variables radiation from storage of nuclear waste and air pollution from power stations loaded highly on factor 2. Finally, world population growth and climate change clustered highly on factor 3.
Second Factor Analysis run: Attitudes
In the second factor analysis run, all the thirteen items of the Attitudes domain were included. Principal component analysis was conducted on the thirteen items using orthogonal rotation (varimax). The KMO measure verified the sampling adequacy, with the KMO statistic being greater that .5 and specifically .81. The value of Sig. for Bartlett’s test was less than .05 and thus significant, which indicated that correlations between items were sufficiently large for principal component analysis. After the initial analysis, the Total Variance Explained results revealed that three components in the data had eigenvalues over Kaiser’s criterion of 1 and in combination they explained 56.61% of
The Netherlands & Greece
Measuring Environmental Consciousness of university students
the total variance. Once again the scree plot was ambiguous in indicating how many components to retain, because it showed inflexions in more than one points and there seemed to be no convergence with the Kaiser’s criterion. Therefore, it was decided to extract three components (factors) according to Kaiser’s criterion of 1. The factor loadings after orthogonal rotation indicated that there were six variables which clustered on component/factor 1 with loadings higher than .4. In addition, five variables loaded highly on factor 2 and two variables loaded highly on factor 3.
Third Factor Analysis run: Non-purchasing behavior
In the third factor analysis run, the eight items of the non-purchasing behavior sub-domain were included. A principal component analysis was conducted on these eight items using orthogonal rotation (varimax). The KMO statistic was significant (.64) and confirmed sampling adequacy for the analysis. Furthermore, Sig. value of Bartlett’s test was less than .05 and thus significant. From the initial analysis eigenvalues were obtained for each component in the data and two of those values were above the Kaiser’s criterion of 1. The components with those eigenvalues in combination explained 57.94% of the variance. Scree plot was again difficult to interpret in a precise way, thus it was decided to retain two components/factors in the final analysis according to Kaiser’s criterion. From the Rotated Component Matrix it was clear that four items (variables) clustered on factor 1 with high factor loadings. These were the four items related to recycling activities. Finally, the rest four items -which were related to political action/other actions concerning the environment- loaded highly on factor 2.
Fourth Factor Analysis run: Purchasing behavior
In the fourth and final factor analysis, all ten items of the purchasing behavior sub-domain were included. Once again, a principal component analysis with orthogonal rotation (varimax) was conducted on the items. The KMO measure confirmed the sampling adequacy for the analysis, with a significant KMO statistic = .72. Bartlett’s test was significant as well. Therefore, there were relationships between the variables included in the analysis. After the initial analysis, eigenvalues were obtained for all components in the data. Two components had eigenvalues over Kaiser’s criterion of 1 and in combination they explained 50.81% of the total variance. The scree plot was ambiguous, but one of its inflexion points was converged with Kaiser’s criterion, so we decided to retain two components in the final analysis. After the orthogonal rotation, it was obvious that eight items had high factor loadings on factor 1 and two items had high loadings on factor 2. It is worth mentioning here that all the items/variables which clustered on factor 1 were all related to ecologically-concerned purchasing behavior,
The Netherlands & Greece
Measuring Environmental Consciousness of university students
either they were statements or categories of ecological products. On the other hand, the two items which loaded highly on factor 2 represented categories of products harmful to the environment.
Conclusion: From the four factor analyses conducted we managed to summarize the variables/items of each component/dimension of environmental concern into smaller sets of factors. Furthermore, the factor scores achieved from each analysis were used in the ongoing regression analysis part.
The SPSS outputs for the four factor analyses can be found in Appendix 4 (4.1, 4.2, 4.3 & 4.4 respectively).
4.4 Regression
In the next step of our data analysis we used the method of multiple regression to test the effects between the three dimensions of ecological awareness. The conceptual model of this study is presented briefly in the following figure:
Figure 4. The investigated relationships between the measures of environmental concern
The basic hypotheses here are that individuals’ attitudes are shaped depending on the knowledge those individuals possess on a particular topic, in our case, the environment. Consequently, those attitudes reflect on individuals’ actual behavior concerning the environmental protection/preservation. In order to measure the effects between those concepts, we conducted multiple regression analysis in three main parts:Part 1: Measuring the effect of the knowledge construct on the attitudinal construct.Part 2: Measuring the effect of the attitudinal construct on the non-purchasing behavioral construct.Part 3: Measuring the effect of the attitudinal construct on the purchasing behavioral construct.
4.4.1 Regression Part 1: The effect of Knowledge (and demographics) on Attitudes
Both samples
The Netherlands & Greece
BEHAVIORATTITUDESKNOWLEDGE
Measuring Environmental Consciousness of university students
For the first regression analysis run of Part 1, all data from both nationality samples were used. As dependent variable, it was used the first factor which derived from the (second) factor analysis run on attitudes. This was a logical decision, since Factor 1 explained the larger percentage of the total variance. For predictor (independent) variables, all factors from the first factor analysis run on knowledge were included in the model. In addition, all the demographic variables were also entered as independent variables. After running the analysis, certain outcomes were found. First of all, the R2 value was .225, which meant that the proportion of variance in the outcome that was accounted for by the predictors was 22.5%. Next, the ANOVA produced an F value of 1.839 with an associated significance value of .081, which was bigger than .05 and thus not significant. This result meant that our model was not significantly better at predicting the outcome than using the mean value of scores on attitude statements. In short, the regression model overall did not predict attitude scores significantly well. However, what was mostly important was to examine the individual contribution of the variables to the model. The SPSS estimates for the b-values indicated positive as well as negative b-values. Therefore, there were positive as well as negative relationships between the predictors and the outcome. From the values of t and Sig. we came to the conclusion that only the (positive) b-values of two independent variables had rather large associated t-values and values of Sig. less than .05. These variables were the factors 1 and 3 of the factor analysis made on the knowledge component. Therefore, it could be concluded that the Knowledge predictors made a significant contribution to the model or that knowledge had a direct positive effect on attitudes, when the data comes from both nationality samples.
Greek sampleApart from the effect of knowledge on attitudes related to data from both our samples, we also wanted to investigate the same effect for each of the samples separately. For this reason we firstly ran an analysis only for the Greek sample. The value of R2 was .307, which means that the predictors could explain 30.7% of the variance in the outcome. Moving on to the ANOVA part, the F-ratio was 1.672. This F value was not significant, which meant that there was a rather big probability the specific F-ratio was obtained by chance. In other words, the regression model was not a significant fit of the data overall. Moving on to the interpretation of the Coefficients, the b-values indicated positive, as well as negative relationships between predictors and the outcome. However, all predictors associated with knowledge had positive b-values indicating positive relationships. Moreover, the factor 3 for knowledge had a Sig. value of .002 < .05. Therefore, it could be concluded that one of the knowledge predictors made a significant contribution to the model. In other words, there was a significant positive effect of knowledge on attitudes concerning the Greek respondents of our survey. In addition, the predictor GENDER also made a significant contribution to predicting the outcome ( p = .049 < .05).
The Netherlands & Greece
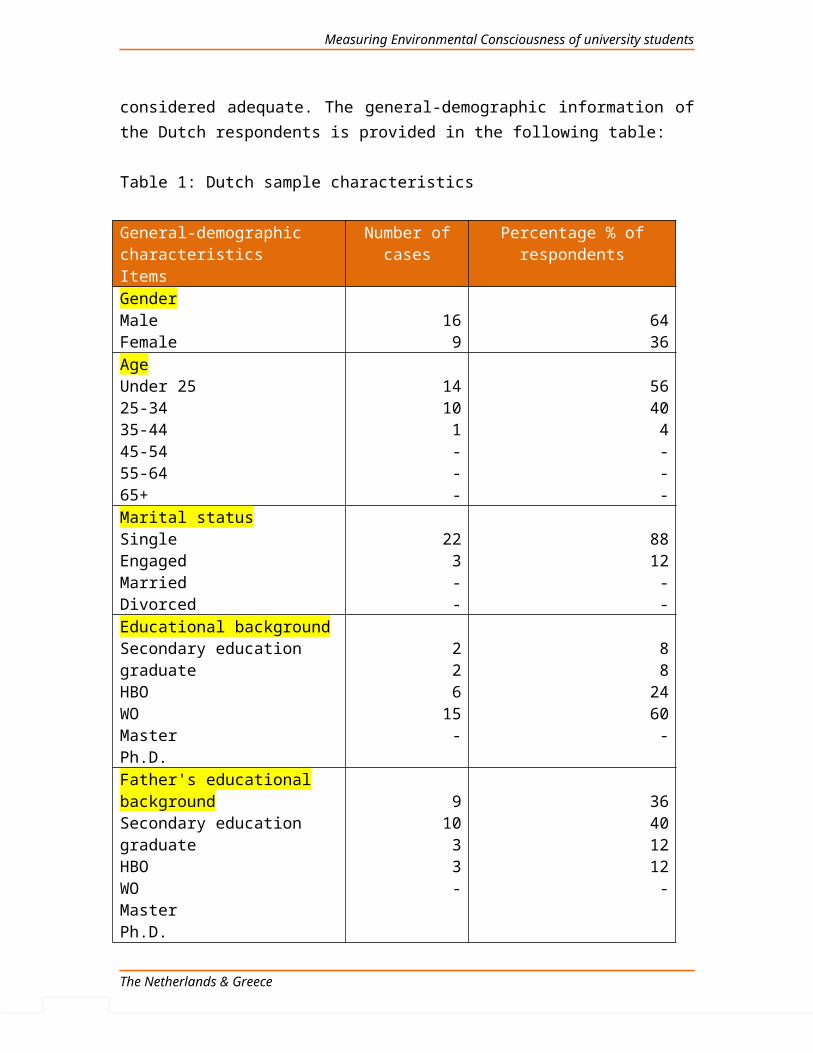
Measuring Environmental Consciousness of university students
Dutch sampleThe next step was to run an analysis with selecting only the Dutch cases (respondents), to examine the influence of knowledge and demographic variables on Attitudes. The SPSS output yielded the value .499 for the R2. This means that the predictor variables had explained 49.9% of the variation in the outcome variable, which was the largest percentage compared to the two previous analyses. However, the ANOVA generated the value 1.44 for the F-ratio with a Sig. value of .266, which means that the F-ratio was not significant (p > .05). Therefore, this can be interpreted by saying that the regression model overall did not predict Attitudes significantly well. Finally, the b-values of the SPSS output revealed positive and negative relationships between Attitudes and the predictor variables. Particularly, the b-values for two of the knowledge predictors (factors 1 & 2) were positive, whilst the b-value for knowledge factor 3 was negative. However, none of these values was significant according to the Sig. column (p > .05 for all these values). Therefore, the knowledge predictors did not make a significant contribution to predicting the outcome variable. In fact, the only predictor which had a significant contribution to the model was the predictor FATHER’S EDUC., with a positive b-value of 1.189 and Sig = .049 < .05, slightly below the significance limit of .05.
According to the analyses above, Hypothesis H4a should be accepted for the Greek sample and for the samples combined, but it should be rejected for the Dutch sample. The SPSS outputs for the three regression analyses can be found in Appendix 5 (5.1.a, 5.1.b, 5.1.c respectively).
4.4.2 Regression Part 2: The effect of Attitudes (and demographics) on Non-purchasing Behavior
Both samplesAll data gathered from both our nationality samples were used for the first regression analysis of Part 2. Factor 1 from the factor analysis on non-purchasing behavior (NPURB from now on) was defined as the dependent variable. All three factors from the factor analysis on attitude variables as well as all the demographic variables were included in the analysis as independent variables. According to the SPSS output, the R2 value was .219 which means that 21.9% of the variability in the outcome was accounted for by the predictors. Moving on to the ANOVA, the value of F was 1.741 and not significant (p = .101 > .05) Thus, the regression model overall did not predict NPURB significantly well. Next, there were positive, as well as negative b-values, indicating positive and negative relationships between the predictors and the outcome. The Attitudes factors 1 & 3 had positive b-values, while Attitudes factor 2 had a negative one. However, only the b-value of Attitudes factor 1 was significant (p < .05) and therefore it could be considered as a significant predictor of the outcome. In other words, Attitudes factor 1 had a
The Netherlands & Greece
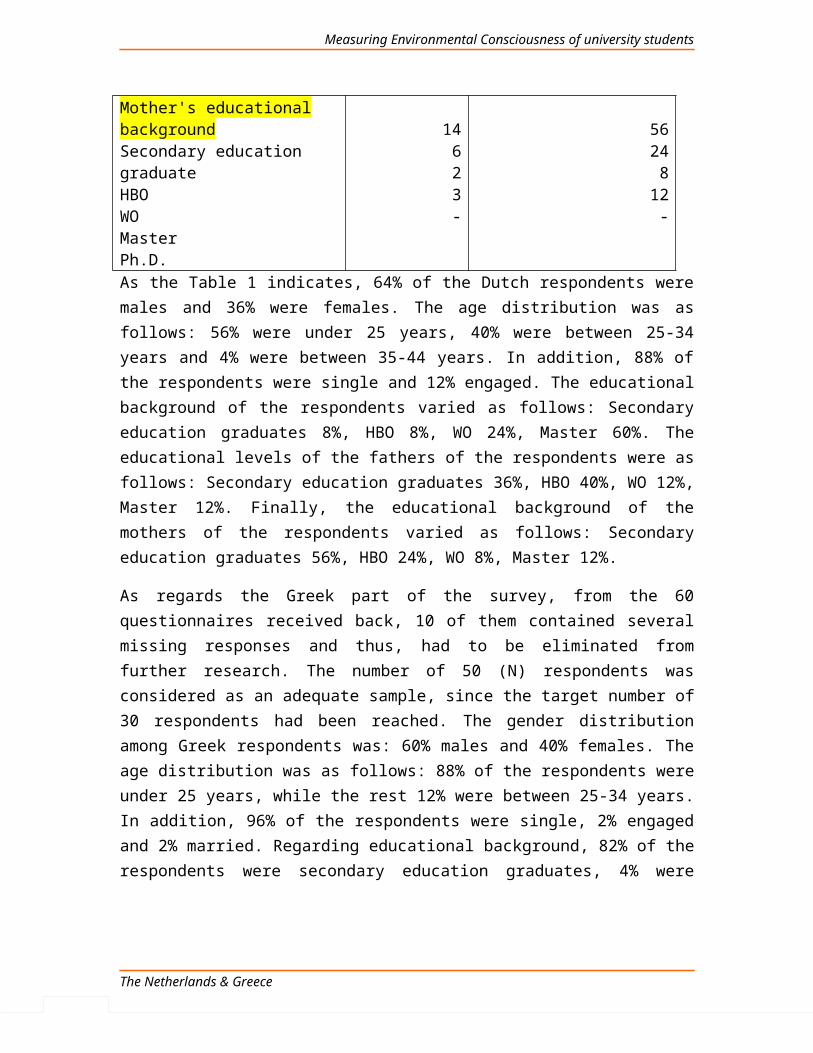
Measuring Environmental Consciousness of university students
significant positive effect on NPURB. None of the other predictors – attitudinal and demographic - had made a significant contribution to predicting the outcome variable.
Greek sampleThe next regression analysis run was conducted using only the data accumulated from the Greek students-respondents. According to the SPSS output, the value of R2 was .248 and indicated 24.8% of the variation in the outcome explained by the predictors. In addition, the ANOVA gave a value of F = 1.282, which was not significant (p = .281 > .05). Consequently, the regression model was not a significant fit of the data overall. Finally, the estimated b-values indicated positive and negative relationships between the predictors and the outcome. Specifically, the Attitudes factors 1 & 2 had positive b-values, while the Attitudes factor 3 had a negative b-value. Among these three predictors, only Attitudes factor 1 had a significant b-value (Sig. = .049 < .05) and therefore it was a significant predictor of NPURB. All the other predictors in the model did not make a significant contribution to predicting the outcome.
Dutch sampleThe last regression analysis of Part 2 was conducted with selecting only the Dutch cases (respondents). The SPSS generated a value of .582 for the R2 and indicated that the proportion of variance explained by the model was 58.2%, which was a relatively large amount of variance explained. On the other hand, the ANOVA gave a value for the F-ratio equal to 1.705, yet not significant (p = .20 > .05). Consequently, the model overall did not predict the outcome variable significantly well. All predictor variables -except the variable GENDER- indicated positive relationships with the outcome, according to the estimated b-values. Although the Attitudes predictors had positive relationships with the outcome, their individual contributions to the model were not significant (p > .05). In other words, the Attitudes predictors were not significant predictors of NPURB. In addition, none of the demographic variables was a significant predictor of the outcome.
According to the analyses above, Hypothesis H4b should be accepted for the Greek sample and for the samples combined, but it should be rejected for the Dutch sample. The SPSS outputs for the three regression analyses can be found in Appendix 5 (5.2.a, 5.2.b, 5.2.c respectively).
4.4.3 Regression Part 3: The effect of Attitudes (and demographics) on Purchasing Behavior
Both samplesThe first regression analysis of part 3 was conducted on the data gathered from both nationality samples. As dependent variable was defined Factor 1 from the factor analysis made on the Purchasing behavior (PURB from now on) variables. All three attitudinal
The Netherlands & Greece
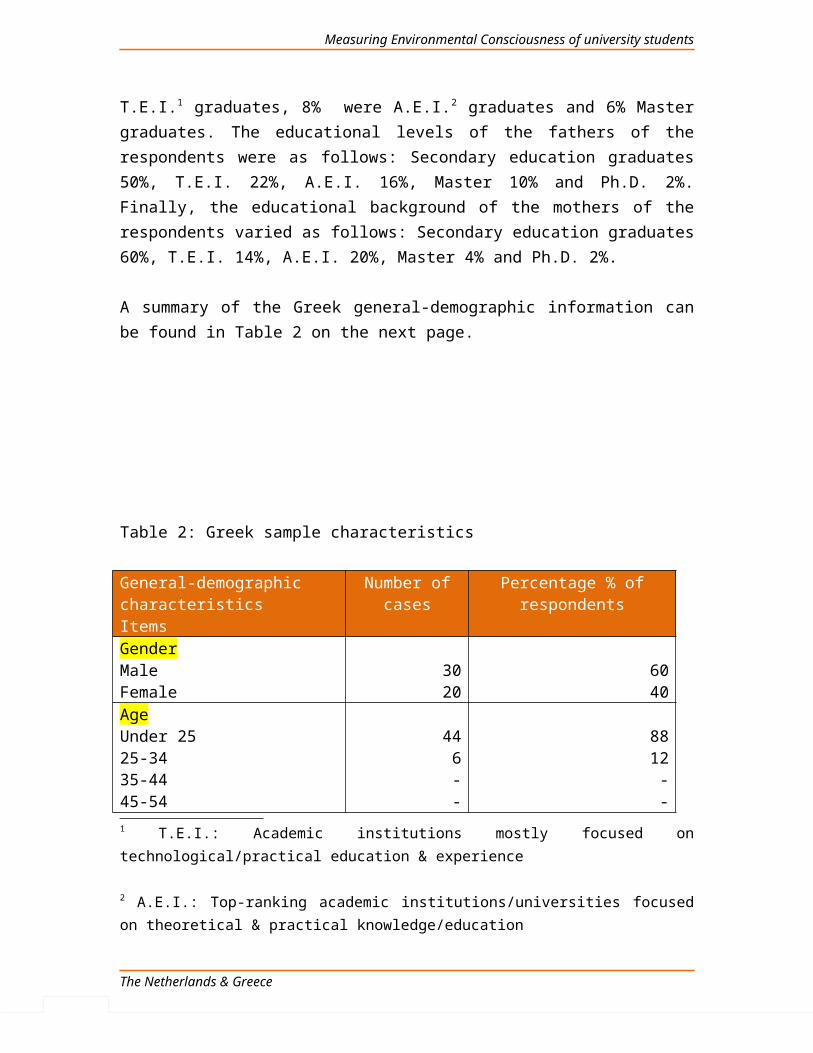
Measuring Environmental Consciousness of university students
factors were included as independent variables, as well as all the demographic variables. The value of R2 was .469, which means that the percentage of variance in the outcome accounted for by the predictors was 46.9%. According to the ANOVA, the value of the F-ratio was 5.684, which was significant (p < .001). Therefore, the regression model was significantly better at predicting the outcome, than using the mean as a ‘best guess’. Next, the estimated b-values indicated positive and negative relationships between the predictors and the outcome. Specifically, all attitudinal predictors had positive b-values indicating positive relationships. The b-values for attitudinal factors 1 & 2 were significant, (p < .05). Thus, these predictors were significant predictors of PURB. The predictor GENDER also had a significant b-value and therefore it made a significant contribution to the model.
Greek sampleThe second regression analysis of Part 3 was based on the data from the Greek respondents only. According to the SPSS output, the R2 was .458, which means that the predictors accounted for 45.8% of the variation in PURB. Furthermore, the F-ratio for this model was 3.282, according to the ANOVA. This F value was significant (p = .005 < .05 and therefore, the regression model overall predicted PURB significantly well. Last but not least, the estimated b-values indicated positive, as well as negative relationships between the predictors and the outcome. The attitudinal predictors (factors) had positive b-values and therefore positive relationships with the outcome. Moreover, the b-values of the attitudinal factors 1 & 2 were highly significant (p < .001), and thus they were both significant predictors of PURB. Regarding the rest of the predictors, only predictor GENDER had a significant b-value and thus it was also a significant predictor of the outcome.
Dutch sampleThe last regression analysis of part 3 was conducted according to data from the Dutch respondents of our survey. The SPSS output estimated the value of R2 being .680. This value means that the predictors of the model could explain 68% of the variance in the outcome, which was a large amount of variance explained. In addition, the value of F was 3.067 and significant ( p = .033 < .05). Thus, the regression model was a significant fit of the data overall. Finally, the estimated b-values indicated positive, as well as negative relationships between the predictors and the outcome. The Attitudes predictors (factors) had positive b-values, but these values were not significant (p > .05 for all these values). Thus, the Attitudes predictors were not significant predictors of PURB. Moreover, none of the demographic variables was a significant predictor of the outcome.
According to the preceding analyses, Hypothesis H4c should be accepted for the Greek sample and for the samples combined, but it should be rejected for the Dutch sample. The
The Netherlands & Greece
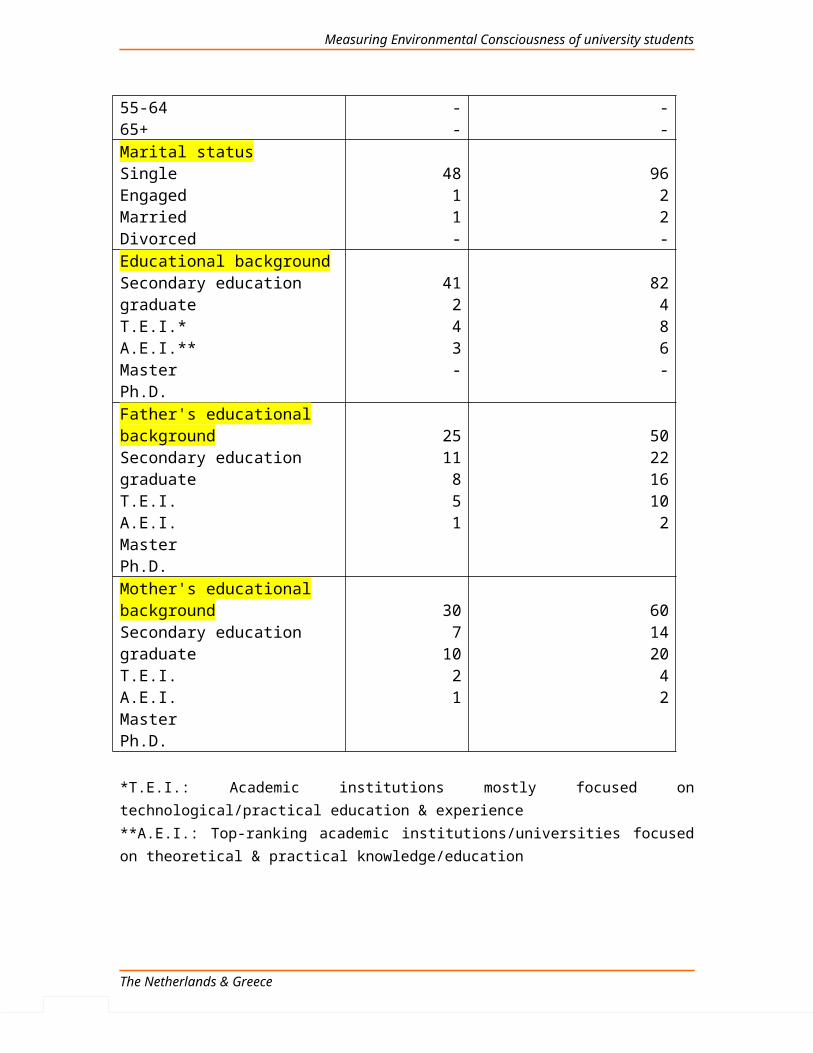
Measuring Environmental Consciousness of university students
SPSS outputs for the three regression analyses can be found in Appendix 5 (5.3.a, 5.3.b, 5.3.c respectively).
Chapter 5: Discussion and Conclusions
5.1 Discussion
The current study follows the path which many other researchers followed in the past and attempts to conceive the levels of environmental consciousness of Dutch and Greek academic students. The theoretical framework on which the present study sets its foundations is derived from the basic assumption that the environmental consciousness/concern domain should consist of three distinct components: 1) Knowledge about environmental issues 2) Attitudes toward the environment and its quality and 3) Environmentally-sensitive behavior (non-purchasing and purchasing) (Bohlen et. al, 1993). As in any cross-national study, between countries’ comparisons were necessary to indicate the differences between the respondents’ performance on the environmental measures and to draw conclusions about those differences. Another important aspect of this study is the investigation of the relationships between the dimensions of environmental consciousness and specifically, whether knowledge is a significant determinant of attitudes and whether attitudes are significant determinants of actual behavior regarding the environment and its protection.
Knowledge about environmental issues: Part of the 1st research question is relevant to the level of knowledge that the students perceive they possess about several, well-reported environmental issues. It was hypothesized that the Dutch students possess at least a moderate level of knowledge, which was confirmed from the data analysis. However, based on the literature review, a higher level of knowledge was expected by the Dutch students. Their average scores on all items indicate a low or moderate amount of knowledge and thus, a general lack of knowledge regarding serious environmental problems that the humanity faces nowadays. Similar findings are reported for the Greek students, that they exhibit a moderate level of knowledge, as was hypothesized. However,
The Netherlands & Greece
Measuring Environmental Consciousness of university students
the expectations for the Greek sample were not higher than the indicated results, since the literature has reported a general lack of information and environmental education among Greek citizens. Surprisingly though, Greek students appear to possess greater knowledge than the Dutch concerning most of the items in the scale and they achieve a slightly higher total average.
Attitudes about the environment: The second part of the 1st research question refers to attitudes toward the environment and its importance. As was hypothesized, Dutch students exhibit neutral to favorable attitudes about the environment, something that was anticipated, since previous studies have reported the general high concern of the Dutch publics regarding the local and global environmental deterioration. The same applies for the Greek students, that express even more positive attitudes toward the environment, in line with the previous studies on Greek population samples.
Environmentally-sensitive Behavior: The 2nd research question investigates the current or actual behavior of the two student groups in relation with the environment and its preservation. For the non-purchasing activities/actions, Dutch students achieve a low, close to moderate score, in contrast to the hypothesis that they would achieve at least a moderate level. Once again the findings come to a discrepancy with past research, which has shown high levels of participation, at least in recycling activity (specifically the Dutch show a high level of glass-recycling activity undertaken, but moderate or low levels for recycling other materials). As for purchasing behavior, Dutch students barely achieve a moderate level and they confirm the second part of our hypothesis. Greek students on the other hand, seem to behave in line with the previous literature and the hypothesized. They show on average a low (close to moderate) level of non-purchasing behavior, whereas their average purchasing behavior is considered moderate.
Cross-national comparisons: The 3rd research question refers to the differences between the two nationality samples from a statistical perspective. The purpose of the analysis that was conducted on the total averages scored by the two countries was to compare the general level of Dutch and Greek students regarding the environmental measures. The results indicate that, in general, Dutch and Greek students possess equal levels of perceived knowledge about environmental issues and they are equally active as regards their environmentally-friendly non-purchasing and purchasing activities. On the other hand, Greek students in general express significantly more positive attitudes toward the environment, compared to their Dutch counterparts. Differences between the means scored by the two nationality groups on the various items of the scales were also occurred, but were they statistically significant? For the items on the Knowledge scale the answer is no. The differences observed are all not significant according to the SPSS t-test for independent samples. In other words, the average knowledge on each specific environmental issue is similar for the Dutch and Greek students. For the attitudinal items
The Netherlands & Greece
Measuring Environmental Consciousness of university students
results are quite diverse. Although both groups express moderate to favorable attitudes toward the environment, there are significant differences between the groups regarding some of the items/statements on the scale. Suggestively, we can conclude that the Greeks place greater importance than the Dutch on the environment as a societal issue, they are more willing to pay substantial amounts in order to protect the environment and they value significantly more the environmental policies of the candidates when they decide how to vote. As for the Non-purchasing Behavior scale, for half of the items the differences are significant. The data analysis revealed that the Greeks are significantly more active in recycling plastics, lobbying M.P.s about green issues and writing articles to journals in favor of the environment. The Dutch on the other hand are significantly far ahead in glass-recycling activity. Finally, only two items on the Purchasing Behavior scale yielded significant differences. Particularly, Greek students appear significantly more reluctant to buy products from companies accused of being polluters and they buy ‘green’ detergents significantly more often than their Dutch counterparts.
Relationships: The 4th and last research question seeks to identify the existence and nature of the relationships between the environmental dimensions/measures. The results of the analyses do not indicate causal relationships in each case. More specifically, from the three regression analyses conducted in order to check whether the knowledge variables/factors had an influence on the attitude variable we came up with the following observations: 1) Knowledge has a significant positive effect on attitudes when data comes from both nationality samples 2) Knowledge has a significant positive effect on attitudes when data comes from the Greek sample 3) Knowledge has no significant effect on attitudes when data comes from the Dutch sample. In the Greek case, this outcome basically means that more knowledgeable students will be better environmental exponents, with greater concern for the environmental issue. The same conclusion applies for the two samples combined. In addition, the variable GENDER also appears to play a significant role in determining environmental attitudes of Greek students. The observed significant positive relationship means that Greek female respondents are more concerned about the environment and its quality. On the other hand, environmental knowledge levels of Dutch students are not significantly related to their attitudes toward the environment. However, it seems that paternal level of education (FATHER’S EDUC.) has a significant impact on the students’ attitudes. In other words, higher educated Dutch fathers influence positively the environmental attitudes of their children. Next, from the three regression analyses conducted in order to check whether the attitude variables had an influence on the NPURB variable, we came up with the following observations: 1) Attitude has a significant positive effect on NPURB, when data comes from both nationality samples 2) Attitude has a significant positive effect on NPURB, when data comes from the Greek sample 3) Attitude has no significant effect on NPURB when data comes from the Dutch sample. Greek students with more positive environmental attitudes are more likely to participate in green activities i.e. recycling activities and political
The Netherlands & Greece
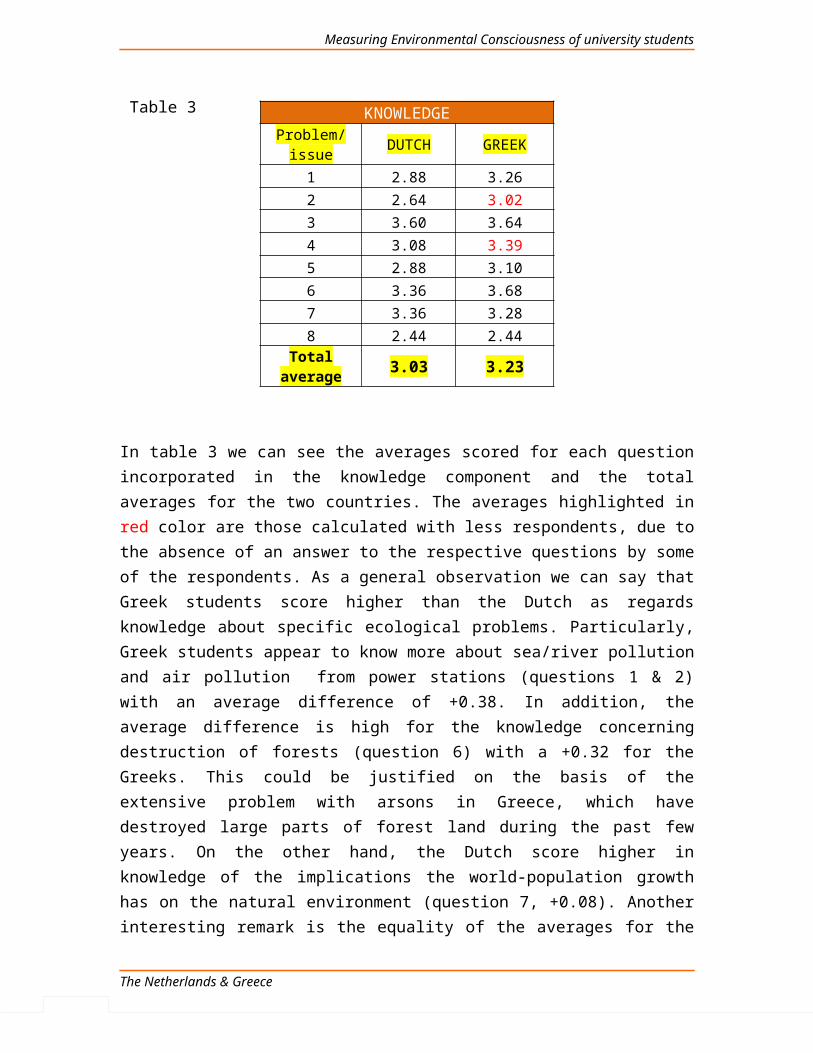
Measuring Environmental Consciousness of university students
action/other actions undertaken. The same applies for the groups combined. That was not the case for Dutch students. Although a positive relationship was observed, it was not significant, meaning that more positive attitudes toward the environment do not necessarily indicate greater participation in green activities. Finally, from the three regression analyses conducted in order to check whether the attitude variables had an influence on the PURB variable, we came up with the following observations: 1) Attitude has a significant positive effect on PURB, when data comes from both nationality samples 2) Attitude has a significant positive effect on PURB, when data comes from the Greek sample 3) Attitude has no significant effect on PURB when data comes from the Dutch sample. Therefore we conclude that more favorable environmental attitudes of Greek students lead to more green purchasing-behavioral patterns. Furthermore, Greek male students are more likely to participate in green purchasing activities than their female counterparts, according to the observed significant negative relationship between gender and purchasing behavior. When the groups are combined, the effects of attitudes and gender on purchasing behavior follow the same pattern as for the Greek sample alone. Attitudes have no significant impact on the Dutch students’ green purchasing behavior. It should be mentioned at this point that the absence of more significant results regarding the analyses conducted on the Dutch sample could be driven both by absence of the effects investigated, as well as by the lack of a sample large enough to yield enough evidence for the effects. The relatively small Dutch sample could also be an explanation of why models with high R2 values (e.g. section 4.4.2., Dutch sample) are not significant. It is also worth mentioning here that the findings regarding the associations between socio-demographic variables and environmental consciousness suggest the generally weak explanatory power of those variables. In the Greek case, only GENDER is appeared to have a significant impact on environmental attitudes and purchasing behavior, whilst for the Dutch case, students with more educated fathers seem to be more environmentally concerned. Age, Marital status, Education and Mother’s education variables are found to be of no significant importance in determining attitudes and behavior of the two samples.
5.2 Theoretical and Managerial Implications
For the current study, established measures from the founded literature were exploited in order to gain information on the environmental consciousness level of Greek and Dutch academic students. The results and conclusions reported, could help Greek and Dutch researchers interested in the topic to acquire information on the extent of perceived knowledge students from their countries possess about the factors that threaten the natural environment nowadays. Moreover, evidence becomes available about the concerns and beliefs of the students toward the environment, as well as how they actually behave in order to contribute to environmental preservation. The findings regarding the causal relationships between the theoretical dimensions of environmental consciousness and the
The Netherlands & Greece
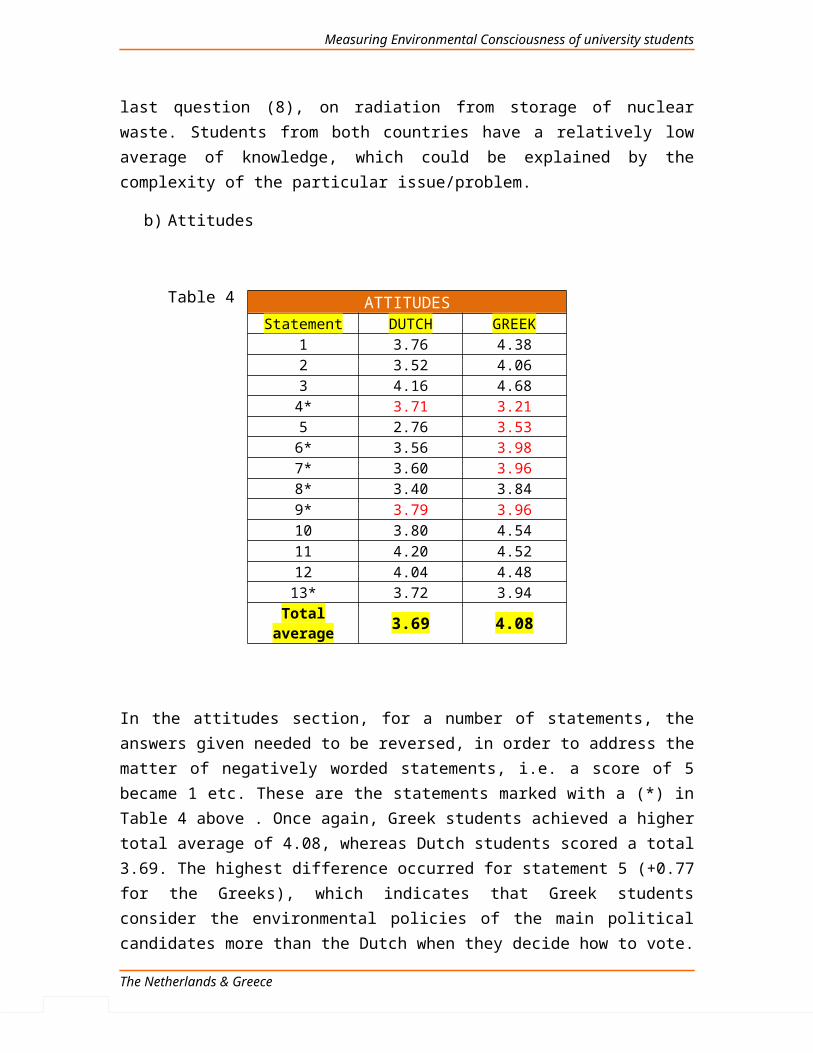
Measuring Environmental Consciousness of university students
role of socio-demographic variables in predicting attitudes and behavior could also serve as a guideline for the researchers, who desire to understand the factors that shape positive environmental attitudes and contribute to higher participation in green activities. Specifically for the Greek students, modifications in the educational materials and practices could be effective toward the reinforcement of environmental knowledge, which has proven to be of a moderate level. The positive relationships observed in the context of this study provide evidence that more knowledgeable Greek students will exhibit more positive environmental attitudes, and more positive environmental attitudes will lead to higher levels of environmentally-conscious behavior. In the Dutch case the moderate level of knowledge could also be a reason for amplification of the environmental knowledge provided by educational institutions. Although the observed impact of knowledge on attitudes was of little importance, it has been argued that individuals require an understanding of the consequences of their behavior, in order to shape a ‘greener’ personality (Bohlen et al., 1993).For managers and public policy officials, the findings of the present study could be useful for various reasons. Within the Greek context, managers of non-profit environmental organizations should place efforts on stimulating attitudes and beliefs of students in favor of the environment, since students that are more environmentally concerned are more likely to participate in recycling activities and join environmental pressure groups. The same applies for marketers that aim to launch new, eco-friendly products and services or promote older ones. Reinforcement of environmental concern through advertising campaigns is likely to lead to greater adoption of the green products associated. Furthermore, despite the fact that – from a managerial perspective – there is limited utility in the use of socio-demographic characteristics for profiling environmentally conscious students in the two countries, it is evidenced that both male and female Greek students are appealing target groups for marketers, since females show a higher level of environmental concern, whereas males exhibit a more frequent environmentally-friendly behavior as regards their purchasing habits. For the Dutch students, managers and marketers are advised to develop strategies capable to influence non-purchasing and purchasing environmental activity independently, since attempts to stimulate environmental attitudes will not have a significant effect on behavior at the same time. Marketers of Dutch companies who seek markets for products made of recycled-paper could find fertile ground on the student segment, while for plastic cutlery products and soft drinks in non-returnable containers marketers should not invest large advertising budgets.
5.3 Directions for Future Research
In the present study, two independent samples were collected from academic students’ populations in Greece and The Netherlands. Although the samples are taken from countries with very different cultural, social and industrial backgrounds, the relatively
The Netherlands & Greece
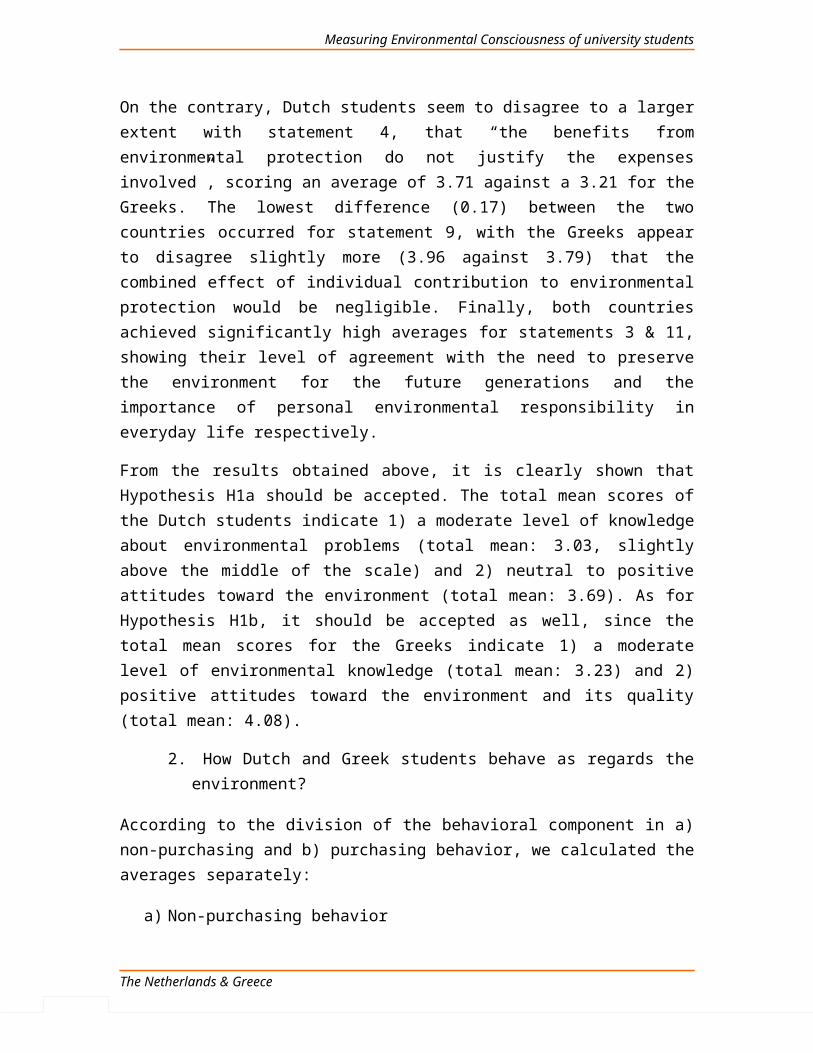
Measuring Environmental Consciousness of university students
small size of the samples is unlikely to allow generalization of the findings across the two nations or as established differences between Northern (e.g. The Netherlands) and Mediterranean European (e.g. Greece) nations. Researchers who are interested in generalizing their findings of environmental consciousness nationwide and between European areas/regions, they should include larger samples of students in their cross-national surveys and – in the case of between - region comparisons – to collect data from more than one countries situated in the same region. It should be mentioned here that the data for this study were collected from students participating mainly in Economics and Business related studying programmes. Therefore, the samples are mostly samples of convenience. The randomization of students was not really feasible, considering the population that was readily accessible by the researcher. For this reason, future research studies should involve students from other scientific fields/programmes as well, in order to identify potential associations between the study field and environmental consciousness of students. However, the current findings could be characterized as representative of the environmental consciousness of students studying in Economics and Business fields. Another interesting direction for further research could be the investigation of the direct effect of environmental knowledge on behavior, which was not a part of the present study’s objectives.
5.4 Conclusion
The main purpose of the current study is to contribute to the important topic of environmental consciousness, by gathering, analyzing and interpreting data from tertiary education student samples originating from two different European countries. Despite the relatively small size of the samples, the established theoretical and conceptual framework utilized here was of great usefulness in order to draw conclusions regarding the levels of environmental knowledge, attitudes and behavior of Greek and Dutch students mainly participating in Economic and Business related studies. Potential theoretical and managerial implications were mentioned and directions were given for researchers, who might wish to use the present study as a source of methodology and information in order to further study the environmental consciousness levels of the academic student segment.
The Netherlands & Greece
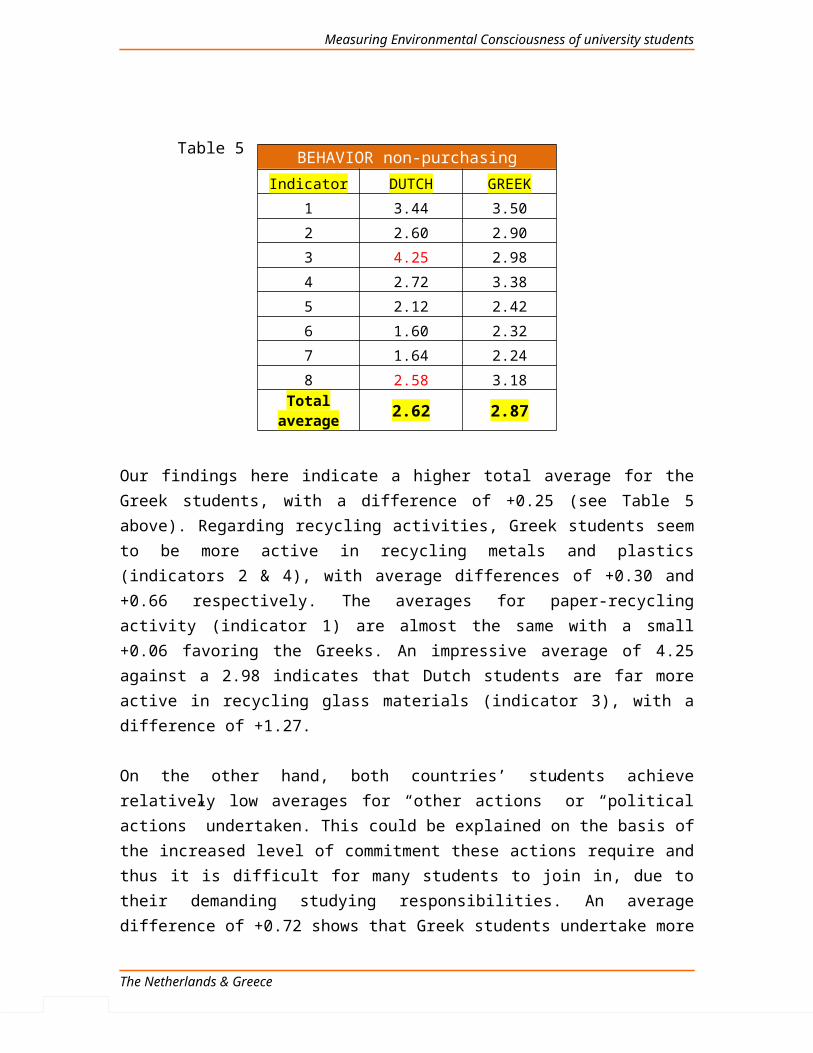
Measuring Environmental Consciousness of university students
The Other Coast, by Adrian Raeside. Source: http://www.gocomics.com/?ref=comics
The Netherlands & Greece
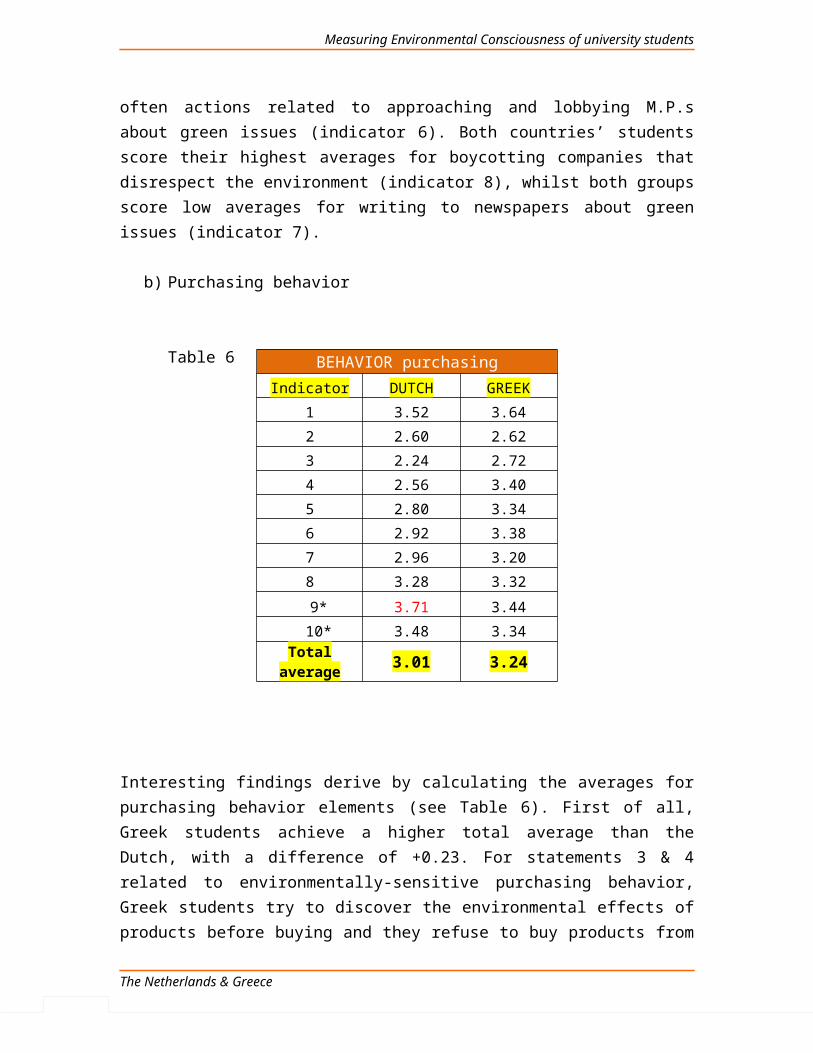
Measuring Environmental Consciousness of university students
LIST OF REFERENCES
Ajzen, I., Fishbein, M. (1980). Understanding Attitudes and Predicting Social Behavior. New York, Prentice Hall.
Ajzen, I. (1988). Attitudes, Personality, and Behavior. Chicago, IL, Dorsey Press.
Altenburg, J., Balderjahn, I., Buchholz, P. & deVries, W. (1996). Bestimmungsgrunde des Abfallverhaltens privater Haushalte: Ein internationaler Vergleich zwischen den Stadten Leipzig und Amsterdam. Jahrb Absatz Verbrauchsforschung, 3, 282 – 302.
Arcury, T. A. (1990). Environmental Attitude and Environmental Knowledge. Human Organization, 49(4), pp. 300–304.
Benton, R. & Funkhouser, G. R. (1994). Environmental attitudes and knowledge: an international comparison among business students. Journal of Managerial Issues, 6(3), pp. 366-81.
Bhate, S. (2002). One world, one environment, one vision: Are we close to achieving this? An exploratory study of consumer environmental behaviour across three countries. Journal of Consumer Behavior, 2(2), pp. 169.
Bloom, D. E. (1995). International Public Opinion on the Environment. Science, New Series, Vol. 269, No. 5222 (Jul. 21, 1995), pp. 354-358.
Blum, A. (1987). Students’ knowledge and beliefs concerning environmental issues in four countries. Journal of Environmental Education, 18, pp. 7–13.
The Netherlands & Greece
Measuring Environmental Consciousness of university students
Bohlen, G. M., Schlegelmilch B. B. & Diamantopoulos A. (1993). Measuring ecological concern: a multi-construct perspective. Journal of Marketing Management, 10(4), pp. 415– 30.
Brooker, G. (1976). The self-actualizing socially conscious consumer. Journal of Consumer Research, 3(2), pp. 107-12.
Bruhn, M. (1978). "Das soziale Bewusstsein von Konsumenten., Erklaerungsansaetze und Ergebnisse einer empirischen Untersuchung in Deutschland" ("The Social Awareness of Consumers. Explanation Attempts and Results of an Empirical Study in Germany"), Doctoral thesis. University of Muenster.
Buttel, F. H. (1979). Age and environmental concern: a multivariate analysis. Youth & Society, 10(3), pp. 237-56.
Charter M., Peattie, K. (1992). Green Marketing, Chapter 28.
Cohen, M. J. (2000). 'Ecological modernization, environmental knowledge and national character: A preliminary analysis of the Netherlands', Environmental Politics, 9(1), pp. 77-106.
Corral-Verdugo, V. & Armendariz., L.I. (2000). The ‘New environmental paradigm’ in aMexican community. Journal of Environmental Education, 31, pp. 25–31.
DeChano, L. M. (2006). 'A Multi-Country Examination of the Relationship Between Environmental Knowledge and Attitudes', International Research in Geographical and Environmental Education, 15(1), pp. 15-28.
Diamantopoulos, A., Schlegelmilch, B. B., Sinkovics, R. R. & Bohlen, G. M. (2003). Can socio-demographics still play a role in profiling green consumers? A review of the evidence and an empirical investigation. Journal of Business Research, 56, pp. 465–480.
Diekmann, A. & Franzen, A. (1999). ‘‘The Wealth of Nations and Environmental Concern.’’ Environment and Behavior, 31, pp. 540–49.
Dunlap, R. E. & Scarce, R. (1991). The Polls-Poll trends: Environmental problems and protection. The public opinion quarterly, 55, pp. 651-672.
Dunlap, R. E. (1991a). "Public Opinion on the Environment in the Eighties: A Decade of Growing Concern." Environment, 33, pp. 10-15, 32-37.-. 1991b. "Trends in Public Opinion toward Environmental Issues: 1965 to 1990." Society and Natural Resources, 4, pp. 285-312.
Dunlap, R. E., Gallup G. H. & Gallup, A. M.. (1993). ‘‘Of Global Concern: Results of the Health of the Planet Survey.’’ Environment, 35, pp. 7–15, 33–39.
Eagly, A. H. & Chaiken, S. (1993). The psychology of attitudes. Orlando, FL, US: Harcourt Brace Jovanovich College Publishers.
The Netherlands & Greece
Measuring Environmental Consciousness of university students
Ewert, A. & Baker, D. (2001). Standing for where you sit: An exploratory analysis of the relationship between academic major and environment beliefs. Environment and Behavior, 33, pp. 687–707.
Ferber, R. (1977). Research by convenience. Journal of Consumer Research, 1, pp. 57-58.
Fishbein, M. & Raven, B. H. (1962). The AB Scales : An Operational Definition of Belief and Attitude. Human Relations, 15, p. 35.
Fishbein, M., & Ajzen, I., (1975). Belief, Attitude, Intention, and Behavior: An Introduction to Theory and Research. Reading, MA: Addison-Wesley Pub. Co.
Franzen, A. (2003). Environmental Attitudes in International Comparison: An Analysis of the ISSP Surveys 1993 and 2000. Social Science Quarterly, 84(2).
Furman, A. (1998). A note on environmental concern in a developing country: Results from an Istanbul survey. Environment and Behavior, 30(4), pp. 520-34.
Gerlach, L. P. (2001). Chapter 9: The structure of social movements: Environmental activism and its opponents - Networks and netwars: The future of terror, crime and militancy.
Gill, J. D., Crosby, L. A. & Taylor, J. R. (1986). Ecological concern, attitudes, and social norms in voting behavior. Public Opinion Quarterly, 50(4), pp. 537 –54.
Harris, Louis & Associates, Inc. (1989), Public and Leadership Attitudes to the Environment in Four Continents: A Report of a Survey in 16 Countries, New York: Louis Harris & Associates, Inc.
Harrison, C. M., Burgess, J. & Filius, P. (1996). Rationalizing environmental responsibilities: A comparison of lay publics in the UK and the Netherlands. Global Environmental Change, 6(3), pp. 215-234.
Hausbeck, K.W., Milbrath, L.W. & Enright, S.M. (1992). Environmental knowledge, awareness and concern among 11th-grade students: New York State. Journal of Environmental Education 24, pp. 27–34
Hilpinen, R. (1970). Knowing that one knows and the classical definition of knowledge . Synthese (Dordrecht), 21(2), p. 109.
Hines, J.M., Hungerford, H.R. & Tomera, A.N. (1986–87). Analysis and synthesis of research on responsible pro-environmental behavior: a meta-analysis, The Journal of Environmental Education, 18(2), pp. 1–8.
Hofrichter, J. (1992). "Umweltbewusstein/Umwefcerhalten" ("Environmental Awareness/Environmental Behaviour"). In: Umwelt Handwoerterbuch ("Environmental Handbook"), (Ed) Dreyhaupt, F. J. Berlin, Walhalla.
The Netherlands & Greece
Measuring Environmental Consciousness of university students
Karameris, A., Ragkou, P. & Kastani, L. (2006). “Exploring the environmental knowledge and attitudes of the students in the School of Forestry and National Environment at the Aristotle University of Thessaloniki” (poster presentation in the International Conference on Sustainable Management and Development of Mountainous and Island Areas, 29th September - 1st October 2006, Island of Naxos, Greece).
Karamichas, J. (2003). “Civil Society and the Environmental Problematic in Southern Europe. A Preliminary Investigation of the Greek and Spanish Cases” (paper prepared for presentation at ECPR joint sessions, Edinburgh 28th March-3rdApril 2003).
Kilbourne, W. E., Beckmann S. C., van Dam, Y. & Pardo, M. (1998). Anthropocentrism, value systems, and environmental attitudes: A multi-national comparison. In 27th Annual European Marketing Academy Conference, eds., P. Andersson, 450-57. Stockholm, Sweden: European Marketing Academy.
Kilbourne, W. E., Beckmann, S. C. & Thelen, E. (2002). The role of the dominant social paradigm in environmental attitudes: A multi-national examination. Journal of Business Research, 55, pp. 193-204.
Kuhlemeier, H., Bergh, H. V. D. & Lagerweij, N. (1999). 'Environmental Knowledge, Attitudes, and Behavior in Dutch Secondary Education', The Journal of Environmental Education, 30(2), pp. 4-14.
Laroche, M., Bergeron, J. & Barbaro-Forleo, G. (2001). Targeting consumers who are willing to pay more for environmentally friendly products. Journal of Consumer Marketing, 18(6), pp. 503-520.
Lee, C. & Green, R. T. (1991). Cross-cultural examination of the Fishbein behavioral intentions model. Journal of International Business Studies, 22(2), pp. 289–305.
Macri, D. & Mullet, E. (2007). 'Cross-National Validation of an Eight-Factor Model of Societal Risk Perception', Human and Ecological Risk Assessment: An International Journal, 13(6), pp. 1352-1358.
Manolas, E. I., Tampakis, S. A. & Karanikola, P. P. (2010). 'Climate change: the views of forestry students in a Greek university', International Journal of Environmental Studies, 67(4), pp. 599-609.
Milbrath, L. W. (1984). Environmentalists: Vanguard for a new society. Albany, NY: State University of New York Press.
Mitchell, R. C. (1990). "Public Opinion and the Green Lobby: Poised for the 1990s?" In Environmental Policy in the 1990s: Toward a New Agenda, ed. N. J. Vig and M. E. Kraft. Washington, DC: CQ Press.
Mullet, E., Lazreg, C., Cereza, C. & Neto, F. (2005). The Scandinavian way of perceiving societal risks. Journal of Risk Research, 8(1), pp. 19–30.
Murphy, P. E., Kangun, N. & Locander, W. B. (1978). Environmentally concerned consumers – racial variations. The Journal of Marketing, 42(4), pp. 61-66.
The Netherlands & Greece
Measuring Environmental Consciousness of university students
Nonaka, I. & Takeuchi, H. (1995). The knowledge-creating company: How Japanese companies create the dynamics of innovation. New York, NY: Oxford University Press.
Organisation for Economic Cooperation and Development (1995). Environmental Performance Review: The Netherlands, Paris: OECD.
Ramsey, C.E. & Rickson, R.E. (1976). Environmental knowledge and attitudes. Journal of Environmental Education, 8, pp. 10–18.
Roozen, I. T. M. & De Pelsmacker, P. (1998). Attributes of environmentally friendly consumer behavior. Journal of International Consumer Marketing, 10(3), pp. 21 –41.
Rosenblueth, A., Wiener, N. & Bigelow J. (1943). Behavior, Purpose and Teleology. Philosophy of Science, 10(1), pp. 18-24.
Roth, R.E. & Perez, J. (1989). Twelfth grade student knowledge and attitudes toward the environment in the Dominican Republic: An assessment. Journal of Environmental Education, 20, pp. 10–14.
Rothschild, M. L. (1979). Marketing communications in non-business situations or why it’s so hard to sell brotherhood like soap. Journal of Marketing, 43(2), pp. 11 –20.
Schultz, P. W. & Oskamp, S. (1996). Effort as a Moderator of the Attitude-Behavior Relationship: General Environmental Concern and Recycling. Social Psychology Quarterly, 59(4), pp. 375-383
Schuster, R. (1992). Umweltorientiertes Konsumentenverhalten in Europa (Environmentally Oriented Consumer Behavior in Europe), Hamburg: Verlag Dr Kovac.
Sriram, V. & Forman, A. M. (1993). The relative importance of products' environmental attributes: A cross-cultural comparison. International Marketing Review, 10(3), pp. 51-70.
Tampakis, S., Tsantopoulos, G. & Karanikola, P. (2007). “Bulding environmental awareness: The case of forestry students in a Greek University” (paper presented at the 1st European Conference on Education for Sustainable Development “Higher Education and the Challenge of Sustainability: Problems, Promises and Good Practice”, Orestiada Soufli, Prefecture of Evros, Greece, 5 - 7 October 2007.
Tsoukas, H. & Vladimirou, E. (2001). What is organizational knowledge? Journal of management studies, 38(7), pp. 973-993.
Van Liere, K. D. & Dunlap, R. E. (1981). Environmental concern: Does it make a difference how it’s measured? Environment and Behavior, 13, pp. 651-676.
Web sites
www.issp.org
http://ec.europa.eu/public_opinion/index_en.htm
The Netherlands & Greece
Measuring Environmental Consciousness of university students
www.thesistools.com
Books
Μεθοδολογία εκπαιδευτικής Έρευνας (Methodology of Educational Research), Papanastasiou, K. (1996). Nicosia: Theopress LTD.
Discovering Statistics using SPSS. Field, A. (2009). 3rd Edition, Sage Publications Ltd.
.
APPENDICES
The Netherlands & Greece
Measuring Environmental Consciousness of university students
.
.
Appendix 1. Final Draft Questionnaire
Measuring Environmental Consciousness
The following questionnaire is an attempt to capture the respondents' environmental consciousness/concern. Given the extensive publicity of topics related to the natural environment nowadays, this questionnaire is part of a survey which aims at investigating the environmental consciousness/concern levels of university students. The questionnaire consists of four (4) sections, which measure individuals’: (1) perceived knowledge about “green” issues, (2) attitudes toward the environment and (3) levels of environmentally-sensitive behavior (non-purchasing and purchasing). The first section contains the necessary questions regarding the personal characteristics of the respondents. Please notice that there are no correct and wrong answers. Each of you may answer the questions freely, according to his/her own knowledge, perceptions and behavior. I would like to thank you in advance for your willingness and cooperation.
Section 1: Socio-demographic characteristics Please fill in your personal details by placing an “x” into the appropriate boxes below:
The Netherlands & Greece
Measuring Environmental Consciousness of university students
1.Gender Male
Female
2.Marital status
3.Age
4.Education*
The Netherlands & Greece
Single
Engaged
Married
Divorced
Under 25
25-34
35-44
45-54
55-64
65+
Secondary education graduate
HBO
WO
Master
Ph.D.
Measuring Environmental Consciousness of university students
5.Education of parents *
* For the Greek part of the survey the educational levels were converted according to the respective ones in Greece.
Section 2: Knowledge about specific environmental problems
In this section we aim to investigate the level of your knowledge regarding specific and well-reported environmental problems/issues. Answers are given in a 5-point scale, where 1 means ‘I know nothing about’ and 5 means ‘I know a great deal about’ .Please indicate your level of knowledge about each of the following problems, by placing an “x” into the appropriate boxes below:
Environmental problems/issues
1 I know
nothing about
2 3 4
5I know a
great deal about
1) Sea/river pollution2) Air pollution from power
stations3) Climate change (e.g. Global
warming)4) Ozone layer depletion
5) Pollution of drinking water
6) Destruction of forests
The Netherlands & Greece
FATHER
Secondary education graduate
HBO
WO
Master
Ph.D.
MOTHER
Secondary education graduate
HBO
WO
Master
Ph.D.
Measuring Environmental Consciousness of university students
7) World population growth
8) Radiation from storage of nuclear waste
Section 3: Attitudes about the environmentIn this section we investigate your attitudes and beliefs toward the natural environment in general and factors related to it. Answers are given in a 5-point scale, where 1 means ‘strongly disagree’ and 5 means ‘strongly agree’.
Attitudes about the environment (statements)
1
Strongly disagree
2 3 4
5
Strongly agree
1) The environment is one of the most important issues facing society today
2) A substantial amount of money should be devoted to environmental protection
3) Unless each of us recognizes the need to protect the environment, future generations will suffer the consequences
4) The benefits of protecting the environment do not justify the expense involved
5) The environmental policies of the main political parties are one issue I consider when deciding how to vote
The Netherlands & Greece
Measuring Environmental Consciousness of university students
6) Green issues should not be a main consideration when deciding what we do in the future
7) Personally, I cannot help to slow down environmental destruction
8) The importance of the environment is frequently exaggerated
9) Even if each of us contributed towards environmental protection, the combined effect would be negligible
10) The government should take responsibility for environmental protection
11) Everyone is personally responsible for protecting the environment in their everyday life
12) If all of us, individually, made a contribution to environmental protection, it would have a significant effect.
13) Firms should always put profitability before environmental protection
Please indicate your level of agreement with the following statements, by placing an “x” into the appropriate boxes:
Section 4a: Environmentally-sensitive non-purchasing behavior
In this section, which consists of two parts, we investigate your non-purchasing behavior as regards the environment .Answers are given in a 5-point scale, where 1 means ‘would never do’ and 5 means ‘I do often’.For part (1), please indicate the frequency by which you engage in the following recycling activities, by placing an “x” into the appropriate boxes.For part (2), please indicate the frequency by which you engage in the described political action/other actions, by placing an “x” into the appropriate boxes:
Non-purchasing behavior
1 Would never
do
2 3 45
I do often
(1) Recycling activities
1. Recycling paper
2. Recycling metals
The Netherlands & Greece
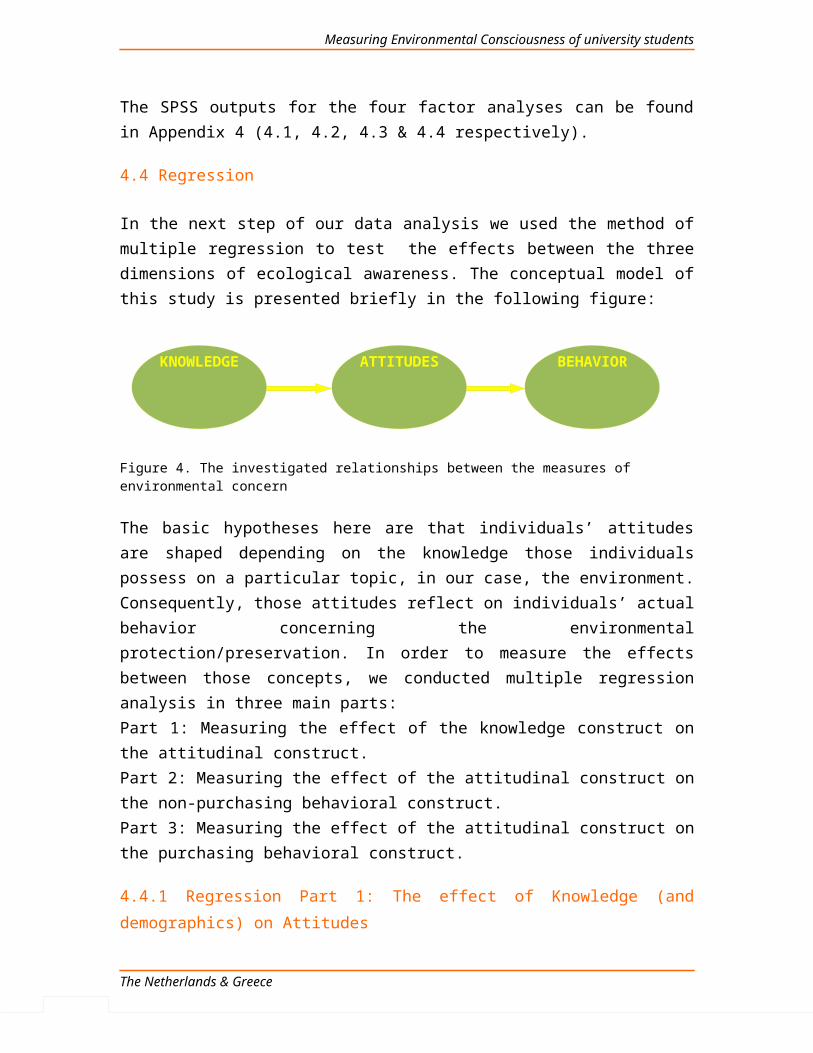
Measuring Environmental Consciousness of university students
3. Recycling glass
4. Recycling plastics
(2)Political action/other actions
1. Supporting environmental pressure groups/organizations
2. Lobbying M.P.s* about green issues
3. Writing to newspapers about green issues
4. Boycotting companies that are not environmentally responsible
* M.P. = Member of the Parliament
Section 4b: Environmentally-sensitive purchasing behaviorIn this last section, which consists of two parts, we investigate your purchasing behavior as regards the environment .Answers are given in a 5-point scale, where 1 means ‘never’ and 5 means ‘always’.For part (1), please indicate how often you behave similarly as described in the following four statements of general purchasing behavior, by placing an “x” into the appropriate boxes.For part (2), please indicate how often you purchase products from the six categories described in the list, by placing an “x” into the appropriate boxes:
Purchasing behavior1
Never2 3 4
5 Always
(1) General purchasing behavior
1. I choose the environmentally-friendly alternative if one of a similar price is available
2. I choose the environmentally-friendly alternative regardless of price
3. I try to discover the environmental effects of products prior to purchase
4. I refuse to buy products from
The Netherlands & Greece
Measuring Environmental Consciousness of university students
companies accused of being polluters
(2) List of environmentally friendly/harmful product categories
1. Environmentally-friendly detergents
2. Products not tested on animals
3. Organically grown fruit and vegetables
4. Recycled paper products
5. Plastic knives, forks or spoons or plates
6. Refreshments etc. in nonreturnable containers
THANK YOU VERY MUCH FOR YOUR COOPERATION!
The Netherlands & Greece
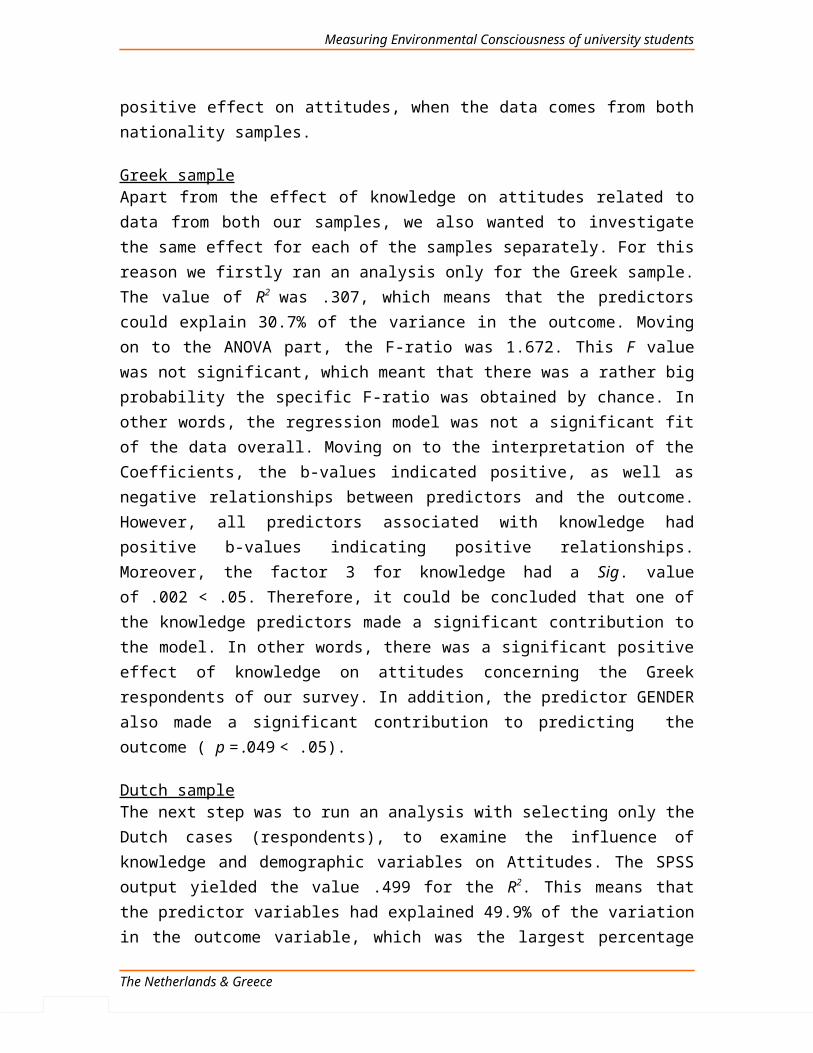
Measuring Environmental Consciousness of university students
The Netherlands & Greece
Appendix 2. Group statistics
Group Statistics
NATIONALITYN Mean
Std.
Deviation
Std. Error
Mean
GENDER Greek 50 1,40 ,495 ,070
Dutch 25 1,36 ,490 ,098
AGE Greek 50 1,12 ,328 ,046
Dutch 25 1,48 ,586 ,117
MARITAL STATUS Greek 50 1,06 ,314 ,044
Dutch 25 1,12 ,332 ,066
EDUCATION Greek 50 1,38 ,878 ,124
Dutch 25 3,36 ,952 ,190
FATHER'S EDUC. Greek 50 1,92 1,122 ,159
Dutch 25 2,00 1,000 ,200
MOTHER'S EDUC. Greek 50 1,74 1,046 ,148
Dutch 25 1,76 1,052 ,210
Sea/river pollution Greek 50 3,26 ,965 ,136
Dutch 25 2,88 1,013 ,203
Air pollution from power stations Greek 48 3,02 ,956 ,138
Dutch 25 2,64 1,114 ,223
Climate change (e.g. Global warming) Greek 50 3,64 1,102 ,156
Dutch 25 3,60 ,866 ,173
Ozone layer depletion Greek 49 3,39 1,037 ,148
Dutch 25 3,08 1,038 ,208
Pollution of drinking water Greek 50 3,10 1,015 ,144
Dutch 25 2,88 1,092 ,218
Destruction of forests Greek 50 3,68 ,999 ,141
Dutch 25 3,36 ,952 ,190
World population growth Greek 50 3,28 1,230 ,174
Dutch 25 3,36 ,995 ,199
Radiation from storage of nuclear waste Greek 50 2,44 1,013 ,143
Dutch 25 2,44 1,003 ,201
The environment is one of the most important issues facing
society today
Greek 50 4,38 ,667 ,094
Dutch 25 3,76 1,128 ,226
A substantial amount of money should be devoted to
environmental protection
Greek 50 4,06 ,793 ,112
Dutch 25 3,52 1,194 ,239
Unless each of us recognizes the need to protect the
environment, future generations will suffer the
consequences
Greek 50 4,68 ,551 ,078
Dutch 25 4,16 1,106 ,221
The benefits of protecting the environment do not justify Greek 48 3,21 1,071 ,155


![Primary Reviewer: - United States Environmental … · Web viewin catalog, supplier, % purity, and impurities of toxicological concern are identified appropriately.] [If the toxicological](https://img.pdfslide.us/doc/110x75/5af65a7a7f8b9a5b1e8f07cf/primary-reviewer-united-states-environmental-viewin-catalog-supplier-.jpg)