Embed Size (px)
Citation preview

2018-19 TRENDS

Prepared by:
Grace Sun Director of Institutional Research Office of Strategy and Institutional Effectiveness Morehouse School of Medicine 720 Westview Drive S.W. Atlanta, GA 30310 [email protected] (404) 756-8927
This fact book contains trend data that are frequently requested from the Director of Institutional
Research and/or reported externally to state, federal, and accrediting agencies. The fact book is intended
as a general source of information about Morehouse School of Medicine. This document includes the most
current information available for either an academic or fiscal year, as well as historical information.
If you are looking for any other institutional data, please contact the Office of Strategy and Institutional
Effectiveness using the information provided below.

1 | P a g e
Contents
About Morehouse School of Medicine ________________________________________________________ 2
Mission ________________________________________________________________________________________ 2
Vision _________________________________________________________________________________________ 2
Core Value _____________________________________________________________________________________ 2
Executive Leadership Team ________________________________________________________________________ 3
Academic Information _____________________________________________________________________ 3
Departments ___________________________________________________________________________________ 3
Degree Programs ________________________________________________________________________________ 3
Residency Training Programs ______________________________________________________________________ 4
Fellowship Programs _____________________________________________________________________________ 4
IPEDS1 General Information _______________________________________________________________________ 4
Enrollment Characteristics __________________________________________________________________ 5
Program Counts _________________________________________________________________________________ 5
Full-time and Part-Time Status (with FTE) ____________________________________________________________ 5
Sex Distribution _________________________________________________________________________________ 6
Race and Ethnic Background _______________________________________________________________________ 6
Program Enrollment by Sex and by Race/Ethnicity _____________________________________________________ 7
Age Distribution________________________________________________________________________________ 11
Program Persistence and Graduation by Admit Year __________________________________________________ 12
Graduation Characteristics ________________________________________________________________ 17
Graduates by Program __________________________________________________________________________ 17
Graduate by Program, by Sex, and by Race/Ethnicity Background ________________________________________ 17
Human Resources ________________________________________________________________________ 19
Faculty Profile (Based on Human Resource Data October 2019) _________________________________________ 19
Staff Profile (Based on IPEDS Human Resource Reports Fall 2018, Fall 2017, Fall 2016) _______________________ 22
Finance: Grants, Contracts, and Gifts (Based on IPEDS Financial Reports FY2018, FY2017, FY2016) _____________ 23
Physical Plant ___________________________________________________________________________ 26
Owned Facilities _______________________________________________________________________________ 26
Leased Facilities ________________________________________________________________________________ 26
Main Campus Map _____________________________________________________________________________ 28

2 | P a g e
About Morehouse School of Medicine
Founded in 1975, Morehouse School of Medicine (MSM) is among the nation's leading educators of primary care physicians and was
recognized by Annals of Internal Medicine in 2011 as the top institution in the first study of U.S. medical schools for our social
mission based on our production of primary care physicians, training of underrepresented minority doctors and placement of
doctors practicing in underserved communities. Our faculty and alumni are noted for excellence in teaching, research and public
policy, as well as exceptional patient care.
Morehouse School of Medicine is accredited by the Southern Association of Colleges and Schools Commission on Colleges to award
doctoral and master’s degrees. For more information, please visit www.msm.edu.
Mission We exist to:
• Improve the health and well-being of individuals and communities
• Increase the diversity of the health professional and scientific workforce
• Address primary health care through programs in education, research, and service
With emphasis on people of color and the underserved urban and rural populations in Georgia, the nation, and the world.
Vision The vision of MSM is “Leading the creation and advancement of health equity” through the following vision imperatives:
• Translating discovery into health equity
• Building bridges between health and healthcare
• Preparing future health learners and leaders
Core Values Excellence: Achieving the highest level of performance in all endeavors.
Service: Treating all people and communities with respect, compassion and empathy.
Knowledge: Sharing our ideas, discoveries, methods and skills to advance health equity.
Wisdom: Valuing the knowledge and experience of all individuals.
Integrity: Upholding the highest standards of ethical behavior, transparency and accountability.
Innovation: Creating inspired solutions in science, service, and education.

3 | P a g e
Executive Leadership Team Valerie Montgomery Rice, M.D.
President and Dean
Gregory Antoine, M.D. Sandra Harris Hooker, Ph.D.
Senior Associate Dean and Chief Medical Officer Vice President
Clinical Affairs Executive Vice Dean Academic Administration and Research
John Case, Ed.D. David Hefner, Ed.D.
Senior Vice President for Operations and Vice President
Chief Financial Officer Office of Strategy and Institutional Effectiveness
Daniel Dawes, J.D. Keith L. Henderson, J.D.
Executive Director Chief Compliance Officer
Government Relations, Policy and External Affairs
Michael Rambert, J.D.
Martha Elks, M.D., Ph.D. Corporate Secretary
Senior Associate Dean General Counsel
Educational Affairs
Taya Scott, Ed.D.
Bennie Harris, Ph.D. Chief Administrative Officer and Chief of Staff & Executive Director, Title III
Senior Vice President Office of the President and Dean
Institutional Advancement
Vacant
Chief Marketing Officer
Office of Marketing and Communication
Academic Information
Departments 1. Community Health and Preventive Medicine 8. Pathology and Anatomy
2. Family Medicine 9. Pediatrics
3. Medical Education 10. Pharmacology and Toxicology
4. Medicine 11. Physiology
5. Microbiology, Biochemistry and Immunology 12. Psychiatry and Behavioral Sciences
6. Neurobiology 13. Surgery
7. Obstetrics and Gynecology
Degree Programs Program Banner Code Common Code Degree
1. Doctor of Medicine ............................................................ MD........................................................... MD………………………………………Doctor of Medicine 2. Doctor of Philosophy in Biomedical Sciences .................. PHD-BMSC .............................................. PHD……………………………………..Doctor of Philosophy 3. Master of Science in Biomedical Research ...................... MS-BMRS ................................................ MSBR…………………………………..Master of Science 4. Master of Science in Biomedical Technology .................. MS-BMTC ................................................ MSBT…………………………………..Master of Science 5. Master of Science in Clinical Research ............................. MS-CLRS .................................................. MSCR…………………………………..Master of Science 6. Master of Science in Medical Sciences ............................ MS-MS .................................................... MSMS………………………………….Master of Science 7. Master of Science in Neuroscience .................................. MS-NESC ................................................. MSNS…………………………………..Master of Science 8. Master of Public Health ..................................................... MPH-PHEA .............................................. MPH…………………………………… Master of Public Health 9. Master of Science in Physician Assistant Studies ............ MS-PAS ................................................... MSPAS…………………………………Master of Science 10. Executive Master of Public Health………………………………..EMPH………………………………………………….EMPH………………………………….Exec Master of Public Health 11. Master of Science in Biotechnology………………………………MS-BT…………………………………………………MSBT…………………………………..Master of Science

4 | P a g e
Residency Training Programs 1. Family Medicine
2. Internal Medicine
3. Obstetrics and Gynecology
4. Pediatrics
5. Psychiatry and Behavioral Sciences
6. Public Health and General Preventive Medicine
7. Surgery
Fellowship Programs 1. Cardiovascular
2. Child and Adolescent Psychiatry
3. Pulmonary Disease and Critical Care Medicine
IPEDS1 General Information Name: Morehouse School of Medicine
Address: 720 Westview Dr. SW, Atlanta, Georgia 30310-1495
General information phone: (404) 752-1500
Website: www.msm.edu
Awards offered: Master’s degree
Doctor’s degree - research/scholarship
Doctor’s degree - professional practice
Campus setting: City: Large
Type: 4-year, Private not-for-profit
1 Integrated Post-secondary Education Data System collected by the National Center for Education Statistics (NCES). This is the primary federal entity for collecting
and analyzing data related to education in the U.S. and other nations. NCES is located within the U.S. Department of Education and the Institute of Education
Sciences. NCES fulfills a Congressional mandate to collect, collate, analyze, and report complete statistics on the condition of American education; conduct and
publish reports; and review and report on education activities internationally.

5 | P a g e
Enrollment Characteristics
Program Counts List of students registered as of October 15th of each fall term. Total counts are unduplicated, that is, the total number of students
within each program represents the actual headcount even though there are students enrolled in more than one program (e.g.
MSCR and PhD).
Fall 2015 Fall 2016 Fall 2017 Fall 2018 Fall 2019
Doctor of Medicine 293 324 362 377 400
Master of Public Health 54 46 48 51 47
MS in Medical Sciences 31 30 32 41 43
PhD in Biomedical Sciences 35 37 28 28 38
MS Physician Assistant Studies
20
Non-Degree Seeking 7 10 12 15 18
MS in Biomedical Research 10 12 8 3 10
Exec Master of Public Health
9
MS in Clinical Research 12 8 10 12 8
PhD/MSCR Biomedical/Clinical 8 5 10 9 8
MS in Neuroscience 2 1 4 3 5
MS in Biotechnology (Online)
4
MS in Biomedical Technology
1 1
Total Count 452 473 514 540 611
Full-time and Part-Time Status (with FTE) Data on time status (full time – FT; part time – PT) were not captured consistently prior to 2014 fall term. The number of full-time
equivalency (FTE) students is calculated based on fall student headcounts as reported on the IPEDS Enrollment component. The FTE
(headcount) of the part-time enrollment is estimated by multiplying 0.382059 times the part-time headcount; that is then added to
the full-time enrollment headcounts to obtain an FTE for all enrolled students. This formula is used to produce an FTE that is used
annually in the federal government publication, Digest of Education Statistics.
Fall 2015 Fall 2016 Fall 2017 Fall 2018 Fall 2019
FT PT FTE FT PT FTE FT PT FTE FT PT FTE FT PT FTE
Doctor of Medicine 292 1 292 318 6 320 355 7 358 374 3 375 392 8 395
MS in Medical Sciences 31 31 30 30 32 32 41 41 43 43
Master of Public Health 50 4 52 42 4 44 48 48 50 1 50 39 8 42
PhD in Biomedical Sciences 33 2 34 36 1 36 27 1 27 27 1 27 37 1 37
MS Physician Assistant Studies 20 20
MS in Biomedical Research 9 1 9 12 12 7 1 7 3 3 10 10
Exec Master of Public Health 9 9
MS in Clinical Research 12 12 8 8 10 10 10 2 11 7 1 7
PhD/MSCR Biomedical/Clinical 8 8 4 1 4 10 10 8 1 8 7 1 7
MS in Neuroscience 2 2 1 1 4 4 3 3 5 5
MS in Biotechnology (Online) 4 4
MS in Biomedical Technology 1 1 1 1
Non-Degree Seeking 7 3 10 4 12 5 15 6 18 7
Total 437 15 443 451 22 459 493 21 501 517 23 526 574 37 588

6 | P a g e
Sex Distribution Sex is a student self-reported characteristic. Stacked bar graph shows proportion of students constituting the self-reported sex
category.
Fall 2015 Fall 2016 Fall 2017 Fall 2018 Fall 2019
Female 289 310 322 330 366
Male 163 163 192 210 239
Not Reported
6
Total Count 452 473 514 540 611
Race and Ethnic Background Race-ethnic background is a student self-reported characteristic. Only those race/ethnicity categories with registered students
within the listed time frame are shown. Percentages show proportion of students within the self-reported race/ethnicity category.
Unduplicated Headcount2
Fall 2015 Fall 2016 Fall 2017 Fall 2018 Fall 2019
Unduplicated Count
Percent Unduplicat
ed Count Percent
Unduplicated Count
Percent Unduplicated Count
Percent Unduplicated Count
Percent
Black/African American
326 72.1% 358 75.7% 382 74.3% 402 74.4% 446 73.0%
Asian 47 10.4% 41 8.7% 51 9.9% 56 10.4% 64 10.5%
White 22 4.9% 29 6.1% 36 7.0% 43 8.0% 44 7.2%
Hispanic 24 5.3% 21 4.4% 23 4.5% 20 3.7% 27 4.4%
Other/Declined to Respond
19 4.2% 14 3.0% 13 2.5% 10 1.9% 16 2.6%
Two or more 11 2.4% 7 1.5% 7 1.4% 8 1.5% 13 2.1%
American Indian/Alaskan Native
1 0.2% 1 0.2% 1 0.2% 1 0.2% 1 0.2%
Hawaiian/Pacific Islander
2 0.4% 2 0.4% 1 0.2% 0.0% 0.0%
Total Count 452 100.0% 473 100.0% 514 100.0% 540 100.0% 611 100.0%
2 Unduplicated headcount is the actual number of individual students enrolled. Students may be enrolled in one or more programs, but they are counted only once.
63.9% 65.5% 62.6% 61.1% 59.9%
36.1% 34.5% 37.4% 38.9% 39.1%
1.0%
F A L L 2 0 1 5 F A L L 2 0 1 6 F A L L 2 0 1 7 F A L L 2 0 1 8 F A L L 2 0 1 9
Female Male Not Reported

7 | P a g e
Program Enrollment by Sex and by Race/Ethnicity Only programs with registered students during the listed semesters are shown. Also, only those race/ethnicity categories with
registered students within the listed time frame are shown. Sex and race/ethnicity are student self-reported characteristics.
MD: Doctor of Medicine
Fall 2015 Fall 2016 Fall 2017 Fall 2018 Fall 2019
Female Female Total 171 200 215 210 222
Black/African American 129 158 168 163 167
Asian 16 15 17 20 23
Hispanic 8 8 10 7 8
White 8 10 12 12 16
Hawaiian/Pacific Islander 1 1 1
Two or more 3 2 3 3 2
Other/Declined to Respond 6 6 4 5 6
Male Male Total 122 124 147 167 176
Black/African American 59 68 80 93 97
Asian 24 19 28 30 33
Hispanic 14 11 11 12 15
American Indian/Alaskan Native 1 1 1 1
White 13 16 20 27 25
Hawaiian/Pacific Islander 1 1
Two or more 2 1 1 1 3
Other/Declined to Respond 8 7 6 3 3
Not Reported
Not Reported Total
2
Asian
1
Hispanic
1
Total Count
293 324 362 377 400
MPH: Master Public Health
Fall 2015 Fall 2016 Fall 2017 Fall 2018 Fall 2019
Female Female Total 42 36 33 34 33
Black/African American 38 35 31 31 31
Asian 1 1 1 1
Hispanic 1
1
Two or more 1
1 1
Other/Declined to Respond 1
1 1
Male Male Total 12 10 15 17 14
Black/African American 12 10 15 17 13
Two or more
1
Total Count 54 46 48 51 47
8 | P a g e
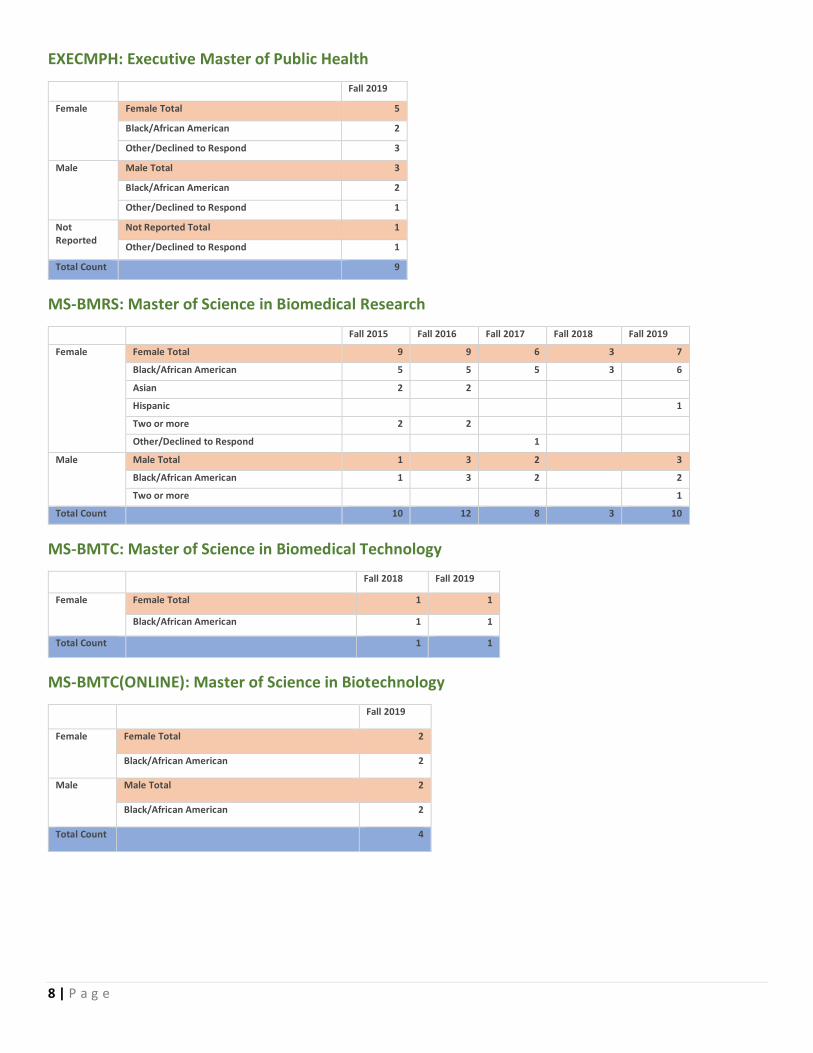
EXECMPH: Executive Master of Public Health
Fall 2019
Female Female Total 5
Black/African American 2
Other/Declined to Respond 3
Male Male Total 3
Black/African American 2
Other/Declined to Respond 1
Not Reported
Not Reported Total 1
Other/Declined to Respond 1
Total Count
9
MS-BMRS: Master of Science in Biomedical Research
Fall 2015 Fall 2016 Fall 2017 Fall 2018 Fall 2019
Female Female Total 9 9 6 3 7
Black/African American 5 5 5 3 6
Asian 2 2
Hispanic
1
Two or more 2 2
Other/Declined to Respond
1
Male Male Total 1 3 2
3
Black/African American 1 3 2
2
Two or more
1
Total Count
10 12 8 3 10
MS-BMTC: Master of Science in Biomedical Technology
Fall 2018 Fall 2019
Female Female Total 1 1
Black/African American 1 1
Total Count
1 1
MS-BMTC(ONLINE): Master of Science in Biotechnology
Fall 2019
Female Female Total 2
Black/African American 2
Male Male Total 2
Black/African American 2
Total Count
4

9 | P a g e
MS-CLRS: Master of Science in Clinical Research
Fall 2015 Fall 2016 Fall 2017 Fall 2018 Fall 2019
Female Female Total 9 7 7 8 4
Black/African American 7 7 5 6 3
Asian 1
1 1 1
White
1 1
Other/Declined to Respond 1
Male Male Total 3 1 3 4 4
Black/African American 2 1 1 2 3
Asian 1
1 1 1
White
1 1
Total Count
12 8 10 12 8
MS-MS: Master of Science in Medical Sciences
Fall 2015 Fall 2016 Fall 2017 Fall 2018 Fall 2019
Female Female Total 18 18 20 30 27
Black/African American 15 16 19 29 25
Asian
1
Hispanic
1 1 1
Two or more 1
1
Other/Declined to Respond 2
1
Male Male Total 13 12 12 11 14
Black/African American 13 12 12 11 14
Not Reported
Not Reported Total
2
Black/African American
2
Total Count
31 30 32 41 43
MS-NESC: Master of Science in Neuroscience
Fall 2015 Fall 2016 Fall 2017 Fall 2018 Fall 2019
Female Female Total 2 1 4 3 4
Black/African American 2 1 3 3 3
Asian
1
Two or more
1
Male Male Total
1
Black/African American
1
Total Count 2 1 4 3 5

10 | P a g e
MS-PAS: Master of Science in Physician Assistant Studies
Fall 2019
Female Female Total 15
Black/African American 12
American Indian/Alaskan Native 1
White 1
Two or more 1
Male Male Total 5
Black/African American 4
Hispanic 1
Total Count
20
PHD-BMSC: Doctor of Philosophy in Biomedical Sciences
Fall 2015 Fall 2016 Fall 2017 Fall 2018 Fall 2019
Female Female Total 26 27 20 22 30
Black/African American 23 22 14 18 24
Asian 1 1 1 1 2
Hispanic 1 1 1
White
2 2 1 1
Hawaiian/Pacific Islander
Two or more 1 1 2 2 3
Male Male Total 9 10 8 6 8
Black/African American 6 6 7 5 7
Asian 1 2 1 1 1
White 1 1
Other/Declined to Respond 1 1
Total Count
35 37 28 28 38
PHD-MSCR: Dual Degree Ph.D. in Biomedical Sciences and Master of Science in Clinical Research
Fall 2015 Fall 2016 Fall 2017 Fall 2018 Fall 2019
Female Female Total 6 4 8 7 6
Black/African American 6 4 8 6 5
White
1 1
Male Male Total 2 1 2 2 2
Black/African American 2 1 1 1 1
Other/Declined to Respond
1 1 1
Total Count 8 5 10 9 8

11 | P a g e
NO-DEGREE: Non-Degree
Fall 2015 Fall 2016 Fall 2017 Fall 2018 Fall 2019
Female Female Total 6 8 9 12 10
Black/African American 5 7 8 11 10
Asian
1
Two or more 1 1
1
Male Male Total 1 2 3 3 7
Black/African American 1 2 3 2 6
Asian
1 1
Not Reported Not Reported Total
1
Black/African American
1
Grand Total
7 10 12 15 18
Age Distribution Age is calculated as of October 15th of registered calendar year.
Unduplicated Headcount by Age Range
Fall 2015 Fall 2016 Fall 2017 Fall 2018 Fall 2019
18-19 2
1
20-21 8 11 15 19 21
22-24 167 182 174 176 203
25-29 210 221 258 281 312
30-34 36 32 41 38 41
35-39 18 17 16 14 15
40-49 9 9 8 9 12
50-64 2 1 2 2 6
Unknown
1
Total Count 452 473 514 540 611

12 | P a g e
Average Age by Programs
Fall 2015 Fall 2016 Fall 2017 Fall 2018 Fall 2019
Exec Master of Public Health 41
MS in Clinical Research 30 26 39 39 39
MS in Biotechnology (Online) 28
MS Physician Assistant Studies 28
PhD in Biomedical Sciences 29 28 28 29 28
PhD/MSCR Biomedical/Clinical 32 32 27 27 28
Non-Degree Seeking 21 23 23 22 27
Doctor of Medicine 26 26 26 26 26
Master of Public Health 28 27 27 26 25
MS in Biomedical Research 25 24 24 23 24
MS in Medical Sciences 24 23 24 24 24
MS in Biomedical Technology 27 23
MS in Neuroscience 23 22 22 24 22
Overall Average Age 26 26 26 26 26
Program Persistence and Graduation by Admit Year Initial fall semester census counts show program cohort size and subsequent semesters show the Persistence and Graduation Rate
of the cohort.
Note: Persistence rate is measured by the percentage of students who started study at MSM and returned to MSM in the same
program in the sequent academic years. For some of the programs such as MSMS, MSBR and MSCR, a significant number of students
transfer to MD or Ph.D. program before they graduate from the original programs. These students were not taken out when
calculate persistence and graduation rate.
MD-Doctor of Medicine
Doctor of Medicine Persistence Start Academic Year
Start Year
2nd Year 3rd Year 4th Year 5th Year 6th Year
N n % n % n % n % n %
2012 56 55 98% 55 98% 54 96% 2 4% 2 4%
2013 64 64 100% 64 100% 62 97% 5
1
2014 70 70 100% 69 99% 64 91% 9
4
2015 78 78 100% 77 99% 77 99% 7
1
2016 81 81 100% 81 100% 76 94% 11
2017 94 94 100% 92 98% 91 97%
2018 100 98 98% 97 97%
2019 100 100 100%
2020 99

13 | P a g e
Doctor of Medicine Graduation
Start Academic Year Start Year Four Year Graduate Five Year Graduate Six Year Graduate
N n % n % n %
2012 56 52 93%
2013 64 57 89% 4 95%
2014 70 52 74% 8 86% 2 89%
2015 78 67 86% 5 92%
2016 81 63 78%
MPH: Master of Public Health
Master of Public Health Persistence
Start Academic Year Start Year 2nd Year 3rd Year 4th Year
N n % n % n %
2012 19 17 89% 6 32% 1 5%
2013 21 19 90% 2 10% 1 5%
2014 21 18 86% 5 24%
2015 20 20 100%
1 5%
2016 28 27 96% 2 7%
2017 19 19 100% 1 5%
2018 27 27 100% 9 33%
2019 22 20 91%
2020 18
Master of Public Health Graduation
Start Academic Year Start Year One Year Graduate Two Year Graduate Three Year Graduate
N n % n % n %
2012 19
12 63% 2 74%
2013 21
15 71%
2014 21
15 71%
2015 20
19 95%
2016 28 2 7% 20 79% 1 82%
2017 19
17 89%
2018 27
17 63%
MSBR: Master of Science in Biomedical Research
MS in Biomedical Research Persistence
Start Academic Year Start Year 2nd Year 3rd Year
N n % n %
2012 11 8 73% 1 9%
2013 5 2 40%
2014 13 10 77% 4 31%
2015 5 1 20%
2016 6 6 100% 1 17%
2017 6 5 83%
2018 2
2019 3 2 67%
2020 8
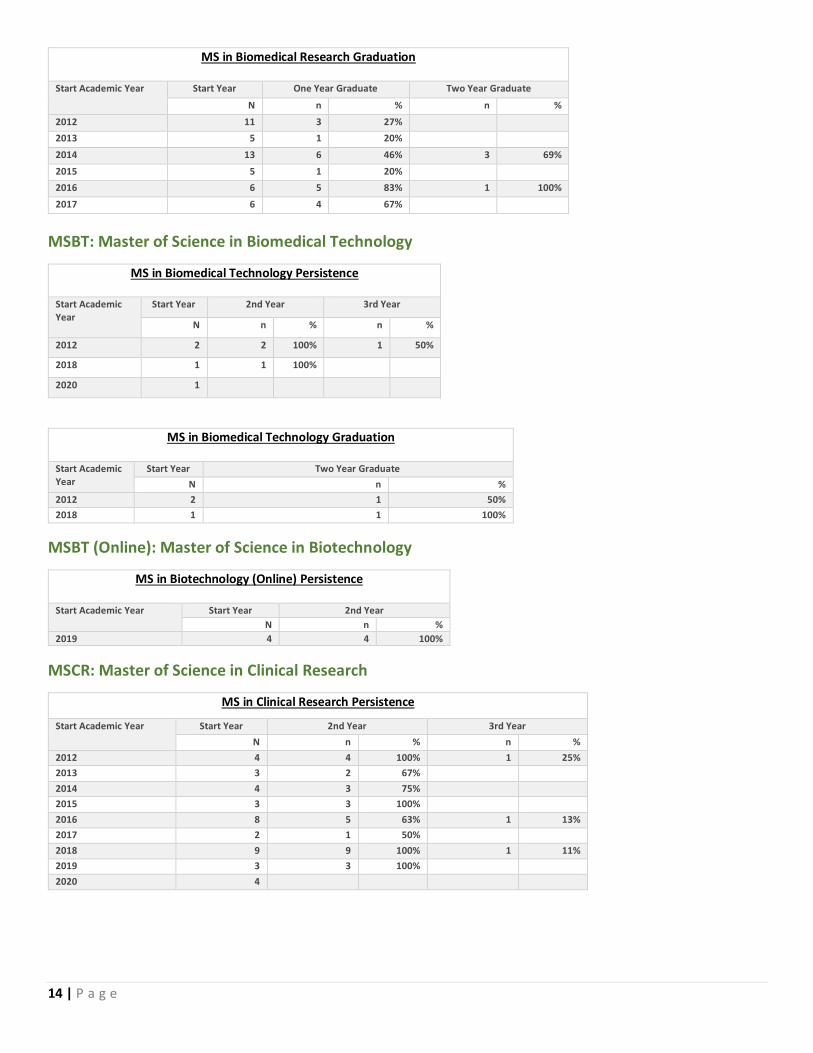
14 | P a g e
MS in Biomedical Research Graduation
Start Academic Year Start Year One Year Graduate Two Year Graduate
N n % n %
2012 11 3 27%
2013 5 1 20%
2014 13 6 46% 3 69%
2015 5 1 20%
2016 6 5 83% 1 100%
2017 6 4 67%
MSBT: Master of Science in Biomedical Technology
MS in Biomedical Technology Persistence
Start Academic Year
Start Year 2nd Year 3rd Year
N n % n %
2012 2 2 100% 1 50%
2018 1 1 100%
2020 1
MS in Biomedical Technology Graduation
Start Academic Year
Start Year Two Year Graduate
N n %
2012 2 1 50%
2018 1 1 100%
MSBT (Online): Master of Science in Biotechnology
MS in Biotechnology (Online) Persistence
Start Academic Year Start Year 2nd Year
N n %
2019 4 4 100%
MSCR: Master of Science in Clinical Research
MS in Clinical Research Persistence
Start Academic Year Start Year 2nd Year 3rd Year
N n % n %
2012 4 4 100% 1 25%
2013 3 2 67%
2014 4 3 75%
2015 3 3 100%
2016 8 5 63% 1 13%
2017 2 1 50%
2018 9 9 100% 1 11%
2019 3 3 100%
2020 4

15 | P a g e
MS in Clinical Research Graduation
Start Academic Year Start Year Two Year Graduate
N n %
2012 4 1 25%
2013 3 2 67%
2014 4 2 50%
2015 3 3 100%
2016 8 5 63%
2017 2 1 50%
2018 9 8 89%
MS-MS: Master of Science in Medical Science
MS in Medical Science Persistence
Start Academic Year Start Year 2nd Year
N n %
2013 11 5 45%
2014 16 9 56%
2015 16 11 69%
2016 20 9 45%
2017 21 11 52%
2018 21 17 81%
2019 24 18 75%
2020 25
MS in Medical Sciences Graduation
Start Academic Year Start Year Two Year Graduate
N n %
2013 11 5 45%
2014 16 9 56%
2015 16 11 69%
2016 20 9 45%
2017 21 11 52%
2018 21 17 81%
MS-NESC: Master of Science in Neuroscience
MS in Neuroscience Persistence
Start Academic Year Start Year 2nd Year
N n %
2016 2
2017 1
2018 4
2019 3 1 33%
2020 4
MS in Neuroscience Graduation
Start Academic Year Start Year One Year Graduate
N n %
2016 2 2 100%
2017 1 1 100%
2018 4 4 100%
2019 3 2 67%

16 | P a g e
PhD-BMSC: Doctor of Philosophy in Biomedical Science
PhD in Biomedical Science Persistence
Start Academic Year
Start Year 2nd Year 3rd Year 4th Year 5th Year 6th Year
N n % n % n % n % n %
2012 5 5 100% 5 100% 4 80% 4
4
2013 2 1 50% 1 50% 1 50% 1
1
2014 6 5 83% 5 83% 5 83% 3
2015 7 6 86% 6 86% 5 71% 4
4
2016 10 10 100% 5 50% 5 50% 5
2017 8 8 100% 7 88% 7 88%
2018 3 3 100% 3 100%
2019 8 8 100%
2020 10
PhD in Biomedical Sciences Graduation
Start Academic Year
Start Year Three Year Graduate Four Year Graduation Five Year Graduation Six Year Graduation Seven Year Graduation
N n % n % n % n % n %
2012 5 2 40% 1 60%
2013 2 1 50%
2014 6 1 17% 2 50%
PhD-MSCR: Dual Degree in Biomedical Science and Clinical Research
PhD/MSCR Biomedical/Clinical Persistence
Start Academic Year Start Year 2nd Year 3rd Year
N n % n %
2015 3 3 100% 3 100%
2016 1 1 100% 1 100%
2017 1 1 100% 1 100%
2018 8 7 88% 7 88%
2019 1 1 100%
PhD/MSCR Biomedical/Clinical Graduation
Start Academic Year Start Year One Year Graduate Three Year Graduate
N n % n %
2015 3
3 100%
2016 1
1 100%
2017 1
1 100%
2018 8 1 13%
17 | P a g e
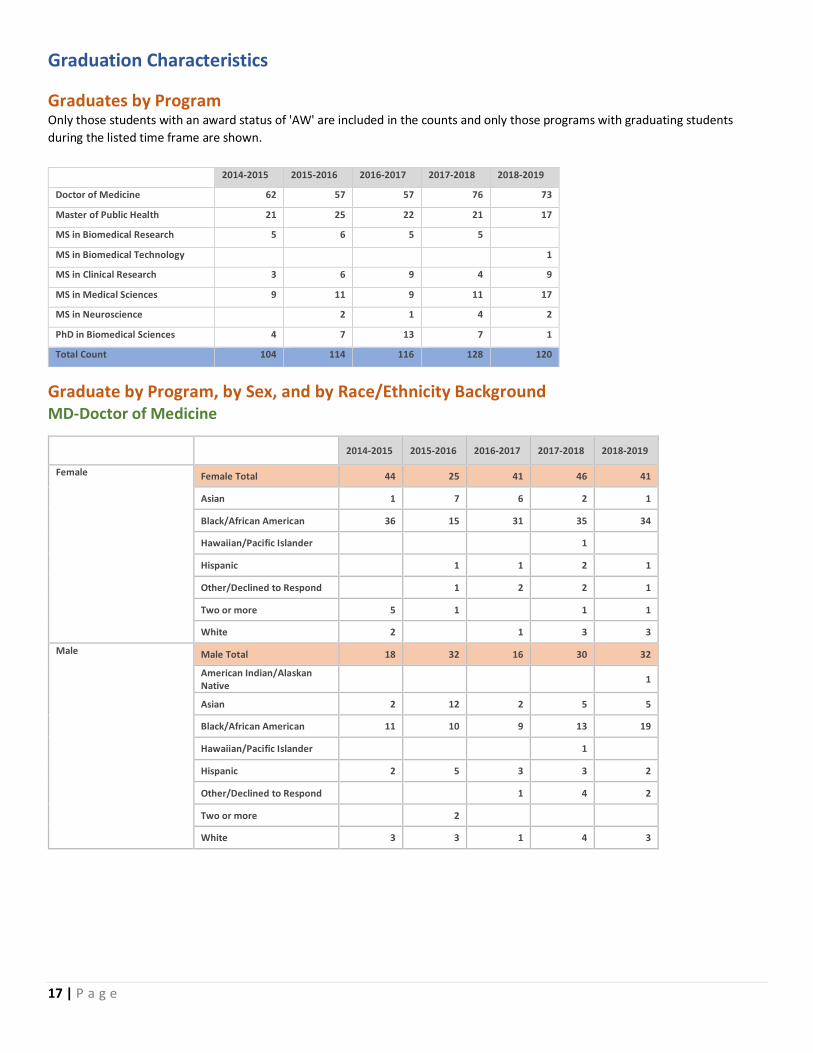
Graduation Characteristics
Graduates by Program Only those students with an award status of 'AW' are included in the counts and only those programs with graduating students
during the listed time frame are shown.
Graduate by Program, by Sex, and by Race/Ethnicity Background MD-Doctor of Medicine
2014-2015 2015-2016 2016-2017 2017-2018 2018-2019
Female Female Total 44 25 41 46 41
Asian 1 7 6 2 1
Black/African American 36 15 31 35 34
Hawaiian/Pacific Islander 1
Hispanic 1 1 2 1
Other/Declined to Respond 1 2 2 1
Two or more 5 1 1 1
White 2 1 3 3
Male Male Total 18 32 16 30 32
American Indian/Alaskan Native
1
Asian 2 12 2 5 5
Black/African American 11 10 9 13 19
Hawaiian/Pacific Islander 1
Hispanic 2 5 3 3 2
Other/Declined to Respond 1 4 2
Two or more 2
White 3 3 1 4 3
2014-2015 2015-2016 2016-2017 2017-2018 2018-2019
Doctor of Medicine 62 57 57 76 73
Master of Public Health 21 25 22 21 17
MS in Biomedical Research 5 6 5 5
MS in Biomedical Technology
1
MS in Clinical Research 3 6 9 4 9
MS in Medical Sciences 9 11 9 11 17
MS in Neuroscience
2 1 4 2
PhD in Biomedical Sciences 4 7 13 7 1
Total Count 104 114 116 128 120

18 | P a g e
MPH: Master of Public Health
2014-2015 2015-2016 2016-2017 2017-2018 2018-2019
Female Female Total 14 18 17 17 10
Asian 1
1
1
Black/African American 13 17 16 17 8
Other/Declined to Respond
1
1
Male Male Total 7 7 5 4 7
Black/African American 7 7 5 4 7
Other/Declined to Respond
MSBR: Master of Science in Biomedical Research
2014-2015 2015-2016 2016-2017 2017-2018 2018-2019
Female Female Total 5 5 5 3
Asian
1 2
Black/African American 4 4 1 3
Two or more 1
2
White
Male Male Total
1
2
Black/African American
1
2
MSBT: Master of Science in Biomedical Technology
2014-2015 2015-2016 2016-2017 2017-2018 2018-2019
Female Female Total
1
Black/African American
1
MSCR: Master of Science in Clinical Research
2014-2015 2015-2016 2016-2017 2017-2018 2018-2019
Female Female Total 3 4 8 3 6
Asian
1
Black/African American 2 2 8 3 5
Hawaiian/Pacific Islander
Other/Declined to Respond 1 1
Two or more
White
1
Male Male Total
2 1 1 3
Asian
1
Black/African American
2 1 1 1
White
1

19 | P a g e
MSMS: Master of Science in Medical Sciences
2014-2015 2015-2016 2016-2017 2017-2018 2018-2019
Female Female Total 3 4 4 8 11
Black/African American 3 4 4 8 10
Hispanic
1
Male Male Total 6 7 5 3 6
Black/African American 5 7 5 3 6
Hispanic 1
MSNESC: Master of Science in Neuroscience
2014-2015 2015-2016 2016-2017 2017-2018 2018-2019
Female Female Total
2 1 4 2
Black/African American
2 1 3 2
Two or more
1
PhD-BMSC: PhD in Biomedical Sciences
2014-2015 2015-2016 2016-2017 2017-2018 2018-2019
Female Female Total 3 5 10 5 1
Asian 1
Black/African American 2 5 10 4 1
Hawaiian/Pacific Islander
Hispanic
1
Male Male Total 1 2 3 2
Asian
1
Black/African American 1 2 1 2
White
1
Human Resources
Faculty Profile (Based on Human Resource Data October 2019)
63 61 63
22
8
75
66
78
1815
73 7174
17
23
0
10
20
30
40
50
60
70
80
90
Professor Associat Professor Assistant Professor Adjunct Faculty Instructor
FY2018 FY2019 FY2020
20 | P a g e
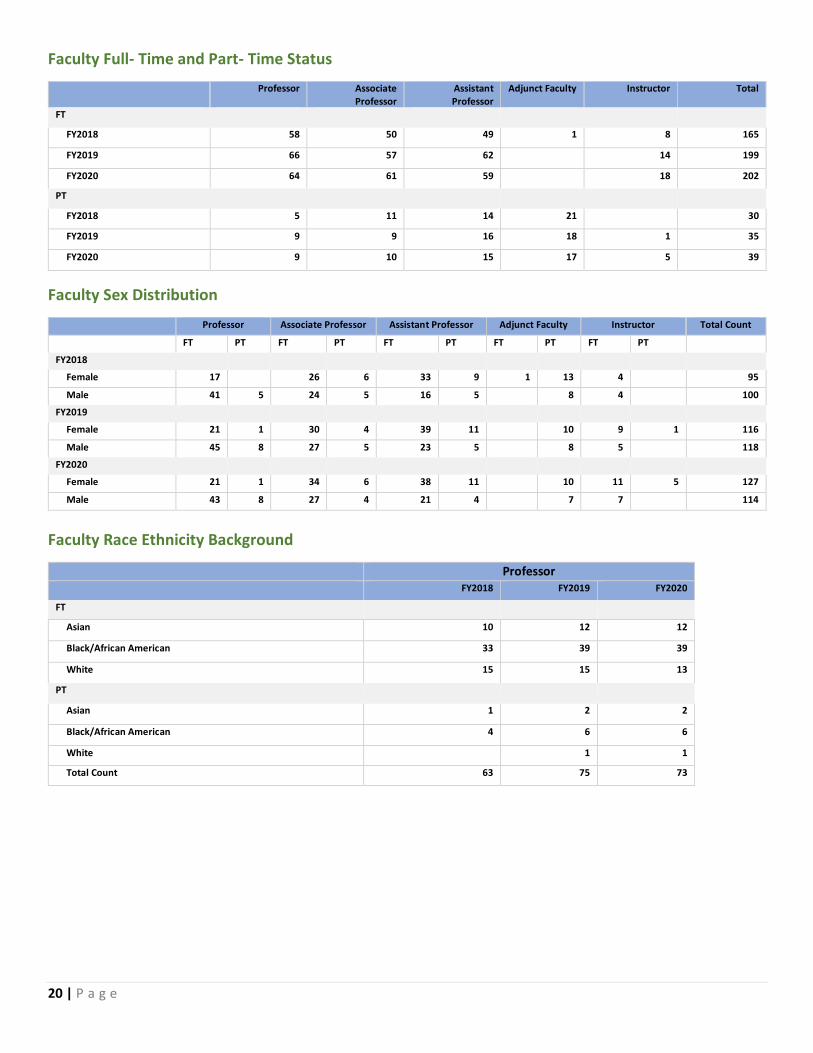
Faculty Full- Time and Part- Time Status
Professor Associate Professor
Assistant Professor
Adjunct Faculty Instructor Total
FT
FY2018 58 50 49 1 8 165
FY2019 66 57 62 14 199
FY2020 64 61 59 18 202
PT
FY2018 5 11 14 21
30
FY2019 9 9 16 18 1 35
FY2020 9 10 15 17 5 39
Faculty Sex Distribution
Professor Associate Professor Assistant Professor Adjunct Faculty Instructor Total Count
FT PT FT PT FT PT FT PT FT PT
FY2018
Female 17 26 6 33 9 1 13 4
95
Male 41 5 24 5 16 5 8 4
100
FY2019
Female 21 1 30 4 39 11 10 9 1 116
Male 45 8 27 5 23 5 8 5
118
FY2020
Female 21 1 34 6 38 11 10 11 5 127
Male 43 8 27 4 21 4 7 7
114
Faculty Race Ethnicity Background
Professor FY2018 FY2019 FY2020
FT
Asian 10 12 12
Black/African American 33 39 39
White 15 15 13
PT
Asian 1 2 2
Black/African American 4 6 6
White
1 1
Total Count 63 75 73

21 | P a g e
Associate Professor
FY2018 FY2019 FY2020
FT
American Indian/Alaskan Native
Asian 8 8 10
Black/African American 34 39 40
Hawaiian/Pacific Islander 1 1 2
Two or more 1 1 1
White 6 8 8
PT
Asian 1 1
Black/African American 9 7 8
Hawaiian/Pacific Islander 1
Hispanic
1 1
White
1
Total Count 61 66 71
Assistant Professor
FY2018 FY2019 FY2020
FT
American Indian/Alaskan Native 1 1 1
Asian 9 13 13
Black/African American 30 39 37
Hispanic 1 1
Two or more 2 2 2
White 7 6 5
PT
Asian 1 1 1
Black/African American 12 15 14
White 1
Total Count 63 78 74
Adjunct Faculty
FY2018 FY2019 FY2020
FT
Black/African American 1
PT
Asian 3 3 3
Black
1
Black/African American 15 12 10
Two or more 1
White 2 3 3
Total Count 22 18 17

22 | P a g e
Instructor FY2018 FY2019 FY2020
FT
American Indian/Alaskan Native
Asian 2 3 5
Black/African American 5 11 13
Hawaiian/Pacific Islander
White 1
PT
Asian
Black/African American
1 4
White
1
Total Count 8 15 23
Staff Profile (Based on IPEDS Human Resource Reports Fall 2016, Fall 2017, Fall 2018)
Number of staff by employment status and occupational category: Fall 2018
Occupational category Reported values FTE staff
Number of Number of
full-time staff
part-time staff
Total number of staff 974 102 1,008
Instructional Staff 241 52 258
Primary Instruction 49 8 52
Exclusively credit 49 8 52
Exclusively not-for-credit 0 0 0
Combined credit/not-for-credit 0 0 0
Instruction/research/public service 192 44 207
Research Staff 0 5 2
Public Service Staff 0 11 4
997
86
1,0261,005
108
1,041
974
102
1,008
0
200
400
600
800
1000
1200
full-time staff part-time staff FTE
Fall 2016 Fall 2017 Fall 2018

23 | P a g e
Library and Student and Academic Affairs and Other Education Services Occupations SOC 200 8 203
Librarians, Curators, and Archivists SOC 25-4000 3 4 4
Archivists, Curators, and Museum Technicians SOC 25-4010 0 0 0
Librarians SOC 25-4020 2 0 2
Library Technicians SOC 25-4030 1 4 2
Student and Academic Affairs and Other Education Services Occupations SOC 25-2000 + 25-3000 + 25-9000
197 4 198
Management Occupations SOC 11-0000 147 1 147
Business and Financial Operations Occupations SOC 13-0000 53 0 53
Computer, Engineering, and Science Occupations SOC 15-0000 + 17-0000 + 19-0000 58 1 58
Community, Social Service, Legal, Arts, Design, Entertainment, Sports and Media Occupations SOC 21-0000 + 23-0000 + 27-0000
13 4 14
Healthcare Practitioners and Technical Occupations SOC 29-0000 27 2 28
Service Occupations SOC 31-0000 + 33-0000 + 35-0000 + 37-0000 + 39-0000 62 11 66
Sales and Related Occupations SOC 41-0000 0 0 0
Office and Administrative Support Occupations SOC 43-0000 173 6 175
Natural Resources, Construction, and Maintenance Occupations SOC 45-0000 + 47-0000 + 49-0000 0 0 0
Production, Transportation, and Material Moving Occupations SOC 51-0000 + 53-0000 0 1 0
NOTE: Full-time-equivalent (FTE) staff is calculated by summing the total number of full-time staff and adding one-third of the total number of part-time staff. Graduate assistants are not included in the above figures. Many of the FTE figures may be included in the DFR.
Finance: Grants, Contracts, and Gifts (Based on IPEDS Financial Reports FY2016, FY2017, FY2018) Total Revenues and Total Expenses
$185,154,658
$165,377,930 $165,913,051
$153,191,115 $158,642,847
$165,187,145
$0
$20,000,000
$40,000,000
$60,000,000
$80,000,000
$100,000,000
$120,000,000
$140,000,000
$160,000,000
$180,000,000
$200,000,000
FY2016 FY2017 FY2018
Total revenues Total expenses
24 | P a g e
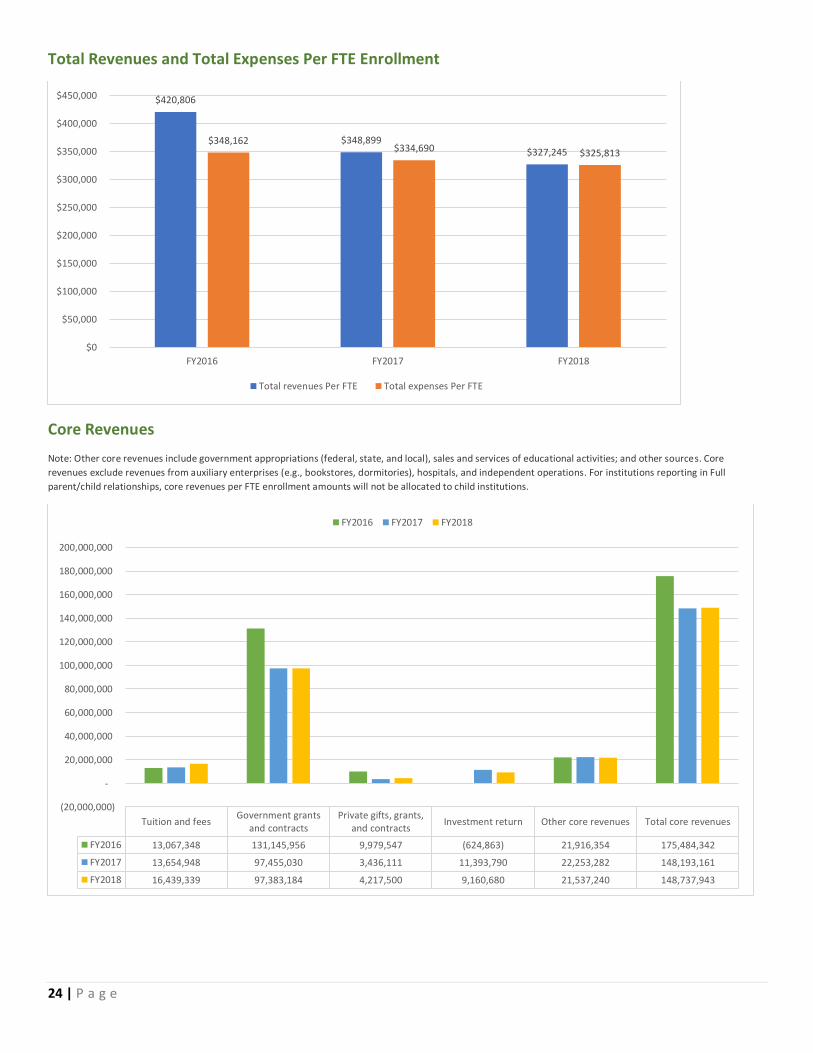
Total Revenues and Total Expenses Per FTE Enrollment
Core Revenues
Note: Other core revenues include government appropriations (federal, state, and local), sales and services of educational activities; and other sources. Core
revenues exclude revenues from auxiliary enterprises (e.g., bookstores, dormitories), hospitals, and independent operations. For institutions reporting in Full
parent/child relationships, core revenues per FTE enrollment amounts will not be allocated to child institutions.
$420,806
$348,899 $327,245
$348,162 $334,690 $325,813
$0
$50,000
$100,000
$150,000
$200,000
$250,000
$300,000
$350,000
$400,000
$450,000
FY2016 FY2017 FY2018
Total revenues Per FTE Total expenses Per FTE
Tuition and feesGovernment grants
and contractsPrivate gifts, grants,
and contractsInvestment return Other core revenues Total core revenues
FY2016 13,067,348 131,145,956 9,979,547 (624,863) 21,916,354 175,484,342
FY2017 13,654,948 97,455,030 3,436,111 11,393,790 22,253,282 148,193,161
FY2018 16,439,339 97,383,184 4,217,500 9,160,680 21,537,240 148,737,943
(20,000,000)
-
20,000,000
40,000,000
60,000,000
80,000,000
100,000,000
120,000,000
140,000,000
160,000,000
180,000,000
200,000,000
FY2016 FY2017 FY2018

25 | P a g e
Core Revenues Per FTE Enrollment
Core Expenses
Note: Other core expenses include net grant aid to students, net of discounts and allowances, and other expenses. Core expenses exclude expenses from auxiliary enterprises (e.g., bookstores, dormitories), hospitals, and independent operations.
Tuition and feesGovernment grants
and contractsPrivate gifts, grants,
and contractsInvestment return Other core revenues Total core revenues
FY2016 $29,699 $298,059 $22,681 ($1,420) $49,810 $398,828
FY2017 $28,808 $205,601 $7,249 $24,038 $46,948 $312,644
FY2018 $32,425 $192,077 $8,319 $18,068 $42,480 $293,369
($50,000)
$0
$50,000
$100,000
$150,000
$200,000
$250,000
$300,000
$350,000
$400,000
$450,000
FY2016 FY2017 FY2018
Instruction Research Public serviceAcademicsupport
Institutionalsupport
Studentservices
Other coreexpenses
Total coreexpenses
FY2016 $56,534,046 $25,822,272 $7,415,394 $9,622,882 $29,782,365 $3,317,909 $9,985,316 $142,480,184
FY2017 $61,066,064 $28,735,241 $6,806,384 $7,426,199 $27,946,575 $3,500,263 $9,990,771 $145,471,497
FY2018 $65,611,585 $26,219,453 $6,843,189 $8,673,100 $24,939,986 $5,316,273 $9,830,300 $147,433,886
$0
$20,000,000
$40,000,000
$60,000,000
$80,000,000
$100,000,000
$120,000,000
$140,000,000
$160,000,000
FY2016 FY2017 FY2018

26 | P a g e
Core Expenses Per FTE Enrollment
Physical Plant
Owned Facilities
Building Year Completed/Renovated Gross Square Feet
Hugh M. Gloster Building
95,000
Medical Education Building 1987 76,000
Harris Building 1988 22,800
Maintenance Building 1989 7,500
Multidisciplinary Research Center 1996 35,500
Parking Deck 1999 3,000
Research Wing 2000 43,000
National Center for Primary Care 2002 106,000
Multidisciplinary Research Center Annex 2004 27,000
Bille Suber Aaron Pavilion 2017 9,500
Pavilion 8,554
Leased Facilities
Lease Description / Address - Suite# Lessor Department Square Feet
BuggyWorks-Psychiatry Suite 100-Bldg 300B 1513 Cleveland Ave. East Point, GA 30344
JGW Diplomat Psychiatry 6,000
BuggyWorks Family Practice- Build. 500 & 300-A
JGW Diplomat Family Practice Center
24,000
Instruction Research Public serviceAcademicsupport
Institutionalsupport
Studentservices
Other coreexpenses
Total coreexpenses
FY2016 $128,486 $58,687 $16,853 $21,870 $67,687 $7,541 $22,694 $323,819
FY2017 $128,831 $60,623 $14,359 $15,667 $58,959 $7,385 $21,078 $306,902
FY2018 $129,411 $51,715 $13,497 $17,107 $49,191 $10,486 $19,389 $290,797
$0
$50,000
$100,000
$150,000
$200,000
$250,000
$300,000
$350,000
FY2016 FY2017 FY2018

27 | P a g e
1513 Cleveland Ave. East Point, GA 30344
BuggyWorks CH/PM - Suite 100, Build. 250-B 1513 Cleveland Ave. East Point, GA 30344
JGW Diplomat Community Health & Preventive Medicine 2,087
BuggyWorks CH/PM - Suite 110, Build. 100-B 1513 Cleveland Ave. East Point, GA 30344
JGW Diplomat Community Health & Preventive Medicine 1,069
BuggyWorks- Suite 100A 1513 Cleveland Ave. East Point, GA 30344
JGW Diplomat Conference Room 1,201
BuggyWorks-Prevention Research Center Suite 200-A Bldg 100 1513 Cleveland Ave. East Point, GA 30344
JGW Diplomat Prevention Research Center 3,817
BuggyWorks-Prevention Research Center Suite 210-A Bldg 100 1513 Cleveland Ave. East Point, GA 30344
JGW Diplomat Prevention Research Center 1,200
Ridgeview Mental Health Suite 215 4015 South Cobb Drive Smyrna, Georgia 30080
Ridgeview Institute Psychiatry 495
BuggyWorks: MSM-VACBOC-Building 300 1513 Cleveland Ave. East Point, GA 30344
JGW Diplomat VACBOC BuggyWorks
9,694
The Hurt Building 50 Hurt Plaza Suite 630 Atlanta, GA 30303
50 Hurt LLC Department of Pediatrics
8,451
Clerkship Program Rothschild Building 1214 1st Avenue Suite 300 Columbus, GA 31908
Rothschild Building, LLC
Medical Education 519
Greenhill Apartment Greenhill at Columbus, LLC 3528 Gentian BLVD Columbus, GA 31907
Greenhill Property Management, LLC
Medical Education 2 Bedroom
Greenhill Apartment Greenhill at Columbus, LLC 3528 Gentian BLVD Columbus, GA 31907
Greenhill Property Management, LLC
Medical Education 4 Bedroom
Richmond Apartments Warner Robbins, GA 31088
Medical Education 2 Units
Morehouse Healthcare 1800 Howell Mill Rd 2nd & 5th Floors Atlanta, GA 30318
Piedmont West Morehouse Healthcare 22,916
BuggyWorks-Prevention Research Center Suite 115-B Bldg 100 1513 Cleveland Ave. East Point, GA 30344
JGW Diplomat Prevention Research Center - iADAPT 1,475
BuggyWorks-Prevention Research Center Suite 106-B Bldg 100 1513 Cleveland Ave. East Point, GA 30344
JGW Diplomat Prevention Research Center - iADAPT 747

28 | P a g e
Main Campus Map