Embed Size (px)
Citation preview
OPINION ON INSTITUTIONAL REFORM III EUROPINION (SPECIAL)
TABLE OF CONTENTS
INTRODUCTION ........................................................................................... 1
I. CITIZENS AND THE UNION................................................................ 2
1. Public awareness of the Conference............................................................ 22. Information and openness........................................................................... 53. The importance of institutional reform for people’s everyday lives ............. 84. Support for a stronger Union .................................................................... 10
II. SUPPORT FOR IGC ISSUES............................................................... 12
1. Flexibility ................................................................................................. 122. Qualified majority voting.......................................................................... 143. Common foreign and defence policies ...................................................... 154. The size of the Commission...................................................................... 175. Weighting of votes in the Council............................................................. 186. Employment ............................................................................................. 197. Freedom of movement .............................................................................. 21
III. ENLARGEMENT.................................................................................. 23
CONCLUSIONS ............................................................................................ 25
ANNEXES..................................................................................................... A1
1. Tables ..................................................................................................... A12. Technical specifications........................................................................... A9
OPINION ON INSTITUTIONAL REFORM III EUROPINION (SPECIAL)1
INTRODUCTION
The 1996 Intergovernmental Conference which commenced in Turin on March29, 1996 was completed in Amsterdam in the early hours of June 18, 1997. It hasresulted in a new draft Treaty on the European Union - the Treaty of Amsterdam- which will be signed by the Union’s fifteen Heads of State and Government bythe first of October, 1997.
Two very important aims of the Conference were to give the Union the meansnecessary to achieve its ambitions of economic and monetary unity as well aspolitical unity and to prepare it for enlargement.
This report presents findings1 from the Commission’s Continuous TrackingSurvey (CTS) on the European public’s support for the issues discussed duringthe Intergovernmental Conference.
Since another important aim of the Conference was to make what the Union doesmore understandable to its citizens, this report begins with an investigation of thepublic’s understanding of the Conference specifically and the Union moregenerally.
The report concludes with a look at how the public views the proposedenlargements to the East and the South.
Two earlier reports on the 1996 Intergovernmental Conference were produced inNovember 1995 and September 1996. The aim of the 1995 report was toascertain what the European public thought about the main issues which wouldbe discussed during the Conference and followed the structure of theCommission report for the Reflection Group. The second report concentrated onthe main issues which were on the agenda for the Conference and followed thestructure of the Commission opinion on the Conference.
1 The figures in this edition all come from the "Continuous Tracking Survey" which has been
carried out by the Commission’s Public Opinion Surveys and Research Unit (DG X.A.2) sinceJanuary 1996. Interviews are conducted by telephone six days a week over four-weekperiods. The sample size consists of 800 interviews for each four-week wave in each of theMember States (with the exception of Germany, where the sample size is 1.600 with 800interviews from the West and 800 interviews from the East). The margin of error is 3.5%.
Some of the figures are based on questions asked in two successive periods (i.e. over eightweeks), which increases the size of the sample to 3.200 interviews in Germany and 1.600 inthe other Member States, and reduces the margin of error to 2.5%. The technicalspecifications for the CTS are attached in the annex.
OPINION ON INSTITUTIONAL REFORM III EUROPINION (SPECIAL)2
I. CITIZENS AND THE UNION
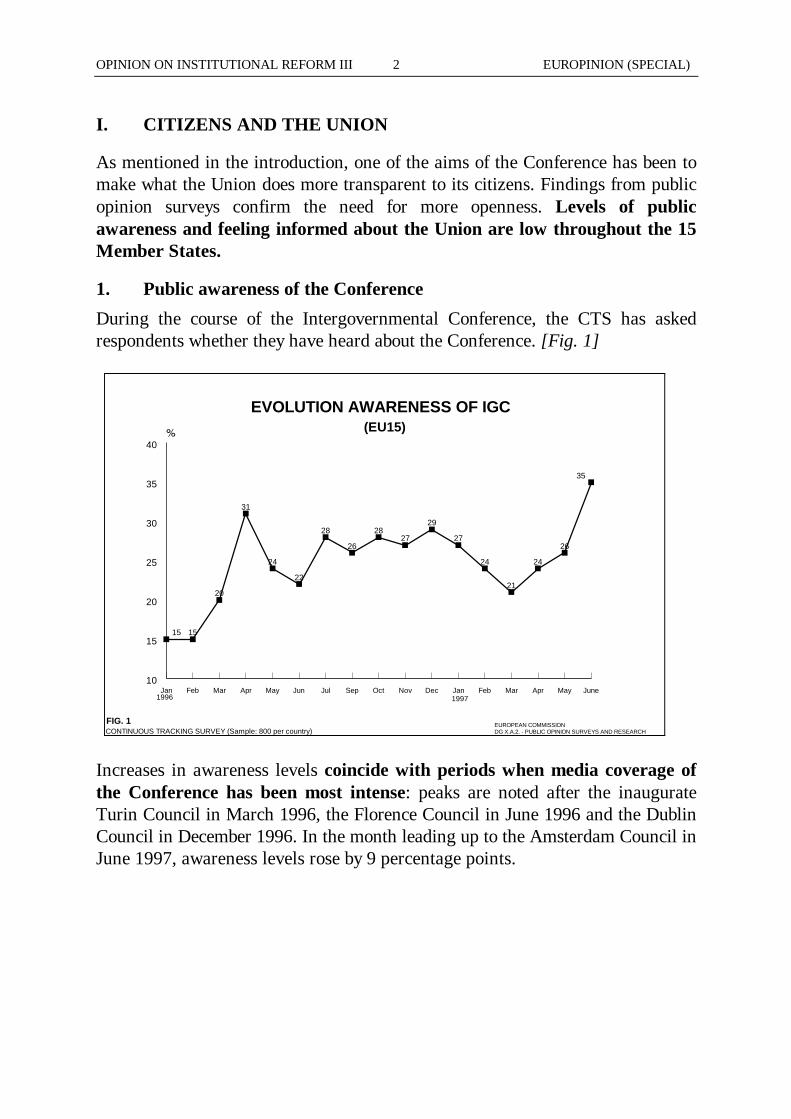
As mentioned in the introduction, one of the aims of the Conference has been tomake what the Union does more transparent to its citizens. Findings from publicopinion surveys confirm the need for more openness. Levels of publicawareness and feeling informed about the Union are low throughout the 15Member States.
1. Public awareness of the Conference
During the course of the Intergovernmental Conference, the CTS has askedrespondents whether they have heard about the Conference. [Fig. 1]
EVOLUTION AWARENESS OF IGC
15 15
20
31
24
22
28
26
2827
29
27
24
21
24
26
35
Jan Feb Mar Apr May Jun Jul Sep Oct Nov Dec Jan Feb Mar Apr May June10
15
20
25
30
35
40
1996
(EU15)
1997
EUROPEAN COMMISSIONDG X.A.2. - PUBLIC OPINION SURVEYS AND RESEARCH
FIG. 1CONTINUOUS TRACKING SURVEY (Sample: 800 per country)
Increases in awareness levels coincide with periods when media coverage ofthe Conference has been most intense: peaks are noted after the inaugurateTurin Council in March 1996, the Florence Council in June 1996 and the DublinCouncil in December 1996. In the month leading up to the Amsterdam Council inJune 1997, awareness levels rose by 9 percentage points.
OPINION ON INSTITUTIONAL REFORM III EUROPINION (SPECIAL)3
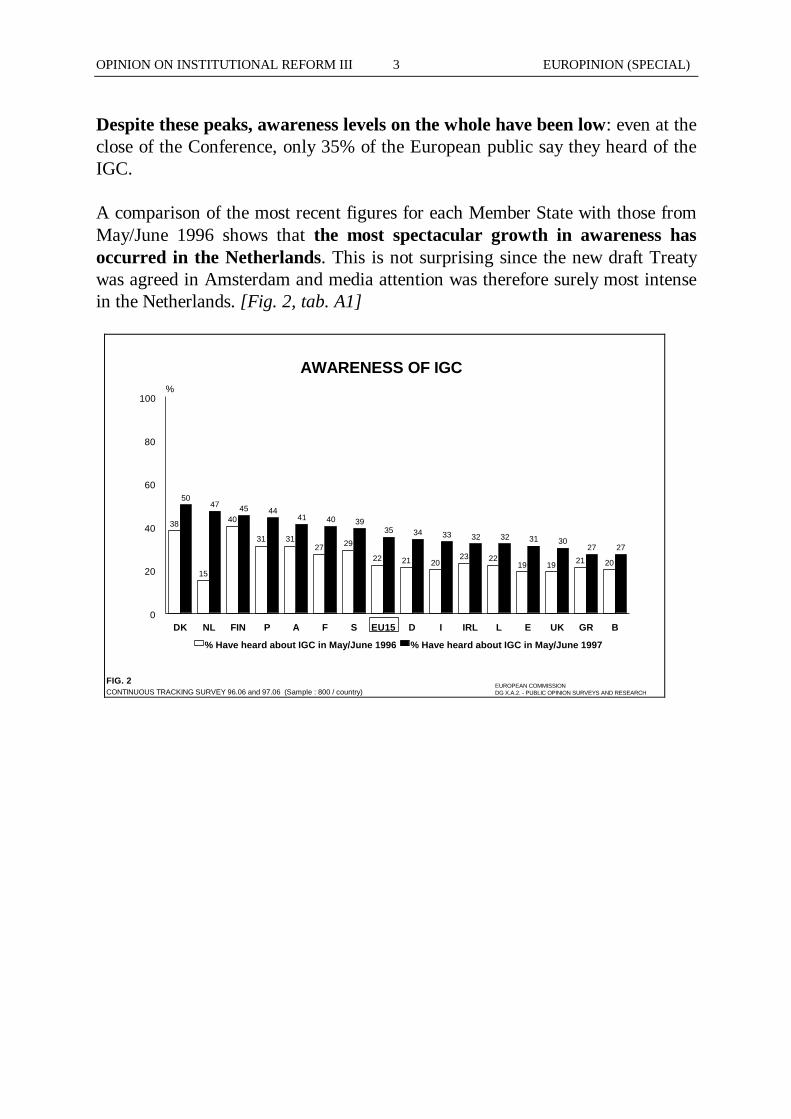
Despite these peaks, awareness levels on the whole have been low: even at theclose of the Conference, only 35% of the European public say they heard of theIGC.
A comparison of the most recent figures for each Member State with those fromMay/June 1996 shows that the most spectacular growth in awareness hasoccurred in the Netherlands. This is not surprising since the new draft Treatywas agreed in Amsterdam and media attention was therefore surely most intensein the Netherlands. [Fig. 2, tab. A1]
AWARENESS OF IGC
38
15
40
31 3127 29
22 21 2023 22
19 19 21 20
5047 45 44
41 40 3935 34 33 32 32 31 30
27 27
DK NL FIN P A F S EU15 D I IRL L E UK GR B0
20
40
60
80
100%
% Have heard about IGC in May/June 1996 % Have heard about IGC in May/June 1997
EUROPEAN COMMISSIONDG X.A.2. - PUBLIC OPINION SURVEYS AND RESEARCH
FIG. 2CONTINUOUS TRACKING SURVEY 96.06 and 97.06 (Sample : 800 / country)
OPINION ON INSTITUTIONAL REFORM III EUROPINION (SPECIAL)4
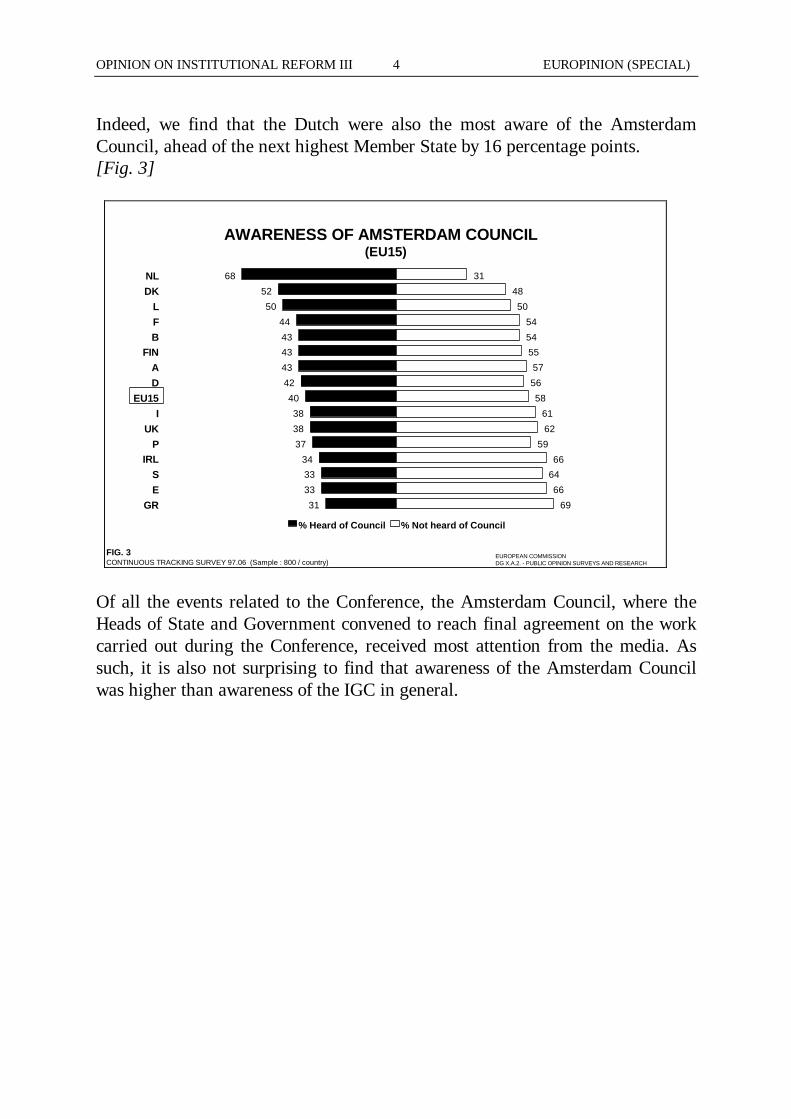
Indeed, we find that the Dutch were also the most aware of the AmsterdamCouncil, ahead of the next highest Member State by 16 percentage points.[Fig. 3]
AWARENESS OF AMSTERDAM COUNCIL
68
52
50
44
4343
43
42
40
38
38
37
3433
33
31
31
48
50
54
5455
57
56
58
61
62
59
6664
66
69
NLDK
LFB
FINAD
EU15I
UKP
IRLSE
GR
% Heard of Council % Not heard of Council
EUROPEAN COMMISSIONDG X.A.2. - PUBLIC OPINION SURVEYS AND RESEARCH
FIG. 3CONTINUOUS TRACKING SURVEY 97.06 (Sample : 800 / country)
(EU15)
Of all the events related to the Conference, the Amsterdam Council, where theHeads of State and Government convened to reach final agreement on the workcarried out during the Conference, received most attention from the media. Assuch, it is also not surprising to find that awareness of the Amsterdam Councilwas higher than awareness of the IGC in general.
OPINION ON INSTITUTIONAL REFORM III EUROPINION (SPECIAL)5
2. Information and openness
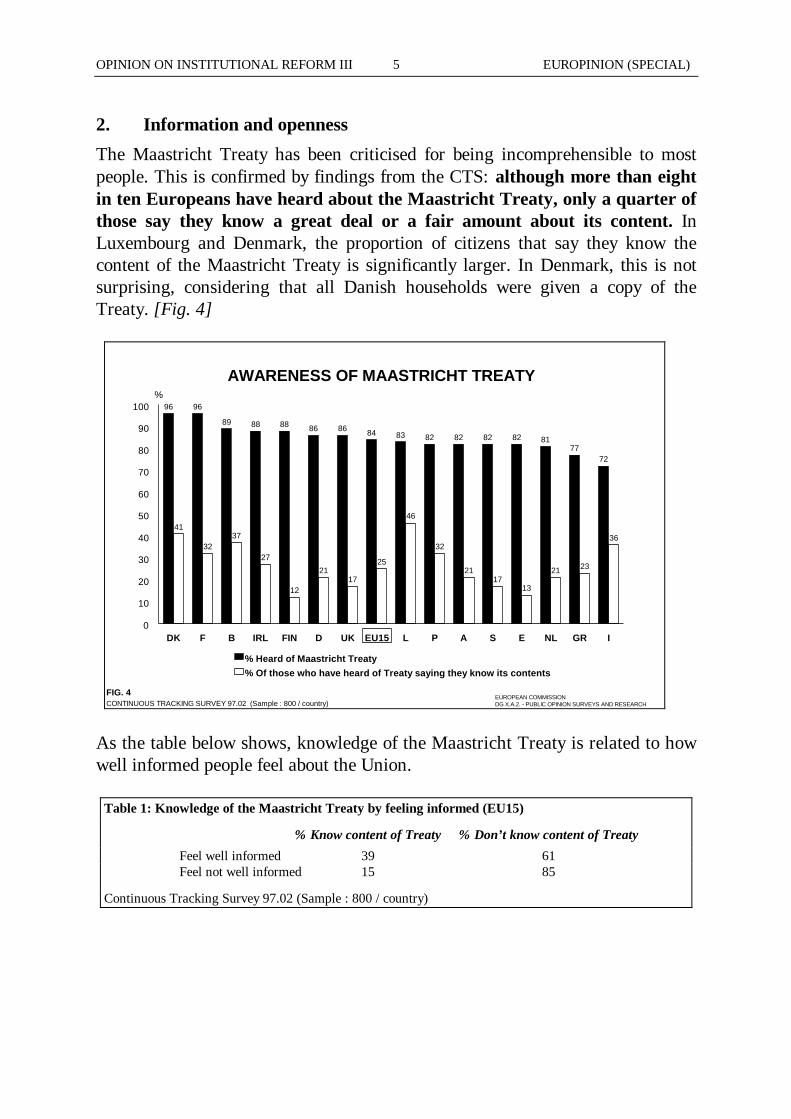
The Maastricht Treaty has been criticised for being incomprehensible to mostpeople. This is confirmed by findings from the CTS: although more than eightin ten Europeans have heard about the Maastricht Treaty, only a quarter ofthose say they know a great deal or a fair amount about its content. InLuxembourg and Denmark, the proportion of citizens that say they know thecontent of the Maastricht Treaty is significantly larger. In Denmark, this is notsurprising, considering that all Danish households were given a copy of theTreaty. [Fig. 4]
AWARENESS OF MAASTRICHT TREATY
96 96
89 88 88 86 86 84 83 82 82 82 82 8177
72
41
3237
27
12
2117
25
46
32
2117
13
21 23
36
DK F B IRL FIN D UK EU15 L P A S E NL GR I0
10
20
30
40
50
60
70
80
90
100
% Heard of Maastricht Treaty% Of those who have heard of Treaty saying they know its contents
EUROPEAN COMMISSIONDG X.A.2. - PUBLIC OPINION SURVEYS AND RESEARCH
FIG. 4CONTINUOUS TRACKING SURVEY 97.02 (Sample : 800 / country)
%
As the table below shows, knowledge of the Maastricht Treaty is related to howwell informed people feel about the Union.
Table 1: Knowledge of the Maastricht Treaty by feeling informed (EU15)
% Know content of Treaty % Don’t know content of Treaty
Feel well informed 39 61Feel not well informed 15 85
Continuous Tracking Survey 97.02 (Sample : 800 / country)
OPINION ON INSTITUTIONAL REFORM III EUROPINION (SPECIAL)6
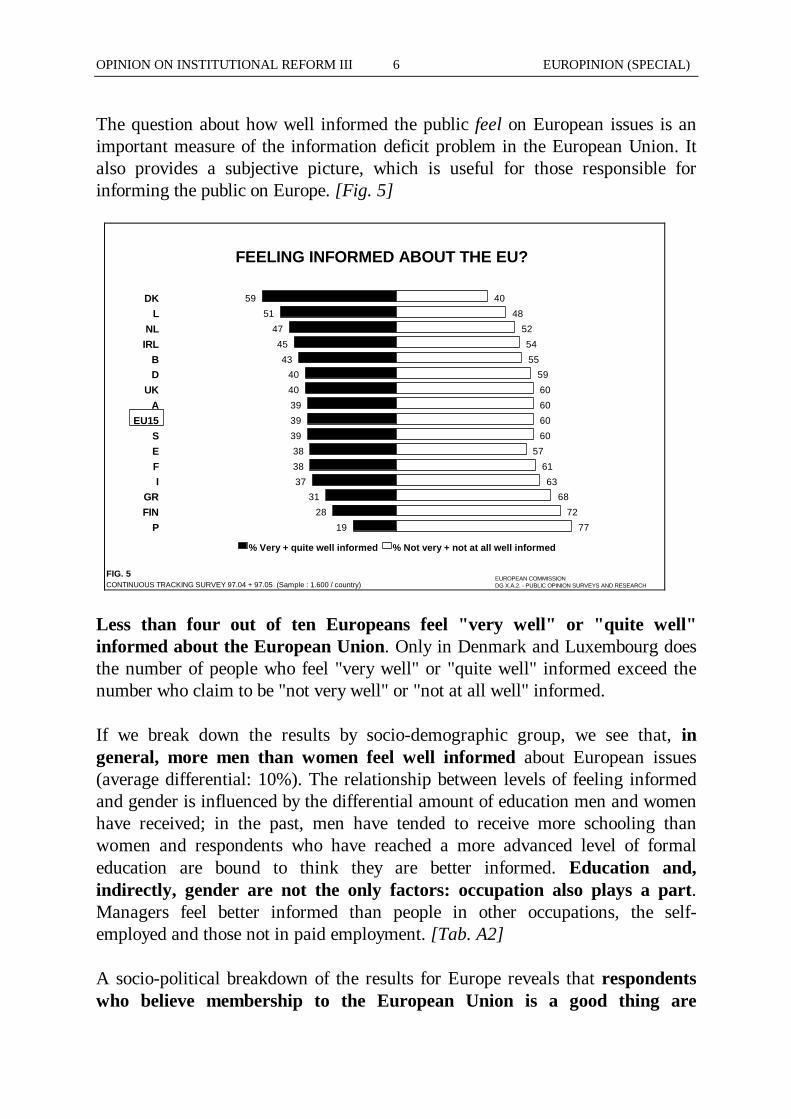
The question about how well informed the public feel on European issues is animportant measure of the information deficit problem in the European Union. Italso provides a subjective picture, which is useful for those responsible forinforming the public on Europe. [Fig. 5]
FEELING INFORMED ABOUT THE EU?
59
51
47
45
4340
40
39
39
39
38
38
3731
28
19
40
48
52
54
5559
60
60
60
60
57
61
6368
72
77
DKL
NLIRL
BD
UKA
EU15SEFI
GRFIN
P
% Very + quite well informed % Not very + not at all well informed
EUROPEAN COMMISSIONDG X.A.2. - PUBLIC OPINION SURVEYS AND RESEARCH
FIG. 5CONTINUOUS TRACKING SURVEY 97.04 + 97.05 (Sample : 1.600 / country)
Less than four out of ten Europeans feel "very well" or "quite well"informed about the European Union. Only in Denmark and Luxembourg doesthe number of people who feel "very well" or "quite well" informed exceed thenumber who claim to be "not very well" or "not at all well" informed.
If we break down the results by socio-demographic group, we see that, ingeneral, more men than women feel well informed about European issues(average differential: 10%). The relationship between levels of feeling informedand gender is influenced by the differential amount of education men and womenhave received; in the past, men have tended to receive more schooling thanwomen and respondents who have reached a more advanced level of formaleducation are bound to think they are better informed. Education and,indirectly, gender are not the only factors: occupation also plays a part.Managers feel better informed than people in other occupations, the self-employed and those not in paid employment. [Tab. A2]
A socio-political breakdown of the results for Europe reveals that respondentswho believe membership to the European Union is a good thing are
OPINION ON INSTITUTIONAL REFORM III EUROPINION (SPECIAL)7
significantly more likely to feel well informed than respondents who viewmembership as a bad thing. People with no opinion, however, are the leastlikely to feel well informed. Lastly, people who refuse to define themselvespolitically feel significantly less well informed than those who do definethemselves (as left, centre or right). [Tab. A3]
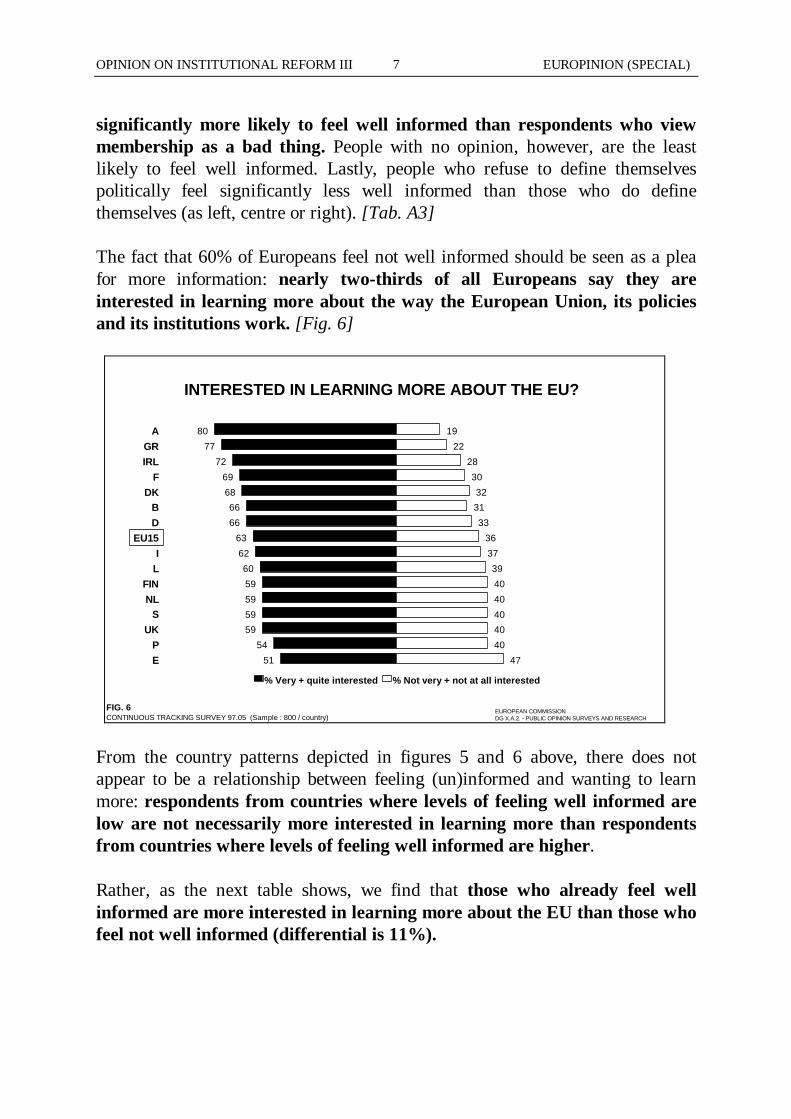
The fact that 60% of Europeans feel not well informed should be seen as a pleafor more information: nearly two-thirds of all Europeans say they areinterested in learning more about the way the European Union, its policiesand its institutions work. [Fig. 6]
INTERESTED IN LEARNING MORE ABOUT THE EU?
80
77
72
69
6866
66
63
62
60
59
59
5959
54
51
19
22
28
30
3231
33
36
37
39
40
40
4040
40
47
AGRIRL
FDK
BD
EU15I
LFINNL
SUK
PE
% Very + quite interested % Not very + not at all interested
EUROPEAN COMMISSIONDG X.A.2. - PUBLIC OPINION SURVEYS AND RESEARCH
FIG. 6CONTINUOUS TRACKING SURVEY 97.05 (Sample : 800 / country)
From the country patterns depicted in figures 5 and 6 above, there does notappear to be a relationship between feeling (un)informed and wanting to learnmore: respondents from countries where levels of feeling well informed arelow are not necessarily more interested in learning more than respondentsfrom countries where levels of feeling well informed are higher.
Rather, as the next table shows, we find that those who already feel wellinformed are more interested in learning more about the EU than those whofeel not well informed (differential is 11%).
OPINION ON INSTITUTIONAL REFORM III EUROPINION (SPECIAL)8
Table 2: Desire to learn more about the European Union (EU15)
% Interested in % Not interested inlearning more learning more
Feel well informed 70 29Feel not well informed 59 40
Membership good thing 73 26Membership bad thing 50 49
Continuous Tracking Survey 97.05 (Sample : 800 / country)
Again we find the largest differences between those who believe membership tothe EU is a good thing and those who believe membership is a bad thing(differential is 23%). People’s attitude towards EU membership proves to bestrongly related to how people feel about many other EU issues.
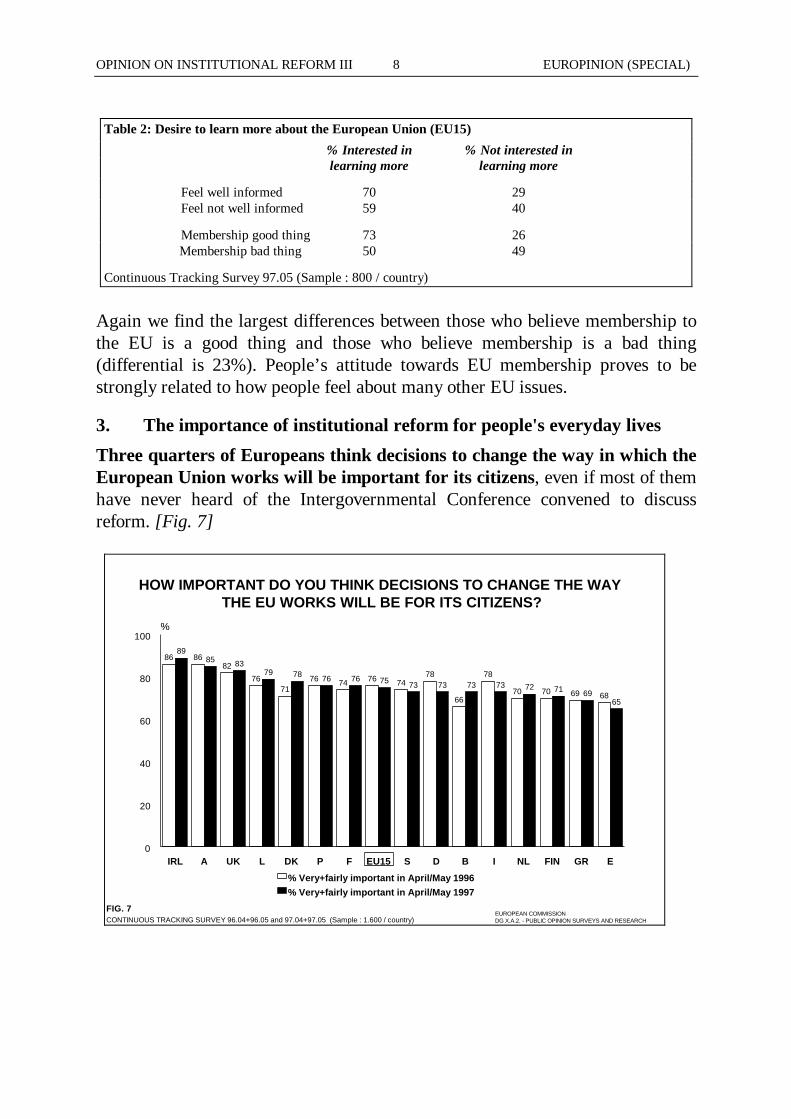
3. The importance of institutional reform for people's everyday lives
Three quarters of Europeans think decisions to change the way in which theEuropean Union works will be important for its citizens, even if most of themhave never heard of the Intergovernmental Conference convened to discussreform. [Fig. 7]
86 8682
7671
76 74 76 7478
66
78
70 70 69 68
8985 83
79 78 76 76 75 73 73 73 73 72 71 6965
IRL A UK L DK P F EU15 S D B I NL FIN GR E0
20
40
60
80
100%
% Very+fairly important in April/May 1996% Very+fairly important in April/May 1997
EUROPEAN COMMISSIONDG X.A.2. - PUBLIC OPINION SURVEYS AND RESEARCH
FIG. 7CONTINUOUS TRACKING SURVEY 96.04+96.05 and 97.04+97.05 (Sample : 1.600 / country)
HOW IMPORTANT DO YOU THINK DECISIONS TO CHANGE THE WAYTHE EU WORKS WILL BE FOR ITS CITIZENS?
OPINION ON INSTITUTIONAL REFORM III EUROPINION (SPECIAL)9
A comparison of the results from April/May 1997 with those obtained a yearearlier shows very little change both in the measurement level and in the countrypattern during the course of the Conference. In Ireland, the percentage of thosesaying “very” or “fairly” important is still the highest. Austria still comes secondand the UK third while it is still lowest in Spain, Greece and Finland. The onlyreal shifts are noted in Denmark and Belgium, where the proportion of peoplebelieving that decisions will be important for citizens has increased, and inGermany and Italy, where the proportion has decreased.
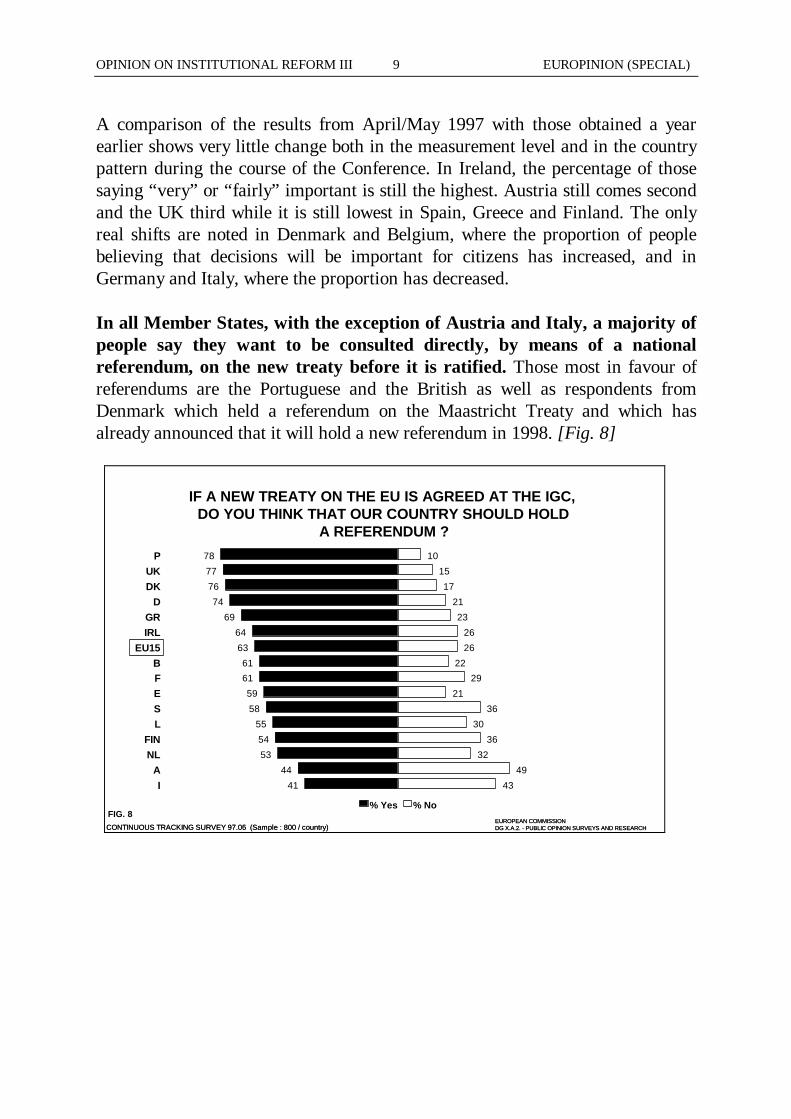
In all Member States, with the exception of Austria and Italy, a majority ofpeople say they want to be consulted directly, by means of a nationalreferendum, on the new treaty before it is ratified. Those most in favour ofreferendums are the Portuguese and the British as well as respondents fromDenmark which held a referendum on the Maastricht Treaty and which hasalready announced that it will hold a new referendum in 1998. [Fig. 8]
EUROPEAN COMMISSIONDG X.A.2. - PUBLIC OPINION SURVEYS AND RESEARCH
IF A NEW TREATY ON THE EU IS AGREED AT THE IGC, DO YOU THINK THAT OUR COUNTRY SHOULD HOLD
A REFERENDUM ?
CONTINUOUS TRACKING SURVEY 97.06 (Sample : 800 / country)
78
77
76
74
69
64
63
6161
59
58
55
54
53
44
41
10
15
17
21
23
26
26
2229
21
36
30
36
32
49
43
PUKDK
DGRIRL
EU15BFESL
FINNL
AI
% Yes % NoEUROPEAN COMMISSIONDG X.A.2. - PUBLIC OPINION SURVEYS AND RESEARCH
FIG. 8CONTINUOUS TRACKING SURVEY 97.05 (Sample : 800 / country)
OPINION ON INSTITUTIONAL REFORM III EUROPINION (SPECIAL)10
4. Support for a stronger Union
The European public clearly wants to be involved in the process of reforming theUnion but what does the public think about the aim to strengthen the Union?
Nearly three-quarters of the European public think their nationalgovernments are willing to reinforce the integration of their country in theEuropean Union. In Ireland, Germany and the Netherlands, the perceivedwillingness of the government is highest while in the UK and Sweden it is thelowest. These two groups of countries happen to also be the countries wheresupport for membership to the Union is above the European average (Ireland,Germany and the Netherlands) and below the European average (Sweden andUK). [Tabs. A4 and A6]
Around two in three Europeans are personally willing to have theirgovernment make arrangements to reinforce the integration of their countryin the European Union. Again, those who live in countries where a higher thanaverage proportion of people believes that membership to the European Union isa good thing are more likely to be personally willing to have their governmentmake arrangements (or vice-versa) than those from countries where attitudestowards the European Union are more negative. [Tabs. A5 and A6]
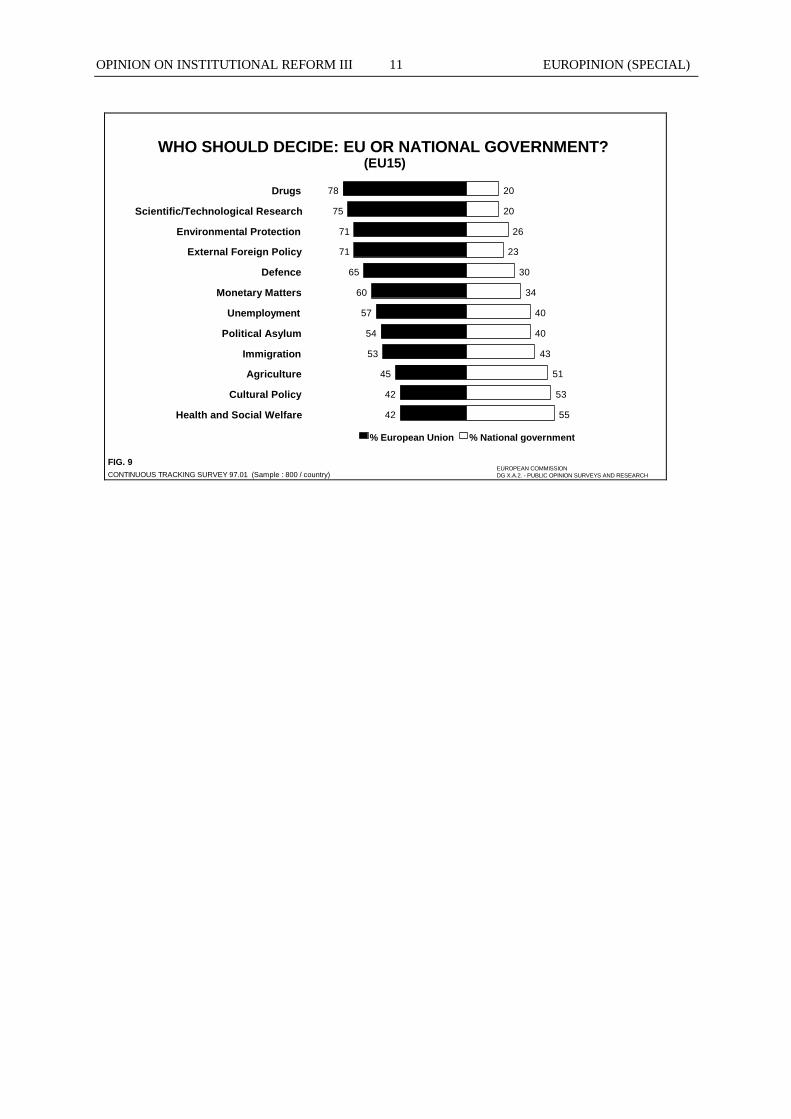
The CTS also measures whether people believe various policy areas should bedecided by their national government or jointly within the European Union.
According to a large majority of Europeans, areas where the sovereignty ofcountries is not directly affected should be decided by the EU. The majorityof Europeans also thinks the EU should take decisions about external foreignpolicy and defence, indicating that many Europeans believe that the role ofthe EU should be to protect its citizens against outside threats. Support is lesspronounced for areas that affect the political or economic situation of nations.Less than half of Europeans want decisions concerning health and socialwelfare and culture to be taken jointly within the EU. [Fig. 9]
OPINION ON INSTITUTIONAL REFORM III EUROPINION (SPECIAL)11
(EU15)WHO SHOULD DECIDE: EU OR NATIONAL GOVERNMENT?
78
75
71
71
65
60
57
54
53
45
42
42
20
20
26
23
30
34
40
40
43
51
53
55
Drugs
Scientific/Technological Research
Environmental Protection
External Foreign Policy
Defence
Monetary Matters
Unemployment
Political Asylum
Immigration
Agriculture
Cultural Policy
Health and Social Welfare
% European Union % National government
EUROPEAN COMMISSIONDG X.A.2. - PUBLIC OPINION SURVEYS AND RESEARCH
FIG. 9CONTINUOUS TRACKING SURVEY 97.01 (Sample : 800 / country)
OPINION ON INSTITUTIONAL REFORM III EUROPINION (SPECIAL)12
II. SUPPORT FOR IGC ISSUES
During the Intergovernmental Conference, the Heads of State and Government ofthe fifteen Member States, and all the other officials involved in the IGC talks,discussed numerous proposals to change the way the European Union works.
1. Flexibility
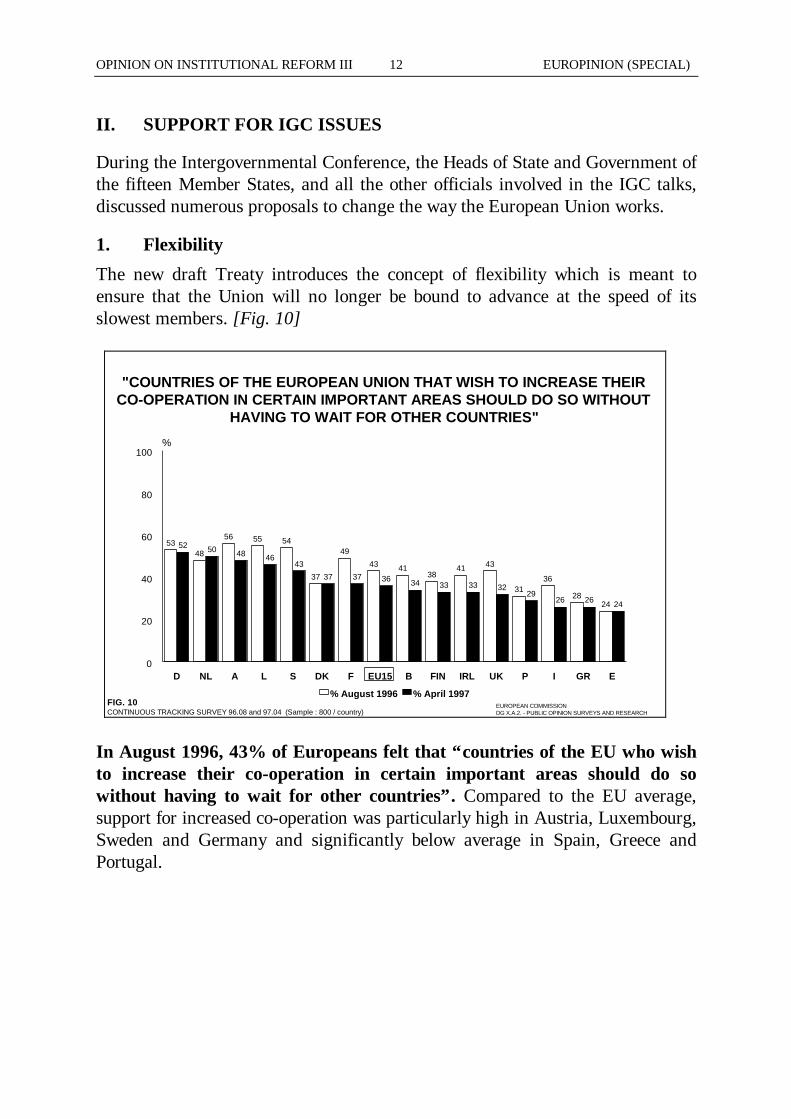
The new draft Treaty introduces the concept of flexibility which is meant toensure that the Union will no longer be bound to advance at the speed of itsslowest members. [Fig. 10]
"COUNTRIES OF THE EUROPEAN UNION THAT WISH TO INCREASE THEIR CO-OPERATION IN CERTAIN IMPORTANT AREAS SHOULD DO SO WITHOUT
HAVING TO WAIT FOR OTHER COUNTRIES"
5348
56 55 54
37
49
43 4138
41 43
3136
2824
52 50 48 4643
37 37 36 34 33 33 3229
26 26 24
D NL A L S DK F EU15 B FIN IRL UK P I GR E0
20
40
60
80
100%
% August 1996 % April 1997EUROPEAN COMMISSIONDG X.A.2. - PUBLIC OPINION SURVEYS AND RESEARCH
FIG. 10CONTINUOUS TRACKING SURVEY 96.08 and 97.04 (Sample : 800 / country)
In August 1996, 43% of Europeans felt that “countries of the EU who wishto increase their co-operation in certain important areas should do sowithout having to wait for other countries”. Compared to the EU average,support for increased co-operation was particularly high in Austria, Luxembourg,Sweden and Germany and significantly below average in Spain, Greece andPortugal.
OPINION ON INSTITUTIONAL REFORM III EUROPINION (SPECIAL)13
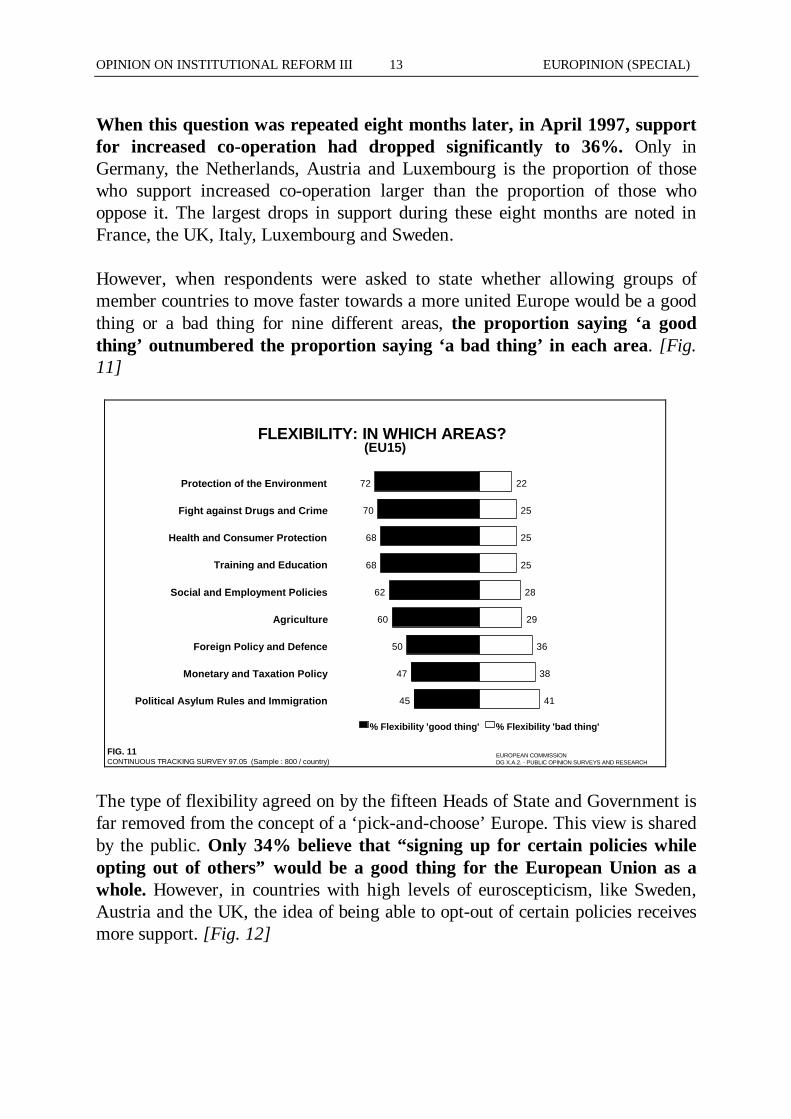
When this question was repeated eight months later, in April 1997, supportfor increased co-operation had dropped significantly to 36%. Only inGermany, the Netherlands, Austria and Luxembourg is the proportion of thosewho support increased co-operation larger than the proportion of those whooppose it. The largest drops in support during these eight months are noted inFrance, the UK, Italy, Luxembourg and Sweden.
However, when respondents were asked to state whether allowing groups ofmember countries to move faster towards a more united Europe would be a goodthing or a bad thing for nine different areas, the proportion saying ‘a goodthing’ outnumbered the proportion saying ‘a bad thing’ in each area. [Fig.11]
(EU15)FLEXIBILITY: IN WHICH AREAS?
72
70
68
68
62
60
50
47
45
22
25
25
25
28
29
36
38
41
Protection of the Environment
Fight against Drugs and Crime
Health and Consumer Protection
Training and Education
Social and Employment Policies
Agriculture
Foreign Policy and Defence
Monetary and Taxation Policy
Political Asylum Rules and Immigration
% Flexibility 'good thing' % Flexibility 'bad thing'
EUROPEAN COMMISSIONDG X.A.2. - PUBLIC OPINION SURVEYS AND RESEARCH
FIG. 11CONTINUOUS TRACKING SURVEY 97.05 (Sample : 800 / country)
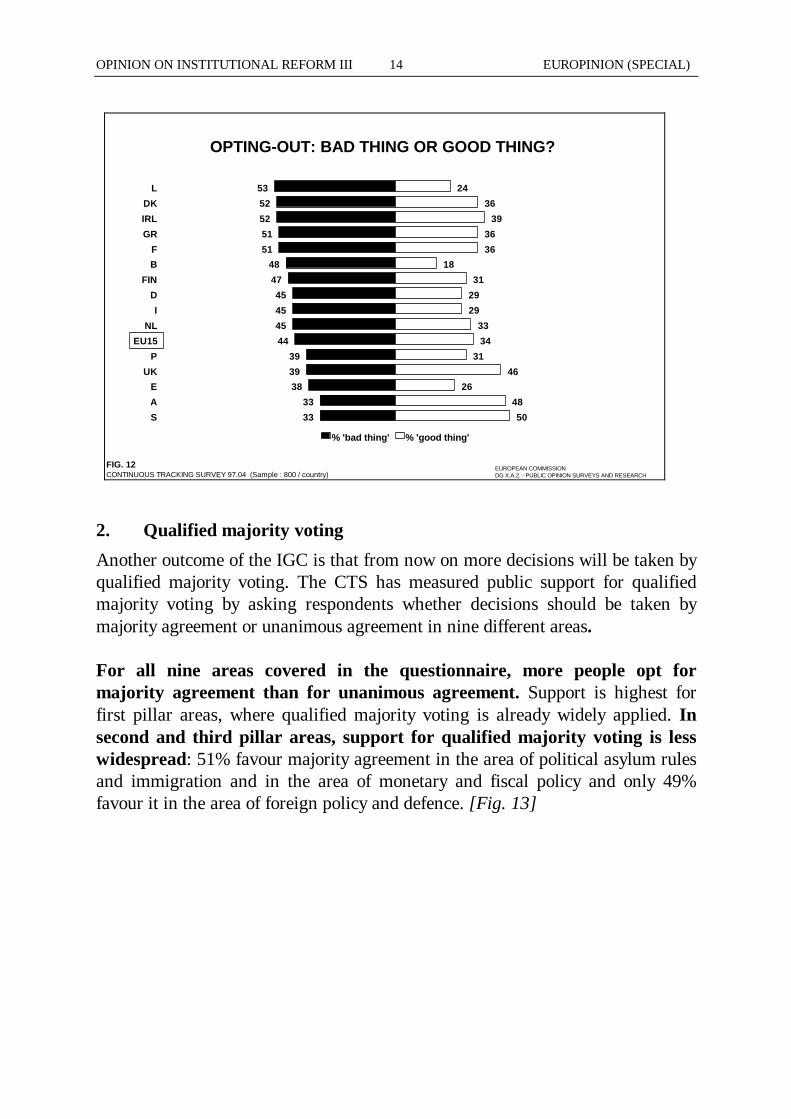
The type of flexibility agreed on by the fifteen Heads of State and Government isfar removed from the concept of a ‘pick-and-choose’ Europe. This view is sharedby the public. Only 34% believe that “signing up for certain policies whileopting out of others” would be a good thing for the European Union as awhole. However, in countries with high levels of euroscepticism, like Sweden,Austria and the UK, the idea of being able to opt-out of certain policies receivesmore support. [Fig. 12]
OPINION ON INSTITUTIONAL REFORM III EUROPINION (SPECIAL)14
OPTING-OUT: BAD THING OR GOOD THING?
53
52
52
51
5148
47
45
45
45
44
39
3938
33
33
24
36
39
36
3618
31
29
29
33
34
31
4626
48
50
L
DK
IRL
GR
FB
FIN
D
I
NL
EU15
P
UKE
A
S
% 'bad thing' % 'good thing'
EUROPEAN COMMISSIONDG X.A.2. - PUBLIC OPINION SURVEYS AND RESEARCH
FIG. 12CONTINUOUS TRACKING SURVEY 97.04 (Sample : 800 / country)
2. Qualified majority voting
Another outcome of the IGC is that from now on more decisions will be taken byqualified majority voting. The CTS has measured public support for qualifiedmajority voting by asking respondents whether decisions should be taken bymajority agreement or unanimous agreement in nine different areas.
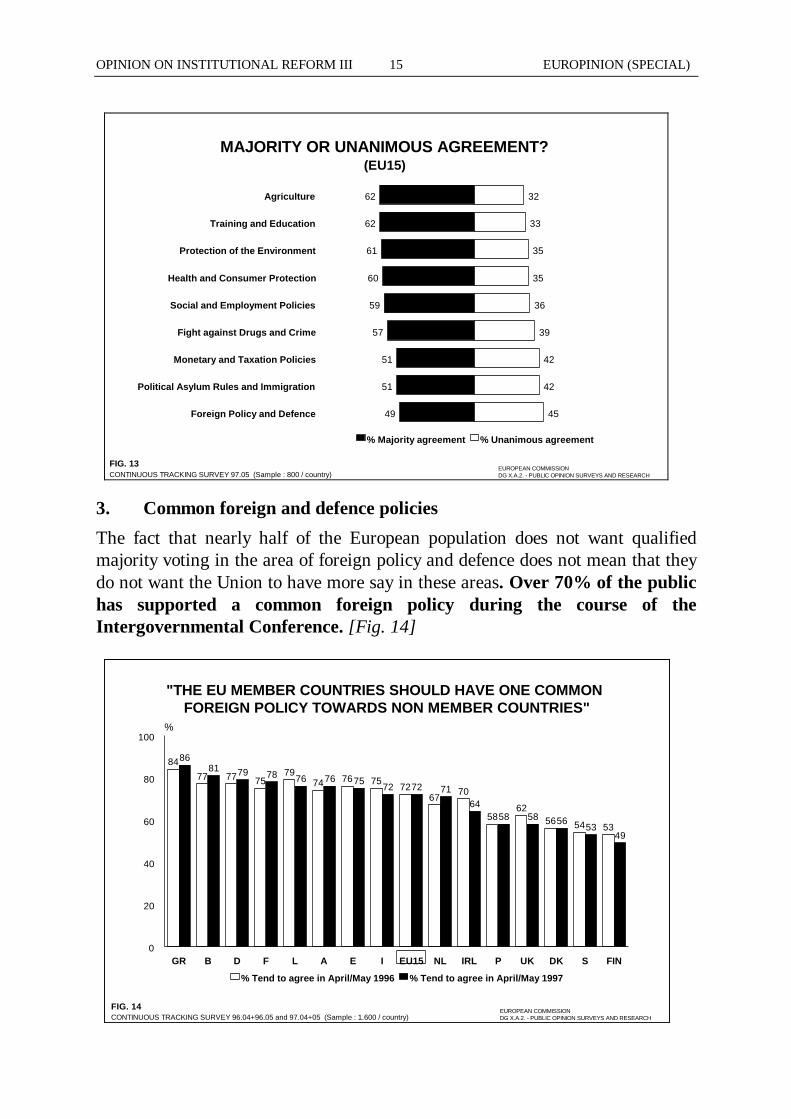
For all nine areas covered in the questionnaire, more people opt formajority agreement than for unanimous agreement. Support is highest forfirst pillar areas, where qualified majority voting is already widely applied. Insecond and third pillar areas, support for qualified majority voting is lesswidespread: 51% favour majority agreement in the area of political asylum rulesand immigration and in the area of monetary and fiscal policy and only 49%favour it in the area of foreign policy and defence. [Fig. 13]
OPINION ON INSTITUTIONAL REFORM III EUROPINION (SPECIAL)15
(EU15)MAJORITY OR UNANIMOUS AGREEMENT?
62
62
61
60
59
57
51
51
49
32
33
35
35
36
39
42
42
45
Agriculture
Training and Education
Protection of the Environment
Health and Consumer Protection
Social and Employment Policies
Fight against Drugs and Crime
Monetary and Taxation Policies
Political Asylum Rules and Immigration
Foreign Policy and Defence
% Majority agreement % Unanimous agreement
EUROPEAN COMMISSIONDG X.A.2. - PUBLIC OPINION SURVEYS AND RESEARCH
FIG. 13CONTINUOUS TRACKING SURVEY 97.05 (Sample : 800 / country)
3. Common foreign and defence policies
The fact that nearly half of the European population does not want qualifiedmajority voting in the area of foreign policy and defence does not mean that theydo not want the Union to have more say in these areas. Over 70% of the publichas supported a common foreign policy during the course of theIntergovernmental Conference. [Fig. 14]
"THE EU MEMBER COUNTRIES SHOULD HAVE ONE COMMON FOREIGN POLICY TOWARDS NON MEMBER COUNTRIES"
8477 77 75
7974 76 75
7267
70
5862
56 54 53
8681 79 78 76 76 75
72 72 7164
58 58 5653
49
GR B D F L A E I EU15 NL IRL P UK DK S FIN0
20
40
60
80
100%
% Tend to agree in April/May 1996 % Tend to agree in April/May 1997
EUROPEAN COMMISSIONDG X.A.2. - PUBLIC OPINION SURVEYS AND RESEARCH
FIG. 14CONTINUOUS TRACKING SURVEY 96.04+96.05 and 97.04+05 (Sample : 1.600 / country)
OPINION ON INSTITUTIONAL REFORM III EUROPINION (SPECIAL)16
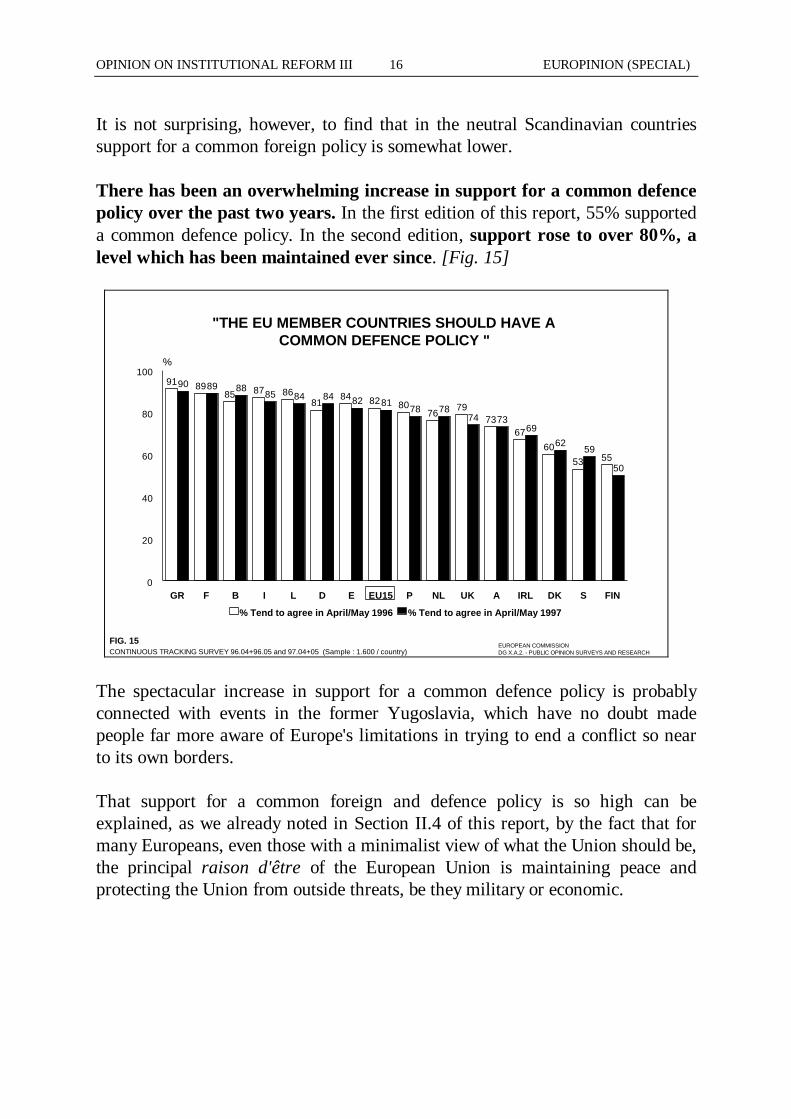
It is not surprising, however, to find that in the neutral Scandinavian countriessupport for a common foreign policy is somewhat lower.
There has been an overwhelming increase in support for a common defencepolicy over the past two years. In the first edition of this report, 55% supporteda common defence policy. In the second edition, support rose to over 80%, alevel which has been maintained ever since. [Fig. 15]
91 8985 87 86
8184 82 80
7679
7367
6053 55
90 89 8885 84 84 82 81
78 7874 73
6962
59
50
GR F B I L D E EU15 P NL UK A IRL DK S FIN0
20
40
60
80
100%
% Tend to agree in April/May 1996 % Tend to agree in April/May 1997
EUROPEAN COMMISSIONDG X.A.2. - PUBLIC OPINION SURVEYS AND RESEARCH
FIG. 15CONTINUOUS TRACKING SURVEY 96.04+96.05 and 97.04+05 (Sample : 1.600 / country)
"THE EU MEMBER COUNTRIES SHOULD HAVE ACOMMON DEFENCE POLICY "
The spectacular increase in support for a common defence policy is probablyconnected with events in the former Yugoslavia, which have no doubt madepeople far more aware of Europe's limitations in trying to end a conflict so nearto its own borders.
That support for a common foreign and defence policy is so high can beexplained, as we already noted in Section II.4 of this report, by the fact that formany Europeans, even those with a minimalist view of what the Union should be,the principal raison d'être of the European Union is maintaining peace andprotecting the Union from outside threats, be they military or economic.
OPINION ON INSTITUTIONAL REFORM III EUROPINION (SPECIAL)17
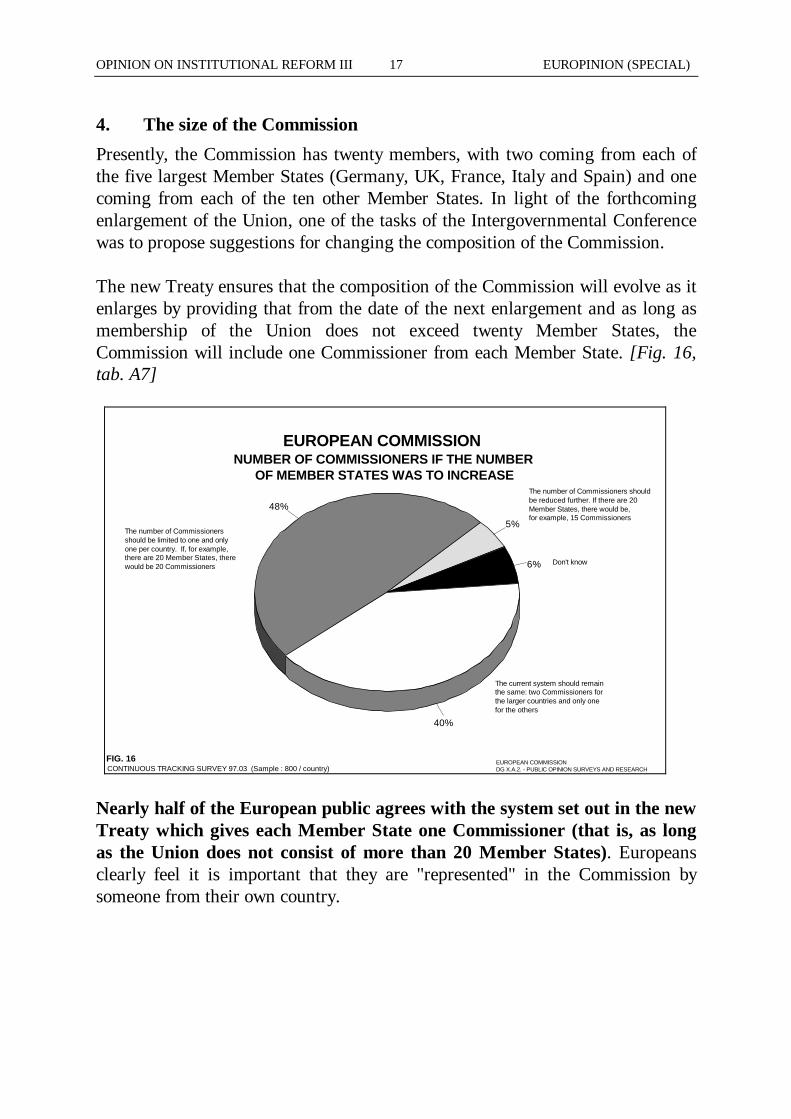
4. The size of the Commission
Presently, the Commission has twenty members, with two coming from each ofthe five largest Member States (Germany, UK, France, Italy and Spain) and onecoming from each of the ten other Member States. In light of the forthcomingenlargement of the Union, one of the tasks of the Intergovernmental Conferencewas to propose suggestions for changing the composition of the Commission.
The new Treaty ensures that the composition of the Commission will evolve as itenlarges by providing that from the date of the next enlargement and as long asmembership of the Union does not exceed twenty Member States, theCommission will include one Commissioner from each Member State. [Fig. 16,tab. A7]
EUROPEAN COMMISSIONNUMBER OF COMMISSIONERS IF THE NUMBER
OF MEMBER STATES WAS TO INCREASE
48%
40%
6%
5%
FIG. 16CONTINUOUS TRACKING SURVEY 97.03 (Sample : 800 / country)
EUROPEAN COMMISSIONDG X.A.2. - PUBLIC OPINION SURVEYS AND RESEARCH
The number of Commissionersshould be limited to one and onlyone per country. If, for example,there are 20 Member States, therewould be 20 Commissioners
The number of Commissioners shouldbe reduced further. If there are 20Member States, there would be,for example, 15 Commissioners
Don't know
The current system should remainthe same: two Commissioners forthe larger countries and only onefor the others
Nearly half of the European public agrees with the system set out in the newTreaty which gives each Member State one Commissioner (that is, as longas the Union does not consist of more than 20 Member States). Europeansclearly feel it is important that they are "represented" in the Commission bysomeone from their own country.
OPINION ON INSTITUTIONAL REFORM III EUROPINION (SPECIAL)18
Two in five Europeans prefer maintaining the status quo. It is hardlysurprising that the highest proportions in favour of keeping the current system arefound in the countries which currently have two Commissioners. If we comparethe current figures with those from April 1996, we see that support for the statusquo has increased significantly in two of these countries (Italy: +13%; Germany:+9%). Only 5% of the European public want the number of Commissionersto be reduced even further, a scenario which implies that some countrieswould not have a Commissioner at all.
5. Weighting of votes in the Council
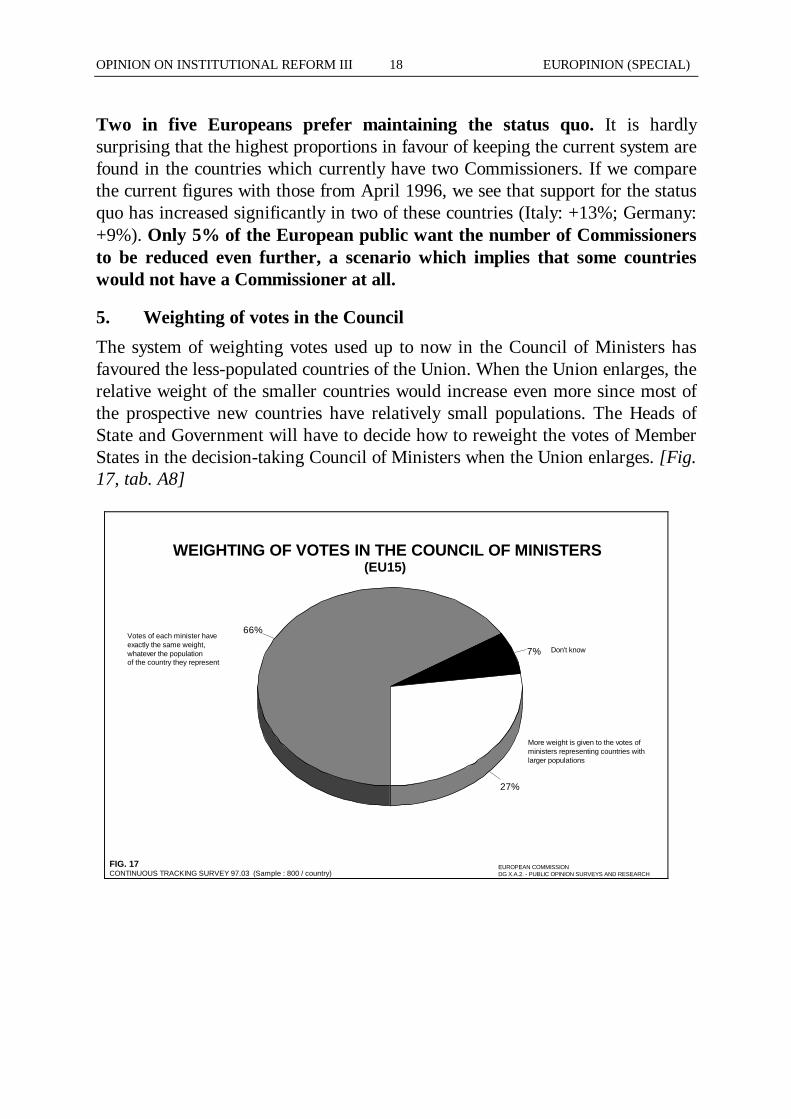
The system of weighting votes used up to now in the Council of Ministers hasfavoured the less-populated countries of the Union. When the Union enlarges, therelative weight of the smaller countries would increase even more since most ofthe prospective new countries have relatively small populations. The Heads ofState and Government will have to decide how to reweight the votes of MemberStates in the decision-taking Council of Ministers when the Union enlarges. [Fig.17, tab. A8]
WEIGHTING OF VOTES IN THE COUNCIL OF MINISTERS
27%
7%
66%
FIG. 17CONTINUOUS TRACKING SURVEY 97.03 (Sample : 800 / country)
EUROPEAN COMMISSIONDG X.A.2. - PUBLIC OPINION SURVEYS AND RESEARCH
Votes of each minister haveexactly the same weight,whatever the populationof the country they represent
Don't know
More weight is given to the votes ofministers representing countries withlarger populations
(EU15)
OPINION ON INSTITUTIONAL REFORM III EUROPINION (SPECIAL)19
Two in three respondents, however, feel that the votes of each ministershould have exactly the same weight, whatever the population of the countrythey represent. The ‘one state, one vote’ principle is supported by largemajorities in fourteen of the fifteen Member States. The sole exception – and notwithout reason – is Germany, whose population accounts for around one fifth ofthe Union's total population. On average, only 27% prefer that more weight isgiven to the votes of ministers representing larger populations.
6. Employment
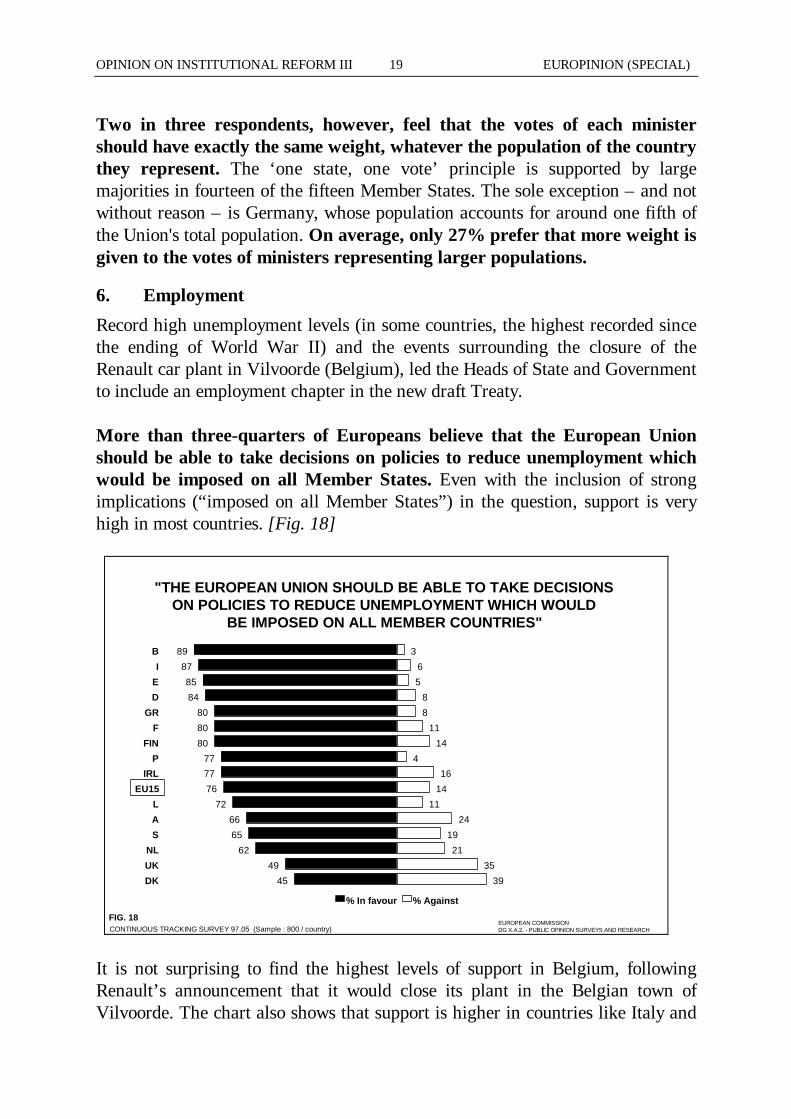
Record high unemployment levels (in some countries, the highest recorded sincethe ending of World War II) and the events surrounding the closure of theRenault car plant in Vilvoorde (Belgium), led the Heads of State and Governmentto include an employment chapter in the new draft Treaty.
More than three-quarters of Europeans believe that the European Unionshould be able to take decisions on policies to reduce unemployment whichwould be imposed on all Member States. Even with the inclusion of strongimplications (“imposed on all Member States”) in the question, support is veryhigh in most countries. [Fig. 18]
EUROPEAN COMMISSIONDG X.A.2. - PUBLIC OPINION SURVEYS AND RESEARCH
FIG. 18CONTINUOUS TRACKING SURVEY 97.05 (Sample : 800 / country)
"THE EUROPEAN UNION SHOULD BE ABLE TO TAKE DECISIONSON POLICIES TO REDUCE UNEMPLOYMENT WHICH WOULD
BE IMPOSED ON ALL MEMBER COUNTRIES"
89
87
85
84
80
80
80
7777
76
72
66
65
62
49
45
3
6
5
8
8
11
14
416
14
11
24
19
21
35
39
B
I
E
D
GR
F
FIN
PIRL
EU15
L
A
S
NL
UK
DK
% In favour % Against
It is not surprising to find the highest levels of support in Belgium, followingRenault’s announcement that it would close its plant in the Belgian town ofVilvoorde. The chart also shows that support is higher in countries like Italy and
OPINION ON INSTITUTIONAL REFORM III EUROPINION (SPECIAL)20
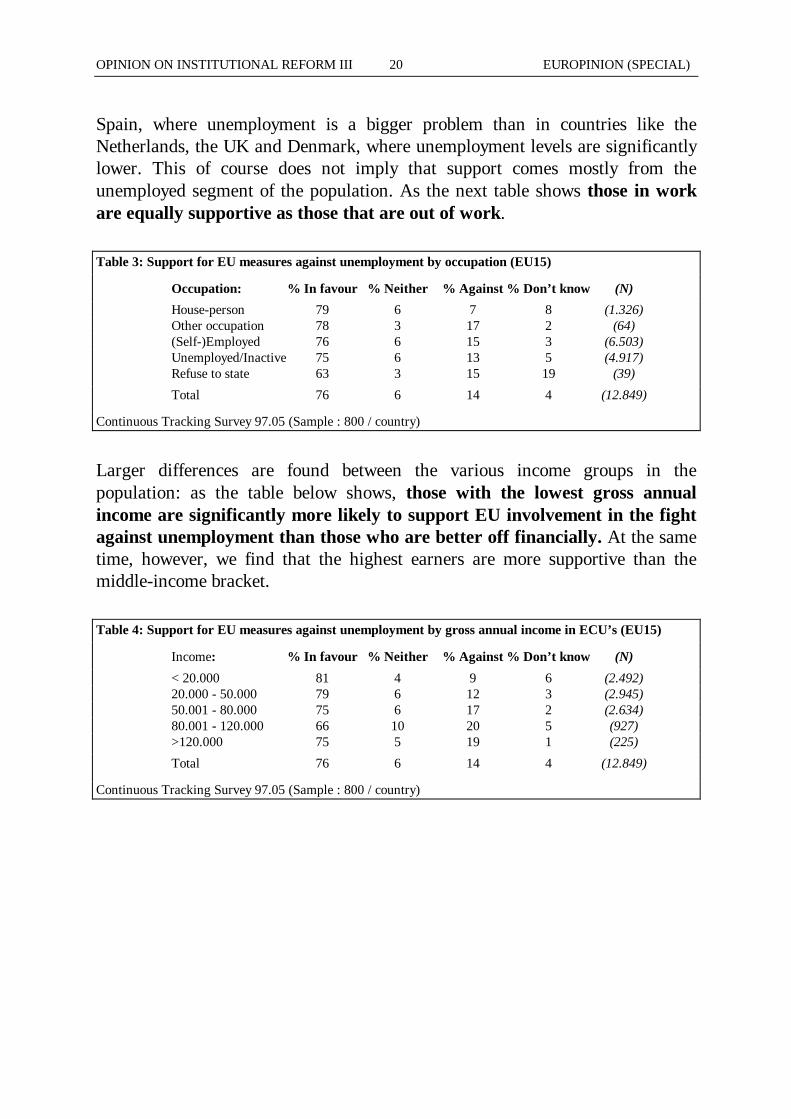
Spain, where unemployment is a bigger problem than in countries like theNetherlands, the UK and Denmark, where unemployment levels are significantlylower. This of course does not imply that support comes mostly from theunemployed segment of the population. As the next table shows those in workare equally supportive as those that are out of work.
Table 3: Support for EU measures against unemployment by occupation (EU15)
Occupation: % In favour % Neither % Against % Don’t know (N)
House-person 79 6 7 8 (1.326)Other occupation 78 3 17 2 (64)(Self-)Employed 76 6 15 3 (6.503)Unemployed/Inactive 75 6 13 5 (4.917)Refuse to state 63 3 15 19 (39)
Total 76 6 14 4 (12.849)
Continuous Tracking Survey 97.05 (Sample : 800 / country)
Larger differences are found between the various income groups in thepopulation: as the table below shows, those with the lowest gross annualincome are significantly more likely to support EU involvement in the fightagainst unemployment than those who are better off financially. At the sametime, however, we find that the highest earners are more supportive than themiddle-income bracket.
Table 4: Support for EU measures against unemployment by gross annual income in ECU’s (EU15)
Income: % In favour % Neither % Against % Don’t know (N)
< 20.000 81 4 9 6 (2.492)20.000 - 50.000 79 6 12 3 (2.945)50.001 - 80.000 75 6 17 2 (2.634)80.001 - 120.000 66 10 20 5 (927)>120.000 75 5 19 1 (225)
Total 76 6 14 4 (12.849)
Continuous Tracking Survey 97.05 (Sample : 800 / country)
OPINION ON INSTITUTIONAL REFORM III EUROPINION (SPECIAL)21
Again we note the importance of people’s core feelings about the EU:respondents with more positive views towards Europe (i.e. those who thinktheir country’s membership to the EU is a good thing and those who believe theircountry has benefited from membership) are significantly more likely tosupport the EU’s involvement in the fight against unemployment than thosewith more negative views towards Europe.
Table 5: Support for EU measures against unemployment by various attitudes towards EU (EU15)
% In favour % Neither % Against % Don’t know (N)
Membership:Good thing 82 5 9 3 (7.406)Neither good nor bad 74 8 14 4 (2.822)Bad thing 59 6 30 5 (1.796)No opinion 69 6 11 15 (825)
EU beneficial:Country benefited 79 6 11 4 (6.280)Country not benefited 73 5 18 4 (4.555)No opinion 72 8 11 9 (2.013)
Continuous Tracking Survey 97.05 (Sample : 800 / country)
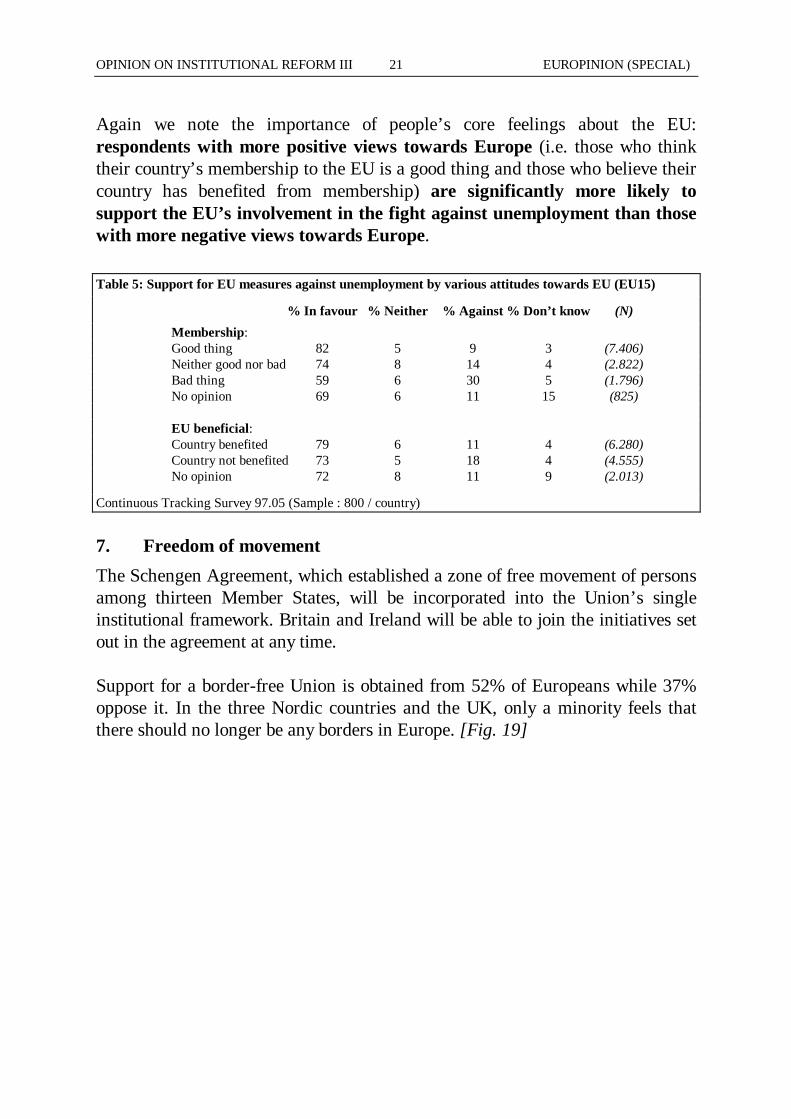
7. Freedom of movement
The Schengen Agreement, which established a zone of free movement of personsamong thirteen Member States, will be incorporated into the Union’s singleinstitutional framework. Britain and Ireland will be able to join the initiatives setout in the agreement at any time.
Support for a border-free Union is obtained from 52% of Europeans while 37%oppose it. In the three Nordic countries and the UK, only a minority feels thatthere should no longer be any borders in Europe. [Fig. 19]
OPINION ON INSTITUTIONAL REFORM III EUROPINION (SPECIAL)22
EUROPEAN COMMISSIONDG X.A.2. - PUBLIC OPINION SURVEYS AND RESEARCH
FIG. 19CONTINUOUS TRACKING SURVEY 97.05 (Sample : 800 / country)
"THERE SHOULD NO LONGER BE ANY BORDERS WITHIN THEMEMBER COUNTRIES OF THE EUROPEAN UNION SO THAT
PEOPLE GOING FROM ONE COUNTRY TO THE NEXT ARE NO LONGER CHECKED"
77
68
6459
56
55
53
52
48
47
4038
31
29
25
25
10
16
2630
39
34
28
37
40
43
4349
62
64
65
68
E
B
IGR
IRL
D
P
EU15
F
A
LNL
UK
FIN
S
DK
% In favour % Against
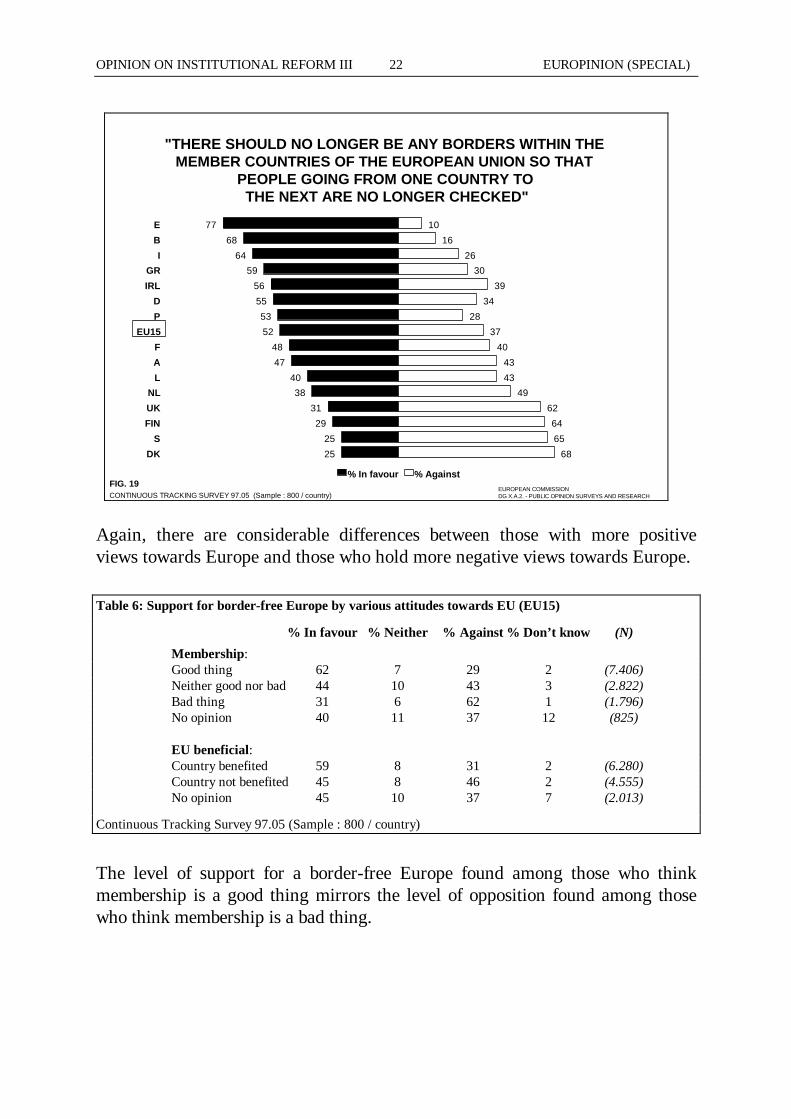
Again, there are considerable differences between those with more positiveviews towards Europe and those who hold more negative views towards Europe.
Table 6: Support for border-free Europe by various attitudes towards EU (EU15)
% In favour % Neither % Against % Don’t know (N)
Membership:Good thing 62 7 29 2 (7.406)Neither good nor bad 44 10 43 3 (2.822)Bad thing 31 6 62 1 (1.796)No opinion 40 11 37 12 (825)
EU beneficial:Country benefited 59 8 31 2 (6.280)Country not benefited 45 8 46 2 (4.555)No opinion 45 10 37 7 (2.013)
Continuous Tracking Survey 97.05 (Sample : 800 / country)
The level of support for a border-free Europe found among those who thinkmembership is a good thing mirrors the level of opposition found among thosewho think membership is a bad thing.
OPINION ON INSTITUTIONAL REFORM III EUROPINION (SPECIAL)23
III. ENLARGEMENT
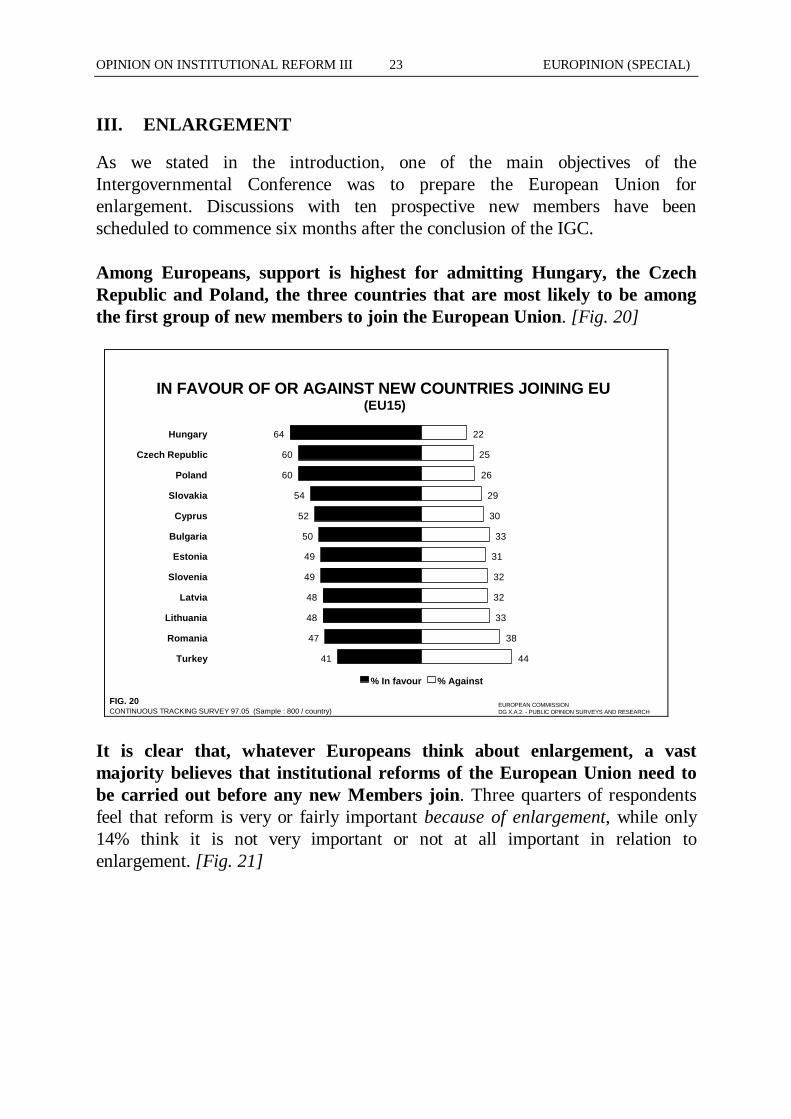
As we stated in the introduction, one of the main objectives of theIntergovernmental Conference was to prepare the European Union forenlargement. Discussions with ten prospective new members have beenscheduled to commence six months after the conclusion of the IGC.
Among Europeans, support is highest for admitting Hungary, the CzechRepublic and Poland, the three countries that are most likely to be amongthe first group of new members to join the European Union. [Fig. 20]
EUROPEAN COMMISSIONDG X.A.2. - PUBLIC OPINION SURVEYS AND RESEARCH
FIG. 20CONTINUOUS TRACKING SURVEY 97.05 (Sample : 800 / country)
IN FAVOUR OF OR AGAINST NEW COUNTRIES JOINING EU(EU15)
64
60
60
54
52
50
49
49
48
48
47
41
22
25
26
29
30
33
31
32
32
33
38
44
Hungary
Czech Republic
Poland
Slovakia
Cyprus
Bulgaria
Estonia
Slovenia
Latvia
Lithuania
Romania
Turkey
% In favour % Against
It is clear that, whatever Europeans think about enlargement, a vastmajority believes that institutional reforms of the European Union need tobe carried out before any new Members join. Three quarters of respondentsfeel that reform is very or fairly important because of enlargement, while only14% think it is not very important or not at all important in relation toenlargement. [Fig. 21]
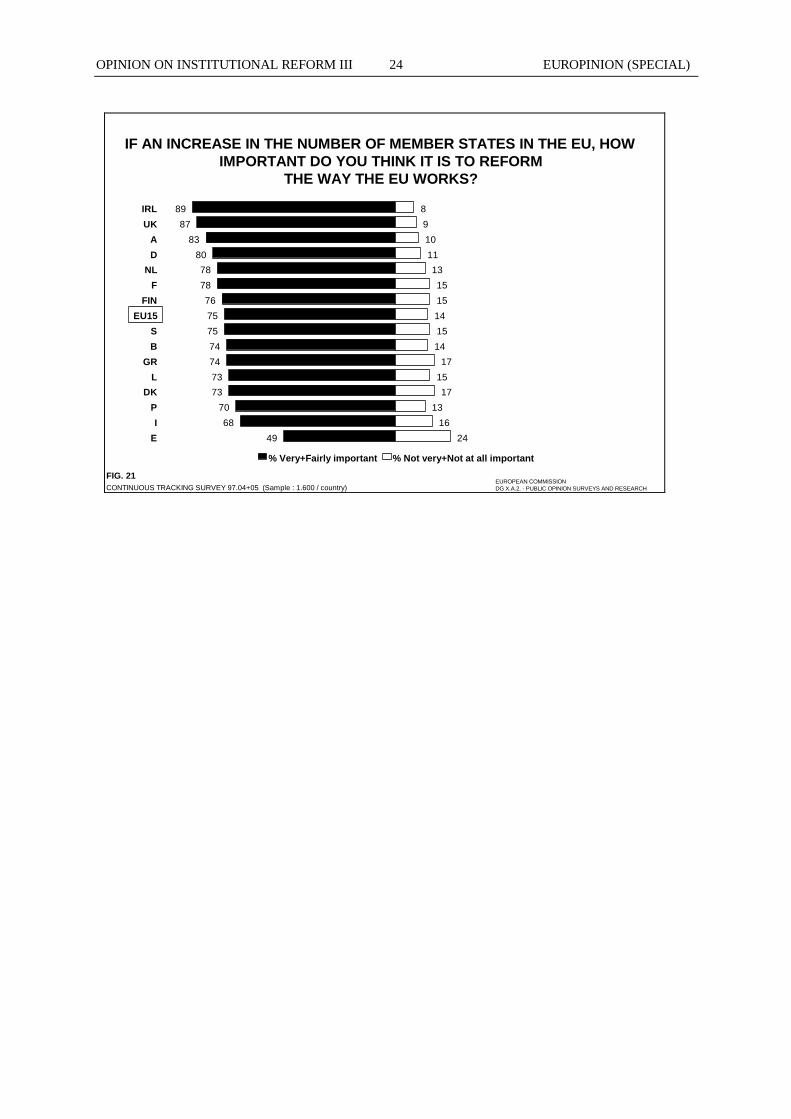
OPINION ON INSTITUTIONAL REFORM III EUROPINION (SPECIAL)24
IF AN INCREASE IN THE NUMBER OF MEMBER STATES IN THE EU, HOW IMPORTANT DO YOU THINK IT IS TO REFORM
THE WAY THE EU WORKS?
CONTINUOUS TRACKING SURVEY 97.04+05 (Sample : 1.600 / country)EUROPEAN COMMISSIONDG X.A.2. - PUBLIC OPINION SURVEYS AND RESEARCH
FIG. 21
89
87
83
8078
78
76
75
75
74
74
7373
70
68
49
8
9
10
1113
15
15
14
15
14
17
1517
13
16
24
IRL
UK
A
DNL
F
FIN
EU15
S
B
GR
LDK
P
I
E
% Very+Fairly important % Not very+Not at all important
OPINION ON INSTITUTIONAL REFORM III EUROPINION (SPECIAL)25
CONCLUSIONS
The recent Intergovernmental Conference has resulted in a new Treatywhich will guide the Union in the period leading up to next enlargement. Thefact that the proportion of Europeans who have heard of the Conference hasbeen relatively low does not imply that public opinion about the issuesdiscussed during the Conference is lacking. The results from the ContinuousTracking Surveys show that:
• An important role of the EU is to protect its citizens against outsidethreats: the majority of Europeans thinks that the EU, rather than thenational governments, should take decisions about external foreign policyand defence matters.
• Although the theoretical concept of flexibility receives support from only aminority of Europeans, when asked whether flexibility should be appliedin a number of areas, those in favour always outnumber the opponents.
• The majority of Europeans is in favour of qualified majority voting,especially in areas where this is already being applied. However, insecond and third pillar areas, the gap between supporters and opponents issmall.
• Europeans want to be represented by a Commissioner from theircountry: only 5% approve of a scenario where their country could bewithout a Commissioner.
• More than three-quarters of the European population wants the EU tobe able to take decisions on policies to reduce unemployment. However,people are less inclined to hand over control of employment policies to theEU.
• There are large differences in support for a border-free Europedepending on the country of respondents: the majority of SouthernEuropeans is in favour while in Scandinavia only a minority of respondentswants borders to be removed.
• Before new countries join the EU, most Europeans believe that it isimportant to reform the way the EU works. Hungary, the CzechRepublic and Poland are the ‘favourites’ for admission to the EU.
OPINION ON INSTITUTIONAL REFORM III EUROPINION (SPECIAL)26
However, one clear and recurrent finding from the Continuous TrackingSurveys is that people’s opinions about the issues discussed during theConference depend on how they view the European Union. In particular, wefind that those who feel that membership to the EU is a good thing tend tohold significantly more positive views about what the Union should be doingthan those who see membership as a bad thing for their country.
Furthermore, people with more pro-European attitudes are more likely tofeel well informed and tend to want to learn more about the Union thanpeople who hold more negative views towards Europe.
The new Treaty may put the Union on a course towards more acceptanceamong the public. It assures that what the Union does will be moretransparent to its citizens. Furthermore, it contains a number of proposalswhich indicate that the leaders of the Union have listened to the people.
OPINION ON INSTITUTIONAL REFORM III EUROPINION (SPECIAL)
ANNEXES